Boa Offshore April 2013 Helge Kvalvik, CEO presentation is made by Boa Offshore ... is making any...
31
Boa Offshore April 2013 Helge Kvalvik, CEO
-
Upload
truongdien -
Category
Documents
-
view
218 -
download
3
Transcript of Boa Offshore April 2013 Helge Kvalvik, CEO presentation is made by Boa Offshore ... is making any...
Boa Offshore April 2013
Helge Kvalvik, CEO
This presentation is made by Boa Offshore (or the ”Company”). The information contained herein
include statements that are ”forward-looking” in their nature. These forward-looking statements include
all matters that are not historical facts and are based on the Company’s current intentions, believes
and expectations about among other things, the Company’s results of operations, financial condition,
prospects, growth, strategies and the industry in which the Company operates. Such forward-looking
information and statements reflect current views with respect to future events. The Company cannot
give any assurance as to the correctness of information and statements related to such future events.
Furthermore, these forward-looking statements involve known and unknown risks, uncertainties and
other factors that are in many cases beyond the Company’s control that could cause the actual results
of operations, financial condition, liquidity and the development of the industry in which the Company’s
businesses operate to differ materially from the impression created by the forward-looking statements
contained herein, because they relate to events and depend on circumstances that may or may not
occur in the future. Although the Company believes that its intentions, beliefs and expectations, and
the statements in this presentation, are based on reasonable assumptions as of today, the Company
can not give any assurance that the actual results will be as set out in this presentation. Financing the
Company involves risks, and several factors could cause the actual results, performance or
achievements of the Company to be materially different from the impression created by the forward-
looking statements contained herein. Neither the Company, nor any company within the Boa Offshore
Group, is making any representation or warranty (express or implied) as to the accuracy, reliability or
completeness of the information and statements in this presentation, and neither the Company, any
company within the Boa Group, nor any of their directors, officers or employees will have any liability
to any persons resulting from the possible use of information in the presentation.
Disclaimer
2
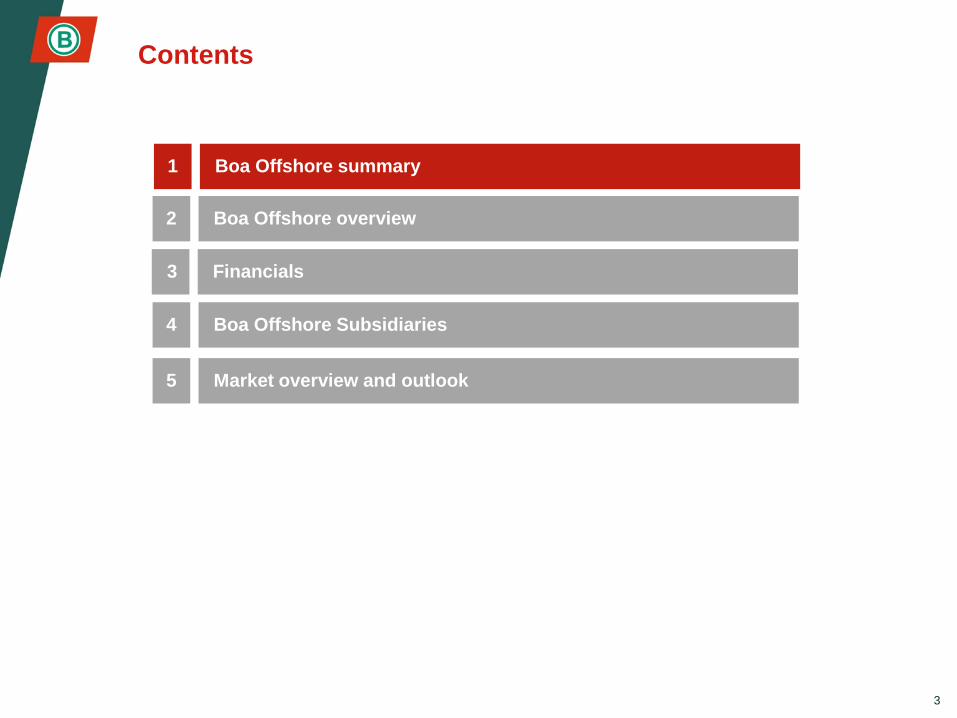
5 Market overview and outlook
3 Financials
2 Boa Offshore overview
4 Boa Offshore Subsidiaries
Contents
3
1 Boa Offshore summary
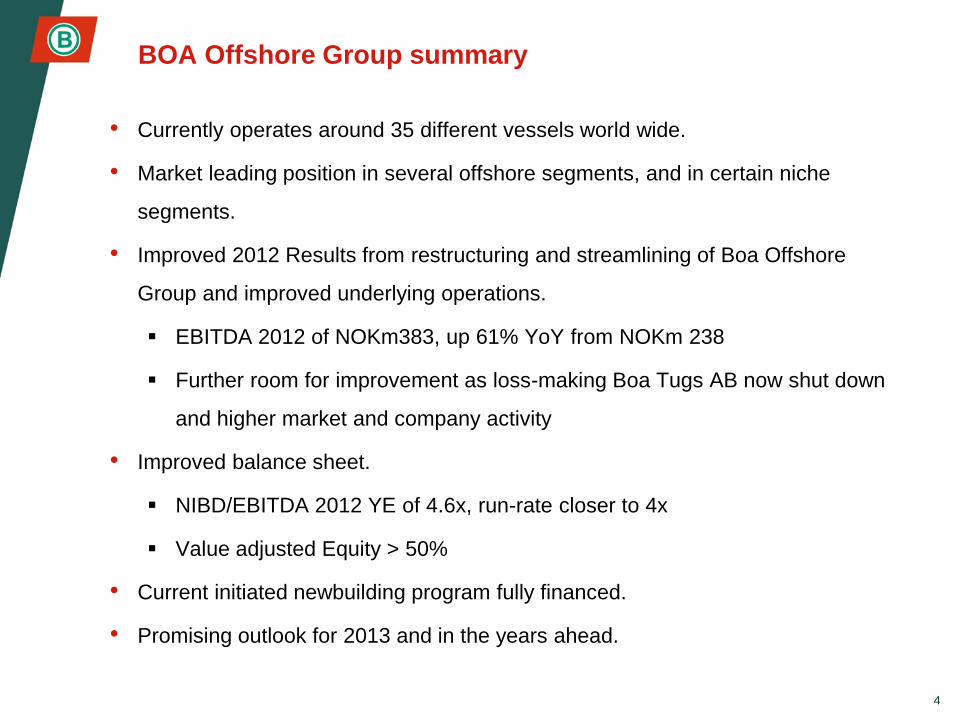
BOA Offshore Group summary
• Currently operates around 35 different vessels world wide.
• Market leading position in several offshore segments, and in certain niche
segments.
• Improved 2012 Results from restructuring and streamlining of Boa Offshore
Group and improved underlying operations.
EBITDA 2012 of NOKm383, up 61% YoY from NOKm 238
Further room for improvement as loss-making Boa Tugs AB now shut down
and higher market and company activity
• Improved balance sheet.
NIBD/EBITDA 2012 YE of 4.6x, run-rate closer to 4x
Value adjusted Equity > 50%
• Current initiated newbuilding program fully financed.
• Promising outlook for 2013 and in the years ahead.
4
5 Market overview and outlook
3 Financials
2 Boa Offshore overview
4 Boa Offshore Subsidiaries
Contents
5
1 Boa Offshore summary
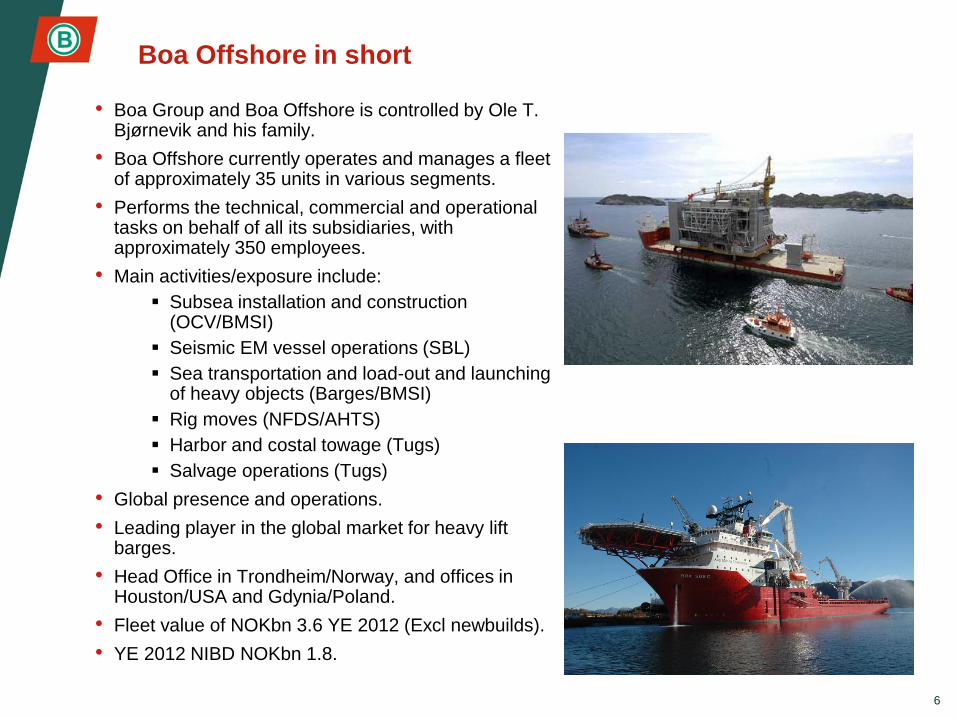
Boa Offshore in short
• Boa Group and Boa Offshore is controlled by Ole T. Bjørnevik and his family.
• Boa Offshore currently operates and manages a fleet of approximately 35 units in various segments.
• Performs the technical, commercial and operational tasks on behalf of all its subsidiaries, with approximately 350 employees.
• Main activities/exposure include:
Subsea installation and construction (OCV/BMSI)
Seismic EM vessel operations (SBL)
Sea transportation and load-out and launching of heavy objects (Barges/BMSI)
Rig moves (NFDS/AHTS)
Harbor and costal towage (Tugs)
Salvage operations (Tugs)
• Global presence and operations.
• Leading player in the global market for heavy lift barges.
• Head Office in Trondheim/Norway, and offices in Houston/USA and Gdynia/Poland.
• Fleet value of NOKbn 3.6 YE 2012 (Excl newbuilds).
• YE 2012 NIBD NOKbn 1.8.
6
7
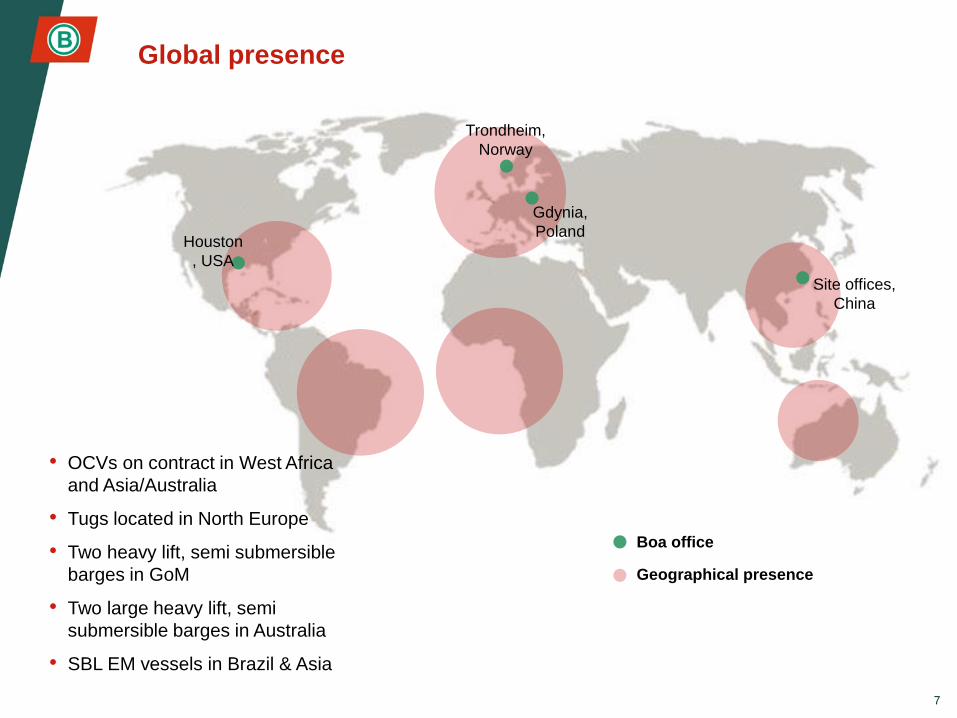
Boa office
Geographical presence
Houston
, USA
Trondheim,
Norway
• OCVs on contract in West Africa
and Asia/Australia
• Tugs located in North Europe
• Two heavy lift, semi submersible
barges in GoM
• Two large heavy lift, semi
submersible barges in Australia
• SBL EM vessels in Brazil & Asia
Site offices,
China
Gdynia,
Poland
Global presence
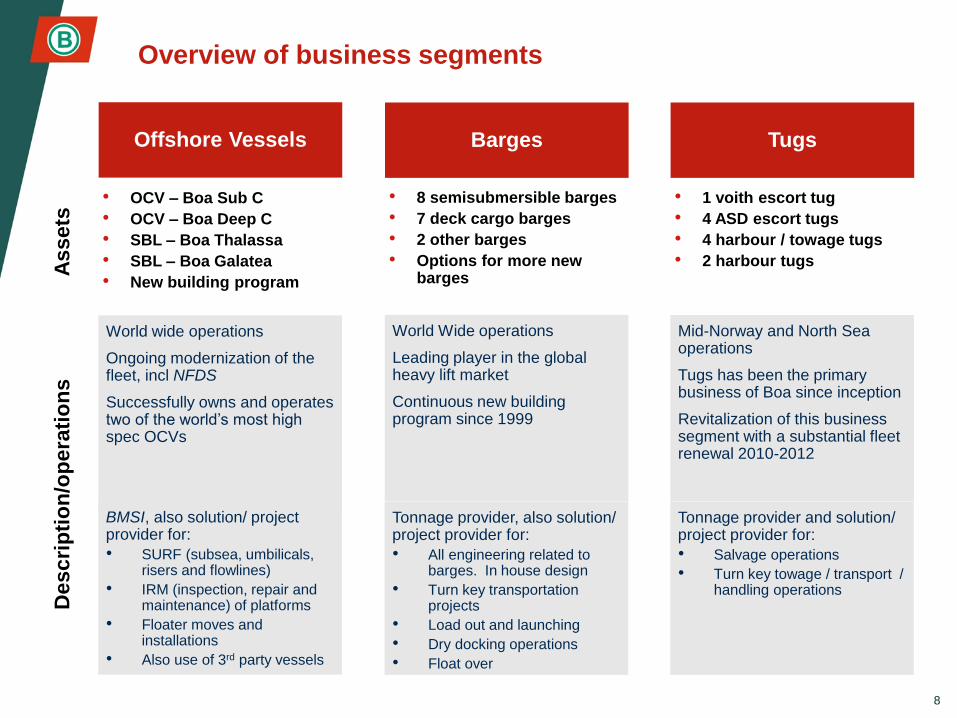
Overview of business segments
Tugs Barges Offshore Vessels
• 1 voith escort tug
• 4 ASD escort tugs
• 4 harbour / towage tugs
• 2 harbour tugs
• 8 semisubmersible barges
• 7 deck cargo barges
• 2 other barges
• Options for more new barges
• OCV – Boa Sub C
• OCV – Boa Deep C
• SBL – Boa Thalassa
• SBL – Boa Galatea
• New building program
Mid-Norway and North Sea operations
Tugs has been the primary business of Boa since inception
Revitalization of this business segment with a substantial fleet renewal 2010-2012
World Wide operations
Leading player in the global heavy lift market
Continuous new building program since 1999
World wide operations
Ongoing modernization of the fleet, incl NFDS
Successfully owns and operates two of the world’s most high spec OCVs
Tonnage provider and solution/ project provider for:
• Salvage operations
• Turn key towage / transport / handling operations
Tonnage provider, also solution/ project provider for:
• All engineering related to barges. In house design
• Turn key transportation projects
• Load out and launching
• Dry docking operations
• Float over
BMSI, also solution/ project provider for:
• SURF (subsea, umbilicals, risers and flowlines)
• IRM (inspection, repair and maintenance) of platforms
• Floater moves and installations
• Also use of 3rd party vessels
8
Assets
D
escri
pti
on
/op
era
tio
ns
76%
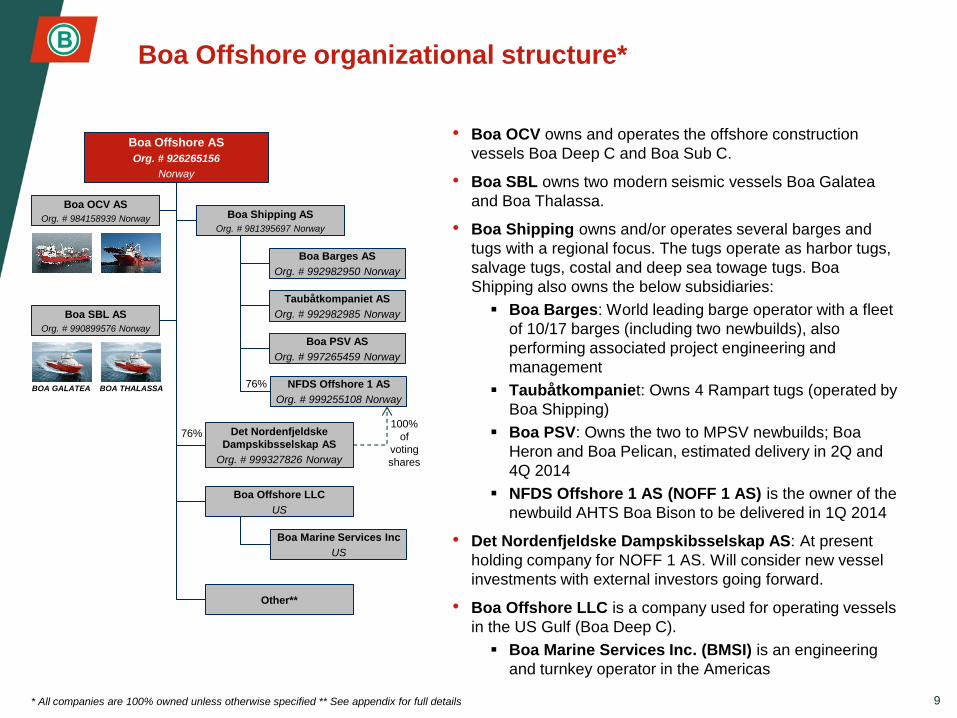
Boa Offshore organizational structure*
• Boa OCV owns and operates the offshore construction
vessels Boa Deep C and Boa Sub C.
• Boa SBL owns two modern seismic vessels Boa Galatea
and Boa Thalassa.
• Boa Shipping owns and/or operates several barges and
tugs with a regional focus. The tugs operate as harbor tugs,
salvage tugs, costal and deep sea towage tugs. Boa
Shipping also owns the below subsidiaries:
Boa Barges: World leading barge operator with a fleet
of 10/17 barges (including two newbuilds), also
performing associated project engineering and
management
Taubåtkompaniet: Owns 4 Rampart tugs (operated by
Boa Shipping)
Boa PSV: Owns the two to MPSV newbuilds; Boa
Heron and Boa Pelican, estimated delivery in 2Q and
4Q 2014
NFDS Offshore 1 AS (NOFF 1 AS) is the owner of the
newbuild AHTS Boa Bison to be delivered in 1Q 2014
• Det Nordenfjeldske Dampskibsselskap AS: At present
holding company for NOFF 1 AS. Will consider new vessel
investments with external investors going forward.
• Boa Offshore LLC is a company used for operating vessels
in the US Gulf (Boa Deep C).
Boa Marine Services Inc. (BMSI) is an engineering
and turnkey operator in the Americas
9
Boa Offshore AS
Org. # 926265156
Norway
Boa OCV AS
Org. # 984158939 Norway
Boa SBL AS
Org. # 990899576 Norway
Boa Shipping AS
Org. # 981395697 Norway
Boa Barges AS
Org. # 992982950 Norway
BOA GALATEA BOA THALASSA
Taubåtkompaniet AS
Org. # 992982985 Norway
Boa PSV AS
Org. # 997265459 Norway
Other**
Boa Offshore LLC
US
Boa Marine Services Inc
US
* All companies are 100% owned unless otherwise specified ** See appendix for full details
Det Nordenfjeldske
Dampskibsselskap AS
Org. # 999327826 Norway
NFDS Offshore 1 AS
Org. # 999255108 Norway
76% 100%
of
voting
shares
5 Market overview and outlook
3 Financials
2 Boa Offshore overview
4 Boa Offshore Subsidiaries
Contents
10
1 Boa Offshore summary
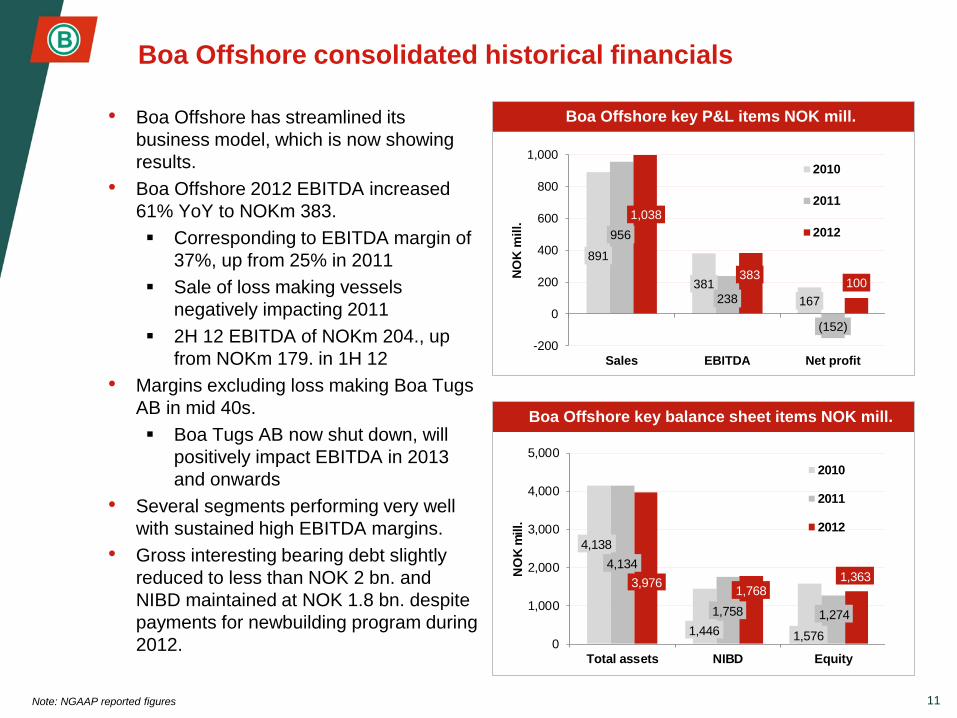
Boa Offshore consolidated historical financials
• Boa Offshore has streamlined its
business model, which is now showing
results.
• Boa Offshore 2012 EBITDA increased
61% YoY to NOKm 383.
Corresponding to EBITDA margin of
37%, up from 25% in 2011
Sale of loss making vessels
negatively impacting 2011
2H 12 EBITDA of NOKm 204., up
from NOKm 179. in 1H 12
• Margins excluding loss making Boa Tugs
AB in mid 40s.
Boa Tugs AB now shut down, will
positively impact EBITDA in 2013
and onwards
• Several segments performing very well
with sustained high EBITDA margins.
• Gross interesting bearing debt slightly
reduced to less than NOK 2 bn. and
NIBD maintained at NOK 1.8 bn. despite
payments for newbuilding program during
2012.
11
Boa Offshore key P&L items NOK mill.
Boa Offshore key balance sheet items NOK mill.
Note: NGAAP reported figures
4,138
1,446 1,576
4,134
1,758 1,274
3,9761,768
1,363
0
1,000
2,000
3,000
4,000
5,000
Total assets NIBD Equity
NO
K m
ill.
2010
2011
2012
891
381
167
956
238
(152)
1,038
383100
-200
0
200
400
600
800
1,000
Sales EBITDA Net profit
NO
K m
ill.
2010
2011
2012
Three outstanding Bonds – Face value of NOKbn 1.6
• BOA OCV 1 pri bond (Taubåt)
Issued NOKbn 1.2 in April 2011 at NIBOR +550 bps
Maturity April 2016
Currently < NOKbn 1.1 (YE 12) outstanding post amortization
1 pri in vessels Deep C and Sub C
Currently trading at around 102 – YTM ca NIBOR + 470bps
• Boa Offshore unsecured
Issued NOKm 75 in November 2012 at NIBOR + 675 bps
Maturity March 2015
Currently trading at 100,5 – 101,5 – YTM ca NIBOR + 648/594 bps
• Boa SBL 1 pri bond
Issued NOKm 400 in April 2013 at NIBOR + 550 bps
Maturity April 2018
1 pri in vessels Galatea and Thalassa
Currently trading at 100,25 – 101 – YTM ca NIBOR + 546/528
Source: Boa, Pareto, Sparebank1 Markets
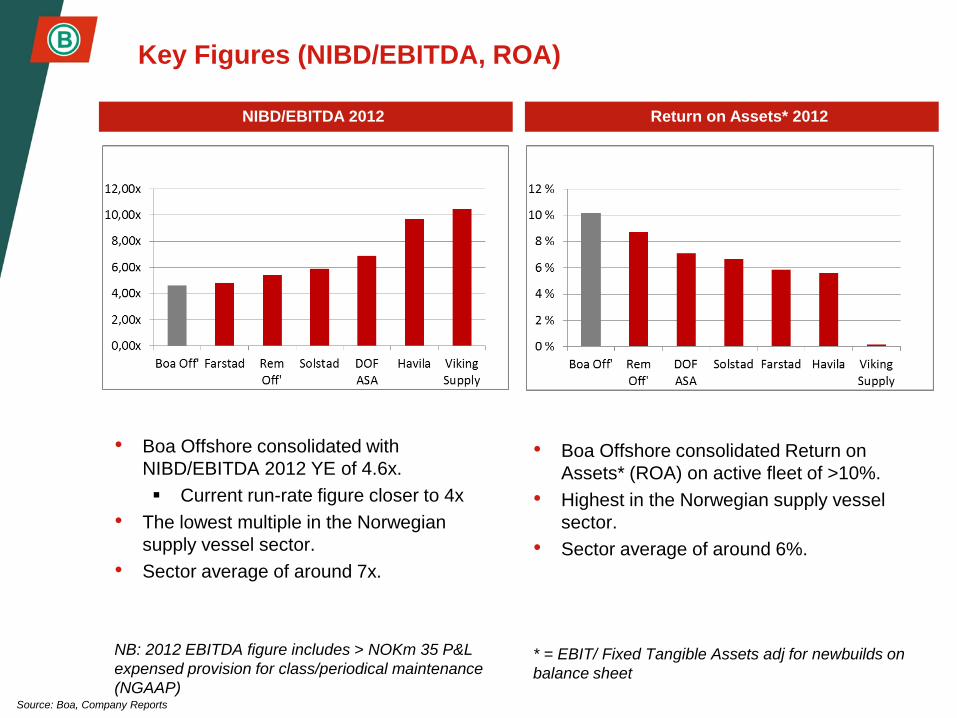
Key Figures (NIBD/EBITDA, ROA)
• Boa Offshore consolidated with
NIBD/EBITDA 2012 YE of 4.6x.
Current run-rate figure closer to 4x
• The lowest multiple in the Norwegian
supply vessel sector.
• Sector average of around 7x.
NB: 2012 EBITDA figure includes > NOKm 35 P&L
expensed provision for class/periodical maintenance
(NGAAP)
NIBD/EBITDA 2012 Return on Assets* 2012
• Boa Offshore consolidated Return on
Assets* (ROA) on active fleet of >10%.
• Highest in the Norwegian supply vessel
sector.
• Sector average of around 6%.
* = EBIT/ Fixed Tangible Assets adj for newbuilds on
balance sheet
Source: Boa, Company Reports
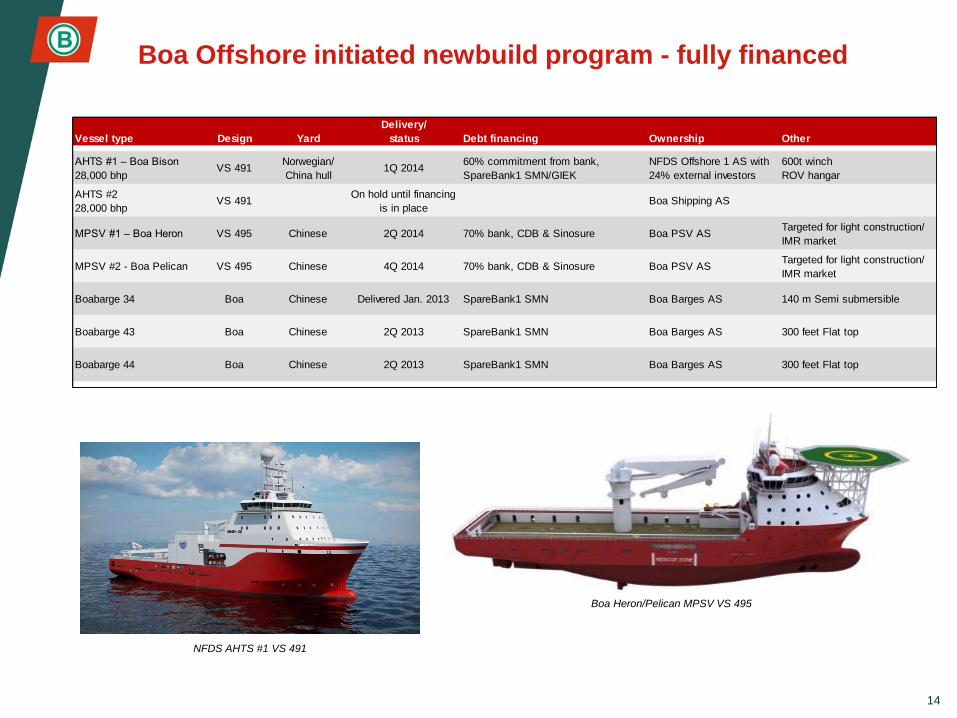
Boa Offshore initiated newbuild program - fully financed
14
Boa Heron/Pelican MPSV VS 495
Delivery/
Vessel type Design Yard status Debt financing Ownership Other
AHTS #1 – Boa Bison
28,000 bhpVS 491
Norwegian/
China hull1Q 2014
60% commitment from bank,
SpareBank1 SMN/GIEK
NFDS Offshore 1 AS with
24% external investors
600t winch
ROV hangar
AHTS #2
28,000 bhpVS 491
On hold until financing
is in placeBoa Shipping AS
MPSV #1 – Boa Heron VS 495 Chinese 2Q 2014 70% bank, CDB & Sinosure Boa PSV ASTargeted for light construction/
IMR market
MPSV #2 - Boa Pelican VS 495 Chinese 4Q 2014 70% bank, CDB & Sinosure Boa PSV ASTargeted for light construction/
IMR market
Boabarge 34 Boa Chinese Delivered Jan. 2013 SpareBank1 SMN Boa Barges AS 140 m Semi submersible
Boabarge 43 Boa Chinese 2Q 2013 SpareBank1 SMN Boa Barges AS 300 feet Flat top
Boabarge 44 Boa Chinese 2Q 2013 SpareBank1 SMN Boa Barges AS 300 feet Flat top
NFDS AHTS #1 VS 491
5 Market overview and outlook
3 Financials
2 Boa Offshore overview
4 Boa Offshore Subsidiaries
Contents
15
1 Boa Offshore summary
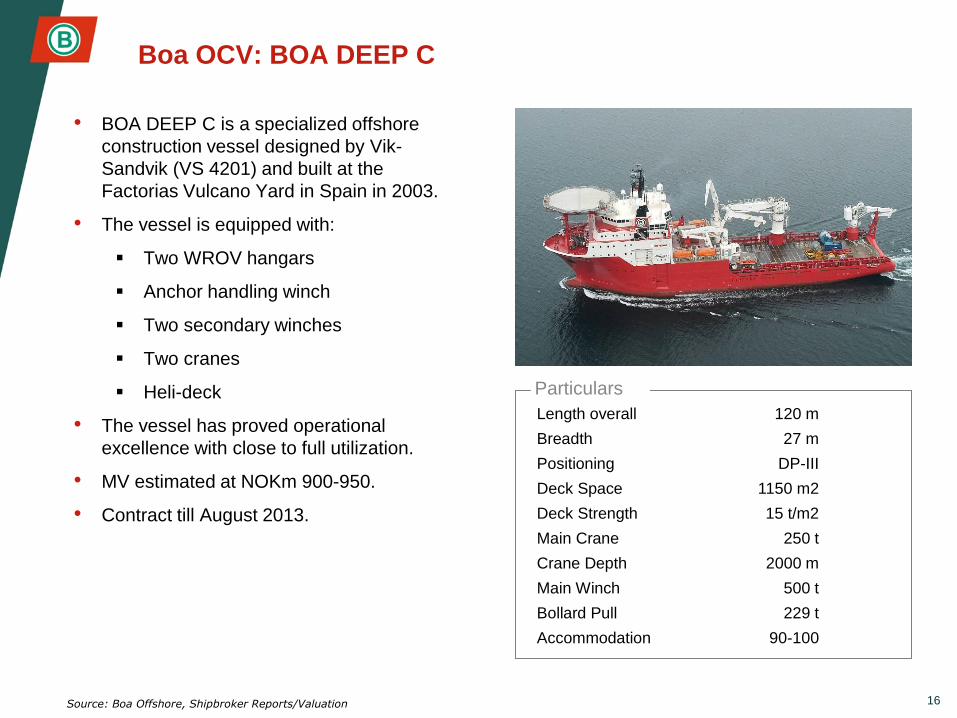
Boa OCV: BOA DEEP C
• BOA DEEP C is a specialized offshore
construction vessel designed by Vik-
Sandvik (VS 4201) and built at the
Factorias Vulcano Yard in Spain in 2003.
• The vessel is equipped with:
Two WROV hangars
Anchor handling winch
Two secondary winches
Two cranes
Heli-deck
• The vessel has proved operational
excellence with close to full utilization.
• MV estimated at NOKm 900-950.
• Contract till August 2013.
Length overall 120 m
Breadth 27 m
Positioning DP-III
Deck Space 1150 m2
Deck Strength 15 t/m2
Main Crane 250 t
Crane Depth 2000 m
Main Winch 500 t
Bollard Pull 229 t
Accommodation 90-100
Particulars
Source: Boa Offshore, Shipbroker Reports/Valuation 16
Boa OCV: BOA SUB C
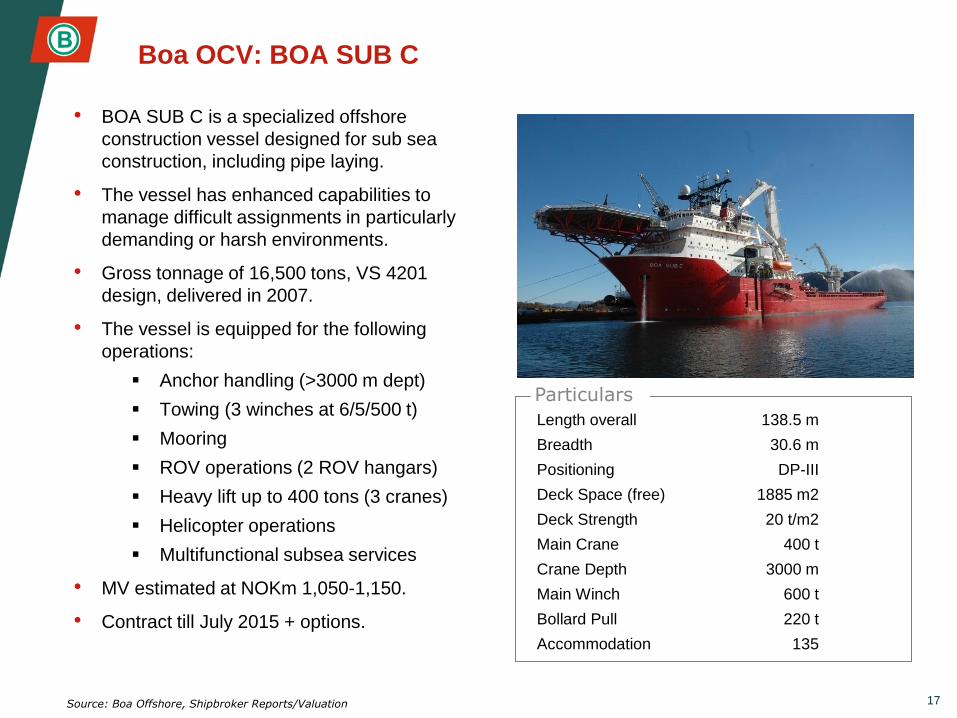
• BOA SUB C is a specialized offshore
construction vessel designed for sub sea
construction, including pipe laying.
• The vessel has enhanced capabilities to
manage difficult assignments in particularly
demanding or harsh environments.
• Gross tonnage of 16,500 tons, VS 4201
design, delivered in 2007.
• The vessel is equipped for the following
operations:
Anchor handling (>3000 m dept)
Towing (3 winches at 6/5/500 t)
Mooring
ROV operations (2 ROV hangars)
Heavy lift up to 400 tons (3 cranes)
Helicopter operations
Multifunctional subsea services
• MV estimated at NOKm 1,050-1,150.
• Contract till July 2015 + options.
Length overall 138.5 m
Breadth 30.6 m
Positioning DP-III
Deck Space (free) 1885 m2
Deck Strength 20 t/m2
Main Crane 400 t
Crane Depth 3000 m
Main Winch 600 t
Bollard Pull 220 t
Accommodation 135
Particulars
Source: Boa Offshore, Shipbroker Reports/Valuation 17
SBL 14%
OCV 59%
Barges, tugs
and other 27%
SBL 17%
OCV 56%
Barges, tugs
and other 27%
Boa OCV AS – Summary and key financials
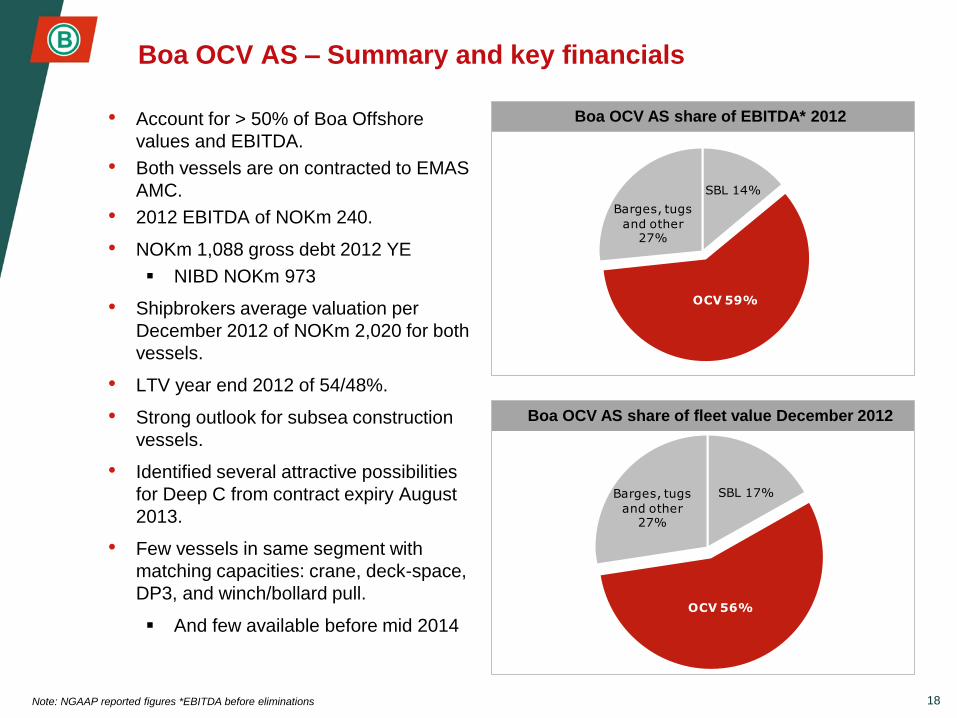
• Account for > 50% of Boa Offshore
values and EBITDA.
• Both vessels are on contracted to EMAS
AMC.
• 2012 EBITDA of NOKm 240.
• NOKm 1,088 gross debt 2012 YE
NIBD NOKm 973
• Shipbrokers average valuation per
December 2012 of NOKm 2,020 for both
vessels.
• LTV year end 2012 of 54/48%.
• Strong outlook for subsea construction
vessels.
• Identified several attractive possibilities
for Deep C from contract expiry August
2013.
• Few vessels in same segment with
matching capacities: crane, deck-space,
DP3, and winch/bollard pull.
And few available before mid 2014
18
Boa OCV AS share of EBITDA* 2012
Boa OCV AS share of fleet value December 2012
Note: NGAAP reported figures *EBITDA before eliminations
Boa SBL - The vessels
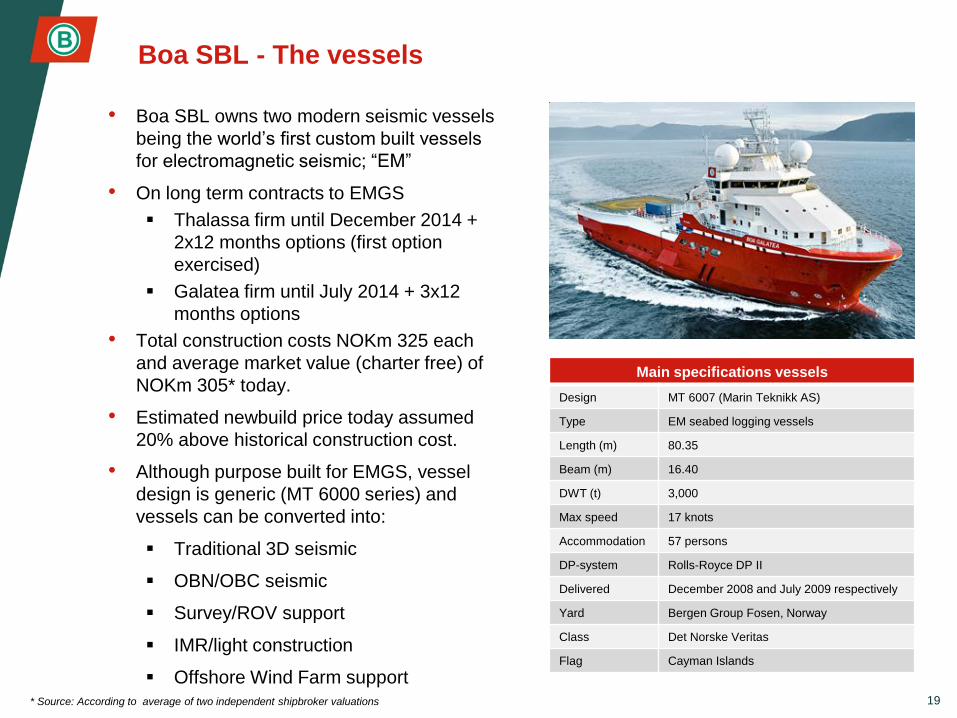
• Boa SBL owns two modern seismic vessels
being the world’s first custom built vessels
for electromagnetic seismic; “EM”
• On long term contracts to EMGS
Thalassa firm until December 2014 +
2x12 months options (first option
exercised)
Galatea firm until July 2014 + 3x12
months options
• Total construction costs NOKm 325 each
and average market value (charter free) of
NOKm 305* today.
• Estimated newbuild price today assumed
20% above historical construction cost.
• Although purpose built for EMGS, vessel
design is generic (MT 6000 series) and
vessels can be converted into:
Traditional 3D seismic
OBN/OBC seismic
Survey/ROV support
IMR/light construction
Offshore Wind Farm support 19
Main specifications vessels
Design MT 6007 (Marin Teknikk AS)
Type EM seabed logging vessels
Length (m) 80.35
Beam (m) 16.40
DWT (t) 3,000
Max speed 17 knots
Accommodation 57 persons
DP-system Rolls-Royce DP II
Delivered December 2008 and July 2009 respectively
Yard Bergen Group Fosen, Norway
Class Det Norske Veritas
Flag Cayman Islands
* Source: According to average of two independent shipbroker valuations
Boa SBL - Historical financials
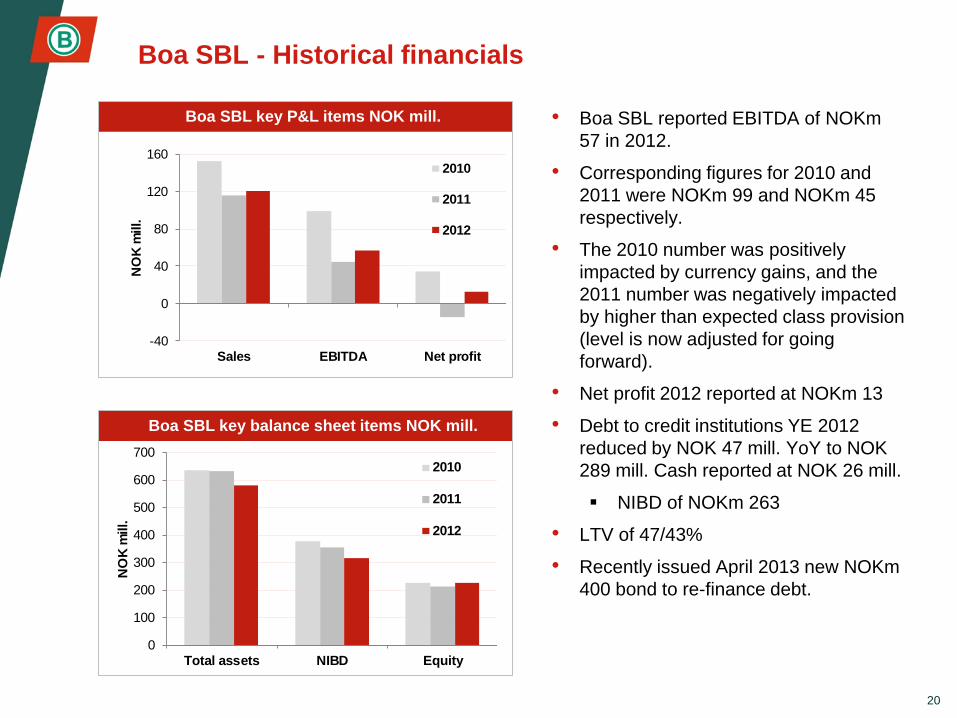
• Boa SBL reported EBITDA of NOKm
57 in 2012.
• Corresponding figures for 2010 and
2011 were NOKm 99 and NOKm 45
respectively.
• The 2010 number was positively
impacted by currency gains, and the
2011 number was negatively impacted
by higher than expected class provision
(level is now adjusted for going
forward).
• Net profit 2012 reported at NOKm 13
• Debt to credit institutions YE 2012
reduced by NOK 47 mill. YoY to NOK
289 mill. Cash reported at NOK 26 mill.
NIBD of NOKm 263
• LTV of 47/43%
• Recently issued April 2013 new NOKm
400 bond to re-finance debt.
20
Boa SBL key P&L items NOK mill.
Boa SBL key balance sheet items NOK mill.
-40
0
40
80
120
160
Sales EBITDA Net profit
NO
K m
ill.
2010
2011
2012
0
100
200
300
400
500
600
700
Total assets NIBD Equity
NO
K m
ill.
2010
2011
2012
21
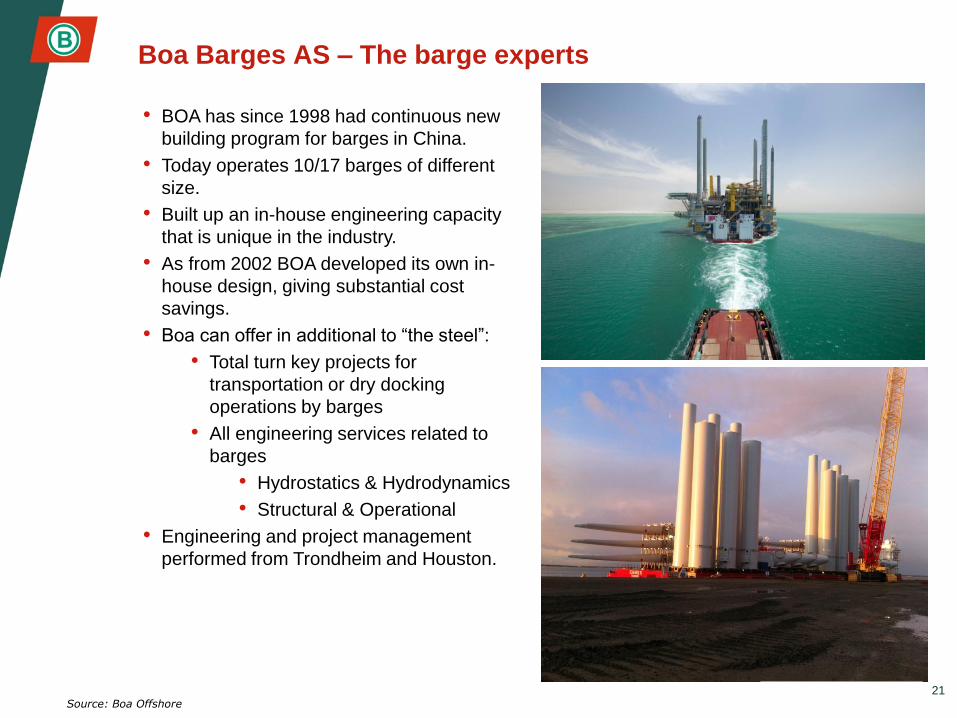
Boa Barges AS – The barge experts
• BOA has since 1998 had continuous new
building program for barges in China.
• Today operates 10/17 barges of different
size.
• Built up an in-house engineering capacity
that is unique in the industry.
• As from 2002 BOA developed its own in-
house design, giving substantial cost
savings.
• Boa can offer in additional to “the steel”:
• Total turn key projects for
transportation or dry docking
operations by barges
• All engineering services related to
barges
• Hydrostatics & Hydrodynamics
• Structural & Operational
• Engineering and project management
performed from Trondheim and Houston.
Source: Boa Offshore
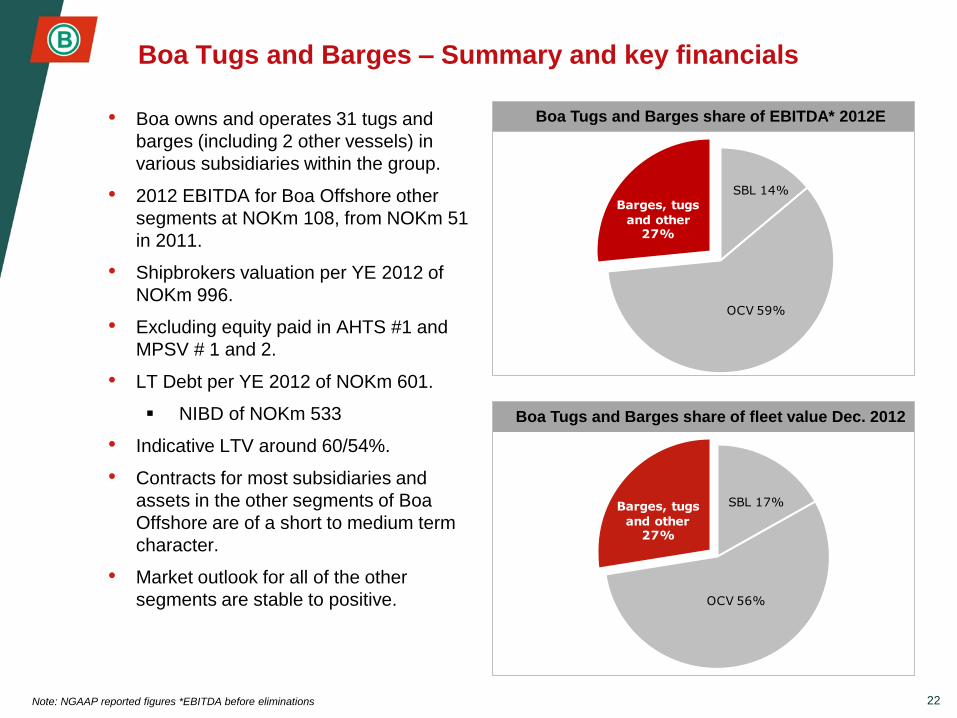
Boa Tugs and Barges – Summary and key financials
• Boa owns and operates 31 tugs and
barges (including 2 other vessels) in
various subsidiaries within the group.
• 2012 EBITDA for Boa Offshore other
segments at NOKm 108, from NOKm 51
in 2011.
• Shipbrokers valuation per YE 2012 of
NOKm 996.
• Excluding equity paid in AHTS #1 and
MPSV # 1 and 2.
• LT Debt per YE 2012 of NOKm 601.
NIBD of NOKm 533
• Indicative LTV around 60/54%.
• Contracts for most subsidiaries and
assets in the other segments of Boa
Offshore are of a short to medium term
character.
• Market outlook for all of the other
segments are stable to positive.
22
Boa Tugs and Barges share of EBITDA* 2012E
Boa Tugs and Barges share of fleet value Dec. 2012
Note: NGAAP reported figures *EBITDA before eliminations
SBL 14%
OCV 59%
Barges, tugs
and other 27%
SBL 17%
OCV 56%
Barges, tugs
and other 27%
5 Market overview and outlook
3 Financials
2 Boa Offshore overview
4 Boa Offshore Subsidiaries
Contents
23
1 Boa Offshore summary
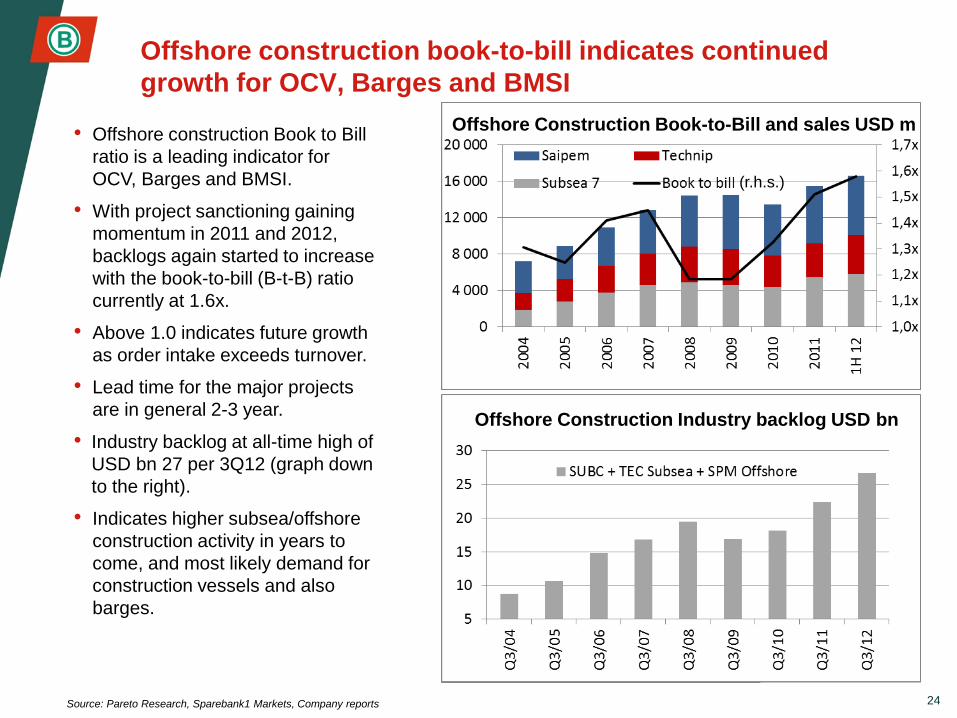
Offshore construction book-to-bill indicates continued
growth for OCV, Barges and BMSI
• Offshore construction Book to Bill
ratio is a leading indicator for
OCV, Barges and BMSI.
• With project sanctioning gaining
momentum in 2011 and 2012,
backlogs again started to increase
with the book-to-bill (B-t-B) ratio
currently at 1.6x.
• Above 1.0 indicates future growth
as order intake exceeds turnover.
• Lead time for the major projects
are in general 2-3 year.
• Industry backlog at all-time high of
USD bn 27 per 3Q12 (graph down
to the right).
• Indicates higher subsea/offshore
construction activity in years to
come, and most likely demand for
construction vessels and also
barges.
24 Source: Pareto Research, Sparebank1 Markets, Company reports
Offshore Construction Book-to-Bill and sales USD m
Offshore Construction Industry backlog USD bn
(r.h.s.)
25 Source: ODS/IHS, Boa Offshore, Sparebank1 Markets, FMC Technologfies/Quest
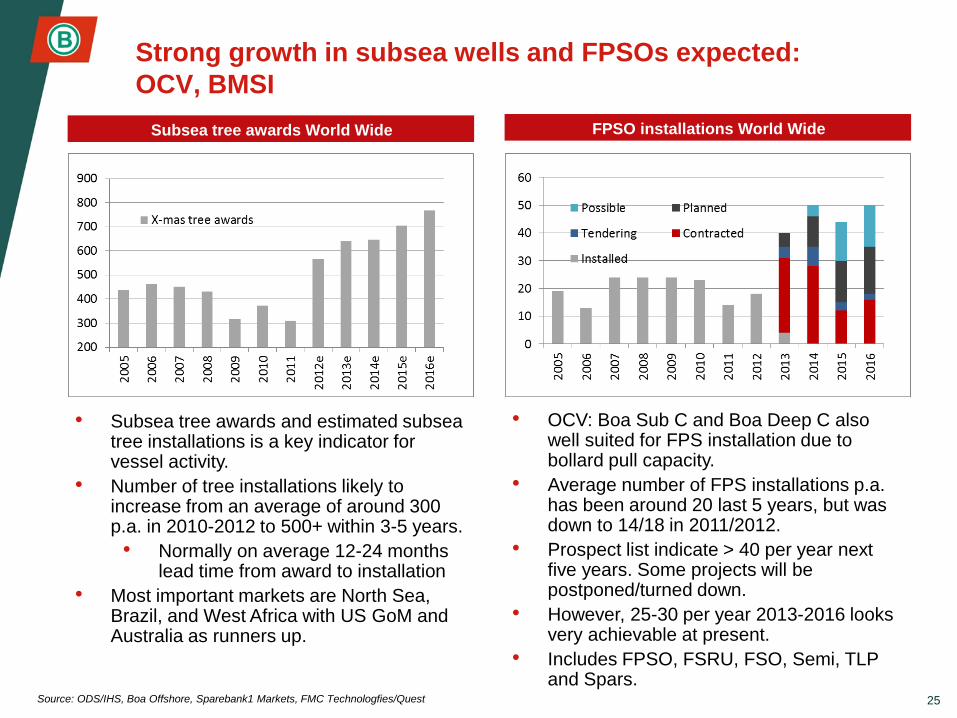
Strong growth in subsea wells and FPSOs expected:
OCV, BMSI
Subsea tree awards World Wide
• Subsea tree awards and estimated subsea tree installations is a key indicator for vessel activity.
• Number of tree installations likely to increase from an average of around 300 p.a. in 2010-2012 to 500+ within 3-5 years.
• Normally on average 12-24 months lead time from award to installation
• Most important markets are North Sea, Brazil, and West Africa with US GoM and Australia as runners up.
2x
FPSO installations World Wide
• OCV: Boa Sub C and Boa Deep C also well suited for FPS installation due to bollard pull capacity.
• Average number of FPS installations p.a. has been around 20 last 5 years, but was down to 14/18 in 2011/2012.
• Prospect list indicate > 40 per year next five years. Some projects will be postponed/turned down.
• However, 25-30 per year 2013-2016 looks very achievable at present.
• Includes FPSO, FSRU, FSO, Semi, TLP and Spars.
26 Source: ODS/IHS, Boa Offshore, UNO
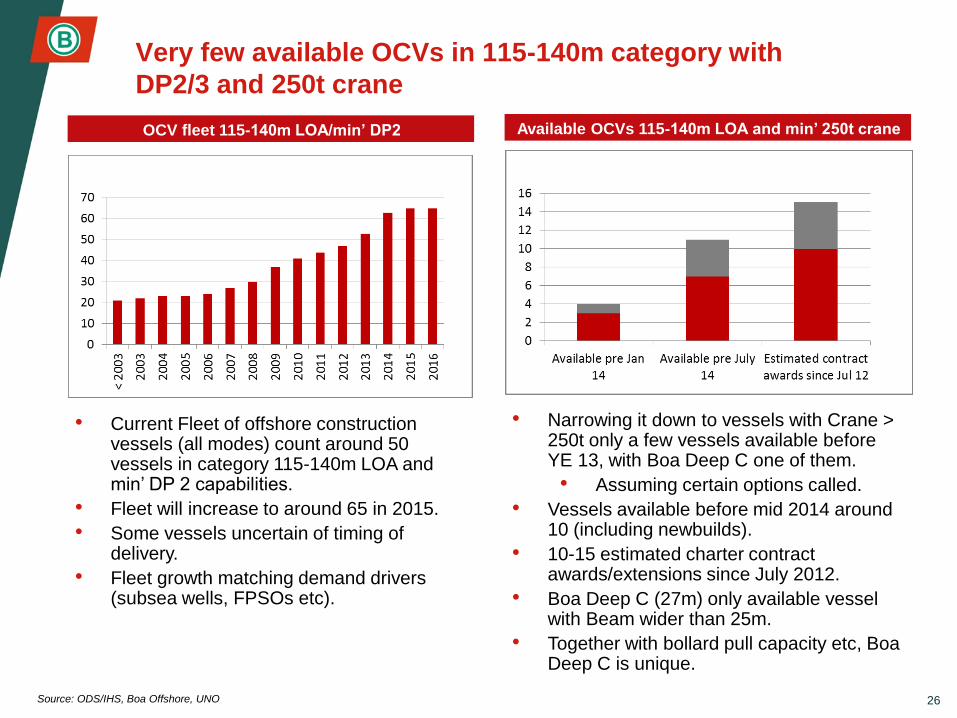
Very few available OCVs in 115-140m category with
DP2/3 and 250t crane
OCV fleet 115-140m LOA/min’ DP2
• Current Fleet of offshore construction vessels (all modes) count around 50 vessels in category 115-140m LOA and min’ DP 2 capabilities.
• Fleet will increase to around 65 in 2015.
• Some vessels uncertain of timing of delivery.
• Fleet growth matching demand drivers (subsea wells, FPSOs etc).
Available OCVs 115-140m LOA and min’ 250t crane
• Narrowing it down to vessels with Crane > 250t only a few vessels available before YE 13, with Boa Deep C one of them.
• Assuming certain options called.
• Vessels available before mid 2014 around 10 (including newbuilds).
• 10-15 estimated charter contract awards/extensions since July 2012.
• Boa Deep C (27m) only available vessel with Beam wider than 25m.
• Together with bollard pull capacity etc, Boa Deep C is unique.
27
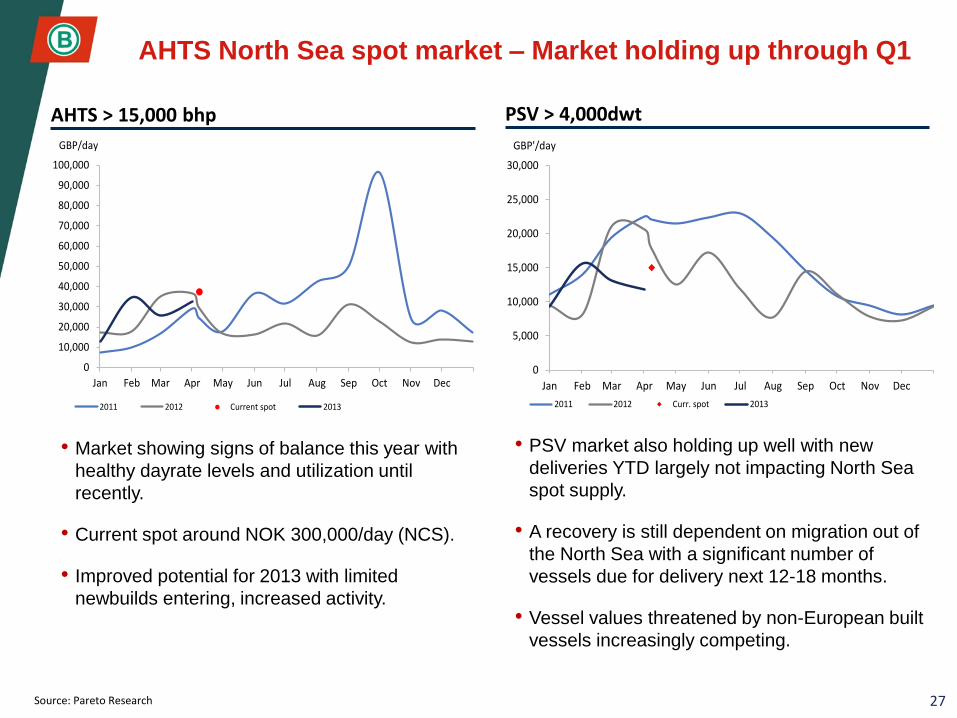
AHTS North Sea spot market – Market holding up through Q1
Source: Pareto Research
AHTS > 15,000 bhp PSV > 4,000dwt
• Market showing signs of balance this year with
healthy dayrate levels and utilization until
recently.
• Current spot around NOK 300,000/day (NCS).
• Improved potential for 2013 with limited
newbuilds entering, increased activity.
• PSV market also holding up well with new
deliveries YTD largely not impacting North Sea
spot supply.
• A recovery is still dependent on migration out of
the North Sea with a significant number of
vessels due for delivery next 12-18 months.
• Vessel values threatened by non-European built
vessels increasingly competing.
0
10,000
20,000
30,000
40,000
50,000
60,000
70,000
80,000
90,000
100,000
Jan Feb Mar Apr May Jun Jul Aug Sep Oct Nov Dec
2011 2012 Current spot 2013
GBP/day
0
5,000
10,000
15,000
20,000
25,000
30,000
Jan Feb Mar Apr May Jun Jul Aug Sep Oct Nov Dec
2011 2012 Curr. spot 2013
GBP'/day
28
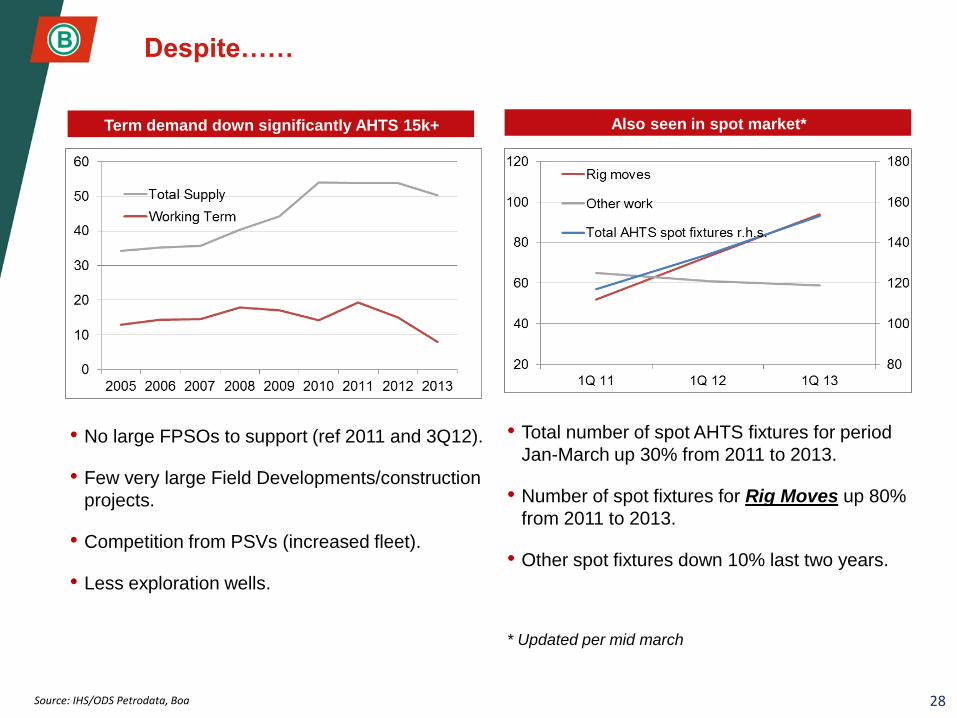
Despite……
Source: IHS/ODS Petrodata, Boa
• No large FPSOs to support (ref 2011 and 3Q12).
• Few very large Field Developments/construction
projects.
• Competition from PSVs (increased fleet).
• Less exploration wells.
• Total number of spot AHTS fixtures for period
Jan-March up 30% from 2011 to 2013.
• Number of spot fixtures for Rig Moves up 80%
from 2011 to 2013.
• Other spot fixtures down 10% last two years.
* Updated per mid march
Term demand down significantly AHTS 15k+ Also seen in spot market*
29
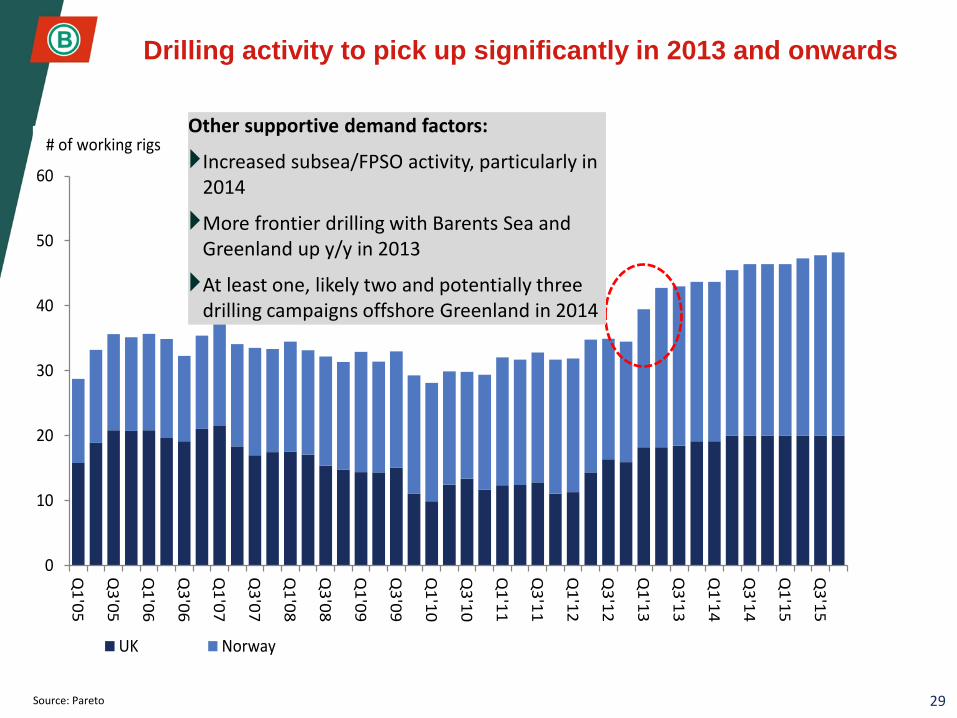
Drilling activity to pick up significantly in 2013 and onwards
Source: Pareto
0
10
20
30
40
50
60
Q1
'05
Q3
'05
Q1
'06
Q3
'06
Q1
'07
Q3
'07
Q1
'08
Q3
'08
Q1
'09
Q3
'09
Q1
'10
Q3
'10
Q1
'11
Q3
'11
Q1
'12
Q3
'12
Q1
'13
Q3
'13
Q1
'14
Q3
'14
Q1
'15
Q3
'15
UK Norway
# of working rigsOther supportive demand factors:
Increased subsea/FPSO activity, particularly in 2014
More frontier drilling with Barents Sea and Greenland up y/y in 2013
At least one, likely two and potentially three drilling campaigns offshore Greenland in 2014
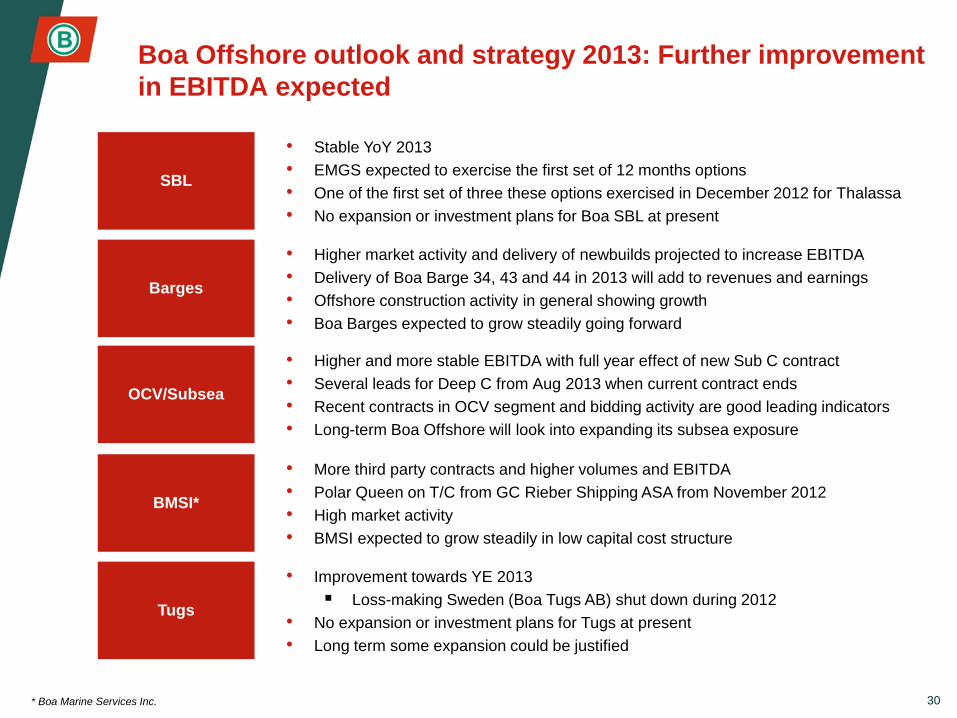
Boa Offshore outlook and strategy 2013: Further improvement
in EBITDA expected
30
• Higher and more stable EBITDA with full year effect of new Sub C contract
• Several leads for Deep C from Aug 2013 when current contract ends
• Recent contracts in OCV segment and bidding activity are good leading indicators
• Long-term Boa Offshore will look into expanding its subsea exposure
• Higher market activity and delivery of newbuilds projected to increase EBITDA
• Delivery of Boa Barge 34, 43 and 44 in 2013 will add to revenues and earnings
• Offshore construction activity in general showing growth
• Boa Barges expected to grow steadily going forward
• Stable YoY 2013
• EMGS expected to exercise the first set of 12 months options
• One of the first set of three these options exercised in December 2012 for Thalassa
• No expansion or investment plans for Boa SBL at present
• More third party contracts and higher volumes and EBITDA
• Polar Queen on T/C from GC Rieber Shipping ASA from November 2012
• High market activity
• BMSI expected to grow steadily in low capital cost structure
• Improvement towards YE 2013
Loss-making Sweden (Boa Tugs AB) shut down during 2012
• No expansion or investment plans for Tugs at present
• Long term some expansion could be justified
OCV/Subsea
Barges
SBL
BMSI*
Tugs
* Boa Marine Services Inc.