
BNP Paribas · investments, developments of BNP ... middle class, more high net-worth individuals...
31
BNP Paribas Sustainable Growth and Value Creation Baudouin Prot Chief Executive Officer 14 June 2007
Transcript of BNP Paribas · investments, developments of BNP ... middle class, more high net-worth individuals...

1
BNP ParibasSustainable Growth and Value Creation
Baudouin Prot Chief Executive Officer
14 June 2007

2
Disclaimer This presentation includes forward-looking statements based on current beliefs and expectations about future events. Forward-looking statements include financial projections and estimates and their underlying assumptions, statements regarding plans, objectives and expectations with respect to future events, operations, products and services, and statements regarding future performance and synergies. Forward-looking statements are not guarantees of future performance and are subject to inherent risks, uncertainties and assumptions about BNP Paribas and its subsidiaries and investments, developments of BNP Paribas and its subsidiaries, banking industry trends, future capital expenditures and acquisitions, changes in economic conditions globally or in BNP Paribas’ principal local markets, the competitive market and regulatory factors. Those events are uncertain; their outcome may differ from current expectations which may in turn significantly affect expected results. Actual results may differ materially from those projected or implied in these forward-looking statements. Any forward-looking statement contained in this presentation speaks as of the date of this presentation: BNP Paribas undertakes no obligation to publicly revise or update any forward-looking statements in light of new information or future events.
The information contained in this presentation as it relates to parties other than BNP Paribas or derived from external sources has not been independently verified and no representation or warranty expressed or implied is made as to, and no reliance should be placed on the fairness, accuracy, completeness or correctness of, the information or opinions contained herein. None of BNP Paribas or its representatives shall have any liability whatsoever in negligence or otherwise for any loss however arising from any use of this presentation or its contents or otherwise arising in connection with this presentation or any other information or material discussed.
Please note that 2003 and 2004 figures are based on French accounting standards, while 2005, 2006 and 2007 figures are based on IFRS accounting standards.

3
BNP Paribas at a GlanceKey Group Catalysts
Presentation overview
Value Proposition for Shareholders

4
BNP ParibasA Leading European Player With a Global Reach
A leading European bank, #2 market cap. in the Eurozone, #13 worldwide*
3/4 of revenues generated in Western Europe of which just over half are generated in France
1/4 of revenues generated from the US, Japan and emerging countries
Strong revenue growth of 27.9% in 2006 supported by 13.5% organic growth
Earnings per share up 23.3% per annum since 2003
* Source: Bloomberg, market capitalization as at June 4th 2007

5
An Integrated Business Model
IndividualCustomers
Corporate Customers
Financial Institutions
Corporate and Investment Banking
Asset Management and Services
Retail Financial Services
Retail Banking networksFrance ItalyWestern United-States Emerging Markets

6
A Pan-European Leader
A growth model combiningPowerful specialised platformsKey retail banking expertiseProven integration know-how
Core business revenues 1Q07
29%8%
21%
Europe excl. France France
AMSRFS& CIB platforms50%
Retailbanking
networks27%
North America Rest of the world
19%
12% 11%
Western Europe 77%
Cetelem
UCB
Arval
BPLG
Private Banking
Insurance
Personal Investors
Asset Mgt.
BPSS
Real Estate
FRB
BNL bc
Corporate and Investment Banking- 3 hubs in Paris, London and Geneva- Presence in 23 countries

7
A very competitive retail set-upA network focused on wealthier urban areas6mn customersGrowing momentum for customer acquisition: +170,000 net new individual cheque and deposit accounts in 2006Leadership in multi-channel distributionProduct innovation and advanced CRM techniques
#1 in Private Banking212 private banking centres serving 100,000 upper affluent customers, Efficient cross-referral framework with retail and corporate
A proven model for corporate clients24 business centres, serving 22,000 corporate and institutional clients
*Source : company data at constant scope and perimeter excluding PEL / CEL effects for 2006; CRCA excluding CASA dividend, HSBC France including both Individual and SME customers divisions
French Retail Banking Outperforming Peers
15.4%
10.4%9.1% 8.5% 8.1%
6.2%
14.4%14.5%
BNPP SG BP CRCA CIC LCL CE HSBC
Revenue Growth 2006/2003*
Market: 11.2%
8
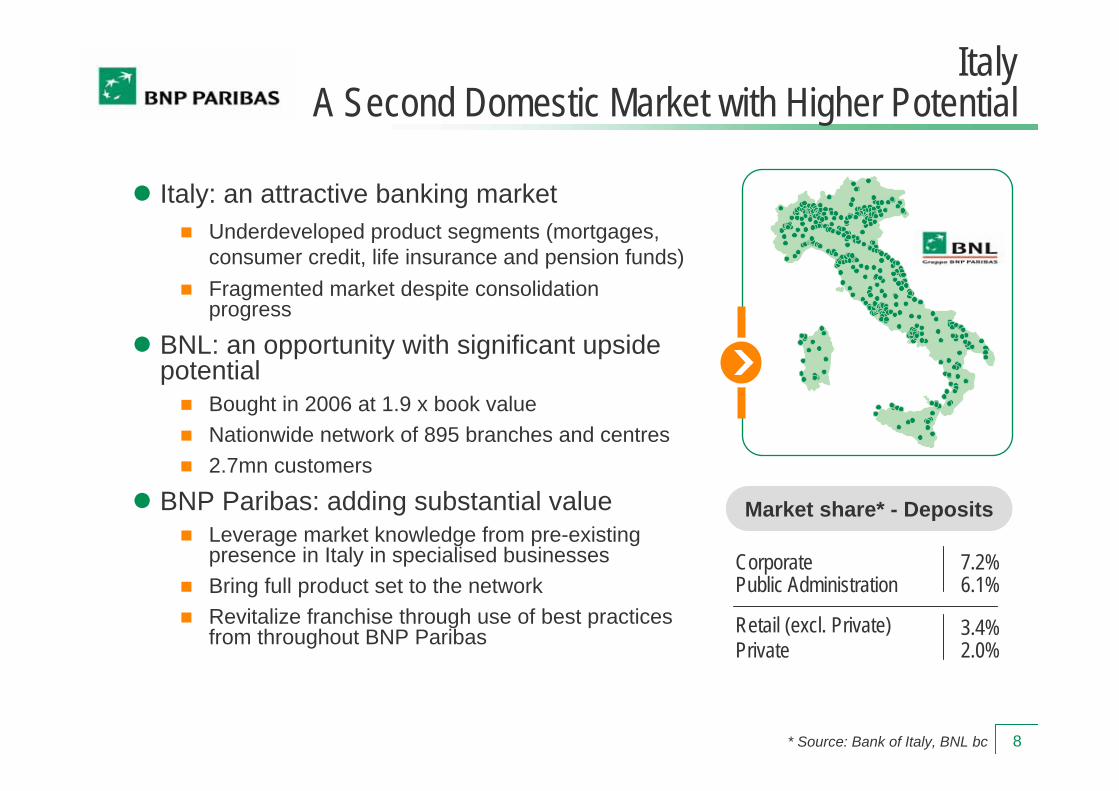
ItalyA Second Domestic Market with Higher Potential
Italy: an attractive banking marketUnderdeveloped product segments (mortgages, consumer credit, life insurance and pension funds)Fragmented market despite consolidation progress
BNL: an opportunity with significant upside potential
Bought in 2006 at 1.9 x book valueNationwide network of 895 branches and centres2.7mn customers
BNP Paribas: adding substantial valueLeverage market knowledge from pre-existing presence in Italy in specialised businesses Bring full product set to the network Revitalize franchise through use of best practices from throughout BNP Paribas
Market share* - Deposits
Retail (excl. Private)Private
Public AdministrationCorporate
3.4%2.0%
7.2%6.1%
* Source: Bank of Italy, BNL bc

9
First Mortgage Home EquityLoans
The western United States: a large and growing market
Banking market still fragmentedPopulation 2006: 98mn* (7% projected growth 2006-2011*)
A focus on community banking A track record of value creating acquisitions
1980-2003: 14 acquisitions2004: Community First and Union Safe Deposit 2005: Commercial Federal
A low risk business modelDiverse portfolio of assetsAll mortgage loans are kept on the balance sheet reducing the volatility of incomeNo exposure to “innovative” mortgages50% of CRE exposure is to owner-occupied buildings
United StatesBancWest: A Growing Retail Franchise
*Source: SNL
48%
51%
1%
50%
PrimeSuper Prime
Sub Prime99%
FICO Scores
2%
98%48%
US$ 9.2 bn
US$ 3.3 bn
Mortgages granted to individual cust.

10
62%58%
38%
42%
2003 2006
Loans outstandings
in €bn
29.0
53.3
Leading market positions in EuropeWestern Europe: #1 in France, #1 in Italy, #3 in Spain Central Europe: #1 in Hungary, #2 in Romania, #3 in the Czech Rep. and Slovakia
#1 In Europe for on line distributionContinued strong growth, especially outside France
Half of new loan production outside France: Italy, Spain, Brazil, Central Europe
Low cost of risk Sophisticated scoring tools No significant presence on the sub-prime segment
France
Outside France
CAGR 22.5%
Consumer CreditCetelem: A Leader in Consumer Finance

11
2,090
3,614
2003 2006
Assets Under Custody/Admi
in €bn
Strong underlying growth trendsDeveloped economies: ageing population, deficits in public pension and health schemes Emerging countries: expanding middle class, more high net-worth individuals
High net asset inflows €100bn since 2003, 58% of AuM increase
Core retail distribution focusIndividuals represent 72% of asset source #1 in France in Private Banking and #1 for on-line savings and brokerage in Europe
Recognised expertise in selected business areas
European leader in Corporate Real Estate services and in Securities servicesWorldwide leader in creditor protection Ongoing expansion of the Parvest range of mutual funds and fast development in asset management in Brazil, Turkey, India, Korea and China
Asset Management and Services Strong and Complementary Businesses
CAGR +20%
4.6% 4.4%
9.9%8.6%
11.1%
2003 2004 2005 2006 1Q07
Net asset inflows*
*Annualised rate − % of AuM

12
14,300 staff in 52 countriesStrong areas of excellence in fast growing markets
Derivatives (Equity, Interest rates, Credit, FX, Commodities), where new asset classes, new products and new investors types are fuelling demand and liquiditySpecialized lending (Energy & Commodities, Acquisition Finance), supported by globalisation and demand for energy
A business model anchored on client driven business
Central role of Coverage teams to foster cross-sellingLimited proprietary trading business
Growth achieved purely organically since merger of BNP and Paribas in 1999Best in class efficiency and risk management
Corporate and Investment BankingA European Leader with Global Franchises
40%
32%33%
27%
2003 2004 2005 2006
Pre-Tax ROE
3.33.8 3.9
5.1
3.5
SociétéGénérale
CréditSuisse**
UBS BNPParibas*
DeutscheBank
European CIBs 2006 Pre-Tax Income
in €bn
•BNP Paribas CIB figures do not include private equity (in the corporate center) nor cash equity (Exane) ** CS figures do not include credits from insurance settlements for litigation and related costs

13
BNP Paribas at a Glance
Key Group CatalystsValue Proposition for Shareholders

14
10%
15%
20%
25%
30%
35%
40%
45%
0% 10% 20% 30% 40% 50%
Profitable Growth Ahead
Outperform thanks to customer acquisition, cross-selling and product innovationReach significant pre-tax growth, thanks to cost control and risk management
Deploy all BNP Paribas product expertise and cross-selling skillsFurther internationalisation, through organic growth and add-on acquisitions
RFS
AMS
BNL bc**
CIB
70%
Size equals 2006 Pre-Tax Income
FRB*EM
Profitability 2006 Pre-Tax ROE
BancWest
30%
*Excluding Pel/CEL effects **1Q07 / 1Q06 pro forma annualised Growth
Pre-Tax Income 2006/2005
Manage for Growth
Manage for Profitability
Cetelem

15
Significant Potential Upside Ahead in Italy
New commercial set-up being deployed
Retail, Private, Corporate
Initial commercial successes4WD and Target Return
Total Return and Conto Revolution
+2,000 new net account openings in 1Q07 vs. -24,000 in 1Q06 before the acquisition
€480mn synergies targeted by 2009
38% (€181mn) of total synergies already implemented
210109
19100
185
270
2007 2008 2009
Total Synergies 2009
in €mn
119
294
480
Cost synergies Net revenue synergies
48
68
116
3838
2711
16Net revenue
synergiesCost synergies Total synergies
Full year effect of synergies already implemented1Q07 accounts2006 accounts
Synergies progress
in €mn
64
117
181

16
Grow Beyond EuropeMediterranean, Gulf and Far Eastern Europe
864
841
574
2005 2006
Number of Branches End of period
Expand the retail banking networks either organically or through disciplined acquisition
Acquisitions of TEB in Turkey and UkrSibbank in Ukraine
Progressively roll out the business model Leverage the rising retail customer base in the region to develop international Private Banking
External growth
1,705
Cetelem
UCB
Arval
BPLG
Retail banking
Insurance
Asset Mgt.
BPSS
Private Banking
Corporate Finance
Energy & Commodities

17
Grow Beyond Europe - Asia
Leverage significant CIB platform in Derivatives, Energy, Commodities and Project Finance
Accelerate development of private banking
Expand distribution network for asset management, life insurance and protection insurance via strategic agreements and participations
Geogit and Sundaram Mutal Fund in India, Taiwan Cooperative Bank in Insurance, Vietcombank and Seabank in Vietnam
Selectively develop presence of Retail financial services in the most promising markets
Hong Kong
Shanghai
Tokyo
Hanoi
Manilla
Mumbai
Ho Chi Minh City
Beijing
Singapore
New Delhi
Seoul
Osaka
Jakarta
Kuala Lumpur
Melbourne
Sydney
Taipei
Bangkok
Private Banking
Insurance
Asset Mgt.
Personal Investors
BPSS
Energy & Commodities
Fixed Income
EQD
Corporate Finance
Structured finance
Cetelem
UCB
Arval
BPLG

18
France: 6mn Customers Continue outperforming the market
Core centre of expertiseHigh average of 8 products/customerRapidly increase wallet share of increasing number of new clients
Emerging Markets 3mn CustomersProgressively roll out the business model
Western USA 4mn Customers Develop cross selling techniques to alleviate margin pressure
Further Raise Cross Selling Levels
Make full product range available throughout the network (i.e. Insurance) Increase product range (i.e. Private Banking)Specific US customer habits
Leverage product expertise and platforms in AMS, RFS and CIB Deploy according to country potential and specific regulatory constraints
Italy: 3mn CustomersReplicate full business model
Deploy full extent of existing strong Italian product offering (AMS, RFS, CIB) to the underdeveloped BNL customer base

19
BNP Paribas at a Glance
Key Group Catalysts
Value Proposition for Shareholders
20
Delivering Sustainable Growth and Shareholder Value
History of producing strong growth and returns
Diversified business mix geared towards growth
Prudent risk policy and stringent monitoring procedures
Strong capital position to execute growth
Shareholder friendly capital allocation
Insiders (executives and staff) own 7% of shares

21
Revenue growth
Revenue growth (organic)
Efficiency ratio evolution
Cost of risk
Return on equity
Book value per share
Net Income per share
Dividends per share
+6.8%
+9.7%
+5.0%
+4.8%
-1pt -26pt
-2.3% -1.3%
+13.2% +27.9%
+37.9%
+7.9%
+20.8%
+9.8%
14.3% 16.8%
A History of Profitable and Sustainable Growth
2003 2004 2005 2006
+12.8%
+10.0%
-12pt
-0.4%
+27.3%
+30.0%
+27.6%
20.2%
+27.9%
+13.5%
+1pt
-0.1%
+14.3%
+8.7%
+19.2%
21.2%

22
2003 2004 2005 2006
Revenues* by Divisions(in €bn and %)
Balanced Business Mix Geared Towards Sustainable Growth
* Excluding BNP Paribas Capital and Other Activities
16%
17%16%
14%
54% 53% 53%55%
32%30%
30%
29%
Asset Management and Services Retail :Banking Networks & Retail Financial Services
Corporate and Investment Banking
CAGR + 15.2 %
17.9
27.4

23
Prudent Risk Policy And Stringent Monitoring Procedures
Limited real estate risks in Europe and in the US, whether in Retail or in CIB
Low and highly stable risk profile in consumer credit
Active syndication of Corporate loans, in particular LBOs
Moderate exposure to market risks, and counterparty risks largely collateralised
BNL incorporated in the Group’s risk management procedures
32 31 25 18 15
67 67
3016 10 15 24
62
5
-17 -14
5024 18 19 23
-92003 2004 2005 2006 1Q07 2006* 1Q07 2003 2004 2005 2006 1Q07 2003 2004 2005 2006* 1Q07 2003 2004 2005 2006 1Q07 2003 2004 2005 2006 1Q07
Cost of Risk
FRB
* Excluding non-recurring items* Pro forma
Net provisions/Average Risk Weighted Assets
CIB Cetelem BancWest BNLbc
194 186209197 197
BNP Paribas

24
Solid Financial Structure to Execute Growth Plans
AA Positive outlookAA Positive outlook Reaffirmed on Feb. 21, 2007
Reaffirmed on Feb. 21, 2007
Aa1 Stable outlookAa1 Stable outlook
AA Stable outlookAA Stable outlook
Upgraded on May 11, 2007
Upgraded on May 11, 2007
Reaffirmed on May 15, 2006
Reaffirmed on May 15, 2006
In Billions of euros31-Dec-06
Shareholders' equity Group share, not re-evaluated (a) 37.2
Valuation Reserve 5.0
(of which Private Equity holdings) (2.2)
Total Capital ratio 10.5%
Tier One Ratio (b) 7.4%
In Billions of euros31-Dec-06
Shareholders' equity Group share, not re-evaluated (a) 37.2
Valuation Reserve 5.0
(of which Private Equity holdings) (2.2)
Total Capital ratio 10.5%
Tier One Ratio (b) 7.4%
Financial Structure
Ratings
(a) Excluding undated participating subordinated notes and after estimated distribution(b) On estimated risk weighted assets respectively of €465.2bn as at 31.12.06 and €377.7bn as at 31.12.05.
7.4%7.4%7.6%7.5%
01.01.05 31.12.05 31.12.06 31.03.07
Tier 1 Ratio

25
Shareholder Friendly Capital Allocation
Internally generated capital provides growth and value for shareholders
Internally generated capital provides growth and value for shareholders
€4.5bn 2006 Free Cash Flow
€4.5bn 2006 Free Cash Flow
Priority given to organic growth projects due to high rates of return on equity
Priority given to organic growth projects due to high rates of return on equity
21.2% 2006 After Tax ROE
21.2% 2006 After Tax ROE
Sharp dividend increases, +29% 2003-06 CAGRSharp dividend increases, +29% 2003-06 CAGR 40.3%2006 Payout ratio
40.3%2006 Payout ratio
A history of share buybacks to enhance returns
A history of share buybacks to enhance returns
7% Tier 1 Ratio Target
7% Tier 1 Ratio Target

26
Delivering Growth and Sustainable ValueBNP Paribas
Thank you

27
Appendices

28
Earnings Per Share
Number of shares, Earnings and Book Value per Share
in millions 1Q07 2006Number of Shares (end of period) 932.9 930.5Number of Shares excluding Treasury Shares (end of period) 900.4 905.3Average Number of Shares Outstanding excluding Treasury Shares 904.7 893.8
In euros 1Q07 1Q06Earnings Per Share (EPS) 2.73 2.38
Number of shares
Book Value Per Share
In euros 31/03/2007 31/12/2006Book Value Per Share 52.2 49.8of which shareholders' equity not re-evaluated 46.8 44.2

29
A Track Record of Growth and Value Creation
Undiluted EPS calculated based on the average number of shares oustandings
4.285.51
6.968.03
2.38 2.73
2003 * 2004 * 2005 * 2006 1Q06 1Q07
in €
Earnings per Share
1.452.00
2.603.10
2003 2004 2005 2006
in €
Dividend per share
CAGR = +28.8%CAGR = +23.3%
•Restated from the impact of the rights issue in March 2006
+14.7%

30
2007 A Positive Momentum
Grow revenues by 4% in 2007 (excl. PEL/CEL effects)Maintain a 1pt jaws effect between revenues and costs
FRENCH RETAIL
BANKING
FRENCH RETAIL
BANKING
BNL bcBNL bc Grow revenues by 7% and costs by 1%
EMERGING MARKETS
EMERGING MARKETS Grow revenues by more than 25%
CETELEMCETELEM Maintain double digit operating income growth
AMSAMS Maintain double digit revenue growth with positive jaws

31
BNP ParibasSustainable Growth and Value Creation
Baudouin Prot Chief Executive Officer
14 June 2007