
BNDES: HISTORY AND ASSESSMENT Sergio G. Lazzarini Insper Institute of Education and Research Aldo...
59
BNDES: HISTORY AND ASSESSMENT Sergio G. Lazzarini Insper Institute of Education and Research Aldo Musacchio Harvard Business School and NBER March 2014
-
Upload
vanessa-gardner -
Category
Documents
-
view
213 -
download
0
Transcript of BNDES: HISTORY AND ASSESSMENT Sergio G. Lazzarini Insper Institute of Education and Research Aldo...
BNDES:HISTORY AND ASSESSMENT
Sergio G. Lazzarini Insper Institute of Education and Research
Aldo MusacchioHarvard Business School and NBER
March 2014

MOTIVATION
State capitalism is one of the most misunderstood phenomena of our time
Most observers see the rise of SOEs and “national champions” from China, Brazil, Russia, with apprehension

PART OF THE APPREHENSION COMES FROM THE FACT THAT LARGE SOEs DIDN’T GO AWAY W/ PRIVATIZATIONS
(FIRMS with gov’t as majority owner—OECD, 2011)
Total equity value of US$ 1.4 trillion, of which 61% are minority stakes in large co’s
Source: Christiansen, H. “The size and composition of the SOE sector in OECD countries”, OECD Corporate Governance Working Papers, no 5, 2011.
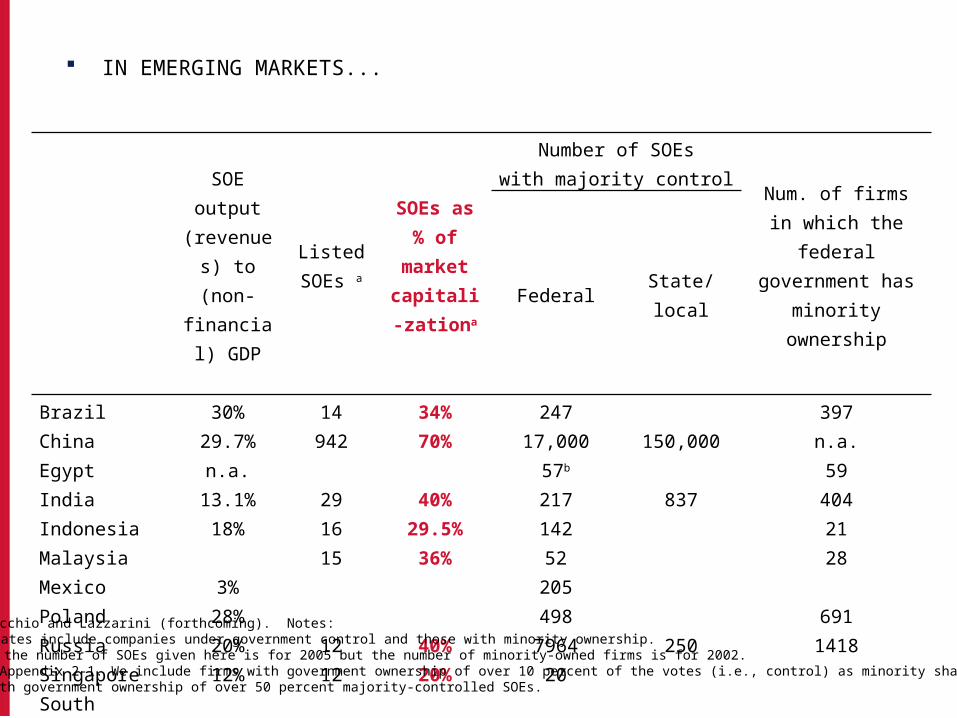
IN EMERGING MARKETS...
SOE output (revenues) to (non-financial)
GDP
Listed SOEs a
SOEs as % of market capitali-zationa
Number of SOEswith majority control Num. of firms in which
the federal government has minority ownership
Federal State/local
Brazil 30% 14 34% 247 397China 29.7% 942 70% 17,000 150,000 n.a.Egypt n.a. 57b 59India 13.1% 29 40% 217 837 404Indonesia 18% 16 29.5% 142 21Malaysia 15 36% 52 28Mexico 3% 205 Poland 28% 498 691Russia 20% 12 40% 7964 250 1418Singapore 12% 12 20% 20South Africa 270 Thailand 26% 6 21% 60Turkey 14% 74 700 67Vietnam 33.9% 461 1805 1559 1740Source: Musacchio and Lazzarini (forthcoming). Notes:
a These estimates include companies under government control and those with minority ownership.b For Egypt, the number of SOEs given here is for 2005 but the number of minority-owned firms is for 2002.Source: See Appendix 2-1. We include firms with government ownership of over 10 percent of the votes (i.e., control) as minority shareholdingsand those with government ownership of over 50 percent majority-controlled SOEs.
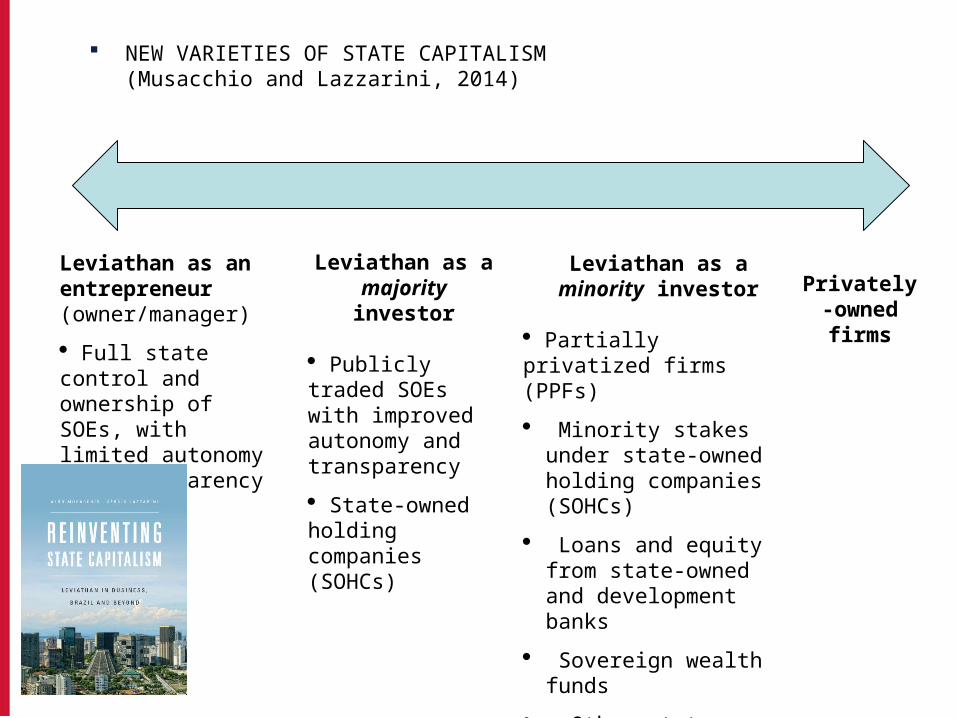
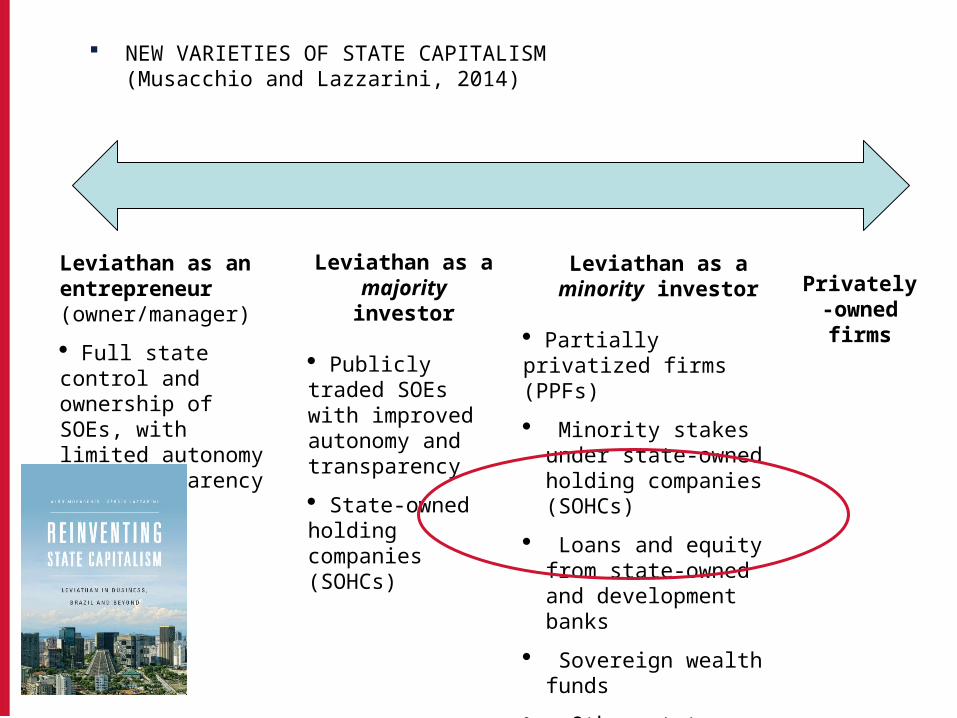
NEW VARIETIES OF STATE CAPITALISM(Musacchio and Lazzarini, 2014)
Leviathan as an entrepreneur (owner/manager)
· Full state control and ownership of SOEs, with limited autonomy and transparency
Leviathan as a majority investor
· Publicly traded SOEs with improved autonomy and transparency
· State-owned holding companies (SOHCs)
Leviathan as a minority investor
· Partially privatized firms (PPFs)
· Minority stakes under state-owned holding companies (SOHCs)
· Loans and equity from state-owned and development banks
· Sovereign wealth funds
· Other state-controlled funds (e.g. pension funds, life insurance companies).
Privately-owned firms

DEVELOPMENT BANKS: UNDERSTUDIED ACTORS
Source: based on Torres Filho (2009), with updated information from the banks’ annual reports.
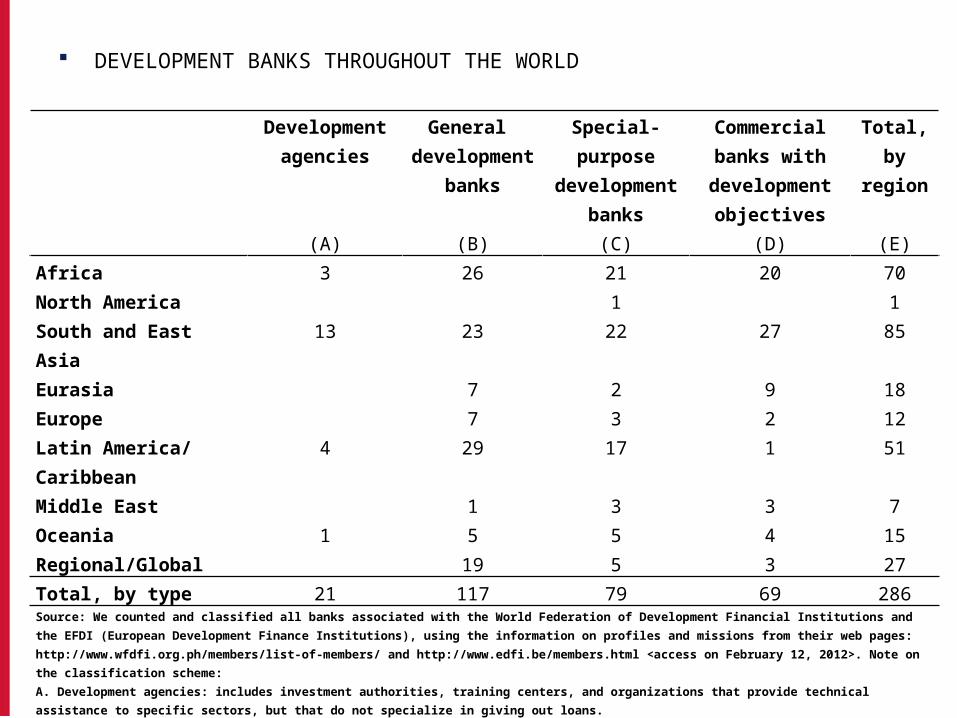
DEVELOPMENT BANKS THROUGHOUT THE WORLD
Development agencies
General development
banks
Special-purpose development
banks
Commercial banks with development
objectives
Total, by region
(A) (B) (C) (D) (E)Africa 3 26 21 20 70North America 1 1South and East Asia 13 23 22 27 85Eurasia 7 2 9 18Europe 7 3 2 12Latin America/ Caribbean 4 29 17 1 51Middle East 1 3 3 7Oceania 1 5 5 4 15Regional/Global 19 5 3 27Total, by type 21 117 79 69 286Source: We counted and classified all banks associated with the World Federation of Development Financial Institutions and the EFDI (European Development Finance Institutions), using the information on profiles and missions from their web pages: http://www.wfdfi.org.ph/members/list-of-members/ and http://www.edfi.be/members.html <access on February 12, 2012>. Note on the classification scheme:A. Development agencies: includes investment authorities, training centers, and organizations that provide technical assistance to specific sectors, but that do not specialize in giving out loans.B. General development banks are those focused on providing loans for or investing in the equity of industrial and/or infrastructure projects. It includes also banks that provide guarantees so that industrial or infrastructure projects can get private funding. They can be regional, such as the Inter-American Development Bank, or domestic, such as the Korea Development Bank.C. Special-purpose development banks are those financial institutions specialized on credits to agriculture, small and medium enterprises, or the construction industry. That is, we include banks that want to promote construction and housing developments for families who could not get mortgage loans from regular banks. This category can include agricultural banks like The Principal Bank for Development and Agricultural Credit, from Egypt or The Land Bank of the Philippines, or banks with broader objectives such as the National Housing Bank of India.D. There are many banks that we classify as commercial banks with some development objectives because these banks, public or private, operate as regular banks, but tend to have one part of their portfolio focused on specific sectors that the government is targeting. Examples of this are Azerigazbank in Azerbaijan, the Banco de Desarrollo Productivo in Bolivia, and the Bhutan National Bank Ltd, in Bhutan.
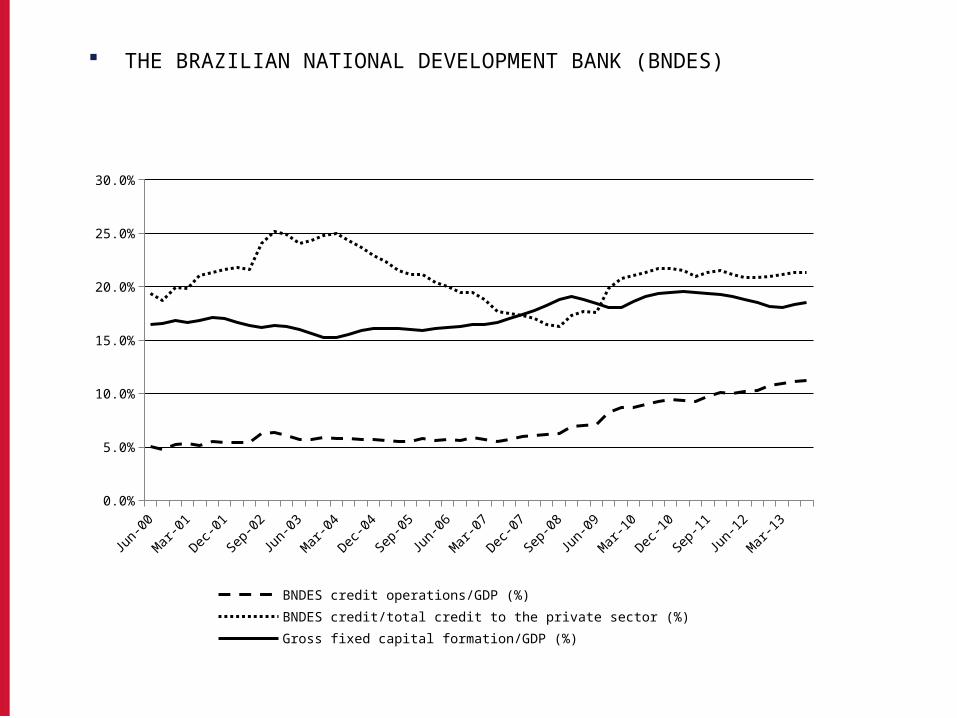
THE BRAZILIAN NATIONAL DEVELOPMENT BANK (BNDES)
Jun-00
Nov-00Apr-0
1
Sep-01
Feb-02Jul-0
2
Dec-02
May-03Oct-
03
Mar-04
Aug-04Jan-05
Jun-05
Nov-05Apr-0
6
Sep-06
Feb-07Jul-0
7
Dec-07
May-08Oct-
08
Mar-09
Aug-09Jan-10
Jun-10
Nov-10Apr-1
1
Sep-11
Feb-12Jul-1
2
Dec-12
May-13
0.0%
5.0%
10.0%
15.0%
20.0%
25.0%
30.0%
BNDES credit operations/GDP (%) BNDES credit/total credit to the private sector (%)Gross fixed capital formation/GDP (%)

THE INDUSTRIAL POLICY VIEW OF DEVELOPMENT BANKS
Development scholars argue that lack of credit and coordination failure will lead to suboptimal investment and entrepreneurship (Amsden, 2001; Gerschenkron, 1962; Rodrik, 2004; Yeyati et al., 2004; Amsden, 2001;).
Development banks, in particular, are specialized in long-term projects and have technical personnel with industry-specific expertise (Armendáriz de Aghion, 1999).
Emphasis on the development of latent capabilities (Hausmann and Rodrik, 2003).
They may also set performance targets as conditions to get loans (Amsden, 2001); and help signal credibility (George and Prabhu, 2000).
Thus, this view suggests a positive effect of development banks on firm-level performance and investment.

THE POLITICAL VIEW OF DEVELOPMENT BANKS
Soft-budget constraint hypothesis (e.g. Kornai, 1979): Development banks tend to support underperforming
firms (e.g. bail them out). Rent-seeking hypothesis (e.g. Claesens et al., 2008; Faccio,
2006; La Porta et al., 2002): Politically-connected firms are more likely to get
subsidized loans. Thus, we should not expect performance improvements after
a company gets funding. The “national champions” debate (Ades & DiTella, 1997)
Loans to help flagship firms for industrial policy reasons or because there is “political influence” in the back?
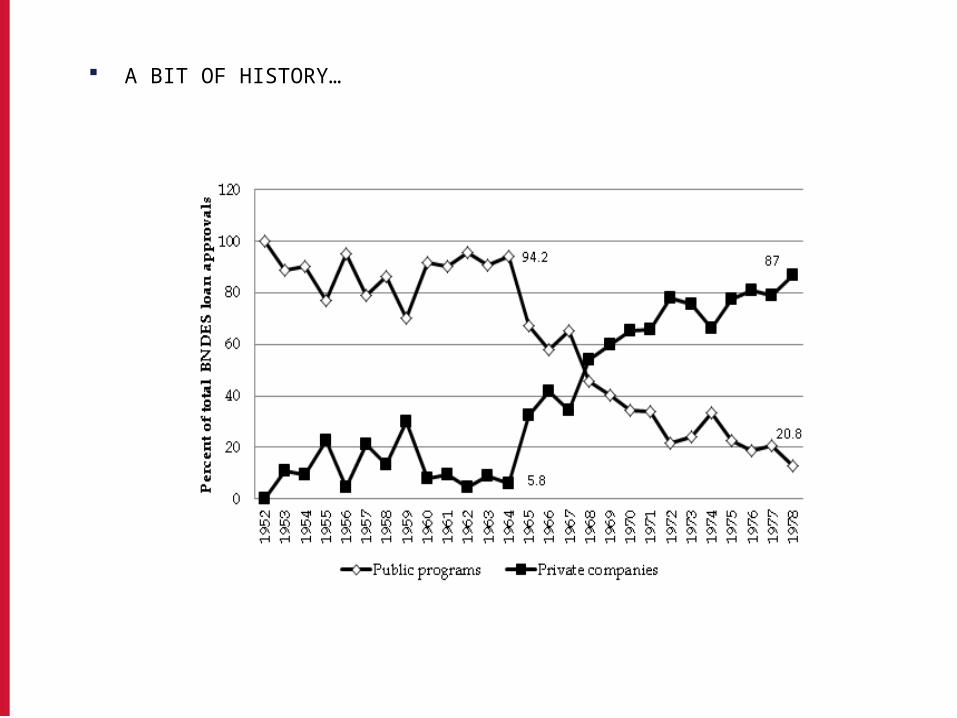
A BIT OF HISTORY…
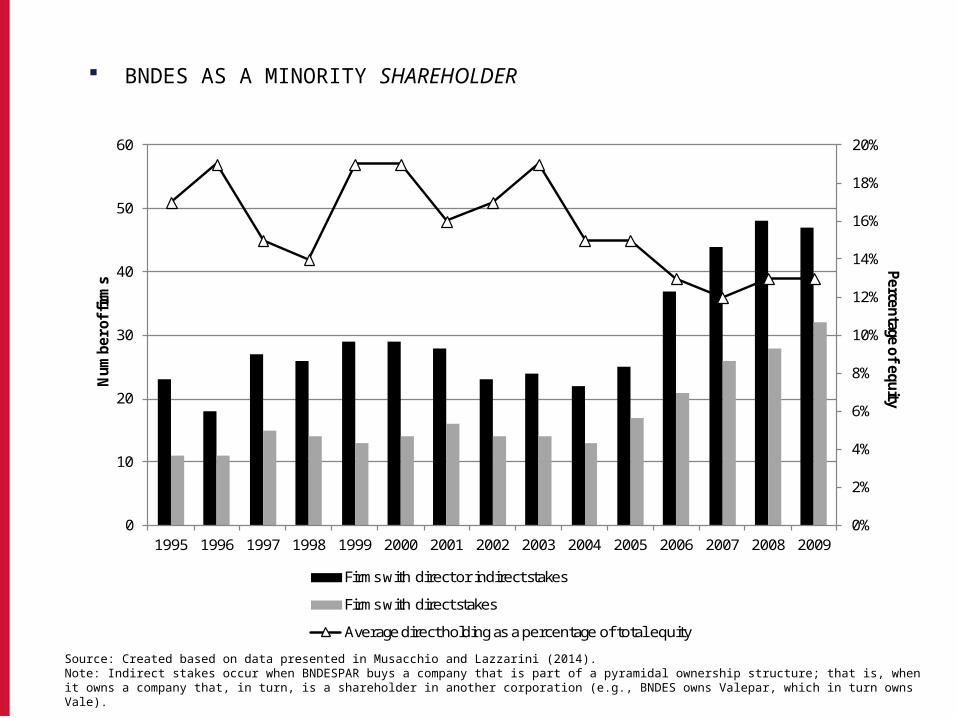
BNDES AS A MINORITY SHAREHOLDER
0%
2%
4%
6%
8%
10%
12%
14%
16%
18%
20%
0
10
20
30
40
50
60
1995 1996 1997 1998 1999 2000 2001 2002 2003 2004 2005 2006 2007 2008 2009
Percentage of equity
Num
ber o
f firm
s
Firms with direct or indirect stakes
Firms with direct stakes
Average direct holding as a percentage of total equity
Source: Created based on data presented in Musacchio and Lazzarini (2014).Note: Indirect stakes occur when BNDESPAR buys a company that is part of a pyramidal ownership structure; that is, when it owns a company that, in turn, is a shareholder in another corporation (e.g., BNDES owns Valepar, which in turn owns Vale).
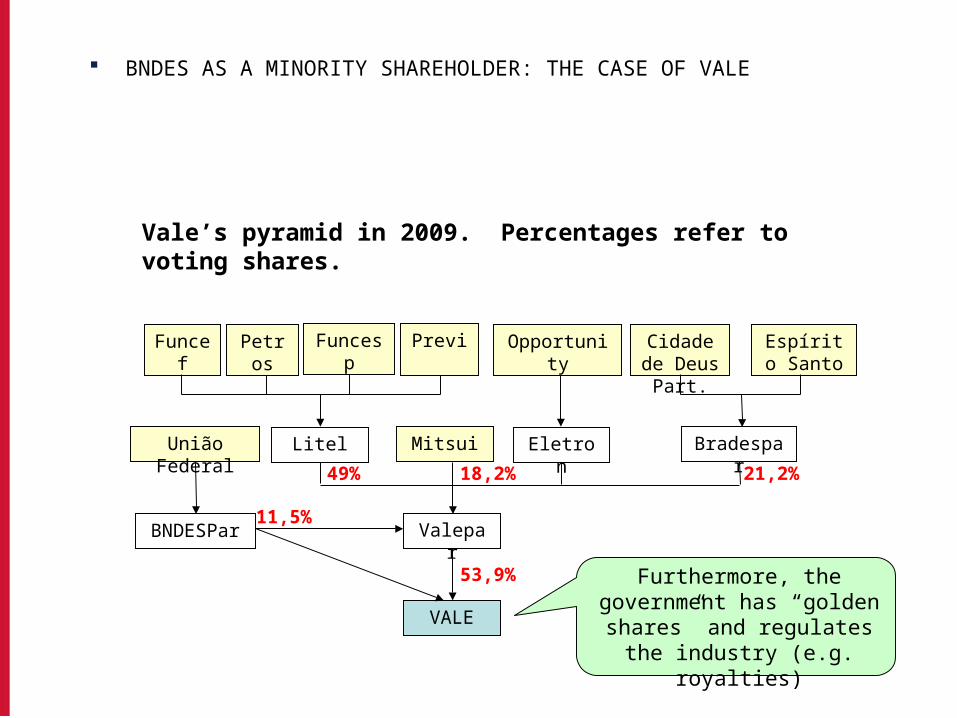
BNDES AS A MINORITY SHAREHOLDER: THE CASE OF VALE
Vale’s pyramid in 2009. Percentages refer to voting shares.
Funcef Petros Funcesp Previ Opportunity Cidade de Deus Part.
Espírito Santo
Mitsui Eletron BradesparLitelUnião Federal
18,2% 21,2%49%
VALE
ValeparBNDESPar11,5%
53,9% Furthermore, the government has “golden shares” and
regulates the industry (e.g. royalties)

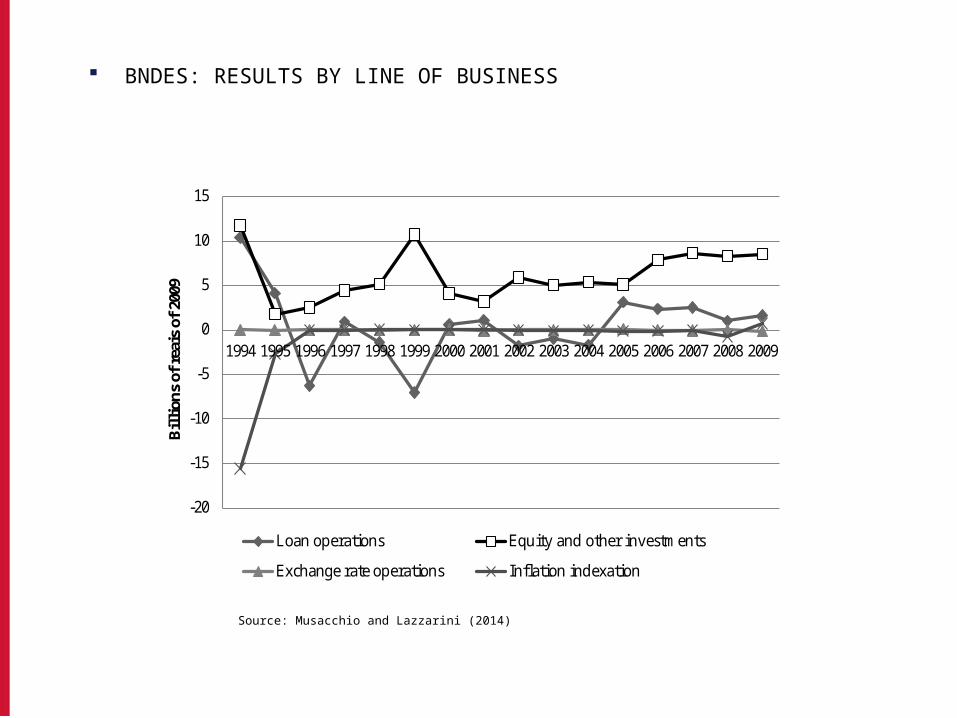
BNDES: RESULTS BY LINE OF BUSINESS
Source: Musacchio and Lazzarini (2014)
-20
-15
-10
-5
0
5
10
15
1994 1995 1996 1997 1998 1999 2000 2001 2002 2003 2004 2005 2006 2007 2008 2009
Billion
s of
reai
s of
200
9
Loan operations Equity and other investments
Exchange rate operations Inflation indexation
BNDES: RESULTS BY LINE OF BUSINESS
Source: Musacchio and Lazzarini (2014)
-20
-15
-10
-5
0
5
10
15
1994 1995 1996 1997 1998 1999 2000 2001 2002 2003 2004 2005 2006 2007 2008 2009
Billion
s of
reai
s of
200
9
Loan operations Equity and other investments
Exchange rate operations Inflation indexation
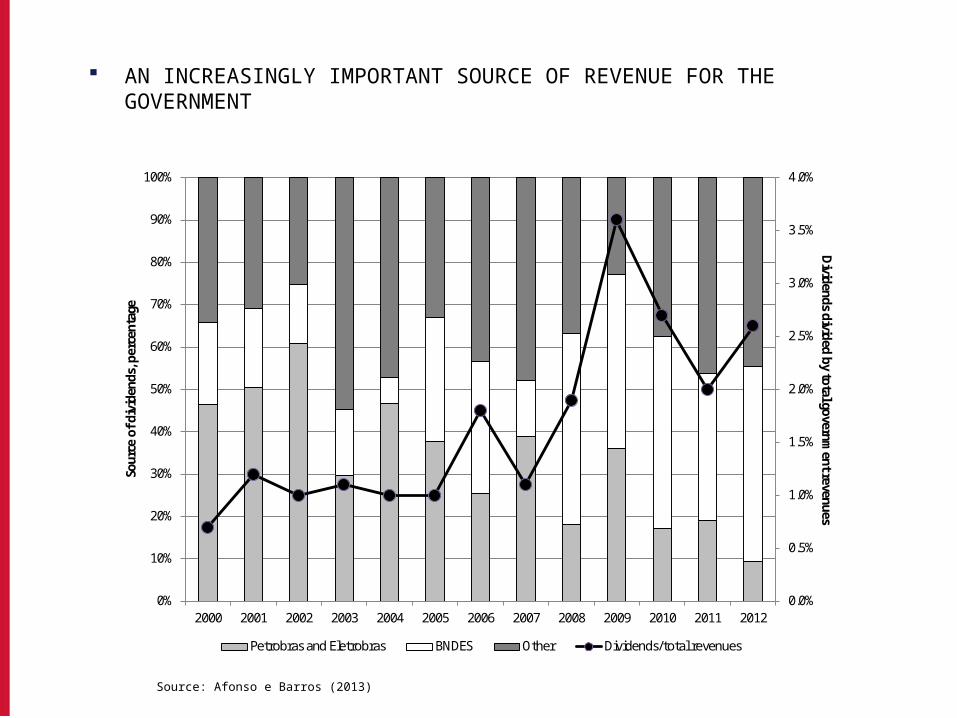
AN INCREASINGLY IMPORTANT SOURCE OF REVENUE FOR THE GOVERNMENT
Source: Afonso e Barros (2013)
0.0%
0.5%
1.0%
1.5%
2.0%
2.5%
3.0%
3.5%
4.0%
0%
10%
20%
30%
40%
50%
60%
70%
80%
90%
100%
2000 2001 2002 2003 2004 2005 2006 2007 2008 2009 2010 2011 2012
Dividends divided by total governm
ent revenuesSo
urce
of d
ivid
ends
, per
cent
age
Petrobras and Eletrobras BNDES Other Dividends/total revenues

FIRM-LEVEL EVIDENCE ON MINORITY STAKES BY BNDES (1995-2009)
ROA is the dependent variable. Minority state equity is measured as…
Direct or indirect stakes (dummy) Direct stakes only (percentage) Stake > 0% Stake ≥ 10% (1) (2) (3) (4) (5) (6)Hypothesized effects
Minority 0.111** 0.003 0.009** 0.004*** 0.003 0.183***(0.055) (0.039) (0.004) (0.002) (0.047) (0.060)
Minority×Group -0.131** -0.041 -0.012*** -0.007** -0.070 -0.233***(0.061) (0.045) (0.005) (0.003) (0.057) (0.080)
Controls Group 0.124** 0.101 0.116** 0.096 0.091 0.091 (0.051) (0.079) (0.050) (0.096) (0.092) (0.097)Ln(Revenues) 0.078*** 0.027** 0.079*** 0.032*** 0.030*** 0.034*** (0.025) (0.013) (0.025) (0.011) (0.011) (0.012)
Leverage -0.012 -0.387*** -0.012 -0.380*** -0.388***-0.360***
(0.008) (0.057) (0.008) (0.056) (0.055) (0.055)
Fixed assets -0.280** -0.223** -0.281** -0.225** -0.200**-0.256***
(0.115) (0.090) (0.115) (0.091) (0.096) (0.091)Foreign control 0.035 -0.029 0.031 -0.038 -0.047 -0.018 (0.033) (0.027) (0.034) (0.037) (0.039) (0.041)State control 0.01 -0.019 -0.003 -0.073 -0.070 -0.080 (0.046) (0.063) (0.055) (0.078) (0.075) (0.079)Merger -0.019 -0.031 -0.007 -0.081 -0.090 -0.077 (0.045) (0.051) (0.046) (0.060) (0.064) (0.064)Year, firm, firm–industry fixed effects Yes Yes Yes Yes Yes Yes
With propensity score matching No Yes No Yes Yes Yes
N (total observations) 2,920 1,169 2,919 1,194 2,919 1,194N (number of firms) 367 128 367 130 130 130p (F-test) < 0.001 < 0.001 < 0.001 < 0.001 < 0.001 < 0.001
Source: Inoue, Musacchio and Lazzarini (2013)
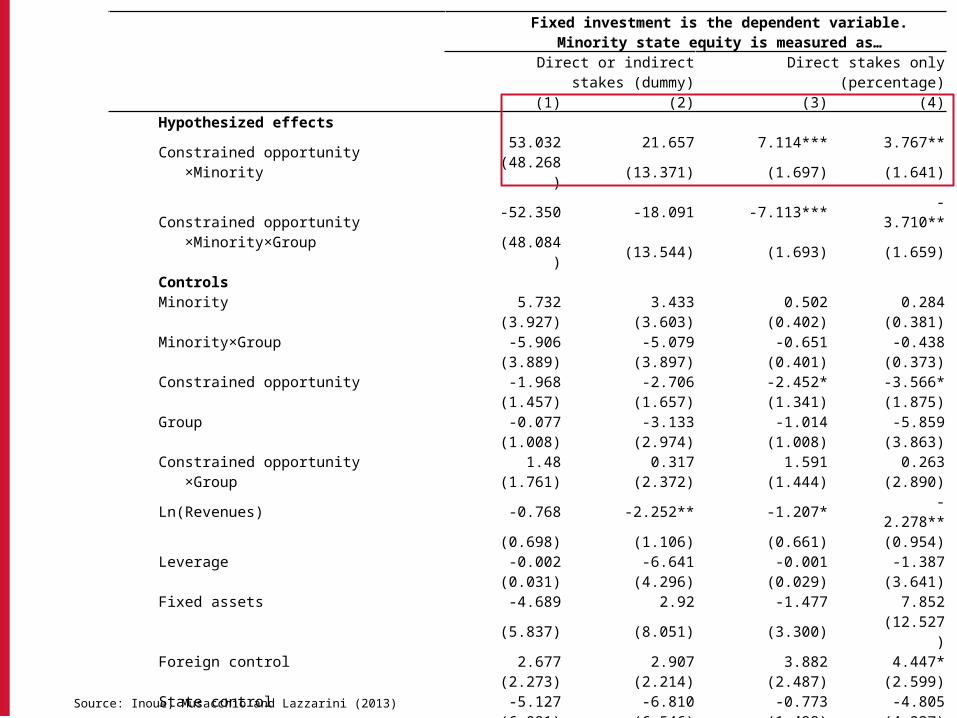
Fixed investment is the dependent variable.Minority state equity is measured as…
Direct or indirect stakes (dummy) Direct stakes only (percentage) (1) (2) (3) (4)Hypothesized effects Constrained opportunity ×Minority
53.032 21.657 7.114*** 3.767**(48.268) (13.371) (1.697) (1.641)
Constrained opportunity ×Minority×Group
-52.350 -18.091 -7.113*** -3.710**(48.084) (13.544) (1.693) (1.659)
Controls Minority 5.732 3.433 0.502 0.284 (3.927) (3.603) (0.402) (0.381)Minority×Group -5.906 -5.079 -0.651 -0.438 (3.889) (3.897) (0.401) (0.373)Constrained opportunity -1.968 -2.706 -2.452* -3.566* (1.457) (1.657) (1.341) (1.875)Group -0.077 -3.133 -1.014 -5.859 (1.008) (2.974) (1.008) (3.863)Constrained opportunity ×Group
1.48 0.317 1.591 0.263(1.761) (2.372) (1.444) (2.890)
Ln(Revenues) -0.768 -2.252** -1.207* -2.278** (0.698) (1.106) (0.661) (0.954)Leverage -0.002 -6.641 -0.001 -1.387 (0.031) (4.296) (0.029) (3.641)Fixed assets -4.689 2.92 -1.477 7.852 (5.837) (8.051) (3.300) (12.527)Foreign control 2.677 2.907 3.882 4.447* (2.273) (2.214) (2.487) (2.599)State control -5.127 -6.810 -0.773 -4.805 (6.091) (6.546) (1.498) (4.237)Merger 0.313 -5.968 0.116 -5.649 (1.411) (3.725) (1.453) (3.799)Year, firm, firm–industry fixed effects Yes Yes Yes YesWith propensity score matching No Yes No YesN (total observations) 1,970 861 1,969 878N (number of firms) 314 122 314 124p (F test) < 0.001 < 0.001 < 0.001 < 0.001
Source: Inoue, Musacchio and Lazzarini (2013)
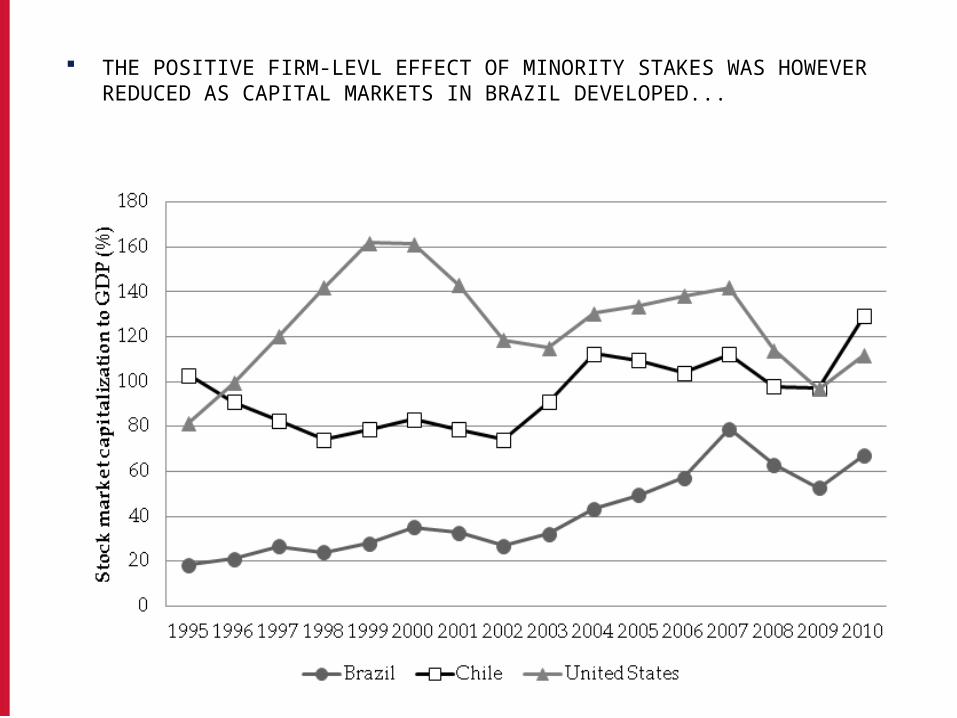
THE POSITIVE FIRM-LEVL EFFECT OF MINORITY STAKES WAS HOWEVER REDUCED AS CAPITAL MARKETS IN BRAZIL DEVELOPED...

IN ADDITION, RETURNS FROM THE EQUITY BUSINESS ARE FALLING...
-20.0%
-15.0%
-10.0%
-5.0%
0.0%
5.0%
10.0%
-0.3%
-2.1%
-17.9%
7.4%
-15.5%
-12.4%
BNDESPAR IBOVESPA
Estimated variation in the market cap of BNDESPAR’s portfolio of large firms.
Source:: BNDESPAR, annual reports. * 2014 data until mid March, 2014.
2012
2013 2014*
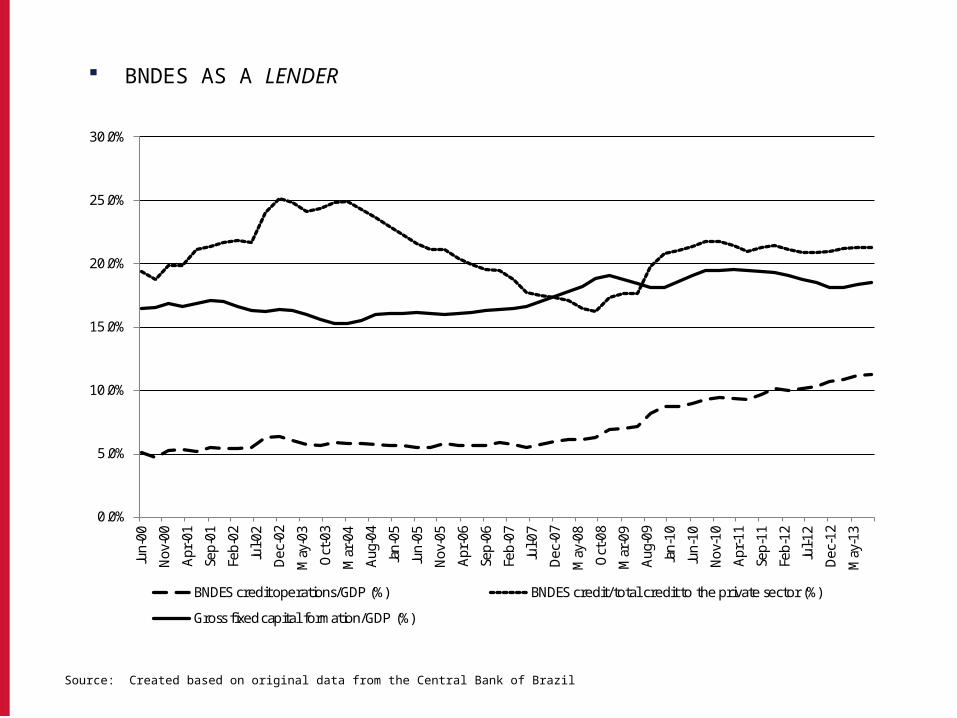
BNDES AS A LENDER
Source: Created based on original data from the Central Bank of Brazil
0.0%
5.0%
10.0%
15.0%
20.0%
25.0%
30.0%Ju
n-00
Nov
-00
Apr
-01
Sep-
01
Feb-
02
Jul-0
2
Dec
-02
May
-03
Oct
-03
Mar
-04
Aug
-04
Jan-
05
Jun-
05
Nov
-05
Apr
-06
Sep-
06
Feb-
07
Jul-0
7
Dec
-07
May
-08
Oct
-08
Mar
-09
Aug
-09
Jan-
10
Jun-
10
Nov
-10
Apr
-11
Sep-
11
Feb-
12
Jul-1
2
Dec
-12
May
-13
BNDES credit operations/GDP (%) BNDES credit/total credit to the private sector (%)
Gross fixed capital formation/GDP (%)

“NATIONAL CHAMPIONS”
Percentage of total loans in the databaseCompany In 2004 In 2009
Petrobras (oil) 14.5 39.4Telemar Norte Leste (telecom) 10.4 7.7Vale do Rio Doce (mining) n.a. 8.5Suzano (paper & energy) 3.4 2.6Brasil Telecom n.a. 3.2Neoenergia (electricity) 3.2 2.5CPFL Energia (electricity) 6.8 n.a.VBC Energia (electricity) 2.7 2.0CSN (steel) 4.2 2.3Klabin (paper) 1.3 2.1Aracruz (cellulose) 2.4 n.a.Cesp (electricity) 11.2 n.a.Sadia (food and agribusiness) 3.2 n.a.CPFL Geração (electricity) n.a. 2.1Embraer (airplanes) n.a. 1.4Source: Musacchio and Lazzarini (2014), using the database employed by Lazzarini et al. (2012).

DO BNDES LOANS IMPROVE PERFORMANCE AND INVESTMENT? ECONOMETRIC EVIDENCE
In general: inconclusive. Ottaviano and Sousa (2007): some lines positively affect
productivity, other lines have a negative effect. Sousa (2010): overall null effect on productivity. Coelho and De Negri (2010) larger effect on more productive
firms. De Negri et al. (2011) effect of loans on employment and the
extent of exports, but not on productivity. Pereira, Simões and Carvalhal (2011): subsidized loans have
positively affected investment (aggregated data). Lazzarini, Musacchio, Bandeira-de-Mello and Marcon (2012):
no effect on firm-level performance or investment, except for a reduction in financial expenditures due to credit subsidies (2002-2009, publicly traded firms).
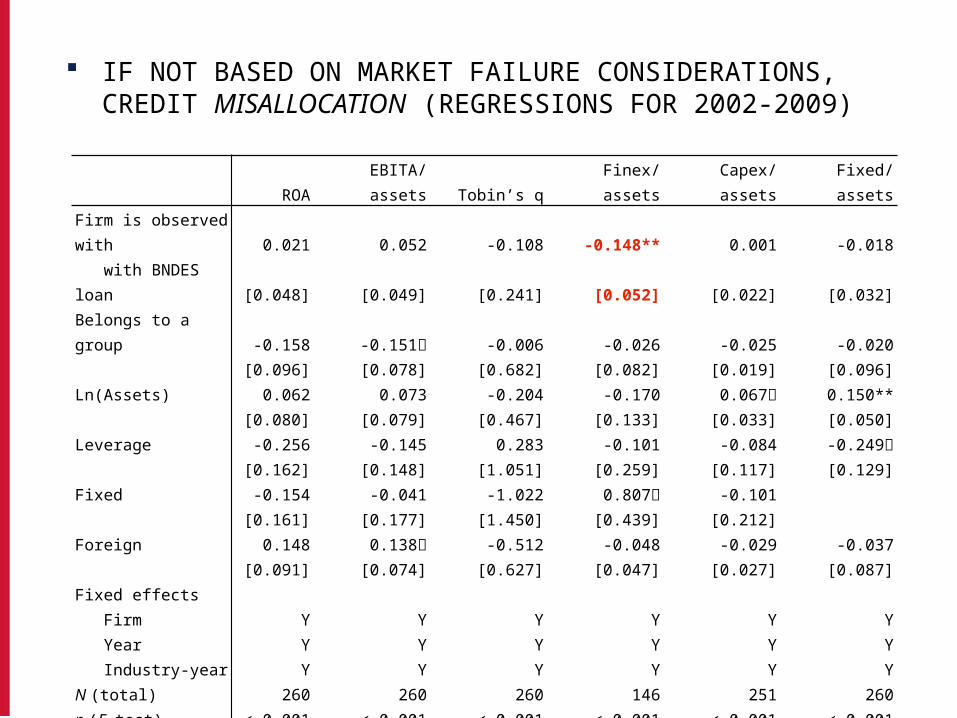
IF NOT BASED ON MARKET FAILURE CONSIDERATIONS, CREDIT MISALLOCATION (REGRESSIONS FOR 2002-2009)
ROA EBITA/assets Tobin’s q Finex/assets Capex/assets Fixed/assetsFirm is observed with 0.021 0.052 -0.108 -0.148** 0.001 -0.018 with BNDES loan [0.048] [0.049] [0.241] [0.052] [0.022] [0.032]Belongs to a group -0.158 -0.151 -0.006 -0.026 -0.025 -0.020 [0.096] [0.078] [0.682] [0.082] [0.019] [0.096]Ln(Assets) 0.062 0.073 -0.204 -0.170 0.067 0.150** [0.080] [0.079] [0.467] [0.133] [0.033] [0.050]Leverage -0.256 -0.145 0.283 -0.101 -0.084 -0.249 [0.162] [0.148] [1.051] [0.259] [0.117] [0.129]Fixed -0.154 -0.041 -1.022 0.807 -0.101 [0.161] [0.177] [1.450] [0.439] [0.212]Foreign 0.148 0.138 -0.512 -0.048 -0.029 -0.037 [0.091] [0.074] [0.627] [0.047] [0.027] [0.087]Fixed effects Firm Y Y Y Y Y Y Year Y Y Y Y Y Y Industry-year Y Y Y Y Y Y
N (total) 260 260 260 146 251 260
p (F test) < 0.001 < 0.001 < 0.001 < 0.001 < 0.001 < 0.001 p < 0.10 * p < 0.05 ** p < 0.01 *** p < 0.001. Robust standard errors in brackets, clustered on each firm. Regression
weights come from propensity matching score (kernel) estimation on the observed variables for the initial year of the sample (2002). Fixed-effect regressions are restricted to regions of common support.
Source: Lazzarini et al. (2012)
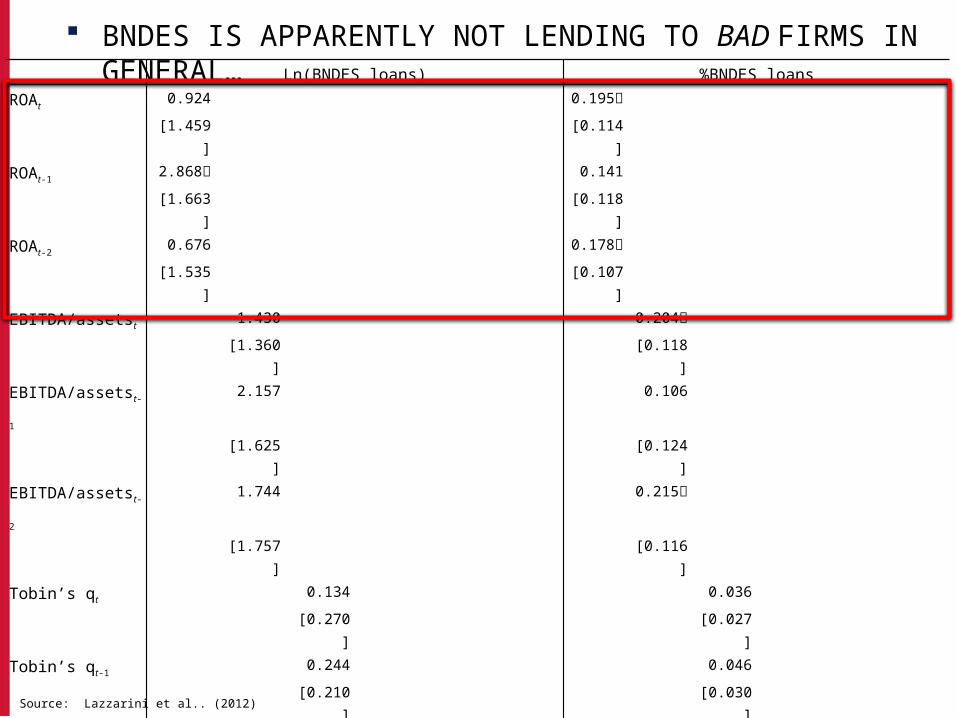
BNDES IS APPARENTLY NOT LENDING TO BAD FIRMS IN GENERAL… Ln(BNDES loans) %BNDES loans
ROAt0.924 0.195
[1.459] [0.114]
ROAt-12.868 0.141
[1.663] [0.118]
ROAt-20.676 0.178
[1.535] [0.107]
EBITDA/assetst1.430 0.204
[1.360] [0.118]
EBITDA/assetst-12.157 0.106
[1.625] [0.124]
EBITDA/assetst-21.744 0.215
[1.757] [0.116]
Tobin’s qt0.134 0.036
[0.270] [0.027]
Tobin’s qt-10.244 0.046
[0.210] [0.030]
Tobin’s qt-20.321 -0.021
[0.331] [0.027]
Donations 0.000 0.000
[0.008] [0.001]
Donations for 0.170** 0.015**
winners [0.062] [0.005]
Donations for -0.147** -0.013**
losers [0.049] [0.004]
Donations for 0.146** 0.013**
winners - losers [0.051] [0.004]
Source: Lazzarini et al.. (2012)

BUT: SOME EVIDENCE FOR THE POLITICAL VIEW…
Ln(BNDES loans) %BNDES loansROAt
0.924 0.195
[1.459] [0.114]
ROAt-12.868 0.141
[1.663] [0.118]
ROAt-20.676 0.178
[1.535] [0.107]
EBITDA/assetst1.430 0.204
[1.360] [0.118]
EBITDA/assetst-12.157 0.106
[1.625] [0.124]
EBITDA/assetst-21.744 0.215
[1.757] [0.116]
Tobin’s qt0.134 0.036
[0.270] [0.027]
Tobin’s qt-10.244 0.046
[0.210] [0.030]
Tobin’s qt-20.321 -0.021
[0.331] [0.027]
Donations 0.000 0.000
[0.008] [0.001]
Donations for 0.170** 0.015**
winners [0.062] [0.005]
Donations for -0.147** -0.013**
losers [0.049] [0.004]
Donations for 0.146** 0.013**
winners - losers [0.051] [0.004]
Likely due to “pre-governmental selection” of “champions” and firms participating in concessions. Donations are not correlated with performance.
Source: Lazzarini et al.. (2012)

BNDES: PERFORMANCE IN THE LOAN BUSINESS
Source: Calculated by Musacchio and Lazzarini (2014) with data from (BNDES 1953-2010). Returns are calculated as profits from BNDES’s investment portfolio (carteira de participações)—mostly through BNDESPAR—over the stock of such investments. All data was deflated using the IGP-DI index.
Between 2005 and 2009, the difference between the net interest margin of loans and the SELIC rate was, on average, -7.6%, which is close to the difference between the TJLP and the SELIC in the same period (-6.7%). Thus, BNDES pays around 7.6 cents per each dollar loaned

CONCERNS ON BNDES (1/2)
Credit Misallocation
– Literature on state-owned banks: misallocation problem involves funding of bad firms (e.g. Bailey et al., 2011 in China).
– Here: the bank is probably transferring credit to a substantial set of firms that would not need subsidized credit in the first place.
– Some argue that loans promote new investment, which in turn generate more taxes and dividends (Pereira et al., 2011). The problem with this argument is that we need to believe in the counterfactual that investment would be lower without new loans from BNDES.
Selection of “Champions”
– Lack of clear criteria (policy or politics?).– Policy of champions abandoned after 2012? Now champions are perhaps
state-controlled firms?

CONCERNS ON BNDES (2/2)
Soft-budget Constraints and Bailouts
– Very low index of nonperforming loans; and no systematic selection of bad firms.
– Yet bailouts do occur from time to time especially through convertible bonds (e.g. JBS in 2011)
Residual Interference in the Target Firms
– Especially when there is collusion of minority owners and firm-level rents. Example: Vale (BNDES + pension funds).

A CONTRASTING EXAMPLE: CORFO (CHILE)
Emphasis on small firms; no recent lending to large groups.
Acts jointly with private banks. Private bank lends; and then CORFO guarantees 50-80% of credit.
More recent emphasis on innovation (“InnovaChile”).
Grants to entrepreneurs are phased. Example: US$ 20k initially; extra money conditional on targets (such as 50% of sales growth in 6 months).

ANCILLARY SLIDES

Initially BNDES was making $ on loans

In the 1980s it became a hospital for ailing firms. Also lost $ on loans—began switch to equity
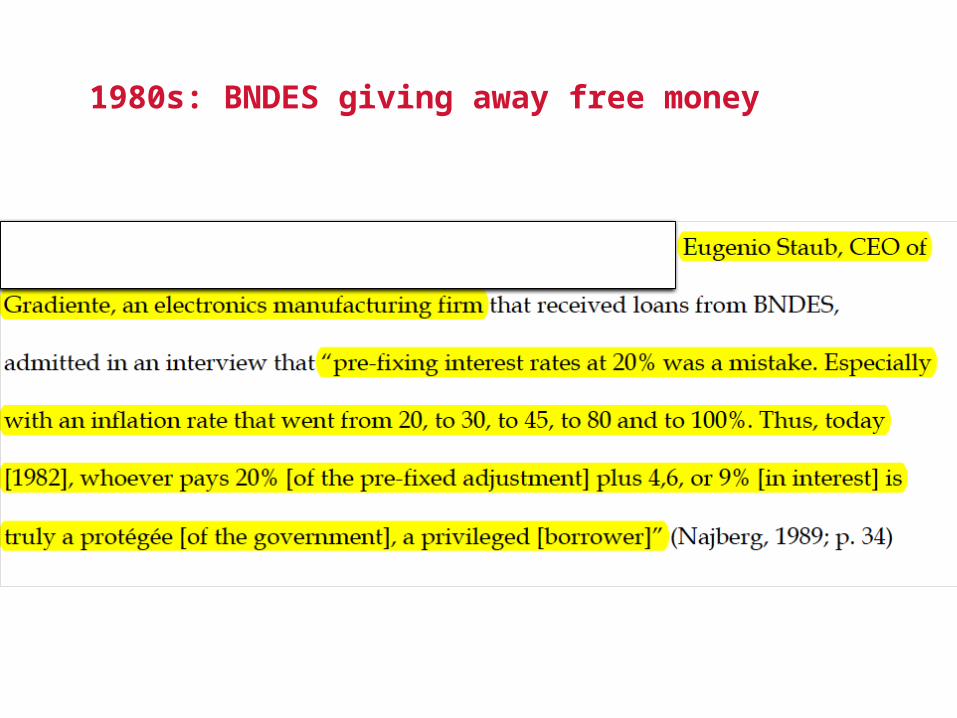
1980s: BNDES giving away free money


Since 1993 (with privatizations) BNDES makes most of its money from equity investments (BNDESPAR)
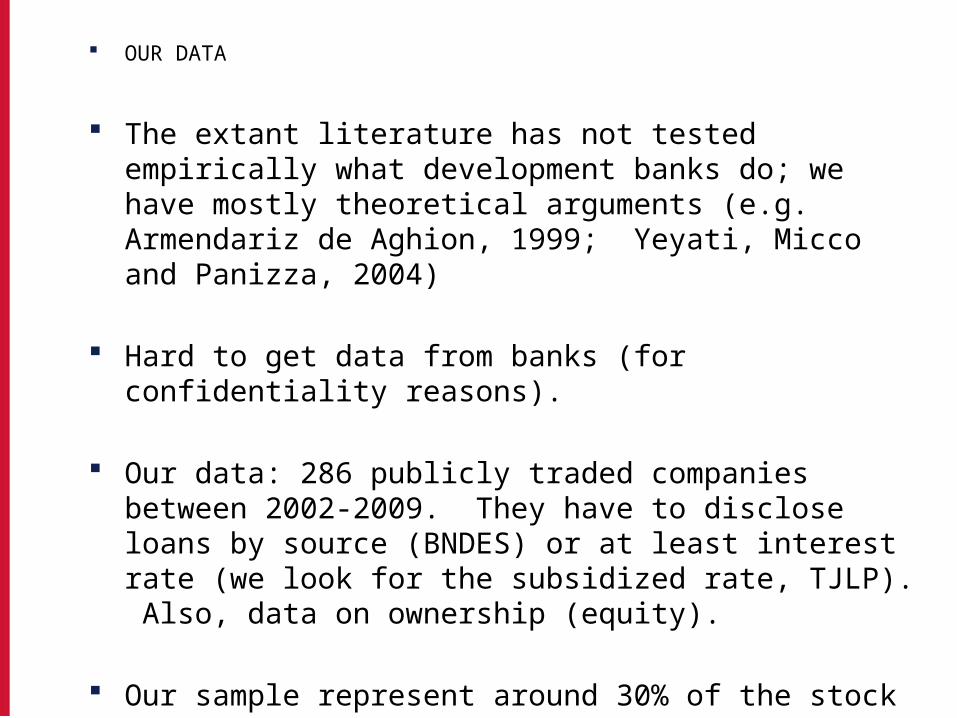
OUR DATA
The extant literature has not tested empirically what development banks do; we have mostly theoretical arguments (e.g. Armendariz de Aghion, 1999; Yeyati, Micco and Panizza, 2004)
Hard to get data from banks (for confidentiality reasons).
Our data: 286 publicly traded companies between 2002-2009. They have to disclose loans by source (BNDES) or at least interest rate (we look for the subsidized rate, TJLP). Also, data on ownership (equity).
Our sample represent around 30% of the stock of outstanding loans and 70% of the stock of equity stakes (2009).
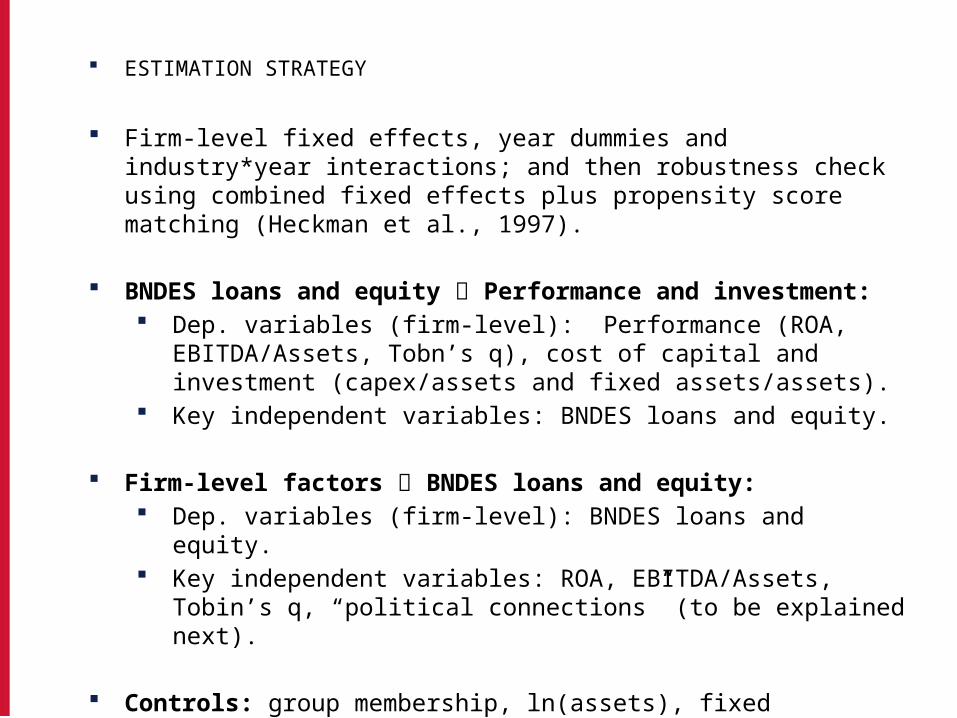
ESTIMATION STRATEGY
Firm-level fixed effects, year dummies and industry*year interactions; and then robustness check using combined fixed effects plus propensity score matching (Heckman et al., 1997).
BNDES loans and equity Performance and investment: Dep. variables (firm-level): Performance (ROA, EBITDA/Assets,
Tobn’s q), cost of capital and investment (capex/assets and fixed assets/assets).
Key independent variables: BNDES loans and equity.
Firm-level factors BNDES loans and equity: Dep. variables (firm-level): BNDES loans and equity. Key independent variables: ROA, EBITDA/Assets, Tobin’s q, “political
connections” (to be explained next).
Controls: group membership, ln(assets), fixed assets/assets (except when it is a dep. variable), leverage (debt/assets), foreign ownership
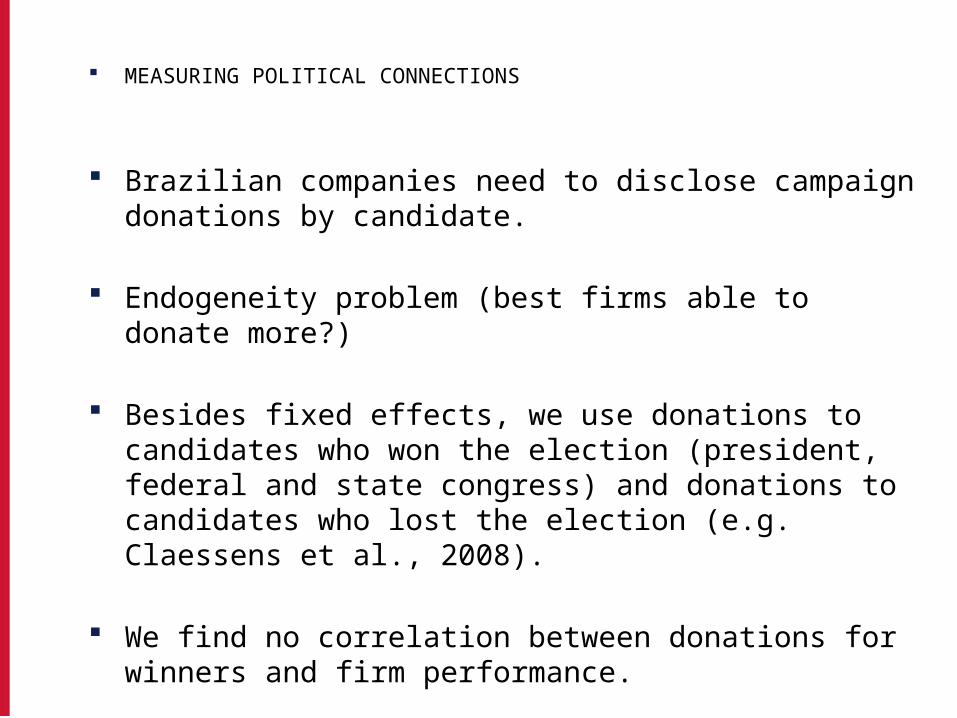
MEASURING POLITICAL CONNECTIONS
Brazilian companies need to disclose campaign donations by candidate.
Endogeneity problem (best firms able to donate more?)
Besides fixed effects, we use donations to candidates who won the election (president, federal and state congress) and donations to candidates who lost the election (e.g. Claessens et al., 2008).
We find no correlation between donations for winners and firm performance.
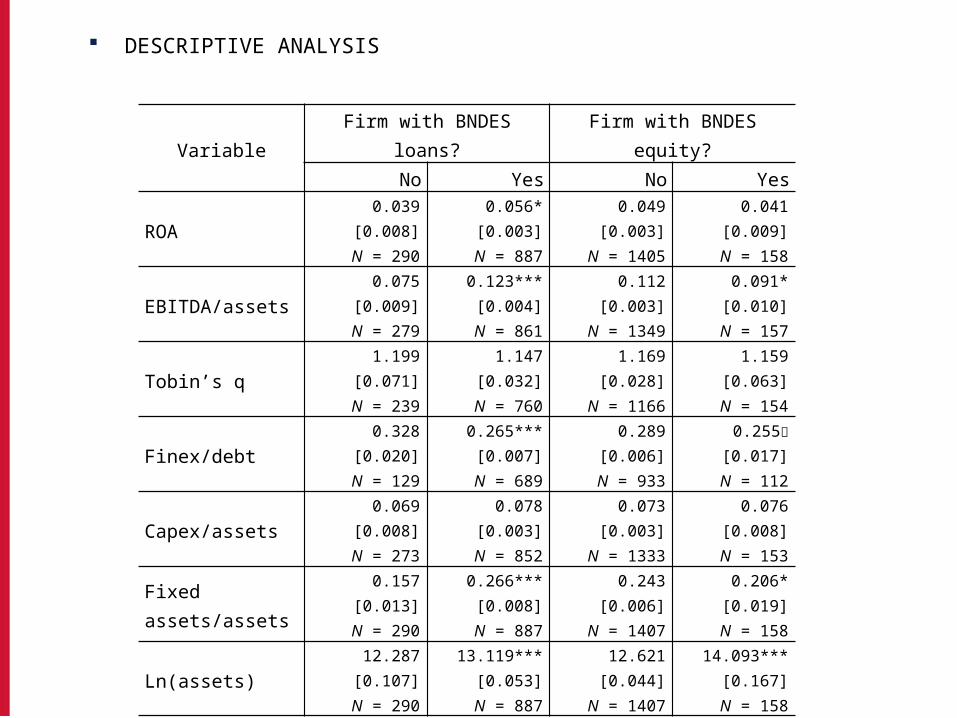
DESCRIPTIVE ANALYSIS
VariableFirm with BNDES loans? Firm with BNDES equity?
No Yes No Yes
ROA
0.039[0.008]
N = 290
0.056* [0.003]N = 887
0.049 [0.003]
N = 1405
0.041 [0.009]N = 158
EBITDA/assets
0.075[0.009]
N = 279
0.123*** [0.004]N = 861
0.112 [0.003]
N = 1349
0.091* [0.010]N = 157
Tobin’s q
1.199[0.071]
N = 239
1.147 [0.032]N = 760
1.169 [0.028]
N = 1166
1.159 [0.063]N = 154
Finex/debt
0.328[0.020]
N = 129
0.265***[0.007]
N = 689
0.289 [0.006]N = 933
0.255
[0.017]N = 112
Capex/assets
0.069[0.008]
N = 273
0.078 [0.003]N = 852
0.073 [0.003]
N = 1333
0.076 [0.008]N = 153
Fixed assets/assets
0.157[0.013]
N = 290
0.266*** [0.008]N = 887
0.243 [0.006]
N = 1407
0.206* [0.019]N = 158
Ln(assets)
12.287[0.107]
N = 290
13.119*** [0.053]N = 887
12.621 [0.044]
N = 1407
14.093*** [0.167]N = 158
p < 0.10 * p < 0.05 ** p < 0.01 *** p < 0.001 (two-tailed mean comparison tests). Standard errors in brackets.

EFFECT ON PERFORMANCE
ROA EBITDA/assets Tobin’s qLn(BNDES loans)t
0.000 -0.002 0.001 -0.003 -0.010 -0.009
[0.002] [0.002] [0.002] [0.003] [0.011] [0.008]
Ln(BNDES loans)t-10.001 0.002 -0.01
[0.003] [0.003] [0.015]
Ln(BNDES loans)t-2-0.001 -0.004 -0.03
[0.003] [0.004] [0.021]
Ln(BNDES equity)t0.001 -0.002 0.000 -0.004 -0.006 0.000
[0.002] [0.002] [0.003] [0.003] [0.008] [0.006]
Ln(BNDES equity)t-1-0.001 0.001 -0.024
[0.004] [0.004] [0.016]
Ln(BNDES equity)t-20.004 0.003 0.030
[0.005] [0.005] [0.019]
%BNDES loanst0.020 0.018 0.031 0.025 0.033 0.085
[0.022] [0.026] [0.021] [0.031] [0.177] [0.173]
%BNDES loanst-10.038 0.028 -0.078
[0.029] [0.036] [0.127]
%BNDES loanst-2-0.011 -0.012 -0.074
[0.027] [0.029] [0.173]
%BNDES equityt0.030 -0.092 0.006 -0.156 -0.652 0.692
[0.181] [0.151] [0.200] [0.186] [0.476] [1.084]
%BNDES equityt-1-0.07 0.069 -1.529
[0.272] [0.258] [0.982]
%BNDES equityt-20.315 0.191 2.561
[0.367] [0.383] [1.955]

EFFECT ON COST OF CAPITAL AND INVESTMENT
Finex/debt Capex/assets Fixed assets/assets
Ln(BNDES loans)t -0.006* -0.013* 0.002 0.004* -0.004 -0.002
[0.003] [0.005] [0.001] [0.002] [0.003] [0.005]
Ln(BNDES loans)t-1 0.005 -0.001 0.000
[0.006] [0.002] [0.002]
Ln(BNDES loans)t-2 -0.001 -0.004 -0.004
[0.006] [0.002] [0.003]
Ln(BNDES equity)t -0.001 0.001 -0.002 -0.003 0.000 0.001
[0.004] [0.006] [0.002] [0.003] [0.003] [0.002]
Ln(BNDES equity)t-1 -0.014 0.001 0.003
[0.009] [0.002] [0.002]
Ln(BNDES equity)t-2 0.003 -0.001 -0.001
[0.007] [0.002] [0.004]
%BNDES loanst 0.005 0.101 -0.032 0.000 0.013 -0.041
[0.050] [0.065] [0.017] [0.021] [0.028] [0.024]
%BNDES loanst-1 -0.124** -0.007 -0.011 0.182
[0.047] [0.024] [0.169] [0.207]
%BNDES loanst-2 0.093 -0.063 -0.018
[0.069] [0.061] [0.031]
%BNDES equityt -0.099 0.277 -0.045 -0.135 -0.002
[0.306] [0.352] [0.147] [0.284] [0.045]
%BNDES equityt-1 -2.100*** -0.003 0.109
[0.496] [0.120] [0.133]
%BNDES equityt-2 -0.171 -0.135 -0.048
Thus, marginal dollar from BNDES reduces financial expenditures to debt by around 4-12 p.p.
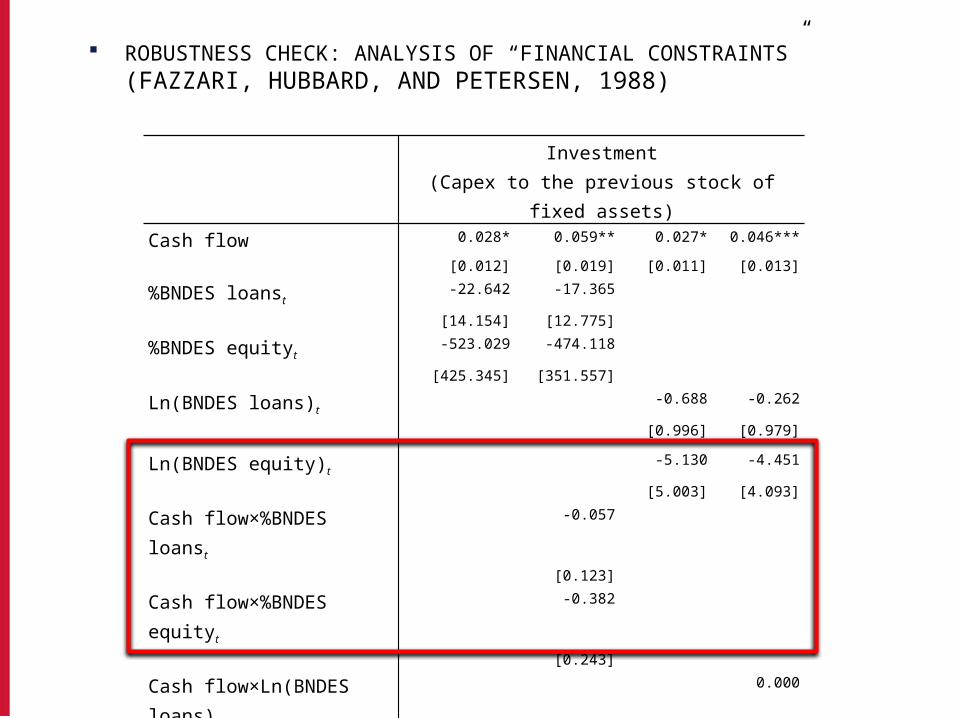
ROBUSTNESS CHECK: ANALYSIS OF “FINANCIAL CONSTRAINTS” (FAZZARI, HUBBARD, AND PETERSEN, 1988)
Investment(Capex to the previous stock of fixed assets)
Cash flow 0.028* 0.059** 0.027* 0.046***
[0.012] [0.019] [0.011] [0.013]
%BNDES loanst-22.642 -17.365
[14.154] [12.775]
%BNDES equityt-523.029 -474.118
[425.345] [351.557]
Ln(BNDES loans)t-0.688 -0.262
[0.996] [0.979]
Ln(BNDES equity)t-5.130 -4.451
[5.003] [4.093]
Cash flow×%BNDES loanst-0.057
[0.123]
Cash flow×%BNDES equityt-0.382
[0.243]
Cash flow×Ln(BNDES loans)t0.000
[0.003]
Cash flow×Ln(BNDES equity)t-0.008
[0.006]
Tobin’s q 10.631 5.419 10.727 6.493
[13.280] [11.355] [12.283] [10.651]
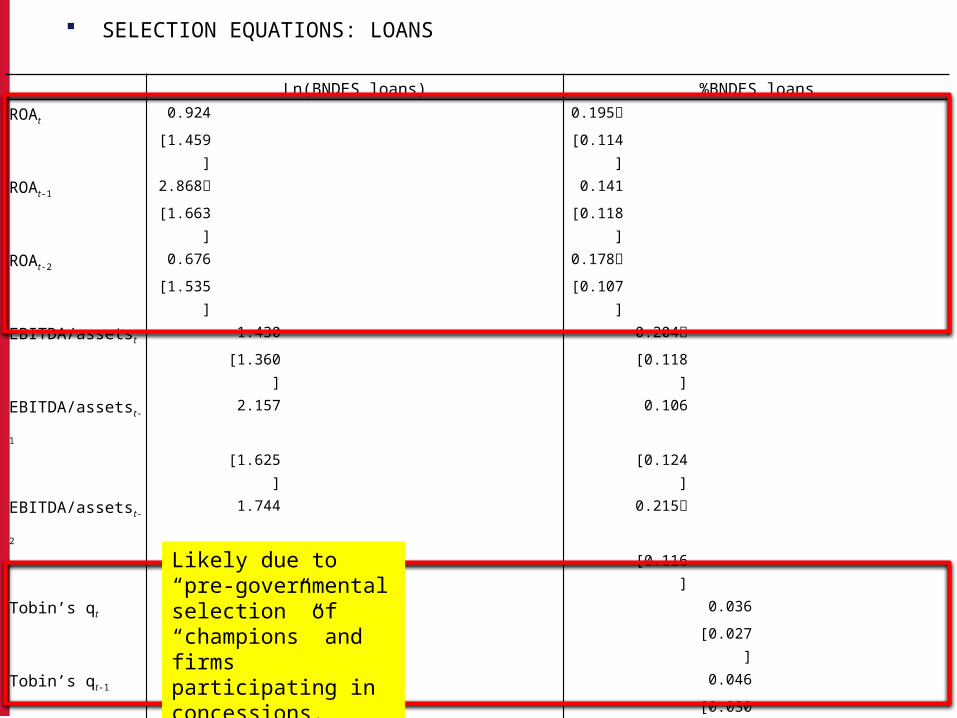
SELECTION EQUATIONS: LOANS
Ln(BNDES loans) %BNDES loansROAt
0.924 0.195
[1.459] [0.114]
ROAt-12.868 0.141
[1.663] [0.118]
ROAt-20.676 0.178
[1.535] [0.107]
EBITDA/assetst1.430 0.204
[1.360] [0.118]
EBITDA/assetst-12.157 0.106
[1.625] [0.124]
EBITDA/assetst-21.744 0.215
[1.757] [0.116]
Tobin’s qt0.134 0.036
[0.270] [0.027]
Tobin’s qt-10.244 0.046
[0.210] [0.030]
Tobin’s qt-20.321 -0.021
[0.331] [0.027]
Donations 0.000 0.000
[0.008] [0.001]
Donations for 0.170** 0.015**
winners [0.062] [0.005]
Donations for -0.147** -0.013**
losers [0.049] [0.004]
Donations for 0.146** 0.013**
winners - losers [0.051] [0.004]
Likely due to “pre-governmental selection” of “champions” and firms participating in concessions.

SELECTION EQUATIONS: EQUITY
Ln(BNDES equity) %BNDES equityROAt
-0.497 0.005
[0.788] [0.011]
ROAt-1-0.615 0.004
[1.005] [0.015]
ROAt-20.089 -0.010
[1.286] [0.013]
EBITDA/assetst0.281 0.009
[0.902] [0.011]
EBITDA/assetst-1-1.024 -0.002
[1.321] [0.018]
EBITDA/assetst-20.197 -0.020
[1.470] [0.017]
Tobin’s qt-0.200 -0.001
[0.155] [0.002]
Tobin’s qt-1-0.252 -0.003
[0.172] [0.002]
Tobin’s qt-2-0.289 -0.007
[0.182] [0.004]
Donations -0.021 -0.001
[0.036] [0.000]
Donations for 0.042 0.000
winners [0.075] [0.001]
Donations for -0.079 -0.001
losers [0.070] [0.001]
Donations for 0.069 0.001
winners - losers [0.069] [0.001]

BNDES LOANS AND EQUITY INVESTMENTS
BNDES loans BNDES equity investments
YearFirms in sample
Number of firms
% firms with
BNDES loans
BNDES loans to
total debt (%)
Number of firms
% firms with
BNDES equity
Avg. BNDES equity share (%)
2002 218 115 52.8 25.2 13 6.0 17.02003 196 109 55.6 30.1 12 6.1 17.62004 179 102 57.0 31.7 12 6.7 14.42005 170 96 56.5 31.1 17 10.0 15.42006 176 95 54.0 31.4 20 11.4 13.02007 203 114 56.2 31.8 25 12.3 12.32008 208 128 61.5 28.7 28 13.5 13.32009 215 128 59.5 32.9 31 14.4 13.2
Median 112 56.3 31.2 19 10.7 13.9


TOP BORROWERS (IN US$ BILLIONS)
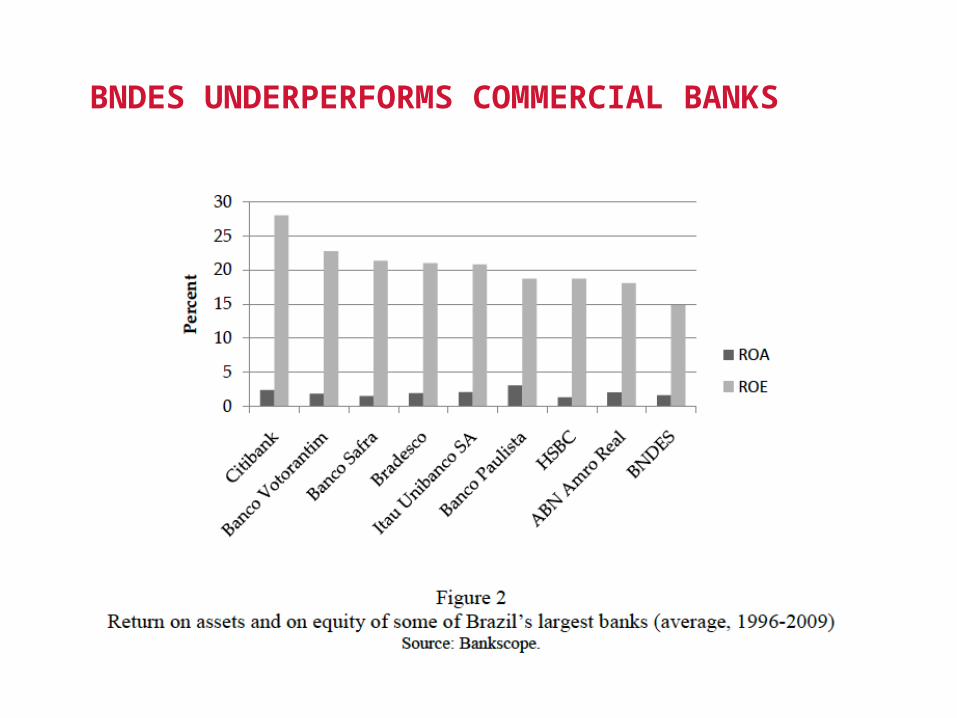
BNDES UNDERPERFORMS COMMERCIAL BANKS
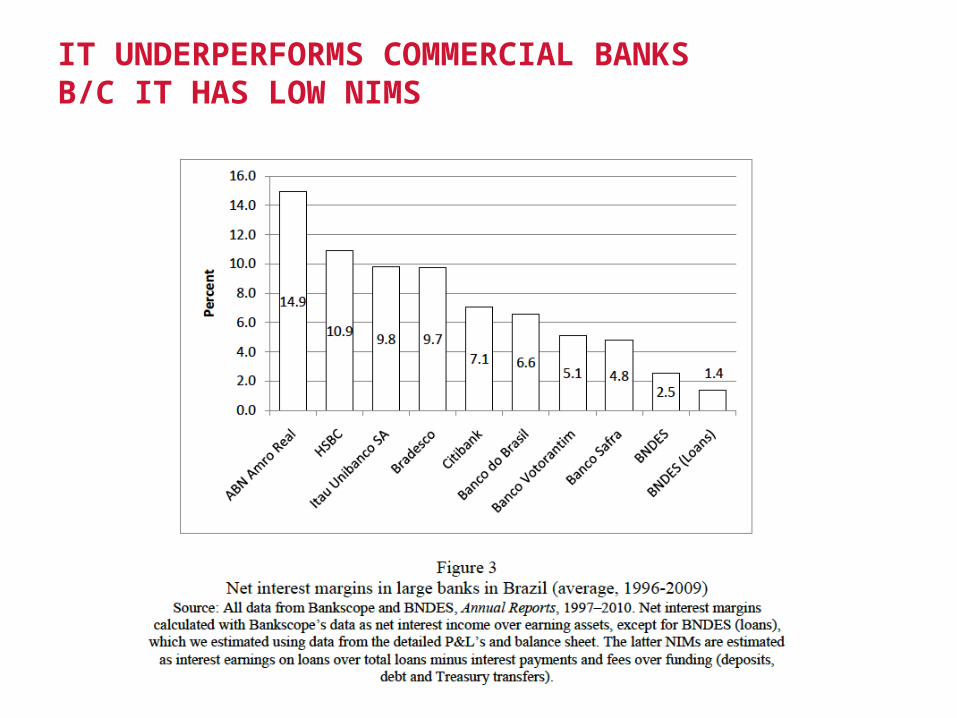
IT UNDERPERFORMS COMMERCIAL BANKS B/C IT HAS LOW NIMS

COST OF CAPITAL IS LOWER THAN COST OF CAPITAL FOR THE GOVERNMENT
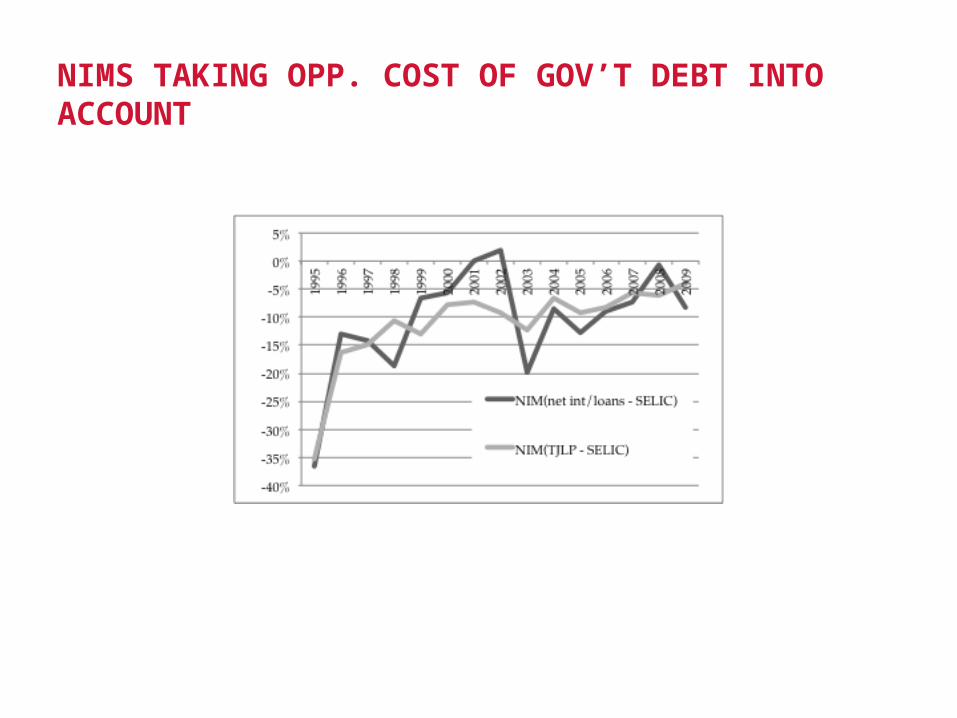
NIMS TAKING OPP. COST OF GOV’T DEBT INTO ACCOUNT

THE RISE OF LEVIATHAN AS A MAJORITY INVESTOR
Under the Leviathan as a majority investor model:– Large state-owned enterprises are listed in stock exchanges.– They bring in active investors as monitors (pension and
mutual funds).– They also have professional management or at least higher-
powered incentives (pay-for-performance) compared to traditional SOEs.
– Improved corporate governance (external board members, more separation between ownership and control).
– Financial transparency (audited financials reported quarterly/semi-annually). Large flagship SOEs now choose BIG 4 auditing firms.
• Not all SOEs evolved into this model...
Leviathan as a minority investor
Governments now have a large proportion of their investment in firms through minority positions (w/ or w/o golden shares)
This “model” of state capitalism is not well understood! Gov’t outsourcing management and monitoring of managers
to private parties In the book and in a paper in Academy of Management
Journal we show that minority equity investments by the government can help firms overcome capital market failure, when financial markets are shallow. We use data from Brazil (1995-2009) to show this (OLS).