BMW GROUP M AUTOMOBILES ARE THE VERY SPORTY AND DYNAMIC END OF OUR MODEL RANGE. PRODUCTS BMW Group...
40
June 2016 BMW GROUP INVESTOR PRESENTATION
Transcript of BMW GROUP M AUTOMOBILES ARE THE VERY SPORTY AND DYNAMIC END OF OUR MODEL RANGE. PRODUCTS BMW Group...

June 2016
BMW GROUPINVESTOR PRESENTATION

STRATEGY NUMBER ONE > NEXT
BMW Group Investor Presentation, June 2016 Page 2

Premium brand strategy2001/
2003
Strategy Number ONE 2007
FORWARD-LOOKING STRATEGIES LEADING TO A SUCCESSFUL CORPORATE DEVELOPMENT SINCE 2001.
2016
BMW Group Investor Presentation, June 2016 Page 3

STRATEGIC APPROACH
> Brands & Design
We are leading the BMW Group into a new era:
We leverage innovative technologies, digitalization
and sustainability to deliver unique customer experiences.
> Products
> Technologies
> Customer Experience & Services
> Digitalization
> Profitability
VISION
We are Number ONE.
We inspire people on the move:
We shape tomorrow‘s individual
premium mobility.COMPETITIVE
ADVANTAGE
We unite excitement, responsibility and
success: We have the most emotional
products and attractive
services.
CORPORATE CULTURE
We create the future:
We combine operational
excellence and fresh
thinking.
BMW Group Investor Presentation, June 2016 Page 4

LEADERSHIP DRIVEN BY ASPIRATIONAL BRAND PORTFOLIO AND HIGHLY EMOTIONAL PRODUCTS. BRANDS & DESIGN
Design
BMW Group Investor Presentation, June 2016
Premium Brands
Luxury
Dynamic Efficient
Compact/Small
Now
Target group
Page 5

ATTRACTIVE PREMIUM BRANDS PROVIDE THE BASISFOR A FURTHER EXPANSION OF THE PRODUCT PORTFOLIO. BRANDS & DESIGN
BMW Group Investor Presentation, June 2016 Page 6

SIXTH GENERATION OF BMW 7 SERIES:THE NEW BENCHMARK IN THE LUXURY SEGMENT. PRODUCTS
Page 7

BMW Group Investor Presentation, June 2016 Page 8
KEEPING THE LEAD – FURTHER EXPANSION OF THE X-PORTFOLIO PLANNED UNTIL 2020. PRODUCTS
BMW X1
BMW X5
BMW X3
BMW X6
BMW X4
BMW X7

BMW M AUTOMOBILES ARE THE VERY SPORTY AND DYNAMIC END OF OUR MODEL RANGE. PRODUCTS
BMW Group Investor Presentation, June 2016
BRAND SHAPER BMW M4 GTS
BMW M235i Coupé
BMW M2 Coupé
BMW 228i Coupé
AN EXAMPLE:
M AUTOMOBILES
M PERFORMANCE
AUTOMOBILES
TOP MODEL
CORE BRAND
Page 9
CORE BRAND MODEL
WITH M SPORT PACKAGE
BMW 420i Coupé with
M sport package

iPERFORMANCE AND BMW i –BALANCING THE PRODUCT PORTFOLIO . PRODUCTS
BMW Group Investor Presentation, June 2016
DYNAMIC EFFICIENT
M Core Models
High
Performance
M Performance
Performance
Champions
Core Models PHEVs
Electrified
Efficiency
Champions
BEVs
Visionary
Mobility
The interplay of BMW M and BMW i enhances competitive differentiation
(representation of the scope of the BMW brand).
BMW brand framework for product portfolio
Page 10

SEVEN ELECTRIFIED BMW MODELS:FURTHER MODELS TO COME. PRODUCTS
BMW X5 xDrive40eiPerformance
BMW 740eiPerformance
BMW 225xeiPerformance
BMW 330eiPerformance
BMW i3 BMW i8
BMW 530Le
BMW Group Investor Presentation, June 2016 Page 11
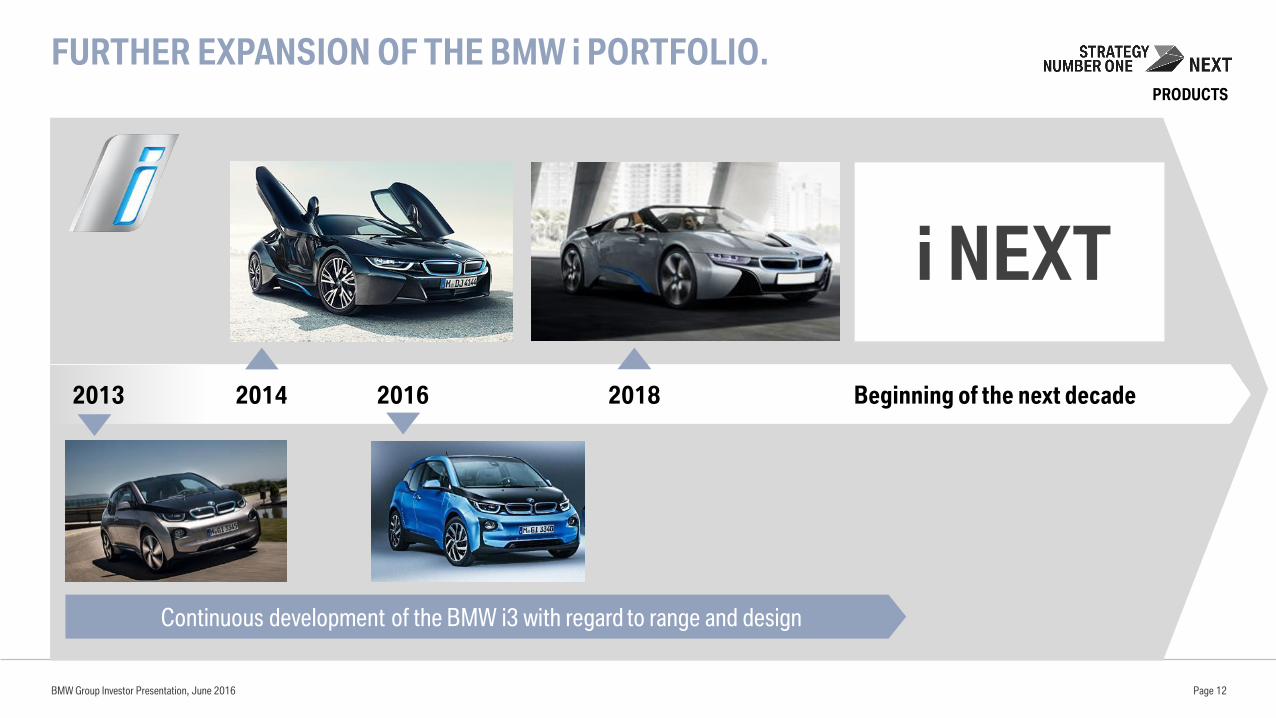
FURTHER EXPANSION OF THE BMW i PORTFOLIO.PRODUCTS
2018 Beginning of the next decade20142013
Continuous development of the BMW i3 with regard to range and design
2016
BMW Group Investor Presentation, June 2016 Page 12
i NEXT

PROJECT i 2.0:THE BMW i NEXT IS THE FUTURE OF MOBILITY.
Artificial Intelligence
Interior of the future
Highly automated driving
Autonomous
driving
Electrification
Lightweight
construction
New sportiness
Purpose-built
Sustainability
Connectivity
BMW Group Investor Presentation, June 2016 Page 13
TECHNOLOGIES
BMW i NEXT

ENSURING OUR POSITION AS TECHNOLOGY LEADER.
Technology and innovation leader
EfficientDynamics
NEXTHydrogen
Artificial Intelligence
Autonomous driving
Connectivity
TECHNOLOGIES
Future focus:Powertrain technologies
Future focus:Digitalization
BMW Group Investor Presentation, June 2016 Page 14

THE NEXT STEPS ARE HIGHLY AND FULLY AUTONOMOUS DRIVING.
BMW Group Investor Presentation, June 2016
TECHNOLOGIES
Take over request(“Eyes-off”)
3 – High-Automation 4 – Full-Automation
General awareness
No take over request(“Mind-off”)
5 – Autonomous
No driver
0 – Driver Only
No active
assistance system
1 – Assistance
Early
warning systems
such as cruise
control/ speed
assistant
(“Feet-off”)
2 – Semi-Automation
Traffic control
(e.g. congestion
assistant)
(“Hands-off”)
Awareness for
take over
Human MachineTransition of responsibility
TODAY
Page 15

MASTERING THE BASIC TECHNOLOGIES IS THE FIRST STEP FOR HIGHLY AUTOMATED DRIVING.
Intelligent
autonomous vehicle
Regulatory
requirements
Sensor systems Artificial Intelligence
Digital maps / HERE Digital reality model
BMW Group Investor Presentation, June 2016 Page 16
TECHNOLOGIES

LEVERAGING POTENTIAL OF DIGITALIZATION ANDCONNECTIVITY. CUSTOMER EXPERIENCE & SERVICES
BMW Connected
Mobility Cloud
BMW Group Investor Presentation, June 2016 Page 17

INTELLIGENT AND INNOVATIVE PRODUCTION -DIGITIZATION CREATES NEW POTENTIAL.
BMW Group Investor Presentation, June 2016
DIGITALIZATION
Laminate or Metal
Serial Production
and Rapid Prototyping
New Individualization
Internet-of-Things
Architecture
Data Management for Planning
and Control
Cyber Security
Autonomous Transport Systems
Global Supply Chain
Visibility and Control
Integrated Supplier Networks
Collaborative Robot Systems
Context-sensitive Worker
Support Systems
Reorganization of Work
46
810
1214
1618
0
2
4
6
8
10
12
14
16
125
130
135
1404
68
1012
1416
18
0
2
4
6
8
10
12
14
16
125
130
135
140
Data and Analytics Smart Logistics Innovative Automation Additive Manufacturing
Page 18
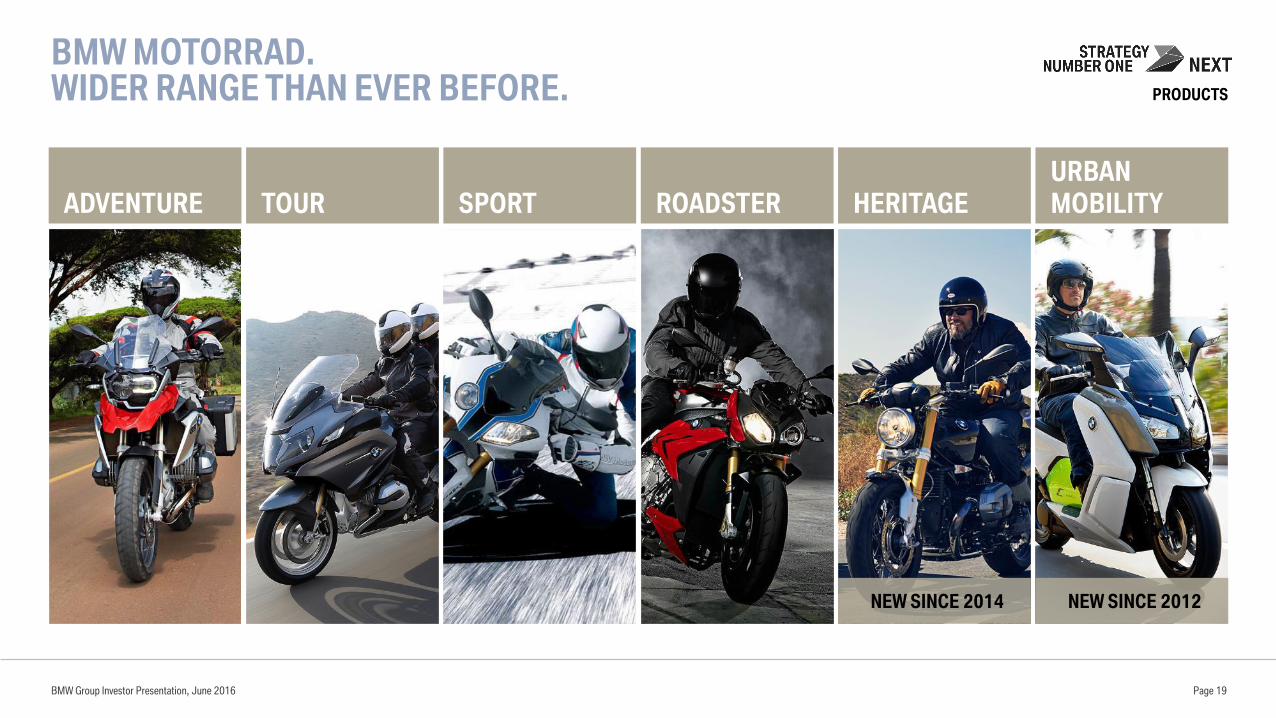
BMW MOTORRAD.WIDER RANGE THAN EVER BEFORE.
BMW Group Investor Presentation, June 2016
ADVENTURE TOUR SPORT ROADSTER HERITAGE
URBAN
MOBILITY
Page 19
NEW SINCE 2014 NEW SINCE 2012
PRODUCTS

MAINTAINING THE AUTOMOTIVE EBIT MARGIN IN THE CORRIDOR OF 8-10% DESPITE ONGOING CHALLENGES. PROFITABILITY
8 %
10 %
Ongoing efficiency
measures to compensate
the cost burden
Future costs Volatility
Market and
competitive
environment
Regulatory
requirements
Expansion & optimization
product portfolio
Reduction of
material costs
New technologies/
equipment options
Retail sales growth
Autos and Motorcycles
Benefits from
digitalizationEfficiency
measuresBMW Group Investor Presentation, June 2016 Page 20

FINANCIAL TARGETS 2020: SUSTAINABLE GROWTH AND SOLID PROFITABILITY DESPITE CHALLENGES. PROFITABILITY
BMW Group Investor Presentation, June 2016
BMW Group
EBT margin (from 2017)
Investment ratio*
Research and development ratio
Payout ratio
Automotive Segment
EBIT margin
Free Cashflow
Motorcycles Segment
Sales volume
EBIT margin (from 2017)
Financial Services Segment
Return on Equity
* Investments in property, plant and equipment and other intangible assets (without capitalized development costs).
Page 21
2015
10.0%
4.2%
5.6%
32.9%
9.2%
5.4 bn €
136,963 units
9.1%
20.2%
2020
>10%
<5.0%
5.0 - 5.5%
30 - 40%
8 -10%
>3 bn €
> 200,000 units
8 -10%
>18%

BMW GROUP
BUSINESS UPDATE
BMW Group Investor Presentation, June 2016 Page 22

SOLID START INTO THE NEW BUSINESS YEAR.BMW GROUP SALES FIGURES YTD MAY 2016.
935,288 + 5.0%
797,457 + 5.0%
136,617 + 5.2%
1,214 - 14.4%
65,761 +4.5%
BMW Group Investor Presentation, June 2016 Page 23

Americas
180,099 units
Europe
432,545 units
+10.3%
Mainland China
202,344 units
Asia (w/o) China
& Rest of World
120,300 units
-7.9%
19% 46%
+6.3%
22% 13%
+6.6%
BMW GROUP AUTOMOTIVE: BALANCED SALES DISTRIBUTION AND SOLID YTD MAY 2016 GROWTH OF +5.0%.
BMW Group Investor Presentation, June 2016 Rolls Royce is included in “Rest of World”, YTD May 2016 (figures may not add to 100% due to rounding) Page 24
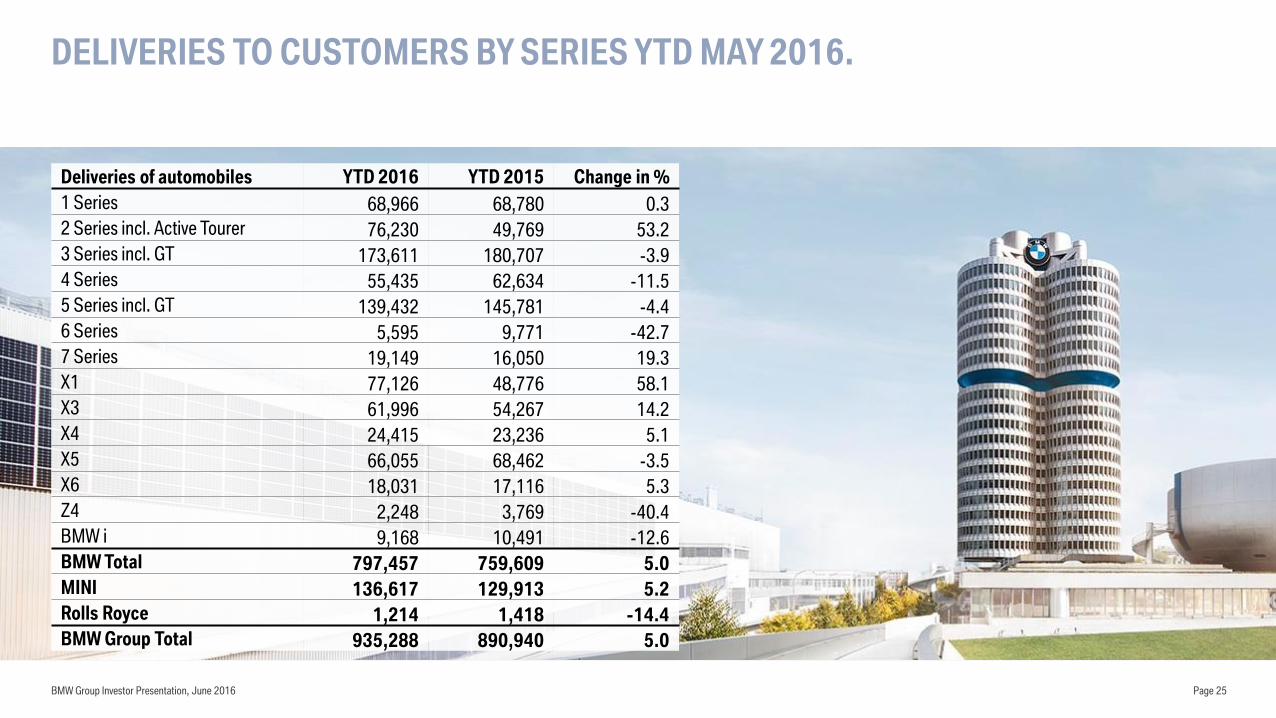
DELIVERIES TO CUSTOMERS BY SERIES YTD MAY 2016.
BMW Group Investor Presentation, June 2016 Page 25
Deliveries of automobiles YTD 2016 YTD 2015 Change in %
1 Series 68,966 68,780 0.3
2 Series incl. Active Tourer 76,230 49,769 53.2
3 Series incl. GT 173,611 180,707 -3.9
4 Series 55,435 62,634 -11.5
5 Series incl. GT 139,432 145,781 -4.4
6 Series 5,595 9,771 -42.7
7 Series 19,149 16,050 19.3
X1 77,126 48,776 58.1
X3 61,996 54,267 14.2
X4 24,415 23,236 5.1
X5 66,055 68,462 -3.5
X6 18,031 17,116 5.3
Z4 2,248 3,769 -40.4
BMW i 9,168 10,491 -12.6
BMW Total 797,457 759,609 5.0
MINI 136,617 129,913 5.2
Rolls Royce 1,214 1,418 -14.4
BMW Group Total 935,288 890,940 5.0

BMW GROUP AUTOMOTIVE MAJOR MARKETS. DELIVERIES TO CUSTOMERS YTD MAY 2016.
BMW Group Investor Presentation, June 2016 Page 26
Deliveries of automobiles YTD 2016 YTD 2015 Change in %
Europe 432,545 392,185 10.3
thereof Germany 1) 125,290 116,295 7.7
Great Britain 92,837 85,167 9.0
France 35,002 31,179 12.3
Italy 33,584 29,407 14.2
Americas 180,099 195,485 -7.9
thereof USA 144,811 160,533 -9.8
Asia 293,188 276,055 6.2
thereof China Mainland 202,344 190,427 6.3
thereof BBA retail sales 127,640 118,466 7.7
Japan 28,200 26,508 6.4
Rest of the World 2) 29,456 27,215 8.2
Total 935,288 890,940 5.0
1) Registrations 2) Rolls-Royce sales are included in “Rest of the World”

BMW AND MINI RETAIL DEVELOPMENT IN MAINLAND CHINA YTD MAY 2016.
BMW Group Investor Presentation, June 2016 Page 27
62% 59% 53% 48% 32% 61%41% 43%
Share of JV Sales
51% 61%
13.8 21.0 30.7 46.8
115.3138.2
185.3 192.2 180.1 181.7
72.0 74.722.6
30.635.2
43.7
53.7
94.4
141.2
198.5
275.9 282.0
118.5 127.6
2006 2007 2008 2009 2010 2011 2012 2013 2014 2015 YTD 2015 YTD 2016
Import JV Sales
36.451.6
65.890.5
169.0
232.6
326.4
in ‘000 units
390.7
456.0 463.7
+41.8 %
+27.5 %+37.5 %
+86.7 %
+37.6 %
+40.3 %
+19.7 %
+16.7 %+1.7%
202.3
62%
Source: BMW Group Retail data, YTD May 2016
63%
190.4
+6.3%

25.8
21.0
11.9
10.19.3 9.0 8.6 8.5 7.4
4.6
2.41.2
0
5
10
15
20
25
30
Germany UnitedKingdom
Italy USA Turkey France S. Korea Russia China Japan Brazil India
PREMIUM SEGMENT SHARE OF TOTAL MARKET 2015.
BMW Group Investor Presentation, June 2016 Page 28
in %
World Average: 8.9%
Source: Global Insight 12/2015

0
1,000
2,000
3,000
4,000
5,000
6,000
7,000
8,000
9,000
10,000
2015 2016 2017 2018 2019 2020
*BRIKT refers to Brazil, Russia, India, South Korea and Turkey Source: Global Insight 04/2016
GLOBAL ANNUAL PREMIUM SEGMENT SALES ARE EXPECTED TO GROW TO 9.0 MN UNITS BY 2020.
BMW Group Investor Presentation, June 2016 Page 29
China, CAGR +5.5%
Japan, CAGR +0.4%
North America, CAGR +2.3%
Western Europe, CAGR +1.3%
Rest of World, CAGR +4.6%
BRIKT*, CAGR +5.2%
Region (‘000 units) 2015 2020 Chg.
World 7,749 9,012 16%
Res t of World 605 759 25%
BRIKT* 475 612 29%
China (Mainland) 1,793 2,345 31%
Japan 225 229 2%
North America 1,944 2,173 12%
Wes tern Europe 2,707 2,894 7%

BMW GROUP – Q1-2016: GOOD START IN THE FIRST THREE MONTHS OF 2016, WITH A RECORD FIRST-QUARTER SALES VOLUME PERFORMANCE.
BMW Group Investor Presentation, June 2016 Page 30
BMW Group Q1-2016 Q1-2015 Change in %
Earnings before tax – Group (in m€) 2,368 2,269 +4.4
EBT margin (in %) – Group 11.4 10.8 -
Automotive Segment
Automotive sales (units) 557,605 526,669 +5.9
Earnings before interest and tax (EBIT) (in m€) 1,763 1,794 -1.7
EBIT margin (in %) 9.4 9.5 -
Net financial assets (m€) 17,511 15,037 +16.5
Motorcycles Segment
Sales (units) 33,788 31,370 +7.7
Earnings before interest and tax (EBIT) (in m€) 94 115 -18.3
EBIT margin (in %) 16.2 20.3 -
Financial Services
Earnings before tax (EBT) (in m€) 570 559 +2.0
Penetration rate (in %) 46.1 44.9 -
Credit loss ratio (in %) 0.29 0.33 -

EBIT MARGIN DEVELOPMENT AUTOMOTIVE SEGMENT.TARGET PROFITABILITY OF 8-10%.
BMW Group Investor Presentation, June 2016
EBIT margin development automotive segment
[in %]
Page 31
Target corridor:
8-10 %
* 2013 figures have been adjusted in accordance with IAS 8.
6.4 6.4
1.4
-0.6
8.0
11.8
10.8
9.4 9.69.2 9.5 9.4
2006 2007 2008 2009 2010 2011 2012 2013* 2014 2015 Q1-2015Q1-2016

FREE CASH FLOW AUTOMOTIVE SEGMENT.TARGET OF >3BN EURO ANNUALLY.
BMW Group Investor Presentation, June 2016 Page 32
* Definition: Free cash flow corresponds to the cash inflow from operating activities of the Automobiles segment less the cash outflow for investing activities of the Automobiles segment adjusted for net investment in marketable securities and term deposits. 2009 – 2015 as reported, 2007 & 2008 calculated according to above definition from reported figures. No cash flow reporting on segment level in 2006.** 2009, 2011, 2013 figures have been adjusted in accordance with IAS 8.
2,277
197
1,456
4,471
3,166
3,809
3,003
3,481
5,404
1,060
532
2006 2007 2008 2009** 2010 2011** 2012 2013** 2014 2015 Q1-2015 Q1-2016
Target:
> 3 billion
n.a.
Free Cash Flow (Automotive)*
[in m€]
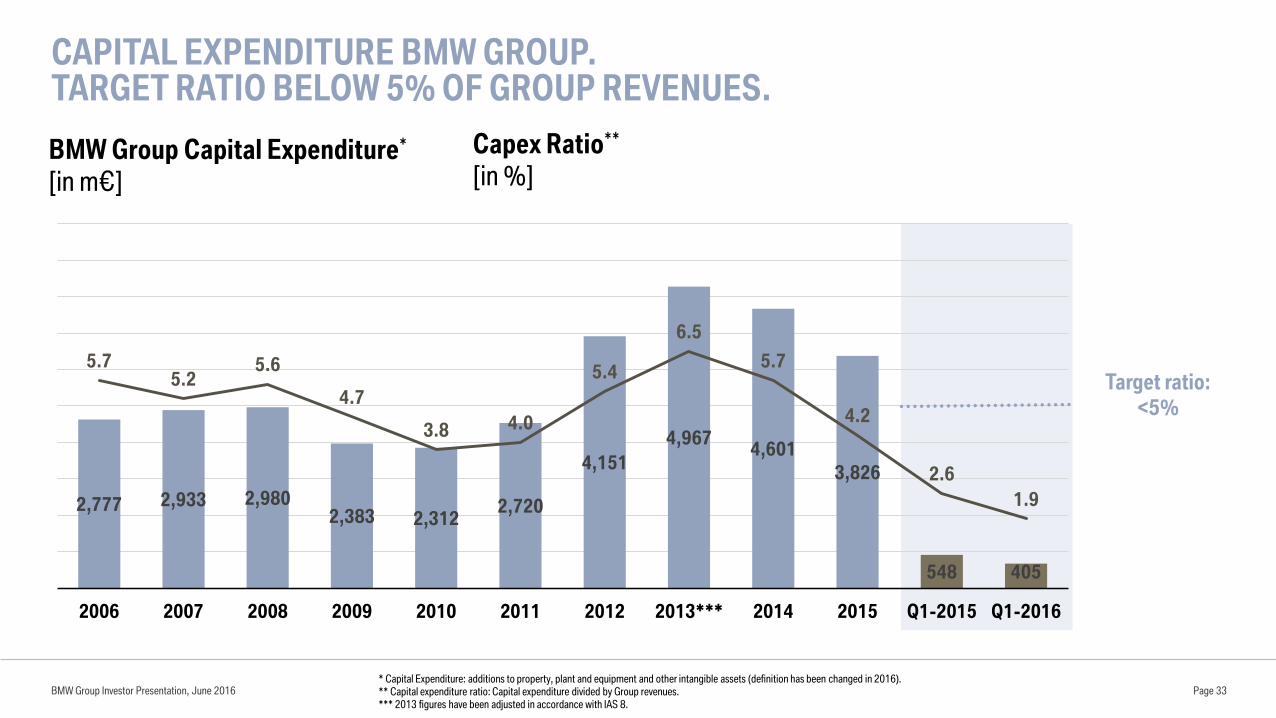
CAPITAL EXPENDITURE BMW GROUP.TARGET RATIO BELOW 5% OF GROUP REVENUES.
BMW Group Investor Presentation, June 2016
BMW Group Capital Expenditure*
[in m€]
Capex Ratio**
[in %]
* Capital Expenditure: additions to property, plant and equipment and other intangible assets (definition has been changed in 2016).** Capital expenditure ratio: Capital expenditure divided by Group revenues.*** 2013 figures have been adjusted in accordance with IAS 8.
Page 33
Target ratio:
<5%
2,777 2,933 2,9802,383 2,312
2,720
4,151
4,9674,601
3,826
548 405
5.75.2
5.6
4.7
3.8 4.0
5.4
6.5
5.7
4.2
2.6
1.9
0
1
2
3
4
5
6
7
8
9
10
0
1,000
2,000
3,000
4,000
5,000
6,000
2006 2007 2008 2009 2010 2011 2012 2013*** 2014 2015 Q1-2015 Q1-2016

OUTLOOK FOR 2016 –POSITIVE BUSINESS DEVELOPMENT EXPECTED DESPITE CHALLENGES.
BMW Group
Slight increase in EBT compared with previous year
Automotive Segment
Slight increase in deliveries and revenues compared with the previous year
EBIT margin in the target range of 8-10%
Financial Services Segment
Return on equity of at least 18%, on par with previous year
Motorcycles Segment
Slight increase in deliveries compared with the previous year
BMW Group Investor Presentation, June 2016 Page 34

BMW GROUP’S FINANCE STRATEGY COVERS THE ENTIRE AUTOMOTIVE VALUE CHAIN.
Page 35BMW Group Investor Presentation, June 2016
Research & Development Production Financial ServicesSales & Marketing
BMW GROUP CORPORATE FINANCE STRATEGY REFLECTS THE INDUSTRIAL NATURE OF THE BUSINESS
AND IS FOCUSED ON THE ENTIRE AUTOMOTIVE VALUE CHAIN.
Automotive value chain

DIVERSIFIED FUNDING MIX WITH A COMBINATION OF INDUSTRY AND BANK TYPICAL FINANCING INSTRUMENTS.
BMW Group Investor Presentation, June 2016 Page 36
CP
<1yr 1yr 2yrs 3yrs 4yrs 5yrs 7yrs 10yrs+
(EMTN) PPs Bonds
Customers deposits
Banks loans
FedFunds
BCD’s
Bank-typical
instruments
Industry-typical
instruments
ABS ABCP
*Adjusted, excluding currency and interest rate derivatives.
Funding Instruments Financial Debt as of 31.03.2016
Structured Financing3.1%
Bank Loans8.1%
SSD2.4%
Fed Funds0.5%
Brokered CD's5.7%
Customer Deposits BMW Bank
9.7%
ABS15.3%
CP6.2%
PP's12.7%
Public Bonds34.8%
Others1.6%
86.5 bn €*

BMW GROUP INVESTOR RELATIONS. CONTACTS.
BMW Group Investor Presentation, June 2016
Torsten Schüssler
Head of Investor Relations
Andreas Stöffler
Equity IR
Bernd Daser
Debt & Equity IR
Ziye Zhou
Debt & Equity IR
Patrick Neumayer
Debt & Equity IR USA
Tanja Seiler
Equity & SRI IR
http://www.bmwgroup.com/ir
IR Contact
BMW Group Investor Relations
Petuelring 130
80788 Munich
Page 37

BMW GROUP INVESTOR RELATIONS.FINANCIAL CALENDAR 2016 & 2017.
BMW Group Investor Presentation, June 2016
02.08.2016 Quarterly Report to June 2016
04.11.2016 Quarterly Report to September 2016
21.03.2017 Annual Accounts Press Conference 2017
22.03.2017 Analyst and Investor Conference 2017
04.05.2017 Quarterly Report to March 2017
11.05.2017 Annual General Meeting 2017
03.08.2017 Quarterly Report to June 2017
http://www.bmwgroup.com/ir
Page 38

BMW GROUP INVESTOR RELATIONS.ON THE ROAD H1 2016.
BMW Group Investor Presentation, June 2016
07.06.2016 J. P. Morgan European Automotive Conference London
08./09.06.2016 Unicredit Auto Credit Conference London
09.06.2016 db Access German, Swiss & Austrian Conference Berlin
13.-15.06.2016 J. P. Morgan Global China Summit Beijing
20.06.-25.06.2016 Roadshow Chicago, Toronto & Montreal
21.06.2016 DB ADAS Conference, London
22.06.2016 Roadshow Edinburgh
23.06.2016 Bank of America Merrill Lynch Future Mobility Conference, London
Page 39

DISCLAIMER.
BMW Group Investor Presentation, June 2016 Page 40
This document contains forward-looking statements that reflect BMW Group’s current views about future events. The words
“anticipate,” “assume,” “believe,” “estimate,” “expect,” “intend,” “may,” ”can,” “could,” “plan,” “project,” “should” and
similar expressions are used to identify forward-looking statements.
These statements are subject to many risks and uncertainties or may be affected by factors outside BMW Group’s control,
including adverse developments in global economic conditions resulting in a decline in demand in BMW Group’s key
markets, including China, North America and Europe; a deterioration in credit and financial markets; a shift in consumer
preferences affecting demand for BMW Group’s products; changes in the prices of fuel or raw materials; disruption of
production due to shortages of materials, labor strikes or supplier insolvencies; the effective implementation of BMW
Group’s strategic goals and targets; changes in laws, regulations and government policies, particularly those relating to
vehicle emissions, fuel economy and safety; and other risks and uncertainties, including those described under the heading
“Report on Risks and Opportunities” in BMW Group’s most recent Annual Report.
If any of these risks and uncertainties materializes or if the assumptions underlying any of BMW Group’s forward-looking
statements prove to be incorrect, actual results may be materially different from those BMW Group expresses or implies by
such statements. BMW Group does not intend or assume any obligation to update these forward-looking statements.