BMI STRATEGY CONSULTING UNIT cc ... · ©bmi-brscu the strategic forum outline of sensemaking...
46
© BMI-BRSCU © BMI-BRSCU Sense making Update: Year To Date 2014 (June 2014) Dr. Llewellyn B. Lewis THE STRATEGIC FORUM A place of assembly for strategic conversations THE STRATEGIC FORUM www.strategicforum.co.za BMI Studium Ad Prosperandum Voluntas in Conveniendum BUILDING RESEARCH STRATEGY CONSULTING UNIT cc Reg. No. 2002/105109/23 • BMI Studium Ad Prosperandum Voluntas in Conveniendum BUILDING RESEARCH STRATEGY CONSULTING UNIT cc • BMI • BMI • BMI • BMI Studium Ad Prosperandum Voluntas in Conveniendum BUILDING RESEARCH STRATEGY CONSULTING UNIT cc Reg. No. 2002/105109/23 • BMI Studium Ad Prosperandum Voluntas in Conveniendum BUILDING RESEARCH STRATEGY CONSULTING UNIT cc • BMI • BMI • BMI • BMI • BMI • BMI • 1
Transcript of BMI STRATEGY CONSULTING UNIT cc ... · ©bmi-brscu the strategic forum outline of sensemaking...

© BMI-BRSCU © BMI-BRSCU
Sense making Update:
Year To Date 2014 (June 2014) Dr. Llewellyn B. Lewis
THE STRATEGIC FORUM
A place of assembly
for strategic conversations
THE STRATEGIC FORUM www.strategicforum.co.za
BMI
Studium Ad Prosperandum
Voluntas in Conveniendum
BUILDING RESEARCH
STRATEGY CONSULTING
UNIT cc
Reg. No. 2002/105109/23
•BMI
Studium Ad Prosperandum
Voluntas in Conveniendum
BUILDING RESEARCH
STRATEGY CONSULTING
UNIT cc
•BMI
•BMI
•BMI
•BMI
Studium Ad Prosperandum
Voluntas in Conveniendum
BUILDING RESEARCH
STRATEGY CONSULTING
UNIT cc
Reg. No. 2002/105109/23
•BMI
Studium Ad Prosperandum
Voluntas in Conveniendum
BUILDING RESEARCH
STRATEGY CONSULTING
UNIT cc
•BMI
•BMI
•BMI
•BMI
•BMI
•BMI
•
1

© BMI-BRSCU © BMI-BRSCU
THE STRATEGIC FORUM www.strategicforum.co.za
OUTLINE OF SENSEMAKING UPDATE 1. BUILDING PLANS PASSED AND BUILDINGS COMPLETED 1993-2013
• Trend, Current Reality 2012 and Forecast 2013 for Res, Non Res and Total BPP in m2 and Value • Trend, Current Reality 2012 and Forecast 2013 for Res, Non Res and Total BC in m2 and Value • Summary YTD % Actual and Forecast BPP, BC, Cement Sales and Local Building Lumber Sales
2. NET BUILDING IN THE PIPELINE (NBIP) • NBIP Residential, Non Residential and Total Building • YTD Forecast BC 2013 vs Actual 2012 by Segment in Number, m2 and Value • BPP and BC by Province
3. INVESTMENT IN BUILDING AND CONSTRUCTION: 2012 4. CURRENT REALITY AND OUTLOOK FOR BUILDING AND CONSTRUCTION ACTIVITY BY SECTOR AND SEGMENT: 2013 - 2020
(CURRENT 2012 VALUE) 5. CURRENT REALITY OF INVESTMENT IN BUILDING & CONSTRUCTION: 2012 6. % CHANGE IN INVESTMENT IN BUILDING & CONSTRUCTION: 2011-2020 (R MILLION) (CONSTANT 2012 VALUES) 7. INVESTMENT IN BUILDING & CONSTRUCTION: 2013-2020 (R MILLION) (CONSTANT 2012 VALUES)
INVESTMENT IN BUILDING & CONSTRUCTION:
2013-2020 (R MILLION) (CONSTANT 2012 VALUES)
2

© BMI-BRSCU
TOTAL BUILDING PLANS PASSED (M2) ENDED 2013 AT + 9,73% COMPARED TO 2012.
THE INDUSTRY DASHBOARD: BUILDING PLANS PASSED: YTD ACTUAL AND FORECAST 2014 VS 2013
3
RES BUILDING PLANS PASSED (BPP): YTD* 2014 VS 2013
m2 % R*1000 %
Dwelling-house < 80 square metres 130 121 25.57% 595 869 37.57%
Dwelling-house => 80 square metres 80 220 3.22% 1 487 491 10.52%
Flats and townhouses 101 537 11.55% 1 405 288 26.59%
Other buildings -35 584 -23.84% -580 052 -46.74%
Additions and alterations -47 143 -2.61% 289 610 3.03%
TOTAL 229 151 3.93% 3 198 206 10.06%
NON RES BUILDING PLANS PASSED (BPP): YTD* 2014 VS 2013
m2 % R*1000 %
Office and banking 234 398 47.52% 2 165 144 60.19%
Shopping -311 954 -45.57% -1 973 529 -45.03%
Industrial and warehouse 21 526 2.18% 546 136 12.59%
Other buildings 10 519 4.91% 153 150 13.07%
Additions and alterations -52 025 -8.27% -313 531 -7.52%
TOTAL -97 536 -3.24% 577 370 3.27%
GRAND TOTAL 131 615 1.49% 3 775 576 7.63%
* July 2014
RES BUILDING PLANS PASSED (BPP): YTD FORECAST 2014 VS 2013
m2 R*1000
Dwelling-house < 80 square metres 245 349 27.68% 958 378 32.58%
Dwelling-house => 80 square metres 179 697 4.25% 2 002 723 8.22%
Flats and townhouses 112 382 7.34% 1 311 739 13.66%
Other buildings 21 100 12.07% -87 148 -6.40%
Additions and alterations -14 124 -0.45% 476 768 2.84%
TOTAL RES 544 404 5.46% 4 662 461 8.47%
NON RES BUILDING PLANS PASSED (BPP): YTD FORECAST 2014 VS 2013
m2 R*1000
Office and banking 182 518 24.92% 1 793 627 33.54%
Shopping -207 626 -16.63% -1 473 653 -18.39%
Industrial and warehouse 163 894 9.25% 1 224 887 15.51%
Other buildings 76 801 18.17% 595 264 25.14%
Additions and alterations 87 748 7.79% 651 902 8.57%
TOTAL NON RES 303 335 5.72% 2 792 027 8.94%
TOTAL RES & NON RES 847 739 5.55% 7 454 487 8.64%
* July 2014
PROGNOSIS: YTD ACTUAL VS FORECAST: BUILDING PLANS PASSED
2013 vs 2012
YTD Actual YTD FC
4.84% 3.93% 5.46%
12.47% 10.06% 8.47%
21.04% -3.24% 5.72%
28.22% 3.27% 8.94%
9.95% 1.49% 5.55%
17.71% 7.63% 8.64%
Building Plans Passed Weighted Average (m2) 9.95% 1.63% 5.55%
Building Plans Passed Weighted Average (R) 6.68% 7.68% 8.64%
Non Residential BPP (R)
Total BPP (m2)
Total BPP (R)
BUILDING PLANS PASSED (BPP) (m2 and value)
Residential BPP (m2)
Non Residential BPP (m2)
2014 vs 2013Jul-14
Residential BPP (R)

© BMI-BRSCU © BMI-BRSCU 4
27.68%
4.25%
7.34%
12.07%
-0.45%
5.46%
32.58%
8.22%
13.66%
-6.40%
2.84%
8.47%
-10% -5% 0% 5% 10% 15% 20% 25% 30% 35%
Dwelling-house < 80 square metres
Dwelling-house => 80 square metres
Flats and townhouses
Other buildings
Additions and alterations
TOTAL RES
RES BUILDING PLANS PASSED (BPP) BY SEGMENT: TOTAL RSA: CUM FC 2014 VS 2013 (JULY)(Source: StatsSA, BMI-BRSCU: BPP South Africa: Chart BPP66)
m2 R*1000
THE INDUSTRY DASHBOARD: BUILDING PLANS PASSED: YTD ACTUAL AND FORECAST 2014 VS 2013

© BMI-BRSCU © BMI-BRSCU 5
24.92%
-16.63%
9.25%
18.17%
7.79%
5.72%
5.55%
33.54%
-18.39%
15.51%
25.14%
8.57%
8.94%
8.64%
-30% -20% -10% 0% 10% 20% 30% 40%
Office and banking
Shopping
Industrial and warehouse
Other buildings
Additions and alterations
TOTAL
GRAND TOTAL
NON RES AND TOTAL BPP BY SEGMENT: TOTAL RSA: YTD FC 2014 VS 2013 (JULY)
(Source: StatsSA, BMI-BRSCU Workings)
m2 R*1000
THE INDUSTRY DASHBOARD: BUILDING PLANS PASSED: YTD ACTUAL AND FORECAST 2014 VS 2013

© BMI-BRSCU 6
BUILDING PLANS PASSED BY SEGMENT: YTD ACTUAL 2014 VS 2013 www.strategicforum.co.za
27.1
4%
25.5
7% 37.5
7%
1.4
5%
3.2
2%
10.5
2%
12.6
8%
11.5
5% 2
6.5
9%
-23.8
4%
-46.7
4%
13.0
7%
47.5
2% 60.1
9%
-45.5
7%
-45.0
3%
2.1
8% 12.5
9%
4.9
1%
13.0
7%
6.6
0%
-2.6
1%
3.0
3%
-8.2
7%
-7.5
2%
-0.1
7%
7.6
3%
-120%
-100%
-80%
-60%
-40%
-20%
0%
20%
40%
60%
80%
No
m2
R'0
00
No
m2
R'0
00
No
m2
R'0
00
m2
R'0
00
R'0
00
m2
R'0
00
m2
R'0
00
m2
R'0
00
m2
R'0
00
R'0
00
m2
R'0
00
m2
R'0
00
R'0
00
R'0
00
< 80m2 > 80m2 Flats andTownhouses
Other Total Office andBanking
Shopping Ind&WH Other Total A&ADwellings
A&A Other A&ATot
Tot
% Difference in Cumulative Y/Y BPP: Cum YTD Actual 2014 vs 2013 by Segment (July)(Source: StatsSA, BMI-BRSCU Workings) (ChartBPP71(2)

© BMI-BRSCU © BMI-BRSCU 7
BUILDING PLANS PASSED BY SEGMENT: YTD FORECAST 2014 VS 2013 www.strategicforum.co.za
28.4
4%
27.6
8%
32.5
8%
4.0
5%
4.2
5%
8.2
2%
7.3
9%
7.3
4% 1
3.6
6%
12.0
7%
-6.4
0%
11.0
4%
24.9
2% 3
3.5
4%
-16.6
3%
-18.3
9%
9.2
5% 1
5.5
1%
18.1
7% 25.1
4%
9.4
5%
-0.4
5%
2.8
4% 7.7
9%
8.5
7%
4.5
6% 8.8
4%
-50%
-40%
-30%
-20%
-10%
0%
10%
20%
30%
40%
No
m2
R'0
00
No
m2
R'0
00
No
m2
R'0
00
m2
R'0
00
R'0
00
m2
R'0
00
m2
R'0
00
m2
R'0
00
m2
R'0
00
R'0
00
m2
R'0
00
m2
R'0
00
R'0
00
R'0
00
< 80m2 > 80m2 Flats andTownhouses
Other Total Office andBanking
Shopping Ind&WH Other Total A&ADwellings
A&A Other A&ATot
Tot
% Difference in Cumulative Y/Y BPP: Cum YTD FC 2014 vs 2013 by Segment (July)(Source: StatsSA, BMI-BRSCU Workings) (Chart BPP72)

© BMI-BRSCU © BMI-BRSCU 8
Jan Feb March April May June July Aug Sept Oct Nov Dec
Residential building 47.90% 17.79% 14.57% 7.74% 6.95% 7.30% 6.86% 6.46% 7.30% 6.69% 8.05% 8.19%
Non-residential buildings -39.42% -24.96% -16.49% -11.56% -10.62% -3.58% -1.91% -0.30% 1.59% 3.78% 6.03% 5.16%
Additions and alterations -0.53% 0.62% 4.96% -1.24% -2.64% -1.94% -4.07% -2.44% -0.86% 0.41% 0.93% 1.72%
Total 3.89% -0.40% 2.35% -0.24% -0.57% 1.86% 1.49% 2.18% 3.49% 4.17% 5.51% 5.55%
-50%
-40%
-30%
-20%
-10%
0%
10%
20%
30%
40%
50%
60%
Pe
rce
nta
ge
Cumulative YTD % Change in BPP by Sector: Jan - Dec 2014 vs 2013: M2 (July)(Source: StasSA, BMI-BRSCU Workings: BPP by Month and Sector; Chart 38(13))
CUM YTD ACTUAL CUM YTD FORECAST
CUM % CHANGE BPP BY SECTOR: 1994-2014: M2 www.strategicforum.co.za

© BMI-BRSCU © BMI-BRSCU 9
Jan Feb March April May June July Aug Sept Oct Nov Dec
Residential building 53.14% 20.28% 19.26% 13.34% 14.04% 15.16% 13.07% 11.70% 12.06% 10.44% 11.61% 11.04%
Non-residential buildings -43.69% -22.24% -12.50% -4.04% -3.51% 3.81% 6.60% 5.02% 7.31% 8.31% 9.37% 9.45%
Additions and alterations 3.00% 2.59% 6.74% 1.54% -0.10% 0.49% -0.17% 1.38% 2.57% 4.22% 4.35% 4.56%
Total 2.58% 1.73% 5.79% 5.04% 5.17% 8.01% 7.63% 7.03% 8.17% 8.18% 9.04% 8.84%
-60%
-40%
-20%
0%
20%
40%
60%
Pe
rce
nta
ge
Cumulative YTD % Change in BPP by Sector: Jan - Dec 2014 vs 2013: R*1000 (July)(Source: StasSA, BMI-BRSCU Workings: BPP by Month and Sector; Chart 38(15))
CUM YTD ACTUAL CUM YTD FORECAST
CUM % CHANGE BC BY SECTOR: 1994-2014: R*1000 www.strategicforum.co.za
© BMI-BRSCU
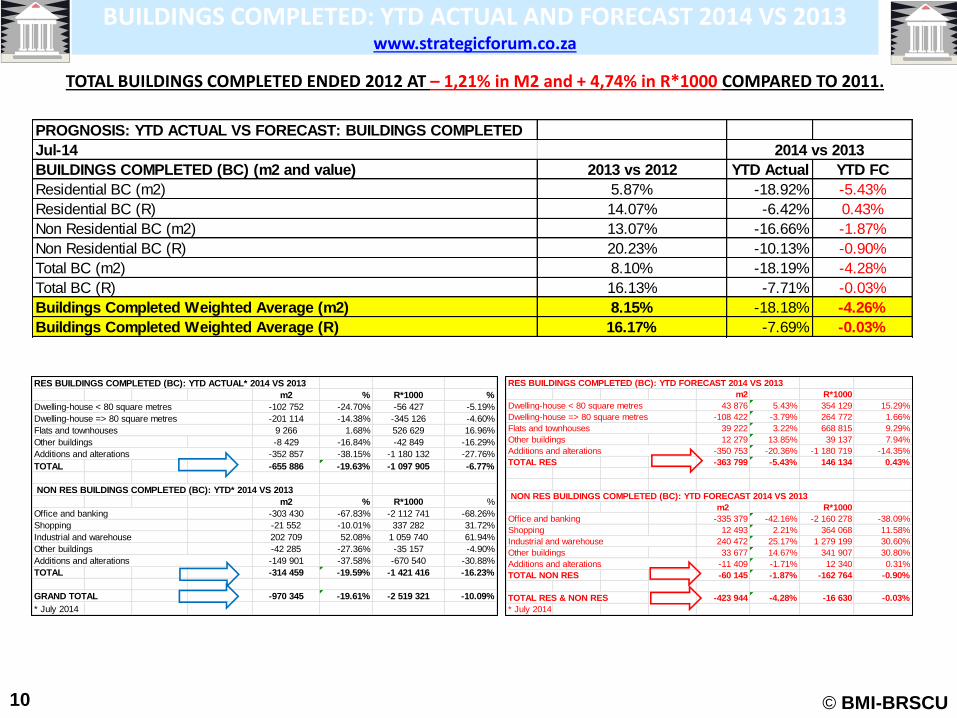
TOTAL BUILDINGS COMPLETED ENDED 2012 AT – 1,21% in M2 and + 4,74% in R*1000 COMPARED TO 2011.
BUILDINGS COMPLETED: YTD ACTUAL AND FORECAST 2014 VS 2013 www.strategicforum.co.za
10
RES BUILDINGS COMPLETED (BC): YTD ACTUAL* 2014 VS 2013
m2 % R*1000 %
Dwelling-house < 80 square metres -102 752 -24.70% -56 427 -5.19%
Dwelling-house => 80 square metres -201 114 -14.38% -345 126 -4.60%
Flats and townhouses 9 266 1.68% 526 629 16.96%
Other buildings -8 429 -16.84% -42 849 -16.29%
Additions and alterations -352 857 -38.15% -1 180 132 -27.76%
TOTAL -655 886 -19.63% -1 097 905 -6.77%
NON RES BUILDINGS COMPLETED (BC): YTD* 2014 VS 2013
m2 % R*1000 %
Office and banking -303 430 -67.83% -2 112 741 -68.26%
Shopping -21 552 -10.01% 337 282 31.72%
Industrial and warehouse 202 709 52.08% 1 059 740 61.94%
Other buildings -42 285 -27.36% -35 157 -4.90%
Additions and alterations -149 901 -37.58% -670 540 -30.88%
TOTAL -314 459 -19.59% -1 421 416 -16.23%
GRAND TOTAL -970 345 -19.61% -2 519 321 -10.09%
* July 2014
RES BUILDINGS COMPLETED (BC): YTD FORECAST 2014 VS 2013
m2 R*1000
Dwelling-house < 80 square metres 43 876 5.43% 354 129 15.29%
Dwelling-house => 80 square metres -108 422 -3.79% 264 772 1.66%
Flats and townhouses 39 222 3.22% 668 815 9.29%
Other buildings 12 279 13.85% 39 137 7.94%
Additions and alterations -350 753 -20.36% -1 180 719 -14.35%
TOTAL RES -363 799 -5.43% 146 134 0.43%
NON RES BUILDINGS COMPLETED (BC): YTD FORECAST 2014 VS 2013
m2 R*1000
Office and banking -335 379 -42.16% -2 160 278 -38.09%
Shopping 12 493 2.21% 364 068 11.58%
Industrial and warehouse 240 472 25.17% 1 279 199 30.60%
Other buildings 33 677 14.67% 341 907 30.80%
Additions and alterations -11 409 -1.71% 12 340 0.31%
TOTAL NON RES -60 145 -1.87% -162 764 -0.90%
TOTAL RES & NON RES -423 944 -4.28% -16 630 -0.03%
* July 2014
PROGNOSIS: YTD ACTUAL VS FORECAST: BUILDINGS COMPLETED
2013 vs 2012 YTD Actual YTD FC
5.87% -18.92% -5.43%
14.07% -6.42% 0.43%
13.07% -16.66% -1.87%
20.23% -10.13% -0.90%
8.10% -18.19% -4.28%
16.13% -7.71% -0.03%
Buildings Completed Weighted Average (m2) 8.15% -18.18% -4.26%
Buildings Completed Weighted Average (R) 16.17% -7.69% -0.03%
Jul-14
BUILDINGS COMPLETED (BC) (m2 and value)
Total BC (m2)
Total BC (R)
2014 vs 2013
Residential BC (m2)
Residential BC (R)
Non Residential BC (m2)
Non Residential BC (R)
© BMI-BRSCU © BMI-BRSCU
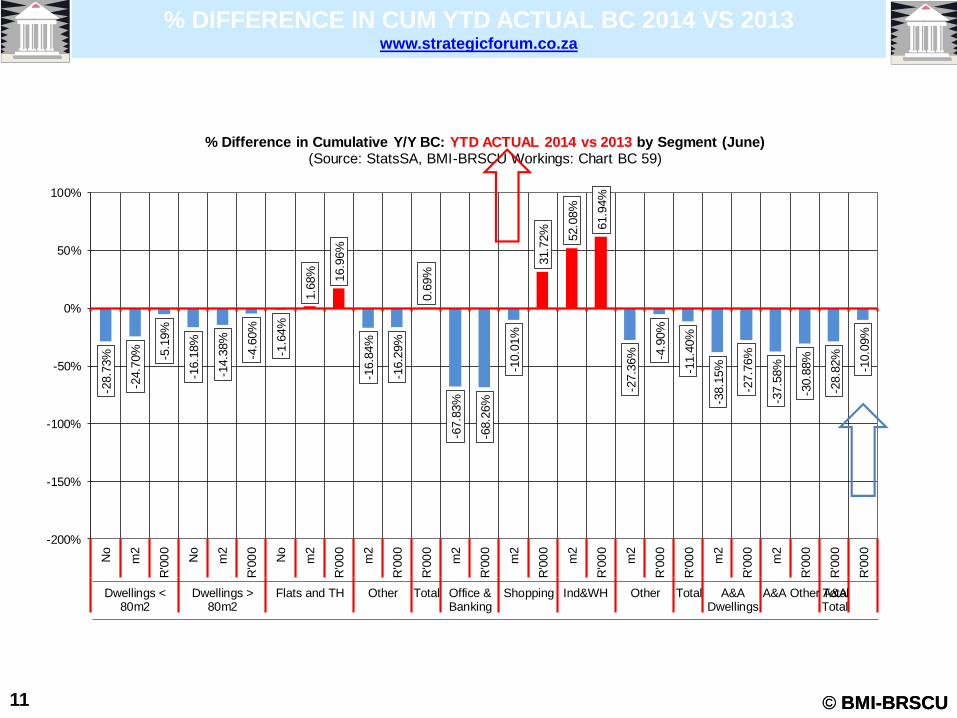
% DIFFERENCE IN CUM YTD ACTUAL BC 2014 VS 2013 www.strategicforum.co.za
11
-28.7
3%
-24.7
0% -5.1
9%
-16.1
8%
-14.3
8%
-4.6
0%
-1.6
4%
1.6
8% 16.9
6%
-16.8
4%
-16.2
9%
0.6
9%
-67.8
3%
-68.2
6%
-10.0
1%
31.7
2%
52.0
8%
61.9
4%
-27.3
6% -4
.90%
-11.4
0%
-38.1
5%
-27.7
6%
-37.5
8%
-30.8
8%
-28.8
2%
-10.0
9%
-200%
-150%
-100%
-50%
0%
50%
100%
No
m2
R'0
00
No
m2
R'0
00
No
m2
R'0
00
m2
R'0
00
R'0
00
m2
R'0
00
m2
R'0
00
m2
R'0
00
m2
R'0
00
R'0
00
m2
R'0
00
m2
R'0
00
R'0
00
R'0
00
Dwellings <80m2
Dwellings >80m2
Flats and TH Other Total Office &Banking
Shopping Ind&WH Other Total A&ADwellings
A&A Other A&ATotalTotal
% Difference in Cumulative Y/Y BC: YTD ACTUAL 2014 vs 2013 by Segment (June) (Source: StatsSA, BMI-BRSCU Workings: Chart BC 59)

© BMI-BRSCU © BMI-BRSCU
% DIFFERENCE IN CUM YTD FC BC 2014 VS 2013
www.strategicforum.co.za
12
2.4
2%
5.4
3%
15.2
9%
-4.6
0%
-3.7
9%
1.6
6%
3.0
0%
3.2
2% 9.2
9%
13.8
5%
7.9
4%
5.1
3%
-42.1
6%
-38.0
9%
2.2
1% 1
1.5
8%
25.1
7%
30.6
0%
14.6
7%
30.8
0%
-1.1
5%
-20.3
6%
-14.3
5%
-1.7
1%
0.3
1%
-9.6
3%
0.1
6%
-70%
-50%
-30%
-10%
10%
30%
50%
No
m2
R'0
00
No
m2
R'0
00
No
m2
R'0
00
m2
R'0
00
R'0
00
m2
R'0
00
m2
R'0
00
m2
R'0
00
m2
R'0
00
R'0
00
m2
R'0
00
m2
R'0
00
R'0
00
R'0
00
Dwellings <80m2
Dwellings >80m2
Flats and TH Other Total Office &Banking
Shopping Ind&WH Other Total A&ADwellings
A&A Other A&ATotalTotal
% Difference in Cumulative Y/Y BC: YTD FC 2014 vs 2013 by Segment (June)(Source: StatsSA, BMI-BRSCU Workings: Chart BC 58)
© BMI-BRSCU
0
100 000
200 000
300 000
400 000
500 000
600 000
700 000
800 000
900 000
1 000 000
1 100 000
1 200 000
1 300 000
1 400 000
1 500 000
1 600 000
1 700 000
19
93
19
94
19
95
19
96
19
97
19
98
19
99
20
00
20
01
20
02
20
03
20
04
20
05
20
06
20
07
20
08
20
09
20
10
20
11
20
12
20
13
20
14
Sq
ua
re M
etr
es
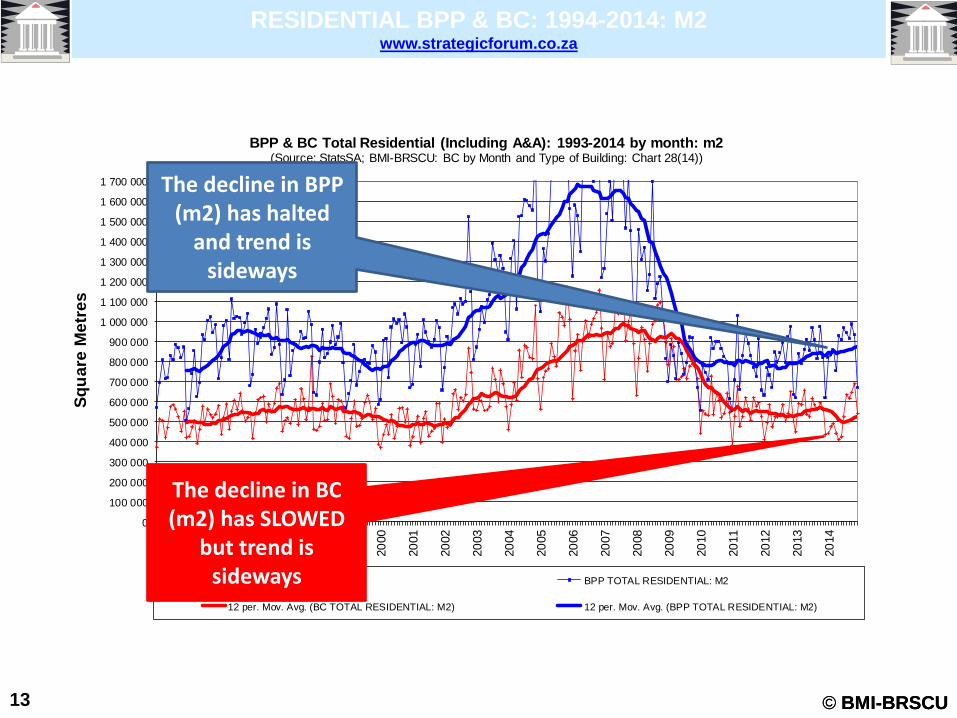
BPP & BC Total Residential (Including A&A): 1993-2014 by month: m2 (Source: StatsSA; BMI-BRSCU: BC by Month and Type of Building: Chart 28(14))
BC TOTAL RESIDENTIAL: M2 BPP TOTAL RESIDENTIAL: M2
12 per. Mov. Avg. (BC TOTAL RESIDENTIAL: M2) 12 per. Mov. Avg. (BPP TOTAL RESIDENTIAL: M2)
© BMI-BRSCU
RESIDENTIAL BPP & BC: 1994-2014: M2 www.strategicforum.co.za
13
The decline in BPP (m2) has halted
and trend is sideways
The decline in BC (m2) has SLOWED
but trend is sideways

© BMI-BRSCU © BMI-BRSCU
RESIDENTIAL BPP & BC: 1994-2014: M2 www.strategicforum.co.za
14
0
40 000
80 000
120 000
160 000
200 000
240 000
280 000
320 000
360 000
400 000
440 000
480 000
19
93
19
94
19
95
19
96
19
97
19
98
19
99
20
00
20
01
20
02
20
03
20
04
20
05
20
06
20
07
20
08
20
09
20
10
20
11
20
12
20
13
20
14
Sq
uare
Metr
es
BPP & BC Residential Flats and Townhouses: 1993-2014 by month: m2(Source: StatsSA; BMI-BRSCU: BC Total RSA by Month and Type of Building: F&TH M2)
BC Flats and Townhouses BC Dwellings < 80 m2 BC Dwellings > 80 m2
12 per. Mov. Avg. (BC Flats and Townhouses) 12 per. Mov. Avg. (BC Dwellings < 80 m2) 12 per. Mov. Avg. (BC Dwellings > 80 m2)

© BMI-BRSCU
-50%
-40%
-30%
-20%
-10%
0%
10%
20%
30%
40%
50%
19
94
19
95
19
96
19
97
19
98
19
99
20
00
20
01
20
02
20
03
20
04
20
05
20
06
20
07
20
08
20
09
20
10
20
11
20
12
20
13
20
14
Sq
ua
re M
etr
es
Cum Y/Y Percentage Change: BPP & BC: Total Residential (Incl A&A): 1993-2014: m2(Source: StatsSA; BMI-BRSCU: BC Total RSA by Month and Type of Building: % CUM BC BY SEGM & MNTH: Chart 50(14))
% CUM BC BY SEGM& MNTH % CUM BPP BY SEGM& MNTH
12 per. Mov. Avg. (% CUM BC BY SEGM& MNTH) 12 per. Mov. Avg. (% CUM BPP BY SEGM& MNTH)
© BMI-BRSCU
CUM % CHANGE RESIDENTIAL BPP & BC: 1994-2014: M2 www.strategicforum.co.za
15
The decline in BPP (m2) has halted and trend is upwards but slowing
The decline in BC (m2) has halted and trend is
up and down.

© BMI-BRSCU
0
500 000
1 000 000
1 500 000
2 000 000
2 500 000
3 000 000
3 500 000
4 000 000
4 500 000
5 000 000
5 500 000
19
93
19
94
19
95
19
96
19
97
19
98
19
99
20
00
20
01
20
02
20
03
20
04
20
05
20
06
20
07
20
08
20
09
20
10
20
11
20
12
20
13
20
14
R*1
000 (
Cu
rren
t V
alu
es)
BPP & BC Total Residential (Including A&A): 1993-2014 by month: R*1000 (Current Values)(Source: StatsSA; BMI-BRSCU: BC Total RSA by Month and Type of Building1993-2008: TOTAL RES BC&BPP R)
BC TOTAL RESIDENTIAL: R*1000 BPP TOTAL RESIDENTIAL: R*1000
12 per. Mov. Avg. (BC TOTAL RESIDENTIAL: R*1000) 12 per. Mov. Avg. (BPP TOTAL RESIDENTIAL: R*1000)
© BMI-BRSCU
RESIDENTIAL BPP & BC: 1994-2014: R*1000 www.strategicforum.co.za
16
The decline in BPP (R*1000) has
halted and trend is strongly upward
The decline in BC (R*1000) has been halted but trend is
gradually upward

© BMI-BRSCU
-40%
-30%
-20%
-10%
0%
10%
20%
30%
40%
50%
60%
19
94
19
95
19
96
19
97
19
98
19
99
20
00
20
01
20
02
20
03
20
04
20
05
20
06
20
07
20
08
20
09
20
10
20
11
20
12
20
13
20
14
R*1
00
0
Cum Y/Y % Change: BPP & BC: Total Residential (Incl A&A): 1993-2014: R*1000 (Current Values)
(Source: StatsSA; BMI-BRSCU: BC by Month and Type of Building: % CUM BC BY SEGM & MNTH: Chart 51(14))
% CUM BC BY SEGM& MNTH % CUM BPP BY SEGM& MNTH
12 per. Mov. Avg. (% CUM BC BY SEGM& MNTH) 12 per. Mov. Avg. (% CUM BPP BY SEGM& MNTH)
© BMI-BRSCU
CUM % CHANGE RES BPP & BC: 1994-2014: R*1000 www.strategicforum.co.za
17
The decline in BPP (R*1000) has halted and trend is strongly up and down
The decline in BC (R*1000) has been halted but trend is STRONGLY up
and down

© BMI-BRSCU
100 000
200 000
300 000
400 000
500 000
600 000
19
93
19
94
19
95
19
96
19
97
19
98
19
99
20
00
20
01
20
02
20
03
20
04
20
05
20
06
20
07
20
08
20
09
20
10
20
11
20
12
20
13
20
14
Sq
uare
Metr
es
BPP & BC Total Non Residential (Including A&A): 1993-2014 by month: m2(Source: StatsSA; BMI-BRSCU: BC by Month and Type of Building: Chart 29(14))
BC TOTAL NON RESIDENTIAL: M2 BPP TOTAL NON RESIDENTIAL: M2
12 per. Mov. Avg. (BC TOTAL NON RESIDENTIAL: M2) 12 per. Mov. Avg. (BPP TOTAL NON RESIDENTIAL: M2)
© BMI-BRSCU
NON RESIDENTIAL BPP & BC: 1994-2014: M2 www.strategicforum.co.za
18

© BMI-BRSCU
-40%
-30%
-20%
-10%
0%
10%
20%
30%
40%
50%
60%
70%
19
94
19
95
19
96
19
97
19
98
19
99
20
00
20
01
20
02
20
03
20
04
20
05
20
06
20
07
20
08
20
09
20
10
20
11
20
12
20
13
20
14
Sq
ua
re M
etr
es
Cum Y/Y Percentage Change: BPP & BC:Total Non Residential (Incl A&A): 1993-2014: m2 (Source: StatsSA; BMI-BRSCU: BC by Month and Type of Building: % CUM BC BY SEGM & MNTH: Chart 62(14))
'% CUM BC BY SEGM & MNTH' % CUM BPP BY SEGM& MNTH
12 per. Mov. Avg. ('% CUM BC BY SEGM & MNTH') 12 per. Mov. Avg. (% CUM BPP BY SEGM& MNTH)
© BMI-BRSCU
NON RESIDENTIAL BPP & BC: 1994-2014: M2 www.strategicforum.co.za
19

© BMI-BRSCU © BMI-BRSCU
NON RESIDENTIAL BPP & BC: 1994-2014: R*1000 www.strategicforum.co.za
20
0
500 000
1 000 000
1 500 000
2 000 000
2 500 000
3 000 000
19
93
19
94
19
95
19
96
19
97
19
98
19
99
20
00
20
01
20
02
20
03
20
04
20
05
20
06
20
07
20
08
20
09
20
10
20
11
20
12
20
13
20
14
R*1
000 (
Cu
rren
t V
alu
es)
BPP & BC Total Non Res (Including A&A): 1993-2014 by month: R*1000 (Current Values)(Source: StatsSA; BMI-BRSCU: BC Total RSA by Month and Type of Building1993-2008: TOTAL NR BC&BPP R)
BC TOTAL NON RESIDENTIAL: R*1000 BPP TOTAL NON RESIDENTIAL: R*1000
12 per. Mov. Avg. (BC TOTAL NON RESIDENTIAL: R*1000) 12 per. Mov. Avg. (BPP TOTAL NON RESIDENTIAL: R*1000)

© BMI-BRSCU © BMI-BRSCU
NON RESIDENTIAL BPP & BC: 1994-2014: R*1000 www.strategicforum.co.za
21
-50%
-40%
-30%
-20%
-10%
0%
10%
20%
30%
40%
50%
60%
70%
80%
90%
19
94
19
95
19
96
19
97
19
98
19
99
20
00
20
01
20
02
20
03
20
04
20
05
20
06
20
07
20
08
20
09
20
10
20
11
20
12
20
13
20
14
R*1
00
0
Cum Y/Y % Change: BPP & BC: Total Non Residential (Incl A&A): 1993-2014: R*1000 (Current Values)
(Source: StatsSA; BMI-BRSCU: BC by Month and Type of Building: % CUM BC BY SEGM & MNTH: Chart 63(14))
% CUM BC BY SEGM& MNTH % CUM BPP BY SEGM& MNTH
12 per. Mov. Avg. (% CUM BC BY SEGM& MNTH) 12 per. Mov. Avg. (% CUM BPP BY SEGM& MNTH)

© BMI-BRSCU © BMI-BRSCU
TOTAL BPP & BC: 1994-2014: M2 www.strategicforum.co.za
22
200 000
400 000
600 000
800 000
1 000 000
1 200 000
1 400 000
1 600 000
1 800 000
2 000 000
2 200 000
19
93
19
94
19
95
19
96
19
97
19
98
19
99
20
00
20
01
20
02
20
03
20
04
20
05
20
06
20
07
20
08
20
09
20
10
20
11
20
12
20
13
20
14
m2
BPP & BC Total Building (Including A&A): 1993-2014 by month: m2(Source: StatsSA; BMI-BRSCU: BC Total RSA by Month and Type of Building1993-2008: TOTAL BLDNG BC&BPP R)
BC TOTAL BUILDING: M2 BPP TOTAL BUILDING: M2 12 per. Mov. Avg. (BC TOTAL BUILDING: M2) 12 per. Mov. Avg. (BPP TOTAL BUILDING: M2)

© BMI-BRSCU © BMI-BRSCU
TOTAL BPP & BC: 1994-2014: M2 www.strategicforum.co.za
23
-45%
-40%
-35%
-30%
-25%
-20%
-15%
-10%
-5%
0%
5%
10%
15%
20%
25%
30%
35%
19
94
19
95
19
96
19
97
19
98
19
99
20
00
20
01
20
02
20
03
20
04
20
05
20
06
20
07
20
08
20
09
20
10
20
11
20
12
20
13
20
14
Sq
ua
re M
etr
es
Cum Y/Y Percentage Change: BPP and BC: Total Building (Inc A&A): 1993-2014: m2(Source: StatsSA; BMI-BRSCU: BC by Month and Type of Building: % CUM BC BY SEGM & MNTH: Chart 66(14))
% CUM BC BY SEGM& MNTH % CUM BPP BY SEGM& MNTH
12 per. Mov. Avg. (% CUM BC BY SEGM& MNTH) 12 per. Mov. Avg. (% CUM BPP BY SEGM& MNTH)
Total BC turned at about – 30% and moved to positive growth in 2013 followed by a downward trend in 2014 . . .
Total BPP has turned at -30% and has breached zero in MID 2011, grew strongly up to mid-2013 and declined again but still in positive zone. . .

© BMI-BRSCU © BMI-BRSCU
TOTAL BPP & BC: 1994-2014: R*1000 www.strategicforum.co.za
24
0
1 000 000
2 000 000
3 000 000
4 000 000
5 000 000
6 000 000
7 000 000
8 000 000
19
93
19
94
19
95
19
96
19
97
19
98
19
99
20
00
20
01
20
02
20
03
20
04
20
05
20
06
20
07
20
08
20
09
20
10
20
11
20
12
20
13
20
14
R*1
000 (
Cu
rren
t V
alu
es)
BPP & BC Total Building: 1993-2014 by month: R*1000 (Current Values)(Source: StatsSA; BMI-BRSCU: BC Total RSA by Month and Type of Building1993-2008: TOTAL BLDNG BC&BPP R)
BC TOTAL BUILDING: R*1000 BPP TOTAL BUILDING: R*1000
12 per. Mov. Avg. (BC TOTAL BUILDING: R*1000) 12 per. Mov. Avg. (BPP TOTAL BUILDING: R*1000)

© BMI-BRSCU © BMI-BRSCU
TOTAL BPP & BC: 1994-2014: R*1000 www.strategicforum.co.za
25
-50%
-45%
-40%
-35%
-30%
-25%
-20%
-15%
-10%
-5%
0%
5%
10%
15%
20%
25%
30%
35%
40%
45%
50%
55%
60%
19
94
19
95
19
96
19
97
19
98
19
99
20
00
20
01
20
02
20
03
20
04
20
05
20
06
20
07
20
08
20
09
20
10
20
11
20
12
20
13
20
14
R*1
00
0
Cum Y/Y % Ch: BPP and BC: Total Building (Incl A&A): 1993-2014: R*1000 (Current Values) (Source: StatsSA; BMI-BRSCU: BC by Month and Type of Building: % CUM BC BY SEGM & MNTH: Chart 67(14))
% CUM BC BY SEGM& MNTH % CUM BPP BY SEGM& MNTH
12 per. Mov. Avg. (% CUM BC BY SEGM& MNTH) 12 per. Mov. Avg. (% CUM BPP BY SEGM& MNTH)
© BMI-BRSCU © BMI-BRSCU
CUM % CHANGE BC BY SECTOR: 1994-2014: M2 www.strategicforum.co.za
26
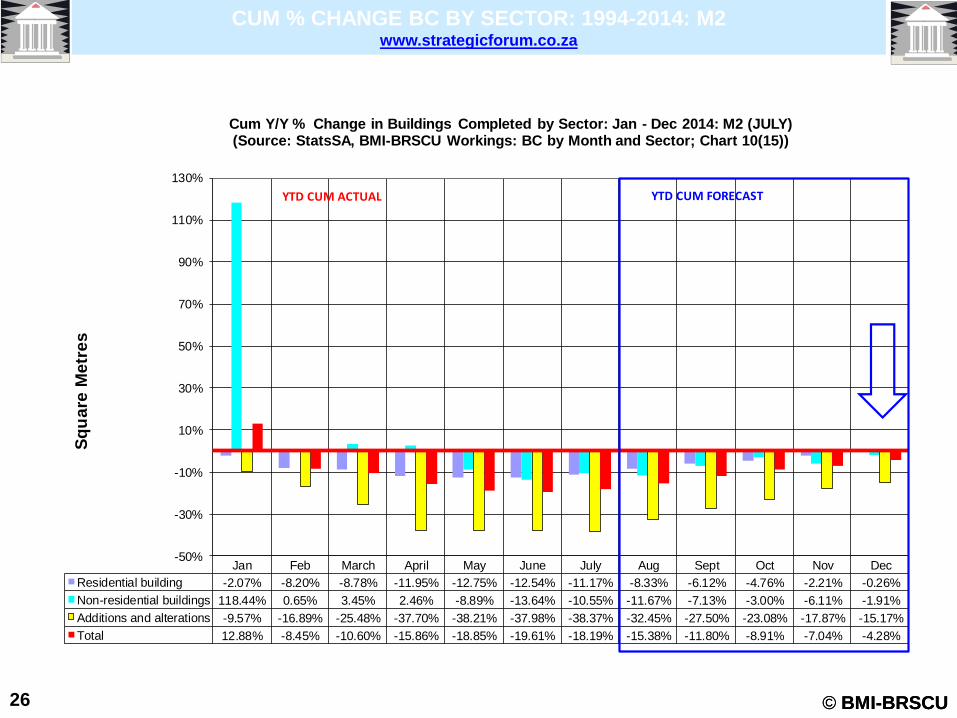
Jan Feb March April May June July Aug Sept Oct Nov Dec
Residential building -2.07% -8.20% -8.78% -11.95% -12.75% -12.54% -11.17% -8.33% -6.12% -4.76% -2.21% -0.26%
Non-residential buildings 118.44% 0.65% 3.45% 2.46% -8.89% -13.64% -10.55% -11.67% -7.13% -3.00% -6.11% -1.91%
Additions and alterations -9.57% -16.89% -25.48% -37.70% -38.21% -37.98% -38.37% -32.45% -27.50% -23.08% -17.87% -15.17%
Total 12.88% -8.45% -10.60% -15.86% -18.85% -19.61% -18.19% -15.38% -11.80% -8.91% -7.04% -4.28%
-50%
-30%
-10%
10%
30%
50%
70%
90%
110%
130%
Sq
ua
re M
etr
es
Cum Y/Y % Change in Buildings Completed by Sector: Jan - Dec 2014: M2 (JULY)(Source: StatsSA, BMI-BRSCU Workings: BC by Month and Sector; Chart 10(15))
YTD CUM ACTUAL YTD CUM FORECAST
© BMI-BRSCU © BMI-BRSCU 27
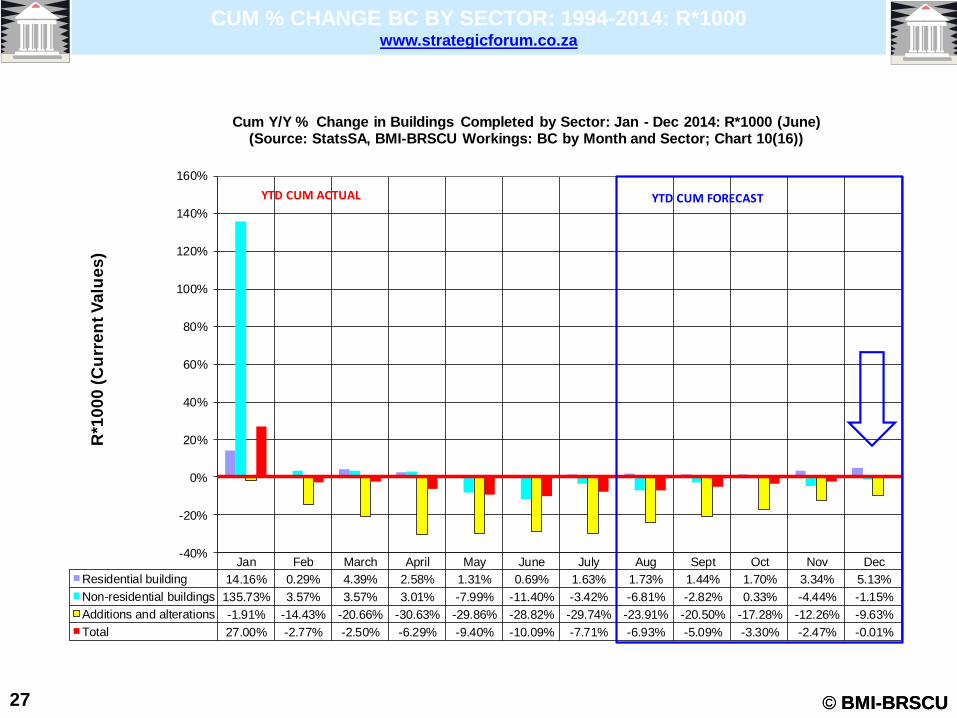
CUM % CHANGE BC BY SECTOR: 1994-2014: R*1000 www.strategicforum.co.za
Jan Feb March April May June July Aug Sept Oct Nov Dec
Residential building 14.16% 0.29% 4.39% 2.58% 1.31% 0.69% 1.63% 1.73% 1.44% 1.70% 3.34% 5.13%
Non-residential buildings 135.73% 3.57% 3.57% 3.01% -7.99% -11.40% -3.42% -6.81% -2.82% 0.33% -4.44% -1.15%
Additions and alterations -1.91% -14.43% -20.66% -30.63% -29.86% -28.82% -29.74% -23.91% -20.50% -17.28% -12.26% -9.63%
Total 27.00% -2.77% -2.50% -6.29% -9.40% -10.09% -7.71% -6.93% -5.09% -3.30% -2.47% -0.01%
-40%
-20%
0%
20%
40%
60%
80%
100%
120%
140%
160%
R*1
00
0 (
Cu
rre
nt
Va
lue
s)
Cum Y/Y % Change in Buildings Completed by Sector: Jan - Dec 2014: R*1000 (June)(Source: StatsSA, BMI-BRSCU Workings: BC by Month and Sector; Chart 10(16))
YTD CUM ACTUAL YTD CUM FORECAST

© BMI-BRSCU
BPP & BC, CEMENT AND LUMBER SALES: YTD ACUAL AND FC 2014 www.strategicforum.co.za
28
-60%
-40%
-20%
0%
20%
40%
60%
80%
Perc
en
tag
e
Jan-14 Feb-14 Mar-14 Apr-14 May-14 Jun-14 Jul-14 Aug-14 Sep-14 Oct-14 Nov-14 Dec-14
Total Res BC Cum YTD % Change (m2) -1.45% -11.61%-13.14%-18.70%-19.76%-19.63%-18.92%-15.37%-12.59%-10.41% -7.50% -5.43%
Total Non Res BC Cum YTD % Change (m2) 61.45% -1.17% -4.76% -9.67% -16.97%-19.59%-16.66%-15.41%-10.16% -5.75% -6.09% -1.87%
Total BC Cum YTD % Change (m2) 12.88% -8.45% -10.60%-15.86%-18.85%-19.61%-18.19%-15.38%-11.80% -8.91% -7.04% -4.28%
Total Residential BPP (m2) 33.40% 13.65% 11.82% 5.00% 4.34% 4.69% 3.93% 3.90% 4.83% 4.40% 5.21% 5.46%
Total Non Residential BPP (m2) -35.74%-22.33%-13.20% -9.72% -9.63% -3.67% -3.24% -1.11% 0.95% 3.73% 6.07% 5.72%
Total Building BPP (m2) 3.89% -0.40% 2.35% -0.24% -0.57% 1.86% 1.49% 2.18% 3.49% 4.17% 5.51% 5.55%
Local Building Lumber Sales (m3) 16.99% 15.50% 14.26% 14.43% 12.54% 12.48% 12.19% 10.13% 9.44% 6.81% 6.31% 7.00%
Domestic Cement Sales (Tonnes) -5.35% -5.35% -5.35% -3.83% -2.88% -2.23% -1.85% -1.56% -1.32% -1.14% -0.99% -0.90%
Cumulative YTD Buildings Completed (BC), Domestic Cement Sales and Local Building Lumber Sales: % Change by Sector: January - Dec 2014 (June)
(Source: StatsSA; BMI-BRSCU Workings)
CUM FORECASTCUM ACTUAL
© BMI-BRSCU © BMI-BRSCU
THE STRATEGIC FORUM www.strategicforum.co.za
OUTLINE OF SENSEMAKING UPDATE 1. BUILDING PLANS PASSED AND BUILDINGS COMPLETED 1993-2013
• Trend, Current Reality 2012 and Forecast 2013 for Res, Non Res and Total BPP in m2 and Value • Trend, Current Reality 2012 and Forecast 2013 for Res, Non Res and Total BC in m2 and Value • Summary YTD % Actual and Forecast BPP, BC, Cement Sales and Local Building Lumber Sales
2. NET BUILDING IN THE PIPELINE (NBIP) • NBIP Residential, Non Residential and Total Building • YTD Forecast BC 2013 vs Actual 2012 by Segment in Number, m2 and Value • BPP and BC by Province
3. INVESTMENT IN BUILDING AND CONSTRUCTION: 2012 4. CURRENT REALITY AND OUTLOOK FOR BUILDING AND CONSTRUCTION ACTIVITY BY SECTOR AND SEGMENT: 2013 - 2020
(CURRENT 2012 VALUE) 5. CURRENT REALITY OF INVESTMENT IN BUILDING & CONSTRUCTION: 2012 6. % CHANGE IN INVESTMENT IN BUILDING & CONSTRUCTION: 2011-2020 (R MILLION) (CONSTANT 2012 VALUES) 7. INVESTMENT IN BUILDING & CONSTRUCTION: 2013-2020 (R MILLION) (CONSTANT 2012 VALUES)
INVESTMENT IN BUILDING & CONSTRUCTION:
2013-2020 (R MILLION) (CONSTANT 2012 VALUES)
29

© BMI-BRSCU
0
200 000
400 000
600 000
800 000
1 000 000
1 200 000
1 400 000
1 600 000
1 800 000
2 000 000
19
93
19
94
19
95
19
96
19
97
19
98
19
99
20
00
20
01
20
02
20
03
20
04
20
05
20
06
20
07
20
08
20
09
20
10
20
11
20
12
20
13
20
14
Sq
ua
re M
etr
es
Total Residential: 1993-2014: BC, Net Building in the Pipeline (NBIP): by month: m2
(Source: StatsSA, BMI-BRSCU: BC Total RSA by Month and Type of Building: NBIP (BPP-BC): Chart 77(14))
Total Residential NBIP
Total Residential BC
Total Residential BPP
12 per. Mov. Avg. (Total Residential NBIP)
12 per. Mov. Avg. (Total Residential BC)
12 per. Mov. Avg. (Total Residential BPP)
NBIP = 70.4%*BC
NBIP = 45.52%*BC
NBIP = 51,11%*BC
RES NET BUILDING IN THE PIPELINE: M2: 1993-2014 www.strategicforum.co.za
30
Total Residential BC Trend-break occurred in mid 2006. NBIP (m2) showing improvement( toward the 70% mark?)

© BMI-BRSCU
RES NET BUILDING IN THE PIPELINE: R*1000: 1993-2014 www.strategicforum.co.za
31
-1 000 000
0
1 000 000
2 000 000
3 000 000
4 000 000
5 000 000
6 000 000
7 000 000
19
93
19
94
19
95
19
96
19
97
19
98
19
99
20
00
20
01
20
02
20
03
20
04
20
05
20
06
20
07
20
08
20
09
20
10
20
11
20
12
20
13
20
14
R*1
00
0 (
Cu
rre
nt
Va
lue
s)
Total Residential: 1993-2014: BC, Net Building in the Pipeline (NBIP): by month: R*1000 (Current Values)
(Source: StatsSA, BMI-BRSCU: BC Total RSA by Month and Type of Building1993-2008: NBIP (BPP-BC): Chart 78(14))
Total Residential NBIP
Total Residential BC
Total Res BPP
12 per. Mov. Avg. (Total Residential NBIP)
12 per. Mov. Avg. (Total Residential BC)
2 per. Mov. Avg. (Total Res BPP)
12 per. Mov. Avg. (Total Res BPP)
NBIP = 84.31%*BC NBIP = 53.83%*BC NBIP = 56,67*BC

© BMI-BRSCU
0
50 000
100 000
150 000
200 000
250 000
300 000
350 000
400 000
450 000
500 000
550 000
600 000
650 000
19
93
19
94
19
95
19
96
19
97
19
98
19
99
20
00
20
01
20
02
20
03
20
04
20
05
20
06
20
07
20
08
20
09
20
10
20
11
20
12
20
13
20
14
Sq
ua
re M
etr
es
Total Non Residential: 1993-2014: BC, Net Building in the Pipeline (NBIP): by Month: m2 (Source: StatsSA, BMI-BRSCU: BC Total RSA by Month and Type of Building: NBIP (BPP-BC): Chart 79(14))
NBIP Total Non Residential
BC Total Non Residential
BPP Total Non Residential
12 per. Mov. Avg. (NBIP Total Non Residential)
12 per. Mov. Avg. (BC Total Non Residential)
12 per. Mov. Avg. (BPP Total Non Residential)
NBIP = 76.4%*BC
NBIP = 42.83%*BC
NBIP = 58,99%*BC
© BMI-BRSCU
NON RES NET BUILDING IN THE PIPELINE: M2: 1993-2014 www.strategicforum.co.za
32
Total Non Residential BC Trend-break occurred in early 2007. NBIP (m2) showing improvement (toward the 76% mark?)

© BMI-BRSCU © BMI-BRSCU
NON RES NET BUILDING IN THE PIPELINE: R*1000: 1993-2014 www.strategicforum.co.za
33
-500 000
0
500 000
1 000 000
1 500 000
2 000 000
2 500 000
3 000 000
19
93
19
94
19
95
19
96
19
97
19
98
19
99
20
00
20
01
20
02
20
03
20
04
20
05
20
06
20
07
20
08
20
09
20
10
20
11
20
12
20
13
20
14
R*1
00
0 (
Cu
rre
nt
Va
lue
s)
Total Non Residential: 1993-2014: BC, Net Building in the Pipeline (NBIP): by Month: R*1000 (Source: StatsSA, BMI-BRSCU: BC Total RSA by Month and Type of Building: NBIP (BPP-BC): Chart 79(14))
NBIP Total Non Residential
BC Total Non Residential
BPP Total Non Residential
12 per. Mov. Avg. (NBIP Total Non Residential)
12 per. Mov. Avg. (BC Total Non Residential)
12 per. Mov. Avg. (BPP Total Non Residential)
NBIP = 91,15%*BC NBIP = 47.17%*BC
NBIP = 67,19%*BC

© BMI-BRSCU
0
200 000
400 000
600 000
800 000
1 000 000
1 200 000
1 400 000
1 600 000
1 800 000
2 000 000
2 200 000
2 400 000
2 600 000
199
3
199
4
199
5
199
6
199
7
199
8
199
9
200
0
200
1
200
2
200
3
200
4
200
5
200
6
200
7
200
8
200
9
201
0
201
1
201
2
201
3
201
4
Sq
ua
re M
etr
es
Total Building: BC: 1993-2014: Net Building in the Pipeline (NBIP): by Month: m2 (Source: StatsSA, BMI-BRSCU: BC Total RSA by Month and Type of Building: NBIP (BPP-BC): Chart 80(14))
Total Building NBIP (BPP-BC)
Total Building BC
Total Building BPP
12 per. Mov. Avg. (Total Building NBIP (BPP-BC))
12 per. Mov. Avg. (Total Building BC)
12 per. Mov. Avg. (Total Building BPP)
NBIP = 71.8%*BC
NBIP = 44.02%*BC
NBIP = 52,11%*BC
© BMI-BRSCU
TOTAL NET BUILDING IN THE PIPELINE: M2: 1993-2014 www.strategicforum.co.za
34
Total Building BC Trend-break occurred in late 2006. NBIP (m2) showing improvement (toward the 72% mark?)

© BMI-BRSCU
-500 000
500 000
1 500 000
2 500 000
3 500 000
4 500 000
5 500 000
6 500 000
7 500 000
199
3
199
4
199
5
199
6
199
7
199
8
199
9
200
0
200
1
200
2
200
3
200
4
200
5
200
6
200
7
200
8
200
9
201
0
201
1
201
2
201
3
201
4
R*1
00
0 (
Cu
rre
nt
Va
lue
s)
Total Building: BC: 1993-2014: Net Building in the Pipeline (NBIP): by Month: R*1000 (Current Values)
(Source: StatsSA, BMI-BRSCU: BC Total RSA by Month and Type of Building: NBIP (BPP-BC): Chart 81(14))
Total Building NBIP (BPP-BC)
Total Building BC
Total Building BPP
12 per. Mov. Avg. (Total Building NBIP (BPP-BC))
12 per. Mov. Avg. (Total Building BC)
12 per. Mov. Avg. (Total Building BPP)
NBIP = 87.06%*BC
NBIP = 45.25%*BC
NBIP = 65,27%*BC
© BMI-BRSCU
TOTAL NET BUILDING IN THE PIPELINE: R*1000: 1993-2014 www.strategicforum.co.za
Total BC Trend-break occurred in mid 2006. NBIP (R*1000) showing improvement( toward the 87% mark?)
Recovery is on the way. Confirmed by improving NBIP.
35

© BMI-BRSCU © BMI-BRSCU
THE STRATEGIC FORUM www.strategicforum.co.za
OUTLINE OF SENSEMAKING UPDATE 1. BUILDING PLANS PASSED AND BUILDINGS COMPLETED 1993-2013
• Trend, Current Reality 2012 and Forecast 2013 for Res, Non Res and Total BPP in m2 and Value • Trend, Current Reality 2012 and Forecast 2013 for Res, Non Res and Total BC in m2 and Value • Summary YTD % Actual and Forecast BPP, BC, Cement Sales and Local Building Lumber Sales
2. NET BUILDING IN THE PIPELINE (NBIP) • NBIP Residential, Non Residential and Total Building • YTD Forecast BC 2013 vs Actual 2012 by Segment in Number, m2 and Value • BPP and BC by Province
3. INVESTMENT IN BUILDING AND CONSTRUCTION: 2012 4. CURRENT REALITY AND OUTLOOK FOR BUILDING AND CONSTRUCTION ACTIVITY BY SECTOR AND SEGMENT: 2013 - 2020
(CURRENT 2012 VALUE) 5. CURRENT REALITY OF INVESTMENT IN BUILDING & CONSTRUCTION: 2012 6. % CHANGE IN INVESTMENT IN BUILDING & CONSTRUCTION: 2011-2020 (R MILLION) (CONSTANT 2012 VALUES) 7. INVESTMENT IN BUILDING & CONSTRUCTION: 2013-2020 (R MILLION) (CONSTANT 2012 VALUES)
INVESTMENT IN BUILDING & CONSTRUCTION:
2013-2020 (R MILLION) (CONSTANT 2012 VALUES)
36

© BMI-BRSCU © BMI-BRSCU
Current Reality and Outlook for Building and Construction Activity by
Sector and Segment: 2013 - 2020 (m2 & Constant 2013 Value)
37
Jun-14 2013 vs 2012 2014 2015 2016 2017 2018 2019 2020
MORTGAGE ADVANCES (VALUE) YTD Actual YTD FC FORECAST FORECAST FORECAST FORECAST FORECAST FORECAST FORECAST AVERAGE
Mortgage Advances on Existing Buildings 7.24% 34.36% 16.72% 4.35% 3.08% 2.34% 4.00% 5.66% 6.30% 6.89% 4.66%
Mortgage Advances on Construction of New Buildings 10.22% 99.26% 39.81% 4.88% 9.52% 5.35% 6.97% 8.60% 9.17% 9.71% 7.74%
Mortgage Advances on Vacant Land -47.57% 49.41% 85.30% 6.49% 6.99% 5.87% 5.04% 6.67% 0.00% 8.89% 5.71%
Total Gross New Mortgage Loans and Re-advances 6.49% 39.55% 19.18% 4.35% 3.08% 2.34% 4.00% 5.66% 6.30% 6.89% 4.66%
Total Mortgage Loans Outstanding 1.72% 3.32% 6.98% 4.35% 3.08% 2.34% 4.00% 5.66% 6.30% 6.89% 4.66%
Mortgage Advances Weighted Average 2.70% 11.85% 11.10% 4.36% 3.18% 2.39% 4.04% 5.71% 6.33% 6.94% 4.71%
PROGNOSIS: YTD ACTUAL VS FORECAST: GFCF
2013 vs 2012
GROSS FIXED CAPITAL FORMATION (VALUE) YTD Actual YTD FC FC 2014 FC 2015 FC 2016 FC 2017 FC 2018 FC 2019 FC 2020 AVERAGE
2.80% 0.92% 4.35% 6.10% 9.71% 5.00% 3.00% 5.50% 6.50% 8.00% 6.26%
7.97% 6.44% 8.00% 7.00% 8.50% 6.90% 4.00% 4.50% 5.00% 6.00% 5.99%
5.97% 3.37% 6.12% 6.66% 8.28% 6.19% 3.63% 4.87% 5.55% 6.74% 5.99%
6.79% 22.87% 9.82% -2.50% -2.00% 5.00% 7.50% 8.00% 8.90% 5.30% 4.31%
Gross Fixed Capital Formation Weighted Average 5.99% 12.53% 7.95% 2.48% 3.77% 5.65% 5.39% 6.30% 7.08% 6.09% 5.25%
PROGNOSIS: YTD ACTUAL VS FORECAST: BUILDING PLANS PASSED
2013 vs 2012
YTD Actual YTD FC FC 2014 FC 2015 FC 2016 FC 2017 FC 2018 FC 2019 FC 2020 AVERAGE
4.84% 3.93% 5.46% 4.53% 4.13% 3.96% 2.86% 4.02% 5.55% 5.69% 4.39%
12.47% 10.06% 8.47% 3.71% 3.91% 3.74% 2.71% 4.52% 6.07% 6.22% 4.41%
21.04% -3.24% 5.72% 20.06% 9.28% 4.91% 3.99% 4.60% 3.63% 7.26% 7.68%
28.22% 3.27% 8.94% 18.19% 9.64% 7.51% 4.64% 4.73% 4.24% 6.99% 7.99%
9.95% 1.49% 5.55% 9.92% 6.09% 4.33% 3.30% 4.25% 4.79% 6.31% 5.57%
17.71% 7.63% 8.64% 8.95% 6.16% 5.27% 3.51% 4.61% 5.30% 6.54% 5.76%
Building Plans Passed Weighted Average (m2) 9.95% 1.63% 5.55% 9.93% 6.00% 4.31% 3.28% 4.23% 4.84% 6.27% 5.55%
Building Plans Passed Weighted Average (R) 6.68% 7.68% 8.64% 8.96% 6.08% 5.19% 3.46% 4.60% 5.35% 6.52% 5.74%
PROGNOSIS: YTD ACTUAL VS FORECAST: BUILDINGS COMPLETED
2013 vs 2012 YTD Actual YTD FC FC 2014 FC 2015 FC 2016 FC 2017 FC 2018 FC 2019 FC 2020 AVERAGE
5.87% -18.92% -5.43% 5.40% 4.56% 4.39% 3.48% 4.32% 5.86% 6.01% 4.86%
14.07% -6.42% 0.43% 3.95% 4.23% 4.05% 3.25% 5.03% 6.59% 6.74% 4.83%
13.07% -16.66% -1.87% 12.30% 9.05% 5.02% 3.89% 4.43% 3.57% 6.90% 6.45%
20.23% -10.13% -0.90% 7.88% 9.23% 6.81% 4.40% 4.63% 4.12% 6.65% 6.25%
8.10% -18.19% -4.28% 7.64% 6.08% 4.61% 3.62% 4.36% 5.06% 6.32% 5.38%
16.13% -7.71% -0.03% 3.95% 4.23% 4.05% 3.25% 5.03% 6.59% 6.74% 4.83%
Buildings Completed Weighted Average (m2) 8.15% -18.18% -4.26% 7.66% 6.07% 4.60% 3.62% 4.36% 5.08% 6.31% 5.39%
Buildings Completed Weighted Average (R) 16.17% -7.69% -0.03% 4.63% 5.08% 4.53% 3.44% 4.96% 6.16% 6.73% 5.08%
PROGNOSIS: YTD ACTUAL VS FORECAST: CEMENT SALES
2013 vs 2012 YTD Actual YTD FC FC 2014 FC 2015 FC 2016 FC 2017 FC 2018 FC 2019 FC 2020 AVERAGE
DOMESTIC CEMENT SALES (Tonnes) 5.26% -5.35% -0.90% 0.32% 1.62% 4.52% 5.00% 6.00% 6.57% 5.36% 4.20%
PROGNOSIS: YTD ACTUAL VS FORECAST: LOCAL BUILDING LUMBER SALES
2013 vs 2012 YTD Actual YTD FC FC 2014 FC 2015 FC 2016 FC 2017 FC 2018 FC 2019 FC 2020 AVERAGE
0.38% 12.19% 7.00% 5.40% 4.56% 4.39% 3.48% 24.19% -11.47% 5.86% 5.20%
PROGNOSIS: YTD ACTUAL VS FORECAST BY INDICATOR
2013 vs 2012 YTD Actual YTD FC FC 2014 FC 2015 FC 2016 FC 2017 FC 2018 FC 2019 FC 2020 AVERAGE
5.94% -4.85% 1.85% 5.83% 4.56% 4.46% 3.84% 9.70% 1.26% 5.95% 5.08%
7.88% 8.37% 6.91% 5.11% 4.53% 4.44% 4.08% 5.39% 6.23% 6.57% 5.19%
Source: BMI-BRSCU
2014 vs 2013
OVERALL AVERAGE (m2)
OVERALL AVERAGE (R)
Non Residential BPP (R)
Total BPP (m2)
Total BPP (R)
Jul-14
BUILDINGS COMPLETED (BC) (m2 and value)
Jul-14
GFCF Total Building
BUILDING PLANS PASSED (BPP) (m2 and value)
Residential BPP (m2)
Total BC (m2)
Total BC (R)
Non Residential BPP (m2)
PROGNOSIS: YTD ACTUAL VS FORECAST BY SECTOR
PROGNOSIS: YTD ACTUAL VS FORECAST: MORTGAGE ADVANCES
2014 vs 2013
2014 vs 2013
2014 vs 2013
2014 vs 2013
LOCAL BUILDING LUMBER SALES (m3)
Jul-14
2014 vs 2013
Residential BC (m2)
Residential BC (R)
Non Residential BC (m2)
Non Residential BC (R)
GFCF Residential
2014 vs 2013
GFCF Non Residential
Jul-14
Jun-14
Mar-14
Residential BPP (R)
GFCF Construction

© BMI-BRSCU © BMI-BRSCU
THE STRATEGIC FORUM www.strategicforum.co.za
OUTLINE OF SENSEMAKING UPDATE 1. BUILDING PLANS PASSED AND BUILDINGS COMPLETED 1993-2013
• Trend, Current Reality 2012 and Forecast 2013 for Res, Non Res and Total BPP in m2 and Value • Trend, Current Reality 2012 and Forecast 2013 for Res, Non Res and Total BC in m2 and Value • Summary YTD % Actual and Forecast BPP, BC, Cement Sales and Local Building Lumber Sales
2. NET BUILDING IN THE PIPELINE (NBIP) • NBIP Residential, Non Residential and Total Building • YTD Forecast BC 2013 vs Actual 2012 by Segment in Number, m2 and Value • BPP and BC by Province
3. INVESTMENT IN BUILDING AND CONSTRUCTION: 2012 4. CURRENT REALITY AND OUTLOOK FOR BUILDING AND CONSTRUCTION ACTIVITY BY SECTOR AND SEGMENT: 2013 - 2020
(CURRENT 2012 VALUE) 5. CURRENT REALITY OF INVESTMENT IN BUILDING & CONSTRUCTION: 2012 6. % CHANGE IN INVESTMENT IN BUILDING & CONSTRUCTION: 2011-2020 (R MILLION) (CONSTANT 2012 VALUES) 7. INVESTMENT IN BUILDING & CONSTRUCTION: 2013-2020 (R MILLION) (CONSTANT 2012 VALUES)
INVESTMENT IN BUILDING & CONSTRUCTION:
2013-2020 (R MILLION) (CONSTANT 2012 VALUES)
38

© BMI-BRSCU © BMI-BRSCU 39
CURRENT REALITY OF INVESTMENT IN BUILDING &
CONSTRUCTION: 2013
Total Building Total Construction
Residential
Contractor (50,8%)
R 77 391
Non Residential Subcontractor (49,2%)
R 74 953
Unrec Add's and Alt's Direct to User (40%)
Large Chain BM (25%) Large Ind BM (10%)
Specialist Shop (5%) Hyper/Super Market (5%)Local Hardware Store (15%)
R 228 517
R 11 426
(Copyright) BMI-BRSCU
R 152 344
Material (60%)
R 22 852
R 91 407
R 11 426R 34 277
Indirect via Distribution (60%)
R 137 110
R 70 064
(R MILLION)
R 57 129
R 186 982
Total Bldng and Constr
R 380 861R 193 879
R 69 697
R 54 118
Labour (40%)
CURRENT REALITY OF INVESTMENT IN BUILDING AND CONSTRUCTION: YTD 2013 (DEC)

© BMI-BRSCU
CURRENT REALITY OF INVESTMENT IN BUILDING: 2013 www.strategicforum.co.za
Total Building
Residential (Excl A&A)
Contractor (50,8%)
33.53% R 39 396
Non Res (Excl A&A) Subcontractor (49,2%)
R 38 15533.78%
Add's & Alt's (Rec & Unrec) Direct to User (40%)
30.16%
R 188 979 97.47%
Large Chain BM (25%) Large Ind BM (10%)
Specialist Shop (5%) Hyper/Super Market (5%)
R 65 001 Labour (40%)
R 5 816
R 193 879 R 193 879
R 77 552
R 58 476
R 29 082
R 65 502
R 46 531
Indirect via Distribution (60%)
R 69 796 R 11 633
Local Hardware Store (15%)
R 5 816
(Copyright) BMI-BRSCU
CURRENT REALITY OF INVESTMENT IN BUILDING: YTD 2013 (DEC)
(R MILLION)
R 17 449
R 116 327
Total Building
Material (60%)

© BMI-BRSCU
CURRENT REALITY OF INVESTMENT IN CONSTRUCTION: 2013 www.strategicforum.co.za
Total Construction
Contractor (50,8%)
R 37 995
Subcontractor (49,2%)
R 36 798
Direct to User (40%)
Large Chain BM (25%) Large Ind BM (10%)
Specialist Shop (5%) Hyper/Super Market (5%)
R 11 219
Local Hardware Store (15%)
Indirect via Distribution (60%)
R 28 047 R 67 314
(Copyright) BMI-BRSCU
CURRENT REALITY OF INVESTMENT IN CONSTRUCTION: YTD 2013 (DEC)
(R MILLION)Total Construction
Labour (40%)
R 5 609 R 16 828
R 186 982
Material (60%)
R 112 189
R 74 793
R 44 876
R 5 609
R 186 982

© BMI-BRSCU © BMI-BRSCU
THE STRATEGIC FORUM www.strategicforum.co.za
OUTLINE OF SENSEMAKING UPDATE 1. BUILDING PLANS PASSED AND BUILDINGS COMPLETED 1993-2013
• Trend, Current Reality 2012 and Forecast 2013 for Res, Non Res and Total BPP in m2 and Value • Trend, Current Reality 2012 and Forecast 2013 for Res, Non Res and Total BC in m2 and Value • Summary YTD % Actual and Forecast BPP, BC, Cement Sales and Local Building Lumber Sales
2. NET BUILDING IN THE PIPELINE (NBIP) • NBIP Residential, Non Residential and Total Building • YTD Forecast BC 2013 vs Actual 2012 by Segment in Number, m2 and Value • BPP and BC by Province
3. INVESTMENT IN BUILDING AND CONSTRUCTION: 2012 4. CURRENT REALITY AND OUTLOOK FOR BUILDING AND CONSTRUCTION ACTIVITY BY SECTOR AND SEGMENT: 2013 - 2020
(CURRENT 2012 VALUE) 5. CURRENT REALITY OF INVESTMENT IN BUILDING & CONSTRUCTION: 2012 6. % CHANGE IN INVESTMENT IN BUILDING & CONSTRUCTION: 2011-2020 (R MILLION) (CONSTANT 2012 VALUES) 7. INVESTMENT IN BUILDING & CONSTRUCTION: 2013-2020 (R MILLION) (CONSTANT 2012 VALUES)
INVESTMENT IN BUILDING & CONSTRUCTION:
2013-2020 (R MILLION) (CONSTANT 2012 VALUES)
42

© BMI-BRSCU © BMI-BRSCU 43
% CHANGE IN INVESTMENT IN BUILDING & CONSTRUCTION:
2011-2020 (R MILLION) (CONSTANT 2013 VALUES)
Jun-14 2013 vs 2012 2014 2015 2016 2017 2018 2019 2020
MORTGAGE ADVANCES (VALUE) YTD Actual YTD FC FORECAST FORECAST FORECAST FORECAST FORECAST FORECAST FORECAST AVERAGE
Mortgage Advances on Existing Buildings 7.24% 34.36% 16.72% 4.35% 3.08% 2.34% 4.00% 5.66% 6.30% 6.89% 4.66%
Mortgage Advances on Construction of New Buildings 10.22% 99.26% 39.81% 4.88% 9.52% 5.35% 6.97% 8.60% 9.17% 9.71% 7.74%
Mortgage Advances on Vacant Land -47.57% 49.41% 85.30% 6.49% 6.99% 5.87% 5.04% 6.67% 0.00% 8.89% 5.71%
Total Gross New Mortgage Loans and Re-advances 6.49% 39.55% 19.18% 4.35% 3.08% 2.34% 4.00% 5.66% 6.30% 6.89% 4.66%
Total Mortgage Loans Outstanding 1.72% 3.32% 6.98% 4.35% 3.08% 2.34% 4.00% 5.66% 6.30% 6.89% 4.66%
Mortgage Advances Weighted Average 2.70% 11.85% 11.10% 4.36% 3.18% 2.39% 4.04% 5.71% 6.33% 6.94% 4.71%
PROGNOSIS: YTD ACTUAL VS FORECAST: GFCF
2013 vs 2012
GROSS FIXED CAPITAL FORMATION (VALUE) YTD Actual YTD FC FC 2014 FC 2015 FC 2016 FC 2017 FC 2018 FC 2019 FC 2020 AVERAGE
2.80% 0.92% 4.35% 6.10% 9.71% 5.00% 3.00% 5.50% 6.50% 8.00% 6.26%
7.97% 6.44% 8.00% 7.00% 8.50% 6.90% 4.00% 4.50% 5.00% 6.00% 5.99%
5.97% 3.37% 6.12% 6.66% 8.28% 6.19% 3.63% 4.87% 5.55% 6.74% 5.99%
6.79% 22.87% 9.82% -2.50% -2.00% 5.00% 7.50% 8.00% 8.90% 5.30% 4.31%
Gross Fixed Capital Formation Weighted Average 5.99% 12.53% 7.95% 2.48% 3.77% 5.65% 5.39% 6.30% 7.08% 6.09% 5.25%
PROGNOSIS: YTD ACTUAL VS FORECAST: BUILDING PLANS PASSED
2013 vs 2012
YTD Actual YTD FC FC 2014 FC 2015 FC 2016 FC 2017 FC 2018 FC 2019 FC 2020 AVERAGE
4.84% 3.93% 5.46% 4.53% 4.13% 3.96% 2.86% 4.02% 5.55% 5.69% 4.39%
12.47% 10.06% 8.47% 3.71% 3.91% 3.74% 2.71% 4.52% 6.07% 6.22% 4.41%
21.04% -3.24% 5.72% 20.06% 9.28% 4.91% 3.99% 4.60% 3.63% 7.26% 7.68%
28.22% 3.27% 8.94% 18.19% 9.64% 7.51% 4.64% 4.73% 4.24% 6.99% 7.99%
9.95% 1.49% 5.55% 9.92% 6.09% 4.33% 3.30% 4.25% 4.79% 6.31% 5.57%
17.71% 7.63% 8.64% 8.95% 6.16% 5.27% 3.51% 4.61% 5.30% 6.54% 5.76%
Building Plans Passed Weighted Average (m2) 9.95% 1.63% 5.55% 9.93% 6.00% 4.31% 3.28% 4.23% 4.84% 6.27% 5.55%
Building Plans Passed Weighted Average (R) 6.68% 7.68% 8.64% 8.96% 6.08% 5.19% 3.46% 4.60% 5.35% 6.52% 5.74%
PROGNOSIS: YTD ACTUAL VS FORECAST: BUILDINGS COMPLETED
2013 vs 2012 YTD Actual YTD FC FC 2014 FC 2015 FC 2016 FC 2017 FC 2018 FC 2019 FC 2020 AVERAGE
5.87% -18.92% -5.43% 5.40% 4.56% 4.39% 3.48% 4.32% 5.86% 6.01% 4.86%
14.07% -6.42% 0.43% 3.95% 4.23% 4.05% 3.25% 5.03% 6.59% 6.74% 4.83%
13.07% -16.66% -1.87% 12.30% 9.05% 5.02% 3.89% 4.43% 3.57% 6.90% 6.45%
20.23% -10.13% -0.90% 7.88% 9.23% 6.81% 4.40% 4.63% 4.12% 6.65% 6.25%
8.10% -18.19% -4.28% 7.64% 6.08% 4.61% 3.62% 4.36% 5.06% 6.32% 5.38%
16.13% -7.71% -0.03% 3.95% 4.23% 4.05% 3.25% 5.03% 6.59% 6.74% 4.83%
Buildings Completed Weighted Average (m2) 8.15% -18.18% -4.26% 7.66% 6.07% 4.60% 3.62% 4.36% 5.08% 6.31% 5.39%
Buildings Completed Weighted Average (R) 16.17% -7.69% -0.03% 4.63% 5.08% 4.53% 3.44% 4.96% 6.16% 6.73% 5.08%
PROGNOSIS: YTD ACTUAL VS FORECAST: CEMENT SALES
2013 vs 2012 YTD Actual YTD FC FC 2014 FC 2015 FC 2016 FC 2017 FC 2018 FC 2019 FC 2020 AVERAGE
DOMESTIC CEMENT SALES (Tonnes) 5.26% -5.35% -0.90% 0.32% 1.62% 4.52% 5.00% 6.00% 6.57% 5.36% 4.20%
PROGNOSIS: YTD ACTUAL VS FORECAST: LOCAL BUILDING LUMBER SALES
2013 vs 2012 YTD Actual YTD FC FC 2014 FC 2015 FC 2016 FC 2017 FC 2018 FC 2019 FC 2020 AVERAGE
0.38% 12.19% 7.00% 5.40% 4.56% 4.39% 3.48% 24.19% -11.47% 5.86% 5.20%
PROGNOSIS: YTD ACTUAL VS FORECAST BY INDICATOR
2013 vs 2012 YTD Actual YTD FC FC 2014 FC 2015 FC 2016 FC 2017 FC 2018 FC 2019 FC 2020 AVERAGE
5.94% -4.85% 1.85% 5.83% 4.56% 4.46% 3.84% 9.70% 1.26% 5.95% 5.08%
7.88% 8.37% 6.91% 5.11% 4.53% 4.44% 4.08% 5.39% 6.23% 6.57% 5.19%
Source: BMI-BRSCU
2014 vs 2013
OVERALL AVERAGE (m2)
OVERALL AVERAGE (R)
Non Residential BPP (R)
Total BPP (m2)
Total BPP (R)
Jul-14
BUILDINGS COMPLETED (BC) (m2 and value)
Jul-14
GFCF Total Building
BUILDING PLANS PASSED (BPP) (m2 and value)
Residential BPP (m2)
Total BC (m2)
Total BC (R)
Non Residential BPP (m2)
PROGNOSIS: YTD ACTUAL VS FORECAST BY SECTOR
PROGNOSIS: YTD ACTUAL VS FORECAST: MORTGAGE ADVANCES
2014 vs 2013
2014 vs 2013
2014 vs 2013
2014 vs 2013
LOCAL BUILDING LUMBER SALES (m3)
Jul-14
2014 vs 2013
Residential BC (m2)
Residential BC (R)
Non Residential BC (m2)
Non Residential BC (R)
GFCF Residential
2014 vs 2013
GFCF Non Residential
Jul-14
Jun-14
Mar-14
Residential BPP (R)
GFCF Construction
Average growth over the next 7 years looks
good . . .

© BMI-BRSCU © BMI-BRSCU
THE STRATEGIC FORUM www.strategicforum.co.za
OUTLINE OF SENSEMAKING UPDATE 1. BUILDING PLANS PASSED AND BUILDINGS COMPLETED 1993-2013
• Trend, Current Reality 2012 and Forecast 2013 for Res, Non Res and Total BPP in m2 and Value • Trend, Current Reality 2012 and Forecast 2013 for Res, Non Res and Total BC in m2 and Value • Summary YTD % Actual and Forecast BPP, BC, Cement Sales and Local Building Lumber Sales
2. NET BUILDING IN THE PIPELINE (NBIP) • NBIP Residential, Non Residential and Total Building • YTD Forecast BC 2013 vs Actual 2012 by Segment in Number, m2 and Value • BPP and BC by Province
3. INVESTMENT IN BUILDING AND CONSTRUCTION: 2012 4. CURRENT REALITY AND OUTLOOK FOR BUILDING AND CONSTRUCTION ACTIVITY BY SECTOR AND SEGMENT: 2013 - 2020
(CURRENT 2012 VALUE) 5. CURRENT REALITY OF INVESTMENT IN BUILDING & CONSTRUCTION: 2012 6. % CHANGE IN INVESTMENT IN BUILDING & CONSTRUCTION: 2011-2020 (R MILLION) (CONSTANT 2012 VALUES) 7. INVESTMENT IN BUILDING & CONSTRUCTION: 2013-2020 (R MILLION) (CONSTANT 2012 VALUES)
INVESTMENT IN BUILDING & CONSTRUCTION:
2013-2020 (R MILLION) (CONSTANT 2012 VALUES)
44

© BMI-BRSCU © BMI-BRSCU 45
INVESTMENT IN BUILDING & CONSTRUCTION:
2014-2020 (R MILLION) (CONSTANT 2013 VALUES)
2014-2020 Average
R*Million R*Million % %
25 989 3 713 1.61% 0.85%
126 331 18 047 7.81% 4.11%
67 828 9 690 4.19% 2.21%
4 979 711 0.31% 0.16%
59 374 8 482 3.67% 1.93%
194 217 27 745 12.01% 6.32%
34 926 4 989 2.16% 1.14%
414 59 0.03% 0.01%
50 195 7 171 3.10% 1.63%
564 253 80 608 34.89% 18.37%
27 629 3 947 1.71% 0.90%
40 202 5 743 2.49% 1.31%
35 535 5 076 2.20% 1.16%
9 691 1 384 0.60% 0.32%
52 564 7 509 3.25% 1.71%
169 760 24 251 10.50% 5.53%
40 540 5 791 2.51% 1.32%
253 367 36 195
629 287 89 898 38.91% 20.48%
359 960 51 423 22.26% 11.72%
63 684 9 098 3.94% 2.07%
1 617 183 231 026 100.00% 52.64%
670 484 95 78346.08% 21.82%
510 541 72 93435.09% 16.62%
273 932 39 133 18.83% 8.92%
1 454 957 181 870 100.00% 47.36%
3 072 139 384 017 100.00%
1 152 052
1 920 087
3 840 174
©BMI-BRSCU
Unrecorded Res Add's and Alt's
Unrecorded Non Res Add's and Alt's
GRAND TOTAL
CONSTRUCTION
General Government
Public Corporations
Private Business Enterprises
TOTAL NON RESIDENTIAL
Shops
Industrial & warehouse
Other
Additions & Alterations
PUBLIC NON-RESIDENTIAL
Public authorities.
Private Business Enterprises
TOTAL RESIDENTIAL
PRIVATE NON-RESIDENTIAL
Offices
Additions & alterations
General government
Public corporations
Private business enterprises
TOTAL CONSTRUCTION
TOTAL BLDNG AND CONSTR
3 years (2013-2015)
5 years (2013-2017)
8 years (2013-2020)
INVESTMENT IN BUILDING & CONSTRUCTION: 2014-2020: LMR SOYUZ SCENARIO
SECTOR AND SEGMENT
PRIVATE RESIDENTIAL
Dwelling-houses < 80 m2
Dwelling-houses > 80 m2
Townhouses & Flats
Other (Incl. hotels & casinos)
Affordable Housing
General Government
PUBLIC RESIDENTIAL
Investment in Building and
Construction over the next
3 years will be some
R1,15 Trillion . . .

© BMI-BRSCU © BMI-BRSCU
THE STRATEGIC FORUM
A place of assembly
for strategic conversations
THE STRATEGIC FORUM www.strategicforum.co.za
BMI
Studium Ad Prosperandum
Voluntas in Conveniendum
BUILDING RESEARCH
STRATEGY CONSULTING
UNIT cc
Reg. No. 2002/105109/23
•BMI
Studium Ad Prosperandum
Voluntas in Conveniendum
BUILDING RESEARCH
STRATEGY CONSULTING
UNIT cc
•BMI
•BMI
•BMI
•BMI
Studium Ad Prosperandum
Voluntas in Conveniendum
BUILDING RESEARCH
STRATEGY CONSULTING
UNIT cc
Reg. No. 2002/105109/23
•BMI
Studium Ad Prosperandum
Voluntas in Conveniendum
BUILDING RESEARCH
STRATEGY CONSULTING
UNIT cc
•BMI
•BMI
•BMI
•BMI
•BMI
•BMI
•
46
Sense making Update:
Year To Date 2014 (June 2014) Dr. Llewellyn B. Lewis