BMC Evolutionary Biology BioMed - BioMed Central | The Open
20
BioMed Central Page 1 of 20 (page number not for citation purposes) BMC Evolutionary Biology Open Access Research article Eumalacostracan phylogeny and total evidence: limitations of the usual suspects Ronald A Jenner*, Ciara Ní Dhubhghaill, Matteo P Ferla and Matthew A Wills Address: Department of Biology and Biochemistry, University of Bath, The Avenue, Claverton Down, Bath, BA2 7AY, UK Email: Ronald A Jenner* - [email protected]; Ciara Ní Dhubhghaill - [email protected]; Matteo P Ferla - [email protected]; Matthew A Wills - [email protected] * Corresponding author Abstract Background: The phylogeny of Eumalacostraca (Crustacea) remains elusive, despite over a century of interest. Recent morphological and molecular phylogenies appear highly incongruent, but this has not been assessed quantitatively. Moreover, 18S rRNA trees show striking branch length differences between species, accompanied by a conspicuous clustering of taxa with similar branch lengths. Surprisingly, previous research found no rate heterogeneity. Hitherto, no phylogenetic analysis of all major eumalacostracan taxa (orders) has either combined evidence from multiple loci, or combined molecular and morphological evidence. Results: We combined evidence from four nuclear ribosomal and mitochondrial loci (18S rRNA, 28S rRNA, 16S rRNA, and cytochrome c oxidase subunit I) with a newly synthesized morphological dataset. We tested the homogeneity of data partitions, both in terms of character congruence and the topological congruence of inferred trees. We also performed Bayesian and parsimony analyses on separate and combined partitions, and tested the contribution of each partition. We tested for potential long-branch attraction (LBA) using taxon deletion experiments, and with relative rate tests. Additionally we searched for molecular polytomies (spurious clades). Lastly, we investigated the phylogenetic stability of taxa, and assessed their impact on inferred relationships over the whole tree. We detected significant conflict between data partitions, especially between morphology and molecules. We found significant rate heterogeneity between species for both the 18S rRNA and combined datasets, introducing the possibility of LBA. As a test case, we showed that LBA probably affected the position of Spelaeogriphacea in the combined molecular evidence analysis. We also demonstrated that several clades, including the previously reported and surprising clade of Amphipoda plus Spelaeogriphacea, are 'supported' by zero length branches. Furthermore we showed that different sets of taxa have the greatest impact upon the relationships within molecular versus morphological trees. Conclusion: Rate heterogeneity and conflict between data partitions mean that existing molecular and morphological evidence is unable to resolve a well-supported eumalacostracan phylogeny. We believe that it will be necessary to look beyond the most commonly utilized sources of data (nuclear ribosomal and mitochondrial sequences) to obtain a robust tree in the future. Published: 27 January 2009 BMC Evolutionary Biology 2009, 9:21 doi:10.1186/1471-2148-9-21 Received: 18 August 2008 Accepted: 27 January 2009 This article is available from: http://www.biomedcentral.com/1471-2148/9/21 © 2009 Jenner et al; licensee BioMed Central Ltd. This is an Open Access article distributed under the terms of the Creative Commons Attribution License (http://creativecommons.org/licenses/by/2.0 ), which permits unrestricted use, distribution, and reproduction in any medium, provided the original work is properly cited.
Transcript of BMC Evolutionary Biology BioMed - BioMed Central | The Open

BioMed CentralBMC Evolutionary Biology
ss
Open AcceResearch articleEumalacostracan phylogeny and total evidence: limitations of the usual suspectsRonald A Jenner*, Ciara Ní Dhubhghaill, Matteo P Ferla and Matthew A WillsAddress: Department of Biology and Biochemistry, University of Bath, The Avenue, Claverton Down, Bath, BA2 7AY, UK
Email: Ronald A Jenner* - [email protected]; Ciara Ní Dhubhghaill - [email protected]; Matteo P Ferla - [email protected]; Matthew A Wills - [email protected]
* Corresponding author
AbstractBackground: The phylogeny of Eumalacostraca (Crustacea) remains elusive, despite over acentury of interest. Recent morphological and molecular phylogenies appear highly incongruent,but this has not been assessed quantitatively. Moreover, 18S rRNA trees show striking branchlength differences between species, accompanied by a conspicuous clustering of taxa with similarbranch lengths. Surprisingly, previous research found no rate heterogeneity. Hitherto, nophylogenetic analysis of all major eumalacostracan taxa (orders) has either combined evidence frommultiple loci, or combined molecular and morphological evidence.
Results: We combined evidence from four nuclear ribosomal and mitochondrial loci (18S rRNA,28S rRNA, 16S rRNA, and cytochrome c oxidase subunit I) with a newly synthesized morphologicaldataset. We tested the homogeneity of data partitions, both in terms of character congruence andthe topological congruence of inferred trees. We also performed Bayesian and parsimony analyseson separate and combined partitions, and tested the contribution of each partition. We tested forpotential long-branch attraction (LBA) using taxon deletion experiments, and with relative ratetests. Additionally we searched for molecular polytomies (spurious clades). Lastly, we investigatedthe phylogenetic stability of taxa, and assessed their impact on inferred relationships over thewhole tree. We detected significant conflict between data partitions, especially betweenmorphology and molecules. We found significant rate heterogeneity between species for both the18S rRNA and combined datasets, introducing the possibility of LBA. As a test case, we showedthat LBA probably affected the position of Spelaeogriphacea in the combined molecular evidenceanalysis. We also demonstrated that several clades, including the previously reported and surprisingclade of Amphipoda plus Spelaeogriphacea, are 'supported' by zero length branches. Furthermorewe showed that different sets of taxa have the greatest impact upon the relationships withinmolecular versus morphological trees.
Conclusion: Rate heterogeneity and conflict between data partitions mean that existing molecularand morphological evidence is unable to resolve a well-supported eumalacostracan phylogeny. Webelieve that it will be necessary to look beyond the most commonly utilized sources of data(nuclear ribosomal and mitochondrial sequences) to obtain a robust tree in the future.
Published: 27 January 2009
BMC Evolutionary Biology 2009, 9:21 doi:10.1186/1471-2148-9-21
Received: 18 August 2008Accepted: 27 January 2009
This article is available from: http://www.biomedcentral.com/1471-2148/9/21
© 2009 Jenner et al; licensee BioMed Central Ltd. This is an Open Access article distributed under the terms of the Creative Commons Attribution License (http://creativecommons.org/licenses/by/2.0), which permits unrestricted use, distribution, and reproduction in any medium, provided the original work is properly cited.
Page 1 of 20(page number not for citation purposes)
BMC Evolutionary Biology 2009, 9:21 http://www.biomedcentral.com/1471-2148/9/21
BackgroundAttempts to infer the phylogeny of eumalacostracans havebeen high on the agenda of systematic zoology at least "[s]ince the awakening in natural science which followedthe publication of the Origin of species" [1]. This is unsur-prising, firstly because several of the most influential zool-ogists of the late 19th and early 20th century werecarcinologists, and secondly because the erstwhile 'higherCrustacea' houses the majority of economically and com-mercially important species of edible crabs, shrimps, andlobsters. What is surprising, however, is that in the 21st
century, when considerable resources are being directedtowards "assembling the tree of life", no major initiativeis focused on resolving relationships within this, the mostdiverse of all crustacean clades [2]. By contrast, relativelylarge programs are underway to tackle both broader (e.g.,arthropod phylogeny: NSF DEB-0120635, awarded to C.Cunningham, J. Martin, J. Regier, J. Thorne, and J. Shultz)and more narrow (e.g., decapod relationships; NSFawards DEB-EF-0531603 (F. Felder), DEB-EF-0531616 (J.Martin), DEB-EF-0531670 (R. Feldmann and C. Sch-weitzer) and DEB-EF-0531762 (K. A. Crandall and N.Hanegan)) phylogenetic problems. A concerted effort toresolve eumalacostracan phylogeny would complementthese efforts, providing a valuable supplement andbroader interpretative framework, respectively.
The ongoing development of faster and cheaper DNAsequencing techniques, coupled with advances in analyti-cal methods, are encouraging researchers to revisit old andrecalcitrant phylogenetic problems. Before embarking onsuch a revision for the Malacostraca, it is thereforeextremely timely to take stock of the present state ofknowledge by synthesizing and analyzing all of the pres-ently available data. This is necessary for several reasons.
Firstly, there is still no robust consensus on malacostracanphylogeny, despite recent and comprehensive analyses ofmorphological and molecular data [3-6]. Although thereis some congruence between the latest morphologicalanalyses, some striking incongruities are present as well[3,4]. Here, we discuss critically some of the most strikingunresolved issues, and integrate previously publishedmorphological data sets [3,4,7-9] into a new matrix.
Secondly, molecular approaches to eumalacostracan rela-tionships are still in their infancy. Although sequence datahave been applied to a variety of taxonomically restrictedquestions [10,11], only two studies were based on suffi-cient taxon sampling to be able to focus on resolving themajor relationships between the traditional higher-levelmalacostracan taxa [5,6]. In addition, several studies ofdeeper arthropod phylogeny [12-15] have included smallnumbers of representative eumalacostracans, but taxonsampling is too sparse to interpret these results straightfor-
wardly. The two comprehensive studies aimed explicitly atresolving eumalacostracan phylogeny are based on 18SrRNA [5,6]. However, potential problems with these anal-yses, such as long-branch attraction, and the availabilityof new sequences of 28S rRNA, 16S rRNA, and cyto-chrome c oxidase subunit I for previously unsampled taxa,make a multilocus re-evaluation of eumalacostracan phy-logeny opportune.
Thirdly, a comparison of the morphological and molecu-lar phylogenies of Eumalacostraca reveals a number of"puzzling" [5] or even "disturbing" [3] conflicts that haveso far evaded satisfactory explanation, or testing in a totalevidence framework. These conflicts are easily revealed bya topological comparison of the molecular and morpho-logical cladograms, but we perform the first quantitativetest of whether morphology and molecules present signif-icantly different signals.
The two most recent and most comprehensive morpho-logical phylogenetic analyses of eumalacostracan phylog-eny are Richter & Scholtz (2001) [4] and Poore (2005) [3].These studies evaluated and synthesized previous evi-dence for malacostracan phylogeny, and agree on the fol-lowing:
• Peracarida including Thermosbaenacea (= Pancarida) ismonophyletic
• Mysidacea is monophyletic
• Mictacea and Spelaeogriphacea are sister taxa
In contrast, these studies disagree about the positions ofDecapoda, Euphausiacea, Mysidacea, Cumacea, Tanaida-cea, and Isopoda. However, because Poore (2005) [3]focused on resolving peracarid relationships while Richter& Scholtz (2001) [4] had the broader remit of malacostra-can phylogeny, these studies are not strictly comparable.
Poore (2005: 2) [3] stated that his morphological data setwas "essentially a compilation of those [morphologicalcharacters] used previously but with additions", whichleads to the reasonable expectation that Poore's analysisshould be the most severe morphological test of peracarid(and possibly wider eumalacostracan) phylogeny pub-lished to date. We note, however, that Poore chose not toincorporate several characters from Richter & Scholtz(2001) [4], including some that he conceded were "themost significant" to bear on certain relationships withinthe wider Eumalacostraca. These were excluded, quite rea-sonably, because they did not contribute specifically toresolving peracarid relationships. All have been reinstatedin the present analyses.
Page 2 of 20(page number not for citation purposes)

BMC Evolutionary Biology 2009, 9:21 http://www.biomedcentral.com/1471-2148/9/21
We synthesized the character sets of Richter & Scholtz(2001) and Poore (2005) [3,4] with those of previousworks [4,8,9,16] as well as newly published informationto derive a revised morphological hypothesis of malacos-tracan phylogeny.
Published molecular phylogenies focusing expressly oneumalacostracan relationships are derived from 28S rRNAand 18S rRNA sequences [5,6,10,15]. Congruencebetween these is limited, partly because of differences intaxon sampling, but also (as we show here), because thetwo molecules contain conflicting signals that are notstrong enough to resolve relationships at all levels. How-ever, 28S rRNA and 18S rRNA do agree that:
• Mysids are more closely related to euphausiaceans andstomatopods than to the other peracarids
• Isopods and amphipods are not sister taxa
• Decapods, euphausiaceans and stomatopods may bepart of a clade separate from the peracarids
The phylogenetic positions of all other taxa are highly var-iable. Different analytical methods yield different trees[5,15], all of which have very low levels of clade support.
One striking aspect of the 18S rRNA trees in Spears et al.(2005) [5] and Meland & Willassen (2007) [6] is the largedifference in branch lengths. All peracarid branches, (withthe exception of those of Mysida), appear to be signifi-cantly longer than those of the non-peracarid malacostra-cans. Particularly noteworthy is the clade of Amphipodaand Spelaeogriphacea, which is supported by both stud-ies, but which lacks any known morphological support[3,5]. This anomalous clade groups the most divergentsequences included in these studies, leading us to suspectlong-branch attraction (LBA). Although Meland & Willas-sen (2007) [6] did not discuss the possibility of LBA,Spears et al. (2005) [5] dismissed it. Our reinvestigationsuggests that LBA may, in fact, be a significant problem.
The most striking result of the recent literature is theapparent conflict between morphology [3,4,8,9,16-18]and molecules [5,6,10,11]. This implies significant homo-plasy in either molecular or morphological evidence (orboth). The only sister group relationship to receive inde-pendent support from molecules and morphology is thatbetween Euphausiacea and Decapoda (Eucarida). Evenso, this clade is contradicted by several other morpholog-ical and molecular phylogenetic analyses. Consideringclade membership rather than sister groupings admits afew more areas of agreement. For example, some studiespresent molecular and morphological support for a cladecomprising Cumacea, Isopoda, and Tanaidacea.
The most striking differences between molecular (princi-pally 18S rRNA) and morphological (principally Richter& Scholtz 2001 and Poore 2005 [3,4]) trees, respectively,are the following:
• Monophyly vs. polyphyly of Mysidacea
• Monophyly vs. polyphyly of Peracarida (through exclu-sion of Mysida from Peracarida)
• Absence vs. presence of a clade minimally including Sto-matopoda, Euphausiacea and Mysida
• Absence vs. presence of a clade minimally includingAmphipoda, Spelaeogriphacea and Lophogastrida
In this paper we combine, for the first time, moleculardata from four nuclear and mitochondrial loci (18S rRNA,28S rRNA, 16S rRNA, cytochrome c oxidase subunit I)along with morphological evidence for higher-leveleumalacostracan relationships. Among other things, thisrepresents the first test of the phylogenetic position ofBathynellacea and the monophyly of Syncarida usingcombined molecular evidence (16S rRNA and cyto-chrome c oxidase subunit I) [11,19]. The combined dis-cussions and results presented in this paper should bevaluable as a guide to any future phylogenetic analysis ofthis diverse clade. They reveal the limitations of publishedevidence, and highlight where understanding is lacking.
MethodsMorphologyWe synthesized a new morphological cladistic dataset byintegrating previous matrices (additional files 1, 2) [3,4,7-9,16]. The data sets of Wills (1997, 1998) [7,9] andSchram and Hof (1998) [16] were originally compiled toaddress wider questions of crustacean phylogeny. Inremoving most non-malacostracan taxa (with the excep-tion of an outgroup comprising Leptostraca, Anostraca,Notostraca and Brachypoda) a number of characters wererendered uninformative for the residual taxon sample.Other additive (or "ordered") characters had "intermedi-ate" states removed, and were therefore recoded to reflectonly those states present in the remaining sample. Poore's(2005) [3] data set contained a restricted sample of non-peracarid malacostracans, such that additional taxa werecoded for some characters. Groups represented in Poore(2005) [3] by more than one OTU (Mictacea and Spe-laeogriphacea) were recoded as polymorphic taxa. Pires(1987) [8] did not present a matrix as such, and mostcharacters were subsumed within those of later authors.More generally, characters represented in two or morematrices were coded to reflect the most recent study. Wehave typically coded limited uncertainty and polymorphicstates rather than introducing assumptions regarding the
Page 3 of 20(page number not for citation purposes)

BMC Evolutionary Biology 2009, 9:21 http://www.biomedcentral.com/1471-2148/9/21
groundplans for our terminals. Characters relating tonumbers of podomeres have generally been coded toreflect all of the variation between orders. Many crusta-cean orders contain exemplars in which given rami forgiven appendages may be either reduced (one or twopodomeres) or absent altogether. For this reason, we havepredominantly included "zero podomeres" as a statewithin characters coding for podomere numbers. Thealternative would be to introduce an additional characterfor the presence or absence of a given ramus, with"podomere" characters coded as inapplicable for termi-nals lacking the ramus. Possible ordering and weightingschemes for such characters have been discussed else-where in detail [9], and similar principles have beenapplied here. In some analyses, therefore, characters relat-ing to numbers of limb elements (podomeres, endites,etc.) and numbers of somites have been ordered, whilethose relating to numbers of limb elements have also beenscaled to unit weight.
MoleculesSpears et al. (2005) and Meland & Willassen (2007) [5,6]have published the most comprehensively sampledmolecular phylogenies of the higher-level taxa withinMalacostraca (14 of the 15 recognised, excludingBathynellacea). Both analyses are based on 18S rRNA. Incontrast, Jarman et al. (2000) [10] included just 10 of the15 recognized higher-level taxa in the first phylogeneticanalysis of Malacostraca based on 28S rRNA. Subsequentmore inclusive analyses of wider arthropod relationshipshave generally included a more restricted sample of mala-costracan higher-level taxa [12-15].
Taxon selectionOur choice of taxa was dictated by several considerations.Firstly, we started with the aligned 18S rRNA dataset ofMeland & Willassen (2007) [6] facilitating a direct com-parison with this study and that of Spears et al. (2005) [5](additional file 3).
Secondly, we concatenated the data partitions for 18SrRNA, 28S rRNA, 16S rRNA, cytochrome c oxidase subunitI, and morphology (additional files 4, 5, 6, 7, 8). In orderto maximize data density per taxon we created composite(chimerical) higher-level terminals for several taxa (seeTable 1), which is a reasonable strategy in multilocus andphylogenomic analyses [20,21]. For composites, weincluded the most closely related species available, usinggeneric (or higher when necessary) membership as prox-ies for relatedness. This strategy should not distort phylo-genetic analyses, provided the composite taxa arecertifiably monophyletic with respect to the others sam-pled [22]. This is well supported for the terminals usedhere [4]. We acknowledge that this strategy precludes test-ing explicitly the validity of our assumed monophyla.
Some authors therefore prefer not to amalgamate, despitethe introduction of large amounts of "missing data" [23].Although missing data can reduce consensus resolution, itdoes not necessarily yield spurious relationships [24].
Thirdly, for taxa with multiple representative species weexcluded most of those with data for just one or two loci.This explains why we sometimes included fewer repre-sentatives of certain groups (e.g., Tanaidacea, Mysida,Lophogastrida, and Decapoda) than Meland & Willassen(2007) [6]. The problematic and rarely-sampled ordersMictacea and Spelaeogriphacea were included on thebasis of 18S rRNA data alone, while Bathynellacea wasrepresented by 16S rRNA and cytochrome c oxidase subu-nit I data. Stygiomysis was excluded. Again, we note thatthe inclusion of missing data need not obfuscate or distortinferred relationships [24]. Moreover, missing data is notthe only thing with the potential to influence trees: smalldifferences in taxon or character sampling can have radi-cal effects [25]. Hence, there are two issues. The first iswhether the removal of taxa that share few characters withthe majority of the others will result in a different tree. Thesecond is whether these same taxa are themselves resolvedin a misleading position. The first issue was addressed, atleast in part, by first order jackknifing. This would demon-strate that both Mictacea and Bathynellacea could beremoved from the parsimony analysis, with no effectupon the relationships of the remaining terminals.Removal of the Spelaeogriphacea had a small, localizedeffect, with no implications for the positions of Mictaceaor Bathynellacea. We also investigated this in the Bayesiananalyses, with a similar outcome. Removal of Spelaeog-riphacea left the topology of the combined molecularanalysis unchanged, while removal of Bathynellacea onlyaffected the position of the Mictacea (shifting it down thetree by two nodes that lacked significant support). Thesecond issue – testing the placement of these taxa – canonly be addressed by collecting more data: filling in thegaps or sequencing new genes. However, this is true forany phylogenetic hypothesis, irrespective of putative miss-ing data problems.
Fourthly, we reduced the number of species in the com-bined molecular and morphological evidence analyses sothat each OTU was represented by a single taxon. This wasdone to prevent the results from being affected by the rep-licated morphological ground patterns, which wouldstrongly bias the analyses in favour of the monophyly ofthe higher taxa with multiple representative species.
For the molecular and combined evidence analyses wedesignated Leptostraca as the outgroup. There is generalconsensus in the malacostracan literature that leptostra-cans are the sister group to the remaining malacostracans,and the monophyly of Eumalacostraca is well supported
Page 4 of 20(page number not for citation purposes)
BMC Evolutionary Biology 2009, 9:21 http://www.biomedcentral.com/1471-2148/9/21
by morphology [4]. This is also supported by some largerscale molecular and combined evidence analyses[13,15,26].
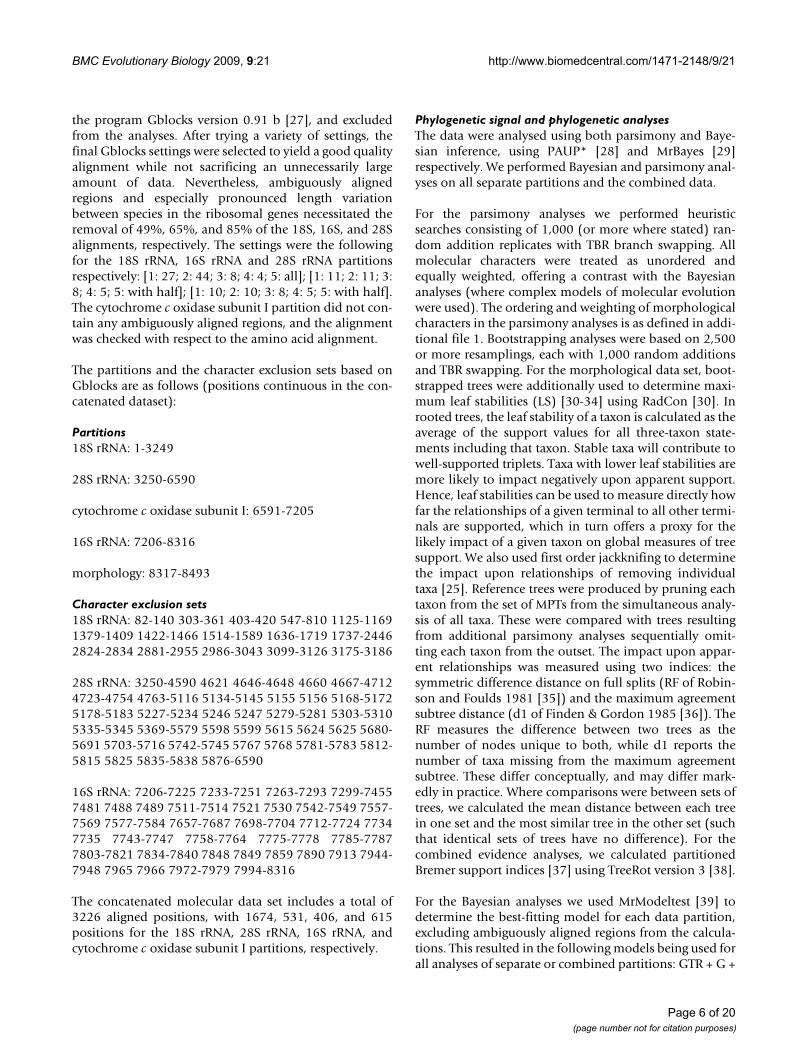
Data partitions and alignmentsAll sequences (except 18S rRNA sequences, which werekindly provided by K. Meland), were downloaded from
the GenBank, National Center for Biotechnology Infor-mation (NCBI) (see Table 1 for accession numbers), andwith the exception of the 18S rRNA data, were alignedonline with T-coffee http://www.tcoffee.org. For the 18SrRNA data we used the alignment of Meland & Willassen(2007) [6], which incorporates secondary structure infor-mation. Ambiguously aligned regions were determined by
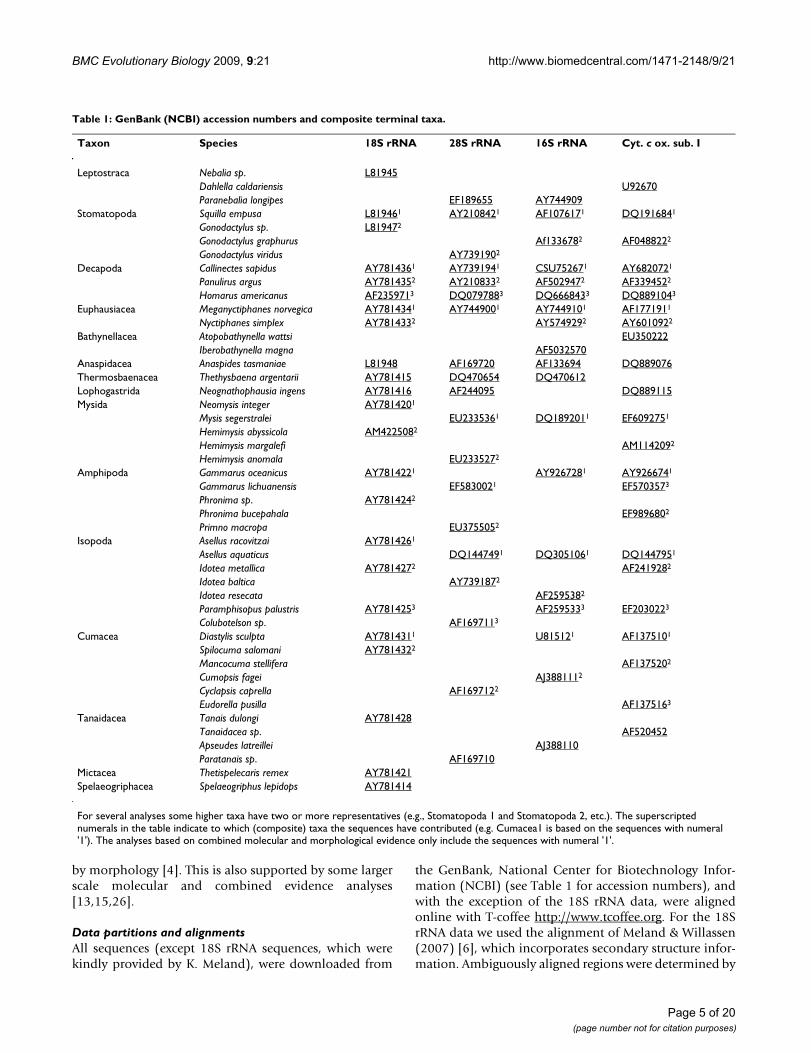
Table 1: GenBank (NCBI) accession numbers and composite terminal taxa.
Taxon Species 18S rRNA 28S rRNA 16S rRNA Cyt. c ox. sub. I
Leptostraca Nebalia sp. L81945Dahlella caldariensis U92670Paranebalia longipes EF189655 AY744909
Stomatopoda Squilla empusa L819461 AY2108421 AF1076171 DQ1916841
Gonodactylus sp. L819472
Gonodactylus graphurus Af1336782 AF0488222
Gonodactylus viridus AY7391902
Decapoda Callinectes sapidus AY7814361 AY7391941 CSU752671 AY6820721
Panulirus argus AY7814352 AY2108332 AF5029472 AF3394522
Homarus americanus AF2359713 DQ0797883 DQ6668433 DQ8891043
Euphausiacea Meganyctiphanes norvegica AY7814341 AY7449001 AY7449101 AF1771911
Nyctiphanes simplex AY7814332 AY5749292 AY6010922
Bathynellacea Atopobathynella wattsi EU350222Iberobathynella magna AF5032570
Anaspidacea Anaspides tasmaniae L81948 AF169720 AF133694 DQ889076Thermosbaenacea Thethysbaena argentarii AY781415 DQ470654 DQ470612Lophogastrida Neognathophausia ingens AY781416 AF244095 DQ889115Mysida Neomysis integer AY7814201
Mysis segerstralei EU2335361 DQ1892011 EF6092751
Hemimysis abyssicola AM4225082
Hemimysis margalefi AM1142092
Hemimysis anomala EU2335272
Amphipoda Gammarus oceanicus AY7814221 AY9267281 AY9266741
Gammarus lichuanensis EF5830021 EF5703573
Phronima sp. AY7814242
Phronima bucepahala EF9896802
Primno macropa EU3755052
Isopoda Asellus racovitzai AY7814261
Asellus aquaticus DQ1447491 DQ3051061 DQ1447951
Idotea metallica AY7814272 AF2419282
Idotea baltica AY7391872
Idotea resecata AF2595382
Paramphisopus palustris AY7814253 AF2595333 EF2030223
Colubotelson sp. AF1697113
Cumacea Diastylis sculpta AY7814311 U815121 AF1375101
Spilocuma salomani AY7814322
Mancocuma stellifera AF1375202
Cumopsis fagei AJ3881112
Cyclapsis caprella AF1697122
Eudorella pusilla AF1375163
Tanaidacea Tanais dulongi AY781428Tanaidacea sp. AF520452Apseudes latreillei AJ388110Paratanais sp. AF169710
Mictacea Thetispelecaris remex AY781421Spelaeogriphacea Spelaeogriphus lepidops AY781414
For several analyses some higher taxa have two or more representatives (e.g., Stomatopoda 1 and Stomatopoda 2, etc.). The superscripted numerals in the table indicate to which (composite) taxa the sequences have contributed (e.g. Cumacea1 is based on the sequences with numeral '1'). The analyses based on combined molecular and morphological evidence only include the sequences with numeral '1'.
Page 5 of 20(page number not for citation purposes)
BMC Evolutionary Biology 2009, 9:21 http://www.biomedcentral.com/1471-2148/9/21
the program Gblocks version 0.91 b [27], and excludedfrom the analyses. After trying a variety of settings, thefinal Gblocks settings were selected to yield a good qualityalignment while not sacrificing an unnecessarily largeamount of data. Nevertheless, ambiguously alignedregions and especially pronounced length variationbetween species in the ribosomal genes necessitated theremoval of 49%, 65%, and 85% of the 18S, 16S, and 28Salignments, respectively. The settings were the followingfor the 18S rRNA, 16S rRNA and 28S rRNA partitionsrespectively: [1: 27; 2: 44; 3: 8; 4: 4; 5: all]; [1: 11; 2: 11; 3:8; 4: 5; 5: with half]; [1: 10; 2: 10; 3: 8; 4: 5; 5: with half].The cytochrome c oxidase subunit I partition did not con-tain any ambiguously aligned regions, and the alignmentwas checked with respect to the amino acid alignment.
The partitions and the character exclusion sets based onGblocks are as follows (positions continuous in the con-catenated dataset):
Partitions18S rRNA: 1-3249
28S rRNA: 3250-6590
cytochrome c oxidase subunit I: 6591-7205
16S rRNA: 7206-8316
morphology: 8317-8493
Character exclusion sets18S rRNA: 82-140 303-361 403-420 547-810 1125-11691379-1409 1422-1466 1514-1589 1636-1719 1737-24462824-2834 2881-2955 2986-3043 3099-3126 3175-3186
28S rRNA: 3250-4590 4621 4646-4648 4660 4667-47124723-4754 4763-5116 5134-5145 5155 5156 5168-51725178-5183 5227-5234 5246 5247 5279-5281 5303-53105335-5345 5369-5579 5598 5599 5615 5624 5625 5680-5691 5703-5716 5742-5745 5767 5768 5781-5783 5812-5815 5825 5835-5838 5876-6590
16S rRNA: 7206-7225 7233-7251 7263-7293 7299-74557481 7488 7489 7511-7514 7521 7530 7542-7549 7557-7569 7577-7584 7657-7687 7698-7704 7712-7724 77347735 7743-7747 7758-7764 7775-7778 7785-77877803-7821 7834-7840 7848 7849 7859 7890 7913 7944-7948 7965 7966 7972-7979 7994-8316
The concatenated molecular data set includes a total of3226 aligned positions, with 1674, 531, 406, and 615positions for the 18S rRNA, 28S rRNA, 16S rRNA, andcytochrome c oxidase subunit I partitions, respectively.
Phylogenetic signal and phylogenetic analysesThe data were analysed using both parsimony and Baye-sian inference, using PAUP* [28] and MrBayes [29]respectively. We performed Bayesian and parsimony anal-yses on all separate partitions and the combined data.
For the parsimony analyses we performed heuristicsearches consisting of 1,000 (or more where stated) ran-dom addition replicates with TBR branch swapping. Allmolecular characters were treated as unordered andequally weighted, offering a contrast with the Bayesiananalyses (where complex models of molecular evolutionwere used). The ordering and weighting of morphologicalcharacters in the parsimony analyses is as defined in addi-tional file 1. Bootstrapping analyses were based on 2,500or more resamplings, each with 1,000 random additionsand TBR swapping. For the morphological data set, boot-strapped trees were additionally used to determine maxi-mum leaf stabilities (LS) [30-34] using RadCon [30]. Inrooted trees, the leaf stability of a taxon is calculated as theaverage of the support values for all three-taxon state-ments including that taxon. Stable taxa will contribute towell-supported triplets. Taxa with lower leaf stabilities aremore likely to impact negatively upon apparent support.Hence, leaf stabilities can be used to measure directly howfar the relationships of a given terminal to all other termi-nals are supported, which in turn offers a proxy for thelikely impact of a given taxon on global measures of treesupport. We also used first order jackknifing to determinethe impact upon relationships of removing individualtaxa [25]. Reference trees were produced by pruning eachtaxon from the set of MPTs from the simultaneous analy-sis of all taxa. These were compared with trees resultingfrom additional parsimony analyses sequentially omit-ting each taxon from the outset. The impact upon appar-ent relationships was measured using two indices: thesymmetric difference distance on full splits (RF of Robin-son and Foulds 1981 [35]) and the maximum agreementsubtree distance (d1 of Finden & Gordon 1985 [36]). TheRF measures the difference between two trees as thenumber of nodes unique to both, while d1 reports thenumber of taxa missing from the maximum agreementsubtree. These differ conceptually, and may differ mark-edly in practice. Where comparisons were between sets oftrees, we calculated the mean distance between each treein one set and the most similar tree in the other set (suchthat identical sets of trees have no difference). For thecombined evidence analyses, we calculated partitionedBremer support indices [37] using TreeRot version 3 [38].
For the Bayesian analyses we used MrModeltest [39] todetermine the best-fitting model for each data partition,excluding ambiguously aligned regions from the calcula-tions. This resulted in the following models being used forall analyses of separate or combined partitions: GTR + G +
Page 6 of 20(page number not for citation purposes)

BMC Evolutionary Biology 2009, 9:21 http://www.biomedcentral.com/1471-2148/9/21
I (general time-reversible model + gamma distributedrates of substitution + estimated proportion of invariantsites) for 18S rRNA and 16S rRNA; GTR + G for 28S rRNAand cytochrome c oxidase subunit I. We did not partitionstem and loop regions for the 18S rRNA and 28S rRNAgenes. With respect to the 18S rRNA data, both Spears etal. (2005: 134) [5] and Meland & Willassen (2007: 1090)[6] note that Bayesian analyses with the stem and loopregions of the 18S rRNA molecule treated the same or asunlinked partitions resulted in "highly congruent" results.For the morphological partition, we used a common-mechanism maximum-likelihood model, with a gammadistribution of rates (Mkv+G model of Lewis, 2001 [40]).Unless stated otherwise we ran four chains, of which threewere heated. We sampled every 200 generations, and useda 25% burn-in. In all combined analyses, we allowed ratesto vary independently for each partition. For the com-bined molecular and morphological analyses all morpho-logical characters were treated as equally weighted andnon-additive. For individual runs, additional parameterswere:
- 18S rRNA: seven million generations, average standarddeviation of split frequencies: 0.007.
- 28S rRNA: 2039000 generations before automatic aver-age standard deviation of split frequencies (0.01) wasreached.
- 16S rRNA: three million generations, average standarddeviation of split frequencies: 0.006.
- Cytochrome c oxidase subunit I: five million genera-tions, average standard deviation of split frequencies:0.008.
- Morphology (MOR): three million generations, averagestandard deviation of split frequencies: 0.003 (all non-additive characters)/0.002 (some characters treated asadditive).
- Combined molecules (MOL): seven chains (six heated),sample and print frequency: 200, seven million genera-
tions, average standard deviation of split frequencies:0.0094.
- MOL minus Spelaeogriphacea: seven chains (six heated),sample and print frequency: 200, four million genera-tions, average standard deviation of split frequencies:0.007.
- MOL minus Amphipoda: five chains (four heated), sam-ple and print frequency: 200, six million generations,average standard deviation of split frequencies: 0.007.
- Combined molecules and morphology (MOLMOR): sixchains (five heated), six million generations, averagestandard deviation of split frequencies: 0.004.
- MOLMOR minus Spelaeogriphacea: six chains (fiveheated), sample and print frequency: 400, six million gen-erations, average standard deviation of split frequencies:0.003.
- MOLMOR minus Amphipoda: six chains (five heated),sample and print frequency: 400, six million generations,average standard deviation of split frequencies: 0.008.
In the combined Bayesian analyses we unlinked theparameters for priors on substitution rates (revmatpr), sta-tionary nucleotide frequencies (statefreqpr), shape of thegamma distribution of rate variation (shapepr), and pro-portion of invariant sites (pinvarpr) for all molecular datapartitions.
For the ILD test [41] we made all possible comparisons ofindividual loci (Table 2) and between these and morphol-ogy (Table 3) (in addition to a single test of all partitionsanalysed simultaneously). For each comparison, weremoved all taxa present in only one partition. Hence, thenumber of taxa analysed was not uniform. This necessi-tated the further removal of uninformative charactersfrom one or both partitions so that the number of charac-ters contributed by an individual partition was also varia-ble. Each concatenated data set (comprising two loci, orone locus and morphology) was analysed in PAUP* with1,000 random partitions ("hompart"). All characters were
Table 2: Results of ILD and TILD tests for the concatenated data set of four molecules.
18S rRNA 28S rRNA 16S rRNA Cyt. c ox. Sub. I
18S rRNA 467/155 354/225 444/31828S rRNA 0.004/na (19) 119/217 155/31316S rRNA 0.001/0.002 (18) 0.001/0.007 (16) 222/308Cyt. c ox. sub. I 0.001/0.002 (20) 0.001/0.001 (18) 0.035/0.001 (18)
Above diagonal: Number of informative characters for row/column. Below diagonal: P value from ILD/TILD test (< 0.008 to reject homogeneity), with number of taxa in brackets. TILD tests were based on strict consensus trees (which was completely unresolved for 28S rRNA in its comparison with 18S rRNA).
Page 7 of 20(page number not for citation purposes)
BMC Evolutionary Biology 2009, 9:21 http://www.biomedcentral.com/1471-2148/9/21
treated as unordered and unweighted for simplicity. Heu-ristic searches were used throughout, with 1,000 randomadditions of taxa followed by TBR branch swapping. Forthe molecular data set (Table 2), we also estimated thetopological Mickevich-Farris ILD or TILD [42]. In thisimplementation, we inferred a strict consensus from eachpartition, recoded these using group inclusion characters(matrix representation in PAUP*), and subjected theresultant combined matrix to the ILD test. We note thatthe TILD test can be applied to partitions and trees com-prising incompletely overlapping sets of taxa, but pre-ferred to make a direct comparison with the ILD resultshere.
Branch lengths, long-branch attraction and relative substitution ratesWe assessed the possibility of long-branch attraction arte-facts in our analyses with a series of exploratory analyses(there are no conclusive tests per se). Firstly, we performeda distance-based relative rate test with RRTree [43] on the18S rRNA data to test whether taxa differed significantly intheir relative substitution rates. We compared the resultsconsidering each taxon as a separate lineage, and using apre-defined guide tree to allow rates to be comparedbetween different supra-specific clades (using the 18SrRNA topology of Meland & Willassen 2007 [6]). Thismethod has been used to identify fast-clock organisms forexclusion from phylogenetic analyses [44,45].
Secondly, we utilized likelihood ratio tests in PAUP* todetermine whether the sequences evolved at similar rates.We did this by comparing the likelihoods of the trees bothwith and without a molecular clock enforced. The likeli-hood ratio was then calculated as 2(lnL1-lnL2), where L1is the null hypothesis (clock assumed), which is a subsetor special case (in nested models) of the alternativehypothesis L2 (no clock assumed). We assumed s-2degrees of freedom, where n is the number of terminals.We used this test in addition to the above distance-basedrelative rate test for several reasons. Spears et al. (2005) [5]rejected the possibility of LBA in their 18S rRNA tree basedon the basis of a likelihood ratio test, so we re-analysedour data in the same way. More importantly, distance-based relative rate tests and likelihood ratio tests may dif-fer in their sensitivity [46], so we applied both here. More
prosaically, and despite repeated attempts, we failed toprevent RRTree from crashing when analyzing the con-catenated molecular data (possibly a function of theamount of sequence data the program is able to handle).Consequently, we resorted to likelihood ratio testing forthe concatenated molecular data.
Thirdly, we performed taxon exclusion experimentsdesigned to test whether taxa with high substitution ratesare artificially attracted to each other [47]. If LBA occurs byattraction of two long-branch taxa, removal of one ofthese from the analysis may allow the other taxon to findits proper place in the phylogeny. If the remaining taxonjumps to a different position in the tree, then it is possiblethat the initial clade was a LBA artefact.
Fourthly, we evaluated concordance between the analysesof the separate data partitions, and between the parsi-mony and Bayesian analyses. Both methodological dis-cordance of results (based on the fact that differentmethods differ in their ability to prevent LBA), and thelack of morphological support for a molecular clade (anadmittedly weak criterion) have been taken as possibleindications of LBA in the literature [47].
Using PAUP *, we performed a likelihood ratio test ofinternal branch lengths for the 18S rRNA sequences andthe combined molecular evidence. This allowed us to testwhether the very short internal branches were signifi-cantly different from zero length (an option availableunder "likelihood settings").
ResultsA single most parsimonious tree resulted from the analy-sis of the morphological characters alone (Figure 1). Treesresulting from parsimony analyses of individual molecu-lar partitions are given in Figure 2. Combined parsimonyanalyses for all molecules, and molecules plus morphol-ogy, are given as Figures 3 and 4 respectively. The Bayesianmorphological tree is given as Figure 5, while Bayesiantrees from the individual molecular partitions are pre-sented in Figure 6 and 7. Combined Bayesian analyses ofall molecules and molecules plus morphology are given inFigures 8 and 9 respectively.
Table 3: Results of the ILD tests for the concatenated total evidence data set (molecules and morphology).
18S rRNA 28S rRNA 16S rRNA Cyt. c ox. sub. I Morphology
18S rRNA 273/100 277/184 281/273 443/12828S rRNA 0.014 (11) 82/168 78/261 100/11916S rRNA 0.001 (11) 0.001 (10) 282/194 194/124Cyt. c ox. sub. I 0.001 (11) 0.001 (10) 0.012 (13) 282/126Morphology 0.001 (14) 0.001 (10) 0.001 (12) 0.001 (12)
Above diagonal: Number of informative characters for row/column. Below diagonal: P value from ILD test (< 0.005 to reject homogeneity), with number of taxa in brackets.
Page 8 of 20(page number not for citation purposes)

BMC Evolutionary Biology 2009, 9:21 http://www.biomedcentral.com/1471-2148/9/21
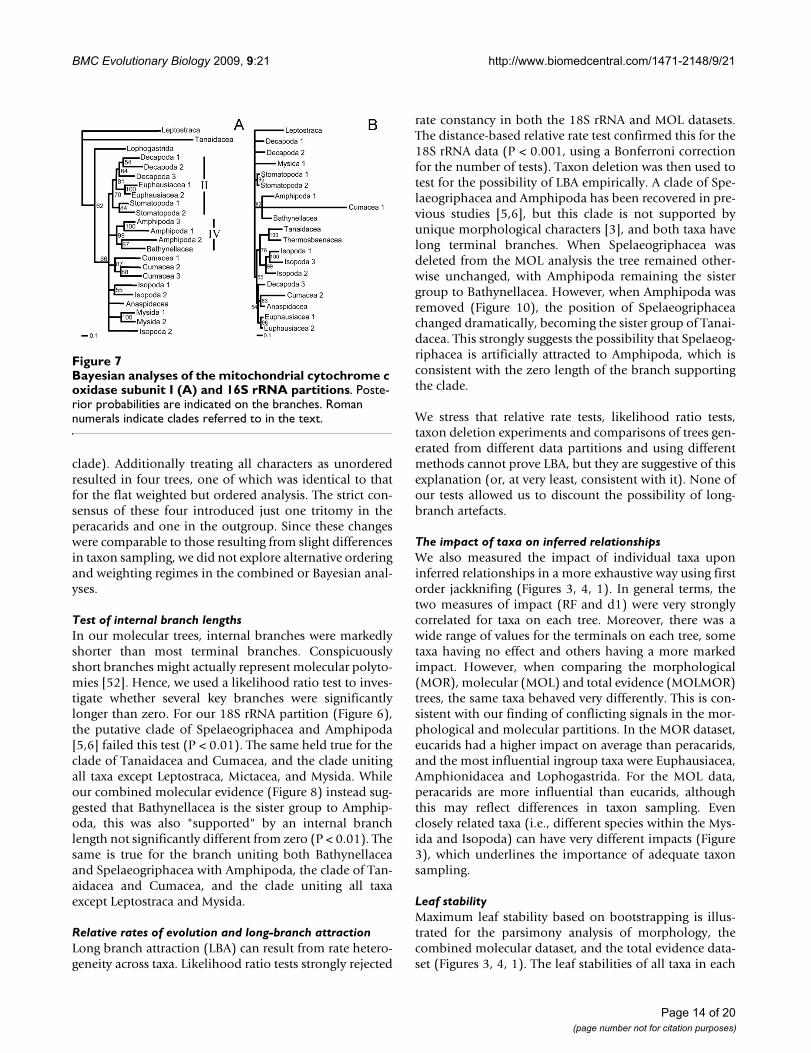
The congruence of partitionsThe results of the individual pairwise ILD tests arereported in Tables 2 and 3. ILD tests for both the com-bined molecular, and combined molecular and morpho-logical data sets partitioned simultaneously into separateloci/morphology were also highly significant (P < 0.001).For the larger, 24 taxon, molecular data set, all compari-sons, except that between 16S rRNA and cytochrome c oxi-dase subunit I for the ILD test, were highly significant(and the hypothesis of congruence was thereforerejected). It is probable that the 16S rRNA and cyto-chrome c oxidase subunit I comparison passes the test
because the signal in one or both subsets of data is veryweak (see Figures 7 and 2). The TILD tests of topologicalcongruence confirmed this: all partitions (including 16SrRNA vs. cytochrome c oxidase subunit I) yielded signifi-cantly incongruent relationships (irrespective of the sup-port for those relationships). Moreover, the PBS analysesof combined molecular and total evidence (Figures 3 and4) pick up conflict between the signals for 16S rRNA andcytochrome c oxidase subunit I for several nodes. For thesmaller, fifteen taxon data set including morphology,eight of the ten ILD comparisons yielded a significantresult (Table 3). Comparisons showed that only the 16S
Phylogeny of Eumalacostraca based on parsimony analysis of 177 morphological characters (CI = 0.42, RI = 0.62)Figure 1Phylogeny of Eumalacostraca based on parsimony analysis of 177 morphological characters (CI = 0.42, RI = 0.62). Data set compiled principally from the work of Pires (1987), Wills (1997, 1998), Schram & Hof (1998), Richter & Scholtz (2001) and Poore (2005) [3,4,7-9,16]. Characters relating to numbers of somites, limbs and limb elements (podomeres and endites) have been ordered. Characters relating to limb elements have also been scaled to unity (ranged). Bold figures on branches indicate Bremer support. Italic figures are bootstrap percentages where these exceed 50% (10,000 equiprobable character resamplings, each with 1,000 random additions and TBR). Histograms of mean RF and mean d1 relate respectively to the symmetrical difference distance and maximum agreement subtree distance measures of the impact upon relationships of removing individual taxa (first order jackknife). Leaf stability is calculated as the maximum value based on trees from the first 2,000 bootstrap replicates.
Page 9 of 20(page number not for citation purposes)

BMC Evolutionary Biology 2009, 9:21 http://www.biomedcentral.com/1471-2148/9/21
Page 10 of 20(page number not for citation purposes)
Fitch parsimony analyses of individual partitions of molecular dataFigure 2Fitch parsimony analyses of individual partitions of molecular data. Taxa with no informative sites for a given locus have been removed. Figures on branches indicate bootstrap percentages where these are >50%. Bootstrapping based on 1,000 resamplings, each with 1,000 random additions and TBR swapping. A. 18S rRNA: One MPT with CI = 0.50 and RI = 0.43. B. 28S rRNA: Bootstrap consensus tree, plus compatible groupings. A strict consensus of the 62 MPTs from these data (CI = 0.61 and RI = 0.49) contained only those clades with >60% bootstrap support. C. cytochrome c oxidase subunit I, one MPT with CI = 0.36 and RI = 0.29. D. 16S rRNA: Strict consensus of five MPTs with CI = 0.46 and RI = 0.36. Roman numerals indicate clades referred to in the text.

BMC Evolutionary Biology 2009, 9:21 http://www.biomedcentral.com/1471-2148/9/21
rRNA and cytochrome c oxidase subunit I partitions, and18S rRNA and 28S rRNA partitions passed the ILD test.
Such a finding of incongruence between morphology,mitochondrial and nuclear sequences is not uncommon[48,49], and the ILD test is known to be conservative,sometimes suggesting conflict where none exists [50].Given the acknowledged interpretational ambiguitiesassociated with the results of ILD and TILD tests [51] weinvestigated the effects of combining all of the data.
Contribution of data partitions to combined evidence: partitioned Bremer supportPBS analysis highlighted moderate conflict between parti-tions for the MOL analysis. As can be seen in Figure 3, for13 out of 21 within-ingroup-nodes, one (but never morethan one) partition conflicted with the other three. In tenof these 13 cases, a mitochondrial partition (in 9 cases,cytochrome c oxidase subunit I) conflicted with the otherpartitions. In striking contrast, all 12 ingroup nodes of theMOLMOR analysis displayed conflict, as can be seen inFigure 4. For eight of these, the morphological partition
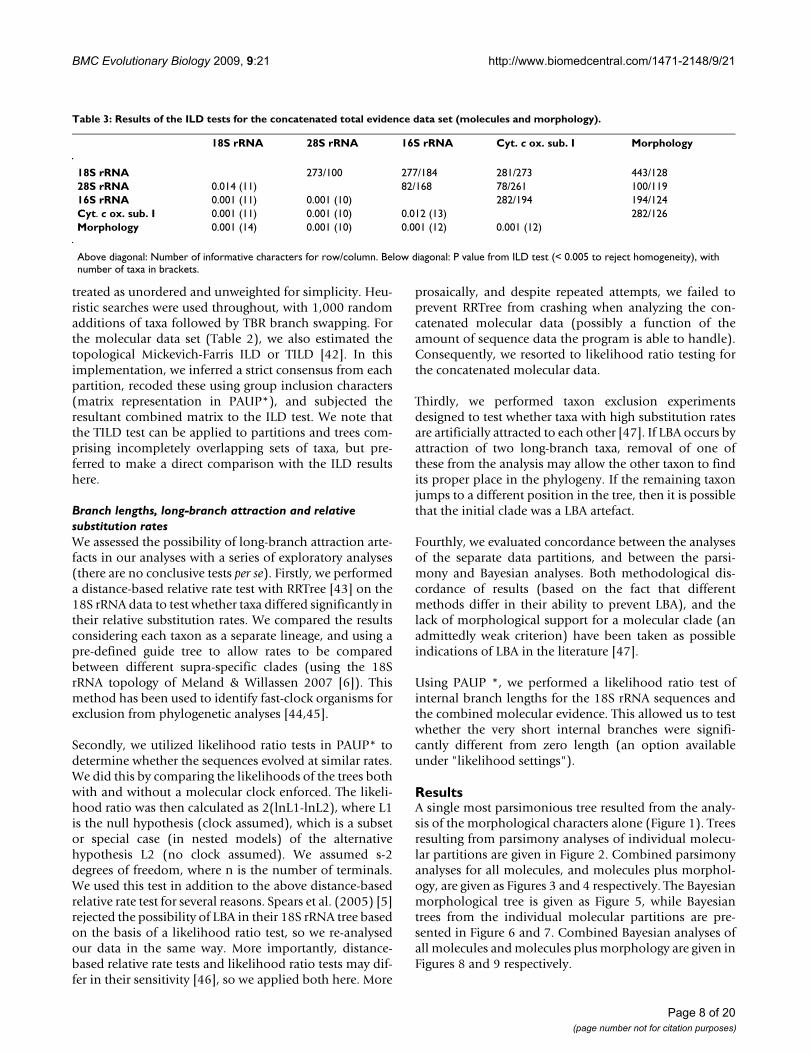
Single MPT from Fitch parsimony analysis of combined 18S rRNA, 28S rRNA, cytochrome c oxidase subunit I and 16S rRNA data (CI = 0.56)Figure 3Single MPT from Fitch parsimony analysis of combined 18S rRNA, 28S rRNA, cytochrome c oxidase subunit I and 16S rRNA data (CI = 0.44, RI = 0.56). Bold figures on branches indicate partitioned Bremer support for these four data partitions. Figures in italics indicate bootstrap support based on 2,500 resamplings, each with 1,000 random additions and TBR swapping. Values less than 50% are not reported. Histograms of mean RF and mean d1 relate respectively to the symmet-rical difference distance and maximum agreement subtree distance measures of the impact upon relationships of removing indi-vidual taxa (first order jackknife). Leaf stability is calculated as the maximum value based on trees from the first 2,000 bootstrap replicates. Roman numerals indicate clades referred to in the text.
Page 11 of 20(page number not for citation purposes)
BMC Evolutionary Biology 2009, 9:21 http://www.biomedcentral.com/1471-2148/9/21
conflicted with all the molecular partitions that contrib-uted clade support. Remarkably, in all eight cases, mor-phology contributed positive support to the node,suggesting that the parsimony analysis of MOLMOR evi-dence is resolved strongly on the basis of morphology.
Topology of Bayesian and parsimony treesMany of the clades found in the combined evidence treesare at odds with traditional ideas based on morphologicalevidence, and have therefore not (yet) received names. Werefrain from proposing new names for these cladesbecause our results are equivocal. We label the clades withnumbers, which are referred to in summary table 4 andthe figures. The Bayesian analyses based on combinedmolecular (MOL), and molecular + morphological (MOL-MOR) evidence (Figures 8 and 9) share a number ofclades:
I. Euphausiacea + Stomatopoda
II. Euphausiacea + Stomatopoda + Decapoda
III. Euphausiacea + Stomatopoda + Decapoda + Anaspida-cea
IV. Amphipoda + Bathynellacea
However, we stress that the Bayesian posterior probabili-ties were statistically insignificant (<0.95) for all cladesuniting higher taxa in the MOL tree. In this tree (Figure 8)just three groups of higher taxa had posterior probabilitiesgreater than 0.90: clade I (0.93), III (0.94), and IV (0.93).Combining morphological with the molecular data (Fig-ure 9) raised the posterior probabilities of clade III to 1.00and clade IV to 0.95, and additionally produced a cladecontaining Thermosbaenacea, Bathynellacea and the per-acarid taxa with a support of 0.97.
The Bayesian MOL tree (Figure 8) and the tree based onmorphological data alone (MOR) (Figure 5) were strik-ingly different, as was also the case for the MOL and MORtrees based on parsimony (Figures 3 and 1). The Bayesian
Single MPT from Fitch parsimony analysis of combined 18S rRNA, 28S rRNA, cytochrome c oxidase subunit I, 16S rRNA and morphological data for a reduced set of taxa (CI = 0.50, RI = 0.29)Figure 4Single MPT from Fitch parsimony analysis of com-bined 18S rRNA, 28S rRNA, cytochrome c oxidase subunit I, 16S rRNA and morphological data for a reduced set of taxa (CI = 0.50, RI = 0.29). Bold figures on branches indicate partitioned Bremer support for these five data partitions. Figures in italics indicate bootstrap sup-port based on 2,500 resamplings, each with 1,000 random additions and TBR swapping. Values less than 50% are not reported. Histograms of mean RF and mean d1 relate respec-tively to the symmetrical difference distance and maximum agreement subtree distance measures of the impact upon relationships of removing individual taxa (first order jack-knife). Leaf stability is calculated as the maximum value based on trees from the first 2,000 bootstrap replicates. Roman numerals indicate clades referred to in the text.
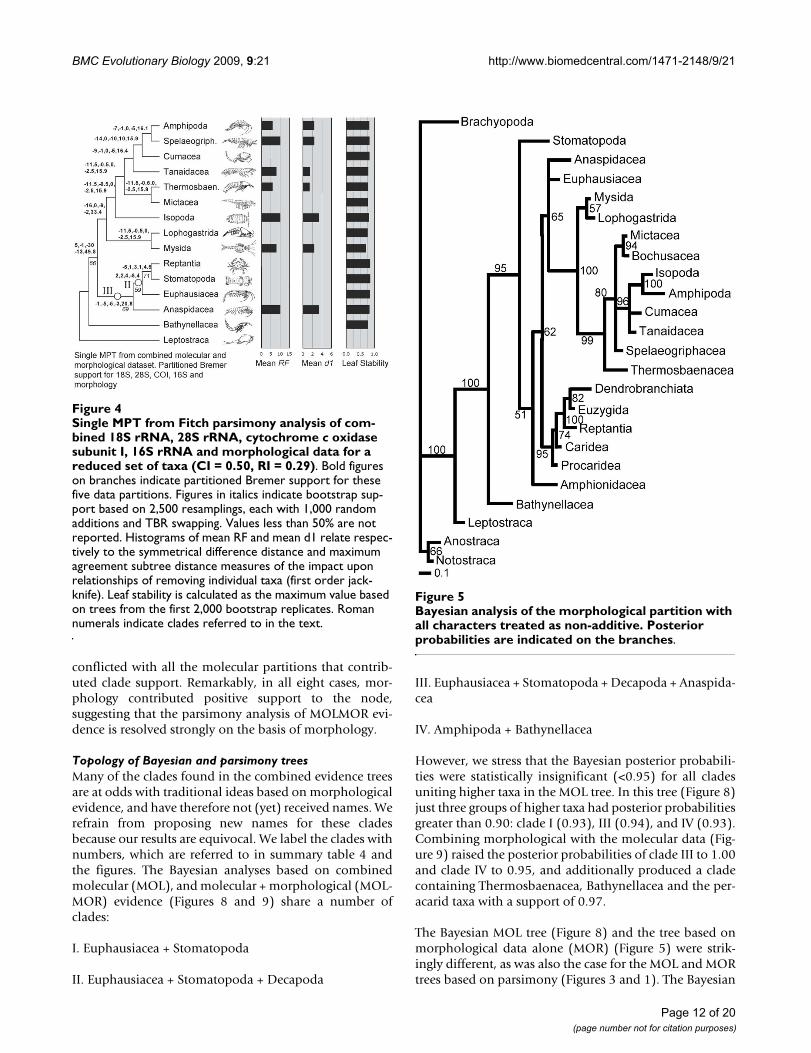
Bayesian analysis of the morphological partition with all char-acters treated as non-additiveFigure 5Bayesian analysis of the morphological partition with all characters treated as non-additive. Posterior probabilities are indicated on the branches.
Page 12 of 20(page number not for citation purposes)
BMC Evolutionary Biology 2009, 9:21 http://www.biomedcentral.com/1471-2148/9/21
morphological tree showed none of the clades sharedbetween the molecular and total evidence analyses.
The parsimony tree based on the MOL data (Figure 3)shared only clades I and III with the Bayesian combinedevidence trees, while the parsimony MOLMOR tree (Fig-ure 4) only shared clades II and III with the Bayesian trees.With the exception of the sister group relationshipbetween Amphipoda and Spelaeogriphacea, the parsi-mony MOL and MOLMOR trees were strikingly different.The bootstrap values for the parsimony analyses were gen-erally very poor.
The parsimony analyses of the MOL partitions arereported in Figure 2. The parsimony and Bayesian analy-ses of the morphological data (Figures 5 and 1) concurredon the monophyly of Mysidacea, the sister group relation-ship of Amphipoda and Isopoda, and the non-mono-phyly of Syncarida. However, these analyses alsodisplayed some conspicuous differences, notably in theirplacement of Euphausiacea, the relative positions of Mysi-
dacea and Thermosbaenacea, and the position of Anaspi-dacea.
Bayesian analyses of the morphological data with or with-out explicit character ordering and weighting as specifiedin additional file 1 yielded identical trees, although withthe latter slightly less resolved. Removing explicit charac-ter ordering and weighting from the parsimony analysesof the morphological dataset had modest effects. Inferredrelationships were changed less than by the removal/inclusion of some terminals (i.e., Leptostraca, Euphausia-cea and Amphionidacea). Weighting all characters tounity (but retaining order for those characters previouslyordered) resulted in a single tree, differing from the origi-nal by d1 = 6 and RF = 12. The positions of Tanaidaceaand Cumacea within the peracarids were affected, andEuphausiacea emerged as sister group to the peracarids.Additionally, relationships within the remaining eucaridswere altered, with the subtree of Procaridea to Dendro-branchiata re-rooted on Dendrobranchiata (such that Pro-caridea + Caridea formed the most highly internested
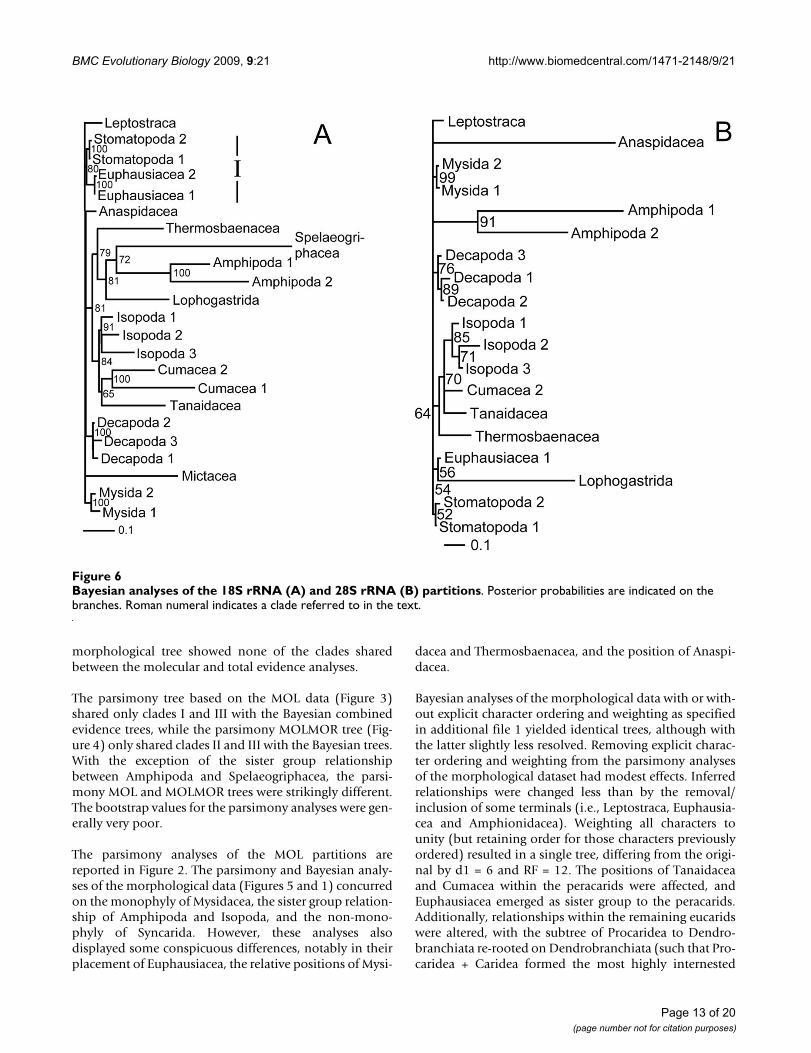
Bayesian analyses of the 18S rRNA (A) and 28S rRNA (B) partitionsFigure 6Bayesian analyses of the 18S rRNA (A) and 28S rRNA (B) partitions. Posterior probabilities are indicated on the branches. Roman numeral indicates a clade referred to in the text.
Page 13 of 20(page number not for citation purposes)
BMC Evolutionary Biology 2009, 9:21 http://www.biomedcentral.com/1471-2148/9/21
clade). Additionally treating all characters as unorderedresulted in four trees, one of which was identical to thatfor the flat weighted but ordered analysis. The strict con-sensus of these four introduced just one tritomy in theperacarids and one in the outgroup. Since these changeswere comparable to those resulting from slight differencesin taxon sampling, we did not explore alternative orderingand weighting regimes in the combined or Bayesian anal-yses.
Test of internal branch lengthsIn our molecular trees, internal branches were markedlyshorter than most terminal branches. Conspicuouslyshort branches might actually represent molecular polyto-mies [52]. Hence, we used a likelihood ratio test to inves-tigate whether several key branches were significantlylonger than zero. For our 18S rRNA partition (Figure 6),the putative clade of Spelaeogriphacea and Amphipoda[5,6] failed this test (P < 0.01). The same held true for theclade of Tanaidacea and Cumacea, and the clade unitingall taxa except Leptostraca, Mictacea, and Mysida. Whileour combined molecular evidence (Figure 8) instead sug-gested that Bathynellacea is the sister group to Amphip-oda, this was also "supported" by an internal branchlength not significantly different from zero (P < 0.01). Thesame is true for the branch uniting both Bathynellaceaand Spelaeogriphacea with Amphipoda, the clade of Tan-aidacea and Cumacea, and the clade uniting all taxaexcept Leptostraca and Mysida.
Relative rates of evolution and long-branch attractionLong branch attraction (LBA) can result from rate hetero-geneity across taxa. Likelihood ratio tests strongly rejected
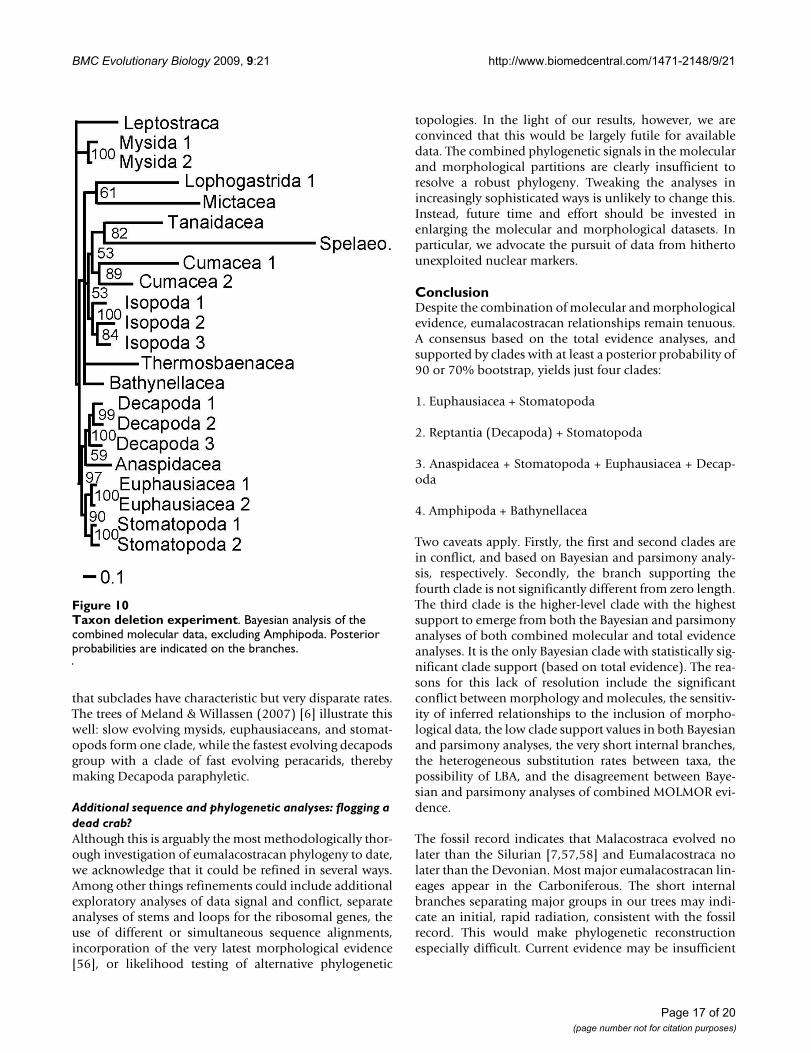
rate constancy in both the 18S rRNA and MOL datasets.The distance-based relative rate test confirmed this for the18S rRNA data (P < 0.001, using a Bonferroni correctionfor the number of tests). Taxon deletion was then used totest for the possibility of LBA empirically. A clade of Spe-laeogriphacea and Amphipoda has been recovered in pre-vious studies [5,6], but this clade is not supported byunique morphological characters [3], and both taxa havelong terminal branches. When Spelaeogriphacea wasdeleted from the MOL analysis the tree remained other-wise unchanged, with Amphipoda remaining the sistergroup to Bathynellacea. However, when Amphipoda wasremoved (Figure 10), the position of Spelaeogriphaceachanged dramatically, becoming the sister group of Tanai-dacea. This strongly suggests the possibility that Spelaeog-riphacea is artificially attracted to Amphipoda, which isconsistent with the zero length of the branch supportingthe clade.
We stress that relative rate tests, likelihood ratio tests,taxon deletion experiments and comparisons of trees gen-erated from different data partitions and using differentmethods cannot prove LBA, but they are suggestive of thisexplanation (or, at very least, consistent with it). None ofour tests allowed us to discount the possibility of long-branch artefacts.
The impact of taxa on inferred relationshipsWe also measured the impact of individual taxa uponinferred relationships in a more exhaustive way using firstorder jackknifing (Figures 3, 4, 1). In general terms, thetwo measures of impact (RF and d1) were very stronglycorrelated for taxa on each tree. Moreover, there was awide range of values for the terminals on each tree, sometaxa having no effect and others having a more markedimpact. However, when comparing the morphological(MOR), molecular (MOL) and total evidence (MOLMOR)trees, the same taxa behaved very differently. This is con-sistent with our finding of conflicting signals in the mor-phological and molecular partitions. In the MOR dataset,eucarids had a higher impact on average than peracarids,and the most influential ingroup taxa were Euphausiacea,Amphionidacea and Lophogastrida. For the MOL data,peracarids are more influential than eucarids, althoughthis may reflect differences in taxon sampling. Evenclosely related taxa (i.e., different species within the Mys-ida and Isopoda) can have very different impacts (Figure3), which underlines the importance of adequate taxonsampling.
Leaf stabilityMaximum leaf stability based on bootstrapping is illus-trated for the parsimony analysis of morphology, thecombined molecular dataset, and the total evidence data-set (Figures 3, 4, 1). The leaf stabilities of all taxa in each
Bayesian analyses of the mitochondrial cytochrome c oxidase subunit I (A) and 16S rRNA partitionsFigure 7Bayesian analyses of the mitochondrial cytochrome c oxidase subunit I (A) and 16S rRNA partitions. Poste-rior probabilities are indicated on the branches. Roman numerals indicate clades referred to in the text.
Page 14 of 20(page number not for citation purposes)

BMC Evolutionary Biology 2009, 9:21 http://www.biomedcentral.com/1471-2148/9/21
of these analyses were very similar. Hence, no taxa reducebranch support spectacularly more than their neighbours.Again, the trends (insofar as these can be detected) are dif-ferent for the three analyses, which reflects the differentsignals present.
DiscussionThis is the first study to attempt to resolve eumalacostra-can phylogeny using a combination of evidence frommultiple molecular loci and morphology. Our results var-iously confirm or reject previously proposed phylogenetichypotheses, although it should be stressed that many con-clusions remain tentative in the absence of unequivocalphylogenetic signals. The most striking findings are therelatively strong conflict between molecular and morpho-logical evidence, and the probable effects of systematicerror (including possible LBA) on these and previouslypublished results. Although the ILD tests for the restricted15 taxon dataset suggest that the nuclear and mitochon-drial partitions are mutually conflicting, the PBS analysisinstead reveals that in most cases of molecular conflict, itis the cytochrome c oxidase subunit I partition that con-flicts with the remaining molecular partitions. However,
when morphological and molecular evidence are com-bined, morphology conflicts strongly with all molecularpartitions. Notwithstanding, the morphological signalhas a strong effect on the relationships inferred in theMOLMOR tree (especially for the parsimony analysis),which differs considerably from the MOL tree. Weacknowledge that such differences may also result fromdifferences in taxon sampling. However, strong conflictbetween molecular and morphological evidence has beennoted before for eumalacostracan relationships [3,5],although it had not been quantified in a combined analy-sis. Our analyses demonstrate that some of the conflicthitherto flagged up as "surprising" or "disturbing" (nota-bly the sister group relationship between Spelaeogripha-cea and Amphipoda based on 18S rRNA) dissolvesbecause of equivocal molecular evidence and possibleLBA.
We stress that the clade support measures in our analysesare generally low. Hence, while molecular and morpho-logical conflict is relatively strong, neither signal is espe-cially robust. However, given the level of interest in theconflict between molecular and morphological trees[53,54], it will be interesting to revisit the issue with newdatasets in the future.
Clade support valuesIn both the MOL and MOLMOR analyses, posterior prob-abilities and bootstrap support values were generallyinsignificant for nodes uniting higher-level taxa. This isunsurprising given that analyses of the separate molecularpartitions also had poor support. What was surprising,however, was that in the Bayesian MOL analysis, a cladeof Bathynellacea + Amphipoda had one of the three high-est posterior probabilities (0.93), but was nevertheless"supported" by a branch not significantly longer thanzero. This result was not apparent from branch lengthsalone. The anomaly occurred because Bathynellacea wasrepresented by mitochondrial data alone, whereas branchlengths were scaled as the expected number of changes persite. This finding highlights the need for caution wheninterpreting clade support measures, especially posteriorprobabilities that are lower than 0.95 [55].
Branch lengths, relative rates, and LBATwo striking features of previous molecular phylogeneticanalyses [5,6,15] are the combination of short internalbranches and long terminal branches, and conspicuousdifferences in the terminal branch lengths of ingroup taxa.In particular, non-mysid peracarid species exhibit muchlonger branches than the remaining taxa. Because theselong-branch taxa group together, and because some of thelongest branching taxa surprisingly resolve as sister groupsin the absence of morphological support (Amphipodaand Spelaeogriphacea), it is possible that these relation-
Bayesian phylogeny of Eumalacostraca based on combined 18S rRNA, 28S rRNA, cytochrome c oxidase subunit I, and 16S rRNA and sequences (MOL)Figure 8Bayesian phylogeny of Eumalacostraca based on combined 18S rRNA, 28S rRNA, cytochrome c oxi-dase subunit I, and 16S rRNA and sequences (MOL). Posterior probabilities are indicated on the branches. Roman numerals indicate clades referred to in the text.
Page 15 of 20(page number not for citation purposes)
BMC Evolutionary Biology 2009, 9:21 http://www.biomedcentral.com/1471-2148/9/21
ships are affected by LBA. Spears et al. (2005) [5] notedthese long branches, and concluded (p. 142) that they cangenerally be "viewed as an indication that a lineage eitherhas had an ancient divergence followed by an extendedperiod of independent evolution or has an acceleratedrate of evolution." They rejected the latter possibility infavour of the former, because "a likelihood-ratio test didnot find evidence of significant heterogeneity in nucle-
otide-substitution rates among lineages for a given topol-ogy." We question these conclusions for several reasons.
Firstly, if their likelihood-ratio test indicated that allsequences evolved according to a molecular clock, onewould not anticipate pronounced differences in branchlengths between taxa. The only way a molecular tree ofextant species can accommodate terminal branches of dif-fering lengths under a clock is if internal branches are alsoof different but complementary lengths so as to averageout apparent rates. This does not appear to be the case inSpears et al.'s phylograms. Secondly, Spears et al. pre-ferred ancient divergence as the explanation for longbranch lengths because LB taxa such as Spelaeogriphaceahave a Palaeozoic fossil record. However, they also notedthat equally ancient taxa may have markedly shorterbranch lengths. Thirdly, our own likelihood-ratio test onthe 18S rRNA data partition strongly rejected rate con-stancy, a finding congruent with the distance-based rela-tive rate test. In fact, when the distance-based test isperformed while not taking tree topology into account(i.e., considering every taxon as a separate lineage), Spe-laeogriphacea is found to evolve at a rate significantlyfaster than any other included species, with the exceptionof the fastest evolving amphipod.
Strong rate heterogeneity and very short internal branches(indistinguishable from zero for several groupings) meanthat LBA is likely to be a problem in our 18S rRNA andother data partitions. The outcome of distance-based rela-tive rate tests has been used to exclude fast clock taxa fromphylogenetic analyses to prevent LBA [44,45]. Followingthis advice would have made the present study impossible(at least for the 18S rRNA data). This conclusion is sup-ported by analyses of the combined MOL and MOLMORdata sets, where exclusion of Amphipoda (the longestbranch taxon after Spelaeogriphacea) caused Spelaeog-riphacea to significantly change position, groupinginstead with another long branch taxon (Tanaidacea).Worryingly, our relative rates tests confirm the prediction(based on branch length differences in 18S rRNA trees),
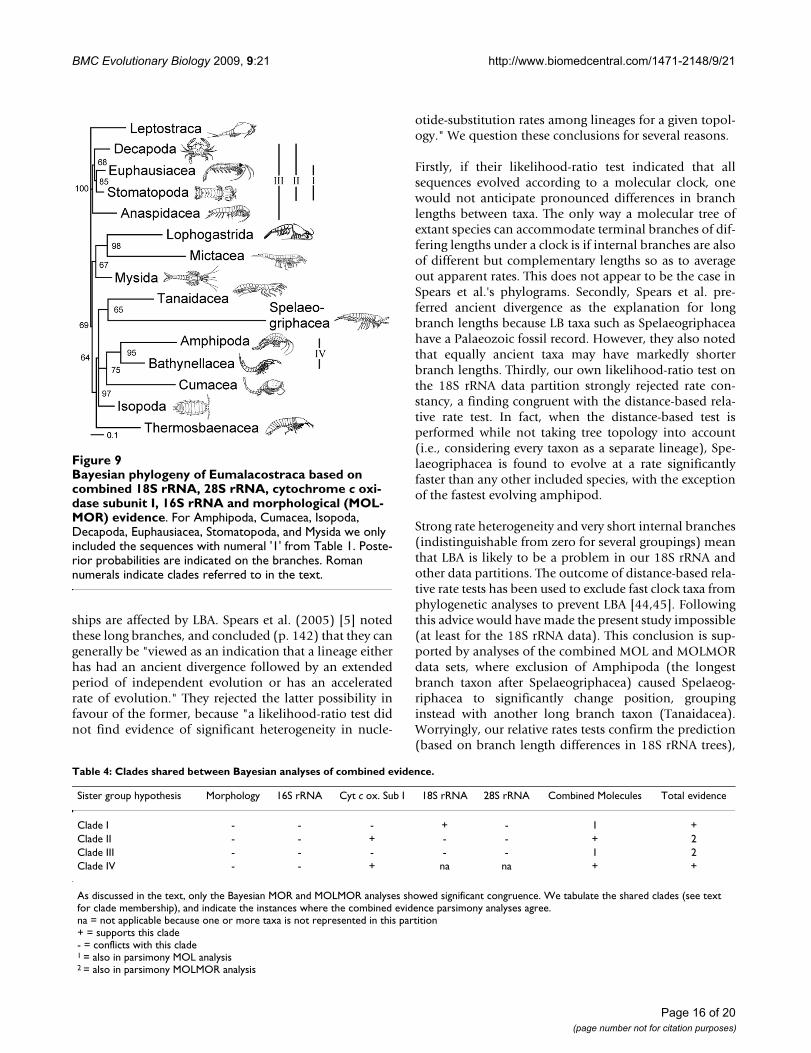
Bayesian phylogeny of Eumalacostraca based on combined 18S rRNA, 28S rRNA, cytochrome c oxidase subunit I, 16S rRNA and morphological (MOLMOR) evidenceFigure 9Bayesian phylogeny of Eumalacostraca based on combined 18S rRNA, 28S rRNA, cytochrome c oxi-dase subunit I, 16S rRNA and morphological (MOL-MOR) evidence. For Amphipoda, Cumacea, Isopoda, Decapoda, Euphausiacea, Stomatopoda, and Mysida we only included the sequences with numeral '1' from Table 1. Poste-rior probabilities are indicated on the branches. Roman numerals indicate clades referred to in the text.
Table 4: Clades shared between Bayesian analyses of combined evidence.
Sister group hypothesis Morphology 16S rRNA Cyt c ox. Sub I 18S rRNA 28S rRNA Combined Molecules Total evidence
Clade I - - - + - 1 +Clade II - - + - - + 2Clade III - - - - - 1 2Clade IV - - + na na + +
As discussed in the text, only the Bayesian MOR and MOLMOR analyses showed significant congruence. We tabulate the shared clades (see text for clade membership), and indicate the instances where the combined evidence parsimony analyses agree.na = not applicable because one or more taxa is not represented in this partition+ = supports this clade- = conflicts with this clade1 = also in parsimony MOL analysis2 = also in parsimony MOLMOR analysis
Page 16 of 20(page number not for citation purposes)
BMC Evolutionary Biology 2009, 9:21 http://www.biomedcentral.com/1471-2148/9/21
that subclades have characteristic but very disparate rates.The trees of Meland & Willassen (2007) [6] illustrate thiswell: slow evolving mysids, euphausiaceans, and stomat-opods form one clade, while the fastest evolving decapodsgroup with a clade of fast evolving peracarids, therebymaking Decapoda paraphyletic.
Additional sequence and phylogenetic analyses: flogging a dead crab?Although this is arguably the most methodologically thor-ough investigation of eumalacostracan phylogeny to date,we acknowledge that it could be refined in several ways.Among other things refinements could include additionalexploratory analyses of data signal and conflict, separateanalyses of stems and loops for the ribosomal genes, theuse of different or simultaneous sequence alignments,incorporation of the very latest morphological evidence[56], or likelihood testing of alternative phylogenetic
topologies. In the light of our results, however, we areconvinced that this would be largely futile for availabledata. The combined phylogenetic signals in the molecularand morphological partitions are clearly insufficient toresolve a robust phylogeny. Tweaking the analyses inincreasingly sophisticated ways is unlikely to change this.Instead, future time and effort should be invested inenlarging the molecular and morphological datasets. Inparticular, we advocate the pursuit of data from hithertounexploited nuclear markers.
ConclusionDespite the combination of molecular and morphologicalevidence, eumalacostracan relationships remain tenuous.A consensus based on the total evidence analyses, andsupported by clades with at least a posterior probability of90 or 70% bootstrap, yields just four clades:
1. Euphausiacea + Stomatopoda
2. Reptantia (Decapoda) + Stomatopoda
3. Anaspidacea + Stomatopoda + Euphausiacea + Decap-oda
4. Amphipoda + Bathynellacea
Two caveats apply. Firstly, the first and second clades arein conflict, and based on Bayesian and parsimony analy-sis, respectively. Secondly, the branch supporting thefourth clade is not significantly different from zero length.The third clade is the higher-level clade with the highestsupport to emerge from both the Bayesian and parsimonyanalyses of both combined molecular and total evidenceanalyses. It is the only Bayesian clade with statistically sig-nificant clade support (based on total evidence). The rea-sons for this lack of resolution include the significantconflict between morphology and molecules, the sensitiv-ity of inferred relationships to the inclusion of morpho-logical data, the low clade support values in both Bayesianand parsimony analyses, the very short internal branches,the heterogeneous substitution rates between taxa, thepossibility of LBA, and the disagreement between Baye-sian and parsimony analyses of combined MOLMOR evi-dence.
The fossil record indicates that Malacostraca evolved nolater than the Silurian [7,57,58] and Eumalacostraca nolater than the Devonian. Most major eumalacostracan lin-eages appear in the Carboniferous. The short internalbranches separating major groups in our trees may indi-cate an initial, rapid radiation, consistent with the fossilrecord. This would make phylogenetic reconstructionespecially difficult. Current evidence may be insufficient
Taxon deletion experimentFigure 10Taxon deletion experiment. Bayesian analysis of the combined molecular data, excluding Amphipoda. Posterior probabilities are indicated on the branches.
Page 17 of 20(page number not for citation purposes)

BMC Evolutionary Biology 2009, 9:21 http://www.biomedcentral.com/1471-2148/9/21
to resolve such ancient divergences: a problem that addi-tional data may yet solve.
Higher-level metazoan phylogenetics has advancedgreatly in recent years, and lessons learned in this endeav-our may be applied to the eumalacostracan problem (foran overview see [59]). Both groups probably radiated rap-idly, and while the Metazoa clearly did so earlier, theantiquity of the two divergences is of the same order ofmagnitude. Molecular phylogenies of both groups werebased initially on rRNA sequences. Although theseinformed a greatly revised understanding of metazoanphylogeny, the limitations of relying on these loci alonehave become clear too.
Workers seeking to expand the nuclear and mitochondrialdataset for Eumalacostraca must consider carefully theissue of taxon sampling. Given the potential for LBA, fastevolving species should be avoided. When included,exploratory analyses for the potential of LBA are neces-sary. For example, a recent study of 18S rRNA data for sty-giomysids concluded that they are not related to mysids,but are rather the sister group of Mictacea [6]. However(although not included in our dataset here), a preliminaryanalysis indicated that stygiomysids share a high substitu-tion rate with mictaceans, while mysids evolve signifi-cantly slower. Moreover, when Mictacea was deleted fromthe analysis, stygiomysids jumped to a very different posi-tion in the tree, appearing as the sister group to slowevolving decapods. This at least admits to the possibilitythat their phylogenetic position based on 18S rRNA evi-dence is an LBA artefact.
Species sampling within higher taxa should be increasedas well. The results of our taxon deletion experiments (Fig-ure 10) suggest that certain species within given highertaxa (e.g., mysids and isopods) may have disproportion-ate effects on tree topology. However, given the benefitsand increasing ease of generating larger amounts of data[60], we believe that the most efficient strategy is toexploit new markers. Specifically, we advocate the use ofnuclear protein coding genes for several reasons. Firstly,the acknowledged benefits of nuclear coding genes. Thereis a vast reservoir of nuclear loci evolving at a variety ofrates that are able to address divergences at a range ofdepths. Not only can these be aligned more confidentlyvia amino acid translation, but also amino acid sequencesoffer one possible way to ameliorate LBA effects that mayplaque analysis of nucleotide sequences. Secondly, andmore specifically, large phylogenomic data sets are basedon nuclear protein coding loci. Testing the utility of thesesame markers for Eumalacostraca (and other lower levelarthropod taxa) will foster integration of these independ-
ent subtrees via primary data, which maximizes explana-tory power. When the subtrees are based on minimallyoverlapping or isolated datasets, by contrast, we limit our-selves to integrating them through supertree methods[61].
Authors' contributionsRAJ designed the study, compiled the molecular dataset,performed the sequence and Bayesian analyses, testedbranch lengths and relative rates, prepared figures and ledthe write-up. CND and MF performed preliminary datagathering and phylogenetic analyses. CND also preparedfigures. MAW conceived the study, compiled the morpho-logical dataset, performed the tests for phylogenetic signaland congruence of partitions, did the leaf stability andtaxon impact analyses, performed the parsimony analy-ses, wrote the paper and prepared figures. All authors readand approved the final manuscript.
Additional material
Additional File 1Morphological character details. List of morphological characters used in parsimony analyses with details of ordering and weighting.Click here for file[http://www.biomedcentral.com/content/supplementary/1471-2148-9-21-S1.pdf]
Additional File 2Morphological character data. Newly synthesized data set incorporating morphological data sets from Poore (2005) [3], Richter & Scholtz (2001) [4], Wills (1998) [7], Pires (1987) [8], Wills (1997) [9] and Schram (1998) [16].Click here for file[http://www.biomedcentral.com/content/supplementary/1471-2148-9-21-S2.nex]
Additional File 318S data set used in analyses of Eumalacostraca. Nexus file of Meland & Willassen (2007) [6] 18S rRNA data.Click here for file[http://www.biomedcentral.com/content/supplementary/1471-2148-9-21-S3.nex]
Additional File 416S data set used in analyses of Eumalacostraca. Nexus file of 16S rRNA data (Camacho et. al 2002) [11].Click here for file[http://www.biomedcentral.com/content/supplementary/1471-2148-9-21-S4.nex]
Additional File 528S data set used in analyses of Eumalacostraca. Nexus file of 28S rRNA data.Click here for file[http://www.biomedcentral.com/content/supplementary/1471-2148-9-21-S5.nex]
Page 18 of 20(page number not for citation purposes)
BMC Evolutionary Biology 2009, 9:21 http://www.biomedcentral.com/1471-2148/9/21
AcknowledgementsWe are indebted to Dr. Kenneth Meland, who kindly provided his aligned 18S rRNA data set electronically. We are very grateful to Dr. Stefan Rich-ter for sharing his thoughts on malacostracan evolution throughout the course of this work. We thank Eleanor Yerburgh for her practical lab assist-ance while a summer project student with us. We appreciate the critical comments of four anonymous referees. Finally, we are indebted to the UK Biotechnology and Biological Sciences Research Council for funding (BB/C006682/1), without which this project would not have been possible.
References1. Brooks WK: The phylogeny of the higher Crustacea. Science
1883, 2:790-793.2. Martin JW, Davis GE: An updated classification of the Recent
Crustacea. Nat Hist Mus Los Angeles Co, Contrib Sci 2001, 39:1-124.3. Poore GCB: Peracarida: monophyly, relationships and evolu-
tionary success. Nauplius 2005, 13:1-27.4. Richter S, Scholtz G: Phylogenetic analysis of the Malacostraca
(Crustacea). J Zool Syst Evol Res Evol 2001, 39:113-136.5. Spears T, DeBry RW, Abele LG, Chodyla K: Peracarid monophyly
and interordinal phylogeny inferred from nuclear small-sub-unit ribosomal DNA sequences (Crustacea: Malacostraca:Peracarida). Proc Biol Soc Wash 2005, 118:117-157.
6. Meland K, Willassen E: The disunity of "Mysidacea" (Crusta-cea). Mol Phyl Evol 2007, 44:1083-1104.
7. Wills MA: Crustacean disparity through the Phanerozoic:comparing morphological and stratigraphic data. Biol J LinnSoc 1998, 65:455-500.
8. Pires AMS: Potiicoara brasiliensis: a new genus and species ofSpelaeogriphacea (Crustacea, Peracarida) from Brazil witha phylogenetic analysis of the Peracarida. J Nat Hist 1987,21:225-238.
9. Wills MA: A phylogeny of recent and fossil Crustacea derivedfrom morphological characters. In Arthropod relationships Volume55. Edited by: Fortey RA, Thomas RH. The Systematics AssociationSpecial. London: Chapman & Hall; 1997:189-209.
10. Jarman SN, Nicol S, Elliot NG, McMinn A: 28S rDNA evolution inthe Eumalacostraca and the phylogenetic position of krill.Mol Phyl Evol 2000, 17:26-36.
11. Camacho AI, Rey I, Dorda BA, Machordom A, Valdecasas AG: Anote on the systematic position of the Bathynellacea (Crus-tacea, Malacostraca) using molecular evidence. Contr Zool2002, 71:123-129.
12. Mallatt J, Giribet G: Further use of nearly complete 28S and 18SrRNA genes to classify Ecdysozoa: 37 more arthropods anda kinorhynch. Mol Phyl Evol 2006, 40:772-794.
13. Regier JC, Shultz JW, Kambic RE: Pancrustacean phylogeny:hexapods are terrestrial crustaceans and maxillopods arenot monophyletic. Proc R Soc Lond B 2005, 272:395-401.
14. Giribet G, Richter S, Edgecombe GD, Wheeler QD: The positionof crustaceans within the Arthropoda – evidence from ninemolecular loci and morphology. In Crustacea and arthropod rela-tionships Edited by: Koenemann S, Jenner RA. Boca Raton: CRC Press;2005:307-352.
15. Babbitt CC, Patel NH: Relationships within the Pancrustacea:examining the influence of additional malacostracan 18S and28S rDNA. In Crustacea and arthropod relationships Edited by: Koen-emann S, Jenner RA. Boca Raton: CRC Press; 2005:275-294.
16. Schram FR, Hof CHJ: Fossils and interrelationships of majorcrustacean groups. In Arthropod fossils and phylogeny Edited by:Edgecombe GD. New York: Columbia University Press;1998:233-302.
17. Watling L: Toward understanding the relationships of the per-acaridan orders: the necessity of determining exact homolo-gies. In Crustaceans and the biodiversity crisis Edited by: Schram FR, vonVaupel Klein JC. Leiden: Brill; 1999:73-89.
18. Wagner HP: A monographic review of the Thermosbaenacea(Crustacea: Peracarida). Zoologische Verhandelingen 1994,291:1-338.
19. Guzik MT, Abrams KM, Cooper SJB, Humphreys WF, Cho J-L, AustinAD: Phylogeography of the ancient Parabathynellidae (Crus-tacea: Bathynellacea) from the Yilgarn region of WesternAustralia. Invert Syst 2008, 22:205-216.
20. Agnarsson I, Maddison WP, Avilés L: The phylogeny of the socialAnelosimus spiders (Araneae: Theridiidae) inferred from sixmolecular loci and morphology. Mol Phyl Evol 2007, 43:833-851.
21. Philippe H, Brinkmann H, Martinez P, Riutort M, Baguñà J: Acoel flat-worms are not Platyhelminthes: evidence from phyloge-nomics. PloS One 2007, 2:e717.
22. Springer MS, Scally M, Madsen O, de Jong WW, Douady CJ, StanhopeMJ: The use of composite taxa in supermatrices. Mol Phyl Evol2004, 30:883-884.
23. Malia MJ, Lipscomb DL, Allard MW: The misleading effects ofcomposite taxa in supermatrices. Mol Phyl Evol 2003,27:522-527.
24. Kearney M: Fragmentary taxa, missing data, and ambiguity:Mistaken assumptions and conclusions. Syst Biol 2002,51:369-381.
25. Cobbett A, Wilkinson M, Wills MA: Fossils impact as hard as liv-ing taxa in parsimony analyses of morphology. Syst Biol 2007,56:753-766.
26. Wheeler WC, Giribet G, Edgecombe GD: Arthropod systemat-ics. In Assembling the tree of life Edited by: Cracraft J, Donoghue MJ.Oxford and New York: Oxford University Press; 2004:281-295.
27. Castresana J: Selection of conserved blocks from multiplealignments for their use in phylogenetic analysis. Mol Biol Evol2000, 17:540-552.
28. Swofford DL: PAUP*4.0b10. Phylogenetic analysis using parsi-mony (*and other methods). Sinauer Associates, Sunderland,Massachusetts; 2002.
29. Huelsenbeck JP, Ronquist FR: MrBayes: Bayesian inference ofphylogenetic trees. Bioinformatics 2001, 17:754-755.
30. Thorley JL, Page RDM: RadCon: phylogenetic tree comparisonand consensus. Bioinformatics 2000, 16:486-487.
31. Thorley JL, Wilkinson M: Testing the phylogenetic stability ofearly tetrapods. J Theor Biol 1999, 200:343-344.
32. Wilkinson M: Coping with abundant missing entries in phylo-genetic inference using parsimony. Syst Biol 1995, 44:501-514.
33. Wilkinson M: Identifying stable reference taxa for phyloge-netic nomenclature. Zool Scr 2006, 35:109-112.
34. Wilkinson M, Thorley JL, Upchurch P: A chain is no stronger thanits weakest link: double decay analysis of phylogenetichypotheses. Syst Biol 2000, 49:754-776.
35. Robinson DF, Foulds LR: Comparison of phylogenetic trees.Math Biosci 1981, 53:131-147.
36. Finden CR, Gordon AD: Obtaining common pruned trees. JClassif 1985, 2:255-276.
37. Lambkin CL, Lee MSY, Winterton SL, Yeates DK: PartitionedBremer support and multiple trees. Cladistics 2002, 18:436-444.
Additional File 6COI data set used in analysis of Eumalacostraca. Nexus file of cyto-chrome c oxidase subunit I data (Guzik et. a., 2008) [19].Click here for file[http://www.biomedcentral.com/content/supplementary/1471-2148-9-21-S6.nex]
Additional File 7All genes combined. Concatenated data file of all COI, 16S rRna, 28S rRna and18S rRNA data used in analyses.Click here for file[http://www.biomedcentral.com/content/supplementary/1471-2148-9-21-S7.nex]
Additional File 8Total evidence data file. Combined molecular and morphological data dataset.Click here for file[http://www.biomedcentral.com/content/supplementary/1471-2148-9-21-S8.dat]
Page 19 of 20(page number not for citation purposes)
BMC Evolutionary Biology 2009, 9:21 http://www.biomedcentral.com/1471-2148/9/21
Publish with BioMed Central and every scientist can read your work free of charge
"BioMed Central will be the most significant development for disseminating the results of biomedical research in our lifetime."
Sir Paul Nurse, Cancer Research UK
Your research papers will be:
available free of charge to the entire biomedical community
peer reviewed and published immediately upon acceptance
cited in PubMed and archived on PubMed Central
yours — you keep the copyright
Submit your manuscript here:http://www.biomedcentral.com/info/publishing_adv.asp
BioMedcentral
38. Sorenson MD, Franzosa EA: TreeRot version 3. Boston, MA: Bos-ton University; 2007.
39. Nylander JAA: MrModeltest v2.2. Program distributed by theauthor. Evolutionary Biology Centre, Uppsala University; 2004.
40. Lewis PO: A likelihood approach to estimating phylogenyfrom discrete morphological character data. Syst Biol 2001,50:913-925.
41. Mickevich MF, Farris JS: The implications of congruence inMenidia. Syst Zool 1981, 30:351-370.
42. Wheeler W: Measuring topological congruence by extendingcharacter techniques. Cladistics 1999, 15:131-135.
43. Robinson-Rechavi M, Huchon D: RRTree: relative-rate testsbetween groups of sequences on a phylogenetic tree. Bioinfor-matics 2000, 16:296-297.
44. Ruiz-Trillo I, Riutort M, Fourcade HM, Baguñà J, Boore JL: Mitochon-drial genome data support the basal position of Acoelomor-pha and the polyphyly of the Platyhelminthes. Mol Phyl Evol2004, 33:321-332.
45. Ruiz-Trillo I, Paps J, Loukota M, Ribera C, Jondelius U, Bagunà J, Riu-tort M: A phylogenetic analysis of myosin heavy chain type IIsequences corroborates that Acoela and Nemertodermat-ida are basal bilaterians. Proc Natl Acad Sci USA 2002,99:11246-11251.
46. Sorhannus U, Van Bell C: Testing for equality of molecular evo-lutionary rates: a comparison between a relative-rate testand a likelihood ratio test. Mol Biol Evol 1999, 16:849-855.
47. Bergsten J: A review of long-branch attraction. Cladistics 2005,21:163-193.
48. Yoder AD, Irwin JA, Payseur BA: Failure of the ILD to determinedata combinability for slow loris phylogeny. Syst Biol 2001,50:408-424.
49. Audzijonyte A, Damgaard J, Varvio S-L, Vainio JK, Väinölä R: Phylog-eny of Mysis (Crustacea, Mysida): history of continental inva-sions inferred from molecular and morphological data.Cladistics 2005, 21:575-596.
50. Quicke DLJ, Jones OR, Epstein DR: Correcting the problem offalse incongruence due to noise imbalance in the incongru-ence length difference (ILD) test. Syst Biol 2007, 56:496-503.
51. Planet PJ: Tree disagreement: measuring and testing incon-gruence in phylogenies. J Biomed Inform 2006, 39:86-102.
52. Slowinski JB: Molecular polytomies. Mol Phyl Evol 2001,19:114-120.
53. Hillis DM, Wiens JJ: Molecules versus morphology in systemat-ics. In Phylogenetic analysis of morphological data Edited by: Wiens JJ.Washington: Smithsonian Institution Press; 2000:1-19.
54. Pisani D, Benton MJ, Wilkinson M: Congruence of morphologicaland molecular phylogenies. Acta Biother 2007, 55:269-281.
55. Alfaro ME, Holder MT: The posterior and the prior in Bayesianphylogenetics. Ann Rev Ecol Evol Sys 2006, 37:19-42.
56. Haupt C, Richter S: Limb articulation in caridoid crustaceansrevisited – new evidence from Euphausiacea (Malacostraca).Arthropod Struct Dev 2008, 37:221-233.
57. Briggs DEG, Sutton MD, Siveter DJ, Siveter DJ: A new phyllocarid(Crustacea: Malacostraca) from the Silurian fossil-Lager-stätte of Herefordshire, UK. Proc R Soc Lond B 2004,271:131-138.
58. Briggs DEG, Clarkson ENK: The late Palaeozoic radiation ofmalacostracan crustaceans. In Major evolutionary radiations Editedby: Taylor PD, Larwood GP. Oxford: Clarendon Press; 1990:165-186.
59. Jenner RA, Littlewood DTJ: Problematica old and new. Phil TransRoy Soc B 2008, 363:1503-1512.
60. Philippe H, Telford MJ: Large-scale sequencing and the new ani-mal phylogeny. Trends Ecol Evol 2006, 21:614-620.
61. De Queiroz K, Gatesy J: The supermatrix approach to system-atics. Trends Ecol Evol 2006, 22:34-41.
Page 20 of 20(page number not for citation purposes)