Blue Ribbon Schools Program - ed€¦ · Web viewStudents may sign up for band or strings where...
50
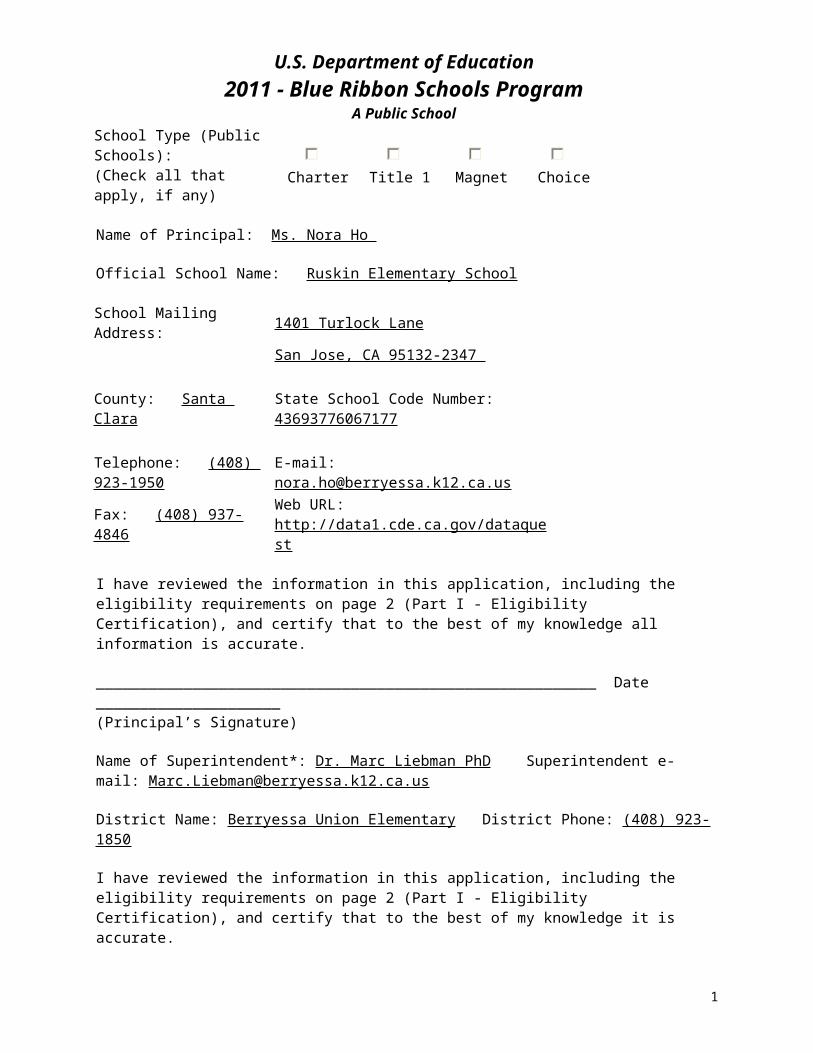
U.S. Department of Education 2011 - Blue Ribbon Schools Program A Public School School Type (Public Schools): (Check all that apply, if any) Charter Title 1 Magnet Choice Name of Principal: Ms. Nora Ho Official School Name: Ruskin Elementary School School Mailing Address: 1401 Turlock Lane San Jose, CA 95132-2347 County: Santa Clara State School Code Number: 43693776067177 Telephone: (408) 923-1950 E-mail: [email protected] Fax: (408) 937- 4846 Web URL: http://data1.cde.ca.gov/dataque st I have reviewed the information in this application, including the eligibility requirements on page 2 (Part I - Eligibility Certification), and certify that to the best of my knowledge all information is accurate. _________________________________________________________ Date _____________________ (Principal’s Signature) Name of Superintendent*: Dr. Marc Liebman PhD Superintendent e- mail: [email protected] District Name: Berryessa Union Elementary District Phone: (408) 923- 1850 I have reviewed the information in this application, including the eligibility requirements on page 2 (Part I - Eligibility Certification), and certify that to the best of my knowledge it is accurate. 1
Transcript of Blue Ribbon Schools Program - ed€¦ · Web viewStudents may sign up for band or strings where...
U.S. Department of Education2011 - Blue Ribbon Schools Program
A Public School School Type (Public Schools):
(Check all that apply, if any) Charter Title 1 Magnet Choice
Name of Principal: Ms. Nora Ho
Official School Name: Ruskin Elementary School
School Mailing Address: 1401 Turlock Lane San Jose, CA 95132-2347
County: Santa Clara State School Code Number: 43693776067177 Telephone: (408) 923-1950 E-mail: [email protected] Fax: (408) 937-4846 Web URL: http://data1.cde.ca.gov/dataquest
I have reviewed the information in this application, including the eligibility requirements on page 2 (Part I - Eligibility Certification), and certify that to the best of my knowledge all information is accurate.
_________________________________________________________ Date _____________________ (Principal’s Signature)
Name of Superintendent*: Dr. Marc Liebman PhD Superintendent e-mail: [email protected]
District Name: Berryessa Union Elementary District Phone: (408) 923-1850
I have reviewed the information in this application, including the eligibility requirements on page 2 (Part I - Eligibility Certification), and certify that to the best of my knowledge it is accurate.
_________________________________________________________ Date _____________________ (Superintendent’s Signature)
Name of School Board President/Chairperson: Mr. Khoa Nguyen
I have reviewed the information in this application, including the eligibility requirements on page 2 (Part I - Eligibility Certification), and certify that to the best of my knowledge it is accurate.
_________________________________________________________ Date _____________________ (School Board President’s/Chairperson’s Signature)
*Private Schools: If the information requested is not applicable, write N/A in the space.
The original signed cover sheet only should be converted to a PDF file and emailed to Aba Kumi, Blue Ribbon Schools Project Manager ([email protected]) or mailed by expedited mail or a courier mail service (such as Express Mail, FedEx or UPS) to Aba Kumi, Director, Blue Ribbon Schools Program, Office of Communications and Outreach, U.S. Department of Education, 400 Maryland Ave., SW, Room 5E103, Washington, DC 20202-8173.
11CA3
1

PART I - ELIGIBILITY CERTIFICATION 11CA3
The signatures on the first page of this application certify that each of the statements below concerning the school’s eligibility and compliance with U.S. Department of Education, Office for Civil Rights (OCR) requirements is true and correct.
1. The school has some configuration that includes one or more of grades K-12. (Schools on the same campus with one principal, even K-12 schools, must apply as an entire school.)
2. The school has made adequate yearly progress each year for the past two years and has not been identified by the state as "persistently dangerous" within the last two years.
3. To meet final eligibility, the school must meet the state's Adequate Yearly Progress (AYP) requirement in the 2010-2011 school year. AYP must be certified by the state and all appeals resolved at least two weeks before the awards ceremony for the school to receive the award.
4. If the school includes grades 7 or higher, the school must have foreign language as a part of its curriculum and a significant number of students in grades 7 and higher must take the course.
5. The school has been in existence for five full years, that is, from at least September 2005.6. The nominated school has not received the Blue Ribbon Schools award in the past five years:
2006, 2007, 2008, 2009 or 2010.7. The nominated school or district is not refusing OCR access to information necessary to
investigate a civil rights complaint or to conduct a district-wide compliance review.8. OCR has not issued a violation letter of findings to the school district concluding that the
nominated school or the district as a whole has violated one or more of the civil rights statutes. A violation letter of findings will not be considered outstanding if OCR has accepted a corrective action plan from the district to remedy the violation.
9. The U.S. Department of Justice does not have a pending suit alleging that the nominated school or the school district as a whole has violated one or more of the civil rights statutes or the Constitution’s equal protection clause.
10. There are no findings of violations of the Individuals with Disabilities Education Act in a U.S. Department of Education monitoring report that apply to the school or school district in question; or if there are such findings, the state or district has corrected, or agreed to correct, the findings.
2

PART II - DEMOGRAPHIC DATA 11CA3
All data are the most recent year available.
DISTRICT
1. Number of schools in the district: 10 Elementary schools (per district designation) 3 Middle/Junior high schools
0 High schools 0 K-12 schools
13 Total schools in district
2. District per-pupil expenditure: 7499
SCHOOL (To be completed by all schools)
3. Category that best describes the area where the school is located: Suburban 4. Number of years the principal has been in her/his position at this school: 7 5. Number of students as of October 1, 2010 enrolled at each grade level or its equivalent in applying
school:
Grade # of Males # of Females Grade Total # of Males # of Females Grade Total
PreK 0 0 0 6 0 0 0
K 47 41 88 7 0 0 0
1 43 54 97 8 0 0 0
2 55 50 105 9 0 0 0
3 47 45 92 10 0 0 0
4 73 57 130 11 0 0 0
5 64 47 111 12 0 0 0
Total in Applying School: 623
3

11CA3
6. Racial/ethnic composition of the school: 0 % American Indian or Alaska Native 76 % Asian 0 % Black or African American 12 % Hispanic or Latino 2 % Native Hawaiian or Other Pacific Islander 5 % White 5 % Two or more races 100 % Total
Only the seven standard categories should be used in reporting the racial/ethnic composition of your school. The final Guidance on Maintaining, Collecting, and Reporting Racial and Ethnic data to the U.S. Department of Education published in the October 19, 2007 Federal Register provides definitions for each of the seven categories.
7. Student turnover, or mobility rate, during the 2009-2010 school year: 7%
This rate is calculated using the grid below. The answer to (6) is the mobility rate.
(1) Number of students who transferred to the school after October 1, 2009 until the end of the school year.
25
(2) Number of students who transferred from the school after October 1, 2009 until the end of the school year.
16
(3) Total of all transferred students [sum of rows (1) and (2)]. 41
(4) Total number of students in the school as of October 1, 2009 619
(5) Total transferred students in row (3)divided by total students in row (4). 0.07
(6) Amount in row (5) multiplied by 100. 7
8. Percent limited English proficient students in the school: 41% Total number of limited English proficient students in the school: 257 Number of languages represented, not including English: 16
Specify languages:
Vietnamese, Mandarin (Putonghua), Cantonese, Spanish, Filipino (Pilipino or Tagalog), Punjabi, Gujarati, Hindi, Korean, Japanese, Assyrian, Urdu, Other non-English languages, Pashto, Bengali, Ilocano
4

11CA3
9. Percent of students eligible for free/reduced-priced meals: 24% Total number of students who qualify: 148
If this method does not produce an accurate estimate of the percentage of students from low-income families, or the school does not participate in the free and reduced-priced school meals program, supply an accurate estimate and explain how the school calculated this estimate.
10. Percent of students receiving special education services: 7% Total number of students served: 52
Indicate below the number of students with disabilities according to conditions designated in the Individuals with Disabilities Education Act. Do not add additional categories.
2 Autism 1 Orthopedic Impairment 0 Deafness 0 Other Health Impaired 0 Deaf-Blindness 19 Specific Learning Disability 1 Emotional Disturbance 29 Speech or Language Impairment 1 Hearing Impairment 0 Traumatic Brain Injury
0 Mental Retardation 0 Visual Impairment Including Blindness
1 Multiple Disabilities 0 Developmentally Delayed 11. Indicate number of full-time and part-time staff members in each of the categories below:
Number of Staff Full-Time Part-Time
Administrator(s) 1 0 Classroom teachers 26 0 Special resource teachers/specialists 0 9 Paraprofessionals 0 2 Support staff 2 12 Total number 29 23
12. Average school student-classroom teacher ratio, that is, the number of students in the school
divided by the Full Time Equivalent of classroom teachers, e.g., 22:1: 24:1
5

11CA3
13. Show the attendance patterns of teachers and students as a percentage. Only high schools need to supply graduation rates. Briefly explain in the Notes section any student or teacher attendance rates under 95% and teacher turnover rates over 12% and fluctuations in graduation rates.
2009-2010 2008-2009 2007-2008 2006-2007 2005-2006
Daily student attendance 98% 97% 98% 98% 98%
Daily teacher attendance 99% 99% 99% 99% 99%
Teacher turnover rate 21% 21% 10% 10% 14%
High school graduation rate % % % % %
If these data are not available, explain and provide reasonable estimates.
The teacher turnover rate is due to the reasons listed below.
2005-2006: One teacher retired; the second teacher moved closer to her home; the third teacher passed away unexpectedly.
2006-2007: The K-1-2 SDC teacher was moved to another site in order to free up a classroom for upper grades; the second teacher left the profession.
2007-2008: One teacher transferred to the middle school; the second teacher retired.
2008-2009: One teacher took a leave of absence; three teachers retired; one teacher left the district due to declining enrollment; one teacher left the profession.
2009-2010: As a result of increase in class size, we lost 5 teachers; one teacher retired. 14. For schools ending in grade 12 (high schools): Show what the students who graduated in Spring 2010
are doing as of Fall 2010. Graduating class size: Enrolled in a 4-year college or university % Enrolled in a community college % Enrolled in vocational training % Found employment % Military service % Other % Total 0%
6

PART III - SUMMARY 11CA3
Ruskin School together with students, parents, and community members, will strive to ensure that all students have the skills necessary to reach high levels of academic achievement, respect self and
others, and become lifelong learners as successful, productive and responsible citizens.
Ruskin Elementary School is respectful of its past, proud of its present, and excited about its future. As a three time California Distinguished school honoree, Ruskin has not been content to rest upon past achievements. The characteristics that have brought Ruskin to the forefront of quality education - resilience, inquiry, and innovation are still being utilized to create and sustain a spirit of excellence among our community for the benefit of every student.
Ruskin’s humble beginnings can be traced back to the late 19th century when the Berryessa School District opened its doors as a single schoolhouse. It was surrounded by fruit orchards and for many, that schoolhouse represented a field of dreams for a better future. Eventually Berryessa grew to 13 schools. Ruskin was added in 1969. Today, the physical, social, and economic landscape of the community has changed considerably. Ruskin now resides in an area often referred to as the birthplace of the high-tech industry, known to the world as “Silicon Valley.”
The seventies was a time when Ruskin had the dubious distinction as the school in Berryessa with the lowest test scores and student achievement. Instruction was free-wheeling and curriculum often reflected the individual interests of the teachers. Ruskin’s rise from obscurity began under the direction of one of its early principals. Many teachers credit him with transforming Ruskin into a “magnet for success.” He changed the culture of the school by addressing the problem of student under-achievement. Assessments were given to students and results of the assessment data were used to provide interventions. His actions proved to be the earliest examples of what many refer to today as “assessment driven differentiated instruction.”
Today the Ruskin community is made up of families who have come to the United States from China, Vietnam, India, and the Philippines within the last 1 or 2 generations. These ethnic groups make up about 85% of the student population with the balance comprised of Hispanic Americans, African Americans, and European Americans. Extended families are common with students having siblings, cousins, and other family as Ruskin students or alumni. Success and belonging are thereby modeled even before children enter kindergarten. Many multicultural events celebrate the diversity that makes Ruskin unique and validate students’ sense of identity and belonging.
Ruskin continues to fulfill its goals - students who are global thinkers, future problem solvers and world changers. Teachers routinely use the icons developed by USC educator, Dr. Sandra Kaplan, to aid students in understanding multiple perspectives and ethical issues. The school’s focus on student achievement, professional development, and community outreach has promoted a long held belief that every student will succeed at Ruskin.
Ruskin has developed many successful programs to enhance its academic curriculum and foster a sense of belonging and personal competence. These include Chess Club, the annual Student Talent Show, RuskinFIT, an annual “Family Fun Night”, and student leadership. Ruskin staff members reached out to form business and community partnerships. This led to the construction of Ruskin’s hands-on Science and Computer Lab built with donated dollars generated by staff, parents, and community members. Students have hands-on lessons in Science Lab from kindergarten through 5th grade. This is a unique aspect of being a student at Ruskin.
7

The development of RuskinFit, the school’s health and fitness program, marked another turning point in Ruskin’s history. This program encourages children to exercise and include good nutrition in their life-long skill sets. Prior to its inception, a majority of students sat idly by during their lunch and recess periods, often eating unhealthy foods. Today, students’ physical activity is encouraged by providing additional play equipment, recording minutes of physical activity, and by staff and parent volunteers who model and encourage physical activity. Test scores continue to rise and absenteeism has dropped. Ruskin has won several awards from the California Governor’s Fitness Challenge and local media outlets have written articles about the success of the RuskinFIT program.
Ruskin looks to its future during a time when California is hard hit by today’s economic downturn, with no end in sight to budget cuts and dwindling resources. The school’s vision places emphasis on resilience, and we hold to our commitment to educate the whole child as respectful, responsible, and resilient individuals.
The nomination for National Blue Ribbon is an honor that acknowledges the journey of this community, from obscurity to national recognition. Thank you for recognizing that great things can and will happen when school leadership, staff, students, parents and the community collaborate together as a TEAM.
“Together, Everyone Achieves More!”
8

PART IV - INDICATORS OF ACADEMIC SUCCESS 11CA3
1. Assessment Results:
The California Standards Tests measure the degree to which students are achieving the content standards adopted by the State Board of Education. California uses five performance levels to report student achievement on the CSTs: advanced, proficient, basic, below basic, and far below basic. The performance levels for each grade and subject area are based on scale scores that range between 150 and 600. The score dividing the basic scores from below basic is 300 for every grade and subject area. The score dividing basic scores from proficient scores is 350 for every grade and subject area. The target is for all California students to score at proficient or above in order to meet the standards.
Ruskin Elementary School’s Performance trends over a five year period on the CSTs reflect an upward trend in students achieving proficient and above on the California Standards Test in both English Language Arts and Math. The percentage of Hispanic students scoring proficient or above was significantly lower than overall percentages while Asian students scored significantly higher than all other subgroups. In almost all subgroups, except Special Education, scores are higher in Year 5 than in Year 4. Scores began to climb in Year 3 and this growth has continued on an upward trend. Overall test scores are much stronger in ELA than Math.
Over a five year period, English Language Learners reflected a decline of 9% in those scoring proficient and above in Math, and an increase of 7% proficient and above in ELA. Hispanic students’ scores revealed an increase of 13% of those scoring proficient and above in Math, and those scoring proficient and above in ELA increased 9%. Special Education Students made significant gains, demonstrating 30% proficient and above in Math and 23% proficient and above in ELA.
In the most recent year’s data, a comparison between the test scores of all students and the test scores of subgroups revealed an achievement gap. Discrepancies in Math include Socio-economic Disadvantaged Students with an achievement gap of 17%, Hispanic or Latino Students with an achievement gap of 35%, and Special Education Students with an achievement gap of 25%. Discrepancies in English Language Arts include the Hispanic or Latino Student subgroup with an achievement gap of 32% and Special Education Students with an achievement gap of 31%.
In closing the achievement gap, Ruskin School has been involved in district, site, and off site professional development. Staff has utilized a variety of strategies gleaned from professional development. The Cycle of Inquiry assisted staff in understanding and disaggregating test scores. The disaggregation of test scores brought to our attention, an achievement gap of 10 percentage points or more in math and reading for the Hispanic and Special Education subgroups. The Socioeconomic Disadvantaged subgroup also reflected an achievement gap but only in math. As a result of these findings, an after school extended day program was implemented 3x weekly for 1 hour each day in grades 1-5 for small groups (15 students or less). Math was the focus for all grade levels except grade 2, whose test scores reflected a greater need for an English Language Arts focus. During the regular school day, students in grades 2-5 are placed in flexible compartmentalized math groups, based on skill ability within grade levels. This configuration allowed staff to work with a lesser range of abilities. It also permitted staff to provide targeted, focused instruction for the identified subgroups. In addition, Ruskin has a partnership with Independence High School’s Teaching Academy where seniors are taught to be future teachers. Four days a week for 45 minutes, each senior works with whole group, small group or one-on-one. The seniors have been teamed with specific individuals from our targeted subgroups and given specific skills and concepts, based on assessments.
9
Staff has participated in ALL (A Look at Learning) training and is using form and function across curricular areas to better support ELL students with oral and written language. A dedicated period of instruction for implementing Form and Function sentence frames are used to provide access to key concepts and vocabulary in all core curriculum areas. Leveled questions based on Bloom’s taxonomy are implemented for students at their language level. In addition, Kaplan’s model of differentiated instruction with the use of icons has helped all students develop comprehension skills. Some classrooms have utilized tiered instruction and assignments. Reteaching and formative assessments have become a part of the regular routine in all classes and the extended day program. Some Special Education Students receive help in the Special Day Class while others require support from the Resource Specialist. Parent volunteers assist students one-on-one or in small groups with needed skills. There is much support for not only our subgroups but for all students.
For additional information on state assessment results, please visit Website URL: http://data1cde.ca.gov/dataquest
2. Using Assessment Results:
A wide variety of assessments are used and analyzed in order to meet the needs of all students. District designed trimester assessments are given in English Language Arts, math and writing. Formative assessments include end of the chapter and theme tests from the adopted text series in core curriculum areas.
Assessments are used to plan reteaching and remediation for students who demonstrate need or challenges. Reteaching lessons are taken from curriculum materials or designed by teachers. Assessment data is used to identify students who may benefit from extended day instructional programs after regular school hours.
An example of an extended day program that is in place is at the first grade level. The first graders have an after school program that serves two groups of students. The first group is a reading comprehension program that promotes the understanding of stories while providing support with writing complete sentences using story vocabulary. The second group is a writing group where the focus is paragraph writing. Students are given support to improve their writings which are assessed each semester by the district.
Star 9 (standardized state tests) are evaluated at the beginning of each school year to identify areas of need. Students' scores are used, along with other measures, to build skill-based groups for math and English language arts. As a result of assessment results, compartmentalized math is in place for grades 2 – 5.
School Site Council evaluates both district and state tests to identify areas of need, to assist with goal setting, and to advise the school of findings. Staff takes the information under advisory, develop goals, and plan action steps which must be taken in order to address needs. Resources are directed accordingly.
Students whose test scores reflect a trend of non-growth or declining results, are referred to the Student Study Team to determine areas of concerns and to look at modifications and/or strategies that can be used in the classroom and/or in the home. If improvement is not seen within 6 weeks, a second SST is scheduled involving the School Psychologist and/or the Resource Specialist to implement additional assessments in order to help the student.
Physical Education testing showed a weakness in endurance and stamina. A running program was initiated and a program to encourage more activity has been developed (Ruskin Fit).
10

3. Communicating Assessment Results:
Ruskin Elementary is dedicated to the success of its students. Ruskin has an effective system of communicating student performance, including assessment data, to parents, students, and community and at the same time ensuring their understanding of the data. All teachers communicate with student's parents---in person, by phone, or on Open House night, Back to School night and sending notices home.
Teachers share assessments and performance data with parents and students every trimester during parent teacher conference. However, parents, teachers, and principal conference as often as necessary. After formative assessments are corrected, students along with their teacher, review each question to gain a better understanding of concepts and skills. Students take the Star Reader and Accelerated reader tests on a regular basis, receiving immediate feedback. A report is sent home. SST and IEP team meetings are conducted with parents to make appropriate decisions, modifications and intervention strategies to benefit and meet individual needs of students. Informally, teachers send email updates home to inform parents of student progress and performance i.e., assessments, individual contracts, etc.
The School Site Council (SSC), composed of community members, parents, and staff, representing each grade level, is well-informed of assessment data. They look at assessment trends in English Language Arts, Math, Science, Physical Education, and significant subgroups. SSC uses data to assist with goal setting. Staff develops objectives and action plans. There is on-going review of the school plan and adjustments are made accordingly.
Throughout the school, documents are posted in several languages. Ruskin’s website has links to Vietnamese, Chinese and Spanish versions of important documents i.e. Star test results. Ruskin sends home a monthly newsletter, “Ruskin Reporter”. Ruskin participates in “Book It” ( Pizza Hut) and “Reading is Cool” (San Jose Sharks), which encourage students to read daily and maintain a log of their daily reading minutes. Once books are completed, students take an Accelerated Reader test and receive immediate feedback.
Ruskin has an active website and PTA to further communicate assessment data with the community. Collaboration and communication with parents are on-going through ELAC, SSC, and PTA with an explanation of noted assessment trends and next steps. The Cycle of Inquiry and backward planning has been instrumental in guiding staff to a better understanding of data, in targeting student needs, in developing lesson plans, in reteaching and in retesting. Ruskin strives to ensure that all stakeholders understand the data.
4. Sharing Lessons Learned:
Ruskin has shared successful strategies and best practices within the Berryessa District and beyond its boundaries to the academic community. . Staff has been instrumental in leading, and active in sharing lessons and strategies during district-wide staff meetings, grade level meetings, and professional development days. Teachers utilize district email and committees to highlight strategies and lessons that work i.e., learning songs that aid in understanding concepts, using literature to introduce a lesson, swapping ideas on use of picture dictionaries, map graphing skills and surveys. Houghton Mifflin extension lessons have been distributed through on-line message boards like MAESTROS and Teachers College Message Board (Columbia University).
Ruskin teachers who have attended county and regional workshops and/or learning communities have shared their lesson plans with the Santa Clara County Office of Education Physical Sciences Learning Community, through “Collaborative Teaming” workshops, “B.E.S.T. Training”, “Cycle of Inquiry,” and “ALL” training.
Staff have also led trainings on the “Use of Icons for Differentiation” for the district’s Summer School Program, on GATE certification through Santa Clara University and the Santa Clara County Office of
11

Education, reading strategies at the Asilomar Reading Conference, and on “Best Practices” at the California Distinguished School Award event.
There are a number of teachers who are/have taken teacher credentialing coursework (i.e., San Jose State University), graduate degree level (Master’s) classes (i.e., San Jose State University, National University), or continuing education courses (i.e., San Jose State University, Vanguard University) and shared their practice in those settings. Many grants secured by Ruskin teachers require filing lesson plans on websites i.e., Silicon Valley Education Foundation’s Lessonopoly.com. Lessons range from science/math integration with the performing arts to yoga, from colonial music suggesting causes of the American Revolution to character studies using The Phantom Tollbooth.
Every year, Ruskin hosts student teachers from San Jose State University and National University as well as Independence High School’s Teaching Academy. Ruskin teachers assist aspiring educators in almost all aspects of the teaching profession: lesson planning, instruction, assessment, and evaluation.
Ruskin’s successful strategies have also been shared with state and professional associations. Ruskin representatives have presented workshops on differentiated instruction at the California Association for the Gifted (CAG) conferences in Sacramento and Palm Springs, California; “Schools for Scholars” in St. Louis, Missouri and “Skills Needed for the 21st Century” in Vancouver, British Columbia, Canada, for the National Association of Gifted conferences; and with the International Association for the Gifted in Malaysia.
12

PART V - CURRICULUM AND INSTRUCTION 11CA3
1. Curriculum:
Ruskin’s core curriculum is derived from California’s public schools’ standards. All text book adoptions, assessments, report card documents, and expectations are based on these state standards which are linked to national standards.
Ruskin’s English Language Arts (ELA) program’s main components are word analysis and vocabulary development, reading comprehension, literary response and analysis, written conventions, and writing strategies.
The mathematics program is focused on number sense, algebra and functions, measurement, and geometry, statistics, data analysis and probability, mathematical reasoning and problem solving. These strands are begun in kindergarten and developed through 5th grade.
The science curriculum is organized with specific areas of focus in both life and physical science units at each grade level. The scientific method, experimentation, observation, recording and reporting data are skills that are taught and practiced through all grade levels. Science knowledge is reinforced through student science projects presented at the annual “Science Fair”, with 80% of Ruskin students in grades K-5 presenting individual projects in the categories of experimentation, demonstrations, collections, and models.
The core curriculum for physical education consists of physical endurance, motor development, aerobic capacity, upper body strength, flexibility, and measurement of body composition.
Instruction is delivered in individual classrooms and organized by grade level. Class sizes range from 24 to 32 students per teacher. Instruction consists of direct instruction, student projects, assigned student reading, small group instruction, instructional assistant support (para-educators) for students with identified need, homework assignments, special education instruction for students with Individual Education Programs (IEPS) and some cross-age tutoring. Students are grouped and instructed according to assessed ability and need, though student placement in classrooms is heterogeneous.
Ruskin strives to challenge all students to excel academically, socially, and physically by providing project-based, hands-on, curriculum integrated field trips, curriculum-based art projects, and inquiry-based education. Differentiated instruction is practiced across curricular areas in order to provide high standards for all students.
Ruskin has a very diverse student population. To celebrate cultural diversity, Ruskin draws on various programs like Arts Attack, Art Express, multicultural assemblies, Project Cornerstone, art docent visits, Water District presentation, Family Fun Night, parent -led art classes, and supplemental multicultural media.
Multicultural Assemblies Ruskin celebrates the diversity of its community by holding multicultural assemblies. These assemblies play an important role of reaching the ever-changing population of students, staff and community members. It also reinforces the importance of understanding and appreciating different cultures, different ways of life and value systems. Students learn about well-known people within Ruskin’s diverse ethnic communities and they also perform dances and songs dressed in traditional costumes.
13

Visual and Performing Arts Ruskin is instrumental in offering music classes to students in grades 3-5. Students may sign up for band or strings where they elect to play percussions, brass, strings, woodwinds, or flute. Twice a year, a band concert is held for families and friends. Art Express is a City operated program offered to San Jose and Santa Clara County Educators to give their students experience in the visual arts. This program involves field trips to local museums after lessons to focus students’ awareness. Art Docent Program is another high interest, enriching, and interactive art educational program which addresses the Visual Arts Standards. An Art Docent visits the classroom and makes a portfolio presentation. The presentation featured 10-12 art works and explores the artists and the elements of visual arts.
Project Cornerstone - Project cornerstone is a program that is run by parents. The teachers sign up for parent volunteers to go to their class once a month. Parents read literature from their culture and do a small project specific to their culture. This program has very positive impact on ELL students. It teaches them reflective thinking, and empowers the students by validating their culture, language, their experiences, and the student themselves. This enriches the socio-cultural experience of both the minority language and majority language students.
The Physical Education, Health, and Nutrition Program Ruskin School’s successful fitness program have been reported in local news stories several times. Ruskin has won these Governor’s Fitness Challenge awards - Front Runner's Prize in February, 2008, and was the regional winner in 2010. Ruskin students had the honor to help set a Guinness World Record - “Most People Skipping Rope” (multiple locations). The students, along with teachers, staff, and community members jumped. Ruskin holds special school events like “Walk to school Day”, “Jump for Heart”, “Field Day”, “Walk-a-thon” and the “RuskinFit Program” to promote the spirit of Ruskin Fitness. Several teachers at different grade levels teach yoga and jazzercise to their students. The physical education teacher gives physical fitness tests to all the students in grade 3-5. To further train their students, 5th grade teachers take their students to Piedmont High School to run a mile lap. A RuskinFIT garden is planned for this year to further promote Health and Nutrition.
2. Reading/English:
Ruskin’s reading curriculum consists of the Houghton Mifflin Basal Reading Program, Literature Focus Units, Literature Circles, and Reading and Writing Workshops. Teachers use more than one approach to teach literacy due to the socioeconomic, ethnic, cultural, and learning diversity of its student population.
Basal Reading Program: Ruskin implements a state-adopted basal reader, Houghton Mifflin. The series contains reading selections along with specific Language Arts learning goals, practice workbooks and related instructional materials at each grade level.
Literature Focus Units: Teachers have created literature units to help students acquire foundational reading skills, including comprehension. For example, when reading Charlotte’s Web, prior knowledge is accessed. Language of the discipline is introduced. Throughout each and every chapter, the big idea is explored through details, multiple perspectives and ethics. Students discover that the main big idea of the book is relationships. To assist in this discovery, students also learn how to structure paragraphs, summarize and review, make predictions, and pay attention to supporting cues.
Literature Circles: Across grade levels, students select books to be read independently and/or with buddies. Of importance is that students are reading something that interests them. Consequently, they summarize, learn vocabulary, and make connections.
Reading and Writing Workshops: Students select books to read and topics for writing based upon selected books. Teachers provide guidance and training with the Writing Process which include book reports. Finished written products are shared with classmates. Responses to books are entered into reading Logs and Journals.
14
A variety of activities and resources further promote literacy. Daily reading is recorded in a “Ruskin Reads” calendar. Websites like BrainPop provide ideas for specific reading skills. Sustained Silent Reading (SSR) is practiced in every classroom. Oral language activities are a ritual in the lower grades with morning messages, patterns within words, poems of the week, songs, and rhyme games. Form and function is integrated throughout lessons to assist students in all grades with oral and written language.
Students performing below grade level are recommended for the Extended Day After School Program. Specific skills are targeted. Students are taught mini-lessons. Assessment is on-going to ensure students understand reading skills. During class time, struggling students are teamed with volunteers to assist with structural analysis, vocabulary development, comprehension, phonemic awareness, and writing skills in a one-on-one or small group setting. Teachers float from one group to another to assist or provide mini-lessons as needed.
3. Mathematics:
At Ruskin Elementary two mathematic programs are used to teach our diverse student population. Both mathematic programs provide support for ELL students as well as teacher resources that supplement the programs. Macmillan/McGraw-Hill, California Mathematics is used in grades K-2. This program focuses on math concepts, skills, and problem solving. It uses vertical alignment that provides learners with an articulated, coherent sequence of content. The program ensures that state standards and units of study are introduced, reinforced, and assessed according to student needs with the California Mathematics Standards. The specific focus areas for K-2 are problem solving, money, time, measurement, fractions, and computation. These focus areas provide the foundation for the upper grade mathematic program.
Scott Foresman Addison Wesley, enVisionMATH California is the program used in grades 3-5. enVisionMATH California is built on a strong research base and authored by the nation's top math experts and educators. enVisionMATH California is centered around interactive and visual learning and differentiated instruction to address the specific needs of all students. Scott Foresman Addison Wesley and Silver Burdett Ginn Mathematics programs provide a strong basis for success. The specific focus areas for grades 3-5 are number sense, statistics, data analysis, probability, algebra functions, measurement geometry, and mathematical reasoning.
Instructors use a variety of strategies to foster learning with all mathematic levels. In the lower primary grades K-2, strategies and practices include: Daily calendar activities (tallying, graphing, patterns, place value, coin value, days of the week, songs, clock skills, number sequence); Manipulatives used to reinforce math lessons (patterns, geometry, addition, subtraction, sorting, graphing, counting); white boards to check for quick comprehension (word problem use, equation writing); Math literature (math stories are read to introduce concepts and reinforce skills); Before and After School Tutoring for short term needs and Extended Day After School for on-going needs.
In the upper primary grades 3-5, strategies include: Compartmentalized math groups based on assessment data where students are placed in flexible skill ability groups; Daily math is given in class to ensure coverage of grade level standards; Before and After School Tutoring is available for students in need; Extended Day After School Program with an emphasis on math; and Supplemental materials are provided to ensure understanding of concepts i.e., manipulatives, student whiteboards, mini quizzes, games, cross curriculum writing to explain how to set up and solve math problems. For all grade levels, parent volunteers assist with one-on-one instruction or small groups.
4. Additional Curriculum Area:
Earth, life, and physical sciences provide ways for understanding the world and everything in it. Math helps us make sense of the information we collect and allows us to make guesses/predictions for things seen and unseen. Math and science also help us learn and appreciate the visual and performing arts. Science is an “across the curriculum” activity. Efforts are made to build a foundation of inquiry. Using the AIMS program, Kindergarteners are introduced to the language of the discipline. Special projects
15

include observational drawings from multiple perspectives and collecting and using outdoor artifacts to create a pattern. Students make valuable connections to see the order, design, and beauty of their surroundings.
Every student is provided a 40 minute, once a week hands-on Science Lab. This program allows students of all capabilities and English language fluency to be successful in learning essential science concepts. Weekly labs maximize the engagement of students and help them “see and feel” the concepts thereby deepening understanding and learning. The role of the two Science Associates is to make science concepts relevant and interesting through novelty i.e., bringing information to a personal level. The role of the classroom teachers is to introduce concepts and to reinforce new learning(s). Checking for understanding occurs through class discussions and journal reflections. This feedback assists in the modification of instruction and/or reinforcement of concepts.
The Science Lab is equipped with technology to provide the most optimal learning environment possible. Science Associates prepare materials and gather resources for all labs. Materials are ready when students enter so no class time is wasted in prep. At the conclusion of lab, Science Associates put away materials and prepare for the next class.
Alignment of the standards to the adopted text, classroom lessons and hands-on activities in the Science lab is a result of the STEMS project training provided by the Santa Clara County Office of Education. Each Science lab activity is coordinated with Science standards, the adopted text and the classroom science program. When students learn the Scientific Method, they learn how to gather and use information to come to a conclusion. Not only are Ruskin students learning to think scientifically, they are learning essential thinking skills for all areas of their life. By working individually, with a partner or in collaborative groups, students develop responsibility as well as respect for each other and the scientific processes.
5. Instructional Methods:
Ruskin school has a wide spectrum of student needs, cultural differences, and learning styles. Differentiation is a must. A variety of strategies for differentiated instruction is practiced to better address and manage the diversity of needs.
In various classrooms, Depth and Complexity Icons are used to address needs. These icons consist of identifiable pictures representing words or ideas. Students identify and look for ethics, rules, patterns, big ideas, details, trends, unanswered questions, perspectives, etc. They are related to whatever content is being taught. As teachers plan lessons, they consider how they cross disciplines, as well as examine the language of those disciplines. Through the icons, students are able to develop critical thinking skills.
Flexible grouping patterns based on readiness and ability occur in whole group, small group, or one-on-one instruction. Regrouping occurs often as a result of formative assessment findings. Using the Cycle of Inquiry, teachers collaborate and scaffold activities to ensure student learning and achievement. Student products are tiered.
Parent helpers, Teaching Academy students and college volunteers support students with their learning. Fifth graders are "Big Buddies" to kindergarteners and first graders. They work in pairs reading, writing, problem solving, making projects and performing in plays. Teaching Academy students work in small groups, individually or whole group to support student learning. Based on assessments, modification of instruction occurs in targeted focused instruction with smaller “teacher-student” ratio.
With our low-achieving students, teachers initiate the Student Study Team (SST) process. The referring teachers work with the Resource Specialist (RSP) to address student needs. If recommended, an Individualized Education Program (IEP) is created. Written communication is maintained between all concerned professionals and parents. Caring committed paraeducators are also an integral part of the special education program.
16

Children whose primary language is not English are screened. ELD and ESL services are provided for students who are classified as Limited or Non-English speaking. Forty five minutes of instructional time is allotted daily. Children are grouped according to their language proficiency level. A specific handbook supplies comprehensive guidance for teachers providing differentiated instruction to students at the stages of English language proficiency. Oral language development activities include total physical response, poems, songs, dialogues, shared storytelling, realia, language experience stories, visual aids, etc. Targeted language skills are directly taught and practiced in a series of lessons. Academic language is explicitly identified and used as a component of reading comprehension which includes vocabulary, grammar and writing skills.
6. Professional Development:
Ruskin is dedicated to the success of all students. In Berryessa School District, 31% of students are identified as English Language Learners (ELL). Ruskin has 41% ELLs. Learners from diverse multicultural groups and students with disabilities, along with Gifted and Talented (GATE) students continue to present challenges. To meet the dynamic needs of Ruskin’s population, professional development is ongoing. It is also an extension of the district’s focus on student achievement.
Ruskin and the district have implemented programs to help students master language skills essential for academic success. The ELL plan is designed and monitored by an English Language Advisory Committee (ELAC) made up of staff members, community members and the principal. Last year all staff participated in district professional development in ELD. There is an adopted ELL teaching curriculum implemented daily for all ELL students. This year all teachers are focused on Math and ELD as part of their professional development.
Ruskin staff is engaged in continued educational courses, workshops linked to standards, grade level meetings, and staff meetings. Staff members attend the annual California Association for the Gifted (CAG) conference and other CAG workshops for training in meeting the needs of GATE students. In the year 2008-09, the fourth and fifth grade staff attended yearlong Physical Science Teaching Training by SCCOE (see 2007-2008 Science scores). It provided them with effective teaching strategies in the physical sciences. In the year 2009-10 the entire staff was engaged in district run staff development in various subjects ranging from P.E to Arts. At present several upper grade teachers (grades 4/5) are participating in a three year training program in the study of history called “BOETAH” (Berryessa, Oakgrove, Evergreen Teaching American History). Many teachers are participating in the San Jose Writing Project that will equip them with differentiated teaching strategies for writing.
All new teachers are part of "Beginning Teacher Support and Assessment", a state-funded induction program, co-sponsored by the California Department of Education (CDE) and the Commission on Teacher Credentialing (CCTC) . It is designed to support the professional development of newly-credentialed, beginning teachers.
In summary, Ruskin teachers take an active part in trainings developed at the school site, in District in-service trainings, and in trainings by many educational organizations beyond the district. Professional development is guided by reviewing standards based assessment data and identifying student needs. Goals are developed, and professional development is crafted to reach these goals.
7. School Leadership:
Ruskin's leadership philosophy revolves around collaborative decision-making. Staff input is encouraged and shared at staff and grade level meetings and through emails. At times, the Leadership Team will handle an issue, then present the background and options to their grade level colleagues (or the staff, if mutually agreed upon). It is understood that the principal has the final determination.
The structure of leadership begins with the Leadership Team, comprised of a representative from each grade level K-5. Serving on the Leadership Team is a distinction for teachers who are asked to be the
17

lead. Other members of the Leadership Team are the principal and the classified staff representative. Information flows from staff through the Leadership Team representative(s) and vice-versa. While some decisions are made solely by the Principal, they are usually considered with staff input.
In addition to the Leadership Team, there are other decision-making groups i.e., the Parent Teacher Association (PTA) (for organizing events). School Site Council (SSC) is one influential leadership group that features a more fair representation of the Ruskin community. Comprised of elected parents, community members, certified and classified staff representatives, plus the principal, the SSC helps to keep the school's focus on goals outlined in the School Development and Improvement Plan (SDIP). Their meetings are data-driven and involve the analysis of the effectiveness of school-wide services and resource allocations.
With regards to school policies, Ruskin's Leadership Team and the SSC work with the principal to ensure the school site plan is revised yearly through staff and community input, based on the most recent student data, correlated with district goals, and targeted to assist students with the most need. The SSC identifies trends in assessment data. The Leadership Team brings this information back to staff. Staff verifies information and develops objectives and an action plan to improve student achievement.
The maintenance of relationships, business sponsorships and organizational partnerships, is what helps buoy the school despite dwindling resources. Ruskin has a partnership with HP Pavilion which enables parents to volunteer and designate a portion of their earned funds to school services. Ruskin staff also secure funds and materials through grants and voluntary programs.
Non-monetary relationships are maintained with city departments (i.e., police, traffic), non-profit organizations (i.e., Kiwanis' K-Kids Club), and community organizations (i.e., Chinese school). Leadership is a sharing of responsibility by all. Ensuring focus on improving student performance is at the forefront of Ruskin's Leadership Teams.
18

PART VII - ASSESSMENT RESULTS
STATE CRITERION-REFERENCED TESTS Subject: Mathematics Grade: 2 Test: California STAR Test Edition/Publication Year: N/A - Annual Publisher: ETS
2009-2010 2008-2009 2007-2008 2006-2007 2005-2006
Testing Month May May May May May
SCHOOL SCORES
Math Proficient and Above 85 88 87 79 92
Math Advance 63 68 60 61 72
Number of students tested 106 90 119 90 102
Percent of total students tested 24 21 25 20 23
Number of students alternatively assessed
Percent of students alternatively assessed
SUBGROUP SCORES
1. Free/Reduced-Price Meals/Socio-economic Disadvantaged Students
Math Proficient and Above 72 79 82 68 88
Math Advance 36 37 46 29 73
Number of students tested 25 19 28 28 26
2. African American Students
Math Proficient and Above
Math Advance
Number of students tested
3. Hispanic or Latino Students
Math Proficient and Above 53 53 62 45
Math Advance 24 15 31 36
Number of students tested 17 13 16 11
4. Special Education Students
Math Proficient and Above
Math Advance
Number of students tested
5. English Language Learner Students
Math Proficient and Above 87 90 93 76 94
Math Advance 62 70 68 55 72
Number of students tested 68 66 85 56 40
6. Asian
Math Proficient and Above 93 90 95 83 98
Math Advance 74 73 73 67 80
Number of students tested 70 70 84 55 71
NOTES: 11CA3
19

STATE CRITERION-REFERENCED TESTS Subject: Reading Grade: 2 Test: California STAR Test Edition/Publication Year: N/A - Annual Publisher: ETS
2009-2010 2008-2009 2007-2008 2006-2007 2005-2006
Testing Month May May May May May
SCHOOL SCORES
ELA Proficient and Above 78 83 76 68 82
ELA Advance 51 44 48 46 46
Number of students tested 106 90 118 90 102
Percent of total students tested 24 21 25 20 23
Number of students alternatively assessed
Percent of students alternatively assessed
SUBGROUP SCORES
1. Free/Reduced-Price Meals/Socio-economic Disadvantaged Students
ELA Proficient and Above 50 79 54 32 69
ELA Advance 23 21 25 18 23
Number of students tested 26 19 28 28 26
2. African American Students
ELA Proficient and Above
ELA Advance
Number of students tested
3. Hispanic or Latino Students
ELA Proficient and Above 29 38 38 27
ELA Advance 18 23 19 27
Number of students tested 17 13 16 11
4. Special Education Students
ELA Proficient and Above
ELA Advance
Number of students tested
5. English Language Learner Students
ELA Proficient and Above 80 83 82 61 83
ELA Advance 54 48 53 43 32
Number of students tested 68 66 85 56 40
6. Asian
ELA Proficient and Above 89 84 86 71 92
ELA Advance 63 50 57 56 49
Number of students tested 70 70 84 55 71
NOTES: 11CA3
20

STATE CRITERION-REFERENCED TESTS Subject: Mathematics Grade: 3 Test: California STAR Test Edition/Publication Year: N/A - Annual Publisher: ETS
2009-2010 2008-2009 2007-2008 2006-2007 2005-2006
Testing Month May May May May May
SCHOOL SCORES
Math Proficient and Above 87 98 94 74 85
Math Advance 51 83 74 68 60
Number of students tested 106 116 86 111 112
Percent of total students tested 24 27 18 25 25
Number of students alternatively assessed
Percent of students alternatively assessed
SUBGROUP SCORES
1. Free/Reduced-Price Meals/Socio-economic Disadvantaged Students
Math Proficient and Above 90 100 86 82 80
Math Advance 65 78 59 57 52
Number of students tested 20 27 22 28 21
2. African American Students
Math Proficient and Above
Math Advance
Number of students tested
3. Hispanic or Latino Students
Math Proficient and Above 100 90 43 58
Math Advance 60 45 14 25
Number of students tested 10 11 14 12
4. Special Education Students
Math Proficient and Above
Math Advance
Number of students tested
5. English Language Learner Students
Math Proficient and Above 94 98 93 84 86
Math Advance 77 91 72 67 50
Number of students tested 69 82 53 48 50
6. Asian
Math Proficient and Above 96 99 95 92 92
Math Advance 79 90 75 77 68
Number of students tested 72 87 56 75 84
NOTES: 11CA3
21

STATE CRITERION-REFERENCED TESTS Subject: Reading Grade: 3 Test: California STAR Test Edition/Publication Year: N/A - Annual Publisher: ETS
2009-2010 2008-2009 2007-2008 2006-2007 2005-2006
Testing Month May May May May May
SCHOOL SCORES
ELA Proficient and Above 87 88 82 69 73
ELA Advance 57 57 48 32 37
Number of students tested 94 117 86 111 112
Percent of total students tested 21 27 18 25 25
Number of students alternatively assessed
Percent of students alternatively assessed
SUBGROUP SCORES
1. Free/Reduced-Price Meals/Socio-economic Disadvantaged Students
ELA Proficient and Above 57 79 59 57 71
ELA Advance 24 32 23 21 24
Number of students tested 21 28 22 28 21
2. African American Students
ELA Proficient and Above
ELA Advance
Number of students tested
3. Hispanic or Latino Students
ELA Proficient and Above 82 73 21 58
ELA Advance 27 10 7 17
Number of students tested 11 11 14 12
4. Special Education Students
ELA Proficient and Above
ELA Advance
Number of students tested
5. English Language Learner Students
ELA Proficient and Above 86 90 75 67 64
ELA Advance 57 65 42 25 22
Number of students tested 69 82 53 48 50
6. Asian
ELA Proficient and Above 89 90 82 79 76
ELA Advance 61 66 54 39 40
Number of students tested 71 87 56 75 84
NOTES: 11CA3
22

STATE CRITERION-REFERENCED TESTS Subject: Mathematics Grade: 4 Test: California STAR Test Edition/Publication Year: N/A - Annual Publisher: ETS
2009-2010 2008-2009 2007-2008 2006-2007 2005-2006
Testing Month May May May May May
SCHOOL SCORES
Math Proficient and Above 80 84 83 74 74
Math Advance 60 65 62 41 56
Number of students tested 120 91 116 119 112
Percent of total students tested 27 21 25 27 25
Number of students alternatively assessed
Percent of students alternatively assessed
SUBGROUP SCORES
1. Free/Reduced-Price Meals/Socio-economic Disadvantaged Students
Math Proficient and Above 71 70 73 58 64
Math Advance 45 35 46 23 44
Number of students tested 31 23 26 26 25
2. African American Students
Math Proficient and Above
Math Advance
Number of students tested
3. Hispanic or Latino Students
Math Proficient and Above 28 53 30
Math Advance 14 20 18
Number of students tested 14 15 17
4. Special Education Students
Math Proficient and Above 46 25
Math Advance 13 17
Number of students tested 15 12
5. English Language Learner Students
Math Proficient and Above 63 69 76 67 81
Math Advance 42 42 43 26 55
Number of students tested 24 26 30 34 31
6. Asian
Math Proficient and Above 88 86 95 82 91
Math Advance 67 69 75 49 75
Number of students tested 94 59 80 87 77
NOTES: 11CA3
23
STATE CRITERION-REFERENCED TESTS Subject: Reading Grade: 4 Test: California STAR Test Edition/Publication Year: N/A - Annual Publisher: ETS
2009-2010 2008-2009 2007-2008 2006-2007 2005-2006
Testing Month May May May May May
SCHOOL SCORES
ELA Proficient and Above 80 80 76 74 78
ELA Advance 60 56 48 45 57
Number of students tested 120 91 116 119 112
Percent of total students tested 27 21 25 27 25
Number of students alternatively assessed 11
Percent of students alternatively assessed 3
SUBGROUP SCORES
1. Free/Reduced-Price Meals/Socio-economic Disadvantaged Students
ELA Proficient and Above 64 65 62 58 56
ELA Advance 44 35 27 19 40
Number of students tested 36 23 26 26 25
2. African American Students
ELA Proficient and Above
ELA Advance
Number of students tested
3. Hispanic or Latino Students
ELA Proficient and Above 29 47 53
ELA Advance 21 7 29
Number of students tested 14 15 17
4. Special Education Students
ELA Proficient and Above 49 25
ELA Advance 20 25
Number of students tested 15 12
5. English Language Learner Students
ELA Proficient and Above 50 54 50 65 71
ELA Advance 21 19 17 21 55
Number of students tested 24 26 30 34 31
6. Asian
ELA Proficient and Above 85 81 82 83 89
ELA Advance 66 59 56 57 73
Number of students tested 94 59 80 87 77
NOTES: 11CA3
24

STATE CRITERION-REFERENCED TESTS Subject: Mathematics Grade: 5 Test: California STAR Test Edition/Publication Year: N/A - Annual Publisher: ETS
2009-2010 2008-2009 2007-2008 2006-2007 2005-2006
Testing Month May May May May May
SCHOOL SCORES
Math Proficient and Above 77 72 57 62 68
Math Advance 55 48 37 44 50
Number of students tested 100 116 134 114 117
Percent of total students tested 23 27 29 26 26
Number of students alternatively assessed 13
Percent of students alternatively assessed 3
SUBGROUP SCORES
1. Free/Reduced-Price Meals/Socio-economic Disadvantaged Students
Math Proficient and Above 58 61 36 46 45
Math Advance 29 36 18 27 30
Number of students tested 24 28 34 26 27
2. African American Students
Math Proficient and Above
Math Advance
Number of students tested
3. Hispanic or Latino Students
Math Proficient and Above 27 18 28 10
Math Advance 9 12 6 10
Number of students tested 11 17 18 10
4. Special Education Students
Math Proficient and Above 23 21 0
Math Advance 8 14 0
Number of students tested 13 14 11
5. English Language Learner Students
Math Proficient and Above 74 45 35 29 69
Math Advance 42 28 16 19 46
Number of students tested 19 18 31 21 35
6. Asian
Math Proficient and Above 84 83 73 77 84
Math Advance 66 59 47 58 65
Number of students tested 67 83 94 81 81
NOTES: 11CA3
25

STATE CRITERION-REFERENCED TESTS Subject: Reading Grade: 5 Test: California STAR Test Edition/Publication Year: N/A - Annual Publisher: ETS
2009-2010 2008-2009 2007-2008 2006-2007 2005-2006
Testing Month Feb May May May May
SCHOOL SCORES
ELA Proficient and above 82 73 68 69 66
Math Advance 51 42 37 46 43
Number of students tested 100 116 134 115 117
Percent of total students tested 23 27 29 26 26
Number of students alternatively assessed 13
Percent of students alternatively assessed 3
SUBGROUP SCORES
1. Free/Reduced-Price Meals/Socio-economic Disadvantaged Students
ELA Proficient and above 77 68 47 42 34
Math Advance 35 25 26 23 19
Number of students tested 26 28 34 26 27
2. African American Students
ELA Proficient and above
Math Advance
Number of students tested
3. Hispanic or Latino Students
ELA Proficient and above 54 53 44 50
Math Advance 18 24 22 10
Number of students tested 11 17 18 10
4. Special Education Students
ELA Proficient and above 23 28 0
Math Advance 0 7 0
Number of students tested 13 14 11
5. English Language Learner Students
ELA Proficient and above 58 33 48 33 60
Math Advance 21 5 13 19 23
Number of students tested 19 18 31 21 35
6. Asian
ELA Proficient and above 87 80 80 80 81
Math Advance 57 52 49 57 56
Number of students tested 67 83 94 81 81
NOTES: 11CA3
26

STATE CRITERION-REFERENCED TESTS Subject: Mathematics Grade: 0
2009-2010 2008-2009 2007-2008 2006-2007 2005-2006
Testing Month May May May May May
SCHOOL SCORES
Math Proficient and Above 84 84 80 76 80
Math Advance 61 63 55 52 45
Number of students tested 442 436 468 443 446
Percent of total students tested 100 100 100 100 100
Number of students alternatively assessed 10
Percent of students alternatively assessed 2
SUBGROUP SCORES
1. Free/Reduced-Price Meals/Socio-economic Disadvantaged Students
Math Proficient and Above 67 77 66 64 68
Math Advance 39 47 40 34 49
Number of students tested 121 109 120 113 102
2. African American Students
Math Proficient and Above 54 59 54 54
Math Advance 31 42 36 27
Number of students tested 14 13 12 12
3. Hispanic or Latino Students
Math Proficient and Above 49 61 44 46 36
Math Advance 26 29 20 17 24
Number of students tested 50 47 63 66 51
4. Special Education Students
Math Proficient and Above 63 71 41 41 33
Math Advance 25 24 14 17 24
Number of students tested 40 34 32 50 36
5. English Language Learner Students
Math Proficient and Above 75 86 81 78 84
Math Advance 63 71 57 56 56
Number of students tested 195 204 207 164 158
6. Asian
Math Proficient and Above 90 85 90 83 91
Math Advance 71 66 67 62 72
Number of students tested 313 305 318 300 313
NOTES: 11CA3
27
STATE CRITERION-REFERENCED TESTS Subject: Reading Grade: 0
2009-2010 2008-2009 2007-2008 2006-2007 2005-2006
Testing Month May May May May May
SCHOOL SCORES
ELA Proficient and Above 81 81 76 71 74
ELA Advance 52 48 44 41 46
Number of students tested 442 436 468 443 446
Percent of total students tested 100 100 100 100 100
Number of students alternatively assessed 24 22
Percent of students alternatively assessed 5 5
SUBGROUP SCORES
1. Free/Reduced-Price Meals/Socio-economic Disadvantaged Students
ELA Proficient and Above 88 73 54 47 56
ELA Advance 62 29 25 20 26
Number of students tested 121 109 120 113 102
2. African American Students
ELA Proficient and Above 61 58 54 54
ELA Advance 23 25 27 27
Number of students tested 14 13 12 12
3. Hispanic or Latino Students
ELA Proficient and Above 49 64 39 38 40
ELA Advance 28 31 15 14 22
Number of students tested 50 47 63 66 51
4. Special Education Students
ELA Proficient and Above 50 50 37 33 27
ELA Advance 19 19 14 12 18
Number of students tested 40 34 32 50 36
5. English Language Learner Students
ELA Proficient and Above 76 81 70 60 69
ELA Advance 48 57 38 30 31
Number of students tested 195 204 207 164 158
6. Asian
ELA Proficient and Above 87 81 83 79 83
ELA Advance 62 50 55 52 54
Number of students tested 313 305 318 300 313
NOTES: 11CA3
28