Blue Ribbon Commission Initial Technical Briefing · Blue Ribbon Commission Initial Technical...
63
Blue Ribbon Commission Initial Technical Briefing April 5, 2013 LSU 1
Transcript of Blue Ribbon Commission Initial Technical Briefing · Blue Ribbon Commission Initial Technical...

Blue Ribbon Commission Initial Technical Briefing
April 5, 2013LSU
1

Why Are We Here?
Emergency Situation with Evacuation Order• Residents been out of 150 homes since August 3, 2012
• 245 days, 35 weeks, 9 months

A World of SolutionsTM 3
Bayou Corne Community
700’

A World of SolutionsTM 4
1. Determine the amount of natural gas that may remain in the Mississippi River Alluvial Aquifer (MRAA) and shallow subsurface underlying the evacuation area to allow community members to safely return to the evacuation area.
2. Determine the current and future structural stability of the western edge of the Napoleonville Salt Dome with consideration of salt cavern operations and public safety.
3. Determine the stability and management of the sinkhole and underlying DRZ to protect public safety.
Major Issues to Address
A World of SolutionsTM 5
1. Establish appropriate remediation/monitoring benchmarks or conditions to ensure sustained public safety.
2. Define additional data needed to assess current conditions and define remediation/monitoring benchmarks.
Commission Must Address Two Key Factors:
A World of SolutionsTM 6
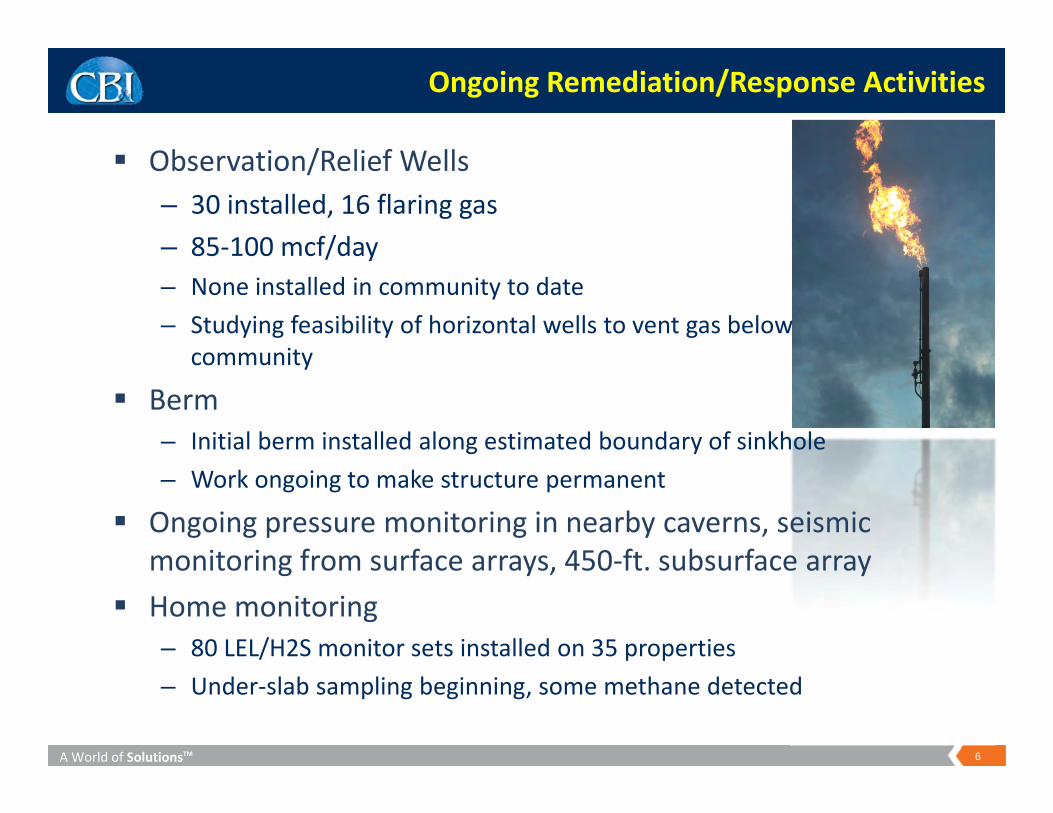
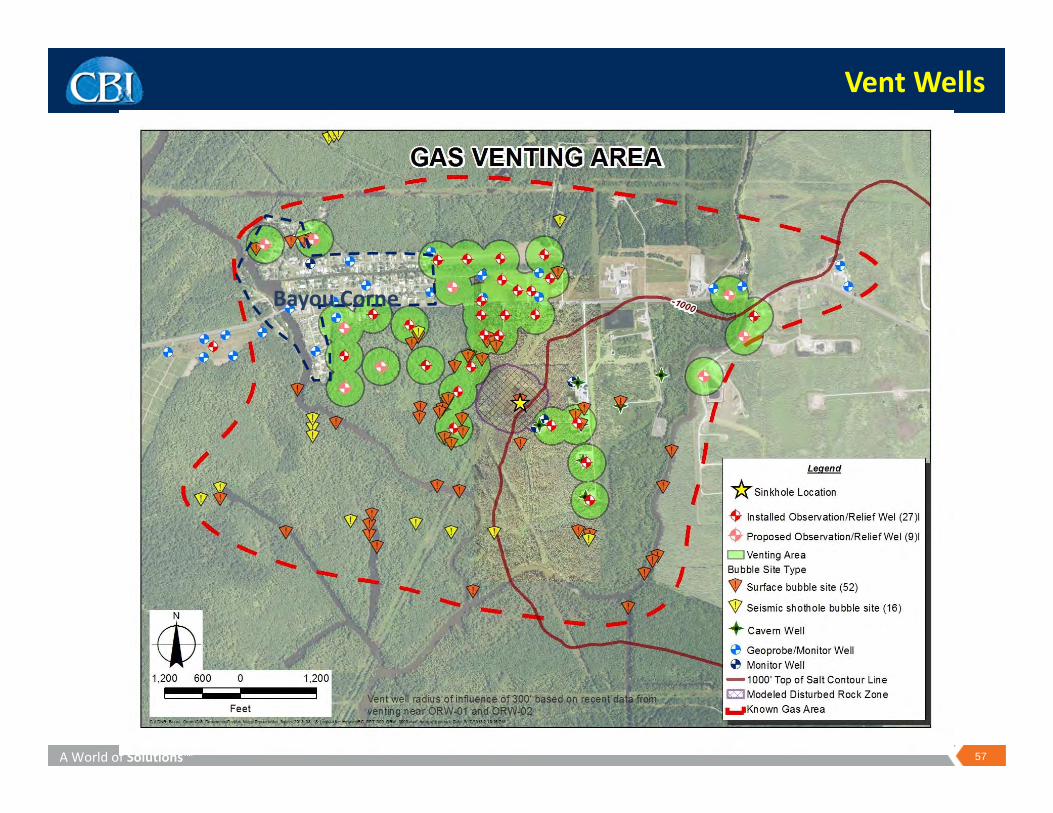
Observation/Relief Wells– 30 installed, 16 flaring gas – 85‐100 mcf/day– None installed in community to date – Studying feasibility of horizontal wells to vent gas below
community
Berm – Initial berm installed along estimated boundary of sinkhole– Work ongoing to make structure permanent
Ongoing pressure monitoring in nearby caverns, seismic monitoring from surface arrays, 450‐ft. subsurface array
Home monitoring – 80 LEL/H2S monitor sets installed on 35 properties– Under‐slab sampling beginning, some methane detected
Ongoing Remediation/Response Activities

A World of SolutionsTM 7
3D seismic—seismic investigative method used to image geologic formations, and gas and oil reservoirs in subsurface
CB&I—formerly Shaw, Shaw purchased by CB&I on Feb. 13, 2013 CERI—Center for Earthquake Research and Information @ Univ. Memphis DRZ—Disturbed Rock Zone, zone of fractured and broken rock adjacent to
and above Oxy 3 cavern, also called collapse zone Gas—Natural gas migrating through DRZ into MRAA and spreading out over 2
square miles of MRAA, >95% methane MEQ—Microearthquake, seismic event from rock breaking MIT—Mechanical integrity test MRAA—Mississippi River Alluvial Aquifer, sand and grave aquifer used for
industrial water supply in vicinity of Napoleonville Salt Dome ORW—Observation/relief well, aka vent well, for flaring gas TBC—Texas Brine Corporation VLP—Very long period seismic event (indicates fluid flow) VSP—Vertical seismic profile
Definitions and Acronyms

Napoleonville Salt Dome Location

NSD Location

A World of SolutionsTM 10
South Louisiana shallow/surface geology relatively young
Primarily Holocene/Pleistocene‐age sediment deposition from shifting courses of Mississippi River
Interbedded sand, silt and clay in shallower formations, trending toward alternating thicker units at depth
Deeper units Miocene and older Production units named from forams (tiny fossils) Numerous faults around flanks of dome
Regional Geology
A World of SolutionsTM 11
Salt domes common across South Louisiana LouAnn Salt—Thick early Jurassic salt layer at approximately 40,000 feet
Salt deposition from marine waters as North and South America separated
Weight/pressure of overlying formations pushes salt upward through fractures and/or discontinuities in overburden toward surface because salt has lower density than overlying formations
South Louisiana Salt Domes

A World of SolutionsTM 12
Salt forms column as it rises – friction commonly creates brittle, porous cap rock and highly pressured, impermeable side boundary creating shale sheath
Salt dome column creates complexity in nearby geologic formations by pushing upward and piercing overlying layers
Formations develop local fractures and faults as they dip upward and pinch out around salt dome boundaries
Irregular side boundaries of salt domes can create hydrocarbon traps in producing formations on flanks of dome
Salt Dome Interaction

A World of SolutionsTM 13
Freshwater injected into salt dome formation to dissolve salt and return it to surface – creates brine‐filled cavern over time
Some strictly used to create brine for use by industry for various purposes
Some brine‐mined caverns have been converted to storage of hydrocarbons –impermeability of salt formations considered ideal for hydrocarbon storage
Some caverns solution mined specifically to create hydrocarbon storage space
Solution Mining in Salt Domes
Brine
Fresh water
Diesel pad
A World of SolutionsTM 14
“Salt creep” – Effects of pressure of surrounding formations and plasticity of salt, salt caverns can begin to close, pressure rises when shut in or plugged
“Gassy salt” – Some salt domes release natural gas trapped in formation as salt is dissolved during brining
Casing/wellbore failure – Pipe/well infrastructure fails due to pressure/age, creating loss of mechanical integrity
Cavern collapse – Solution‐mined caverns brined too close to top of salt dome have collapsed to surface due to weight of overlying formations (No known incidence of sidewall collapse previous to Oxy 3 in 2012)
Historic Issues in Solution Mining

A World of SolutionsTM 15
Actively operated over area of about 1 mile (N‐S) by 3 miles (E‐W) – 54 caverns created since 1950s
Mix of brine mining to support petrochemical industry, hydrocarbon storage –
No previous cavern collapse history – One previous hydrocarbon storage cavern casing failure
leading to release and evacuation in 2003 (Gulf South incident)
3 caverns plugged and abandoned
Napoleonville Salt Dome

A World of SolutionsTM 16
Napoleonville Salt Dome Caverns

A World of SolutionsTM 17
Aquitard
Napoleonville Salt Dome
Consolidated silts and clays
Sand
Mississippi River Alluvial AquiferCap Rock
Sand
Sand
Sand Sand
0’
‐11,000’
‐5,000’
Elevation (ft)
0 6 miles
3:1 Vertical ExaggerationWest East
Sand 2.5 miles
‐2,500’
‐7,500’
Sand unit depths are conceptual only pending 3D seismic data.Gas and crude oil trapped along flanks of dome.
Conceptual Cross‐section Of Napoleonville Salt Dome
Caverns (conceptual)
Oxy 3

A World of SolutionsTM 18
Mississippi River Alluvial Aquifer– Top aquifer—120 ft.– Base between—400‐600 ft.– Water not used as drinking water due to dissolved solids (5,000) and
chlorides (2,500)
Cap rock above salt dome– Top—475' – Bottom— 700‐1,000' feet'– Anhydrite and gypsum
Miocene soft rock, sands, silts, clays, on western flank of dome
Salt dome – extends from ~ 700‐1,000 feet down to source layer at approx. 40,000 ft.
Site Geology

A World of SolutionsTM 19
Area around salt dome has been explored over time for oil/gas production potential
Little production at depths shallower than base of Oxy 3 (5,600 feet)
Mixed results at depths correlating to Oxy 3 cavern base (6,000 ft. to 8,000 ft.) – many dry holes, producing wells have not generally had strong initial production and have tended to play out relatively quickly
Complex nature of geology near salt dome (updips, localized faults etc.) mean productive depths/formations not homogenous over wider area
Local Hydrocarbon Production
A World of SolutionsTM 20
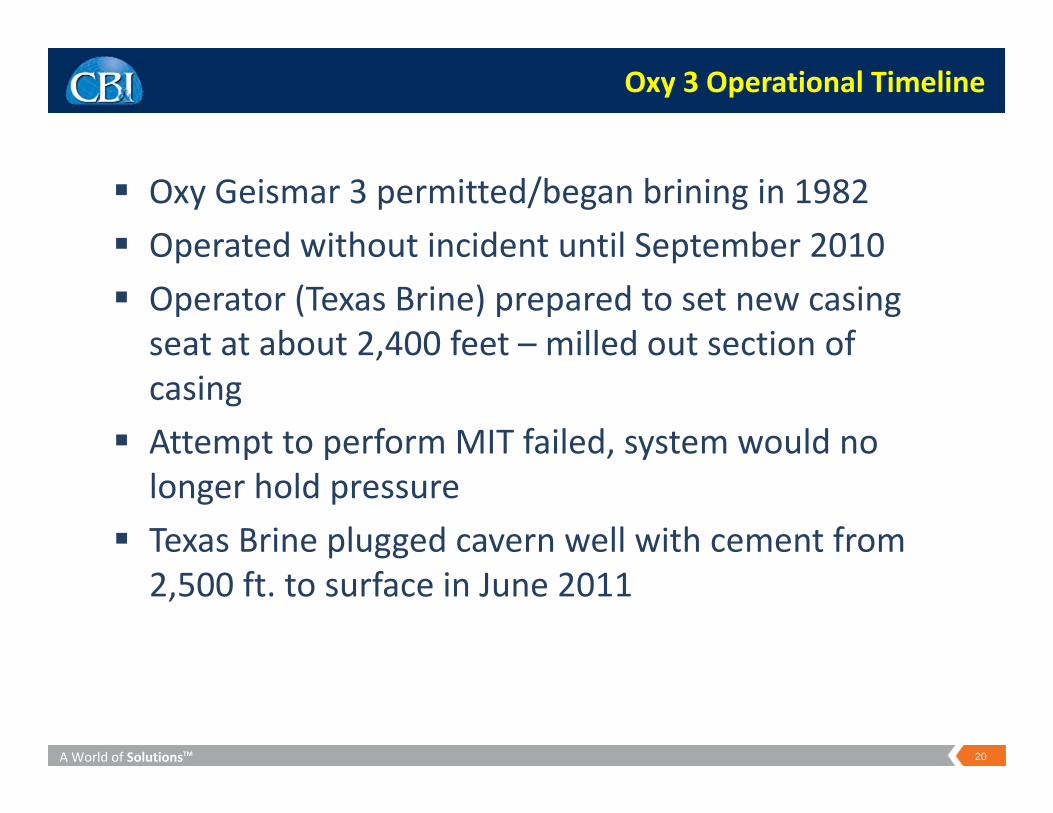
Oxy Geismar 3 permitted/began brining in 1982 Operated without incident until September 2010 Operator (Texas Brine) prepared to set new casing seat at about 2,400 feet – milled out section of casing
Attempt to perform MIT failed, system would no longer hold pressure
Texas Brine plugged cavern well with cement from 2,500 ft. to surface in June 2011
Oxy 3 Operational Timeline

A World of SolutionsTM 21
Vertical Seismic Profile (VSP) indicated base of cavern closer to edge of salt than previously believed but cavern collapse was not concern at time
No indication of problems until reports of tremors & gas bubbling in nearby waterways in May/June 2012
Tremors felt by nearby residents, USGS seismic monitors installed in July indicated seismic activity centered on western side of dome
Monitoring indicated several hundred significant seismic events a day in days before sinkhole observed on Aug. 3, 2012– Termed slurry hole because it was full of debris– Evacuation order issued by parish
Initial Indications of Oxy 3 Cavern Collapse

A World of SolutionsTM 22
Closest cavern to western boundary of salt dome
Top of salt at 700 ft., cavern roof at 3,400 feet, base of cavern at 5,600 ft.
Failure/collapse of sidewall of brine‐mined salt cavern Oxy Geismar 3
Likely began several months prior to initial indications at surface
Collapse at ~5,600 feet fractured to surface creating Disturbed Rock Zone (DRZ), zone of broken rock
DRZ now pathway for formation water, crude oil, natural gas to flow from deep formations to surface
MRAA aquifer sands flow down into DRZ, Unknown if salt involved in collapse
What Happened?

A World of SolutionsTM 23
Growth of DRZ (view towards SE)

A World of SolutionsTM 24
1. Collapse of cavern still ongoing as cavern space continues to fill in with sedimentary material
2. Subsurface movement continually changing width/depth of sinkhole as cavern fills and natural gas/crude oil are released from disturbed rock zone
3. Natural gas still flowing to surface/aquifer, occasional “burps” through sinkhole as void spaces shift
4. Natural gas bubbling to surface over ~ 2 square miles
Ongoing Cavern Collapse

A World of SolutionsTM 25
Seismic Monitoring Array

A World of SolutionsTM 26
Example: Active Seismic Period, 1/19/2013

A World of SolutionsTM 27
Seismic Events Histograms Associated With Oxy 3 Collapse
VLP Events—Very Long Period events indicting fluid movement
MEQ Events—MicroEarthQuakesindicating rock breaking
Ongoing data processing and analysis by Dr. Horton, CERI, and Dr. Pettitt, ItascaMarch 2013 data

A World of SolutionsTM 28
MicroEarthQuake (MEQ) Events
March 13, 2013events

A World of SolutionsTM 29
Very Long‐Period (VLP) Events
March 28, 2013events

A World of SolutionsTM 30
3830
3880
3930
3980
4030
4080
9/29 10/29 11/29 12/29 1/29
VERT
ICAL
DEP
TH (FEET)
OXY 3 CAVERN FILL DEPTH & FILL RATE
248 ft over 124 d2.0 ft/d
(1,450,000 bbls or 302,000 cy)
Cavern filling in over time as rock breaks and fills in
Filling rate 1‐2 feet per day Western wall of cavern still
collapsing Major fill event of 100’ from
1/17/2013 to 1/31/2013—related to seismic activity
Roof of cavern at 3400’, ~450’ to fill and January 29,2013
Next Oxy 3A bottom tag and sonar scheduled for April 9, 2013
Instability will likely continue at least until cavern is full
Cavern In‐filling Rate

A World of SolutionsTM 31
200
300
400
500
600
700
800
900
1000
1100
1200
1/12
1/19
1/26
2/2
2/9
2/16
2/23
3/2
3/9
3/16
3/23
3/30
4/6
4/13Pressure (p
si)
Oxy 3a Cavern Pressure Related To Burps In Sinkhole
Sinkhole Burp Events
Rapid Increase to 1150 psi
Collapsed hole re‐opened, crude oil removed
Hydrocarbon removal
Removal of brine
Hole blocked at 2,600’

A World of SolutionsTM 32
Other Caverns in Vicinity of Oxy 3
Salt dome
Cap rock
Bottom aquifer
Top aquifer
Caverns
Looking north, no vertical exaggeration
Sinkhole

A World of SolutionsTM 33
2013 VSP data delivered March 2013 indicates Oxy 1 is near the edge of salt.
Initial sinkhole analysis of potential Oxy 1 collapse
– Sinkhole most likely diameter estimation (if it happened) is 460 ft
– Sinkhole most likely depth estimation (if it happened) is 80 ft
Oxy 1 has been evaluated by DNR’s four cavern experts—no indication of instability at present.
Most seismic events adjacent to Oxy 3. Best thing to do with Oxy 1 is maintain
pressure and monitor microseismic activity.
Any future collapse would be preceded by months of seismic activity near Oxy 1.
Oxy 1 Stability

A World of SolutionsTM 34
Sinkhole Size Itasca Model Results for Oxy 1 Collapse

A World of SolutionsTM 35
2. BAYOU CORNE SINKHOLE
Continuously changing

A World of SolutionsTM 36
• Main sinkhole area—12+acres
• Settlement area—25 acres• Volume 1.2 million yd3 –increased from 550,000 yd3in October 2012
• ~700,000 yd3 migrated down DRZ
• Berm around outside of sinkhole to contain contamination
Sinkhole March 2013
W‐E Section
S‐N Sectio
n

A World of SolutionsTM 37
Itasca Modeling of Sinkhole Size
Sinkhole DiameterMost Likely = 734 ftWorst Case = 1400 ft
Sinkhole DepthMost Likely = 144 ftWorst Case = 346 ft
Itasca analysis

A World of SolutionsTM 38
Sinkhole Fall 2012

A World of SolutionsTM 39
Sinkhole January 2013

A World of SolutionsTM 40
Sinkhole with Berm March 2013
1000'1000'
A World of SolutionsTM 41
Sinkhole Changes Animation

A World of SolutionsTM 42
Sinkhole Cross‐Sections
‐450
‐400
‐350
‐300
‐250
‐200
‐150
‐100
‐50
0
0 100 200 300 400 500
Dep
th (ft)
Distance (ft)
CROSS‐SECTION S‐N
Depth 3/11/2013
Depth 1/11/2013
Depth 12/10/2012
Depth 11/16/2012
Depth 11/1/2012
Depth 10/30/2012
Depth 10/9/2012‐450
‐400
‐350
‐300
‐250
‐200
‐150
‐100
‐50
0
0 100 200 300 400 500
Dep
th (ft)
Distance (ft)
CROSS‐SECTION W‐E
Depth 3/11/2013
Depth 1/11/2013
Depth 12/10/2012
Depth 11/16/2012
Depth 11/1/2012
Depth 10/30/2012
Depth 10/9/2012
A World of SolutionsTM 43
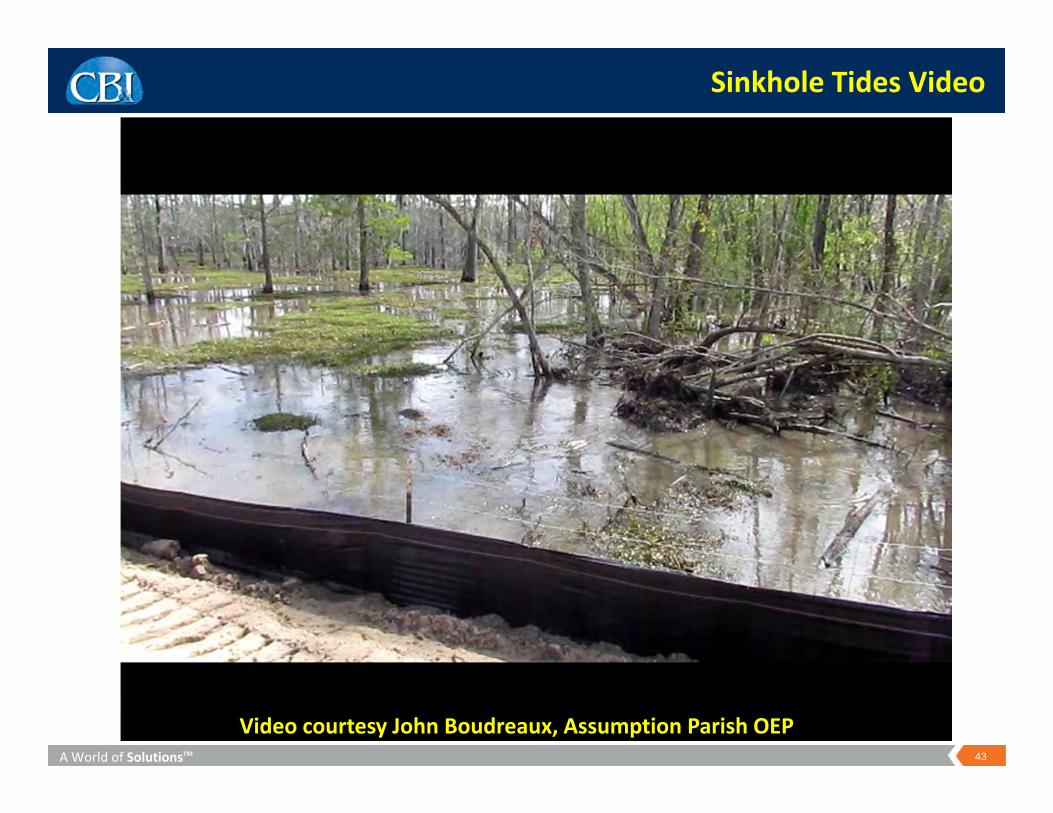
Sinkhole Tides Video
Video courtesy John Boudreaux, Assumption Parish OEP

A World of SolutionsTM 44
0
20
40
60
80
100
120
0 10,000 20,000 30,000 40,000 50,000 60,000 70,000 80,000
10/4 TDS 11/14 TDS Avg Industrial Well TDS Sea Water
Sinkhole Total Dissolved Solids
71,700
58,500
Based on concentration trend, TDS at ~350 feet = saturated brine TDS of 250,000 mg/L, bottom of alluvium @ ~450 feet

A World of SolutionsTM 45
3. Natural Gas (~99% methane) Migrating into MRAA

A World of SolutionsTM 46
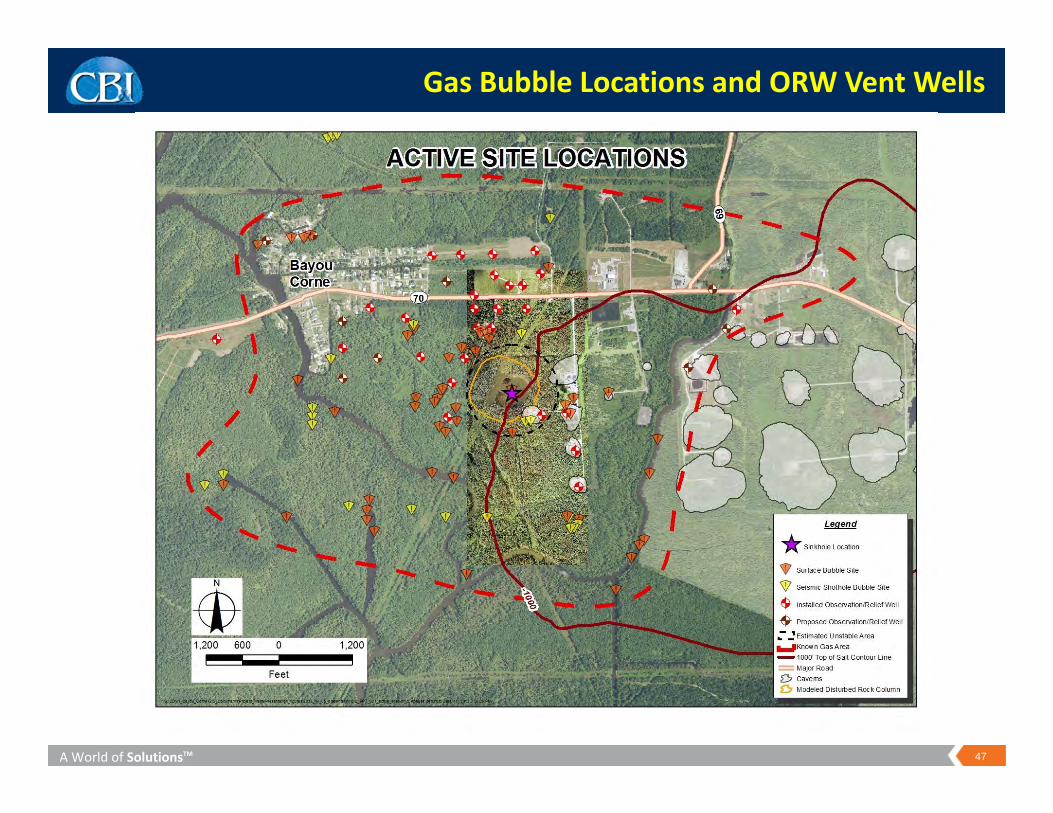
Natural gas flowing into aquifer thru DRZ and spreading laterally over 2 sq. miles – gas column 2 ft. to 10 ft. thick
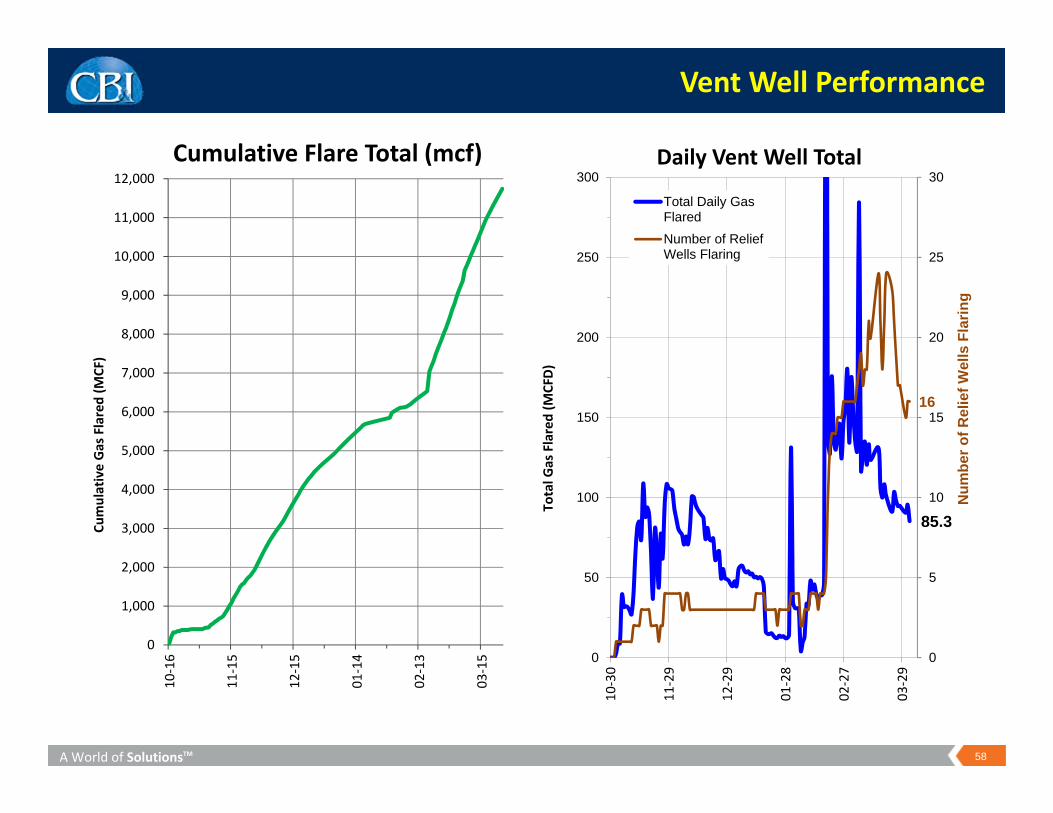
Estimated 45 mmcf (million cubic feet) in place, about 12 mmcf vented to date
Gas bubbling at over 50 identified bubble sites Gas bubbling observed in Bayou Corne community after rains
Depth and volume of reservoirs feeding natural gas currently being evaluated
Natural Gas Metrics
A World of SolutionsTM 47
Gas Bubble Locations and ORW Vent Wells

A World of SolutionsTM 48
Quantify Flow Rates of Gas Bubbles with the Bubble‐o‐Meter
Results—5 to 50 cubic feet per hour (100 to > 1,000 ft3/day)Known bubble sites—15 mcfd total over 26 sites
Used to calibrate biweekly videos

A World of SolutionsTM 49
Sinkhole “Rain‐drop” Bubbles video
Video courtesy John Boudreaux, Assumption Parish OEP

A World of SolutionsTM 50
Gas Thickness Map

A World of SolutionsTM 51
Clay
Shale
Gas Migration Conceptual Model
Sand
Sand andgravel
Gravel
Fine sand
DRZ
Sinkhole
Gas
Gas
Gas
Not to scale
Bayou Corne

Conceptual Shallow Gas Model
SWAMP GAS
FORMATION GAS
Barometric pressure changes can affect pressures day to day
Calculated gas flow rate very low

A World of SolutionsTM 53
Potential Gas Migration Into Homes
Clay Aquitard
Aquifer
Gas
From collapse zone
Slab‐on‐gradeConcern
Crawl spaceConcern
PiersNo Concern

A World of SolutionsTM 54
24 Geoprobe wells at depths of 20‐40 feet
Positive pressures over monitoring area
Bubbling observed in some wells Some wells self purge—lift water
column when wellhead valve opened
Low pressures (< ½ psi)are likely result of barometric pressure changes
Formation pressures are about the same across Bayou Corne area when water levels and depths are accounted for
Shallow Geoprobe Wells Monitor Pressure

A World of SolutionsTM 55
Gas Isotope Evaluation
Evaluation by Dr. Jonathan Myers, CB&I
1
10
100
1,000
10,000
100,000
1,000,000
‐90 ‐80 ‐70 ‐60 ‐50 ‐40 ‐30
C1/(
C2+
C3)
δ13C in Methane
Figure 2. Gas Ratios versus Carbon Isotope Ratios in Methane
ORWs
Bubble Sites
Oxy‐3 Cavern
Residential
Industrial Wells
Oxy‐1 Cavern
Biogenic Field
Thermogenic Field

A World of SolutionsTM 56
Source Horizons for Gas
A World of SolutionsTM 57
Vent Wells
Bayou Corne
A World of SolutionsTM 58
0
1,000
2,000
3,000
4,000
5,000
6,000
7,000
8,000
9,000
10,000
11,000
12,00010
‐16
11‐15
12‐15
01‐14
02‐13
03‐15
Cumulative Gas Flared (M
CF)
Vent Well Performance
Cumulative Flare Total (mcf)
85.3
16
0
5
10
15
20
25
30
0
50
100
150
200
250
300
10‐30
11‐29
12‐29
01‐28
02‐27
03‐29
Num
ber o
f Rel
ief W
ells
Fla
ring
Total G
as Flared (M
CFD)
Daily Vent Well Total
Total Daily GasFlaredNumber of ReliefWells Flaring

A World of SolutionsTM 59
Next Steps

A World of SolutionsTM 60
1. 2013 3D seismic survey to 7000 feet to image collapse zone and determine potential gas production zones
2. Oxy 3 bottom tag and sonar3. Final geotechnical analysis of core from 1,000‐foot well4. 3D geomechanical modeling of cavern stability and Oxy 3 collapse5. Replacement of deep salt seismic array originally installed in Oxy 1
a) Oxy 1 array had noise issuesb) TBC with MEQGeo and Magnitude (France) looking at various options for monitoring
salt volume between Oxy 1, 2, and 3 cavernsc) Results of monitoring modeling—mid‐April
6. Aquifer test data from new MRAA monitoring wells7. New sinkhole water quality depth survey8. Extent of gas investigation9. Radius of influence testing of ORW wells10. Basic gas migration model from Dr. Faust (Tetra‐Tech)11. TBC re‐logging ORW wells with PDK logs (issue with PDK not showing low gas
saturations)12. Shallow Geoprobe monitoring wells near ORW wells
Ongoing Data Collection/Modeling Activities
A World of SolutionsTM 61
Full extent of gas in aquifer being defined Rate and mechanics of gas migration from aquifer to shallow subsurface not yet fully understood
Permeability of aquifer Locations of seismic events
Known Data Gaps with Ongoing Work in Progress

A World of SolutionsTM 62
Late April/early May 2013 Site visit Define technical scope Define schedule—will be very aggressive
Three‐Day Workshop

A World of SolutionsTM 63
Bayou Corne Cavern Collapse—An Unprecedented Event