Blue Label is magnet for foot traffic half a million touch ... · PDF filehalf a million touch...
220
Blue Label is a magnet for foot traffic with over half a million touch points globally INTEGRATED ANNUAL REPORT 2017
-
Upload
trannguyet -
Category
Documents
-
view
231 -
download
7
Transcript of Blue Label is magnet for foot traffic half a million touch ... · PDF filehalf a million touch...
Blue Label is a magnet for foot
traffic with over half a million touch points globally
INTEGRATED ANNUAL REPORT 2017
BL
UE
LA
BE
L IN
TE
GR
AT
ED
AN
NU
AL
RE
PO
RT
20
17

BLUE LABEL INTEGRATED ANNUAL REPORT 2017
Report contents
p1 – 15STRATEGIC REVIEWKey facts 1Highlights 2Business model 3Our business 4Vision, mission and values 5How we work – business illustrated 6Approach and reporting frameworks 8Group operating structure 9Ten-year review 10Understanding material matters 12Ethical leadership and business conduct 15
p16 – 33LEADERSHIPBoard of Directors 16Senior Management 18Chairman’s report 20The Joint Chief Executive Officers’ report 22Financial Director’s report 26
p34 – 71GOVERNANCEGovernance philosophy and approach 34Effective and ethical leadership 35Board composition, structure and report back 37King IV functional areas 46Governance of risk 47Technology and information governance 48Compliance report 49Combined assurance 50Stakeholder relations 51Remuneration report 56Audit, Risk and Compliance Committee’s report 67
Social, Ethics and Transformation Committee’s report 71
p72 — 84OPERATING PERFORMANCEOperational overview 72Value added statement 78Social practices 80Human capital 81Health and safety 82Corporate social investment 83
p85 – 197FINANCIAL PERFORMANCEProminent notice 85Statement of Directors’ responsibility 85Approval of the financial statements 86Declaration by the Company Secretary 86Directors’ report 87Independent auditor’s report 90Group income statement 96Group statement of comprehensive income 96Group statement of financial position 97Group statement of changes in equity 98Group statement of cash flows 100Notes to the Group annual financial statements
101
Company statement of financial position 170Company statement of comprehensive income 171Company statement of changes in equity 172Company statement of cash flows 174Notes to the Company annual financial statements
175
p198 – IBCSHAREHOLDERS’ INFORMATION AND ADMINISTRATIONAnnexure to the Company annual financial statements – shareholder analysis
198
Notice of Annual General Meeting and proxy 200Glossary 213Administration IBC
www.bluelabeltelecoms.co.za

BLUE LABEL INTEGRATED ANNUAL REPORT 2017
1 /
Key facts
Founded in
2001Business model underpinned by long-termdistribution contracts
Main products and services:
u airtime, starter packs, data, hardware, postpaid contracts and content;
u electricity and water;
u ticketing; and
u financial, fintech and value-add services.
u Listed as BLU on JSE in 2007
u Market capitalisation R14.2 billion
u Free float 57% with diverse institutional shareholders
u ADRs launched in 2013
Maiden dividendpaid in September 2010
CSI spend R8.5 million and skills spend R9.4 million
BLUE LABEL INTEGRATED ANNUAL REPORT 2017
/ 2
Highlights
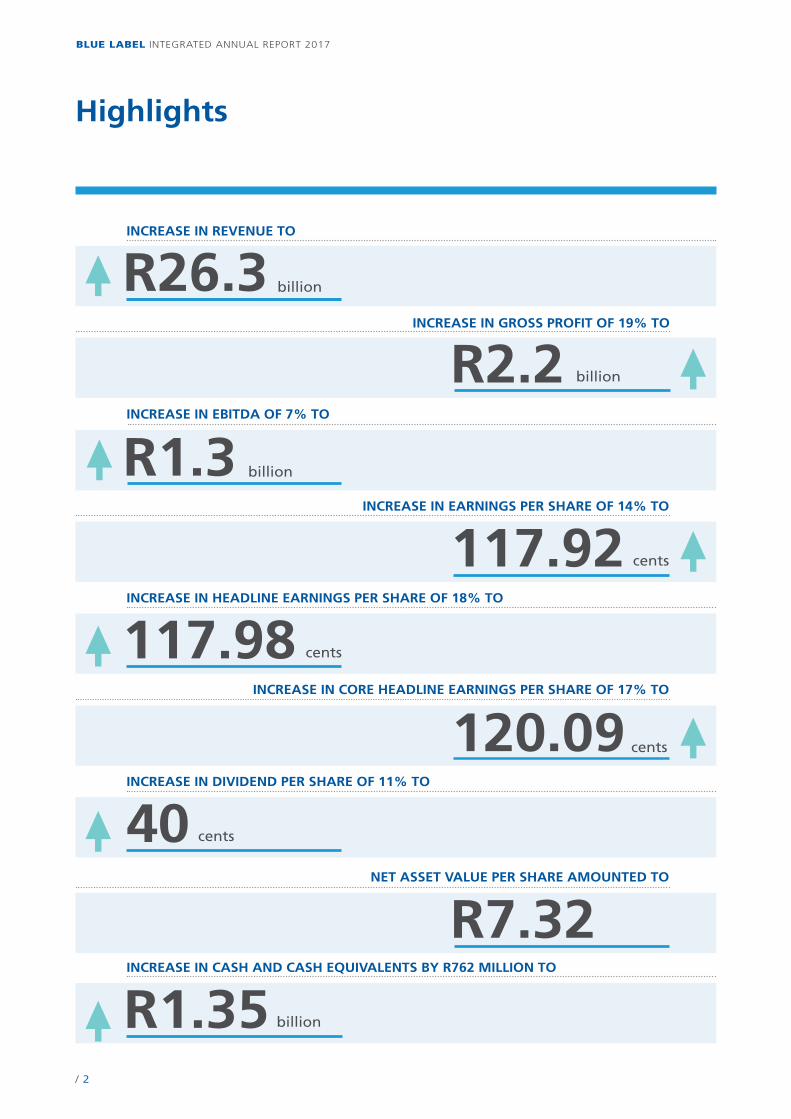
INCREASE IN HEADLINE EARNINGS PER SHARE OF 18% TO
cents117.98�
INCREASE IN REVENUE TO
R26.3 billion�
INCREASE IN GROSS PROFIT OF 19% TO
�
INCREASE IN EBITDA OF 7% TO
R1.3 billion�
INCREASE IN CORE HEADLINE EARNINGS PER SHARE OF 17% TO
120.09 cents �
NET ASSET VALUE PER SHARE AMOUNTED TO
R7.32
INCREASE IN DIVIDEND PER SHARE OF 11% TO
cents40�
INCREASE IN EARNINGS PER SHARE OF 14% TO
cents117.92 �
INCREASE IN CASH AND CASH EQUIVALENTS BY R762 MILLION TO
�R1.35 billion
R2.2 billion
BLUE LABEL INTEGRATED ANNUAL REPORT 2017
3 /
Business model
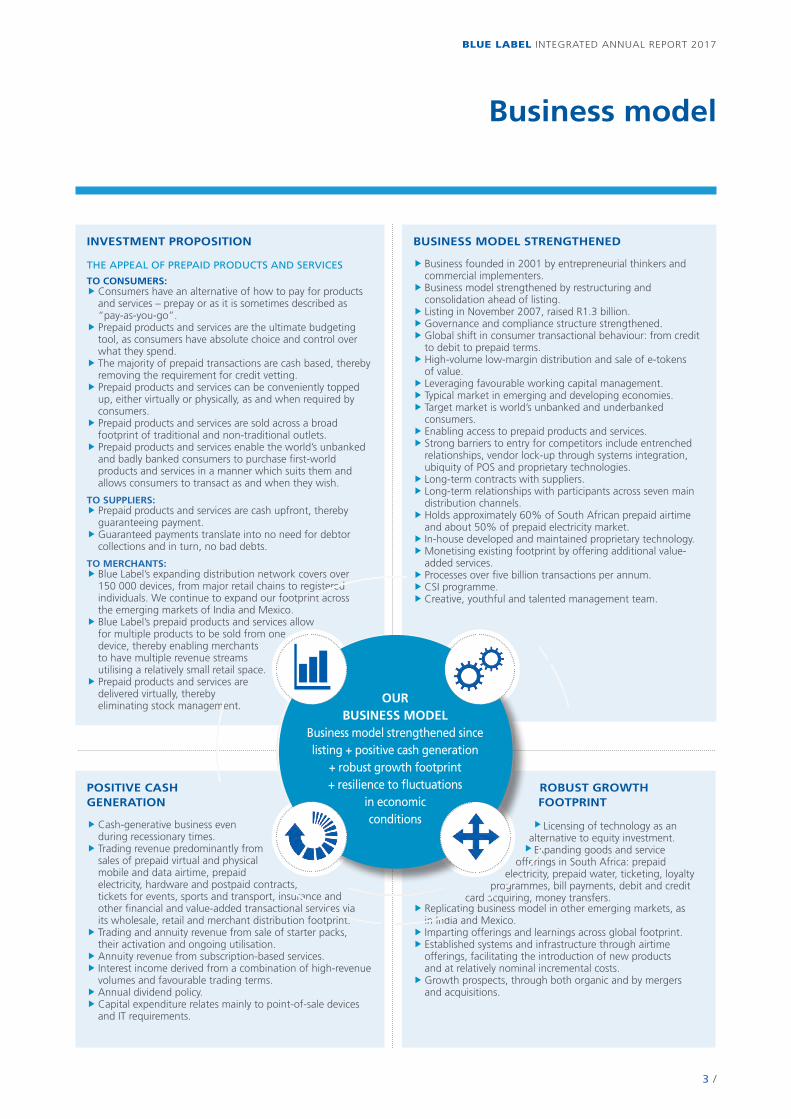
POSITIVE CASH GENERATION
�� Cash-generative business even during recessionary times. �� Trading revenue predominantly from sales of prepaid virtual and physical mobile and data airtime, prepaid electricity, hardware and postpaid contracts, tickets for events, sports and transport, insurance and other financial and value-added transactional services via its wholesale, retail and merchant distribution footprint.�� Trading and annuity revenue from sale of starter packs, their activation and ongoing utilisation. �� Annuity revenue from subscription-based services.�� Interest income derived from a combination of high-revenue volumes and favourable trading terms.�� Annual dividend policy. �� Capital expenditure relates mainly to point-of-sale devices and IT requirements.
ROBUST GROWTH FOOTPRINT
��Licensing of technology as an alternative to equity investment.��Expanding goods and service
offerings in South Africa: prepaid electricity, prepaid water, ticketing, loyalty
programmes, bill payments, debit and credit card acquiring, money transfers.
�� Replicating business model in other emerging markets, as in India and Mexico.�� Imparting offerings and learnings across global footprint. �� Established systems and infrastructure through airtime offerings, facilitating the introduction of new products and at relatively nominal incremental costs. ��Growth prospects, through both organic and by mergers and acquisitions.
INVESTMENT PROPOSITION
THE APPEAL OF PREPAID PRODUCTS AND SERVICES
TO CONSUMERS:�� Consumers have an alternative of how to pay for products and services – prepay or as it is sometimes described as “pay-as-you-go”.�� Prepaid products and services are the ultimate budgeting tool, as consumers have absolute choice and control over what they spend.�� The majority of prepaid transactions are cash based, thereby removing the requirement for credit vetting.�� Prepaid products and services can be conveniently topped up, either virtually or physically, as and when required by consumers.�� Prepaid products and services are sold across a broad footprint of traditional and non-traditional outlets.�� Prepaid products and services enable the world’s unbanked and badly banked consumers to purchase first-world products and services in a manner which suits them and allows consumers to transact as and when they wish.
TO SUPPLIERS:�� Prepaid products and services are cash upfront, thereby guaranteeing payment.��Guaranteed payments translate into no need for debtor collections and in turn, no bad debts.
TO MERCHANTS:�� Blue Label’s expanding distribution network covers over 150 000 devices, from major retail chains to registered individuals. We continue to expand our footprint across the emerging markets of India and Mexico. �� Blue Label’s prepaid products and services allow for multiple products to be sold from one device, thereby enabling merchants to have multiple revenue streams utilising a relatively small retail space.�� Prepaid products and services are delivered virtually, thereby eliminating stock management.
BUSINESS MODEL STRENGTHENED
�� Business founded in 2001 by entrepreneurial thinkers and commercial implementers.�� Business model strengthened by restructuring and consolidation ahead of listing.�� Listing in November 2007, raised R1.3 billion.��Governance and compliance structure strengthened.��Global shift in consumer transactional behaviour: from credit to debit to prepaid terms.�� High-volume low-margin distribution and sale of e-tokens of value.�� Leveraging favourable working capital management.�� Typical market in emerging and developing economies.�� Target market is world’s unbanked and underbanked consumers.�� Enabling access to prepaid products and services.�� Strong barriers to entry for competitors include entrenched relationships, vendor lock-up through systems integration, ubiquity of POS and proprietary technologies.�� Long-term contracts with suppliers.�� Long-term relationships with participants across seven main distribution channels.�� Holds approximately 60% of South African prepaid airtime and about 50% of prepaid electricity market.�� In-house developed and maintained proprietary technology.��Monetising existing footprint by offering additional value-added services.�� Processes over five billion transactions per annum.�� CSI programme. �� Creative, youthful and talented management team.
OUR BUSINESS MODEL
Business model strengthened since listing + positive cash generation
+ robust growth footprint + resilience to fluctuations
in economic conditions
BLUE LABEL INTEGRATED ANNUAL REPORT 2017
/ 4
Our business
With at least 50% of the global population without access to bank accounts, our prepaid offerings are a lifestyle enabler for the majority of people in the countries we service.
Blue Label is a JSE-listed company that provides innovative technology for mobile commerce to emerging markets in South Africa and abroad. Consumers are located in rural and
urban areas and our services enable
them to interact and transact on an
equal footing. We reach them by
utilising both physical and virtual
distribution channels. We are a lifestyle
enabler, rather than a technology
disruptor.
We target many of our services at
consumers who do not have easy
access to bank accounts, and we
provide them with the convenience
of being able to transact whenever is
suitable to them. Our solid reputation
is our licence to operate.
We know that prepaid provides
certainty and believe that if
a product can be digitised, we can
create it and distribute it.
We are innovative and entrepreneurial.
We focus on managing the last mile of
the m-commerce distribution network.
We offer suppliers and merchants a
mechanism to sell multiple products and
services without incurring additional
costs. We utilise neutral aggregation
and intelligent switch capabilities with
our proprietary technology, which offers
multiple products and services that are
distributed through a single interface.
This allows the convergence of all
suppliers under one roof.
We operate in South Africa, Mexico
(Blue Label Mexico) and India (Oxigen
Services).
Our business model is based on
strategic partnerships, underpinned by
long-term contracts and we market
our products directly to customers
through our expanding distribution
channels and our increasing number
of retail outlets in small towns and
township shopping centres.
Our strategy is to extend our global
footprint of touch points, both
organically and through acquisitions.
As a single distributor, we are able
to utilise a variety of delivery
mechanisms to service numerous
merchants or vendors, providing
multiple prepaid products and services
that serve the ever-increasing need
for them.
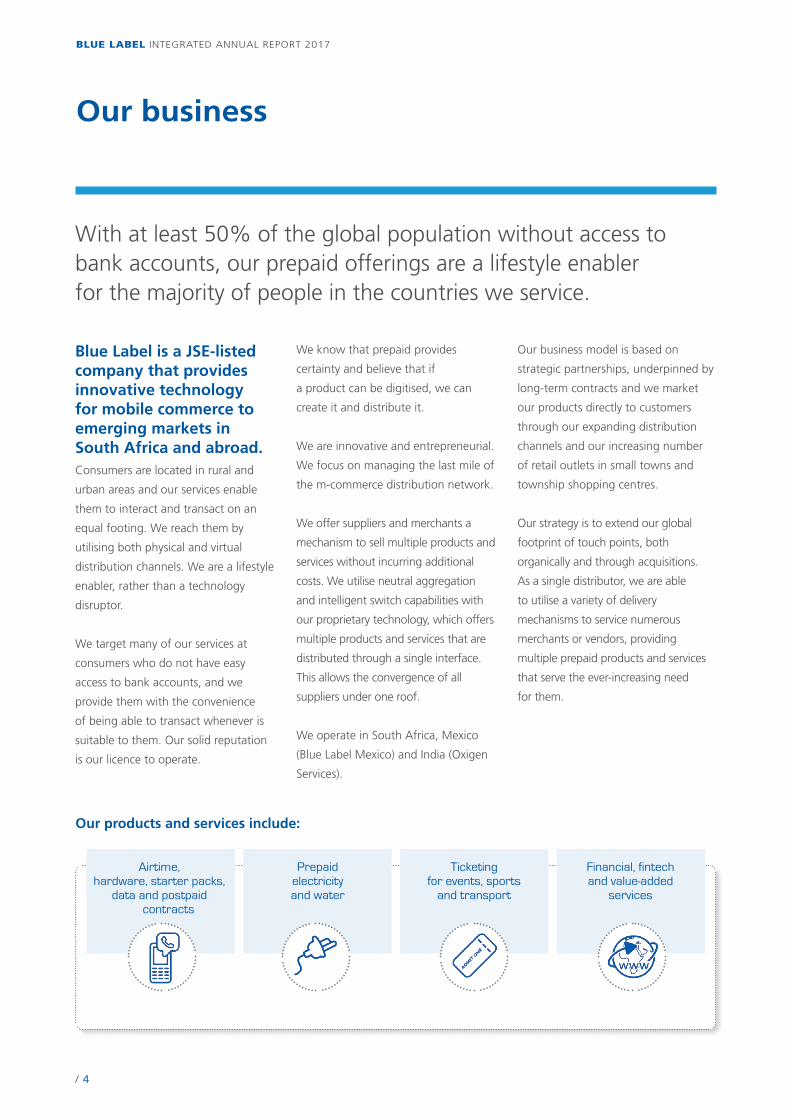
Our products and services include:
Airtime, hardware, starter packs,
data and postpaid contracts
Prepaid electricityand water
Ticketing for events, sports
and transport
Financial, fintechand value-added
services

BLUE LABEL INTEGRATED ANNUAL REPORT 2017
5 /
Vision, mission and values
OUR MISSIONis to provide products and
services required by the middle and lower tiers of the world’s economic
pyramid. We focus on diversifying the range of products and services we offer, while expanding our
distribution footprint through organic and acquisitive growth.
OUR VALUE SYSTEM Customer service orientation
Customers are our most important assets and our function is to satisfy their expectations in a sustainable manner.
Achievement and drive to succeed We recognise and reward the achievement of goals and targets.
We celebrate creative and exceptional deliverables.
Honesty and integrityBy conducting ourselves with honesty and integrity in all interactions,
we create trust which is a key driver to maintaining stakeholder relationships.
EnjoymentWe believe in creating an enjoyable work environment in which we motivate
and incentivise employees to be more productive and creative.
Collaboration Consulting and working together as a team towards a common goal
ensures that we can achieve our objectives, simultaneously developing sustainable value propositions for each
stakeholder grouping.
OUR VISION is to be the leading
global distributor of secure
fintech products and
services within emerging
markets.
BLUE LABEL INTEGRATED ANNUAL REPORT 2017
/ 6
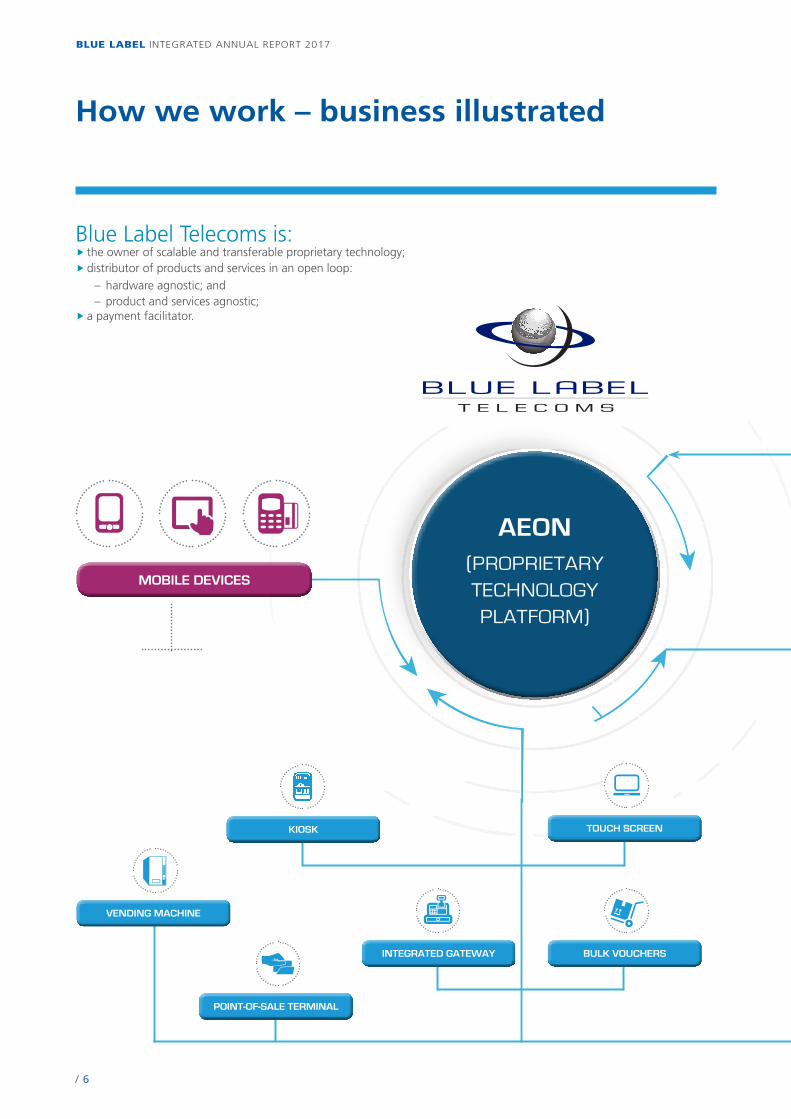
How we work – business illustrated
Blue Label Telecoms is: �� the owner of scalable and transferable proprietary technology;�� distributor of products and services in an open loop:
– hardware agnostic; and – product and services agnostic;
�� a payment facilitator.
AEON
(PROPRIETARY TECHNOLOGY PLATFORM)
POINT-OF-SALE TERMINAL
KIOSK
INTEGRATED GATEWAY BULK VOUCHERS
VENDING MACHINE
TOUCH SCREEN
MOBILE DEVICES
BLUE LABEL INTEGRATED ANNUAL REPORT 2017
7 /
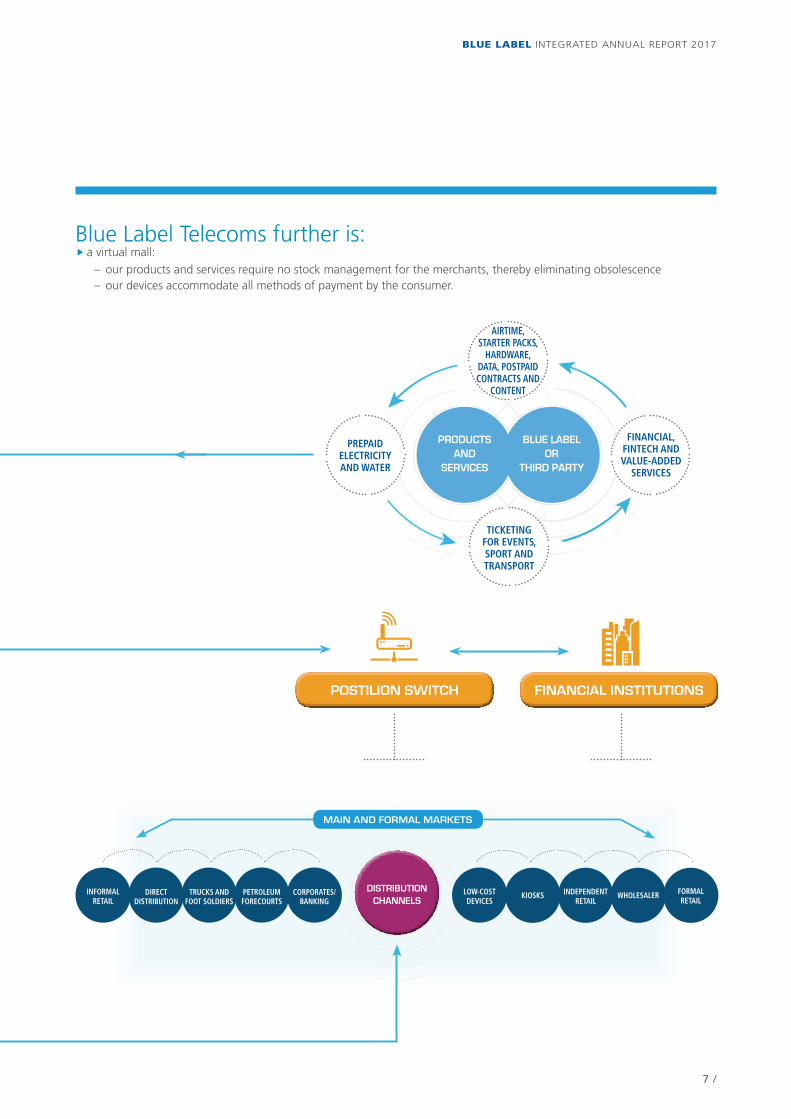
Blue Label Telecoms further is: �� a virtual mall:
– our products and services require no stock management for the merchants, thereby eliminating obsolescence – our devices accommodate all methods of payment by the consumer.
POSTILION SWITCH FINANCIAL INSTITUTIONS
DISTRIBUTION CHANNELS
CORPORATES/BANKING
PETROLEUM FORECOURTS
TRUCKS AND FOOT SOLDIERS
DIRECT DISTRIBUTION
INFORMAL RETAIL
FORMAL RETAIL
WHOLESALERINDEPENDENT RETAIL
KIOSKSLOW-COST DEVICES
PRODUCTS AND
SERVICES
BLUE LABEL OR
THIRD PARTY
AIRTIME, STARTER PACKS,
HARDWARE, DATA, POSTPAID CONTRACTS AND
CONTENT
PREPAID ELECTRICITY AND WATER
FINANCIAL, FINTECH AND VALUE-ADDED
SERVICES
TICKETING FOR EVENTS, SPORT AND TRANSPORT
MAIN AND FORMAL MARKETS
BLUE LABEL INTEGRATED ANNUAL REPORT 2017
/ 8
Approach and reporting frameworks
Approach This is Blue Label’s seventh integrated annual report, which continues to document the journey of our unique story, encompassing how the entrepreneurial Levy brothers envisioned and then built a business which listed on the JSE as Blue Label Telecoms Limited in 2007. Simultaneously, the report shares with stakeholders Blue Label’s integrated thinking as it implements its strategy across the Group.
In following the recommendations of the King Code of Governance Principles for South Africa and the structure set out by the International Integrated Reporting Council’s framework, Blue Label’s process aims to link material Group information with reference to strategy, governance, performance, remuneration and prospects in a manner which enables stakeholders to obtain a view of the commercial, social and environmental context within which the Group operates.
This integrated annual report is the Group’s primary report. It covers its business segments and its financial and operational performance for the financial year ended 31 May 2017. Non-financial and sustainability information is limited to the South African operations, as our international operations are not required to report on these matters.
The report contains issues material to our strategy and of interest to our stakeholders. Blue Label has mapped its stakeholders, in particular its relationship with its employees, providers of capital, the media, customers, business partners and suppliers, communities, educational institutions and government bodies. These stakeholder groupings receive more structured engagement
processes than other groupings and the level of inclusivity with these stakeholders is correspondingly more integrated into the Group’s strategic thinking (refer to the stakeholder relations section on pages 51 to 55.)
The integrated annual report provides a detailed understanding of the financial aspects of the Group’s business. The annual financial statements are prepared in accordance with International Financial Reporting Standards (IFRS) and the Companies Act of South Africa.
This report contains the notice of Annual General Meeting, proxy form and information to enable shareholders to exercise their vote on the resolutions to be put to the meeting. The notice and other related disclosures have been condensed into a booklet for physical distribution to shareholders at their request. The complete integrated annual report is also produced and is available for viewing and download via the website.
Various supporting documents to the Group’s library of disclosure, such as results presentations, short-form advertisements and SENS announcements are accessible via the website.
Ultimately, the report aims to provide stakeholders with the means to assess the Group’s ability to create and sustain value over the short, medium and long term.
Reporting frameworksThis report has been compiled in line with the requirements of King IV report on corporate governance for South Africa 2016 (King IV) and the principles of the International Integrated Reporting Framework. This is the first reporting cycle that requires
King IV adoption and disclosure. The disclosure requirements of King IV have been adopted in this year’s integrated annual report, as far as possible, and explain the continuation of robust governance principles and practices adopted under King III and some of the transitional initiatives to adopting King IV.
Blue Label utilises a risk-based model which identifies internal risks and stakeholder issues, in order to determine the material content of the report.
Board responsibility and approval statementOur process of integrated reporting continues to evolve and at this stage the Group has not sought external assurance of the content or part thereof apart from the annual financial statements, which the external auditor, PwC, has provided assurance as confirmed in the independent auditor’s report. The Board, assisted by its Audit, Risk and Compliance Committee, is ultimately responsible for overseeing the integrity of the integrated annual report. The Board has applied its collective mind to the preparation and presentation of the integrated annual report and has concluded that it is presented substantially in accordance with the principles of the International Integrated Reporting Framework.
The integrated annual report was approved by the Board and signed on its behalf by:
Larry NestadtChairman
BLUE LABEL INTEGRATED ANNUAL REPORT 2017
9 /
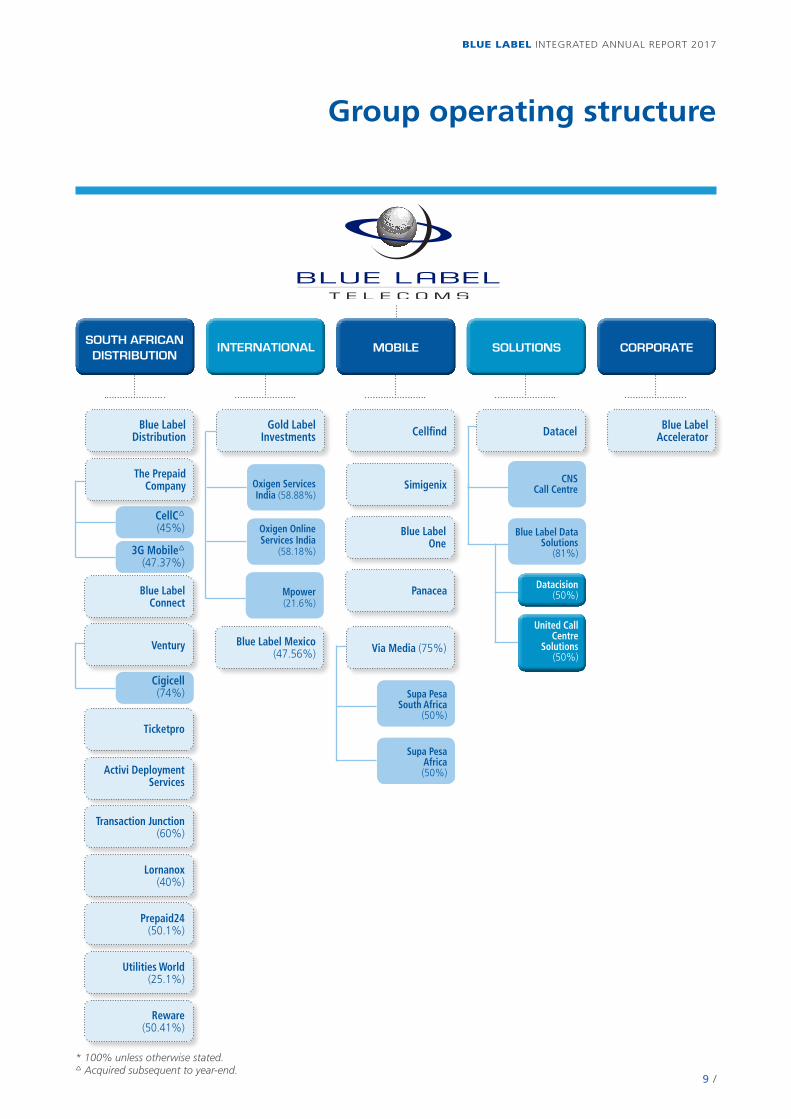
Group operating structure
Gold Label Investments
Blue Label Mexico(47.56%)
SOUTH AFRICANDISTRIBUTION
INTERNATIONAL MOBILE SOLUTIONS CORPORATE
Cigicell(74%)
CellC(45%)
3G Mobile(47.37%)
Blue Label Distribution
The Prepaid Company
Blue Label Connect
Ventury
Ticketpro
Activi Deployment Services
Transaction Junction (60%)
Prepaid24(50.1%)
Utilities World (25.1%)
Reware(50.41%)
Lornanox (40%)
Oxigen Services India (58.88%)
Oxigen Online Services India
(58.18%)
Mpower (21.6%)
Cellfind Datacel Blue Label Accelerator
Simigenix
Blue Label One
Panacea
Supa Pesa South Africa
(50%)
Via Media (75%)
CNS Call Centre
Blue Label Data Solutions
(81%)
Datacision(50%)
United Call Centre
Solutions(50%)
Supa Pesa Africa(50%)
* 100% unless otherwise stated. Acquired subsequent to year-end.
BLUE LABEL INTEGRATED ANNUAL REPORT 2017
/ 10
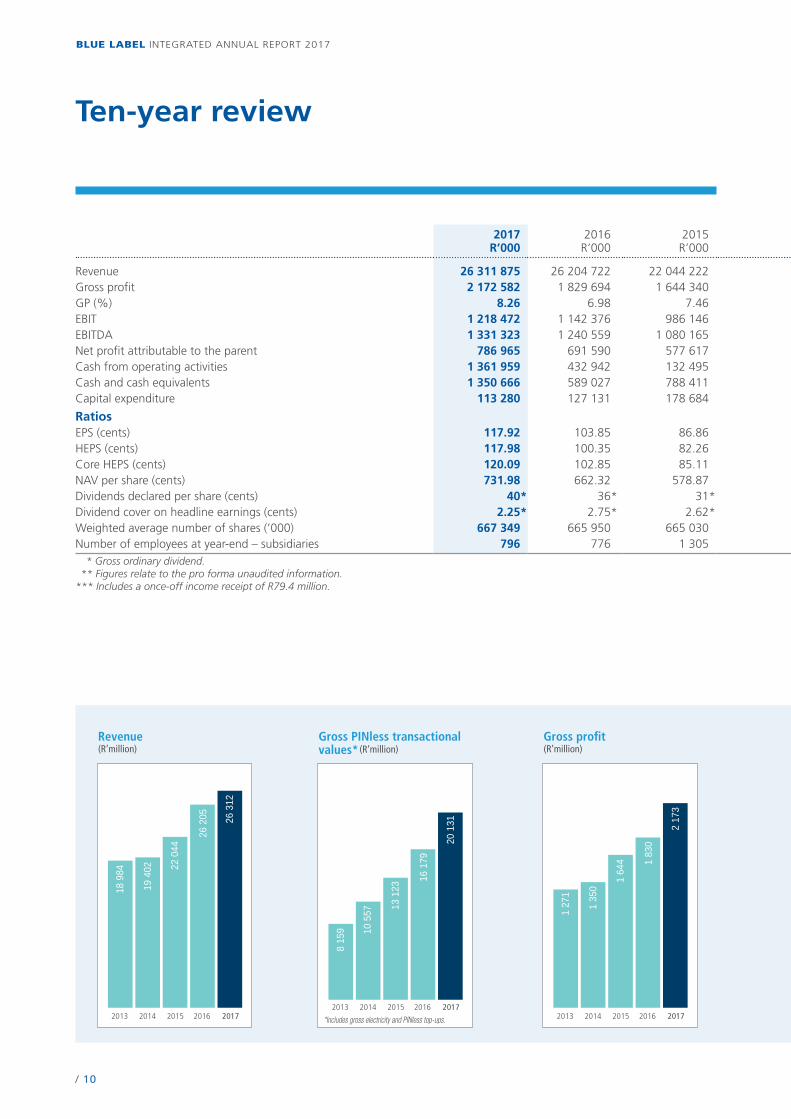
Ten-year review
2017R’000
2016R’000
2015R’000
2014R’000
2013R’000
2012***R’000
2011R’000
2010R’000
2009R’000
2008R’000
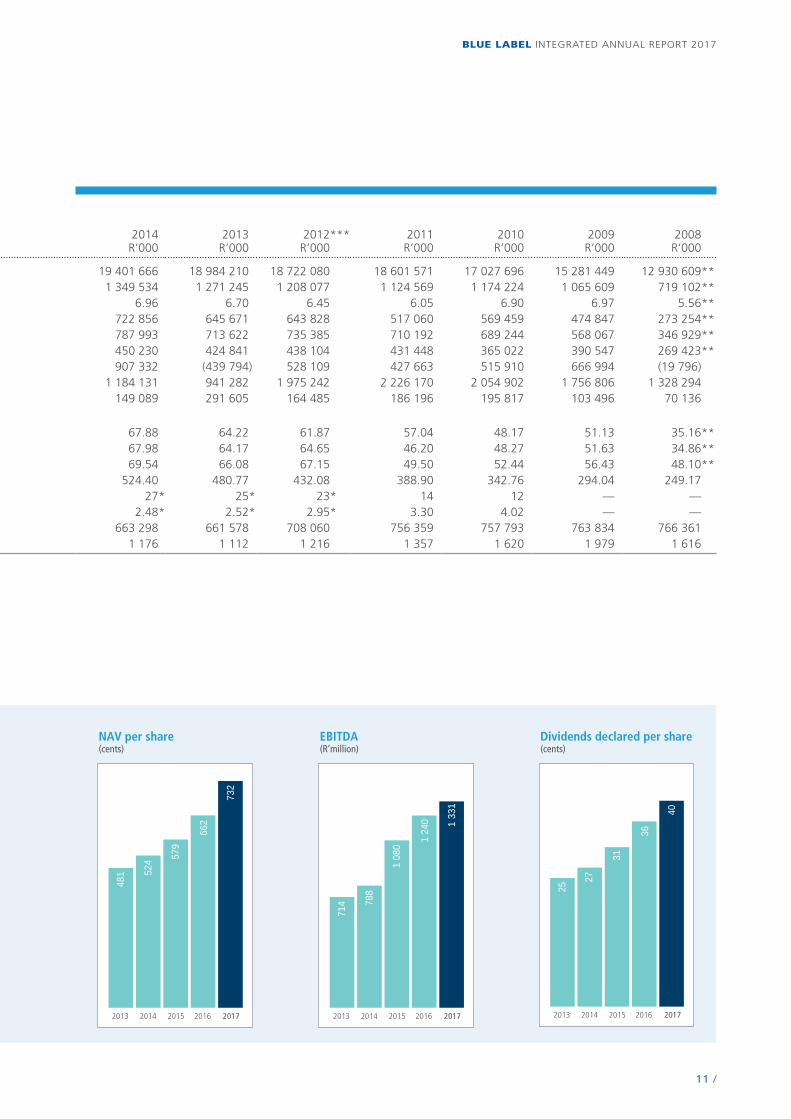
Revenue 26 311 875 26 204 722 22 044 222 19 401 666 18 984 210 18 722 080 18 601 571 17 027 696 15 281 449 12 930 609** Gross profit 2 172 582 1 829 694 1 644 340 1 349 534 1 271 245 1 208 077 1 124 569 1 174 224 1 065 609 719 102** GP (%) 8.26 6.98 7.46 6.96 6.70 6.45 6.05 6.90 6.97 5.56** EBIT 1 218 472 1 142 376 986 146 722 856 645 671 643 828 517 060 569 459 474 847 273 254** EBITDA 1 331 323 1 240 559 1 080 165 787 993 713 622 735 385 710 192 689 244 568 067 346 929** Net profit attributable to the parent 786 965 691 590 577 617 450 230 424 841 438 104 431 448 365 022 390 547 269 423** Cash from operating activities 1 361 959 432 942 132 495 907 332 (439 794) 528 109 427 663 515 910 666 994 (19 796) Cash and cash equivalents 1 350 666 589 027 788 411 1 184 131 941 282 1 975 242 2 226 170 2 054 902 1 756 806 1 328 294 Capital expenditure 113 280 127 131 178 684 149 089 291 605 164 485 186 196 195 817 103 496 70 136
RatiosEPS (cents) 117.92 103.85 86.86 67.88 64.22 61.87 57.04 48.17 51.13 35.16** HEPS (cents) 117.98 100.35 82.26 67.98 64.17 64.65 46.20 48.27 51.63 34.86** Core HEPS (cents) 120.09 102.85 85.11 69.54 66.08 67.15 49.50 52.44 56.43 48.10** NAV per share (cents) 731.98 662.32 578.87 524.40 480.77 432.08 388.90 342.76 294.04 249.17 Dividends declared per share (cents) 40* 36* 31* 27* 25* 23* 14 12 — —Dividend cover on headline earnings (cents) 2.25* 2.75* 2.62* 2.48* 2.52* 2.95* 3.30 4.02 — — Weighted average number of shares (’000) 667 349 665 950 665 030 663 298 661 578 708 060 756 359 757 793 763 834 766 361 Number of employees at year-end – subsidiaries 796 776 1 305 1 176 1 112 1 216 1 357 1 620 1 979 1 616 * Gross ordinary dividend. ** Figures relate to the pro forma unaudited information.*** Includes a once-off income receipt of R79.4 million.
Revenue(R’million)
20172016201520142013
26 3
12
18 9
84
19 4
02 22 0
44
26 2
05
Gross PINless transactional values* (R’million)
20 1
31
8 15
9 10 5
57 13 1
23
16 1
79
*Includes gross electricity and PINless top-ups.
20172016201520142013
Gross pro�t(R’million)
2 17
3
1 27
1
1 35
0
1 64
4 1 83
0
20172016201520142013
BLUE LABEL INTEGRATED ANNUAL REPORT 2017
11 /
2017R’000
2016R’000
2015R’000
2014R’000
2013R’000
2012***R’000
2011R’000
2010R’000
2009R’000
2008R’000
Revenue 26 311 875 26 204 722 22 044 222 19 401 666 18 984 210 18 722 080 18 601 571 17 027 696 15 281 449 12 930 609** Gross profit 2 172 582 1 829 694 1 644 340 1 349 534 1 271 245 1 208 077 1 124 569 1 174 224 1 065 609 719 102** GP (%) 8.26 6.98 7.46 6.96 6.70 6.45 6.05 6.90 6.97 5.56** EBIT 1 218 472 1 142 376 986 146 722 856 645 671 643 828 517 060 569 459 474 847 273 254** EBITDA 1 331 323 1 240 559 1 080 165 787 993 713 622 735 385 710 192 689 244 568 067 346 929** Net profit attributable to the parent 786 965 691 590 577 617 450 230 424 841 438 104 431 448 365 022 390 547 269 423** Cash from operating activities 1 361 959 432 942 132 495 907 332 (439 794) 528 109 427 663 515 910 666 994 (19 796) Cash and cash equivalents 1 350 666 589 027 788 411 1 184 131 941 282 1 975 242 2 226 170 2 054 902 1 756 806 1 328 294 Capital expenditure 113 280 127 131 178 684 149 089 291 605 164 485 186 196 195 817 103 496 70 136
RatiosEPS (cents) 117.92 103.85 86.86 67.88 64.22 61.87 57.04 48.17 51.13 35.16** HEPS (cents) 117.98 100.35 82.26 67.98 64.17 64.65 46.20 48.27 51.63 34.86** Core HEPS (cents) 120.09 102.85 85.11 69.54 66.08 67.15 49.50 52.44 56.43 48.10** NAV per share (cents) 731.98 662.32 578.87 524.40 480.77 432.08 388.90 342.76 294.04 249.17 Dividends declared per share (cents) 40* 36* 31* 27* 25* 23* 14 12 — —Dividend cover on headline earnings (cents) 2.25* 2.75* 2.62* 2.48* 2.52* 2.95* 3.30 4.02 — — Weighted average number of shares (’000) 667 349 665 950 665 030 663 298 661 578 708 060 756 359 757 793 763 834 766 361 Number of employees at year-end – subsidiaries 796 776 1 305 1 176 1 112 1 216 1 357 1 620 1 979 1 616 * Gross ordinary dividend. ** Figures relate to the pro forma unaudited information.*** Includes a once-off income receipt of R79.4 million.
EBITDA(R’million)
1 33
1
714 78
8
1 08
0
1 24
0
20172016201520142013
Dividends declared per share(cents)
20172016201520142013
40
25
27
31
36
NAV per share(cents)
732
481 52
4 579
662
20172016201520142013
BLUE LABEL INTEGRATED ANNUAL REPORT 2017
/ 12
Understanding material matters
Fluctuating economic conditions, including political, social and environmental conditions in South Africa and on the international frontThese factors can affect consumer health, and in turn could have an adverse effect on revenue and profitability, in spite of the Group’s historical resilience to adverse economic conditions.
It has been the Group’s experience that the diversity of its mix of products and services and distribution channels has limited its exposure to economic downturns. Consumers appear to be unwilling to reduce spending on utilities, transport and airtime. In this regard the Group’s products continue to be in demand and remain resilient to downturns. The Group is focusing on its existing platforms, both locally and internationally. Its vast geography of point-of-sale presence afford continuous opportunities to provide additional products and services to be expedited on these expanding points of presence.
Margin compressionThe network operators determine the margins to the prepaid airtime distribution channel. The Group may not always be able to pass on to the retailer, merchant or customer any margin compression enforced by the network operators.
Management is confident, that based on historical trends, the Group will be able to continue to pass on any margin compression to the distribution channel. Any margin compression is also likely to eliminate inefficient
distributors out of the distribution channel. In addition, the Group is constantly looking to introduce new product and service offerings at comparatively higher margins than its traditional business, through the leverage of its significant distribution footprint and merchant relationships.
Interest ratesFluctuations in interest rates have an impact on the cost of Group borrowings.
Foreign exchange ratesFluctuations in exchange rates have an impact on the results reported from, and any refinancing required by, associate and joint venture companies located in India, Mauritius and Mexico.
Non-compliance with legislation Non-compliance with legislation applicable to the Group could lead to fines and negative reputational impact, i.e. POPI, CPA, WASPA legislation, Companies Act, Income Tax Act, Value Added Tax Act, JSE Listings Requirements, OHSA, BEE Act, Employment Equity Act, industry charters and scorecards.
Legislation that affects the Group is identified, analysed and categorised according to its impact and relevance. The process is ongoing in order to test and ensure total compliance at an operational level.
The compliance function is managed by Group Legal and Company Secretarial, as assisted by the internal auditor.
Ability to attract and retain skilled resourcesThe Group’s future performance will depend largely on the efforts and abilities of its key personnel and employees. The existing Group Executive Management pioneered the mass prepaid market and established the Group’s business model. The Group’s future success will depend, in part, upon its ability to continue to attract, retain, motivate and reward personnel, including executive officers and certain other key and specialised employees. There is a dearth of suitable technical skills in the ITC sector.
The joint CEOs and co-founders are both substantial shareholders and are dedicated to the sustainability and growth of the Group.
Key members of the management team are bound by service and restraint agreements and in most instances they are shareholders of Blue Label via the forfeitable share scheme. Executive Management has implemented talent management and succession planning in key areas of the Group. Appropriate skills transfer activities are ongoing through on the job and other training programmes.
The RNC has approved remuneration policies which include long-term retention benefits, short-term incentives and an outperformance bonus. In addition, key components of the Group’s remuneration policy include retention.
BLUE LABEL INTEGRATED ANNUAL REPORT 2017
13 /
Increasing exposure to issues such as data security, breaches in technology security or privacyAs the bulk of the Group’s inventory is of a virtual nature, defence against cybercrime is a top priority, as susceptibility to hacking and the penetration of firewalls and other defence systems are always matters of extreme concern.
The Group is dependent on the systems and platforms that it utilises to deliver its products and services, as well as management of its merchant base. In recent years, technology spend has been increasing in recognition of this key imperative, in order to support not only organic and acquisitive growth in the business (and the concomitant rise in the number and type of transactions processed), but also to improve system availability and resilience. This invariably includes a major focus on the security of all systems, both production and enterprise, in order to suitably detect and manage security threats, as well as the ability to recover from collateral damage that may be caused as a result of cyber security breaches.
Elimination of the middle manIn most industries a wholesaler is at risk of being eliminated from the supply chain if the supplier has the infrastructure and capabilities to supply the customer directly.
From inception, the objective of the Group was to become a one-stop destination for the supply and
distribution of all of the mobile network offerings. This would provide both convenience and efficiency to the retailer and customer. Furthermore, the technology and footprint developed by the Group allows retailers to earn additional revenue by introducing additional products. This would make it difficult to disintermediate the Group.
No single network can offer this complete solution.
The introduction of the sale of prepaid electricity tokens and its phenomenal uptake in South Africa, strengthens the Group’s foothold as a one-stop destination that is most convenient to the retailer. The Group’s increasing bouquet of products and its neutral aggregation thereof will continue to ensure that its middle-man status as distributor is essential to the retailer and will remain entrenched. The Group will continually develop and upgrade new, innovative products to strengthen the foundation of its middle-man status. Many merchants have limited cash flow; however, utilising the Group’s vending solutions allows them to vend products and services which they previously could not afford. The lack of affordability was due to various complexities, such as managing stock levels, obsolescence, pilferage at store level, the inability to order small quantities and access to limited stock ranges.
In addition the introduction of a growing suite of products necessitates that the Group not only excels in the sourcing, management and delivery of
these products and the management of relationships in its merchant base, but simultaneously delivering an excellent supporting back-office capability – including the ability to deliver and manage reconciliation and settlement on behalf of its customers, extensive and professional merchant support services, and deep technology support for online and integrated systems. These competencies make it even more difficult for the Group to be disintermediated, because of the significant value that it provides to merchants, not only in the products and services that it delivers, but also in respect of the increasingly complex back-office support functionality required to deliver such services.
The Group is an aggregator and an enabler to both its customers and suppliers.
Without a distributor, every one of the four mobile operators and around 200 utilities across South Africa would need to deploy a device linked to technology at every merchant in the country, in order to provide the same access and level of service as that of which the Group has to offer.
In comparison to the amount of commission the mobile network operators afford the Group for distribution, it would be more costly to them and they would not be able to provide the same level of service if they were to do it themselves. In addition, the Group provides the capex, field support, R&D and call centre services to the merchant base.
BLUE LABEL INTEGRATED ANNUAL REPORT 2017
/ 14
Understanding material matters continued
Disaster recovery and continuity of businessThe Group has developed proprietary technology supporting the roll out of its bouquet of products and services. Its infrastructure connects into some of South Africa’s major banks, public and private utility companies and telecommunication operators. In addition, the Group switches both debit and credit cards, electronic funds transfer transactions and e-token products on behalf of the country’s leading retailers and petroleum companies. The effective and continuous operation of this infrastructure is critical to the Group’s service delivery.
Management recognises the importance assigned to IT in its corporate governance systems.The Group’s business continuity and
disaster recovery plan provides guidance for emergency and crisis management, business unit recovery and technology disaster recovery. The latter includes the restoration of IT facilities. The plan describes the IT framework and procedures to be activated in the event of a disaster.
The major goals of the plan are to:��minimise interruptions and limit damage to normal operations;��minimise the economic impact of the interruption;�� establish alternative means of operation in advance;�� train personnel on emergency procedures; �� provide for rapid restoration of service, ensuring availability/continuity of critical business operations; and�� communicate appropriately to relevant stakeholders.
Investments in Cell C and the 3G Mobile groupThe investment of R5.5 billion in Cell C and R1.9 billion in the 3G Mobile group represent a significant percentage of the market capitalisation of Blue Label Telecoms.
The failure of Cell C would not only negatively impact the investment therein, but would have a compounded effect on the 3G Mobile group, in that a significant portion of its profitability stems from its trading relationship with Cell C.
In order to contribute to the success of Cell C, Blue Label has representation on the board of directors, which will afford it complete oversight of the performance of the Company and ensuring that the agreed strategy is adhered to.
The above contributions, combined with the major reduction in interest-bearing debt and foreign exchange exposure thereto, are all positive indicators for sustainable success in longevity.
BLUE LABEL INTEGRATED ANNUAL REPORT 2017
15 /
Ethical leadership and business conduct
Good corporate governance is essentially about effective and responsible leadership. It is characterised by the ethical values of responsibility, accountability, fairness and transparency. The typical aspects of corporate governance, such as the role and responsibilities of the Board and Directors individually, internal audit, risk management and stakeholder engagement rest on a foundation of ethical values.
Blue Label’s ethical standards are encapsulated in its ethics statement (page 35), which serves as a framework for ethical reasoning applicable to all employees in their dealings with both internal and external stakeholders. The ethics statement applies to employees across the Group, customers, business partners, suppliers and other stakeholders. Each is requested to uphold the ethical principles underpinning the statement, thereby enabling us to live our values.
The purpose of the ethics statement is to: �� emphasise the Group’s commitment to ethics and compliance with laws and regulations;�� set out basic standards of ethical and legal behaviour; �� provide reporting mechanisms for known or suspected ethical or legal violations; and�� help prevent and detect wrongdoing.
Blue Label reiterates its stance on the following matters:�� fraudulent, corrupt or illegal practices are not tolerated. Bribes or any other illicit payments including facilitations will neither be paid nor received;�� the Group does not participate in any illegal anti-competitive activity. Employees cannot authorise or participate in any illegal conduct or action that purports to restrict competition; and�� the Group is non-political.
Employees are expected to demonstrate ethical business practices at all times. All new staff members undergo an induction programme that includes training on the above code of business conduct, including the function of the ethics hotline, such as what should be reported and how to report unethical behaviour via this channel. The ethics hotline is outsourced to KPMG Ethics Line, a division of KPMG, and has been certified by EthicsSA as fulfilling the External Whistleblowing Hotline Service Provider Standard EO1.1.1. This standard is a best practice set of guidelines or norms for the professional and ethical conduct of external whistleblowing hotline service providers operating their own centres or facilities.
A number of incidents were reported during the year. All incidents were human resource-related and were resolved by the Group Head of Human Resources and the relevant line managers, in terms of the Group’s policies and procedures.
BLUE LABEL INTEGRATED ANNUAL REPORT 2017
/ 16
Board of Directors
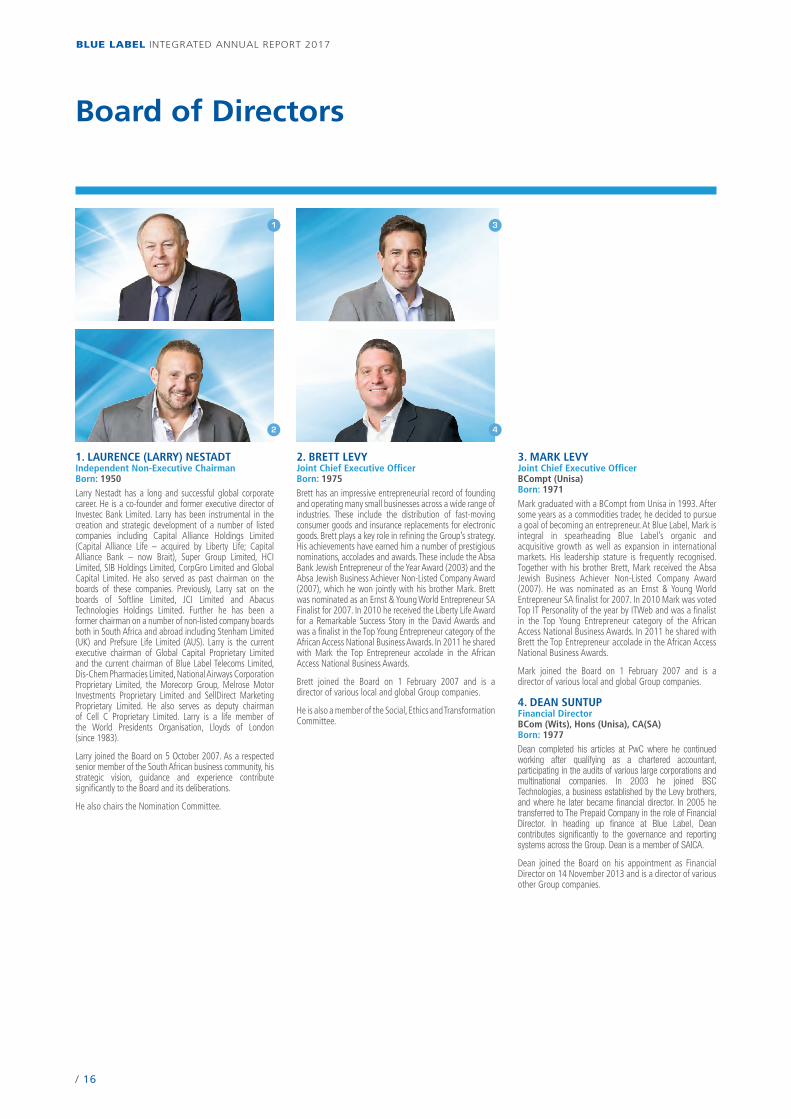
1. LAURENCE (LARRY) NESTADTIndependent Non-Executive ChairmanBorn: 1950
Larry Nestadt has a long and successful global corporate career. He is a co-founder and former executive director of Investec Bank Limited. Larry has been instrumental in the creation and strategic development of a number of listed companies including Capital Alliance Holdings Limited (Capital Alliance Life – acquired by Liberty Life; Capital Alliance Bank – now Brait), Super Group Limited, HCI Limited, SIB Holdings Limited, CorpGro Limited and Global Capital Limited. He also served as past chairman on the boards of these companies. Previously, Larry sat on the boards of Softline Limited, JCI Limited and Abacus Technologies Holdings Limited. Further he has been a former chairman on a number of non-listed company boards both in South Africa and abroad including Stenham Limited (UK) and Prefsure Life Limited (AUS). Larry is the current executive chairman of Global Capital Proprietary Limited and the current chairman of Blue Label Telecoms Limited, Dis-Chem Pharmacies Limited, National Airways Corporation Proprietary Limited, the Morecorp Group, Melrose Motor Investments Proprietary Limited and SellDirect Marketing Proprietary Limited. He also serves as deputy chairman of Cell C Proprietary Limited. Larry is a life member of the World Presidents Organisation, Lloyds of London (since 1983).
Larry joined the Board on 5 October 2007. As a respected senior member of the South African business community, his strategic vision, guidance and experience contribute significantly to the Board and its deliberations.
He also chairs the Nomination Committee.
2. BRETT LEVYJoint Chief Executive OfficerBorn: 1975
Brett has an impressive entrepreneurial record of founding and operating many small businesses across a wide range of industries. These include the distribution of fast-moving consumer goods and insurance replacements for electronic goods. Brett plays a key role in refining the Group’s strategy. His achievements have earned him a number of prestigious nominations, accolades and awards. These include the Absa Bank Jewish Entrepreneur of the Year Award (2003) and the Absa Jewish Business Achiever Non-Listed Company Award (2007), which he won jointly with his brother Mark. Brett was nominated as an Ernst & Young World Entrepreneur SA Finalist for 2007. In 2010 he received the Liberty Life Award for a Remarkable Success Story in the David Awards and was a finalist in the Top Young Entrepreneur category of the African Access National Business Awards. In 2011 he shared with Mark the Top Entrepreneur accolade in the African Access National Business Awards.
Brett joined the Board on 1 February 2007 and is a director of various local and global Group companies.
He is also a member of the Social, Ethics and Transformation Committee.
3. MARK LEVYJoint Chief Executive OfficerBCompt (Unisa)Born: 1971
Mark graduated with a BCompt from Unisa in 1993. After some years as a commodities trader, he decided to pursue a goal of becoming an entrepreneur. At Blue Label, Mark is integral in spearheading Blue Label’s organic and acquisitive growth as well as expansion in international markets. His leadership stature is frequently recognised. Together with his brother Brett, Mark received the Absa Jewish Business Achiever Non-Listed Company Award (2007). He was nominated as an Ernst & Young World Entrepreneur SA finalist for 2007. In 2010 Mark was voted Top IT Personality of the year by ITWeb and was a finalist in the Top Young Entrepreneur category of the African Access National Business Awards. In 2011 he shared with Brett the Top Entrepreneur accolade in the African Access National Business Awards.
Mark joined the Board on 1 February 2007 and is a director of various local and global Group companies.
4. DEAN SUNTUPFinancial DirectorBCom (Wits), Hons (Unisa), CA(SA)Born: 1977
Dean completed his articles at PwC where he continued working after qualifying as a chartered accountant, participating in the audits of various large corporations and multinational companies. In 2003 he joined BSC Technologies, a business established by the Levy brothers, and where he later became financial director. In 2005 he transferred to The Prepaid Company in the role of Financial Director. In heading up finance at Blue Label, Dean contributes significantly to the governance and reporting systems across the Group. Dean is a member of SAICA.
Dean joined the Board on his appointment as Financial Director on 14 November 2013 and is a director of various other Group companies.
2
3
4
1

BLUE LABEL INTEGRATED ANNUAL REPORT 2017
17 /
5
5. GARY HARLOWIndependent Non-Executive DirectorBBusSci (Hons) (UCT), FCMA, CGMA, CA(SA)Born: 1957
Gary graduated from the University of Cape Town in 1979, qualifying as a Chartered Accountant (SA) in 1982, an associate of the Chartered Institute of Management Accountants (UK) in 1983 and as a Fellow Chartered Management Accountant (UK) in 1996. His career was forged in merchant and investment banking. In the early 1990s he became an adviser to the African National Congress in developing black economic empowerment strategies and in 1992 was instrumental in the creation of Thebe Investment Corporation, South Africa’s first broad-based black-owned company. Gary served as joint chief executive officer of Msele Corporate and Merchant Bank, South Africa’s first black-controlled merchant bank.
In 1996, Gary was appointed group chief executive officer of Unihold Limited, where he remains executive chairman. He led its transition from an engineering conglomerate to an international IT and telecommunications group, followed by a delisting through a management buyout in 2002. Gary continues to serve on numerous private and public company boards and is chairman of Newpark Reit Limited.
Gary joined the Board on 5 October 2007 and is also chairman and/or director of various Group subsidiaries.
He chairs the Investment Committee and Remuneration Committee. Gary is also a member of the Nomination Committee as well as the Social, Ethics and Transformation Committee.
6. JERRY VILAKAZIIndependent Non-Executive Director BA (Unisa), MA (Thames Valley), MA (London), MBA (California Coast University)Born: 1961
Jerry is executive chairman of Palama, which he co-founded to facilitate investments in strategic private and listed companies. He is a past CEO of Business Unity South Africa, during which period he served as business representative at Nedlac and on various international business councils. Prior to this, he held various executive positions in government and in the private sector including that of managing director of the Black Management Forum where he also served on the board of the BMF investment company. In 2009 Jerry was appointed to the Presidential Broad-based Black Economic Empowerment Advisory Council and was appointed as a Commissioner of the National Planning Commission in 2010. He was appointed Public Service Commissioner in 1999 and played a role in shaping public service policies in post-1994 South Africa. Jerry was chairman of the Mpumalanga Gambling Board from 2006 to 2015 and the State Information Technology Agency (SOC) Proprietary Limited until the end of his term in 2015. He previously held the position of chairman of Netcare Limited and adviser to Citi Bank. He is non-executive director of Sibanye-Stillwater Limited where he also chairs the social and ethics committee. He led a consortium that acquired equity and subsequently served on the board of PPC Limited in 2008.
Jerry joined the Board on 19 October 2011. He also chairs the Social, Ethics and Transformation Committee.
7. JOE MTHIMUNYEIndependent Non-Executive DirectorBCompt (Hons)/CTA (Unisa), CA(SA)Born: 1965
Joe qualified as a chartered accountant in 1993. In 1996, he co-founded Gobodo Incorporated, an accounting practice with eight other partners which in time became the largest black accounting firm in South Africa. In 1999, he led a management buyout of Gobodo Corporate Finance from the accounting firm and rebranded it AloeCap Proprietary Limited, of which he is currently executive chairman. He also serves on the board of directors of various non-listed companies in which AloeCap Private Equity is invested. Joe is a director of Dis-Chem Pharmacies Limited and Cell C Proprietary Limited. He is also chairman of Cell C’s audit committee.
Joe joined the Board on 5 October 2007. He chairs the Audit, Risk and Compliance Committee and is a member of the Remuneration and Nomination Committee as well as the Investment Committee.
6
7
8
9
8. KEVIN ELLERINENon-Executive DirectorNational Diploma in Company AdministrationBorn: 1968
Kevin joined the family business, Ellerine Holdings, in 1991. After serving in various roles, in 1993 he was appointed as property manager of Ellerine Bros. Proprietary Limited, rising to managing director of the property division in 2000, a position he still holds today. He sits on the boards of the property and private equity companies in which Ellerines is invested. He is also a director of Hyprop Investments Limited and Newpark REIT Limited. Kevin’s all-round business skill and acumen contribute to Board and Committee deliberations of the Group.
Kevin joined the Board on 8 December 2009 and is a director of various other companies, including some Group subsidiaries.
He is a member of the Investment Committee as well as the Social, Ethics and Transformation Committee.
9. PHUTI MAHANYELEIndependent Non-Executive Director BA Economics (Rutgers, USA), MBA (De Montfort, UK), Executive Education Programme (Harvard, USA)Born: 1971
Phuti is Executive Chairperson of Sigma Capital, an investment holding company. She is the former CEO of Shanduka Group. Previously, she held senior positions at the Development Bank of Southern Africa, and in the North American and South African offices of Fieldstone, an international firm specialising in financing infrastructure assets. Currently, she sits on the board of Comair Limited.
Phuti chairs the Bain Academy, which supports professionals in corporate Africa. She also participates in the Young Global Leaders initiative of the World Economic Forum. Phuti is an honorary member of the Golden Key International Honour Society and sits on the advisory board of the University of Stellenbosch.
Phuti joined the Board on 1 September 2016. She is a member of the Audit, Risk and Compliance Committee, Investment Committee as well as the Social, Ethics and Transformation Committee.

BLUE LABEL INTEGRATED ANNUAL REPORT 2017
/ 18
Senior Management
1. ANDREW MURRAYChief Information OfficerBSc Eng (Wits)
2. ARCHIE RANTAODirector of Sales Community ChannelsExecutive Development Programme (Unisa)Certificate in Operations Management (Wits)
3. ETIENNE DE VILLIERSGeneral CounselBA LLB (Natal) Admitted Attorney
4. GARTH MACKINTOSHChief Executive Officer – MobileBCom, Honours (Information Systems), MBA (UCT)
5. INGRID HINDLEYGroup Head of Human ResourcesBSocSci Honours (Industrial Psychology) (Natal)
6. JABU MOGANEDirector Sales and Marketing of Community Channels
7. JANINE VAN EDENGroup Company SecretaryBProc LLB (RAU), Conveyancing
1
2
5
6
4
3
7
BLUE LABEL INTEGRATED ANNUAL REPORT 2017
19 /
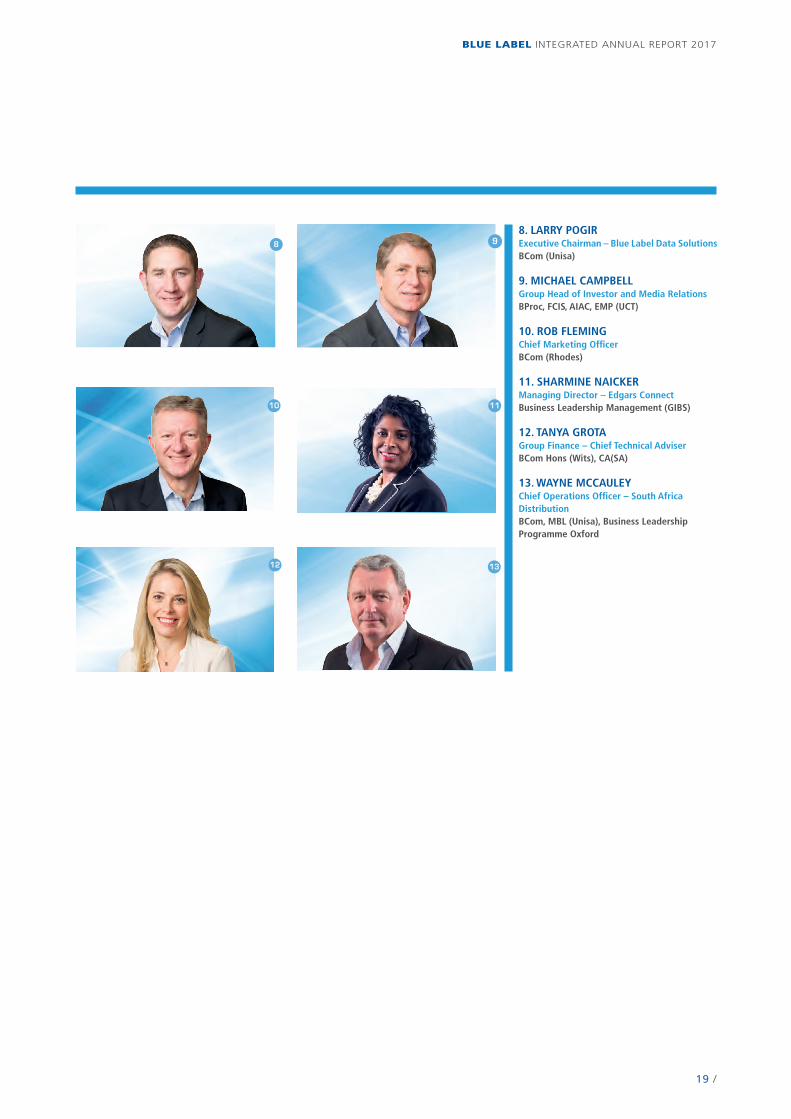
8. LARRY POGIRExecutive Chairman – Blue Label Data SolutionsBCom (Unisa)
9. MICHAEL CAMPBELLGroup Head of Investor and Media RelationsBProc, FCIS, AIAC, EMP (UCT)
10. ROB FLEMINGChief Marketing OfficerBCom (Rhodes)
11. SHARMINE NAICKERManaging Director – Edgars ConnectBusiness Leadership Management (GIBS)
12. TANYA GROTAGroup Finance – Chief Technical AdviserBCom Hons (Wits), CA(SA)
13. WAYNE MCCAULEYChief Operations Officer – South Africa DistributionBCom, MBL (Unisa), Business Leadership Programme Oxford
98
10
12 13
11
BLUE LABEL INTEGRATED ANNUAL REPORT 2017
/ 20
“Blue Label
continues developing
a rich ecosystem,
enhanced by recent landmark
acquisitions which expand
both its supply chain
and distribution
footprint.”
Dear stakeholdersThe Group continues delivering on its strategy of distributing secure fintech products and services to the main consumer market in emerging communities in South Africa, India and Mexico. This year marked a significant enhancement in Blue Label’s business model as it embraced a number of vertical integration opportunities in its ecosystem.
Blue Label’s participation in the recapitalisation of Cell C in which it acquired a 45% shareholding, as well as its two-stage acquisition of the entire share capital of 3G Mobile, will expand both the Group’s supply chain and distribution footprint. In July 2017, 200 million unissued shares were placed under the control of directors for the purposes of funding an element of these transactions.
Acquisitions are considered according to a number of criteria, including synergies, earnings accretion, additions to the product line, enhancement of the distribution network or geography and which benefit the Group strategically.
Chairman’s report
BLUE LABEL INTEGRATED ANNUAL REPORT 2017
21 /
Organic growth primarily contributed to core headline earnings in the South African Distribution Segment increasing by 19% to R893 million. The Group’s share of losses in Blue Label Mexico narrowed 42% to R37 million, as distribution of additional products and services continued to gain traction. In recognising fundamental changes to India’s fintech sector during the year, the Board has reviewed its strategy regarding our stake in Oxigen Services India. As a result thereof, the investment therein is accounted for as a venture capital investment.
Group headline earnings per share increased by 18% to 117.98 cents, predominantly achieved through increases in revenue to R26.3 billion, gross profit by 19% to R2.2 billion and EBITDA by 7% to R1.3 billion. Earnings per share increased by 14% to 117.92 cents.
Capital and reserves accumulated to R5 billion, net of accumulated dividends paid totalling R1.16 billion. The net asset value per share increased by 11% to R7.32. In August 2017, the Board declared a dividend of 40 cents per share, equating to a 2.25 times cover on headline earnings.
The Group’s flagship CSI project, Boys & Girls Club of South Africa at Protea Glen, enhanced its after-school and extramural offerings. Over 500 pupils attend the club on a daily basis and future plans include the roll out of a further eight clubs in disadvantaged areas over the next three years. The Social, Ethics and Transformation Committee supported CSI expenditure of R8.5 million during the year for projects focusing on youth development through education, sport and entrepreneurship.
Looking ahead: ��As Blue Label is one of the primary distribution channels for Cell C’s products and services, its acquisition therein provides a compelling value proposition to realise synergies in product distribution. Blue Label will benefit from improving operational and financial performance from the combined platform. In turn, Cell C’s new sustainable capital structure enables it to deliver on its strategic objectives to improve financial returns from increased network utilisation, the upgrading of network infrastructure and the expansion of LTE coverage. �� 3G Mobile is one of Africa’s largest suppliers, distributors and financiers of tier 1 and tier 2 mobile handsets to major retailers and cellular network providers. Its wholly owned subsidiary, Comm Equipment Company, provides financing to Cell C for the mobile handset component of postpaid and hybrid contracts, with the capability of extending such services to other networks and channels. 3G Mobile provides the ideal platform for combining Blue Label’s low cost and certified pre-owned mobile handset divisions into a consolidated group, well positioned for distribution to the burgeoning low cost smartphone market.�� Blue Label Mexico is expected to provide a positive contribution to Group profitability, given its consistent growth at sustainable improved gross profit margins and compounding annuity revenue generated from starter pack sales.�� “Big Data” consolidates and aggregates transactions across the divisions within the Group, which creates the opportunity to up-sell and cross-sell the various bouquets of products and services that Blue Label has to offer through its distribution channels, by intelligently
understanding consumer behaviour.�� Value-added services, including the provision of short-term finance for emergency airtime recharge required by consumers, are current initiatives with high growth possibilities.
The Blue Label entrepreneurial culture came to the fore this year in completing two significant acquisitions with a combined price tag of R7.4 billion, as well as a sound financial performance in a difficult trading environment.
I acknowledge and thank my fellow Directors, the management team led by Brett Levy and Mark Levy, the senior management team, all employees and other stakeholders for their considerable efforts over the past year, contributing to the success of the Group.
In achieving another milestone, Blue Label marked its 10th anniversary of listing on the JSE on 14 November 2017.
Larry NestadtChairman
23 November 2017

BLUE LABEL INTEGRATED ANNUAL REPORT 2017
/ 22
For over 16 years, Blue Label has delivered on its strategic objective of distributing electronic tokens of value in emerging markets. In a targeted approach driven by data analytics, we continue to expand our range of products and services while increasing our distribution footprint through a vast network of POS devices and electronic wallets, enabling consumers to transact conveniently.
Physical and virtual tokens are delivered through the deployment of various technologies embedded in our technical vending solutions. We liken our distribution methodology to a virtual delivery system, whereby our sophisticated proprietary technology is the carrier enabling such transactions. Incremental costs are minimal, as the heavy lifting to establish the distribution network is already in place, resulting in profit margins filtering directly to the bottom line.
In deployment campaigns, we observe merchants benefit through increased turnover of our products, as well as those of others from the moment our POS device is installed. The longer duration that a device operates in the market, the more transactions it records and the less churn is encountered. Hence, we are a ‘magnet for foot traffic’ – be it in South Africa, India or Mexico.
In South Africa, the Group distributes a range of offerings, including prepaid airtime, starter packs for voice, data consumption and content downloading; a complete range of tier one to tier four hardware devices, such as branded and unbranded, new and refurbished handsets and tablets; finance for the mobile device element
of postpaid and hybrid contracts; prepaid electricity and water e-tokens; ticketing for the events, sports and transport sectors; as well as fintech and value-added services, such as debit and credit card acquiring, bill payments, Lotto, money wallets and transfers and other value-added services.
This variety and depth of digital products and services, along with merchants and consumers increasingly adopting more tech savvy practices, places Blue Label at the convergence of the next Industrial Revolution.
Blue Label complements its distribution by embracing the retail channel in serving consumers in ‘the last mile’. The relevance of this is that the operator of the last mile of the channel determines merchandising practices and pricing, as the POS terminal is located in this part of the channel and in most instances is placed there by Blue Label.
Blue Label is
a “magnet for
foot traffic”
The Joint Chief Executive Officers’ report
BLUE LABEL INTEGRATED ANNUAL REPORT 2017
23 /
How we operate The distribution model is based on strategic partnerships between ourselves and our suppliers and customers which are underpinned by long-term contracts. These inevitably evolve into constructive relationships
where customers in our ecosystem become our partners. The integrity of these relationships enables the model to continuously develop and evolve.
Blue Label derives income from three main pillars: the sale of commodities (such as airtime, electricity and ticketing), annuity transactions (from our starter pack base, location-based services, content and other subscription services) and interest earned on any surplus cash generated.
The discount structure is based on long-term contracts with network operators and other product and service providers, which cover payment terms, annuity and commissions receivable. Discounts received are shared with merchants in the distribution channel as an incentive to distribute our merchandise. In turn, the Group channels merchants’ feedback and manages all their field support requirements, in addition to supplying products, services and marketing materials, as well as looking at building their future needs.
Group performance Group earnings continue to increase organically, primarily attributable to the South African Distribution segment raising its contribution to core headline earnings by 19%. Group core headline earnings increased by 17% to R801 million.
Group revenue remained static at R26.3 billion, congruent with an escalating shift in consumer buying patterns from traditional purchasing of airtime to that of “PINless top-ups”. Only the gross profit earned thereon is accounted for in revenue, as opposed
to the gross amount of such transactions. On imputing such amounts the effective growth in revenue would have equated to 7%.
Gross profit increased by 19% to R2.2 billion, in line with an increase in margin from 6.98% to 8.26%.
In measuring performance, we place reliance on gross profit as a growth metric rather than revenue. A further example of our preference for measuring gross profit is in our accounting treatment of prepaid electricity, PINless airtime and water sales. We act as the agent on behalf of utilities, as only the commission earned on these sales is included in revenue, and not the product’s face value.
South Africa’s core business South African Distribution segment is the predominant contributor to Group profitability. Revenue remained consistent at R25.8 billion. However, revenue generated on “PINless top-ups” increased by R2 billion to R6.1 billion, equating to an effective growth in revenue of 7%, as only the commissions earned thereon are recognised.
This year the management team was enhanced by the appointment of experienced professionals in distribution.
International segment The investment in Oxigen was initially of a long-term nature as it was expected to emulate the business model of the South African distribution operations. However, its profile has changed from that of the traditional Group business model to one of generating growth in the
BLUE LABEL INTEGRATED ANNUAL REPORT 2017
/ 24
The Joint Chief Executive Officers’ report continued
market value of the investment with a view to unlocking the Group’s share thereof. With the advent of its change in focus to financial services through wallet subscription, it is no longer strategically aligned with the other business units of the Group and is unlikely to generate profitability in the short to medium term. However, the market value of the company is expected to increase in conjunction with its growth in wallet subscribers. This in turn creates the potential to unlock the investment in the future and the Group is pursuing this new strategy with respect to its investment in Oxigen.
Blue Label Mexico’s losses continued to decline, with the Group’s share thereof reducing 42% to R37 million, mainly underpinned by higher blended gross profit margins.
Vertical integration of our ecosystemBlue Label’s model of distributing virtual goods and services across multiple economic sectors affords it access to vertical integration possibilities in its ecosystem. Our strategy is to combine or link appropriate opportunities into a richly networked ecosystem.
Integration creates further scope for design thinking alongside existing operating processes and systems. Integration also brings together a number of different players, which are now able to serve markets in ways previously beyond the capacity of a single organisation. The ecosystem’s diversity and collective capability to
learn, adapt, enable, disrupt and innovate are key in determining its further successes and sustainability.
AcquisitionsBlue Label delivered two landmark transactions subsequent to financial year-end:
Cell CThe R5.5 billion funding of Blue Label’s participation in the recapitalisation of Cell C was funded through a hybrid of our own cash resources and the placement of shares. Implementation of the acquisition was effective on 2 August 2017.
Our rationale for the vertical integration with Cell C embraces three main pillars:1. Creating value as a free-standing
entity;2. Ensuring longevity of our existing
trading relationship with Cell C; and
3. Commercial synergies, as Blue Label becomes a service and product provider to Cell C across multiple shared services arising from the alliance.
3G Mobile In August 2017, Blue Label announced the acquisition of 3G Mobile, a distributor of the major tier 1 and 2 mobile device and handset manufacturers, such as Apple, Samsung, Huawei, ZTE and Nokia. Through 3G Mobile’s wholly owned subsidiary, Comm Equipment Company, it offers financing for the
mobile handset element of postpaid and hybrid contracts.
The R1.9 billion acquisition cost was structured in two stages. Initially 47.37% was acquired for R900 million. The remaining 52.63% will be acquired for a further R1.0 billion, subject to the fulfilment of conditions precedent in relation thereto, the completion of which is anticipated to be in early 2018. Of the initial purchase price, R250 million was applied through vendor placement of shares, and the balance of R650 million will be payable on 28 February 2018.
Our existing handset and tablet business comprises both low-cost smart phones and certified pre-owned mobile handsets. By vertically integrating with 3G Mobile, we are now able to offer a complete range of handsets and tablets.
Blue Label’s success going forward will be characterised by management’s execution capability in aligning, integrating and extracting operational and financial metrics from these significant investments.
Evolving our digital presence in AfricaThe recent acquisition of 3G Mobile instantly augmented Blue Label’s footprint across the continent. When coupled with Blue Label’s merchandise available through its Mobile segment, countries now served include Botswana, Cameroon, DRC, Ghana,
BLUE LABEL INTEGRATED ANNUAL REPORT 2017
25 /
Guinea, Lesotho, Mauritius, Mozambique, Namibia, Swaziland, Tanzania, Uganda, Zambia and Zimbabwe, in addition to core businesses in South Africa.
Technology and big data The Group’s distribution capability is underpinned by its sophisticated proprietary technology platforms. Technology is both our cornerstone and competitive advantage. Its robustness can be attributed to its adaptability to ever-changing demands, complemented by a thorough deployment methodology. It is product and hardware agnostic, a neutral aggregator, capable of plug ’n play, proven, scalable and does not outsource its ongoing development.
The advanced level of our technology platforms has enabled the introduction of modern products and services, such as prepaid electricity and water, and the proprietary UniPIN, which is the offline solution to an online problem. Other capabilities include our online wallet and sophisticated ticketing engine.
The Group continues to accumulate merchant and consumer transactional big data mindful of its obligations in terms of POPI and the CPA. Data scientists aggregate, process and analyse vast sets of information gathered from across the Group and our partners. Insights from these records enable us to form a single, content-rich profile per customer, which in turn creates multiple cross-selling and up-selling opportunities throughout the Group. We are now able to identify unique characteristics and traits, which allow us to mine data intelligently and more effectively, thereby enabling us to focus on specific market segments with unique and differentiated products. This targeted approach is especially relevant in the main market segment, where the typical consumer is unbanked or badly banked and therefore does not qualify for credit. Our sophisticated technology enables us to build a thin file or “cash” risk profile for each consumer.
Marketing Our marketing approach focuses on delivering technology, products and services, as required by merchants and consumers. Extensive research, project work, pilots, trials and perception studies are utilised in identifying opportunities in order to entrench our distribution footprint in formal retail, independent, petroleum forecourts, corporate and rural areas.
Brett Levy Mark LevyJoint Chief Executive Officers
23 November 2017
BLUE LABEL INTEGRATED ANNUAL REPORT 2017
/ 26
Financial Director’s report
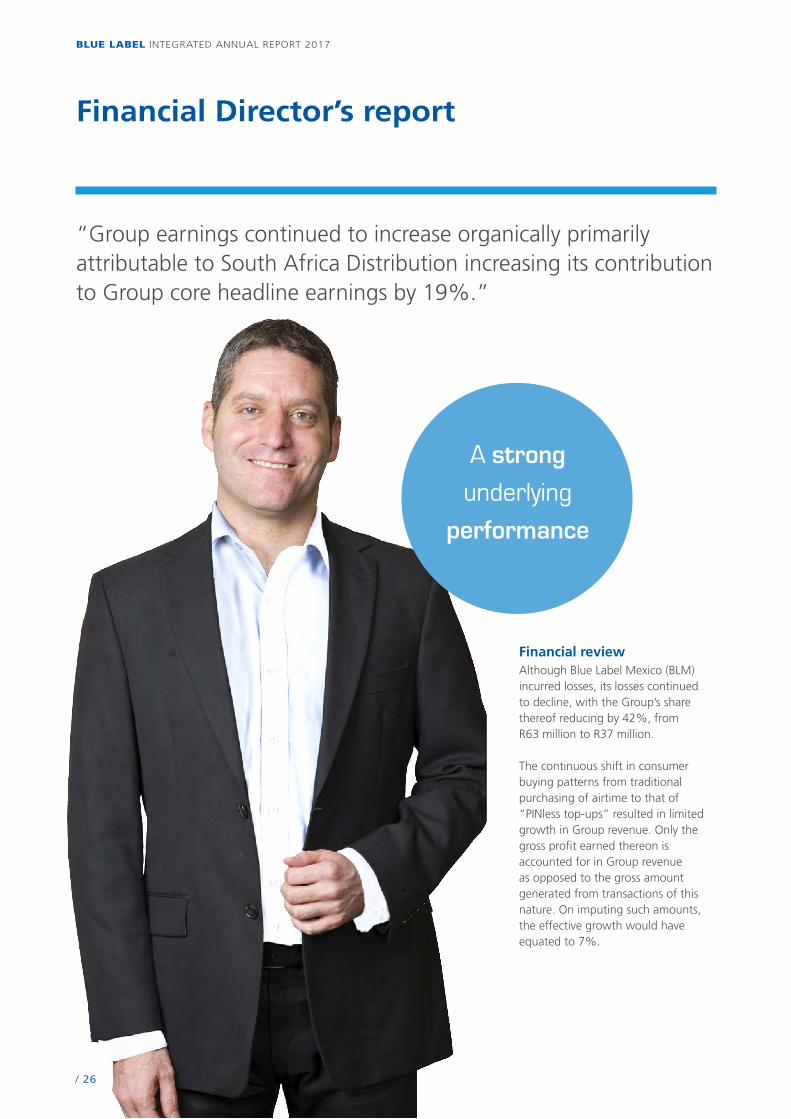
Financial reviewAlthough Blue Label Mexico (BLM) incurred losses, its losses continued to decline, with the Group’s share thereof reducing by 42%, from R63 million to R37 million.
The continuous shift in consumer buying patterns from traditional purchasing of airtime to that of “PINless top-ups” resulted in limited growth in Group revenue. Only the gross profit earned thereon is accounted for in Group revenue as opposed to the gross amount generated from transactions of this nature. On imputing such amounts, the effective growth would have equated to 7%.
“Group earnings continued to increase organically primarily attributable to South Africa Distribution increasing its contribution to Group core headline earnings by 19%.”
A strong
underlying
performance
BLUE LABEL INTEGRATED ANNUAL REPORT 2017
27 /
Group income statement
May 2017R’000
May 2016R’000
GrowthR’000
Growth%
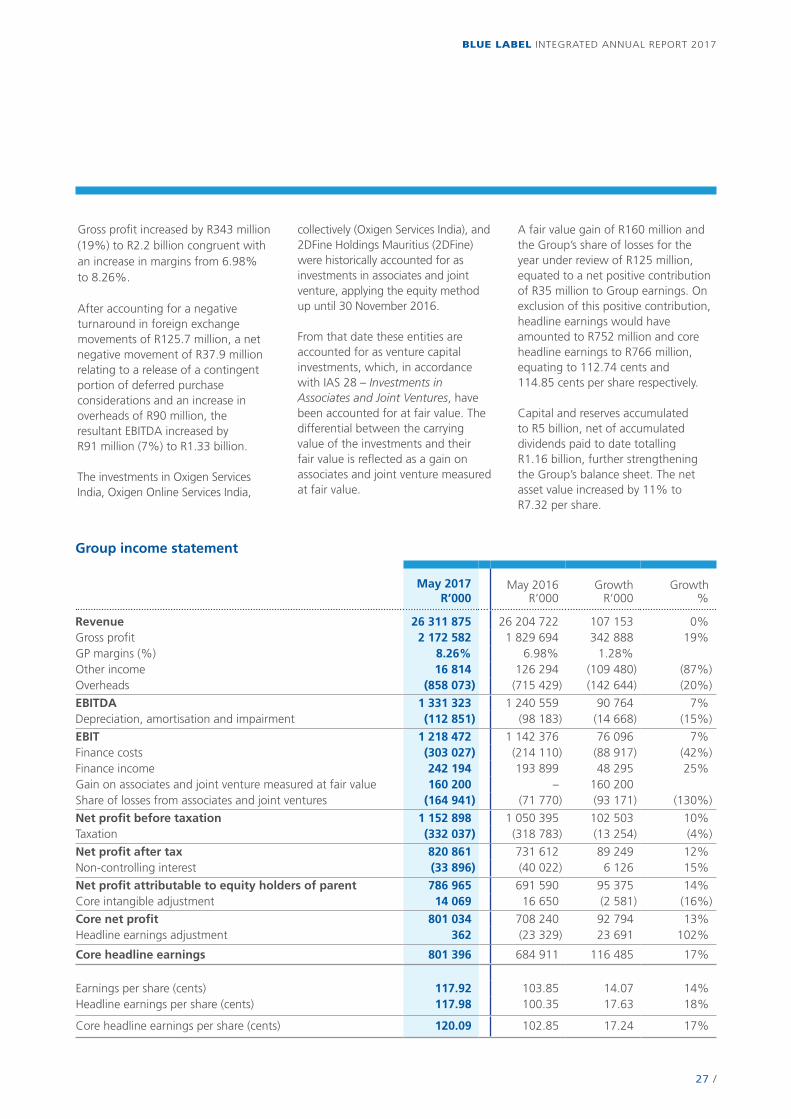
Revenue 26 311 875 26 204 722 107 153 0%Gross profit 2 172 582 1 829 694 342 888 19%GP margins (%) 8.26% 6.98% 1.28%Other income 16 814 126 294 (109 480) (87%)Overheads (858 073) (715 429) (142 644) (20%)
EBITDA 1 331 323 1 240 559 90 764 7%Depreciation, amortisation and impairment (112 851) (98 183) (14 668) (15%)
EBIT 1 218 472 1 142 376 76 096 7%Finance costs (303 027) (214 110) (88 917) (42%)Finance income 242 194 193 899 48 295 25%Gain on associates and joint venture measured at fair value 160 200 – 160 200Share of losses from associates and joint ventures (164 941) (71 770) (93 171) (130%)
Net profit before taxation 1 152 898 1 050 395 102 503 10%Taxation (332 037) (318 783) (13 254) (4%)
Net profit after tax 820 861 731 612 89 249 12%Non-controlling interest (33 896) (40 022) 6 126 15%
Net profit attributable to equity holders of parent 786 965 691 590 95 375 14%Core intangible adjustment 14 069 16 650 (2 581) (16%)
Core net profit 801 034 708 240 92 794 13%Headline earnings adjustment 362 (23 329) 23 691 102%
Core headline earnings 801 396 684 911 116 485 17%
Earnings per share (cents) 117.92 103.85 14.07 14%Headline earnings per share (cents) 117.98 100.35 17.63 18%
Core headline earnings per share (cents) 120.09 102.85 17.24 17%
Gross profit increased by R343 million (19%) to R2.2 billion congruent with an increase in margins from 6.98% to 8.26%.
After accounting for a negative turnaround in foreign exchange movements of R125.7 million, a net negative movement of R37.9 million relating to a release of a contingent portion of deferred purchase considerations and an increase in overheads of R90 million, the resultant EBITDA increased by R91 million (7%) to R1.33 billion.
The investments in Oxigen Services India, Oxigen Online Services India,
collectively (Oxigen Services India), and 2DFine Holdings Mauritius (2DFine) were historically accounted for as investments in associates and joint venture, applying the equity method up until 30 November 2016.
From that date these entities are accounted for as venture capital investments, which, in accordance with IAS 28 – Investments in Associates and Joint Ventures, have been accounted for at fair value. The differential between the carrying value of the investments and their fair value is reflected as a gain on associates and joint venture measured at fair value.
A fair value gain of R160 million and the Group’s share of losses for the year under review of R125 million, equated to a net positive contribution of R35 million to Group earnings. On exclusion of this positive contribution, headline earnings would have amounted to R752 million and core headline earnings to R766 million, equating to 112.74 cents and 114.85 cents per share respectively.
Capital and reserves accumulated to R5 billion, net of accumulated dividends paid to date totalling R1.16 billion, further strengthening the Group’s balance sheet. The net asset value increased by 11% to R7.32 per share.
BLUE LABEL INTEGRATED ANNUAL REPORT 2017
/ 28
Financial Director’s report continued
RevenueAlthough growth in revenue was confined to R107 million, revenue generated on “PINless top-ups” escalated, congruent with the continued shift in consumer buying patterns from the traditional purchasing of airtime to that of “PINless top-ups”. As only the commission earned thereon is accounted for, the effective growth in group revenue equated to 7%.
Gross profitThe increase in revenue, underpinned by an improvement in gross profit margins from 6.98% to 8.26%, resulted in gross profit increasing by R343 million (19%) to R2.17 billion.
The improvement in margins was attributable to a hybrid of additional discounts received on early settlement payments and compounded annuity revenue.
Overheads Overheads, comprising employee costs and operating expenses, increased by 20% to R858 million, of which the former accounted for 6% and the latter 41%.
The increase in operating expenses was predominately due to foreign exchange losses incurred as well as sponsorship costs both totalling R81 million.
EBITDAAfter accounting for a negative turnaround in foreign exchange movements of R126 million, a net negative movement of R38 million relating to a release of a contingent portion of deferred purchase considerations and an increase in overheads of R90 million, the resultant EBITDA increased by R91 million (7%) to R1.33 billion.
Depreciation, amortisation and impairment chargesDepreciation, amortisation and impairment charges increased by R15 million to R113 million.
Of this amount, R18 million pertained to the amortisation of intangible assets resulting from purchase price allocations on historical acquisitions compared to R20.6 million in the comparative year. The balance of the increase was congruent with capital expenditure incurred during the year.
Net finance costsFinance costsFinance costs totalled R303 million, of which R106 million related to interest paid on borrowed funds and R197 million to imputed IFRS interest adjustments on credit received from suppliers. On a comparative basis, interest paid on borrowed funds amounted to R48 million and the imputed IFRS interest adjustment equated to R166 million.
The increase of R58 million on interest paid on borrowed funds was mainly due to applying funds to bulk inventory purchase transactions and early settlement payments attracting favourable discounts.
Finance facilities were utilised on a piecemeal basis for this purpose and repaid during the current year. The additional finance costs were more than compensated for by the growth in gross profit and gross profit margins.
Finance incomeFinance income totalled R242 million, of which R79 million was attributable to interest received on cash resources and R163 million to imputed IFRS interest adjustments on credit afforded to customers. In the prior year, interest received on cash
resources amounted to R64 million and the imputed IFRS interest adjustment to R130 million.
The increase in interest received from cash resources was mainly attributable to growth in working capital resources, partially offset by the utilisation of funds for financing and investing activities.
Gain on associates and joint venture measured at fair valueWith effect from 30 November 2016, Oxigen Services India and 2DFine have been accounted for as venture capital investments. The differential between the carrying value of the investments and their fair values amounted to R160 million and has been accounted for as a gain on associate and joint venture measured at fair value. This is further elaborated on in the International Distribution segment, under “Oxigen Services India and 2DFine Holdings Mauritius”.
Share of losses from associates and joint venturesThe Group’s share of losses primarily related to Oxigen Services India, 2DFine and BLM.
The financial performance of Oxigen and 2DFine for the six months ended November 2016 was equity accounted for, of which the Group’s share of losses amounted to R125 million. Consequently, any further losses incurred by Oxigen and 2DFine Holdings Mauritius, from that date, will have no impact on Group earnings. The investment therein will continue to be measured at fair value.
The Group’s share of losses in BLM amounted to R37 million after the amortisation of intangible assets.
BLUE LABEL INTEGRATED ANNUAL REPORT 2017
29 /
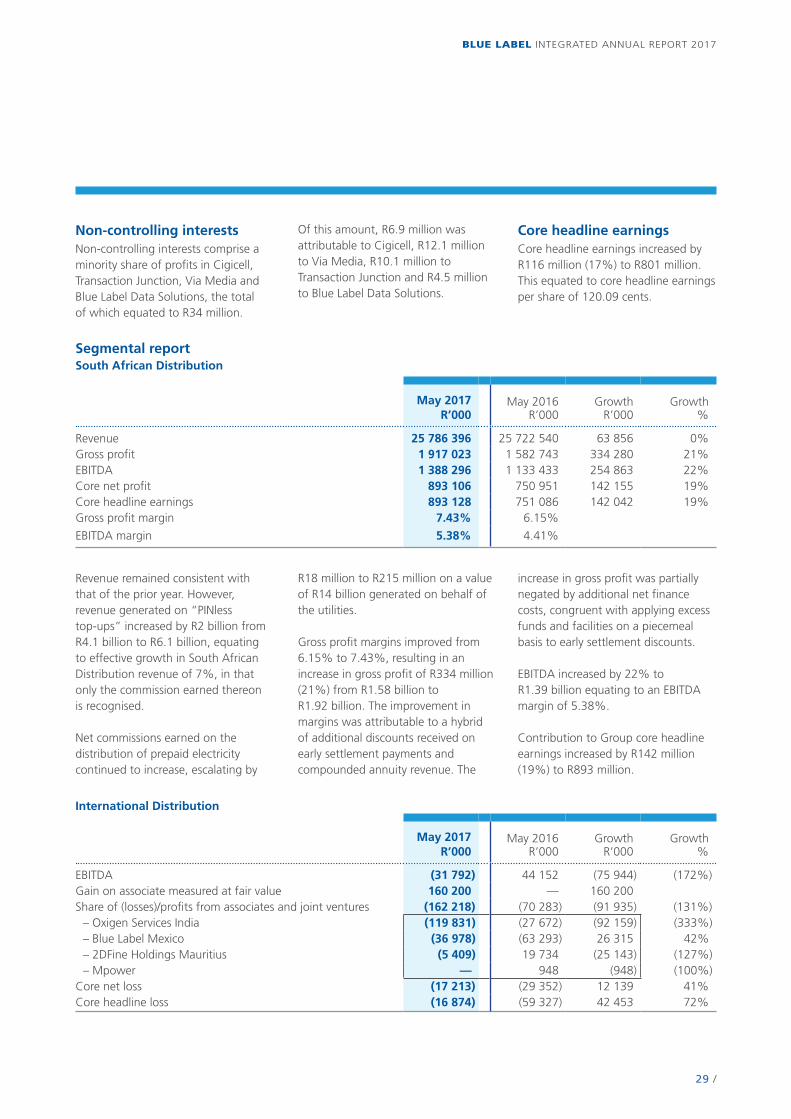
Non-controlling interestsNon-controlling interests comprise a minority share of profits in Cigicell, Transaction Junction, Via Media and Blue Label Data Solutions, the total of which equated to R34 million.
Revenue remained consistent with that of the prior year. However, revenue generated on “PINless top-ups” increased by R2 billion from R4.1 billion to R6.1 billion, equating to effective growth in South African Distribution revenue of 7%, in that only the commission earned thereon is recognised.
Net commissions earned on the distribution of prepaid electricity continued to increase, escalating by
Of this amount, R6.9 million was attributable to Cigicell, R12.1 million to Via Media, R10.1 million to Transaction Junction and R4.5 million to Blue Label Data Solutions.
R18 million to R215 million on a value of R14 billion generated on behalf of the utilities.
Gross profit margins improved from 6.15% to 7.43%, resulting in an increase in gross profit of R334 million (21%) from R1.58 billion to R1.92 billion. The improvement in margins was attributable to a hybrid of additional discounts received on early settlement payments and compounded annuity revenue. The
Core headline earningsCore headline earnings increased by R116 million (17%) to R801 million. This equated to core headline earnings per share of 120.09 cents.
increase in gross profit was partially negated by additional net finance costs, congruent with applying excess funds and facilities on a piecemeal basis to early settlement discounts.
EBITDA increased by 22% to R1.39 billion equating to an EBITDA margin of 5.38%.
Contribution to Group core headline earnings increased by R142 million (19%) to R893 million.
Segmental reportSouth African Distribution
May 2017R’000
May 2016R’000
GrowthR’000
Growth%
Revenue 25 786 396 25 722 540 63 856 0%Gross profit 1 917 023 1 582 743 334 280 21%EBITDA 1 388 296 1 133 433 254 863 22%Core net profit 893 106 750 951 142 155 19%Core headline earnings 893 128 751 086 142 042 19%Gross profit margin 7.43% 6.15%
EBITDA margin 5.38% 4.41%
International Distribution
May 2017 R’000
May 2016R’000
GrowthR’000
Growth%
EBITDA (31 792) 44 152 (75 944) (172%)Gain on associate measured at fair value 160 200 — 160 200Share of (losses)/profits from associates and joint ventures (162 218) (70 283) (91 935) (131%)
– Oxigen Services India (119 831) (27 672) (92 159) (333%)– Blue Label Mexico (36 978) (63 293) 26 315 42%– 2DFine Holdings Mauritius (5 409) 19 734 (25 143) (127%)– Mpower — 948 (948) (100%)
Core net loss (17 213) (29 352) 12 139 41%Core headline loss (16 874) (59 327) 42 453 72%

BLUE LABEL INTEGRATED ANNUAL REPORT 2017
/ 30
Financial Director’s report continued
The decline in EBITDA of R76 million was directly attributable to a negative turnaround in foreign exchange movements.
The share of net losses from associates and joint ventures comprised the following:
Oxigen Services India and 2DFine Holdings MauritiusThe financial performance of Oxigen Services India for the six months ended November 2016 was equity accounted for, of which the Group’s share of losses amounted to R120 million. The major portion of these losses was attributable to substantial expenditure incurred on the marketing of the brand and the acquisition of wallets.
The Group’s share of losses in 2DFine amounted to R5.4 million for the six months ended November 2016. These losses were attributable to interest incurred on historical loans from Gold Label Investments and Blue Label.
In the prior year, the Group’s share of profits amounted to R19.7 million. This pertained to a gain on dilution of R30 million, being the Group’s share of the increased net asset value emanating from a rights issue in Oxigen Services India, offset by a share of losses of R10.2 million relating to interest incurred on the
above loans. The gain on dilution was deducted as a headline earnings adjustment, resulting in a negative contribution of R59.3 million by the International segment to core headline earnings. With effect from 30 November 2016, Oxigen Services India and 2DFine have been accounted for as venture capital investments, and as a result thereof the investments are measured at fair value. Consequently, any further losses incurred by the above entities from that date will have no impact on Group earnings.
The differential between the carrying value of the investments and their fair value amounted to R160 million and has been accounted for in the reviewed condensed Group statement of comprehensive income as a gain on associate and joint venture measured at fair value. The fair value gain of R160 million and the Group’s share of losses for the year of R125 million, equated to a net positive contribution of R35 million to Group earnings.
Blue Label MexicoBLM’s losses declined from R130 million to R74 million, of which the Group’s share amounted to R37 million after the amortisation of intangible assets. In the comparative period the Group’s share of losses amounted to R63 million.
The decline in losses was achieved in spite of a reduction in revenue by 23%. This decline was caused by intense competition amongst carriers, resulting in lower tariffs payable by the end user. However, in the latter half of the financial year pricing stabilised, resulting in an increase in revenue during that period.
The overall decline in revenue was compensated for by an increase in gross profit of R26.6 million (32%), underpinned by higher gross profit margins.
The increase in gross profit was primarily attributable to BLM becoming a multicarrier distributor as opposed to historically being confined to one network. This has created a more competitive environment amongst the networks to the benefit of the Company.
Focus on cost efficiencies resulted in a decrease in operational expenditure by 9%. While the resultant EBITDA remained negative, it increased by R42.7 million (61%). Bill payments, credit and debit card acquiring, food vouchers and compounding annuity revenue emanating from starter pack distribution are perpetually increasing, which together with improved margins and expense containment resulted in a decline in losses.
Mobile
May 2017 R’000
May 2016R’000
GrowthR’000
Growth%
Revenue 347 858 291 856 56 002 19%Gross profit 200 079 182 533 17 546 10%EBITDA 99 101 111 142 (12 041) (11%)Core net profit 56 327 64 273 (7 946) (12%)Core headline earnings 56 289 65 333 (9 044) (14%)
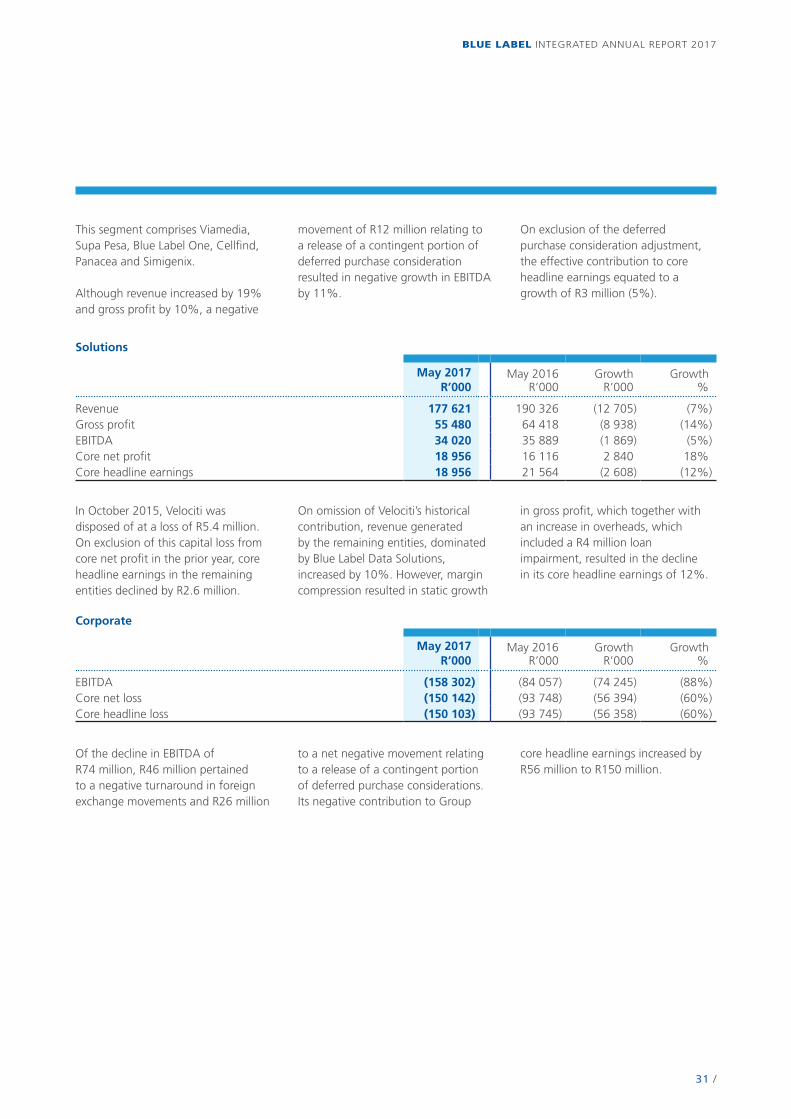
BLUE LABEL INTEGRATED ANNUAL REPORT 2017
31 /
This segment comprises Viamedia, Supa Pesa, Blue Label One, Cellfind, Panacea and Simigenix.
Although revenue increased by 19% and gross profit by 10%, a negative
Of the decline in EBITDA of R74 million, R46 million pertained to a negative turnaround in foreign exchange movements and R26 million
In October 2015, Velociti was disposed of at a loss of R5.4 million. On exclusion of this capital loss from core net profit in the prior year, core headline earnings in the remaining entities declined by R2.6 million.
movement of R12 million relating to a release of a contingent portion of deferred purchase consideration resulted in negative growth in EBITDA by 11%.
to a net negative movement relating to a release of a contingent portion of deferred purchase considerations.Its negative contribution to Group
On omission of Velociti’s historical contribution, revenue generated by the remaining entities, dominated by Blue Label Data Solutions, increased by 10%. However, margin compression resulted in static growth
On exclusion of the deferred purchase consideration adjustment, the effective contribution to core headline earnings equated to a growth of R3 million (5%).
core headline earnings increased by R56 million to R150 million.
in gross profit, which together with an increase in overheads, which included a R4 million loan impairment, resulted in the decline in its core headline earnings of 12%.
Solutions
May 2017 R’000
May 2016R’000
GrowthR’000
Growth%
Revenue 177 621 190 326 (12 705) (7%)Gross profit 55 480 64 418 (8 938) (14%)EBITDA 34 020 35 889 (1 869) (5%)Core net profit 18 956 16 116 2 840 18%Core headline earnings 18 956 21 564 (2 608) (12%)
Corporate
May 2017 R’000
May 2016R’000
GrowthR’000
Growth%
EBITDA (158 302) (84 057) (74 245) (88%)Core net loss (150 142) (93 748) (56 394) (60%)Core headline loss (150 103) (93 745) (56 358) (60%)
BLUE LABEL INTEGRATED ANNUAL REPORT 2017
/ 32
Financial Director’s report continued
Statement of financial positionTotal assets increased by R1.4 billion to R8.7 billion of which current assets increased by R1.5 billion and non-current assets reduced by R76 million.
Non-current assets included increases in capital expenditure net of depreciation of R11 million, in loans receivable of R30.9 million and trade and other receivables of R13.3 million. These increases were offset by decreases of R86 million in intangible assets and goodwill and R50.6 million in investments in associates and joint ventures.
The net decrease of R50.6 million in investment in associate and joint ventures comprised the R160 million gains measured at fair value relating to Oxigen Services India and 2DFine, a capital contribution of R25.5 million to Oxigen Services India, a further equity loan granted to Lornanox of R9.3 million, the acquisition of Utilities World for R12 million, interest of R23.5 million capitalised on loans and loans granted of R14 million. These increases were offset by the Group’s share of losses therein totalling R165 million inclusive of the amortisation of applicable intangible assets, a negative impact on foreign currency translation reserves of R82.4 million and unrealised foreign exchange losses on loans of R47.2 million.
The net decline of R86 million in intangible assets and goodwill mainly pertained to the amortisation of intangibles by R143 million, offset by R56 million expended on the purchase of software, internally generated software development costs and starter pack bases.
Of the increase in current assets, material movements included increases in inventories of R521 million, loans receivable of R90 million, cash resources of R762 million and trade receivables of R80 million.
The stock turn equated to 33 days compared to 25 days for the comparative year. Bulk inventory purchase opportunities at favourable discount rates validated the consequent increase in inventory. The nature of the business enables it to reduce its inventory holdings within the above number of days at any given time.
The debtors’ collection period increased to 39 days compared to 38 days for the comparative year.
Net profit attributable to equity holders of R787 million, less a dividend of R243 million, resulted in retained earnings accumulating to R3.6 billion.
Trade and other payables increased by R881 million, with average credit terms increasing to 53 days compared to 40 days for the comparative year.
Statement of cash flowsCash flows generated from operating activities amounted to R1.36 billion, predominately attributable to increased trading activity, net of working capital requirements.
Cash flows applied to investing activities amounted to R320 million. Of this amount, R56 million related to the purchase of intangible assets, R57 million to capital expenditure, R25.5 million to a capital contribution to Oxigen Services India, R133 million to net loans granted, R50.7 million to
earn outs relating to prior acquisitions and R7.5 million to the acquisition of Utilities World. These outflows were partially offset by R1.7 million from the sale of fixed assets and R13 million from an earn-out received emanating from the sale of Ukash.
After applying R7 million to the acquisition of treasury shares and a dividend payment of R270 million to shareholders and non-controlling interests, cash on hand at year-end amounted to R1.35 billion.
Forfeitable share schemeForfeitable shares totalling 1 376 257 (2016: 2 591 066) were issued to qualifying employees. During the year 121 226 (2016: 612 453) shares were forfeited and 2 141 673 (2016: 3 163 359) shares vested.
DividendThe Group’s current dividend policy is to declare an annual dividend. On 23 August 2017 the Board approved a gross ordinary dividend (dividend number 8) of 40 cents per ordinary share (32 cents per ordinary share net of dividend withholding tax) for the year ended 31 May 2017.
The dividend of R349 803 616 inclusive of withholding tax equates to a 2.25 cover on headline earnings. The dividend for the year ended 31 May 2017 has not been recognised in the financial statements as it was declared after this date.
Subsequent eventsOn 2 August 2017, Blue Label, through its wholly owned subsidiary, The Prepaid Company Proprietary Limited (The Prepaid Company), acquired 45% of the issued share
BLUE LABEL INTEGRATED ANNUAL REPORT 2017
33 /
capital of Cell C for a purchase consideration of R5.5 billion. In part settlement of this amount, 183 333 333 ordinary shares in Blue Label were subscribed for by third parties at an issue price of R15.00 per share, equating to R2.75 billion.
On the same date, The Prepaid Company concluded an agreement to purchase 100% of the issued share capital in 3G Mobile from its shareholders for a purchase consideration of R1.9 billion. The acquisition has been structured in two stages, whereby 47.37% of the issued share capital was initially acquired for a purchase consideration of R900 million. The remaining 52.63% of the issued share capital will be acquired for a further R1.0 billion, subject to the fulfilment of conditions precedent. Of the initial purchase of 47.37%, 16 666 666 ordinary shares were issued to the vendors at R15.00 per share, equating to R250 million. The balance of R650 million will be payable on 28 February 2018.
As part of the restructure of the debt within Cell C by third-party lenders, The Prepaid Company will be required to provide liquidity support to Magnolia Cellular Investment 2 (RF) Proprietary Limited (SPV2), which is 100% held by 3C Telecommunications Proprietary Limited (3C), of up to USD80 million, which liquidity support will be provided over 24 months and
will be in the form of subordinated funding to SPV2. Oger Telecoms contributed USD20 million of the aforesaid USD80 million thus reducing The Prepaid Company’s obligation in this regard to a maximum of USD60 million. In addition, to the extent that certain assets of Oger Telecoms are realised within the aforesaid 24-month period, a portion of such realisation shall further reduce The Prepaid Company’s obligation. In this regard, USD16 million has been realised to date, thereby reducing its current exposure to a maximum of USD44 million.
The Prepaid Company, with effect from 2 August 2017, purchased Bond notes, issued by Cedar Cellular Investments 1 Proprietary Limited (SPV1), which is 100% held by 3C, from Saudi Oger Limited with a capital redemption value of USD18 million and with a coupon rate of 8.625% per annum for a purchase consideration of USD18 million, of which USD6 million has been paid, USD3 million will be paid imminently and USD9 million will be payable on 30 November 2017. The Prepaid Company is entitled to assign its rights and obligations, in whole or in part, to a nominee. Accordingly, it has assigned such rights and obligations in respect of 50% of the Bond notes, which assignment has been accepted by the assignee.
The Prepaid Company concluded an agreement with Cell C on 2 August 2017 in terms of which it has undertaken to advance R1.34 billion on a piecemeal basis for the purpose of applying such funds towards capital expenditure. This advance, which is interest bearing, will be repayable in full by the end of July 2018.
Subsequent to year-end, dividend number 8 was declared and approved by the Board.
AppreciationI wish to express my gratitude to the Group’s finance team for their professional input and dedication throughout the year.
Dean SuntupFinancial Director
23 November 2017
Governance philosophy and approach
Entrepreneurship and innovation underpinned by good governanceThe philosophy of the Group is that good corporate governance provides an essential platform upon which to achieve its strategic objectives through the pursuit of the entrepreneurial and innovative ethos of the Group. The Board recognises that good corporate governance is essentially about effective and responsible leadership that rests on a foundation of ethical values.
King IV and Blue Label TelecomsThe Group favours the outcomes-based approach of the King IV Report on Corporate Governance for South Africa 2016 (King IV) that focuses on the quality of governance outcomes and not simply the structural and compliance approach. The Board sees the adoption of King IV as an opportunity to review, revitalise and streamline its governance structures and practices to the requirements of the expanding group. A process is currently under way to review the most appropriate recommended practices and adaptations to be applied in achieving the outcomes-based principles of King IV. Based on this review an implementation plan will be determined to fully transition the Group to the desired application of King IV.
In the interim the disclosure requirements of King IV have been adopted in this year’s integrated report, as far as possible, and explain the continuation of robust governance principles and practices adopted under King III and some of the transitional initiatives to adopting King IV.
Current year Board focus and future focusThe focus of the Board in the current year has been on continuing development and maturing of the risk management and compliance of the Group as it expands both organically and through acquisitions. While focus was maintained on the core operations, intensive Board attention has been placed on the acquisition of 3G Mobile and the 45% interest in Cell C.
Further focus will be placed on overseeing the integration and synergy plans relating to these acquisitions. With the broadening footprint and scale of the Group’s operations continued attention will be paid to further developing the governance framework for Group companies and investments to ensure that adequate strategic direction and oversight is placed on these investments.
BLUE LABEL INTEGRATED ANNUAL REPORT 2017
/ 34

Effective and ethical leadership
Ethics in actionGood corporate governance is essentially about effective and responsible leadership. It is characterised by the ethical values of responsibility, accountability, fairness and transparency. The typical aspects of corporate governance, such as the role and responsibilities of the Board and Directors individually, internal audit, risk management and stakeholder engagement rest on a foundation of ethical values.
The Board subscribes to the same ethical standards contained in the ethics statement and seeks to demonstrate these standards in all engagements with stakeholders, deliberations and decisions made as well as monitoring the ethical culture and compliance of the Group. Conflict of interest declarations are made by all directors at each Board and committee meeting.
The purpose of the ethics statement is to: �� emphasise the Group’s commitment to ethics and compliance with laws and regulations;�� set out basic standards of ethical and legal behaviour; �� provide reporting mechanisms for known or suspected ethical or legal violations; and�� help prevent and detect wrongdoing. https://www.bluelabeltelecoms.co.za/sus-ethics-statement.php
Blue Label reiterates its stance on the following matters:�� fraudulent, corrupt or illegal practices are not tolerated. Bribes or any other illicit payments including facilitations will neither be paid nor received;�� the Group does not participate in any illegal anti-competitive activity.
Employees cannot authorise or participate in any illegal conduct or action that purports to restrict competition; and�� the Group is non-political.
Employees are expected to demonstrate ethical business practices. All new staff members undergo an induction programme that includes training on the code of business conduct, including the function of the ethics hotline, such as what should be reported and how to report unethical behaviour via this channel. The Group recently implemented an interactive online portal called Blue Galaxy. The aim is to facilitate the awareness of issues relating to ethics, Group policy and procedure, security awareness and best practice. All staff have access to the portal and are required to read and understand the relevant topic, answer and number of specific questions relating to the topic and acknowledge receipt of the relevant document or policy. The ethics hotline is outsourced to KPMG Ethics Line, a division of KPMG, and can be accessed on 0800 22 10 20. No incidents were reported during the year ended 31 May 2017.
The Social, Ethics and Transformation Committee maintains oversight of the ethics policies and applications in the Group and the Chairman of the Board sets the ethical tone for the Board as a whole. Focus areas during the year and going forward included:��Appropriate use and safeguards of customer data including confidentiality regulations��Accreditation and monitoring of business partners’ adherence to Group ethical standards
Responsible corporate citizenship Making a difference in South Africa is a key component of the Group’s purpose and core strategy in so far as the positive impact we have on the economy, communities, customers, employees and our business partners. The continued economic, business and societal transformation of South Africa is considered integral to the future success of our business.
The very nature of our business operations extends to empowering our consumers through:�� Innovative products and services providing access to airtime, data, utilities, financial services and ticketing; �� Reaching unbanked and underbanked communities enabling convenient payment mechanisms and taking products to the people; and�� Enriching and uplifting quality of life.
The market we service extends to nearly 1.5 million merchants in the formal and informal market. Informal and indirect employment opportunities abound within our network of merchants including foot soldiers and BLU agents. Our entrepreneurial trading models including gazebos, umbrellas, tables and stalls allow easy access for individuals into the market.
The investment in our people extends to our extensive and blended development programmes, training and learnership programmes (refer to Human capital section on page 81).
BLUE LABEL INTEGRATED ANNUAL REPORT 2017
35 /
Effective and ethical leadership continued
Our transformation plans extend to employment equity plans, enterprise and supplier development as well as specific socio-economic projects that are reported on pages 80 to 83.
The Social, Ethics and Transformation Committee specifically oversees and monitors transformation, socio- economic development, labour, employment, corporate citizenship, health, safety and environmental practices throughout the Group. Their detailed report can be found on page 71. In addition the Board actively considers the responsible corporate citizenship and making a difference in South Africa in its core strategy and purpose.
Focus areas during the year included the launch of the School of Entrepreneurship in Tshwane and Soweto, involving the accredited training of unemployed South Africans in how to run a successful SMME, and growing the Group’s distribution footprint in the main market channel. A further focus area has been leveraging off the access to matriculants that Blue Label has via the primary SED initiative, the Boys & Girls Club of South Africa (BGCSA).
Value creation and reportingThe Board regards governance as essential for the success of the Group’s business. It is committed to applying the principles of good governance in directing and managing the Group in order to achieve its strategic objectives. The integration of our stakeholder engagement, material matters assessment, strategy and business model development together with our performance management and outlook ultimately encapsulates the value creation story of the Group overseen by our governance framework.
The Group endeavours to provide relevant reporting in a transparent manner to its stakeholders through the integrated report, annual and interim financial statements as well as supplementary reports and engagement with various stakeholders during the year.
The integrated report is our primary annual report and is supported by supplementary reports available on our website www.bluelabeltelecoms.co.za.
BLUE LABEL INTEGRATED ANNUAL REPORT 2017
/ 36
Board of DirectorsThe Board directs the Group towards and facilitates the achievement of the Group’s strategy and operational objectives. It is accountable for the development and execution of the Group’s strategy, operating performance and financial results. Its primary responsibilities include: determining the Group’s purpose and values, providing strategic direction to the Group, appointing the Joint Chief Executive Officers, identifying key risk areas and key performance indicators of the Group’s businesses, monitoring the performance of the Group against agreed objectives, deciding on significant financial matters, approving policies and reviewing the performance of the Executive Directors against defined objectives. A range of non-financial information is also provided to the Board to enable it to consider qualitative performance factors that involve broader stakeholder interests.
The Board, which meets at least quarterly, retains full and effective control over all the operations. Additional ad hoc Board meetings are convened as circumstances require.
Board CharterOur Board Charter assists our Board in conducting its business according to legislative requirements and the principles of good corporate governance. It ensures that each director is aware of his or her powers, duties and responsibilities when acting on behalf of the Blue Label Telecoms Group. The Board Charter is subject to the provisions of the Companies Act, JSE Listings Requirements, our Memorandum of Incorporation, and all other applicable legislation. The Board Charter covers the role and function of the Board; its detailed responsibilities; how it discharges its duties; the Board composition; and the establishment of Board Committees.
The Board has concluded that it has collectively satisfied and fulfilled its responsibilities in accordance with the charter.
Governance frameworkThe Board regards governance as a fundamental essential for the success of the Group’s business. It is committed to applying the principles of good governance in directing and managing the Group in order to achieve its strategic objectives. The Board is the focal point for and custodian of the Group’s governance framework, and is supported by its committee structures, management, shareholders and other stakeholders of the Company. The Board is ultimately accountable for the performance and affairs of the Company.
The governance framework facilitates a balance between the Board’s role of providing direction and oversight with accountability to support acceptable risk parameters, consistent compliance with regulations, standards and codes relevant to the Group. At the same time the Board encourages entrepreneurship and innovation, which are recognised as key drivers of Group performance. At the operations, governance processes are aligned with the governance framework established by Blue Label. Each subsidiary company has its own board of directors and its strategy, business plan and performance criteria are clearly defined. The strategy and business plan of each subsidiary are presented to the Blue Label Board by the subsidiary’s board each year. Subsidiary boards comprise Executive and Non-Executive Directors, some of whom are Executive and Non-Executive Directors of Blue Label.
Board compositionBlue Label has a unitary Board structure comprising nine Directors.
Five are Independent Non-Executive Directors, while one is Non-Executive and three are Executive Directors. A biography of each Director appears on pages 16 and 17 of the integrated annual report.
The Board has a balance of independent directors and non-executive directors. This is incorporated into our Board Charter, which promotes a clear balance of power and authority at board of directors’ level, to ensure that no one director has unfettered powers of decision-making. In line with King IV, the roles of the Chairman and the Chief Executives are separate. The Board is led by Larry Nestadt, an independent non-executive Chairman. The Joint Chief Executives are Brett Levy and Mark Levy.
The Chairman’s role includes setting the ethical tone for the Board and ensuring that the Board remains efficient, focused and operates as a unit. The Chairman provides overall leadership to the Board, without limiting the principle of collective responsibility for Board decisions. He also facilitates appropriate communication with shareholders and enables constructive relations between the Executive and Non-Executive Directors.
The Joint Chief Executives’ principal role is to provide leadership to the executive team in running the Group’s businesses. The Board defines the Group’s levels of authority, reserving specific powers for the Board, while delegating others to Senior Management. The collective responsibility of management vests with the Joint Chief Executives who regularly report to the Board on the Group’s progress in delivering its objectives and strategy.
Board composition, structure and report back
BLUE LABEL INTEGRATED ANNUAL REPORT 2017
37 /
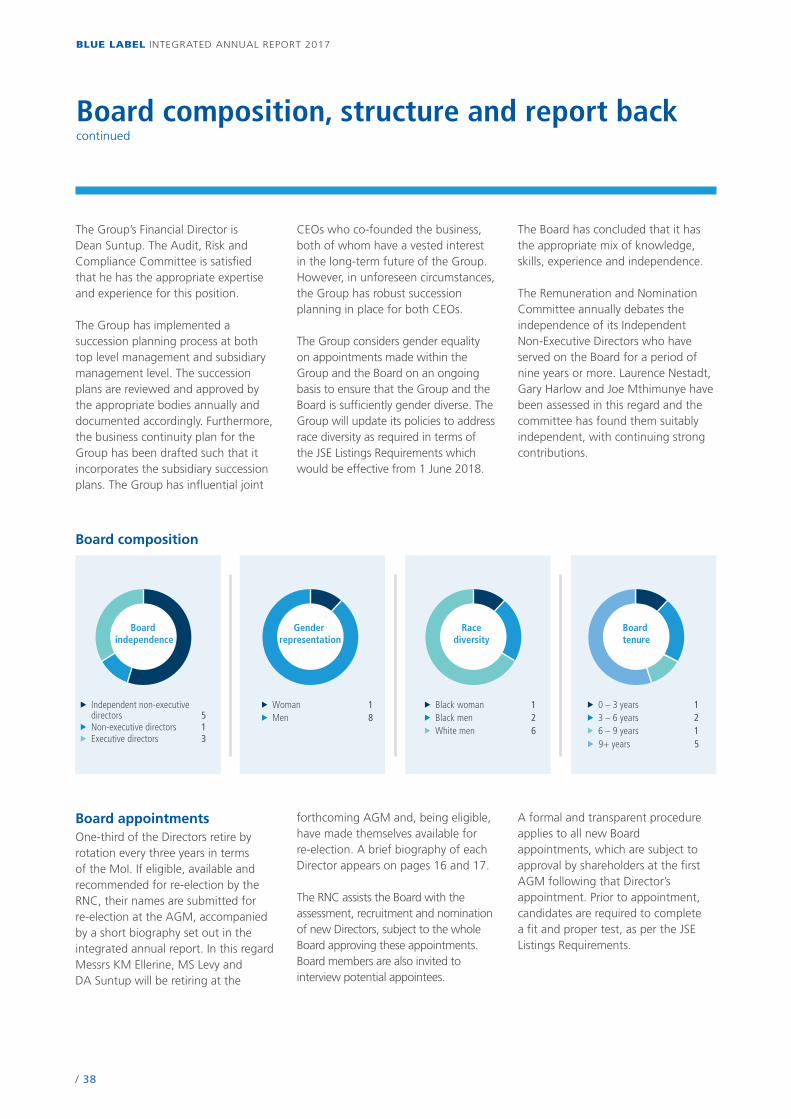
Board composition, structure and report back continued
The Group’s Financial Director is Dean Suntup. The Audit, Risk and Compliance Committee is satisfied that he has the appropriate expertise and experience for this position.
The Group has implemented a succession planning process at both top level management and subsidiary management level. The succession plans are reviewed and approved by the appropriate bodies annually and documented accordingly. Furthermore, the business continuity plan for the Group has been drafted such that it incorporates the subsidiary succession plans. The Group has influential joint
Board appointmentsOne-third of the Directors retire by rotation every three years in terms of the MoI. If eligible, available and recommended for re-election by the RNC, their names are submitted for re-election at the AGM, accompanied by a short biography set out in the integrated annual report. In this regard Messrs KM Ellerine, MS Levy and DA Suntup will be retiring at the
CEOs who co-founded the business, both of whom have a vested interest in the long-term future of the Group. However, in unforeseen circumstances, the Group has robust succession planning in place for both CEOs.
The Group considers gender equality on appointments made within the Group and the Board on an ongoing basis to ensure that the Group and the Board is sufficiently gender diverse. The Group will update its policies to address race diversity as required in terms of the JSE Listings Requirements which would be effective from 1 June 2018.
forthcoming AGM and, being eligible, have made themselves available for re-election. A brief biography of each Director appears on pages 16 and 17.
The RNC assists the Board with the assessment, recruitment and nomination of new Directors, subject to the whole Board approving these appointments. Board members are also invited to interview potential appointees.
The Board has concluded that it has the appropriate mix of knowledge, skills, experience and independence.
The Remuneration and Nomination Committee annually debates the independence of its Independent Non-Executive Directors who have served on the Board for a period of nine years or more. Laurence Nestadt, Gary Harlow and Joe Mthimunye have been assessed in this regard and the committee has found them suitably independent, with continuing strong contributions.
A formal and transparent procedure applies to all new Board appointments, which are subject to approval by shareholders at the first AGM following that Director’s appointment. Prior to appointment, candidates are required to complete a fit and proper test, as per the JSE Listings Requirements.
Board composition
u Independent non-executive directors 5
u Non-executive directors 1u Executive directors 3
u Woman 1u Men 8
u Black woman 1u Black men 2u White men 6
u 9+ years 5
u 0 – 3 years 1u 3 – 6 years 2u 6 – 9 years 1
Gender representation
Board independence
Race diversity
Board tenure
BLUE LABEL INTEGRATED ANNUAL REPORT 2017
/ 38
Mr Y Mahomed resigned as a Director of the Board and member of the Social, Ethics and Transformation Committee with effect from 11 January 2017, due to ill health. Ms P Mahanyele was appointed as a Director of the Board and member of the Audit, Risk and Compliance Committee on 1 September 2016, as a member of the Social, Ethics and Transformation Committee on 7 March 2017 and as a member of the Investment Committee on 31 August 2017.
Board effectivenessThe Board Charter provides for assessing of the Board and its committees every other year, which is recommended by King IV. In the prior year the Board and its committees assessed its performance and effectiveness according to the following categories:
u Effectiveness and composition; u Dynamics; u Risk management; u Succession planning; u Ethical leadership; and u Corporate citizenship.
Based on the consolidated feedback from the assessment, the Board is satisfied with the overall performance and effectiveness of the Board, its members and the committees. The 2016 internal evaluation revealed no major concerns, however gender diversity aspirations were noted. In response, Ms P Mahanyele was appointed as a member of the Social, Ethics and Transformation Committee and the Investment Committee. Aligned with our gender policy we will continue to pursue gender diversification on the Board.
The Board is satisfied that the evaluation process improves performance and effectiveness.
Refer to Remuneration section (page 60) for performance evaluation of CEOs against agreed upon performance measures and targets.
Evaluations of individual Executive Directors’ performance take place annually, once during remuneration increase and performance bonus award periods and, as applicable, prior to the AGM regarding the re-election of Directors. Evaluations of individual Non-Executive Directors’ performance takes place annually (in respect of those standing for re-election at the AGM) and for the remaining Directors every other year (as part of the Board and committee evaluations). Refer to Remuneration section for further details.
Induction of a new Director is tailored according to the knowledge and experience of the Director in a listed environment. Focus is placed on providing information on the Board structure, business operations and Group strategy. Ongoing training and development of Directors involve ad hoc presentations to the Board by professional advisers and Senior Management to ensure the Board is kept abreast of governance, regulatory and operational developments.
Company SecretaryOur Board remains satisfied with the competency and experience of our Group Company Secretary, Janine van Eden (BProc, LLB, Conveyancing). The performance appraisal of the Company Secretary for the year under review took into account the quality of support received and guidance provided to the Board. She maintains an arm’s length relationship with the Board, providing guidance to Board members on execution of their duties and keeps up to date on the latest
developments in corporate governance and regulation. All Directors have full access to the services and advice of the Group Company Secretary in all aspects of the Board’s mandate and operations of the Group, the Board is satisfied that these arrangements are effective.
Board CommitteesThe Board has delegated certain functions to well-structured committees without abdicating its own responsibilities and accountability. Board Committees operate under written terms of reference approved by the Board. Board Committees are free to take independent professional advice as and when deemed necessary, for which a formal policy is in place. The Group Company Secretary provides secretarial services for the committees.
There is transparency and full disclosure from Board Committees to the Board. The minutes of committees are submitted to the Board for noting and discussion. In addition, Directors have full access to all Board Committee documentation and committee chairpersons provide the Board with verbal reports on recent activities.
The Board is of the opinion that all Board Committees have effectively discharged their responsibilities, as contained in their respective terms of reference.
BLUE LABEL INTEGRATED ANNUAL REPORT 2017
39 /
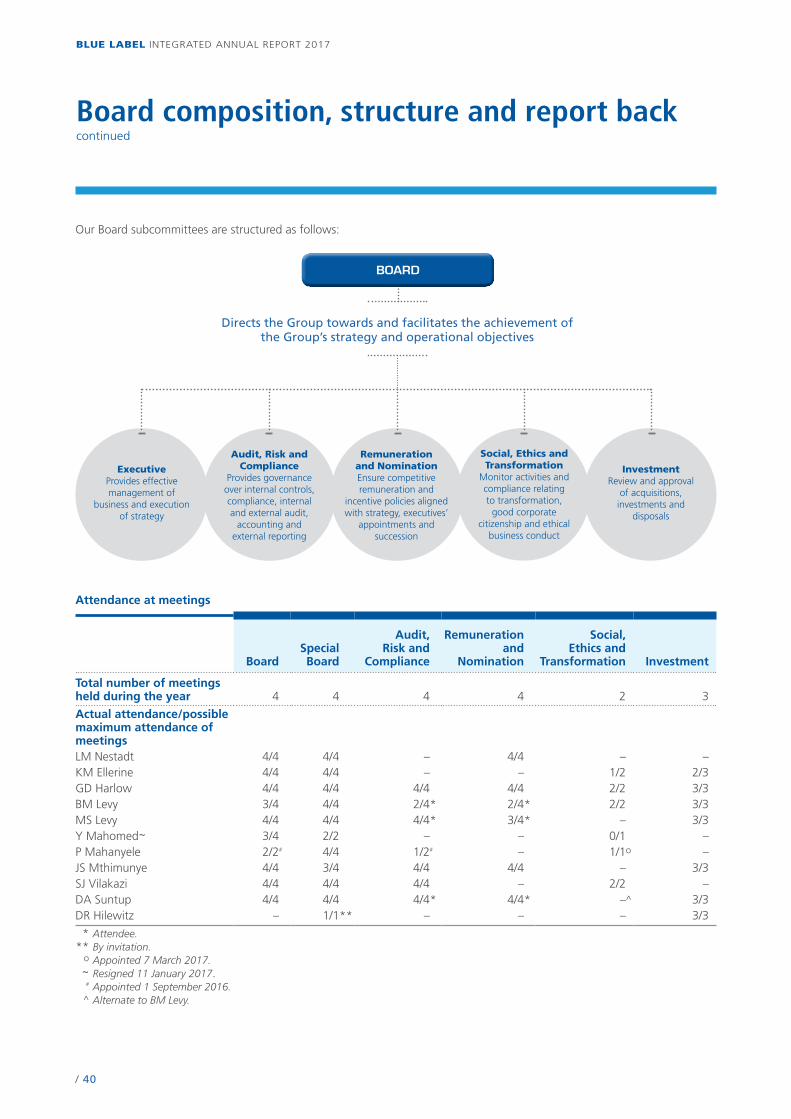
Board composition, structure and report back continued
Our Board subcommittees are structured as follows:
BOARD
Directs the Group towards and facilitates the achievement of the Group’s strategy and operational objectives
ExecutiveProvides effective management of
business and execution of strategy
Audit, Risk and Compliance
Provides governance over internal controls, compliance, internal and external audit,
accounting and external reporting
Remuneration and NominationEnsure competitive remuneration and
incentive policies aligned with strategy, executives’
appointments and succession
Social, Ethics and Transformation
Monitor activities and compliance relating to transformation,
good corporate citizenship and ethical
business conduct
InvestmentReview and approval
of acquisitions, investments and
disposals
Attendance at meetings
BoardSpecialBoard
Audit,Risk and
Compliance
Remunerationand
Nomination
Social,Ethics and
Transformation Investment
Total number of meetings held during the year 4 4 4 4 2 3
Actual attendance/possible maximum attendance of meetingsLM Nestadt 4/4 4/4 – 4/4 – –KM Ellerine 4/4 4/4 – – 1/2 2/3GD Harlow 4/4 4/4 4/4 4/4 2/2 3/3BM Levy 3/4 4/4 2/4* 2/4* 2/2 3/3MS Levy 4/4 4/4 4/4* 3/4* – 3/3Y Mahomed~ 3/4 2/2 – – 0/1 –P Mahanyele 2/2# 4/4 1/2# – 1/1o –JS Mthimunye 4/4 3/4 4/4 4/4 – 3/3SJ Vilakazi 4/4 4/4 4/4 – 2/2 –DA Suntup 4/4 4/4 4/4* 4/4* –^ 3/3DR Hilewitz – 1/1** – – – 3/3
* Attendee. ** By invitation. o Appointed 7 March 2017. ~ Resigned 11 January 2017. # Appointed 1 September 2016. ^ Alternate to BM Levy.
BLUE LABEL INTEGRATED ANNUAL REPORT 2017
/ 40
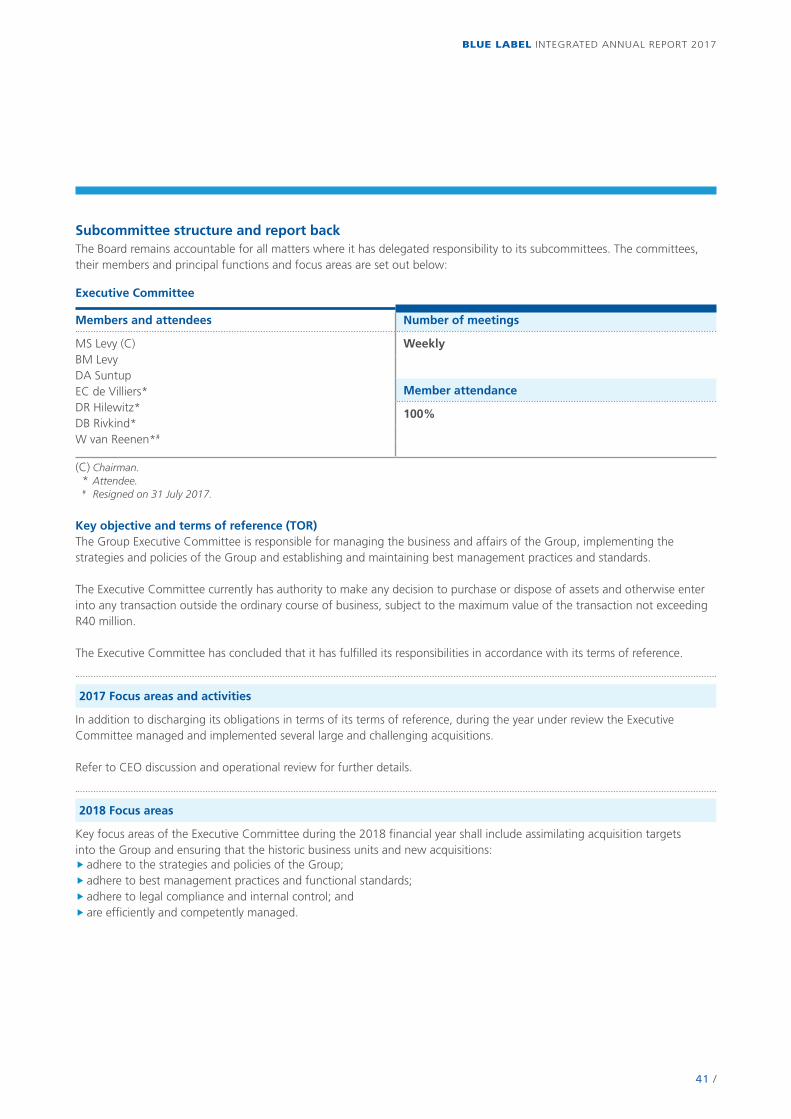
Subcommittee structure and report backThe Board remains accountable for all matters where it has delegated responsibility to its subcommittees. The committees, their members and principal functions and focus areas are set out below:
Executive Committee
Members and attendees Number of meetings
MS Levy (C)BM LevyDA SuntupEC de Villiers*DR Hilewitz*DB Rivkind*W van Reenen*#
Weekly
Member attendance
100%
(C) Chairman.* Attendee.
# Resigned on 31 July 2017.
Key objective and terms of reference (TOR)The Group Executive Committee is responsible for managing the business and affairs of the Group, implementing the strategies and policies of the Group and establishing and maintaining best management practices and standards.
The Executive Committee currently has authority to make any decision to purchase or dispose of assets and otherwise enter into any transaction outside the ordinary course of business, subject to the maximum value of the transaction not exceeding R40 million.
The Executive Committee has concluded that it has fulfilled its responsibilities in accordance with its terms of reference.
2017 Focus areas and activities
In addition to discharging its obligations in terms of its terms of reference, during the year under review the Executive Committee managed and implemented several large and challenging acquisitions.
Refer to CEO discussion and operational review for further details.
2018 Focus areas
Key focus areas of the Executive Committee during the 2018 financial year shall include assimilating acquisition targets into the Group and ensuring that the historic business units and new acquisitions:�� adhere to the strategies and policies of the Group;�� adhere to best management practices and functional standards;�� adhere to legal compliance and internal control; and�� are efficiently and competently managed.
BLUE LABEL INTEGRATED ANNUAL REPORT 2017
41 /
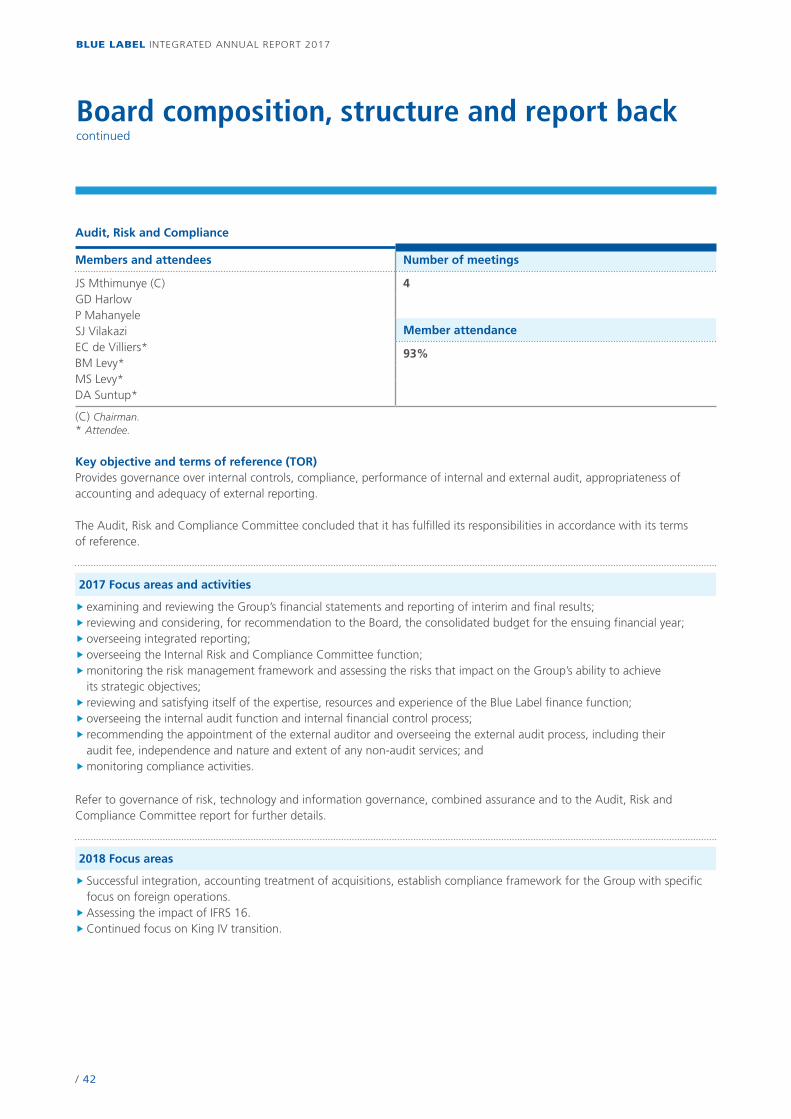
Board composition, structure and report back continued
Audit, Risk and Compliance
Members and attendees Number of meetings
JS Mthimunye (C)GD HarlowP MahanyeleSJ Vilakazi EC de Villiers*BM Levy*MS Levy*DA Suntup*
4
Member attendance
93%
(C) Chairman.* Attendee.
Key objective and terms of reference (TOR)Provides governance over internal controls, compliance, performance of internal and external audit, appropriateness of accounting and adequacy of external reporting.
The Audit, Risk and Compliance Committee concluded that it has fulfilled its responsibilities in accordance with its terms of reference.
2017 Focus areas and activities
�� examining and reviewing the Group’s financial statements and reporting of interim and final results;�� reviewing and considering, for recommendation to the Board, the consolidated budget for the ensuing financial year;�� overseeing integrated reporting;�� overseeing the Internal Risk and Compliance Committee function;��monitoring the risk management framework and assessing the risks that impact on the Group’s ability to achieve its strategic objectives;�� reviewing and satisfying itself of the expertise, resources and experience of the Blue Label finance function;�� overseeing the internal audit function and internal financial control process;�� recommending the appointment of the external auditor and overseeing the external audit process, including their audit fee, independence and nature and extent of any non-audit services; and��monitoring compliance activities.
Refer to governance of risk, technology and information governance, combined assurance and to the Audit, Risk and Compliance Committee report for further details.
2018 Focus areas
�� Successful integration, accounting treatment of acquisitions, establish compliance framework for the Group with specific focus on foreign operations.��Assessing the impact of IFRS 16.��Continued focus on King IV transition.
BLUE LABEL INTEGRATED ANNUAL REPORT 2017
/ 42
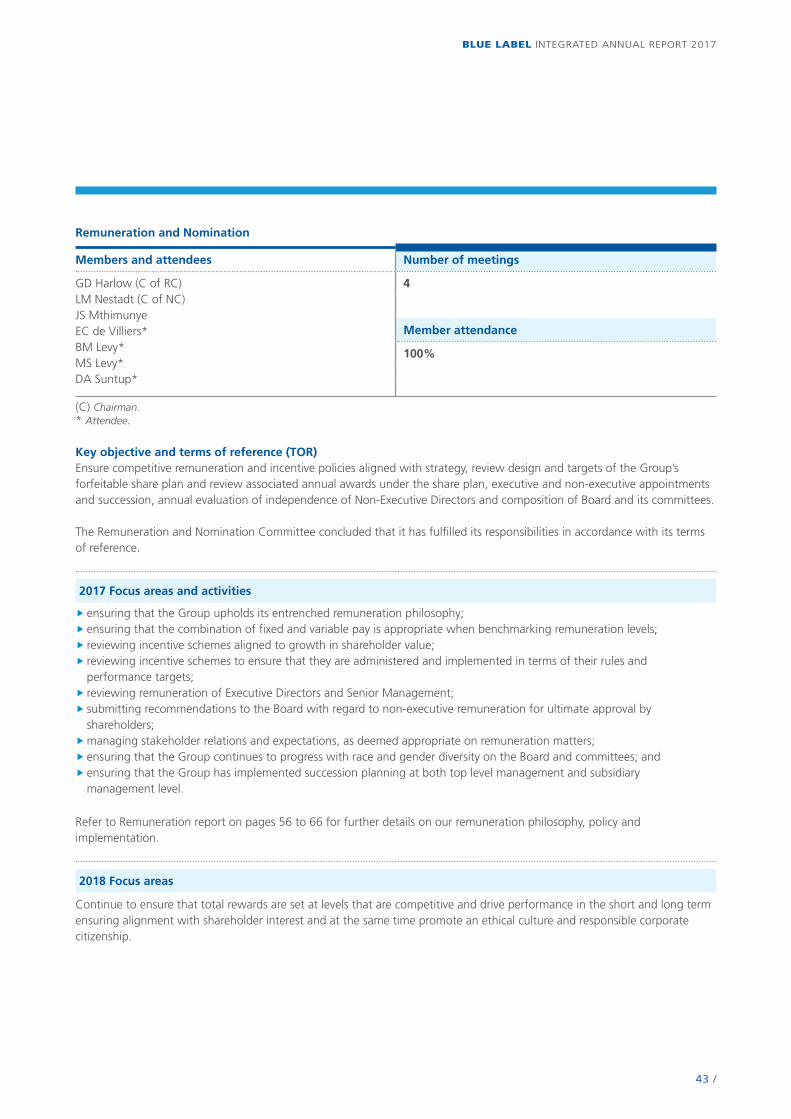
Remuneration and Nomination
Members and attendees Number of meetings
GD Harlow (C of RC)LM Nestadt (C of NC)JS MthimunyeEC de Villiers*BM Levy*MS Levy*DA Suntup*
4
Member attendance
100%
(C) Chairman.* Attendee.
Key objective and terms of reference (TOR)Ensure competitive remuneration and incentive policies aligned with strategy, review design and targets of the Group’s forfeitable share plan and review associated annual awards under the share plan, executive and non-executive appointments and succession, annual evaluation of independence of Non-Executive Directors and composition of Board and its committees.
The Remuneration and Nomination Committee concluded that it has fulfilled its responsibilities in accordance with its terms of reference.
2017 Focus areas and activities
�� ensuring that the Group upholds its entrenched remuneration philosophy;�� ensuring that the combination of fixed and variable pay is appropriate when benchmarking remuneration levels;�� reviewing incentive schemes aligned to growth in shareholder value;�� reviewing incentive schemes to ensure that they are administered and implemented in terms of their rules and performance targets;�� reviewing remuneration of Executive Directors and Senior Management; �� submitting recommendations to the Board with regard to non-executive remuneration for ultimate approval by shareholders;��managing stakeholder relations and expectations, as deemed appropriate on remuneration matters;�� ensuring that the Group continues to progress with race and gender diversity on the Board and committees; and�� ensuring that the Group has implemented succession planning at both top level management and subsidiary management level.
Refer to Remuneration report on pages 56 to 66 for further details on our remuneration philosophy, policy and implementation.
2018 Focus areas
Continue to ensure that total rewards are set at levels that are competitive and drive performance in the short and long term ensuring alignment with shareholder interest and at the same time promote an ethical culture and responsible corporate citizenship.
BLUE LABEL INTEGRATED ANNUAL REPORT 2017
43 /
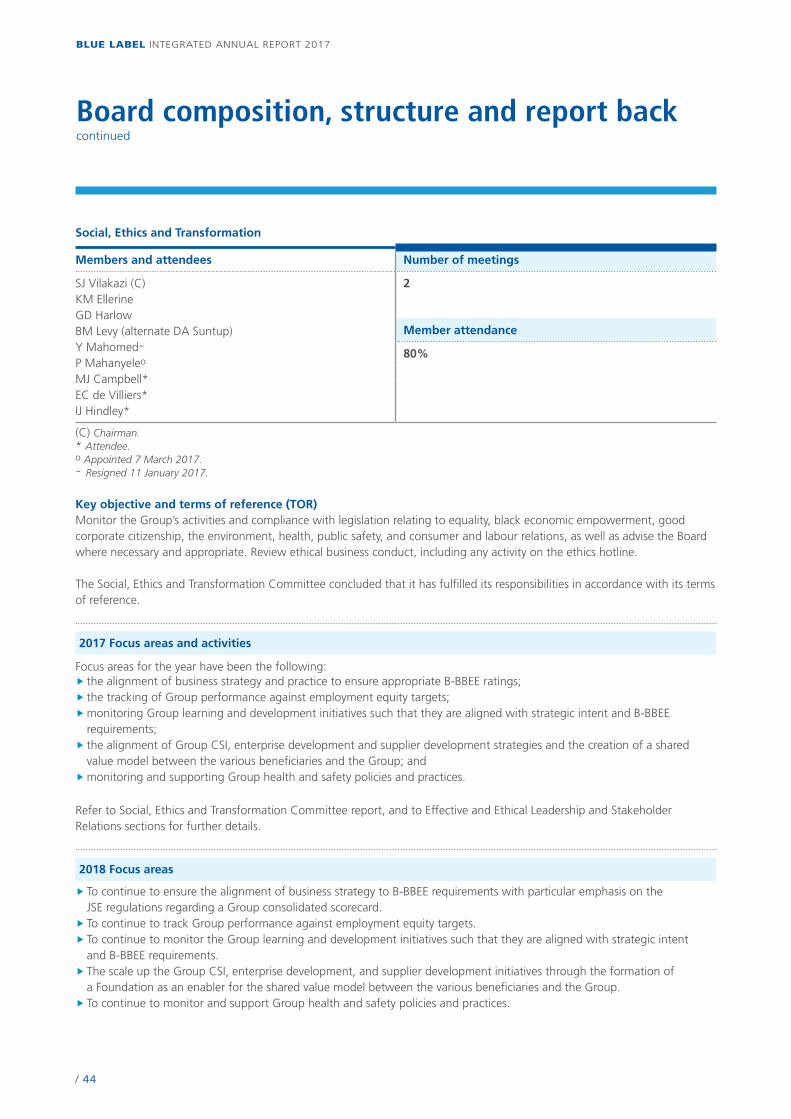
Board composition, structure and report back continued
Social, Ethics and Transformation
Members and attendees Number of meetings
SJ Vilakazi (C)KM EllerineGD HarlowBM Levy (alternate DA Suntup)Y Mahomed~
P Mahanyeleo
MJ Campbell*EC de Villiers*IJ Hindley*
2
Member attendance
80%
(C) Chairman.* Attendee.o Appointed 7 March 2017.~ Resigned 11 January 2017.
Key objective and terms of reference (TOR)Monitor the Group’s activities and compliance with legislation relating to equality, black economic empowerment, good corporate citizenship, the environment, health, public safety, and consumer and labour relations, as well as advise the Board where necessary and appropriate. Review ethical business conduct, including any activity on the ethics hotline.
The Social, Ethics and Transformation Committee concluded that it has fulfilled its responsibilities in accordance with its terms of reference.
2017 Focus areas and activities
Focus areas for the year have been the following:�� the alignment of business strategy and practice to ensure appropriate B-BBEE ratings;�� the tracking of Group performance against employment equity targets;��monitoring Group learning and development initiatives such that they are aligned with strategic intent and B-BBEE requirements; �� the alignment of Group CSI, enterprise development and supplier development strategies and the creation of a shared value model between the various beneficiaries and the Group; and ��monitoring and supporting Group health and safety policies and practices.
Refer to Social, Ethics and Transformation Committee report, and to Effective and Ethical Leadership and Stakeholder Relations sections for further details.
2018 Focus areas
�� To continue to ensure the alignment of business strategy to B-BBEE requirements with particular emphasis on the JSE regulations regarding a Group consolidated scorecard.�� To continue to track Group performance against employment equity targets.�� To continue to monitor the Group learning and development initiatives such that they are aligned with strategic intent and B-BBEE requirements. �� The scale up the Group CSI, enterprise development, and supplier development initiatives through the formation of a Foundation as an enabler for the shared value model between the various beneficiaries and the Group.�� To continue to monitor and support Group health and safety policies and practices.
BLUE LABEL INTEGRATED ANNUAL REPORT 2017
/ 44

Investment (ad hoc, minimum two meetings)
Members and attendees Number of meetings
GD Harlow (C)KM EllerineDR Hilewitz BM LevyMS LevyJS MthimunyeDA SuntupEC de Villiers*
3
Member attendance
95%
(C) Chairman.* Attendee.
Key objective and terms of reference (TOR)�� Reviewing acquisitions, investments and disposals made within the Executive Committee’s mandate.�� Reviewing, considering and approving proposed acquisitions, investments and disposals of the Group recommended by the Executive Committee ranging between R40 million and R100 million per transaction.�� Reviewing, considering and recommending to the Board acquisitions and investments of the Group above R100 million.��Annually review the performance of each investment and acquisition made.
The Investment Committee concluded that it has fulfilled its responsibilities in accordance with its terms of reference.
2017 Focus areas and activities
Blue Label’s strategy is to grow its businesses organically and to enhance its competitive advantage and offering to its customers through strategic acquisitions. All new investments which are considered have to be motivated by alignment with Group objectives, strategic focus and they have to enhance future profitability. Among the considerations are the requirements that the future returns exceed Blue Label’s weighted average cost of capital (WACC), enhance Blue Label’s service and product offerings or complement existing ones, attract new skills and management and offer synergy benefits.
The main challenge is that Blue Label operates in a rapidly developing and highly competitive market where the customer is “king”. Acquisitions need to be strongly motivated to the investment committee to meet these challenges.
Past acquisitions over the previous four years are reviewed annually in terms of actual performance compared to budget and whether they met the criteria set when they were initially approved by the Investment Committee. Any sub-performance is analysed in full to assist the committee in shaping its criteria for future acquisitions as well as advising management on corrective steps to be taken.
In August 2017 the Cell C and 3G acquisitions were implemented.
2018 Focus areas
As the Group is in the expansion phase of its development, further acquisitions are being pursued and appraised and are likely to continue in the next financial year.
A challenge for the committee will always be to look at ways of retaining the entrepreneurial management teams that come with these acquisitions through our long-term share plan.
BLUE LABEL INTEGRATED ANNUAL REPORT 2017
45 /
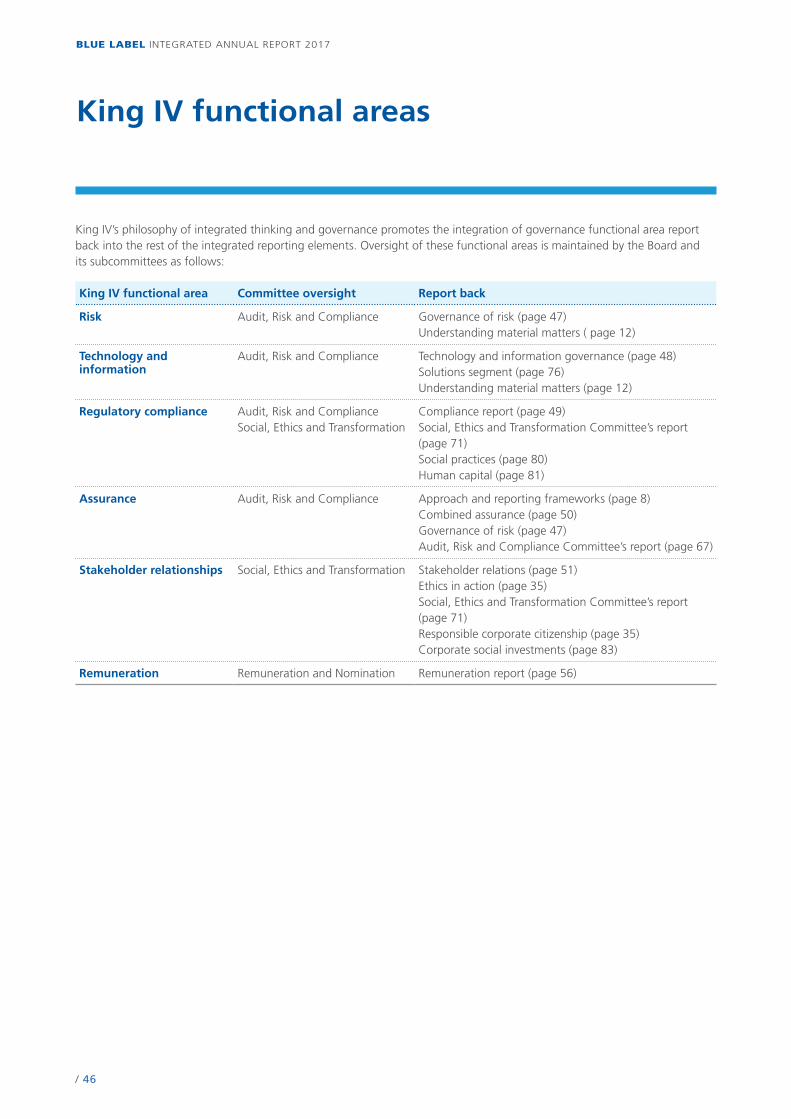
King IV’s philosophy of integrated thinking and governance promotes the integration of governance functional area report back into the rest of the integrated reporting elements. Oversight of these functional areas is maintained by the Board and its subcommittees as follows:
King IV functional area Committee oversight Report back
Risk Audit, Risk and Compliance Governance of risk (page 47)Understanding material matters ( page 12)
Technology and information
Audit, Risk and Compliance Technology and information governance (page 48)Solutions segment (page 76)Understanding material matters (page 12)
Regulatory compliance Audit, Risk and ComplianceSocial, Ethics and Transformation
Compliance report (page 49)Social, Ethics and Transformation Committee’s report (page 71)Social practices (page 80)Human capital (page 81)
Assurance Audit, Risk and Compliance Approach and reporting frameworks (page 8)Combined assurance (page 50)Governance of risk (page 47)Audit, Risk and Compliance Committee’s report (page 67)
Stakeholder relationships Social, Ethics and Transformation Stakeholder relations (page 51)Ethics in action (page 35)Social, Ethics and Transformation Committee’s report (page 71)Responsible corporate citizenship (page 35)Corporate social investments (page 83)
Remuneration Remuneration and Nomination Remuneration report (page 56)
King IV functional areas
BLUE LABEL INTEGRATED ANNUAL REPORT 2017
/ 46
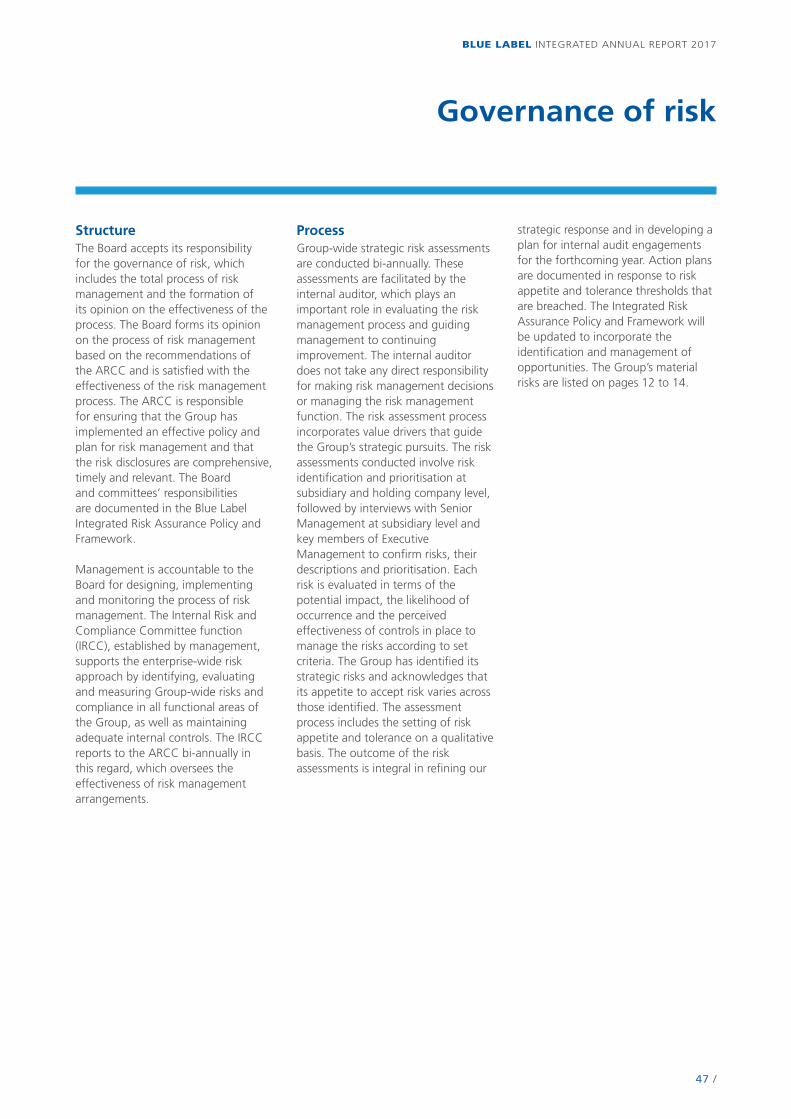
StructureThe Board accepts its responsibility for the governance of risk, which includes the total process of risk management and the formation of its opinion on the effectiveness of the process. The Board forms its opinion on the process of risk management based on the recommendations of the ARCC and is satisfied with the effectiveness of the risk management process. The ARCC is responsible for ensuring that the Group has implemented an effective policy and plan for risk management and that the risk disclosures are comprehensive, timely and relevant. The Board and committees’ responsibilities are documented in the Blue Label Integrated Risk Assurance Policy and Framework.
Management is accountable to the Board for designing, implementing and monitoring the process of risk management. The Internal Risk and Compliance Committee function (IRCC), established by management, supports the enterprise-wide risk approach by identifying, evaluating and measuring Group-wide risks and compliance in all functional areas of the Group, as well as maintaining adequate internal controls. The IRCC reports to the ARCC bi-annually in this regard, which oversees the effectiveness of risk management arrangements.
ProcessGroup-wide strategic risk assessments are conducted bi-annually. These assessments are facilitated by the internal auditor, which plays an important role in evaluating the risk management process and guiding management to continuing improvement. The internal auditor does not take any direct responsibility for making risk management decisions or managing the risk management function. The risk assessment process incorporates value drivers that guide the Group’s strategic pursuits. The risk assessments conducted involve risk identification and prioritisation at subsidiary and holding company level, followed by interviews with Senior Management at subsidiary level and key members of Executive Management to confirm risks, their descriptions and prioritisation. Each risk is evaluated in terms of the potential impact, the likelihood of occurrence and the perceived effectiveness of controls in place to manage the risks according to set criteria. The Group has identified its strategic risks and acknowledges that its appetite to accept risk varies across those identified. The assessment process includes the setting of risk appetite and tolerance on a qualitative basis. The outcome of the risk assessments is integral in refining our
strategic response and in developing a plan for internal audit engagements for the forthcoming year. Action plans are documented in response to risk appetite and tolerance thresholds that are breached. The Integrated Risk Assurance Policy and Framework will be updated to incorporate the identification and management of opportunities. The Group’s material risks are listed on pages 12 to 14.
Governance of risk
BLUE LABEL INTEGRATED ANNUAL REPORT 2017
47 /
Technology and information governance
The Board is responsible for the Group’s technology and information governance risk and compliance. The Board has delegated its responsibility for the implementation of IT governance to management, which in turn, has adopted an IT governance framework. The Information Security Officer continues to drive a number of operational and educational programmes across the organisation in order to ensure the framework is effectively communicated and that all Group companies are informed of the framework and associated policies. Management has implemented controls to ensure that the policies are effectively adopted and maintained across the organisation.
IT controls have been tested to ensure consistent and adequate risk management has been applied. The operation’s environment has been tested to ascertain the process requirements from both an enhancement as well as a compliance perspective.
On project and system changes, processes are in operation to ensure that focus is appropriately maintained. Congruent with growth in business, there has been a marked increase in new requests for technology enhancements. These processes ensure that efforts are focused on developments that will assist customers to meet their objectives, while maintaining acceptable performance levels from the systems.
In order to gear the technology function to support the growing business environment, a number of governance, risk and compliance objectives were set and have been met. The governance framework was developed by initially identifying generic technology risks and the policies developed aligned to the framework are in some cases more Group specific, and these are being refined and defined in more detail to ensure a higher level of maturity.
The most significant key risk is the threat from cyber security. A significant effort is spent with internal audit, external audit and specialist third parties to ensure that we continually update and test our systems to ensure that we have taken every precaution possible.
The ‘big data’ programme is regularly reviewed with the compliance officer to make sure that we are compliant with POPI and other appropriate legislation in the use of the Group’s data.
Refer to the Group’s material risks on pages 13 and 14 which includes further detail on cybercrime risk and mitigation and disaster recovery and continuity of business.
BLUE LABEL INTEGRATED ANNUAL REPORT 2017
/ 48
Compliance report
The Internal Risk and Compliance Committee function (IRCC) oversees the discharge of legal and regulatory responsibilities. The committee monitors, assesses, researches and reports on the regulatory environment in which the Group operates. The IRCC reports to the Audit, Risk and Compliance Committee.
The process of compliance reporting encompasses:�� identifying and prioritising all acts and regulations at a national level applicable to Blue Label; �� incorporating regulatory requirements into control measures such as standard operating procedures or processes, manuals or policies; �� recommending corrective measures or steps to ensure compliance; and ��monitoring compliance through the adequacy and effectiveness of control measures, which includes the use of best industry practice compliance tools.
There have been no material instances of non-compliance by the Group or its Directors during the past financial year.
Future focus areas include:�� Blue Label is in the process of appointing a dedicated Compliance Officer who will be tasked to oversee the compliance function within the Group; and�� develop compliance risk management plans in respect of priority legislation, including monitoring thereon.
BLUE LABEL INTEGRATED ANNUAL REPORT 2017
49 /
Combined assurance
The objectives of assurance are to assess whether the internal control environment is effective, to assess whether there is sufficient integrity in the information used for internal decision-making and to support the integrity of external reports. The Audit, Risk and Compliance Committee of Blue Label is responsible for overseeing the effectiveness of combined assurance arrangements within the organisation, which is documented within the Blue Label Integrated Risk Assurance Policy and Framework. The Internal Risk and Compliance Committee is responsible for directing and assisting in the co-ordination of the combined assurance arrangements within Blue Label as well as to ensure that a robust integrated risk assurance plan is compiled and executed by the various assurance providers on an annual basis.
Blue Label has adopted a combined assurance model, in line with corporate governance objectives, to optimise assurance obtained from management, corporate functions, and internal and external assurance providers on the risks affecting the
business. The combined assurance model is integrated within the risk management process, including reporting to and oversight from the IRCC and ARCC, from which the annual integrated assurance plan is developed in respect of the priority risks for the Group across the four lines of defence (Management, Corporate Functions, Independent Assurance and Oversight Committees) through defined assurance activities. The assurance plan is a key tool to support the Audit, Risk and Compliance Committee and the Board in making its endorsement on the effectiveness of internal controls in the integrated report and to support the integrity of information that underpins internal decision-making within Blue Label and reporting to its stakeholders.
Embedding combined assurance throughout the Group will be a future area of focus.
BLUE LABEL INTEGRATED ANNUAL REPORT 2017
/ 50

Stakeholder relations
The Board has ultimate accountability for stakeholder strategy and engagement, recognising that developing and nurturing dialogue with key stakeholders is a driver of business sustainability.
The Board acknowledges that Blue Label’s relationship with its stakeholders is a core capital, as defined by the framework for International Integrated Reporting. The responsibility for satisfactory stakeholder relationships vests with every employee in the Group, as we consider a good reputation to be a competitive advantage, which affords the Group the ability to create additional value.
We approach stakeholders with trust and respect and look to them for the same mutual good faith. A broad range of internal and external stakeholders with a material or potential interest in, or who are affected by us, have been identified.
We recognise the importance of identifying issues of a shared interest, but also value the opportunity for engagement, as it provides a unique insight into the expectations of each stakeholder group. We apply a measured approach to interacting with and responding to stakeholders, with a view to establishing enduring relationships. A stakeholder engagement programme has been formalised for key stakeholder groupings. This process takes into account the impact that each stakeholder group may have on our business, ensuring that the frequency and form of engagement is aligned to its estimated impact.
Some of the initiatives and methods used in the process of engaging with stakeholders comprise: face-to-face formal or informal, individual or group meetings (including the AGM), media and securities exchange news announcements, presentations, roadshows, telephone and conference calls, the Blue Label website
(www.bluelabeltelecoms.co.za), investor site and trade visits. We rely on the results of perception studies, independent research, reputation audits, whistleblowing facilities and formal grievance mechanisms as well as financial and sustainability reports. In addition, we initiate newsletters, circulars and e-mail updates, regular customer, business partner and supplier meetings, below and above-the-line advertising and marketing across various channels, formal consultations and audit processes, and host management and sales conferences. Dialogue, review and feedback are encouraged wherever possible, which in turn are presented to Exco for consideration.
We monitor the effectiveness of stakeholder management by taking cognisance of external and internal inputs such as perception studies, independent research, reputation audits, whistleblowing facilities and formal grievance mechanisms.
Blue Label’s stakeholder engagement programme supports its efforts to be a successful, stable and ethical company contributing to the economic growth of the communities in which we operate. The Board’s approach to stakeholder managementIn identifying and prioritising stakeholders, the Board considers the following criteria:��Groupings which interact with the Group, or are directly or indirectly affected by the Group’s activities; and��Groupings which have a positive or negative impact on our ability to operate.
On listing in 2007 we identified our key stakeholder groupings. On an annual basis Exco assesses the completeness thereof, with reference to the ecosystem in which the Group as a whole operates. This approach to stakeholder identification and engagement is cascaded to all
subsidiaries across the regions, although each is responsible for managing its own stakeholder relationships. Any key concerns at subsidiary level are escalated, either to line management or via the Internal Risk and Compliance Committee. Stakeholder identification and prioritisation is an ongoing process and is evolving as the Group expands.
The Board’s approach to stakeholders also embraces:�� appreciating that stakeholder perceptions affect reputation, and therefore managing reputation risk;�� delegating to management the responsibility to deal with stakeholder relationships;�� overseeing the mechanisms and processes for the constructive engagement of stakeholders;�� disclosing stakeholder engagement in the integrated annual report;�� striving to achieve a balance of stakeholders’ legitimate expectations in the best interests of the Group; and�� ensuring equitable treatment of shareholders.
In profiling key stakeholder groupings, the nature of engagement, the method of engagement and the dialogue process and outcomes are reported alongside each grouping. Stakeholder groupEmployees �� investing in the development of our people.
Nature of engagementContinuous communication with employees covers matters of a strategic, financial and operational nature, including new developments, product launches, health and safety initiatives, internal policies and practices such as the ethics hotline, competitions, business initiatives, charitable initiatives, human resource matters, staff wellness, staff-related news and regulatory and compliance matters.
BLUE LABEL INTEGRATED ANNUAL REPORT 2017
51 /
Stakeholder relations continued
Blue Label also holds an annual off-site conference attended by Directors and Senior Management. The purpose of the conference is to obtain input and feedback from attendees on strategic and common operational matters. Subsidiaries host their own management, sales and strategy conferences at least once a year.
Method of engagementStaff meetings, newsletters, posters, e-mails, staff notices posted on notice boards, in the canteen and in elevators, lunch and coffee station discussions, line management engagements on personal performances, top management presentations and briefings of strategy updates, material acquisitions made, interim and year-end financial results.
For those staff based in outside regions, access to relevant information is directed via the MyTrack portal. Other forms of engagement include wellness days, a carnival day, blood donor drives, health campaigns, the year-end awards ceremony, and social events with employees, customers and service providers. More details are provided in the human capital section on page 81.
From time to time, keynote and motivational speakers are invited to address discussion groups, breakaway sessions and team building exercises.Later this calendar year, Blue Label Galaxy will be launched. This internal communication platform will enable comprehensive and targeted communication with staff regarding Company policies and procedures.
Dialogue process and outcomesNewly appointed staff attend an induction programme held at the beginning of each month.
Innovation in our entrepreneurial environment is nurtured and motivation and values are reinforced
in a safe and rewarding environment. Focus is on balancing the organisation’s entrepreneurial spirit with a structured work environment by streamlining processes and procedures in a relatively flat organogram and an open communication system. This year the Group ran the “what’s the big idea” initiative, which encouraged staff to submit innovative and creative ideas to enhance business for a reward.
Staff performance is reviewed bi-annually with the intention of measuring performance and reviewing salaries. There is a forum to which staff may make recommendations and/or requests.
External training, coaching and mentoring programmes are available to staff on the recommendation of their line manager.
See page 80 for more details of the Group’s social practices.
Ongoing focus areas include the identification and selection, as well as the retention, of technically skilled staff.
Stakeholder groupProviders of capital, including shareholders, institutional and retail investors and financial analysts�� delivering value to Blue Label’s shareholders.
Nature of engagementEngagement includes ongoing and/or ad hoc meetings with senior management, involving presentations and discussions covering Group financial performance, overview of strategic direction and the investment proposition.
Visits to head office and the warehouse at No 75 Grayston Drive and to a local shopping centre,
merchant trading grounds and our customers’ sites are arranged on request.
Individuals from this stakeholder group and their contact details are registered on the Blue Label investor database.
Questions received via telephone or e-mail are answered expediently, with a return time of no longer than 48 hours from receipt, with due regard of close periods.
Method of engagementManagement undertakes local and international roadshows to existing and prospective institutional investors and analysts, at which one-on-one and group meetings take place.
Integrated annual report, interim report and AGM.
The highlights of the interim and year-end results are published in the press as a short-form advertisement, with more detailed information posted on the website.
Material announcements are issued through SENS via the JSE.
Ad hoc face-to-face meetings, group meetings, teleconference and videoconference calls with management and/or the Head of Investor Relations.
Speaker and presenter at local and international investor conferences, JSE showcases and other workshops.Investor alerts are e-mailed to those registered on our database.
Other activities as arranged by sell-side analysts, banks and financial communication and media houses.
Future focus areas include enhancing financial disclosure of Cell C’s performance, and that of other acquisitions, to enable stakeholders to fairly value their contributions to the Group.
BLUE LABEL INTEGRATED ANNUAL REPORT 2017
/ 52
Dialogue process and outcomesTo address this stakeholder group’s request to increase its understanding of the business model, the geographies and markets in which we operate, as well as the five categories of products and services distributed, management is available to take meetings and conference calls throughout the year, subject to close period dates. Presentations and webcasts are posted on the website.
A warehouse, situated at No 75 Grayston Drive, can be visited by prior arrangement.
Visits are arranged to local markets, petroleum forecourts, retail outlets, Mom & Pop stores and malls, where our merchants’ activities can be witnessed. By prior arrangement the truck and footsoldier model can be seen in action in nearby local communities. Visits of this nature were held in and around Johannesburg during the year.
Stakeholders showed significant interest in the Group’s acquisition strategy this year, resulting in management hosting a number of individual and group progress meetings and conference calls with investors and analysts.
Stakeholder groupCustomers �� enhancing innovation.
Nature of engagementThe Group’s customer base comprises corporate clients, chain stores, petroleum forecourts, large independent retail clients, wholesale/cash-and-carry stores, and Mom & Pop stores.
Engagement involves servicing customers, through a dedicated call cycle where face-to-face meetings take place at which sharing of information on new products, market research and trends, business queries
and other growth opportunities are discussed. Field technicians are deployed to assist customers with technical support and installation of terminals. Outbound calls to merchants measure customer satisfaction scores regarding touch points, trade marketing and Blu Approved branding.
Senior Management liaises regularly with its customers and supplier counterparts and, in so doing, continues building and strengthening long-term relationships, which in turn, enhances growth opportunities.
Method of engagementA dedicated, national helpdesk operating daily from 07:00 to 21:00, with a team of customer relationship and technical support consultants.Face-to-face formal and informal meetings, as well as formal consultation.
The Group has a CRM system, self-help facilities and dedicated sales and technical consultants to enhance its customer engagement service. Customer satisfaction surveys are carried out across all customer segments on a regular basis.
Future focus areas will be driven by the newly strengthened management team heading up Blue Label Distribution and will include reinforcing a customer-centric approach to the main market.
Dialogue process and outcomesPrice and value for money drive the relationship with this stakeholder group. FAQs by customers usually involve technical matters or account queries. It is essential that queries are expeditiously resolved in order to impart a greater sense of value to the customer. A call-out is logged for technical matters and a technician will visit the site within 24 to 48 hours. Account queries that require escalation are dealt with by a CRC
who will visit the merchant. The contact centre reports regular updates to the merchant base through SMS and e-mail communications.
CRCs and regional managers maintain good relationships through a scheduled call cycle that ensures open communication and updates on new product offerings. Support is also provided for POS material, branding, minor repairs and maintenance. Emphasis is placed on upselling and cross-selling opportunities within the Group’s products and services. Differentiating service levels incentivise merchants to upgrade to a higher level, enhancing their value proposition in selling more of our products and services.
Stakeholder groupBusiness partners and suppliers ��we collaborate to enhance the end customer’s experience.
Nature of engagementThe relationships with business partners such as Vodacom, MTN, Cell C, Telkom, Eskom, municipalities, utilities, parastatals, event, concert and sport organisers, transport providers, entertainment and gaming suppliers, commercial banks and merchant acquirers, as well as service providers are managed in terms of written distributor and/or dealer agreements. The nature of agreements are generally long term.
Relationship managers are appointed to each partner to provide a single and dedicated point of contact.
Suppliers are managed in a formal procurement process, during which issues such as quality of product, creditworthiness and B-BBEE status are confirmed, prior to their appointment. Suppliers of services are, if appropriate, initially engaged through a tender process and, where successful, agreements are concluded. The majority of the Group’s goods and
BLUE LABEL INTEGRATED ANNUAL REPORT 2017
53 /
services are procured from locally based suppliers.
Engaging this group of stakeholders also provides a platform for product innovation, as well as line of sight into indicative market supply and demand trends.
Existing trading relationships with the network operators afford the Group a clear line of sight into cross- and up-selling opportunities.
Method of engagementWritten distributor and/or dealer agreements.
Formal and informal meetings.
Site visits are held on request.
Supplier relationships may transform into customer service arrangements.
A future focus area will be in ensuring that constructive relationships are maintained with the main network operators, following the Group’s acquisition of a 45% stake in Cell C in August 2017.
Dialogue process and outcomesWe recognise the need to work co-operatively in order to ensure quality and value for money in products and services. Adherence to contract terms and conditions and full payment for goods delivered and services rendered, are key to maintaining sound relationships with this stakeholder group. Matters raised pertain mostly to technical and operational issues, which are resolved timeously thereby ensuring a smooth service delivery.
Supplier relationships may transform into customer service arrangements.
During the year a number of meetings were held with network operators in advising each of the rationale for and progress on Blue Label’s acquisition of a 45% stake in Cell C.
Stakeholder groupCommunities, educational institutions and research organisations�� participating with leaders in the communities in which we operate.
Nature of engagementBy deepening our understanding of the interests of the communities in which we operate, we enhance trust and strengthen relationships.
The TPC community channel specialises in the development and empowerment of broad-based communities through the deployment of mobile technology and products. The community channel aims to distribute the Group’s products more widely, to create job opportunities for members of the communities and to share a portion of the revenue with them.
Senior Management, such as the Group Head of Human Resources and the Head of Investor and Media Relations, also engage regularly with the business community, professional associations and research organisations across various levels.
The Joint CEOs and Senior Management are involved in collaborative projects and workshops with local and international business and secondary schools.
Management also takes cognisance of the published works of Financial Technology Partners LP, Frost and Sullivan and the Institute for Futures Research at the University of Stellenbosch. The outputs of relevant print, electronic and social media monitoring services are also noted.
A Group CSI Manager was recently appointed, who actively engages with those in charitable organisations aligned with Group strategy regarding youth development, with a view to improving service delivery and securing a satisfactory return on investment.
The Joint CEOs are regularly recognised for their contributions to entrepreneurialism, business development and the community at large, if not as award recipients, then as judges. Some accolades are listed in each of their biographies on page 16.
Method of engagementFormal and informal meetings and forums.
Training and workshops. Outreach programmes, as requested.
Presentation at conferences, participation in panel and roundtable discussions.
Addressing public conferences, roundtable sessions on best practices, governance and sustainability.
Frequent engagement with lecturers, students and scholars at formal and informal settings. Case studies assist the Group and the community in gaining a better understanding of developments, challenges, achievements and failures.
The Group, represented by Executive Directors or Senior Management, frequently participates in group discussions with the community on business entrepreneurialism and administration.
Future focus areas will be driven by the recently appointed Group CSI Manager. Dialogue process and outcomesThe Group supports making responsible contributions to broader societal issues, be it through its charitable donations, CSI spend or in developing our business model among communities. See page 83 for more detail.
The communities in which the TPC community channel operates mainly focuses on the upliftment of their
Stakeholder relations continued
BLUE LABEL INTEGRATED ANNUAL REPORT 2017
/ 54

communities, the enhancement of skills and the delivery of services in their mostly rural areas. These issues are directly addressed by the community channel, in focusing on providing services, creating job opportunities and stimulating economic upliftment.
These opportunities provide extramural stimulus for senior staff and enable them to extend their knowledge, mentoring reach and networks.This provides the Group access to talented individuals, while gaining direct line of sight into academia, where it may be able to offer and receive learning.
During the period of the Group’s intense acquisition activity, it deferred a number of reach-out opportunities, which will now be re-initiated, over time.
Stakeholder groupMembers of the media, including journalists, reporters and editors �� engaging with outsiders to our business who may have difficulty understanding our activities.
Nature of engagementBriefings to media are held at the interim and full-year results, followed by Q&A. One-on-one interviews are conducted on radio, TV and with print and online journalists and editors.Ad hoc requests for interviews and participation in panel discussions.Daily media monitoring assists the Group in understanding the reach, interpretation and needs of this stakeholder group.
Method of engagementNews releases are distributed to media and news services both locally and overseas, as per a database maintained by the Company.Print, online, broadcast and social media monitoring is outsourced and
reports of coverage are received and distributed daily among business segments, as appropriate.
A media agency is engaged to assist the Group in maximising its news-worthy activities.
Future focus areas include enhancing stakeholders’ understanding of Blue Label’s acquisition strategy, in particular Cell C.
Dialogue process and outcomesMid-cap companies do not readily gain news coverage. To raise this stakeholder group’s interest and awareness of the scope of business, products and services, media briefings and trade visits were held throughout the year.
Numerous interviews with Senior Management resulted in articles being published in the press, clips aired on radio and TV, on subjects such as profiles of the CEOs, Group financial performance, various new products such as ticketing and prepaid water, and the acquisitions of equity in a recapitalised Cell C and in 3G Mobile.Management participates on radio and TV at the release of interim and year-end financial results.
This stakeholder grouping showed significant interest in the Group’s acquisition strategy this year, resulting in management hosting a number of interviews and group meetings with a range of media members.
Stakeholder groupGovernment, regulatory bodies and the public sector ��we believe in partnering.
Nature of engagementThe Group regularly engages national and local government, parastatals and other public organisations through various tender processes.
From a compliance perspective, the completion and rendition of statutory returns are undertaken diligently.Blue Label is not a member of any business or industry association or national/international advocacy organisation in which the Company has positions in governance bodies, participates in projects or committees or provides substantive funding.
The Group occasionally consults the Department of Labour and physically lodges returns at the CIPC to expedite registration.
Method of engagementFormal personal meetings, written communications and tender processes.The Group takes cognisance of the implications of the B-BBEE Codes of Best Practice.
Meetings are held covering matters such as health and safety, employment equity, and the Codes of Best Practice.The Group meets all its statutory filing obligations in respect of the Department of Labour, CIPC, SARS, etc.
Focus areas are determined on an ad hoc basis.
Dialogue process and outcomesOur sound reputation is our licence to operate and we therefore have to uphold our stature with all stakeholders.
During the year under review no prosecutions were brought against the Group for the contravention or non-compliance of any laws or regulations.
BLUE LABEL INTEGRATED ANNUAL REPORT 2017
55 /
Remuneration report
PhilosophyBlue Label’s remuneration philosophy is to reward employees and executives in a fair and equitable way in order to attract the best talent and ensure a culture of high performance in the execution and support of Blue Label’s business strategy and vision. Rewards are set at levels that are competitive and drive performance in the short and long term, ensuring alignment with shareholder interests and simultaneously promoting an ethical culture and responsible corporate citizenship. Incentive-based rewards are earned through the attainment of demanding key performance indices and targets, consistent with shareholder growth expectations. We consult our key shareholders on any proposed changes to our remuneration and reward policy with due cognisance given to the non-binding advisory votes at the AGM.
Incentive packages, both short and long term, are aligned with best practice and benchmarked regularly where we aim to be in the top quartile of the peer review group. This review is performed from time to time, utilising the services of third-party consultants. Our goal is to profile Blue Label as an “employer of choice”, enabling us to attract and retain the best skills required in a constantly evolving technology landscape, enhancing our ethos of entrepreneurship and innovation.
In the previous year we re-aligned the criteria pertaining to the forfeitable share plan as well as introducing an outperformance bonus for senior executives, further enhancing the alignment of executive remuneration with shareholder interests. The RNC strives to meet all requirements of the
JSE and King IV and will take cognisance at the AGM of any vote against the remuneration and reward policy of 25% or more of the votes exercised and will, as a matter of policy, engage where necessary to ascertain the reasons thereof and where legitimate reasonable objections are raised, these will be considered by RNC.
We are pleased to report that at the 2016 AGM, votes in respect of the non-binding advisory vote on endorsement of the Group remuneration policy was 97.73% in favour, 2.24% against and 0.03% abstained.
GovernanceThe Board has delegated to the Remuneration and Nomination Committee (RNC) the responsibility of determining the remuneration of the Executive Directors and Senior Managers, as well as to approve the allocation of shares under the Group’s forfeitable share scheme. The RNC also fulfils the functions of the Nomination Committee.
The RNC consists of three Independent Non-Executive Directors, namely Messrs GD Harlow (Chairman of the RNC), LM Nestadt (Chairman of the Nomination Agenda of the RNC), and JS Mthimunye. The chairpersons respectively report to the Board on deliberations and decisions. The Joint CEOs and the Financial Director may attend meetings of the RNC by invitation, but do not vote on decisions.
With regard to the annual salary review of staff, the Group Head of Human Resources presents recommendations for consideration by
the RNC. The RNC formulates its own proposals regarding the fee structure for Non-Executive Directors and the fees payable to members of Board Committees for consideration by the Board and ultimately, for approval by shareholders.
Key duties of the RNC include:�� ensuring that the Group upholds its entrenched remuneration philosophy;�� ensuring that the combination of fixed and variable pay is appropriate when benchmarking remuneration levels;�� reviewing incentive schemes aligned to growth in shareholder value;�� reviewing incentive schemes to ensure that they are administered and implemented in terms of their rules and performance targets;�� reviewing remuneration of Executive Directors and Senior Management; �� submitting recommendations to the Board with regard to non-executive remuneration for ultimate approval by shareholders; ��managing stakeholder relations and expectations, as deemed appropriate on remuneration matters;�� ensuring that the Group continues to progress with race and gender diversity on the Board and committees; and�� ensuring that the Group has implemented succession planning at both top level management and subsidiary management level.
In the course of deliberations, the RNC considers the views of the Joint CEOs on the remuneration and performance of other Executive Directors and Senior Management.
BLUE LABEL INTEGRATED ANNUAL REPORT 2017
/ 56
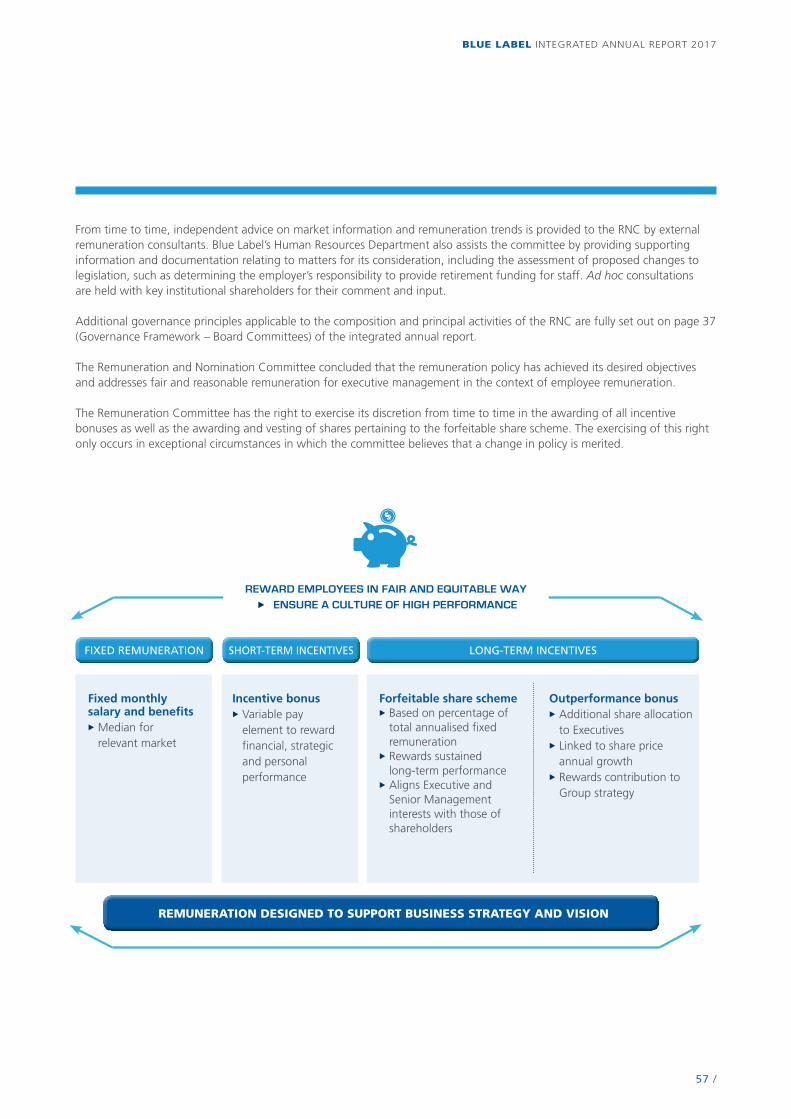
From time to time, independent advice on market information and remuneration trends is provided to the RNC by external remuneration consultants. Blue Label’s Human Resources Department also assists the committee by providing supporting information and documentation relating to matters for its consideration, including the assessment of proposed changes to legislation, such as determining the employer’s responsibility to provide retirement funding for staff. Ad hoc consultations are held with key institutional shareholders for their comment and input.
Additional governance principles applicable to the composition and principal activities of the RNC are fully set out on page 37 (Governance Framework – Board Committees) of the integrated annual report.
The Remuneration and Nomination Committee concluded that the remuneration policy has achieved its desired objectives and addresses fair and reasonable remuneration for executive management in the context of employee remuneration.
The Remuneration Committee has the right to exercise its discretion from time to time in the awarding of all incentive bonuses as well as the awarding and vesting of shares pertaining to the forfeitable share scheme. The exercising of this right only occurs in exceptional circumstances in which the committee believes that a change in policy is merited.
REWARD EMPLOYEES IN FAIR AND EQUITABLE WAY u�ENSURE A CULTURE OF HIGH PERFORMANCE
Fixed monthly salary and benefitsu Median for
relevant market
Incentive bonusu Variable pay
element to reward financial, strategic and personal performance
Forfeitable share schemeu Based on percentage of
total annualised fixed remuneration
u Rewards sustained long-term performance
u Aligns Executive and Senior Management interests with those of shareholders
Outperformance bonusu Additional share allocation
to Executivesu Linked to share price
annual growthu Rewards contribution to
Group strategy
FIXED REMUNERATION SHORT-TERM INCENTIVES LONG-TERM INCENTIVES
REMUNERATION DESIGNED TO SUPPORT BUSINESS STRATEGY AND VISION
BLUE LABEL INTEGRATED ANNUAL REPORT 2017
57 /
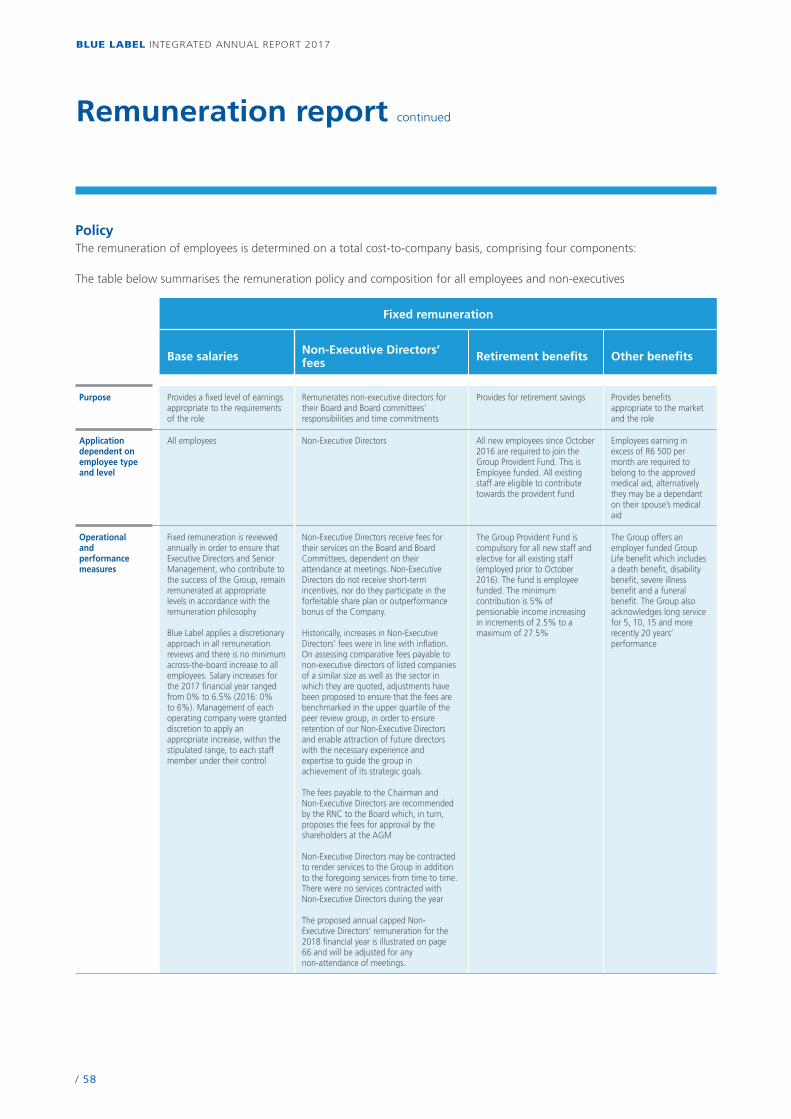
Remuneration report continued
PolicyThe remuneration of employees is determined on a total cost-to-company basis, comprising four components:
The table below summarises the remuneration policy and composition for all employees and non-executives
Fixed remuneration
Base salaries Non-Executive Directors’ fees Retirement benefits Other benefits
Purpose Provides a fixed level of earnings appropriate to the requirements of the role
Remunerates non-executive directors for their Board and Board committees‘ responsibilities and time commitments
Provides for retirement savings Provides benefits appropriate to the market and the role
Application dependent on employee type and level
All employees Non-Executive Directors All new employees since October 2016 are required to join the Group Provident Fund. This is Employee funded. All existing staff are eligible to contribute towards the provident fund
Employees earning in excess of R6 500 per month are required to belong to the approved medical aid, alternatively they may be a dependant on their spouse’s medical aid
Operational and performance measures
Fixed remuneration is reviewed annually in order to ensure that Executive Directors and Senior Management, who contribute to the success of the Group, remain remunerated at appropriate levels in accordance with the remuneration philosophy
Blue Label applies a discretionary approach in all remuneration reviews and there is no minimum across-the-board increase to all employees. Salary increases for the 2017 financial year ranged from 0% to 6.5% (2016: 0% to 6%). Management of each operating company were granted discretion to apply an appropriate increase, within the stipulated range, to each staff member under their control
Non-Executive Directors receive fees for their services on the Board and Board Committees, dependent on their attendance at meetings. Non-Executive Directors do not receive short-term incentives, nor do they participate in the forfeitable share plan or outperformance bonus of the Company.
Historically, increases in Non-Executive Directors’ fees were in line with inflation. On assessing comparative fees payable to non-executive directors of listed companies of a similar size as well as the sector in which they are quoted, adjustments have been proposed to ensure that the fees are benchmarked in the upper quartile of the peer review group, in order to ensure retention of our Non-Executive Directors and enable attraction of future directors with the necessary experience and expertise to guide the group in achievement of its strategic goals.
The fees payable to the Chairman and Non-Executive Directors are recommended by the RNC to the Board which, in turn, proposes the fees for approval by the shareholders at the AGM
Non-Executive Directors may be contracted to render services to the Group in addition to the foregoing services from time to time. There were no services contracted with Non-Executive Directors during the year
The proposed annual capped Non-Executive Directors’ remuneration for the 2018 financial year is illustrated on page 66 and will be adjusted for any non-attendance of meetings.
The Group Provident Fund is compulsory for all new staff and elective for all existing staff (employed prior to October 2016). The fund is employee funded. The minimum contribution is 5% of pensionable income increasing in increments of 2.5% to a maximum of 27.5%
The Group offers an employer funded Group Life benefit which includes a death benefit, disability benefit, severe illness benefit and a funeral benefit. The Group also acknowledges long service for 5, 10, 15 and more recently 20 years’ performance
BLUE LABEL INTEGRATED ANNUAL REPORT 2017
/ 58
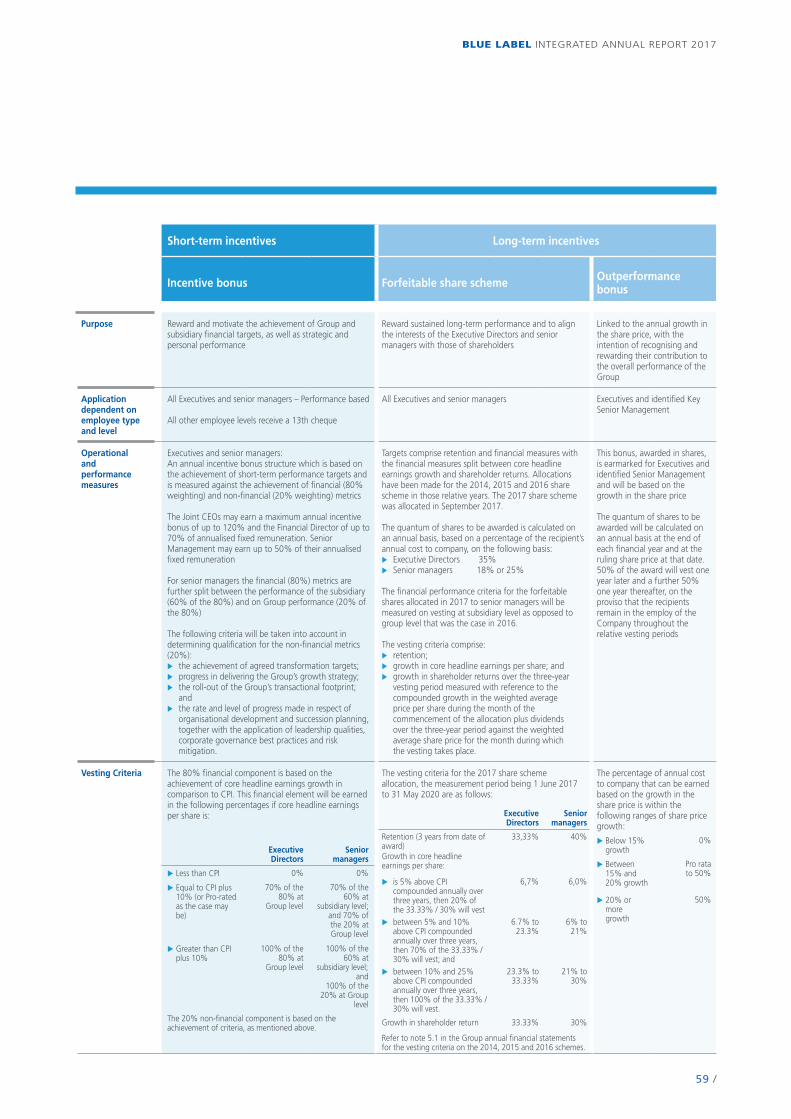
Short-term incentives Long-term incentives
Incentive bonus Forfeitable share scheme Outperformance bonus
Purpose Reward and motivate the achievement of Group and subsidiary financial targets, as well as strategic and personal performance
Reward sustained long-term performance and to align the interests of the Executive Directors and senior managers with those of shareholders
Linked to the annual growth in the share price, with the intention of recognising and rewarding their contribution to the overall performance of the Group
Application dependent on employee type and level
All Executives and senior managers – Performance based
All other employee levels receive a 13th cheque
All Executives and senior managers Executives and identified Key Senior Management
Operational and performance measures
Executives and senior managers:An annual incentive bonus structure which is based on the achievement of short-term performance targets and is measured against the achievement of financial (80% weighting) and non-financial (20% weighting) metrics
The Joint CEOs may earn a maximum annual incentive bonus of up to 120% and the Financial Director of up to 70% of annualised fixed remuneration. Senior Management may earn up to 50% of their annualised fixed remuneration
For senior managers the financial (80%) metrics are further split between the performance of the subsidiary (60% of the 80%) and on Group performance (20% of the 80%)
The following criteria will be taken into account in determining qualification for the non-financial metrics (20%): u��the achievement of agreed transformation targets; u��progress in delivering the Group’s growth strategy; u��the roll-out of the Group’s transactional footprint;
and u��the rate and level of progress made in respect of
organisational development and succession planning, together with the application of leadership qualities, corporate governance best practices and risk mitigation.
Targets comprise retention and financial measures with the financial measures split between core headline earnings growth and shareholder returns. Allocations have been made for the 2014, 2015 and 2016 share scheme in those relative years. The 2017 share scheme was allocated in September 2017.
The quantum of shares to be awarded is calculated on an annual basis, based on a percentage of the recipient’s annual cost to company, on the following basis:u�Executive Directors 35%u�Senior managers 18% or 25%
The financial performance criteria for the forfeitable shares allocated in 2017 to senior managers will be measured on vesting at subsidiary level as opposed to group level that was the case in 2016.
The vesting criteria comprise:u�retention; u�growth in core headline earnings per share; and u�growth in shareholder returns over the three-year
vesting period measured with reference to the compounded growth in the weighted average price per share during the month of the commencement of the allocation plus dividends over the three-year period against the weighted average share price for the month during which the vesting takes place.
This bonus, awarded in shares, is earmarked for Executives and identified Senior Management and will be based on the growth in the share price
The quantum of shares to be awarded will be calculated on an annual basis at the end of each financial year and at the ruling share price at that date. 50% of the award will vest one year later and a further 50% one year thereafter, on the proviso that the recipients remain in the employ of the Company throughout the relative vesting periods
Vesting Criteria The 80% financial component is based on the achievement of core headline earnings growth in comparison to CPI. This financial element will be earned in the following percentages if core headline earnings per share is:
The vesting criteria for the 2017 share scheme allocation, the measurement period being 1 June 2017 to 31 May 2020 are as follows:
The percentage of annual cost to company that can be earned based on the growth in the share price is within the following ranges of share price growth:
Executive Directors
Senior managers
u��Below 15% growth
0%Retention (3 years from date of award)
33,33% 40%
Executive Directors
Senior managers Growth in core headline
earnings per share: u��Between 15% and 20% growth
Pro rata to 50%u�Less than CPI 0% 0%
u�is 5% above CPI compounded annually over three years, then 20% of the 33.33% / 30% will vest
6,7% 6,0%u��Equal to CPI plus
10% (or Pro-rated as the case may be)
70% of the 80% at
Group level
70% of the 60% at
subsidiary level; and 70% of the 20% at Group level
u��20% or more growth
50%
u�between 5% and 10% above CPI compounded annually over three years, then 70% of the 33.33% / 30% will vest; and
6.7% to 23.3%
6% to 21%
u��Greater than CPI plus 10%
100% of the 80% at
Group level
100% of the 60% at
subsidiary level; and
100% of the 20% at Group
level
u�between 10% and 25% above CPI compounded annually over three years, then 100% of the 33.33% / 30% will vest.
23.3% to 33.33%
21% to 30%
The 20% non-financial component is based on the achievement of criteria, as mentioned above.
Growth in shareholder return 33.33% 30%
Refer to note 5.1 in the Group annual financial statements for the vesting criteria on the 2014, 2015 and 2016 schemes.
BLUE LABEL INTEGRATED ANNUAL REPORT 2017
59 /
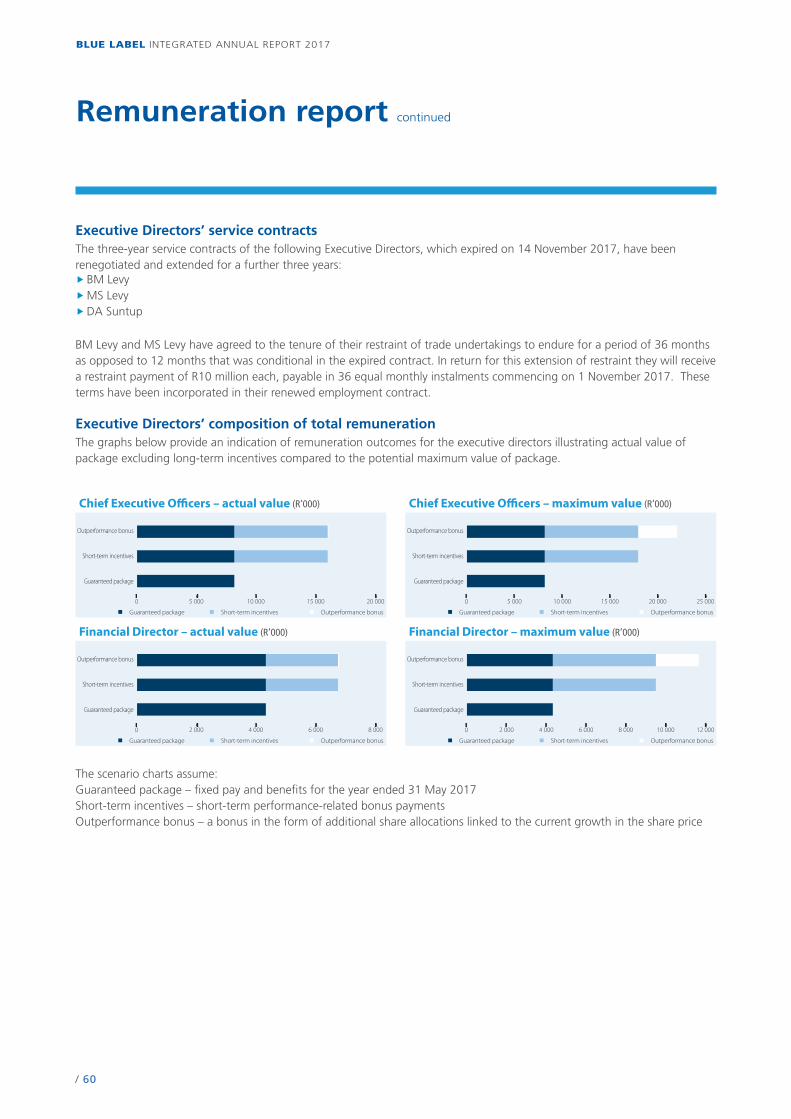
Remuneration report continued
Executive Directors’ service contractsThe three-year service contracts of the following Executive Directors, which expired on 14 November 2017, have been renegotiated and extended for a further three years:�� BM Levy ��MS Levy��DA Suntup
BM Levy and MS Levy have agreed to the tenure of their restraint of trade undertakings to endure for a period of 36 months as opposed to 12 months that was conditional in the expired contract. In return for this extension of restraint they will receive a restraint payment of R10 million each, payable in 36 equal monthly instalments commencing on 1 November 2017. These terms have been incorporated in their renewed employment contract.
Executive Directors’ composition of total remunerationThe graphs below provide an indication of remuneration outcomes for the executive directors illustrating actual value of package excluding long-term incentives compared to the potential maximum value of package.
Guaranteed package Short-term incentives Outperformance bonus
0 20 00015 00010 0005 000
Chief Executive O�cers – actual value (R’000)
Outperformance bonus
Short-term incentives
Guaranteed package
Guaranteed package Short-term incentives Outperformance bonus
Outperformance bonus
Short-term incentives
Guaranteed package
0 25 00020 00015 00010 0005 000
Chief Executive O�cers – maximum value (R’000)
Guaranteed package Short-term incentives Outperformance bonus
0 8 0006 0004 0002 000
Financial Director – actual value (R’000)
Outperformance bonus
Short-term incentives
Guaranteed package
Guaranteed package Short-term incentives Outperformance bonus
0 12 0008 000 10 0006 0004 0002 000
Financial Director – maximum value (R’000)
Outperformance bonus
Short-term incentives
Guaranteed package
The scenario charts assume: Guaranteed package – fixed pay and benefits for the year ended 31 May 2017Short-term incentives – short-term performance-related bonus paymentsOutperformance bonus – a bonus in the form of additional share allocations linked to the current growth in the share price
BLUE LABEL INTEGRATED ANNUAL REPORT 2017
/ 60
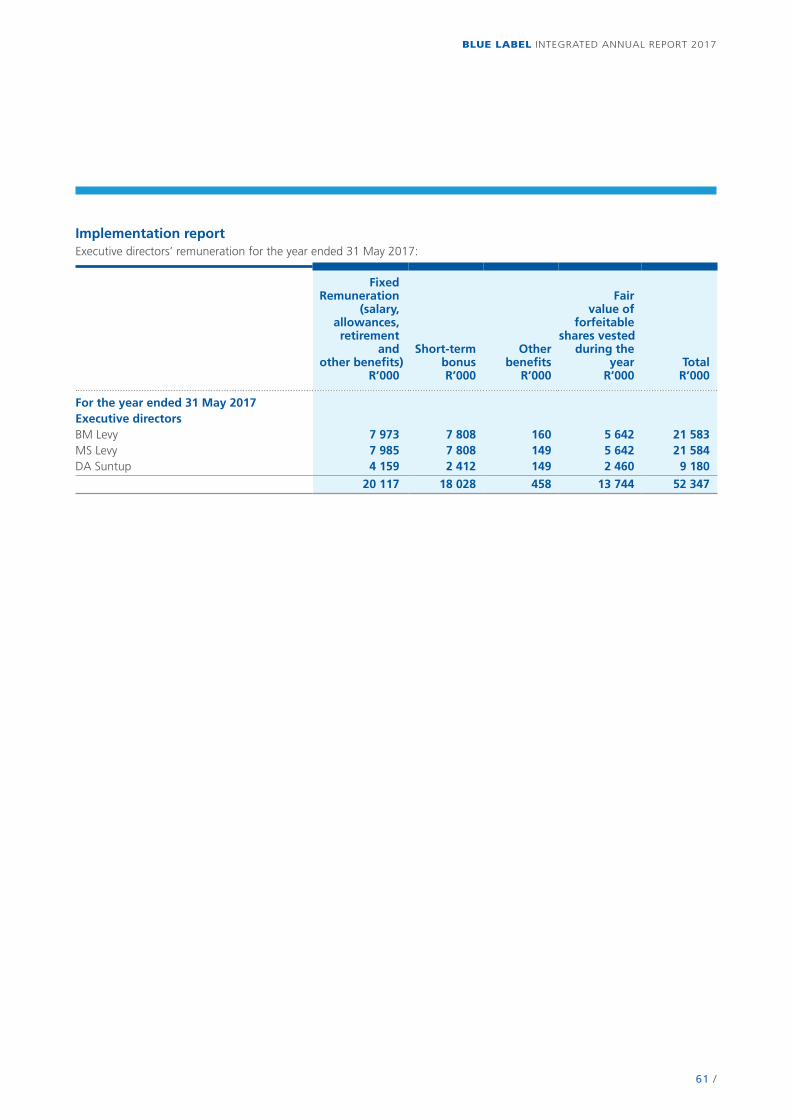
Implementation reportExecutive directors’ remuneration for the year ended 31 May 2017:
Fixed Remuneration
(salary, allowances,retirement
and other benefits)
R’000
Short-term bonusR’000
Otherbenefits
R’000
Fair value of
forfeitable shares vested
during the year
R’000Total
R’000
For the year ended 31 May 2017Executive directorsBM Levy 7 973 7 808 160 5 642 21 583MS Levy 7 985 7 808 149 5 642 21 584DA Suntup 4 159 2 412 149 2 460 9 180
20 117 18 028 458 13 744 52 347
BLUE LABEL INTEGRATED ANNUAL REPORT 2017
61 /
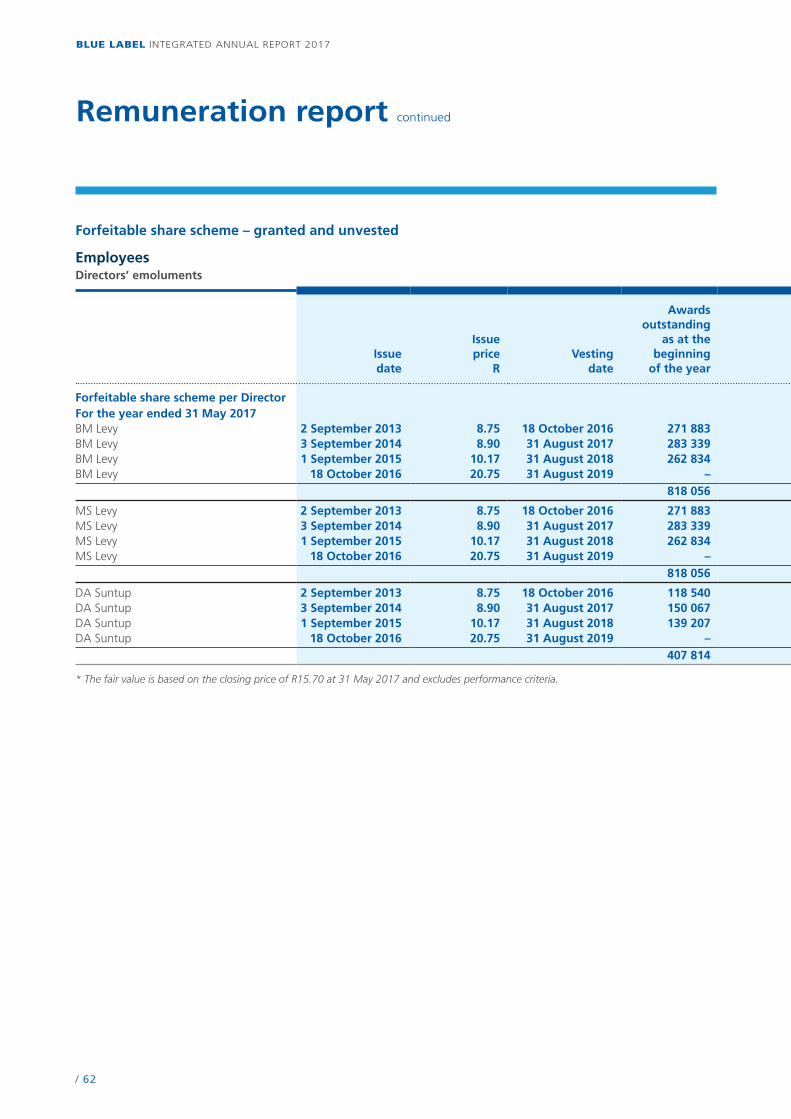
Remuneration report continued
Forfeitable share scheme – granted and unvested
EmployeesDirectors’ emoluments
Issue date
Issue price
RVesting
date
Awards outstanding
as at the beginning
of the year
Number of shares awarded
Awards forfeited
during the year
Awards vested during
the year
Balanceas at the end
of the year
Fair value at grant date
R’000
Fair value at 31 May 2017*
R’000
Forfeitable share scheme per DirectorFor the year ended 31 May 2017BM Levy 2 September 2013 8.75 18 October 2016 271 883 – – -271 883 – – –BM Levy 3 September 2014 8.90 31 August 2017 283 339 – – – 283 339 2 522 4 448 BM Levy 1 September 2015 10.17 31 August 2018 262 834 – – 262 834 2 673 4 126 BM Levy 18 October 2016 20.75 31 August 2019 – 137 194 – – 137 194 2 847 2 154
818 056 137 194 – -271 883 683 367 8 042 10 728
MS Levy 2 September 2013 8.75 18 October 2016 271 883 – – -271 883 – – –MS Levy 3 September 2014 8.90 31 August 2017 283 339 – – – 283 339 2 522 4 448 MS Levy 1 September 2015 10.17 31 August 2018 262 834 – – 262 834 2 673 4 126 MS Levy 18 October 2016 20.75 31 August 2019 – 137 194 137 194 2 847 2 154
818 056 137 194 – -271 883 683 367 8 042 10 728
DA Suntup 2 September 2013 8.75 18 October 2016 118 540 – – -118 540 – – –DA Suntup 3 September 2014 8.90 31 August 2017 150 067 – – – 150 067 1 336 2 356 DA Suntup 1 September 2015 10.17 31 August 2018 139 207 – – 139 207 1 416 2 186 DA Suntup 18 October 2016 20.75 31 August 2019 – 72 663 – – 72 663 1 508 1 141
407 814 72 663 – -118 540 361 937 4 260 5 683
* The fair value is based on the closing price of R15.70 at 31 May 2017 and excludes performance criteria.
BLUE LABEL INTEGRATED ANNUAL REPORT 2017
/ 62
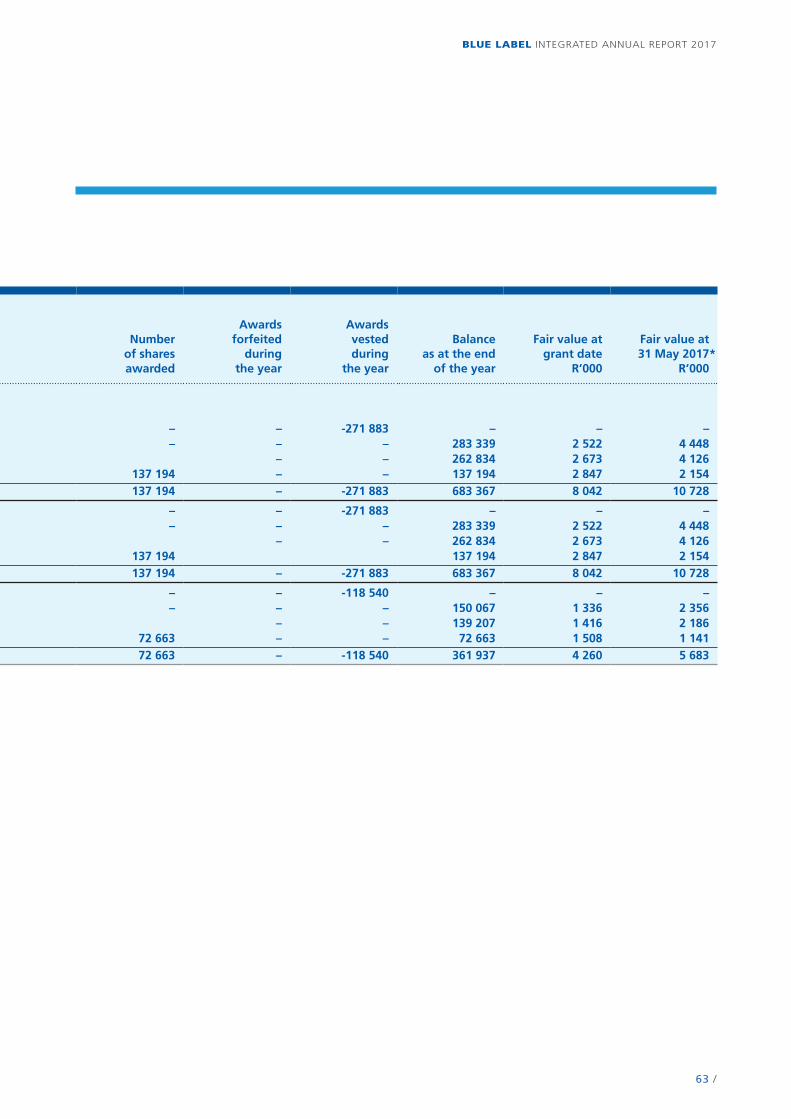
Forfeitable share scheme – granted and unvested
EmployeesDirectors’ emoluments
Issue date
Issue price
RVesting
date
Awards outstanding
as at the beginning
of the year
Number of shares awarded
Awards forfeited
during the year
Awards vested during
the year
Balanceas at the end
of the year
Fair value at grant date
R’000
Fair value at 31 May 2017*
R’000
Forfeitable share scheme per DirectorFor the year ended 31 May 2017BM Levy 2 September 2013 8.75 18 October 2016 271 883 – – -271 883 – – –BM Levy 3 September 2014 8.90 31 August 2017 283 339 – – – 283 339 2 522 4 448 BM Levy 1 September 2015 10.17 31 August 2018 262 834 – – 262 834 2 673 4 126 BM Levy 18 October 2016 20.75 31 August 2019 – 137 194 – – 137 194 2 847 2 154
818 056 137 194 – -271 883 683 367 8 042 10 728
MS Levy 2 September 2013 8.75 18 October 2016 271 883 – – -271 883 – – –MS Levy 3 September 2014 8.90 31 August 2017 283 339 – – – 283 339 2 522 4 448 MS Levy 1 September 2015 10.17 31 August 2018 262 834 – – 262 834 2 673 4 126 MS Levy 18 October 2016 20.75 31 August 2019 – 137 194 137 194 2 847 2 154
818 056 137 194 – -271 883 683 367 8 042 10 728
DA Suntup 2 September 2013 8.75 18 October 2016 118 540 – – -118 540 – – –DA Suntup 3 September 2014 8.90 31 August 2017 150 067 – – – 150 067 1 336 2 356 DA Suntup 1 September 2015 10.17 31 August 2018 139 207 – – 139 207 1 416 2 186 DA Suntup 18 October 2016 20.75 31 August 2019 – 72 663 – – 72 663 1 508 1 141
407 814 72 663 – -118 540 361 937 4 260 5 683
* The fair value is based on the closing price of R15.70 at 31 May 2017 and excludes performance criteria.
BLUE LABEL INTEGRATED ANNUAL REPORT 2017
63 /
Remuneration report continued
Short term incentive bonusFor the 2017 financial year, the Group achieved the levels required in terms of its predetermined targets for growth in core headline earnings per share. In addition, the non-financial targets set for the Executive Directors were also achieved. As a result, the Joint CEOs and Financial Director qualified to be paid their short term incentive bonuses. This equated to 120% of the annual salaries for the CEOs and 70% of the annual salary for the Financial Director. In spite of qualifying for these bonuses, as demonstrated in the table below, the remuneration committee, at their mandated discretion, determined that the above bonuses should be limited to 96% of the annual salary in the case of the joint CEOs and 56% of the annual salary in the case of the Financial Director.
Long term incentive planThe long term incentive plan related to the allocation of shares in 2013, which vested on 18 October 2016. The financial measurement was for the period 1 June 2013 to 31 May 2016.
The retention criteria of 40% was met.
Growth in core headline earnings per share over the three year period equated to 48.46%. Growth in CPI over the three year period accumulated to 17.15%, which after inclusion of the maximum growth target of 25%, equated to 42.15%. As the actual growth amounted to 48.46%, the resultant allocation of 50% was met.
In respect of growth in shareholder returns, the weighted average price per share at commencement of the allocation in September 2013 was
R8.75. The required compounded growth of 10% per annum over the vesting period as at 18 October 2016 equated to a targeted share price of R11.65 inclusive of dividends paid totalling R0.83. The qualifying target equated to R10.82 net of dividends. The market price at vesting date was R20.75, thereby exceeding the minimum target requirement.
In line with the criteria being met in all respects, vesting of the 2013 share scheme allocations fell due on 18 October 2016.
Outperformance bonusFor the year ended 31 May 2017, the members of the executive committee did not qualify for an outperformance bonus due to static movement in the share price. The share price as at 31 May 2016 was R15.70 and at 31 May 2017 R15.70.
BLUE LABEL INTEGRATED ANNUAL REPORT 2017
/ 64

Performance metric TargetActual
performance WeightingExecutive Directors
Short term incentive bonusFinancial targetGroup core headline earnings per share growth
greater/equal to CPI + 10%
17% 80% 14 422 000
Non-financial targets Varies acrossthe Group
Varies acrossthe Group
20% 3 606 000
Total 18 028 000
Long term incentive plan (2013 Forfeitable share scheme vested in 2016)Retention 3 years 40% 5 497 200Growth in core HEPS 25% +
(cumulative CPI over 3 years)
= 42.15%
48.46% 50% 6 871 500
Shareholder returns R10.82 market price per share
R20.75 market price per share
10% 1 375 300
Total 13 744 000
Outperformance bonus
Annual growth in the share price R18.84 market price per share
R15.70 market price per share
0%
BLUE LABEL INTEGRATED ANNUAL REPORT 2017
65 /
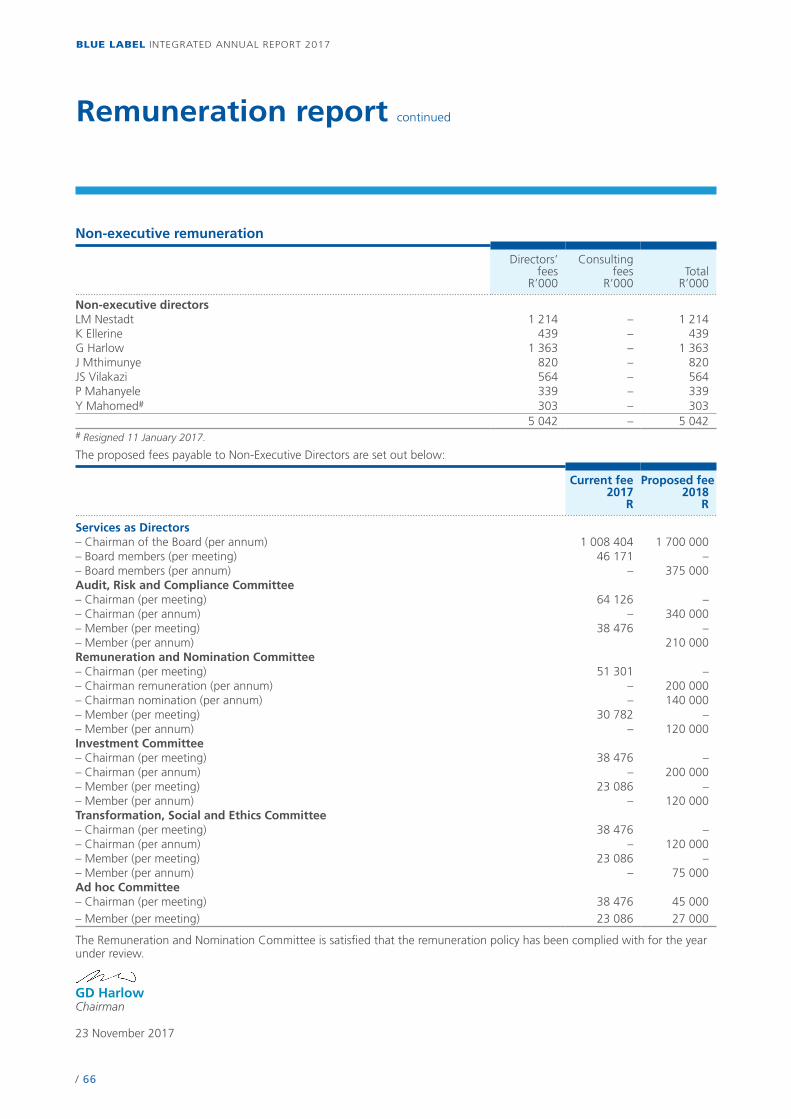
Non-executive remuneration
Directors’ fees
R’000
Consulting fees
R’000Total
R’000
Non-executive directorsLM Nestadt 1 214 – 1 214K Ellerine 439 – 439G Harlow 1 363 – 1 363J Mthimunye 820 – 820JS Vilakazi 564 – 564P Mahanyele 339 – 339Y Mahomed# 303 – 303
5 042 – 5 042# Resigned 11 January 2017.
The proposed fees payable to Non-Executive Directors are set out below:
Current fee2017
R
Proposed fee2018
R
Services as Directors– Chairman of the Board (per annum) 1 008 404 1 700 000– Board members (per meeting) 46 171 –– Board members (per annum) – 375 000Audit, Risk and Compliance Committee– Chairman (per meeting) 64 126 –– Chairman (per annum) – 340 000– Member (per meeting) 38 476 –– Member (per annum) 210 000Remuneration and Nomination Committee– Chairman (per meeting) 51 301 –– Chairman remuneration (per annum) – 200 000– Chairman nomination (per annum) – 140 000– Member (per meeting) 30 782 –– Member (per annum) – 120 000Investment Committee– Chairman (per meeting) 38 476 –– Chairman (per annum) – 200 000– Member (per meeting) 23 086 –– Member (per annum) – 120 000Transformation, Social and Ethics Committee – Chairman (per meeting) 38 476 –– Chairman (per annum) – 120 000– Member (per meeting) 23 086 –– Member (per annum) – 75 000Ad hoc Committee– Chairman (per meeting) 38 476 45 000– Member (per meeting) 23 086 27 000
The Remuneration and Nomination Committee is satisfied that the remuneration policy has been complied with for the year under review.
GD HarlowChairman
23 November 2017
Remuneration report continued
BLUE LABEL INTEGRATED ANNUAL REPORT 2017
/ 66
Audit, Risk and Compliance Committee’s report
The Audit, Risk and Compliance Committee (ARCC) is pleased to present its report for the financial year ended 31 May 2017.
The Committee is an independent statutory committee appointed by the shareholders of the Company. In addition to its statutory duties, the Board has delegated further duties to the Committee. This report covers both these sets of duties and responsibilities.
Mandate and terms of referenceThe Committee has adopted comprehensive and formal terms of reference which have been approved by the Board and which are reviewed on an annual basis. The responsibilities of the ARCC include:�� examining and reviewing the Group’s financial statements and reporting of interim and final results;�� reviewing and considering, for recommendation to the Board, the consolidated budget for the ensuing financial year;�� overseeing integrated reporting;�� overseeing the Internal Risk and Compliance Committee function;��monitoring the risk management framework and assessing the risks that impact on the Group’s ability to achieve its strategic objectives;�� reviewing and satisfying itself of the expertise, resources and experience of the Blue Label finance function;�� overseeing the internal audit function and internal financial control process;
�� recommending the appointment of the external auditor and overseeing the external audit process, including their audit fee, independence and nature and extent of any non-audit services; and��monitoring compliance activities.
Membership and meetings heldIn accordance with the requirements of the Companies Act, No 71 of 2008 (the Act) JS Mthimunye, GD Harlow, P Mahanyele and SJ Vilakazi were appointed to the Committee by shareholders at the Annual General Meeting held on 8 December 2016.
Membership of the Committee for the year under review:�� JS Mthimunye (Independent Non-Executive Chairman)��GD Harlow (Independent Non-Executive Director)�� SJ Vilakazi (Independent Non-Executive Director)�� P Mahanyele (Independent Non-Executive Director)
The members of the Committee collectively have experience in audit, accounting, commerce, economics, law, corporate governance and general industry. All of the members of the ARCC are Independent Non-Executive Directors.
The Committee meets quarterly and the quorum for each meeting is three members present throughout the meeting. Mandatory attendees at the meetings are the Joint Chief Executive
Officers and the Financial Director of Blue Label. The external audit partner from PricewaterhouseCoopers Inc. (PwC) and a director from KPMG Services Proprietary Limited (KPMG), to whom Blue Label outsources its internal audit function, are also attendees. Both internal and external auditors are afforded the opportunity to address the meeting and have unlimited access to the Committee. During the year, the Committee met with the external and internal auditors respectively without the presence of management. The internal audit function reports directly to the ARCC and is also responsible to the Financial Director on day-to-day administrative matters.
Statutory duties dischargedIn execution of its statutory duties during the year under review, the Committee:�� nominated and recommended to shareholders the reappointment of PwC as independent external auditors, with Deon Storm the audit partner, as the registered independent auditor;�� approved the fees to be paid to PwC and other external auditors, where applicable, and approved the terms of engagement;��maintained a non-audit services policy which determines the nature and extent of any non-audit services that PwC may provide to the Group;�� discharged those statutory duties as prescribed by section 94 of the Act, acting in its capacity as the appointed audit committee of the subsidiary companies of Blue Label;
BLUE LABEL INTEGRATED ANNUAL REPORT 2017
67 /
�� considered the Committee’s report describing how duties have been discharged; and�� submitted matters to the Board concerning the Company’s accounting policies, financial controls, records and reporting, as appropriate.
Other duties discharged Financial statements and reporting The Committee:�� ensured that the Group has established appropriate financial reporting procedures and that those procedures are operating (per JSE mandatory King IV practices);��monitored compliance with accounting standards and legal requirements and ensured that all regulatory compliance matters had been considered in the preparation of the financial statements;�� reviewed the external auditor’s report to the Committee and management’s responses thereto and made appropriate recommendations to the Board of Directors regarding actions to be taken;�� reviewed and commented on the annual financial statements, interim reports, paid advertisements, announcements and the accounting policies and recommended these to the Board for approval;�� reviewed and recommended to the Board for adoption the consolidated budget for the ensuing financial year; and�� considered the going concern status of the Company and Group on the basis of review of the annual financial statements and the information available to the Committee and recommended such going concern status for adoption by the Board. The Board statement on the going concern status of the Group and Company is contained on page 87 of the Directors’ report.
External audit plan, audit fees and non-audit servicesThe ARCC has satisfied itself as to the independence of the external auditor, PwC, as set out in section 94(7) of the Act, which includes consideration of compliance with criteria relating to independence or conflicts of interest as prescribed by the Independent Regulatory Board for Auditors. Requisite assurance was sought from and provided by PwC that internal governance processes within the firm support and demonstrate its claim to independence. D Storm is the individual registered auditor and member of the aforegoing firm who undertakes the audit with the rotation of the designated audit partner during 2019 for the 2020 financial year-end. PwC has been the auditor of the Group for 13 years. The Audit Committee confirms that it has executed its responsibilities in terms of paragraph 3.84(g)(iii) of the Listings Requirements in its assessment of the sustainability of the auditor. To assess the effectiveness of the external auditors, the Committee considered PwC’s fulfilment of the agreed audit plan and variations from the plan, and the robustness and perceptiveness of PwC in its handling of key accounting treatments and disclosures.
The Committee, in consultation with Executive Management, agreed to the engagement letter, terms, audit plan and budgeted audit fees for the 2017 financial year.
Any non-audit services to be provided by the external auditors are governed by a formal written policy which incorporates a monetary delegation of authority in terms of non-audit services to be provided. The non-audit services rendered by the external auditors during the year ended 31 May 2017 comprised tax advisory
services, tax compliance services and general advisory services. The fees applicable to the aforementioned services totalled R8.4 million (2016: R11.7 million), of which R6.0 million (2016: R9.3 million) relate to acquisition-related costs.
Appointment of PwCThe ARCC has nominated, for approval at the Annual General Meeting, the reappointment of PwC as registered auditors for the 2018 financial year. The Committee also satisfied itself that PwC is accredited and appears on the JSE List of Accredited Auditors as contemplated in paragraph 3.86 of the JSE Listings Requirements.
Internal audit and internal controlsBlue Label’s internal audit function is outsourced to KPMG Services Proprietary Limited and the role of the Chief Audit Executive is fulfilled by the Engagement Director. The ARCC concludes that the Chief Audit Executive and internal audit arrangements are effective.
The Committee:�� reviewed the co-operation and co-ordination between the internal and external audit functions in order to avoid duplication of work;�� have requested the continued support from the internal and external audit teams to work towards an effective and efficient combined assurance approach;�� examined and reviewed the progress made by internal audit against the approved 2016/17 audit plan;�� approved the internal audit plan for the 2017/18 financial year;�� considered the effectiveness of internal audit;�� considered internal audit findings and corrective actions taken in response to such findings; and
Audit, Risk and Compliance Committee’s report continued
BLUE LABEL INTEGRATED ANNUAL REPORT 2017
/ 68
�� reviewed the effectiveness of the systems of internal control, including internal financial control and risk management.
The ARCC has evaluated the internal audit function and satisfied itself to place reliance thereon.
The ARCC concludes that the design and implementation of internal controls, including financial controls and risk management, are effective.
Refer to page 50 for the arrangements in place for combined assurance. The ARCC concludes that the combined assurance arrangement is effective and will continue to evolve as the Group grows.
Risk management and complianceThe Committee:�� reviewed the integrity of the risk control systems and ensured that the risk policies and strategies of the Company are effectively managed;��made recommendations to the Board concerning the levels of tolerance and risk appetite;��monitored bi-annual risk assessments;�� ensured that management considered and implemented appropriate risk responses;�� reviewed legal matters that could have a material impact on the Group; and�� reviewed developments in corporate governance and best practice and considered their impact and implications across the Group with particular reference to the principles of King IV.
Expertise and effectiveness of the Financial Director and finance functionThe Committee considered the appropriateness of the expertise and effectiveness of the Financial Director and finance function in accordance with the JSE Listings Requirements and governance best practice.
The Committee confirms that it is satisfied that Dean Suntup possesses the appropriate expertise and experience to effectively discharge his responsibilities as Financial Director, and confirms the effectiveness of the finance function.
Annual financial statementsThe Committee has reviewed the accounting policies and financial statements of the Company and the Group and is satisfied that they are appropriate and comply with International Financial Reporting Standards, the JSE Listings Requirements and the requirements of the Act.
The Committee has evaluated the Group and Company financial statements of Blue Label Telecoms Limited for the year ended 31 May 2017 and based on the information provided to the Committee, the Committee recommends the adoption of the annual financial statements by the Board.
The significant audit matters considered by the Committee were:1. the impairment assessment of
goodwill arising from business combinations;
2. the impairment assessment of the investment in BLM; and
3. the fair value assessment of the investment in Oxigen, Oxigen Online and 2DFine.
These matters were addressed as follows:The impairment assessment of goodwill arising from business combinationsFor the year ended 31 May 2017, management performed an impairment assessment over the goodwill balance as follows:�� assessing the recoverable amount as being value-in-use, as entities are held for trading and not for sale;�� calculating the value-in-use for each cash-generating unit (CGU) using a discounted cash flow model; and�� performing a sensitivity analysis over the value-in-use calculations, by varying the assumptions used (growth rates, terminal growth rate and WACC, i.e. discount rate) to assess the impact on the valuations.
Management concluded there was no need for any impairment.
The impairment assessment of the investment in BLMFor the year ended 31 May 2017, management performed an impairment assessment over the investment in BLM as follows:�� assessing the recoverable amount as being value-in-use, as BLM is held for trading and not for sale;�� calculating the value-in-use for BLM using a discounted cash flow model;�� performing a sensitivity analysis over the value-in-use calculations, by varying the assumptions used (growth rates, terminal growth rate and WACC, i.e. discount rate) to assess the impact on the valuation; and�� as a final check, comparing the carrying value of the Group’s investment in BLM with the calculated value-in-use.
Management concluded there was no need for any impairment.
BLUE LABEL INTEGRATED ANNUAL REPORT 2017
69 /
Audit, Risk and Compliance Committee’s report continued
The fair value assessment of the investment in Oxigen, Oxigen Online and 2DFineThe investments in Oxigen Services India, Oxigen Online Services India, collectively (Oxigen Services India), and 2DFine Holdings Mauritius (2DFine) were historically accounted for as investments in associates and joint venture, applying the equity method up until 30 November 2016. From that date, the exemption available in IAS 28 – Investments in Associate and Joint Ventures for venture capital organisations has been applied to these investments and accounted for in accordance with IAS 39 – Financial Instruments: Recognition and Measurement at fair value with changes in fair value recognised in profit or loss. The difference between the carrying value of the investments as previously determined using the equity accounting method and their fair value is reflected as a fair value gain on a financial instrument through profit and loss for the year ended 31 May 2017. In order to determine the fair value, management used an independent third party with the requisite expertise in assisting it with the determination of the fair value of the investments.
These investments were initially of a long-term nature as they were expected to emulate the business model of the South African distribution operations. However, their profile has changed from that of the traditional Group business model to one of generating growth in the market value of the investments with a view to unlocking the Group’s share thereof. With the advent of the change in focus to financial services through wallet subscription, they are no longer strategically aligned with the other business units of the Group and are unlikely to generate profitability in the short to medium term. This in turn creates the potential to unlock the investment values in the future and the Group is pursuing this new strategy with respect to these investments.
Integrated annual reportThe Committee considered the integrated annual report, incorporating the annual financial statements for the year ended 31 May 2017. The Committee considered the sustainability information as disclosed in the integrated annual report and assessed its consistency with
operational and other information known to its members. The Committee recommended the approval of the integrated annual report to the Board.
The ARCC is satisfied that it has complied with its legal, regulatory and other responsibilities as per its terms of reference and that it has executed its responsibilities in terms of paragraph 3.84(g)(iii) of the Listings Requirements in its assessment of the suitability of the auditor. The contents of the ARCC report was discussed at the Committee meeting and were approved by the Committee members on 23 November 2017.
On behalf of the Audit, Risk and Compliance Committee
JS MthimunyeChairman
23 November 2017
BLUE LABEL INTEGRATED ANNUAL REPORT 2017
/ 70
Social, Ethics and Transformation Committee’s report
Dear stakeholdersI am pleased to report on the activities of the Committee for the financial year ended 31 May 2017.
The Committee was formed in February 2012 in accordance with section 72(4) of the Act and operates under Board-approved terms of reference, which includes holding meetings twice per financial year.
As prescribed by the Act, the role of the Committee is to monitor the Group’s activities in respect of:�� social and economic development, including the Group’s compliance with the Broad-Based Black Economic Empowerment Act and the Employment Equity Act;�� consumer relations and the Group’s compliance with consumer protection laws; �� the Group’s standing in terms of the ILO protocol on decent work and working conditions, the Group’s employment relationships and its contribution to the educational development of its employees;�� good corporate citizenship, including the Group’s promotion of equality, prevention of unfair discrimination and reduction of corruption, contribution to development of the communities in which the Group operates, and its record of sponsorships, donations and charitable givings;�� the environment, health and public safety and the impact thereon of the Group’s activities; and�� the ten principles of the United Nations Global Compact.
This year the Committee met twice. Areas discussed with management included transformation across the Group’s workplace focusing on the following issues: �� The regulatory landscape. �� Impacts of the revised and clarified dti codes of good practice. �� Reviewing current initiatives and their effectiveness and making appropriate recommendations. ��Monitoring progress of the roadmap to address equity B-BBEE shortfalls.��Company and subsidiary B-BBEE ratings.
The following items were also considered during the year: �� Social and economic development matters.��Coaching and skills development initiatives.�� Employment equity, including feedback from the Group Employment Equity Committee. �� Ten principles of the United Global Compact.��Corporate citizenship:
– Corporate Social Investment, including monitoring and spend on projects;
– sponsorship and donations, in particular our ongoing support of the flagship project, the Boys & Girls Club in Protea Glen, Soweto; and
– ethics statement and whistle-blowing policy.
�� Environment: – health and safety review; – health and safety practices; and – review of environmental footprint.
The Committee believes that the Group complies with the statutory duties, save for issues being addressed by management with regard to employment equity and aspects of procurement as the Group purchases mainly from the networks and power utilities.
On 11 January 2017 Yusuf Mahomed resigned and on 7 March 2017 we welcomed Phuti Mahanyele as a member to the Committee.
I look forward to reporting on our progress next year.
SJ VilakaziChairman
23 November 2017
BLUE LABEL INTEGRATED ANNUAL REPORT 2017
71 /

BLUE LABEL INTEGRATED ANNUAL REPORT 2017
/ 72
Operational overview
SA Distribution is the predominant contributor to the Group’s revenue and profitability. The principal operating companies therein are The Prepaid Company, Cell C, Blue Label Connect, Blue Label Distribution, TicketPro, 3G Mobile, Cigicell, Prepaid24, Utilities World, Reware, Edgars Connect and Transaction Junction.
Overview As the leading distributor of prepaid airtime and electricity in South Africa, this segment is well positioned to supply its expanding suite of products and services through its widespread distribution footprint of approximately 150 000 devices. Distribution channels range from Mom & Pop stores, spaza shops, independent stores, wholesalers, petroleum forecourts to multi-channel retail and corporate banking partners.
SA Distribution’s unique ability to deliver both virtual and physical products to an extensive distribution footprint through a single company with a proven platform across different channels to market, differentiates it as the market leader in South Africa.
Products include, but are not limited to, physical products such as hardware (POS terminals, handsets, tablets and accessories), prepaid starter packs, postpaid contracts and virtual products such as prepaid airtime, prepaid data, prepaid electricity, prepaid water, bill payments, voucher products, gaming, money transfers and ticketing.
The informal sector contributes approximately 85% to SA Distribution’s revenue, with the remaining 15% derived from the
corporate and formal retail sectors. In reaching into and uplifting rural communities, SA Distribution utilises unique and diverse route-to-market strategies. Solutions are facilitated by a fleet of trucks accompanied by foot soldiers, with further opportunities available through Start your own Business initiatives, which include bicycle traders and informal vending points or the option of purchasing Business in a Box from sales agents or retail partners. In addition, incentives are offered to retain merchants and reward their growth, resulting in further opportunities to cross- and up-sell our merchandise.
The majority of SA Distribution’s revenue continues to be derived from the sales and distribution of prepaid airtime, electricity, data and starter packs.
The South African Distribution segment(SA Distribution) is the largest distributor ofprepaid products and transactional servicesin South Africa, covering both thewholesale and retail markets. The productrange includes prepaid airtime, data, starterpacks, postpaid contracts, hardware, electricity, water and all forms of ticketing and financial services. These products are supplied across a diverse distribution footprint reaching all South Africans, thereby achieving the strategic objective of positioning core products and services within arm’s reach of urban and rural communities.
South African Distribution
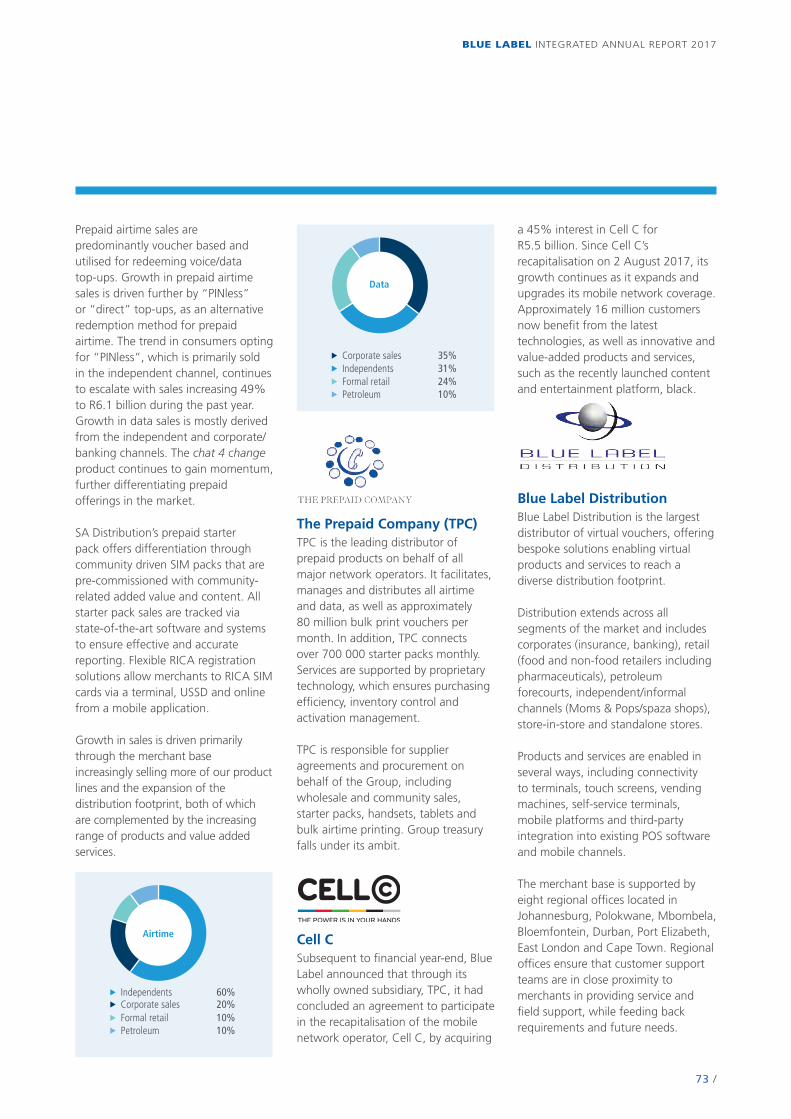
BLUE LABEL INTEGRATED ANNUAL REPORT 2017
73 /
Prepaid airtime sales are predominantly voucher based and utilised for redeeming voice/data top-ups. Growth in prepaid airtime sales is driven further by “PINless” or “direct” top-ups, as an alternative redemption method for prepaid airtime. The trend in consumers opting for “PINless”, which is primarily sold in the independent channel, continues to escalate with sales increasing 49% to R6.1 billion during the past year.Growth in data sales is mostly derived from the independent and corporate/banking channels. The chat 4 change product continues to gain momentum, further differentiating prepaid offerings in the market.
SA Distribution’s prepaid starter pack offers differentiation through community driven SIM packs that are pre-commissioned with community-related added value and content. All starter pack sales are tracked via state-of-the-art software and systems to ensure effective and accurate reporting. Flexible RICA registration solutions allow merchants to RICA SIM cards via a terminal, USSD and online from a mobile application.
Growth in sales is driven primarily through the merchant base increasingly selling more of our product lines and the expansion of the distribution footprint, both of which are complemented by the increasing range of products and value added services.
Airtime
u Independents 60%u Corporate sales 20%u Formal retail 10%u Petroleum 10%
u Corporate sales 35%u Independents 31%u Formal retail 24%u Petroleum 10%
Data
The Prepaid Company (TPC)TPC is the leading distributor of prepaid products on behalf of all major network operators. It facilitates, manages and distributes all airtime and data, as well as approximately 80 million bulk print vouchers per month. In addition, TPC connects over 700 000 starter packs monthly. Services are supported by proprietary technology, which ensures purchasing efficiency, inventory control and activation management.
TPC is responsible for supplier agreements and procurement on behalf of the Group, including wholesale and community sales, starter packs, handsets, tablets and bulk airtime printing. Group treasury falls under its ambit.
Cell CSubsequent to financial year-end, Blue Label announced that through its wholly owned subsidiary, TPC, it had concluded an agreement to participate in the recapitalisation of the mobile network operator, Cell C, by acquiring
a 45% interest in Cell C for R5.5 billion. Since Cell C’s recapitalisation on 2 August 2017, its growth continues as it expands and upgrades its mobile network coverage. Approximately 16 million customers now benefit from the latest technologies, as well as innovative and value-added products and services, such as the recently launched content and entertainment platform, black.
Blue Label DistributionBlue Label Distribution is the largest distributor of virtual vouchers, offering bespoke solutions enabling virtual products and services to reach a diverse distribution footprint.
Distribution extends across all segments of the market and includes corporates (insurance, banking), retail (food and non-food retailers including pharmaceuticals), petroleum forecourts, independent/informal channels (Moms & Pops/spaza shops), store-in-store and standalone stores.
Products and services are enabled in several ways, including connectivity to terminals, touch screens, vending machines, self-service terminals, mobile platforms and third-party integration into existing POS software and mobile channels.
The merchant base is supported by eight regional offices located in Johannesburg, Polokwane, Mbombela, Bloemfontein, Durban, Port Elizabeth, East London and Cape Town. Regional offices ensure that customer support teams are in close proximity to merchants in providing service and field support, while feeding back requirements and future needs.
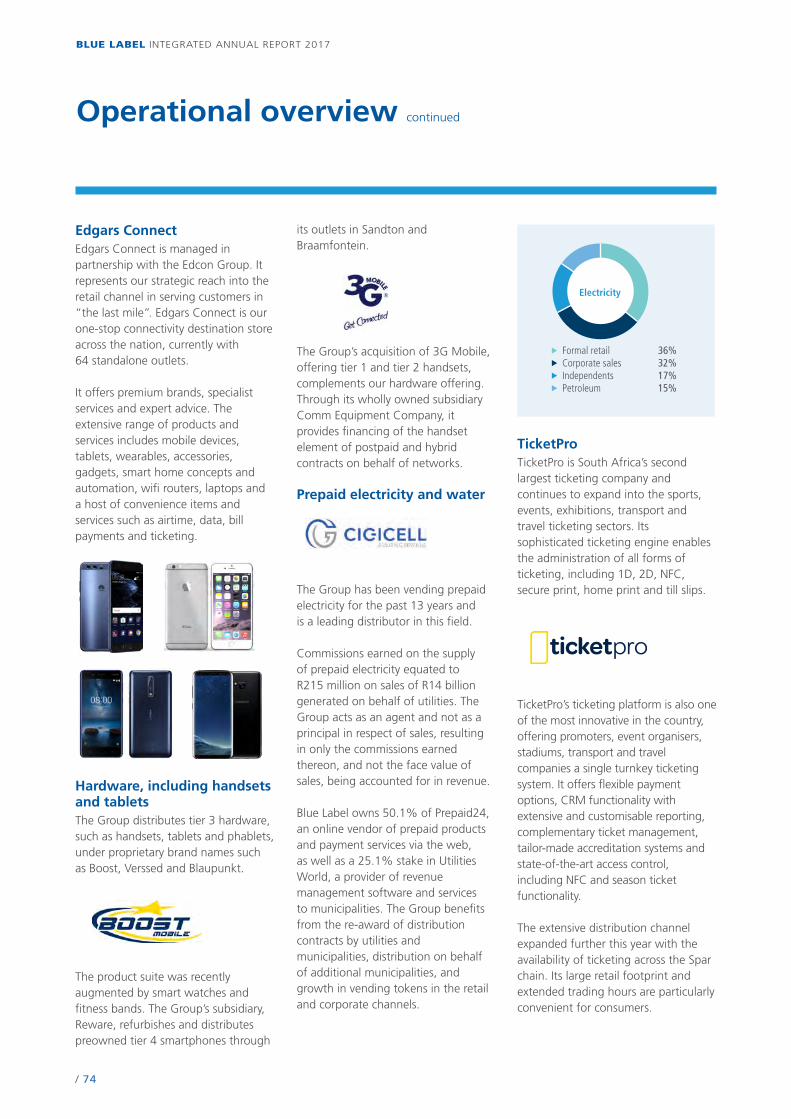
BLUE LABEL INTEGRATED ANNUAL REPORT 2017
/ 74
Operational overview continued
Edgars ConnectEdgars Connect is managed in partnership with the Edcon Group. It represents our strategic reach into the retail channel in serving customers in “the last mile”. Edgars Connect is our one-stop connectivity destination store across the nation, currently with 64 standalone outlets.
It offers premium brands, specialist services and expert advice. The extensive range of products and services includes mobile devices, tablets, wearables, accessories, gadgets, smart home concepts and automation, wifi routers, laptops and a host of convenience items and services such as airtime, data, bill payments and ticketing.
Hardware, including handsets and tablets The Group distributes tier 3 hardware, such as handsets, tablets and phablets, under proprietary brand names such as Boost, Verssed and Blaupunkt.
The product suite was recently augmented by smart watches and fitness bands. The Group’s subsidiary, Reware, refurbishes and distributes preowned tier 4 smartphones through
its outlets in Sandton and Braamfontein.
The Group’s acquisition of 3G Mobile, offering tier 1 and tier 2 handsets, complements our hardware offering. Through its wholly owned subsidiary Comm Equipment Company, it provides financing of the handset element of postpaid and hybrid contracts on behalf of networks.
Prepaid electricity and water
The Group has been vending prepaid electricity for the past 13 years and is a leading distributor in this field.
Commissions earned on the supply of prepaid electricity equated to R215 million on sales of R14 billion generated on behalf of utilities. The Group acts as an agent and not as a principal in respect of sales, resulting in only the commissions earned thereon, and not the face value of sales, being accounted for in revenue.
Blue Label owns 50.1% of Prepaid24, an online vendor of prepaid products and payment services via the web, as well as a 25.1% stake in Utilities World, a provider of revenue management software and services to municipalities. The Group benefits from the re-award of distribution contracts by utilities and municipalities, distribution on behalf of additional municipalities, and growth in vending tokens in the retail and corporate channels.
u Formal retail 36%u Corporate sales 32%u Independents 17%u Petroleum 15%
Electricity
TicketPro TicketPro is South Africa’s second largest ticketing company and continues to expand into the sports, events, exhibitions, transport and travel ticketing sectors. Its sophisticated ticketing engine enables the administration of all forms of ticketing, including 1D, 2D, NFC, secure print, home print and till slips.
TicketPro’s ticketing platform is also one of the most innovative in the country, offering promoters, event organisers, stadiums, transport and travel companies a single turnkey ticketing system. It offers flexible payment options, CRM functionality with extensive and customisable reporting, complementary ticket management, tailor-made accreditation systems and state-of-the-art access control, including NFC and season ticket functionality.
The extensive distribution channel expanded further this year with the availability of ticketing across the Spar chain. Its large retail footprint and extended trading hours are particularly convenient for consumers.
BLUE LABEL INTEGRATED ANNUAL REPORT 2017
75 /
The Mobile segment’s capability enables the rapid roll out of mobile-mediated sales, financial services, banking, couponing, loyalty, rewards, ticketing, transport, media advertising, gaming and LBS. Our technologies and products enable our customers to reach their customers, agnostic to any phone type or any mobile operator.
Core headline earnings from this segment amounted to R56.3 million (2016: R65.3 million).
During the year, Ticketpro expanded its product offerings in the bus transport sector. The Putco commuter ticket was introduced at over 200 stores strategically positioned around its key routes. Ticketing on behalf of Autopax was also implemented.
Financial services In support of financial inclusion, Blue Label offers a comprehensive suite of financial services, including bill payments, merchant acquiring and money transfers. Distribution footprint in the independent and informal channels continues to increase steadily.
Technology The SA Distribution segment houses Blue Label’s Technology division. The segment’s dependency on back-end
The Mobile segment houses the following main operating entities:
��Cellfind is one of Africa’s largest enablers of mobile messaging, VAS and mobile financial services. It boasts an impressive sending capacity of greater than 2 000 SMSs per second. During the year it delivered 3.2 billion SMSs, up 23% on the previous year, in spite of a contracting market.
system management, up-time and product and service delivery is crucial to ensuring the continual expansion of the distribution footprint and products and services offered.
The proprietary AEON and AMS systems, as well as Transaction Junction’s Postilion switch, entrenches the Group’s capability as a neutral aggregator in connecting to multiple service providers, product providers and distribution channels, regardless of the channel’s technology requirements.
Transaction Junction (TJ) is the foremost bank independent payment
�� Viamedia offers content for mobile phone users, across both B2C and B2B platforms. Its extensive infotainment catalogues are downloadable across networks in nine countries in Africa and in 10 languages.
services provider in southern Africa. It processes over 1.2 billion transactions per annum. TJ plays a vital role in the payment ecosystem by consistently delivering quality solutions to customers. It serves multiple industries, including major retailers, financial institutions, petroleum companies and others seeking to extend their payment services requirements securely and on time.
The SA Distribution segment’s contribution to core headline earnings equated to R893 million (2016: R751 million).
This segment provides mobile phone users with a complete ecosystem of services, including smartphone applications, WAP, MMS, e-mail, LBS, instant messaging, web messaging, SMS and USSD.
Mobile segment
BLUE LABEL INTEGRATED ANNUAL REPORT 2017
/ 76
Operational overview continued
Blue Label Data Solutions (BLDS) is a market leader in consumer data, big data, validation, verification, cleansing of data and lead generation. BLDS is accredited by the Direct Marketing Association of South Africa, of which it is a founding member.
It delivers a targeted approach of mining data and harnessing algorithmic technology, where data scientists transform large and complex datasets into effective and insightful marketing information.
Characteristics of underlying consumers are identified, and in turn, consumer behaviour patterns and trends are profiled.
Our databases continue to amplify and now exceed 65 million consumers. This year over 3 million qualifying leads were generated out of 1.2 billion SMSs delivered.
BLDS remains mindful of its obligations and adherence to the terms of POPI and the Financial Advisory and Intermediary Services Acts.
In compliance with POPI, the opt-in register is rebuilt every month by removing new opt-outs, adding new opt-ins, market segmenting opt-ins and recording other requested updates.
Core headline earnings from this segment amounted to R19.0 million (2016: R21.6 million).
This segment specialises in providing data and analytical support services.
Solutions segment
BLUE LABEL INTEGRATED ANNUAL REPORT 2017
77 /
Blue Label Mexico (BLM)BLM continues to deliver its growth strategy of building market share by expanding its POS network and distributing incremental products and services through its technology platform.
Currently, some 81 000 terminals are deployed. Initiatives to drive additional product and service transactions through the Red Qiubo terminal base include utilising data analytics.
The range of products and services includes “PINless” airtime recharge, SIM card distribution and bill payments. Financial services, such as cash collections and card acceptance and acquiring, are offered with CitiBanamex as the acquirer and Visa as a strategic partner. Digital food vouchers are delivered on behalf of the major food distributors, namely Edenred, Si Vale, Sodexo and Inbursa.
Blue Label’s share of losses continue to narrow and amounted to R37 million (2016: R63 million loss).
Oxigen Services IndiaThe government’s demonetisation of high denomination notes in November 2016, intended to transition India’s cash economy in favour of digitisation, resulted in the dynamics of the fintech sector changing significantly.
Initially the floodgates for the creation of e-wallets were opened. Subsequently, the introduction of new legislation and technologies has required fintech businesses to adapt and modify their strategies. Since inception, Oxigen focused on expanding its offline network of retail outlets, currently reaching approximately 200 000 merchants. In support of government’s call to industry for deploying up to 20 million terminals over the next few years, Oxigen has embarked on rolling out its own micro-ATM POS to access “the last mile”.
Each micro-ATM is equipped with a biometric scanner allowing customers to transact by using their Aadhaar ID number as authentication. Micro-ATMs are connected to the National Payments Corporation of India (NPCI), which facilitates cash deposit and withdrawal transactions. Oxigen’s platform already enables it to perform the functions of a bank by delivering the convenience of
comprehensive payment solutions through connectivity to NPCI’s Bill Payments and Settlement System (Bharat) and IMPS (Immediate Payments Service), an instant 24/7 interbank electronic funds transfer service.
Oxigen’s main offline products include mobile airtime top-ups, data card recharge, satellite TV recharge, bill payments, correspondence banking and domestic remittances.
Whilst Oxigen entered the online wallet market some years ago, the effects of demonetisation continue to evolutionise and disrupt the e-wallet industry. For example, government’s Unified Payments Interface (UPI) app allows merchants and consumers to pay and receive money in an instant transfer between any two bank accounts, a facility that is not afforded to other apps.
As a result, Oxigen is now focused on its core business of rolling out its footprint in the offline environment, whilst its e-wallet strategy follows a B2B2C approach of acquiring subscribers through white labelling its platform. Consequently, the online business and its high cost base is being scaled back significantly.
Blue Label’s holding in Oxigen is held as a venture capital investment. The fair value gain of R160 million and the Group’s share of losses to 30 November 2016 of R125 million equated to a net contribution of R35 million to core headline earnings.
The strategy of the International segment is to pursue growth opportunities for Group and third-party products and services across its global footprint, by systematically rolling out points of presence, in a replication of the proven South African business model. International operations comprise Blue Label Mexico and Oxigen Services India.
International segment

BLUE LABEL INTEGRATED ANNUAL REPORT 2017
/ 78
Value added statement
2017R’000
2017%
2016R’000
2016%
2015R’000
2015%
2014R’000
2014%
2013R’000
2013%
2012R’000
2012%
VALUE ADDED Value added by operating activities 1 792 768 95.8 1 674 203 96.3 1 492 949 98.0 1 125 610 96.7 1 050 765 95.9 1 068 131 94.7 Revenue 26 311 875 26 204 722 22 044 222 19 401 666 18 984 210 18 722 080 Net operating expenses (24 519 107) (24 530 519) (20 551 273) (18 276 056) (17 933 445) (17 653 949)Value added by investing activities 79 125 4.2 64 266 3.7 30 721 2.0 38 807 3.3 45 489 4.1 59 730 5.3 Interest income 79 125 64 266 30 721 38 807 45 489 59 730
1 871 893 100 1 738 469 100 1 523 670 100 1 164 417 100 1 096 254 100 1 127 861 100
VALUE DISTRIBUTED Distributed to employees 452 985 24.2 427 116 24.6 407 448 26.8 332 542 28.6 332 901 30.4 329 406 29.2 Salaries, wages, medical and other benefits 452 985 427 116 407 448 332 542 332 901 329 406 Distributed to providers of finance 105 518 5.6 48 207 2.8 67 964 4.5 22 993 2.0 23 767 2.2 3 307 0.3 Finance costs 105 518 48 207 67 964 22 993 23 767 3 307 Distributed to the state 345 990 18.5 305 420 17.6 275 768 18.1 208 996 17.9 215 075 19.6 190 759 16.9 Income tax 345 990 305 420 275 768 208 996 215 075 190 759 Distributed to social responsibility 8 460 0.5 6 528 0.4 5 336 0.4 5 075 0.4 4 242 0.4 3 340 0.3 Corporate social investment 8 460 6 528 5 336 5 075 4 242 3 340 Value reinvested 138 079 7.4 219 586 12.6 185 961 12.2 145 896 12.5 112 164 10.2 181 575 16.1 Depreciation, amortisation and impairment 112 851 98 183 94 019 65 137 67 951 91 557 Net discounting finance cost 34 440 36 270 22 875 26 440 15 558 66 505 Gain on associates and joint venture measured at fair value (160 200) – – – – –Share of losses of associates and joint ventures 164 941 71 770 79 338 56 873 47 326 19 835 Deferred taxation (13 953) 13 363 (10 271) (2 554) (18 671) 3 678 Value retained 820 861 43.8 731 612 42.0 581 193 38.0 448 915 38.6 408 105 37.2 419 474 37.2 Retained profit 786 965 691 590 577 617 450 230 424 841 438 104 Minority shareholders' interest 33 896 40 022 3 576 (1 315) (16 736) (18 630)
1 871 893 100 1 738 469 100 1 523 670 100 1 164 417 100 1 096 254 100 1 127 861 100
u Employees 24.2%u Providers of �nance 5.6%u The state 18.5%u Social responsiblitiy 0.5%u Reinvested 7.4%u Value retained 43.8%
Value distributed
2017
u Employees 24.6%u Providers of �nance 2.8%u The state 17.6%u Social responsiblitiy 0.4%u Reinvested 12.6%u Value retained 42.0%
Value distributed
2016
u Employees 26.8%u Providers of �nance 4.5%u The state 18.1%u Social responsiblitiy 0.4%u Reinvested 12.2%u Value retained 38.0%
Value distributed
2015
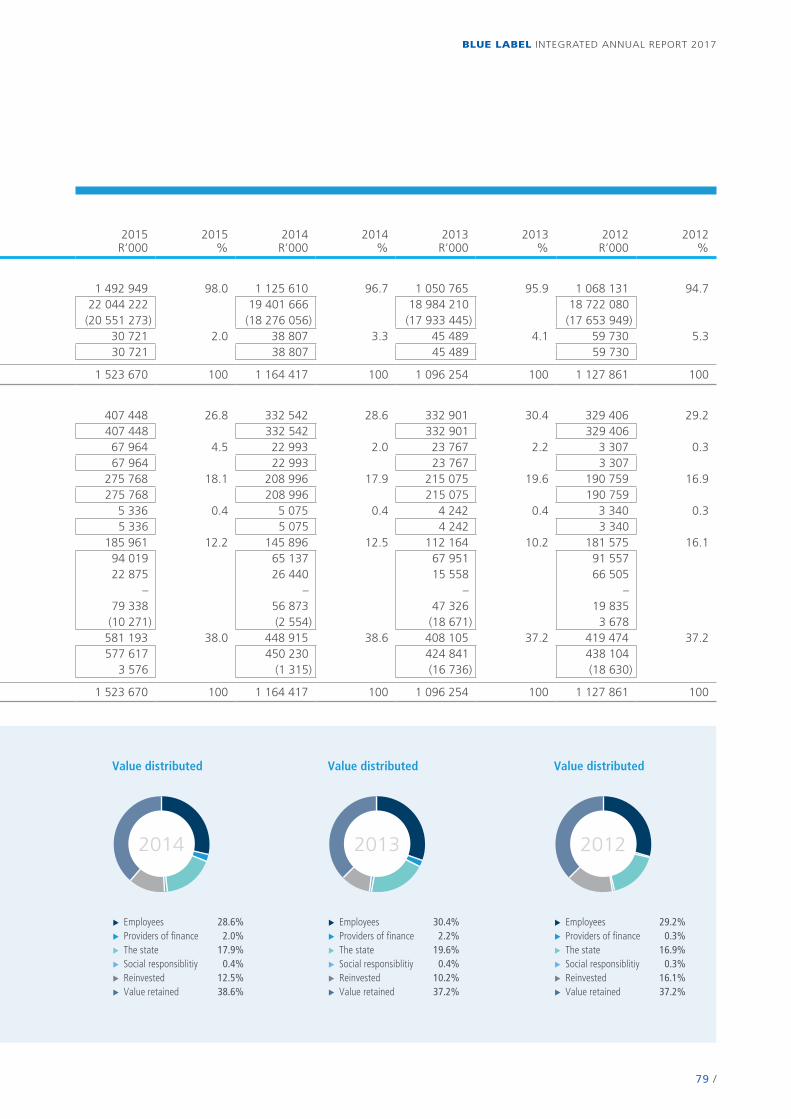
BLUE LABEL INTEGRATED ANNUAL REPORT 2017
79 /
2017R’000
2017%
2016R’000
2016%
2015R’000
2015%
2014R’000
2014%
2013R’000
2013%
2012R’000
2012%
VALUE ADDED Value added by operating activities 1 792 768 95.8 1 674 203 96.3 1 492 949 98.0 1 125 610 96.7 1 050 765 95.9 1 068 131 94.7 Revenue 26 311 875 26 204 722 22 044 222 19 401 666 18 984 210 18 722 080 Net operating expenses (24 519 107) (24 530 519) (20 551 273) (18 276 056) (17 933 445) (17 653 949)Value added by investing activities 79 125 4.2 64 266 3.7 30 721 2.0 38 807 3.3 45 489 4.1 59 730 5.3 Interest income 79 125 64 266 30 721 38 807 45 489 59 730
1 871 893 100 1 738 469 100 1 523 670 100 1 164 417 100 1 096 254 100 1 127 861 100
VALUE DISTRIBUTED Distributed to employees 452 985 24.2 427 116 24.6 407 448 26.8 332 542 28.6 332 901 30.4 329 406 29.2 Salaries, wages, medical and other benefits 452 985 427 116 407 448 332 542 332 901 329 406 Distributed to providers of finance 105 518 5.6 48 207 2.8 67 964 4.5 22 993 2.0 23 767 2.2 3 307 0.3 Finance costs 105 518 48 207 67 964 22 993 23 767 3 307 Distributed to the state 345 990 18.5 305 420 17.6 275 768 18.1 208 996 17.9 215 075 19.6 190 759 16.9 Income tax 345 990 305 420 275 768 208 996 215 075 190 759 Distributed to social responsibility 8 460 0.5 6 528 0.4 5 336 0.4 5 075 0.4 4 242 0.4 3 340 0.3 Corporate social investment 8 460 6 528 5 336 5 075 4 242 3 340 Value reinvested 138 079 7.4 219 586 12.6 185 961 12.2 145 896 12.5 112 164 10.2 181 575 16.1 Depreciation, amortisation and impairment 112 851 98 183 94 019 65 137 67 951 91 557 Net discounting finance cost 34 440 36 270 22 875 26 440 15 558 66 505 Gain on associates and joint venture measured at fair value (160 200) – – – – –Share of losses of associates and joint ventures 164 941 71 770 79 338 56 873 47 326 19 835 Deferred taxation (13 953) 13 363 (10 271) (2 554) (18 671) 3 678 Value retained 820 861 43.8 731 612 42.0 581 193 38.0 448 915 38.6 408 105 37.2 419 474 37.2 Retained profit 786 965 691 590 577 617 450 230 424 841 438 104 Minority shareholders' interest 33 896 40 022 3 576 (1 315) (16 736) (18 630)
1 871 893 100 1 738 469 100 1 523 670 100 1 164 417 100 1 096 254 100 1 127 861 100
u Employees 28.6%u Providers of �nance 2.0%u The state 17.9%u Social responsiblitiy 0.4%u Reinvested 12.5%u Value retained 38.6%
Value distributed
2014
u Employees 30.4%u Providers of �nance 2.2%u The state 19.6%u Social responsiblitiy 0.4%u Reinvested 10.2%u Value retained 37.2%
Value distributed
2013
u Employees 29.2%u Providers of �nance 0.3%u The state 16.9%u Social responsiblitiy 0.3%u Reinvested 16.1%u Value retained 37.2%
Value distributed
2012
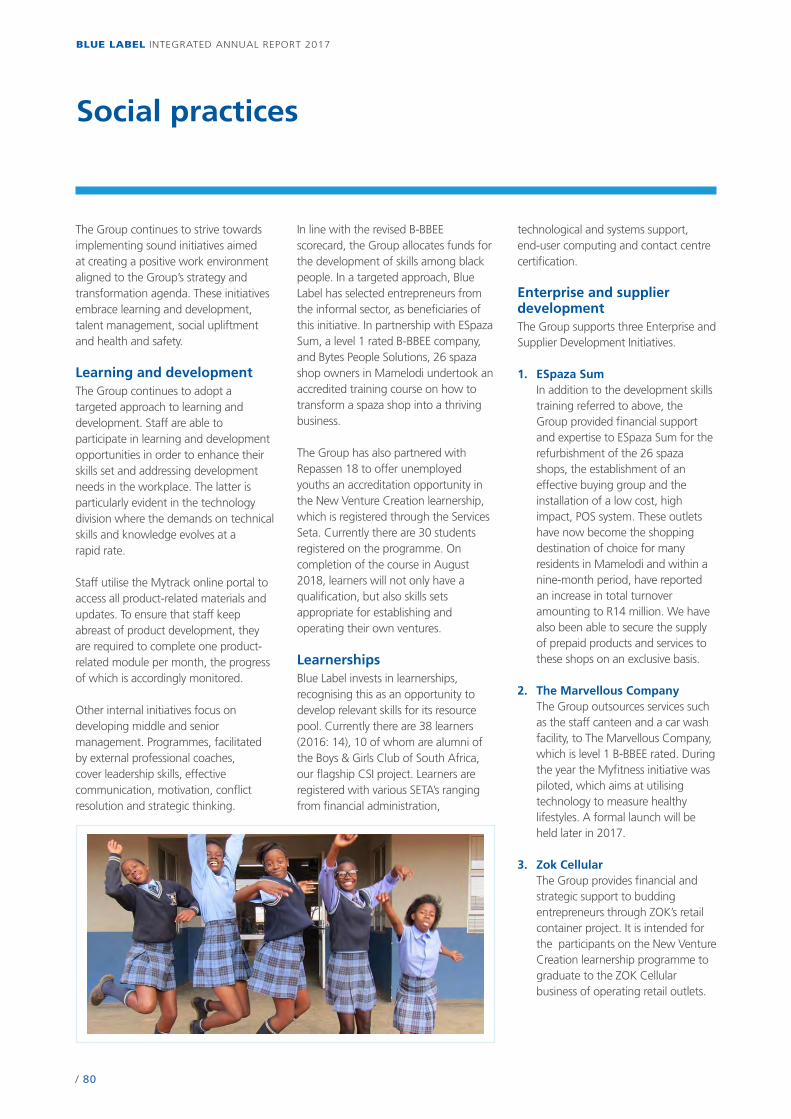
BLUE LABEL INTEGRATED ANNUAL REPORT 2017
/ 80
Social practices
The Group continues to strive towards implementing sound initiatives aimed at creating a positive work environment aligned to the Group’s strategy and transformation agenda. These initiatives embrace learning and development, talent management, social upliftment and health and safety.
Learning and developmentThe Group continues to adopt a targeted approach to learning and development. Staff are able to participate in learning and development opportunities in order to enhance their skills set and addressing development needs in the workplace. The latter is particularly evident in the technology division where the demands on technical skills and knowledge evolves at a rapid rate.
Staff utilise the Mytrack online portal to access all product-related materials and updates. To ensure that staff keep abreast of product development, they are required to complete one product-related module per month, the progress of which is accordingly monitored.
Other internal initiatives focus on developing middle and senior management. Programmes, facilitated by external professional coaches, cover leadership skills, effective communication, motivation, conflict resolution and strategic thinking.
In line with the revised B-BBEE scorecard, the Group allocates funds for the development of skills among black people. In a targeted approach, Blue Label has selected entrepreneurs from the informal sector, as beneficiaries of this initiative. In partnership with ESpaza Sum, a level 1 rated B-BBEE company, and Bytes People Solutions, 26 spaza shop owners in Mamelodi undertook an accredited training course on how to transform a spaza shop into a thriving business.
The Group has also partnered with Repassen 18 to offer unemployed youths an accreditation opportunity in the New Venture Creation learnership, which is registered through the Services Seta. Currently there are 30 students registered on the programme. On completion of the course in August 2018, learners will not only have a qualification, but also skills sets appropriate for establishing and operating their own ventures.
LearnershipsBlue Label invests in learnerships, recognising this as an opportunity to develop relevant skills for its resource pool. Currently there are 38 learners (2016: 14), 10 of whom are alumni of the Boys & Girls Club of South Africa, our flagship CSI project. Learners are registered with various SETA’s ranging from financial administration,
technological and systems support, end-user computing and contact centre certification.
Enterprise and supplier developmentThe Group supports three Enterprise and Supplier Development Initiatives.
1. ESpaza Sum In addition to the development skills
training referred to above, the Group provided financial support and expertise to ESpaza Sum for the refurbishment of the 26 spaza shops, the establishment of an effective buying group and the installation of a low cost, high impact, POS system. These outlets have now become the shopping destination of choice for many residents in Mamelodi and within a nine-month period, have reported an increase in total turnover amounting to R14 million. We have also been able to secure the supply of prepaid products and services to these shops on an exclusive basis.
2. The Marvellous Company The Group outsources services such
as the staff canteen and a car wash facility, to The Marvellous Company, which is level 1 B-BBEE rated. During the year the Myfitness initiative was piloted, which aims at utilising technology to measure healthy lifestyles. A formal launch will be held later in 2017.
3. Zok Cellular The Group provides financial and
strategic support to budding entrepreneurs through ZOK’s retail container project. It is intended for the participants on the New Venture Creation learnership programme to graduate to the ZOK Cellular business of operating retail outlets.

BLUE LABEL INTEGRATED ANNUAL REPORT 2017
81 /
We have adopted a number of initiatives aimed at driving a high performance culture, where staff are recognised and rewarded commensurately with their contributions.
Talent acquisition and retentionThe Group adheres to a defined process for talent acquisition, so that all vacant roles can be filled within a short space of time followed by an effective recruitment process. This process includes a targeted search of relevant job portals, selection of candidates involving line managers and colleagues, after assessments where applicable.
Performance assessments are conducted with new staff after six weeks in the role in order to ensure that any issues that may arise are addressed. The formal performance management procedure aims at achieving our required standards. Performance is monitored on a biannual basis and measured against established and agreed key performance criteria. These measures are used to determine bonuses and increases payable.
Employee benefitsThe Group offers several employee benefits, including group life insurance (inclusive of a life policy, severe illness, disability and a funeral cover) and medical aid through Discovery Health and a provident fund through Destiny Retirement Fund. As we have adopted a Total Cost to Company remuneration system, the costs of medical aid and provident fund are included in staff packages. The cost of the group life benefit is borne by the company.
Staff wellnessWe host an annual Vitality wellness day at head office enabling staff to undergo various medical assessments. During the year staff were afforded the opportunity to check blood pressure, eye sight, to donate blood to the South African National Blood Service, to obtain flu injections and to undergo HIV testing and counselling, as applicable. Staff also have access to qualified counselling on issues such as depression, stress, burnout and addiction.
Staff regularly volunteer their support for various community and charity initiatives throughout the year,
including hosting and assisting at youth events, Cyclethon and the JP Morgan Corporate Challenge Race.
Employment equity The principles supporting and promoting equal opportunity as well as fair and consistent treatment to all staff, are embodied in the Group’s employment equity and transformation policy.
Learning, development and talent acquisition are aimed at promoting and encouraging employment equity.
The Employment Equity Committee, which reports to the Social, Ethics and Transformation Committee, is representative of gender, race, employment level and geography within the Group. The committee meets quarterly to discuss specific items, such as employment equity targets, barriers to employment, learning and development and any work place issues.
The Employment Equity Plans submitted to the Department of Labour in 2012 have expired and are being reviewed, with the intention of resubmitting revised targets in early 2018 in respect of the period 2018 to 2023.
Human capital
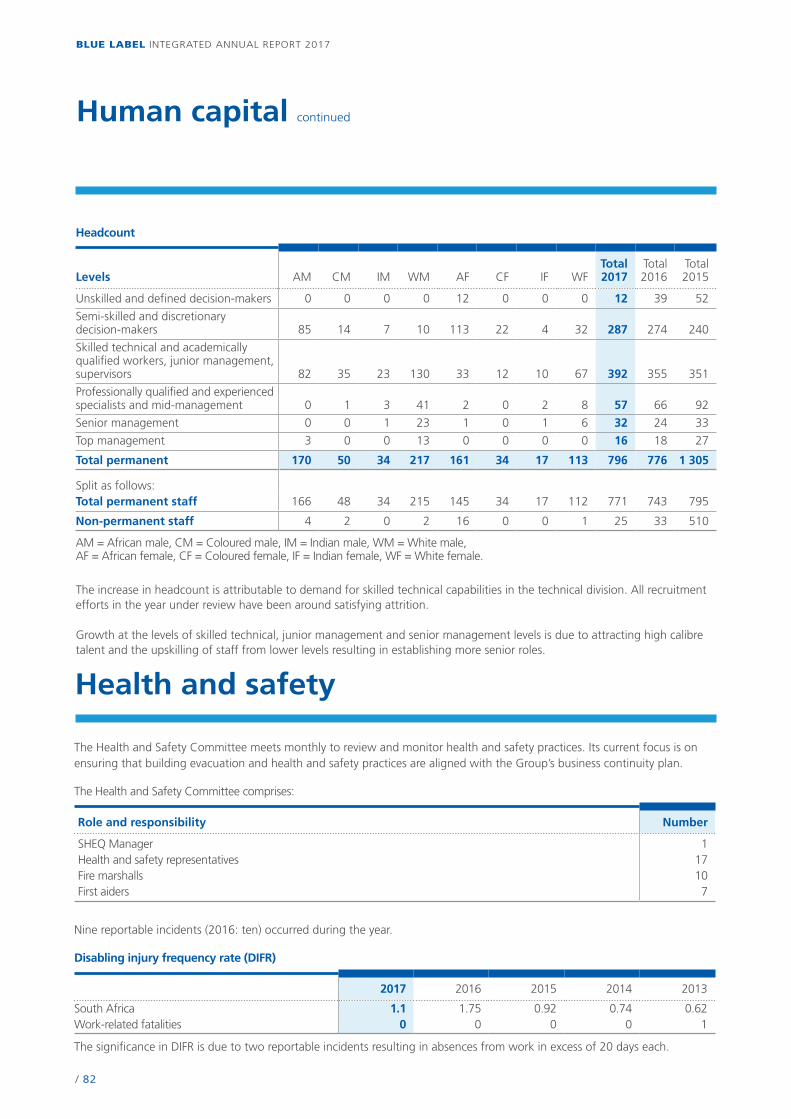
BLUE LABEL INTEGRATED ANNUAL REPORT 2017
/ 82
Health and safety
The Health and Safety Committee meets monthly to review and monitor health and safety practices. Its current focus is on ensuring that building evacuation and health and safety practices are aligned with the Group’s business continuity plan.
The Health and Safety Committee comprises:
Role and responsibility Number
SHEQ Manager 1Health and safety representatives 17Fire marshalls 10First aiders 7
Nine reportable incidents (2016: ten) occurred during the year.
Disabling injury frequency rate (DIFR)
2017 2016 2015 2014 2013
South Africa 1.1 1.75 0.92 0.74 0.62Work-related fatalities 0 0 0 0 1
The significance in DIFR is due to two reportable incidents resulting in absences from work in excess of 20 days each.
Headcount
Levels AM CM IM WM AF CF IF WFTotal2017
Total 2016
Total 2015
Unskilled and defined decision-makers 0 0 0 0 12 0 0 0 12 39 52
Semi-skilled and discretionary decision-makers 85 14 7 10 113 22 4 32 287 274 240
Skilled technical and academically qualified workers, junior management, supervisors 82 35 23 130 33 12 10 67 392 355 351
Professionally qualified and experienced specialists and mid-management 0 1 3 41 2 0 2 8 57 66 92
Senior management 0 0 1 23 1 0 1 6 32 24 33
Top management 3 0 0 13 0 0 0 0 16 18 27
Total permanent 170 50 34 217 161 34 17 113 796 776 1 305
Split as follows:Total permanent staff 166 48 34 215 145 34 17 112 771 743 795
Non-permanent staff 4 2 0 2 16 0 0 1 25 33 510
AM = African male, CM = Coloured male, IM = Indian male, WM = White male, AF = African female, CF = Coloured female, IF = Indian female, WF = White female.
The increase in headcount is attributable to demand for skilled technical capabilities in the technical division. All recruitment efforts in the year under review have been around satisfying attrition.
Growth at the levels of skilled technical, junior management and senior management levels is due to attracting high calibre talent and the upskilling of staff from lower levels resulting in establishing more senior roles.
Human capital continued
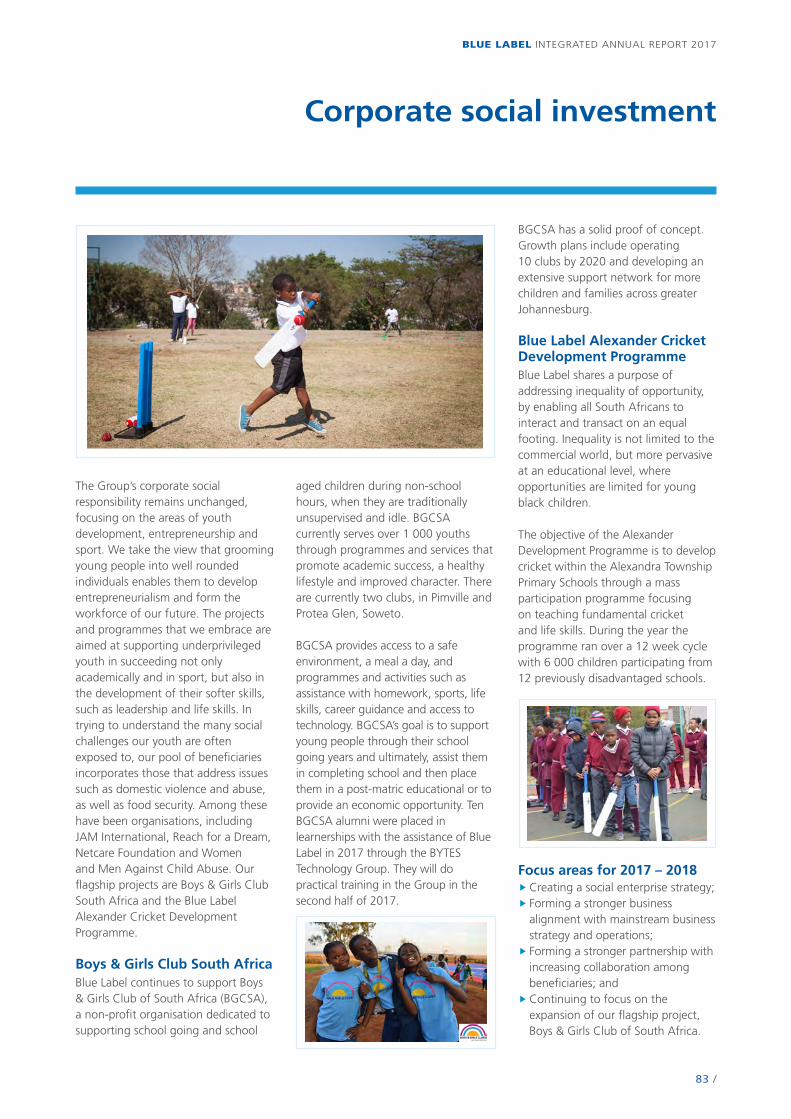
BLUE LABEL INTEGRATED ANNUAL REPORT 2017
83 /
Corporate social investment
The Group’s corporate social responsibility remains unchanged, focusing on the areas of youth development, entrepreneurship and sport. We take the view that grooming young people into well rounded individuals enables them to develop entrepreneurialism and form the workforce of our future. The projects and programmes that we embrace are aimed at supporting underprivileged youth in succeeding not only academically and in sport, but also in the development of their softer skills, such as leadership and life skills. In trying to understand the many social challenges our youth are often exposed to, our pool of beneficiaries incorporates those that address issues such as domestic violence and abuse, as well as food security. Among these have been organisations, including JAM International, Reach for a Dream, Netcare Foundation and Women and Men Against Child Abuse. Our flagship projects are Boys & Girls Club South Africa and the Blue Label Alexander Cricket Development Programme.
Boys & Girls Club South AfricaBlue Label continues to support Boys & Girls Club of South Africa (BGCSA), a non-profit organisation dedicated to supporting school going and school
aged children during non-school hours, when they are traditionally unsupervised and idle. BGCSA currently serves over 1 000 youths through programmes and services that promote academic success, a healthy lifestyle and improved character. There are currently two clubs, in Pimville and Protea Glen, Soweto.
BGCSA provides access to a safe environment, a meal a day, and programmes and activities such as assistance with homework, sports, life skills, career guidance and access to technology. BGCSA’s goal is to support young people through their school going years and ultimately, assist them in completing school and then place them in a post-matric educational or to provide an economic opportunity. Ten BGCSA alumni were placed in learnerships with the assistance of Blue Label in 2017 through the BYTES Technology Group. They will do practical training in the Group in the second half of 2017.
BGCSA has a solid proof of concept. Growth plans include operating 10 clubs by 2020 and developing an extensive support network for more children and families across greater Johannesburg.
Blue Label Alexander Cricket Development ProgrammeBlue Label shares a purpose of addressing inequality of opportunity, by enabling all South Africans to interact and transact on an equal footing. Inequality is not limited to the commercial world, but more pervasive at an educational level, where opportunities are limited for young black children.
The objective of the Alexander Development Programme is to develop cricket within the Alexandra Township Primary Schools through a mass participation programme focusing on teaching fundamental cricket and life skills. During the year the programme ran over a 12 week cycle with 6 000 children participating from 12 previously disadvantaged schools.
Focus areas for 2017 – 2018��Creating a social enterprise strategy;�� Forming a stronger business alignment with mainstream business strategy and operations;�� Forming a stronger partnership with increasing collaboration among beneficiaries; and��Continuing to focus on the expansion of our flagship project, Boys & Girls Club of South Africa.

/ 84
BLUE LABEL INTEGRATED ANNUAL REPORT 2017
Contents
Prominent notice 85
Statement of Directors’ responsibility 85
Approval of the financial statements 86
Declaration by the Company Secretary 86
Directors’ report 87
Independent auditor’s report 90
Group income statement 96
Group statement of comprehensive income 96
Group statement of financial position 97
Group statement of changes in equity 98
Group statement of cash flows 100
Notes to the Group annual financial statements 101
Company statement of financial position 170
Company statement of comprehensive income 171
Company statement of changes in equity 172
Company statement of cash flows 174
Notes to the Company annual financial statements 175
Annexure to the Company annual financial statements 198
/ 85
BLUE LABEL INTEGRATED ANNUAL REPORT 2017
Statement of Directors’ responsibility for the year ended 31 May 2017
These Group and Company annual financial statements have been audited by our independent external auditor PricewaterhouseCoopers Inc. in compliance with the applicable requirements of the Companies Act, No 71 of 2008.
Dean Suntup, Financial Director, supervised the preparation of the Group and Company annual financial statements.
DA Suntup CA(SA)Financial Director
Prominent notice
The Directors are responsible for the maintenance of adequate accounting records and the preparation, integrity and fair presentation of the Group and Company financial statements of Blue Label Telecoms Limited, its subsidiaries, joint ventures and associates (the Group).
The financial statements have been prepared in accordance with International Financial Reporting Standards (IFRS) as issued by the International Accounting Standards Board (IASB), the Financial Reporting Guides as issued by the South African Institute of Chartered Accountants (SAICA) Accounting Practices Committee, Financial Pronouncements as issued by the Financial Reporting Standards Council, the JSE Listings Requirements and the requirements of the Companies Act of 2008.
The Directors consider that having applied IFRS in preparing the Group and Company financial statements they have selected the most appropriate accounting policies, consistently applied and supported by reasonable and prudent judgements and estimates, and that all IFRS statements that they consider to be applicable have been followed.
The Directors are satisfied that the information contained in the Group and Company financial statements fairly presents the results of operations for the year and the financial position of the Group and Company at year-end. The Directors prepared the other information included in the Group and Company financial statements and are responsible for both its accuracy and its consistency.
In addition, the Directors are responsible for the Group’s systems of internal financial control. These are designed to provide reasonable, but not absolute, assurance as to the reliability of the financial statements, and to adequately safeguard, verify and maintain accountability of the assets, and to prevent and detect misstatement and loss. Nothing has come to the attention of the Directors to indicate that any material breakdown in the functioning of these controls, procedures and systems has occurred during the year under review.
The Group and Company financial statements have been prepared on the going concern basis, since the Directors have every reason to believe that the Group have adequate resources in place to continue in operation for the foreseeable future, based on forecasts and available cash resources. These Group financial statements support the viability of the Group.
The independent auditing firm PricewaterhouseCoopers Inc., which was given unrestricted access to all financial records and related data including minutes of all meetings of shareholders, the Board of Directors and Committees of the Board has audited the Group financial statements. The Directors believe that all representations made to the independent auditors during their audit are valid and appropriate.
/ 86
BLUE LABEL INTEGRATED ANNUAL REPORT 2017
Approval of the financial statements
In terms of section 88(2)(e) of the Companies Act, No 71 of 2008 (the Act), I confirm that for the year ended 31 May 2017, Blue Label Telecoms Limited has lodged with the Companies and Intellectual Property Commission all such returns and notices as are required of a public company in terms of the Act and that all such returns and notices are true, correct and up to date.
J van EdenGroup Company SecretarySandton23 November 2017
The financial statements which appear on pages 96 to 197 were produced and approved by the Board of Directors on 23 November 2017 and are signed on its behalf by:
LM Nestadt DA SuntupNon-executive Chairman Financial Director
BM Levy MS LevyJoint Chief Executive Officer Joint Chief Executive Officer
For the year ended 31 May 2017
Declaration by the Company Secretary
/ 87
BLUE LABEL INTEGRATED ANNUAL REPORT 2017
The Directors have pleasure in presenting the Group and Company annual financial statements of Blue Label Telecoms Limited (Blue Label Telecoms or the Company) and its subsidiary, associate and joint venture companies (the Group) for the year ended 31 May 2017.
Principal activities and strategyBlue Label Telecoms’ core business is the virtual distribution of secure electronic tokens of value and transactional services across its global footprint of touch points. The Group’s stated strategy is to extend its global footprint of touch points, both organically and acquisitively, to meet the significant demand for the delivery of multiple prepaid products and services through a single distributor, across various delivery mechanisms and via numerous merchants or vendors.
Financial resultsThe Group recorded a net profit after tax attributable to equity holders for the year ended 31 May 2017 of R787 million (2016: R692 million). Full details of the financial position and results of the Company, the Group and its segments are set out in the annual financial statements and Group annual financial statements. The Group and Company annual financial statements for the year ended 31 May 2017 were approved by the Board and signed on its behalf on 23 November 2017.
Going concernThe financial statements have been prepared on the going concern basis, since the Directors have every reason to believe that the Blue Label Telecoms Group and the Company have adequate resources in place to continue in operation for the foreseeable future.
AcquisitionsThe Group’s effective shareholding in Oxigen Services India Private Limited (OSI) prior to April 2017 was 58.18%. Of this shareholding, 40.96% was held by Gold Label Investments (GLI), a wholly owned subsidiary of the Group and 17.21% indirectly through the Group’s 50% shareholding in 2DFine Holdings Mauritius. In April 2017, a rights issue was offered by OSI for USD1.5 million. The Group exercised its rights for the entire amount through GLI congruent with 2DFine Holdings Mauritius waiving its rights. The effect of this is that GLI’s shareholding has increased from 40.96% to 41.96% and its indirect shareholding of 17.21% has been diluted to 16.92%. The Group’s effective shareholding in OSI therefore increased by 0.7% to 58.88%.
Blue Label Telecoms acquired 25.1% of Utilities World on 1 June 2016 for a payment of R7.5 million and a further contingent payment of R5.0 million.
Refer to note 2.1 of the Group annual financial statements for further information.
Share capitalFull details of the authorised, issued and unissued capital of the Company at 31 May 2017 are contained in note 6 of the Group annual financial statements. There were no shares issued during the financial year ended 31 May 2017 (2016: nil).
Subsequent eventsSubsequent to year-end, dividend number 8 was declared and approved by the Board.
On 2 August 2017, Blue Label, through its wholly owned subsidiary, The Prepaid Company Proprietary Limited (The Prepaid Company), acquired 45% of the issued share capital of Cell C Proprietary Limited (Cell C) for a purchase consideration of R5.5 billion. Of this amount, 183 333 333 ordinary shares were subscribed for by third parties at an issue price of R15.00 per share, equating to R2.75 billion.
On the same date, The Prepaid Company concluded an agreement to purchase 100% of the issued share capital in 3G Mobile Proprietary Limited (3G Mobile) from its shareholders for a purchase consideration of R1.9 billion.
The acquisition has been structured in two stages, whereby 47.37% of the issued share capital was initially acquired for a purchase consideration of R900 million. The remaining 52.63% of the issued share capital will be acquired for a further R1.0 billion, subject to the fulfilment of conditions precedent. Of the initial purchase of 47.37%, 16 666 666 ordinary shares were issued to the vendors at R15.00 per share, equating to R250 million. The balance of R650 million will be payable on the 28 February 2018.
As part of the restructure of the debt into Cell C by third party lenders, The Prepaid Company will be required to provide liquidity support to Magnolia Cellular Investment 2 (RF) Proprietary Limited (SPV2), which is 100% held by 3C Telecommunications Proprietary Limited of up to USD80 million, which liquidity support will be provided over 24 months and will be in the form of subordinated funding to SPV2. Oger Telecoms contributed USD20 million of the aforesaid USD80 million thus reducing The Prepaid Company’s obligation in this regard to a maximum of USD60 million. In addition, to the extent that certain assets of Oger Telecoms are realised within the aforesaid 24 month period, a portion of such realisation shall further reduce The Prepaid Company’s obligation. In this regard, USD16 million has been realised, thereby reducing its exposure to a maximum of USD44 million.
Directors’ report
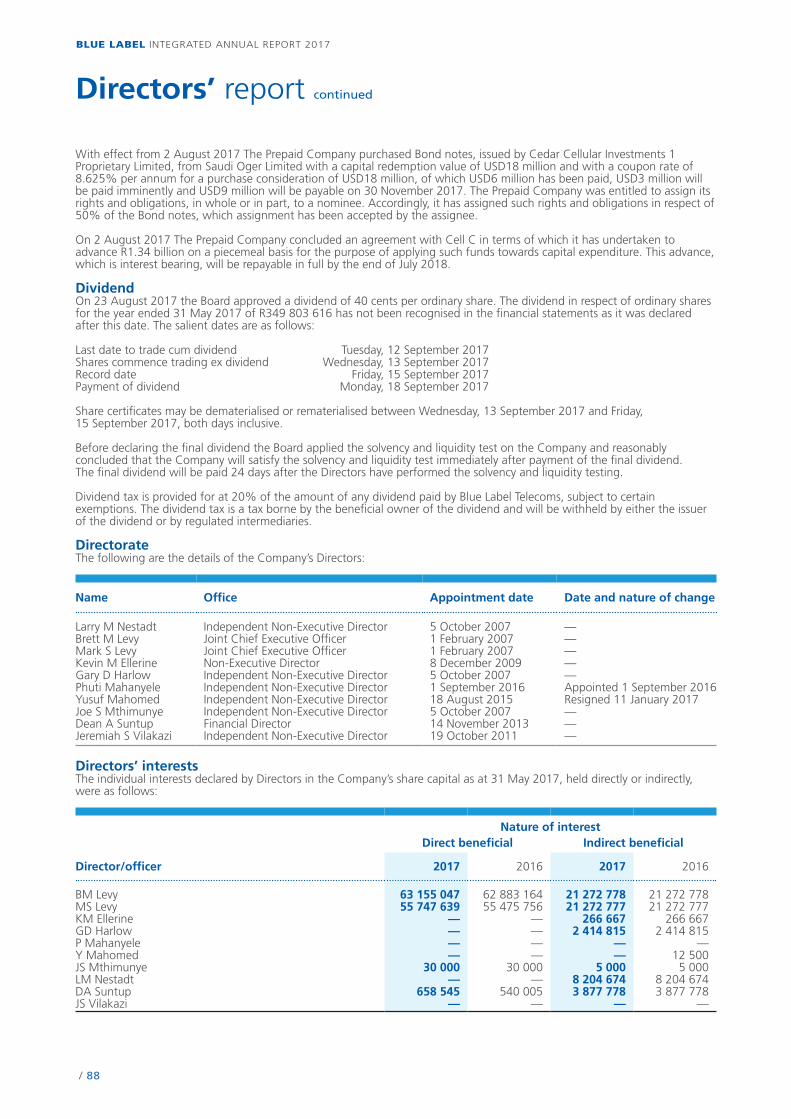
/ 88
BLUE LABEL INTEGRATED ANNUAL REPORT 2017
Directors’ report continued
With effect from 2 August 2017 The Prepaid Company purchased Bond notes, issued by Cedar Cellular Investments 1 Proprietary Limited, from Saudi Oger Limited with a capital redemption value of USD18 million and with a coupon rate of 8.625% per annum for a purchase consideration of USD18 million, of which USD6 million has been paid, USD3 million will be paid imminently and USD9 million will be payable on 30 November 2017. The Prepaid Company was entitled to assign its rights and obligations, in whole or in part, to a nominee. Accordingly, it has assigned such rights and obligations in respect of 50% of the Bond notes, which assignment has been accepted by the assignee.
On 2 August 2017 The Prepaid Company concluded an agreement with Cell C in terms of which it has undertaken to advance R1.34 billion on a piecemeal basis for the purpose of applying such funds towards capital expenditure. This advance, which is interest bearing, will be repayable in full by the end of July 2018.
DividendOn 23 August 2017 the Board approved a dividend of 40 cents per ordinary share. The dividend in respect of ordinary shares for the year ended 31 May 2017 of R349 803 616 has not been recognised in the financial statements as it was declared after this date. The salient dates are as follows:
Last date to trade cum dividend Tuesday, 12 September 2017Shares commence trading ex dividend Wednesday, 13 September 2017Record date Friday, 15 September 2017Payment of dividend Monday, 18 September 2017
Share certificates may be dematerialised or rematerialised between Wednesday, 13 September 2017 and Friday, 15 September 2017, both days inclusive.
Before declaring the final dividend the Board applied the solvency and liquidity test on the Company and reasonably concluded that the Company will satisfy the solvency and liquidity test immediately after payment of the final dividend. The final dividend will be paid 24 days after the Directors have performed the solvency and liquidity testing.
Dividend tax is provided for at 20% of the amount of any dividend paid by Blue Label Telecoms, subject to certain exemptions. The dividend tax is a tax borne by the beneficial owner of the dividend and will be withheld by either the issuer of the dividend or by regulated intermediaries.
DirectorateThe following are the details of the Company’s Directors:
Name Office Appointment date Date and nature of change
Larry M Nestadt Independent Non-Executive Director 5 October 2007 —Brett M Levy Joint Chief Executive Officer 1 February 2007 —Mark S Levy Joint Chief Executive Officer 1 February 2007 —Kevin M Ellerine Non-Executive Director 8 December 2009 —Gary D Harlow Independent Non-Executive Director 5 October 2007 —Phuti Mahanyele Independent Non-Executive Director 1 September 2016 Appointed 1 September 2016Yusuf Mahomed Independent Non-Executive Director 18 August 2015 Resigned 11 January 2017Joe S Mthimunye Independent Non-Executive Director 5 October 2007 —Dean A Suntup Financial Director 14 November 2013 —Jeremiah S Vilakazi Independent Non-Executive Director 19 October 2011 —
Directors’ interestsThe individual interests declared by Directors in the Company’s share capital as at 31 May 2017, held directly or indirectly, were as follows:
Nature of interest Direct beneficial Indirect beneficial
Director/officer 2017 2016 2017 2016
BM Levy 63 155 047 62 883 164 21 272 778 21 272 778MS Levy 55 747 639 55 475 756 21 272 777 21 272 777KM Ellerine — — 266 667 266 667GD Harlow — — 2 414 815 2 414 815P Mahanyele — — — —Y Mahomed — — — 12 500JS Mthimunye 30 000 30 000 5 000 5 000LM Nestadt — — 8 204 674 8 204 674DA Suntup 658 545 540 005 3 877 778 3 877 778JS Vilakazi — — — —
/ 89
BLUE LABEL INTEGRATED ANNUAL REPORT 2017
Directors’ report continued
The aggregate interest of the current Directors in the capital of the Company was as follows:
Number of shares
Director/officer 2017 2016
Beneficial 176 905 720 176 255 914
The beneficial interest held by Directors and officers of the Company constitutes 26.48% (2016: 26.46%) of the issued share capital of the Company.
Post year-end and prior to the approval of the annual financial statements, JS Mthimunye has increased his indirect beneficial interest by 20 000 shares and his direct beneficial interest by 15 000 shares.
Details of Directors’ emoluments and equity compensation benefits are set out in note 5.3 of the Group annual financial statements and details of the forfeitable share plan are set out in note 5.2.
ResolutionsOn 8 December 2016 the Company passed and filed with the Companies and Intellectual Property Commission the following special resolutions:• approving the remuneration of non-executive directors; • granting a general authority to repurchase the Company’s shares;• granting financial assistance in terms of section 44 and 45 of the Act; and• approving fraction of shares amendment of memorandum of incorporation.
Except for the aforementioned, no other special resolutions, the nature of which might be significant to shareholders in their appreciation of the state of affairs of the Group, were passed by the Company or its subsidiaries during the period covered at the date of signing these Group and Company annual financial statements.
Company SecretaryThe Board is satisfied that Ms J van Eden has the requisite knowledge and experience to carry out the duties of a company secretary of a public company in accordance with section 88 of the Act and is not disqualified to act as such. She is not a director of the Board and maintains an arm’s-length relationship with the Board.
The business and postal address of the Company Secretary appear on the Company’s website at www.bluelabeltelecoms.co.za.
American depository receipt facilityBlue Label Telecoms has a sponsored American depository receipt facility. The facility is sponsored by BNY Mellon and details of the administrators are reflected on the Company’s website.
AuditorsPricewaterhouseCoopers Inc. will continue in office in accordance with section 90(6) of the Companies Act.
Larry NestadtChairman
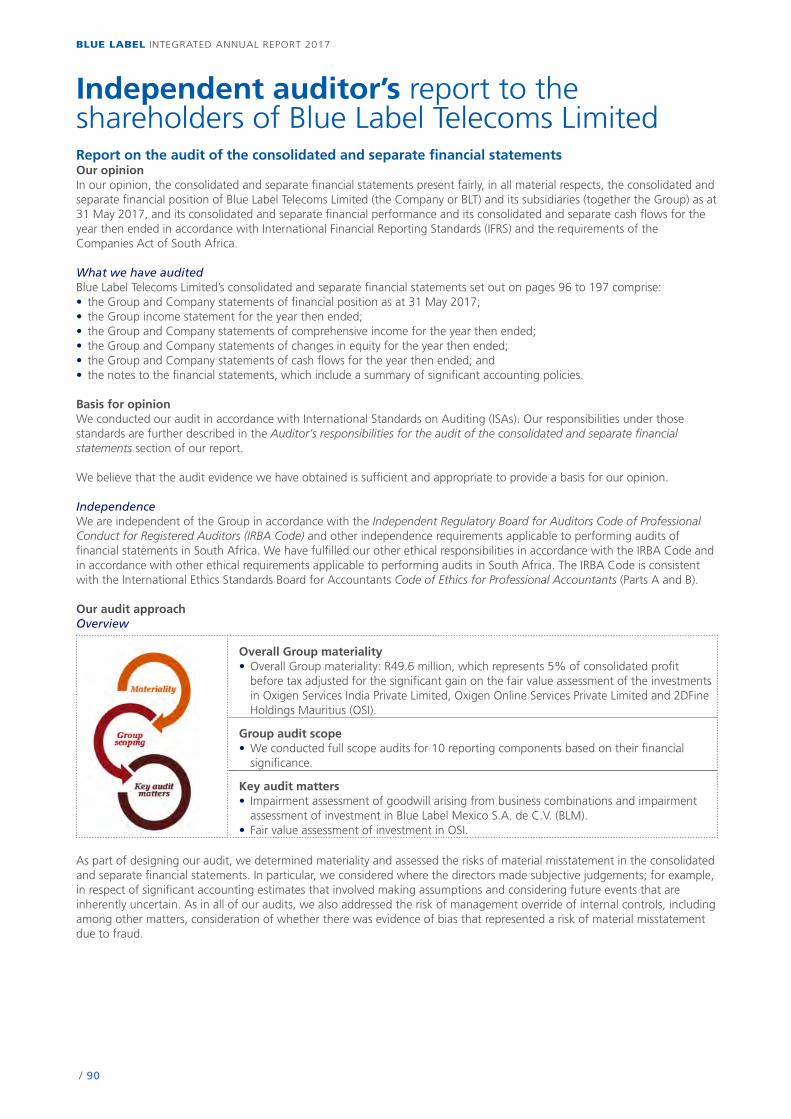
/ 90
BLUE LABEL INTEGRATED ANNUAL REPORT 2017
Independent auditor’s report to the shareholders of Blue Label Telecoms LimitedReport on the audit of the consolidated and separate financial statementsOur opinionIn our opinion, the consolidated and separate financial statements present fairly, in all material respects, the consolidated and separate financial position of Blue Label Telecoms Limited (the Company or BLT) and its subsidiaries (together the Group) as at 31 May 2017, and its consolidated and separate financial performance and its consolidated and separate cash flows for the year then ended in accordance with International Financial Reporting Standards (IFRS) and the requirements of the Companies Act of South Africa.
What we have auditedBlue Label Telecoms Limited’s consolidated and separate financial statements set out on pages 96 to 197 comprise:• the Group and Company statements of financial position as at 31 May 2017;• the Group income statement for the year then ended;• the Group and Company statements of comprehensive income for the year then ended;• the Group and Company statements of changes in equity for the year then ended;• the Group and Company statements of cash flows for the year then ended; and• the notes to the financial statements, which include a summary of significant accounting policies.
Basis for opinionWe conducted our audit in accordance with International Standards on Auditing (ISAs). Our responsibilities under those standards are further described in the Auditor’s responsibilities for the audit of the consolidated and separate financial statements section of our report.
We believe that the audit evidence we have obtained is sufficient and appropriate to provide a basis for our opinion.
IndependenceWe are independent of the Group in accordance with the Independent Regulatory Board for Auditors Code of Professional Conduct for Registered Auditors (IRBA Code) and other independence requirements applicable to performing audits of financial statements in South Africa. We have fulfilled our other ethical responsibilities in accordance with the IRBA Code and in accordance with other ethical requirements applicable to performing audits in South Africa. The IRBA Code is consistent with the International Ethics Standards Board for Accountants Code of Ethics for Professional Accountants (Parts A and B).
Our audit approachOverview
Overall Group materiality•Overall Group materiality: R49.6 million, which represents 5% of consolidated profit
before tax adjusted for the significant gain on the fair value assessment of the investments in Oxigen Services India Private Limited, Oxigen Online Services Private Limited and 2DFine Holdings Mauritius (OSI).
Group audit scope•We conducted full scope audits for 10 reporting components based on their financial
significance.
Key audit matters• Impairment assessment of goodwill arising from business combinations and impairment
assessment of investment in Blue Label Mexico S.A. de C.V. (BLM).• Fair value assessment of investment in OSI.
As part of designing our audit, we determined materiality and assessed the risks of material misstatement in the consolidated and separate financial statements. In particular, we considered where the directors made subjective judgements; for example, in respect of significant accounting estimates that involved making assumptions and considering future events that are inherently uncertain. As in all of our audits, we also addressed the risk of management override of internal controls, including among other matters, consideration of whether there was evidence of bias that represented a risk of material misstatement due to fraud.
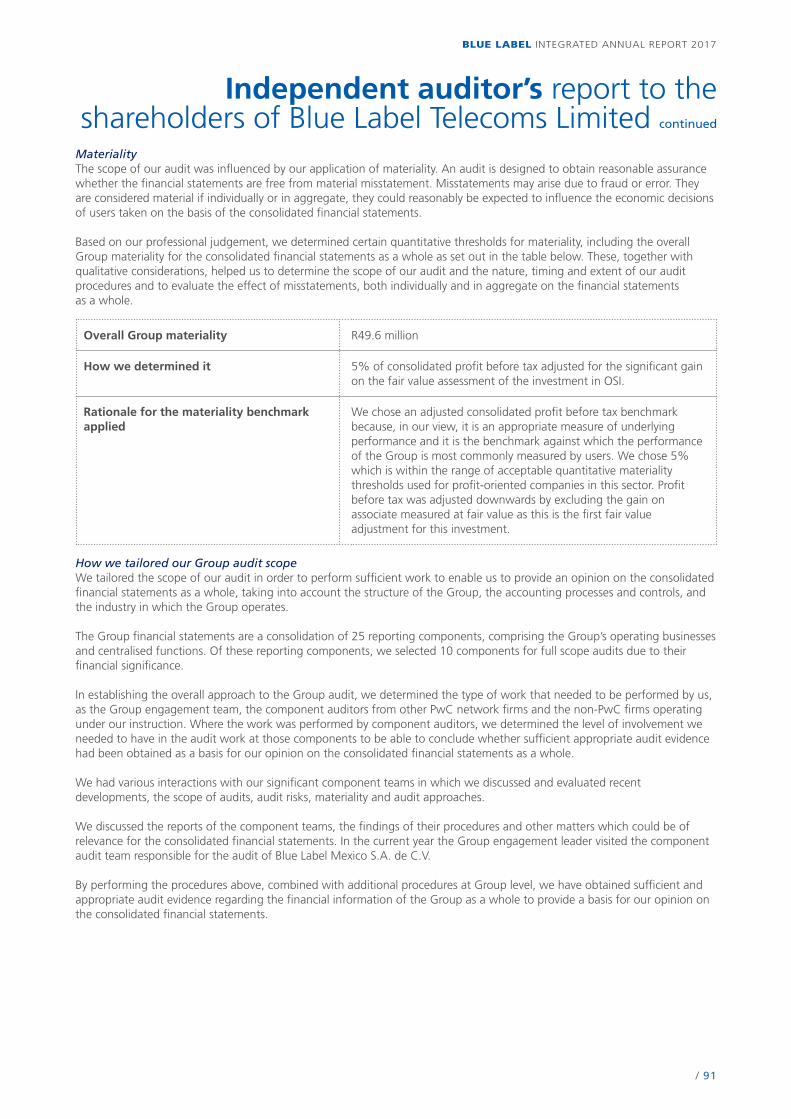
/ 91
BLUE LABEL INTEGRATED ANNUAL REPORT 2017
Independent auditor’s report to the shareholders of Blue Label Telecoms Limited continued
MaterialityThe scope of our audit was influenced by our application of materiality. An audit is designed to obtain reasonable assurance whether the financial statements are free from material misstatement. Misstatements may arise due to fraud or error. They are considered material if individually or in aggregate, they could reasonably be expected to influence the economic decisions of users taken on the basis of the consolidated financial statements.
Based on our professional judgement, we determined certain quantitative thresholds for materiality, including the overall Group materiality for the consolidated financial statements as a whole as set out in the table below. These, together with qualitative considerations, helped us to determine the scope of our audit and the nature, timing and extent of our audit procedures and to evaluate the effect of misstatements, both individually and in aggregate on the financial statements as a whole.
Overall Group materiality R49.6 million
How we determined it 5% of consolidated profit before tax adjusted for the significant gain on the fair value assessment of the investment in OSI.
Rationale for the materiality benchmark applied
We chose an adjusted consolidated profit before tax benchmark because, in our view, it is an appropriate measure of underlying performance and it is the benchmark against which the performance of the Group is most commonly measured by users. We chose 5% which is within the range of acceptable quantitative materiality thresholds used for profit-oriented companies in this sector. Profit before tax was adjusted downwards by excluding the gain on associate measured at fair value as this is the first fair value adjustment for this investment.
How we tailored our Group audit scope We tailored the scope of our audit in order to perform sufficient work to enable us to provide an opinion on the consolidated financial statements as a whole, taking into account the structure of the Group, the accounting processes and controls, and the industry in which the Group operates.
The Group financial statements are a consolidation of 25 reporting components, comprising the Group’s operating businesses and centralised functions. Of these reporting components, we selected 10 components for full scope audits due to their financial significance.
In establishing the overall approach to the Group audit, we determined the type of work that needed to be performed by us, as the Group engagement team, the component auditors from other PwC network firms and the non-PwC firms operating under our instruction. Where the work was performed by component auditors, we determined the level of involvement we needed to have in the audit work at those components to be able to conclude whether sufficient appropriate audit evidence had been obtained as a basis for our opinion on the consolidated financial statements as a whole.
We had various interactions with our significant component teams in which we discussed and evaluated recent developments, the scope of audits, audit risks, materiality and audit approaches.
We discussed the reports of the component teams, the findings of their procedures and other matters which could be of relevance for the consolidated financial statements. In the current year the Group engagement leader visited the component audit team responsible for the audit of Blue Label Mexico S.A. de C.V.
By performing the procedures above, combined with additional procedures at Group level, we have obtained sufficient and appropriate audit evidence regarding the financial information of the Group as a whole to provide a basis for our opinion on the consolidated financial statements.

/ 92
BLUE LABEL INTEGRATED ANNUAL REPORT 2017
Independent auditor’s report to the shareholders of Blue Label Telecoms Limited continued
Key audit mattersKey audit matters are those matters that, in our professional judgement, were of most significance in our audit of the consolidated and separate financial statements of the current period. These matters were addressed in the context of our audit of the consolidated and separate financial statements as a whole, and in forming our opinion thereon, and we do not provide a separate opinion on these matters.
The key audit matters below relate to the consolidated financial statements. We have determined that there are no key audit matters in respect of the separate financial statements to describe in our audit report.
Key audit matter How our audit addressed the key audit matter
Impairment assessment of goodwill arising from business combinations and impairment assessment of investment in Blue Label Mexico S.A. de C.V. (BLM) Due to the number of business combinations that the Group enters into, the Group’s net assets include a significant amount of goodwill.
Goodwill comprises 7% of the total consolidated assets in the consolidated statement of financial position. These assets have been recognised in the consolidated statement of financial position as a consequence of the acquisitive nature of the Group.
Goodwill is tested annually for impairment or whenever there is an impairment indicator identified by management.
This annual impairment test was a matter of most significance to our audit because management’s assessment process is complex and highly judgemental and is based on assumptions, specifically the terminal growth rate, discount rate and forecast cash flows, which are affected by expected future market or economic conditions, particularly those in South Africa. The balance of R604.6 million as at 31 May 2017 is material to the financial statements.
For the year ended 31 May 2017 management performed an impairment assessment over the goodwill balance as follows:•Assessing the recoverable amount as being value-in-use,
as entities are held for trading and not for sale;•Calculating the value-in-use for each cash generating
unit (CGU) using a discounted cash flow model; and• Performing a sensitivity analysis over the value in use
calculations, by varying the assumptions used (growth rates, terminal growth rate and WACC i.e. discount rate) to assess the impact on the valuations.
Refer to note 2.1 for details of management’s impairment test and assumptions
Under IFRS, the Group is required to test the recoverable amount of investments for impairment if there is an indicator of impairment.
This impairment test was significant to our audit because BLM reported a loss of R77.8 million for the year. The BLM investment balance of R173.7 million includes a goodwill balance of R120.1 million as of 31 May 2017.
Management’s assessment process is consistent with the process followed for goodwill as described above. The process is complex and highly judgemental and is based on assumptions, including the terminal growth rate, discount rate and forecast cash flows, which are affected by expected future market or economic conditions, particularly those in Mexico.
Refer to note 2.1 for details of management’s impairment test and assumptions.
We made use of our internal valuations expertise to assess whether the approach adopted by management in the valuation models for both goodwill and the investment in BLM is in line with market practice and the applicable requirements of International Accounting Standard (IAS) 36 – Impairment of Assets. We also tested the mathematical accuracy of the valuation models through performing a recalculation.
We assessed management’s cash flow forecasts and agreed them to the latest BLT Group Board approved budgets which is subject to oversight by the subsidiary directors. We held discussions with management regarding the process by which the budgets were developed and to understand the basis for the assumptions used.
The Board approved budgets cover a period of five years and the forecasts for the purpose of the value-in-use calculations extend out to five years.
We made use of our valuations expertise to independently calculate a discount rate taking into account independently obtained data such as the cost of debt, risk free rates in the market, market risk premiums, country risk premium, specific risk premium, debt/equity ratios as well as the beta of comparable companies. This was compared to the discount rate used by management.
We found the discount rate used by management to be within an acceptable range of our independent calculations.
The terminal growth rate was compared to forecast industry trends and to management’s past forecast history for similar operations.
We also assessed whether assumptions, such as working capital and capital expenditure, had been determined and applied consistently across the CGU’s.
We performed independent sensitivity calculations on the impairment assessments, to determine the degree by which the key assumptions needed to change in order to trigger an impairment. We discussed these with management and based on the evidence obtained we accepted management’s conclusion that the key assumptions applied in the models were reasonable.
As a final test we compared the Group’s net assets as at 31 May 2017 of R5 billion to its market capitalisation of R10.5 billion and noted that the R5.5 billion of implied headroom was consistent with the results of our testing.
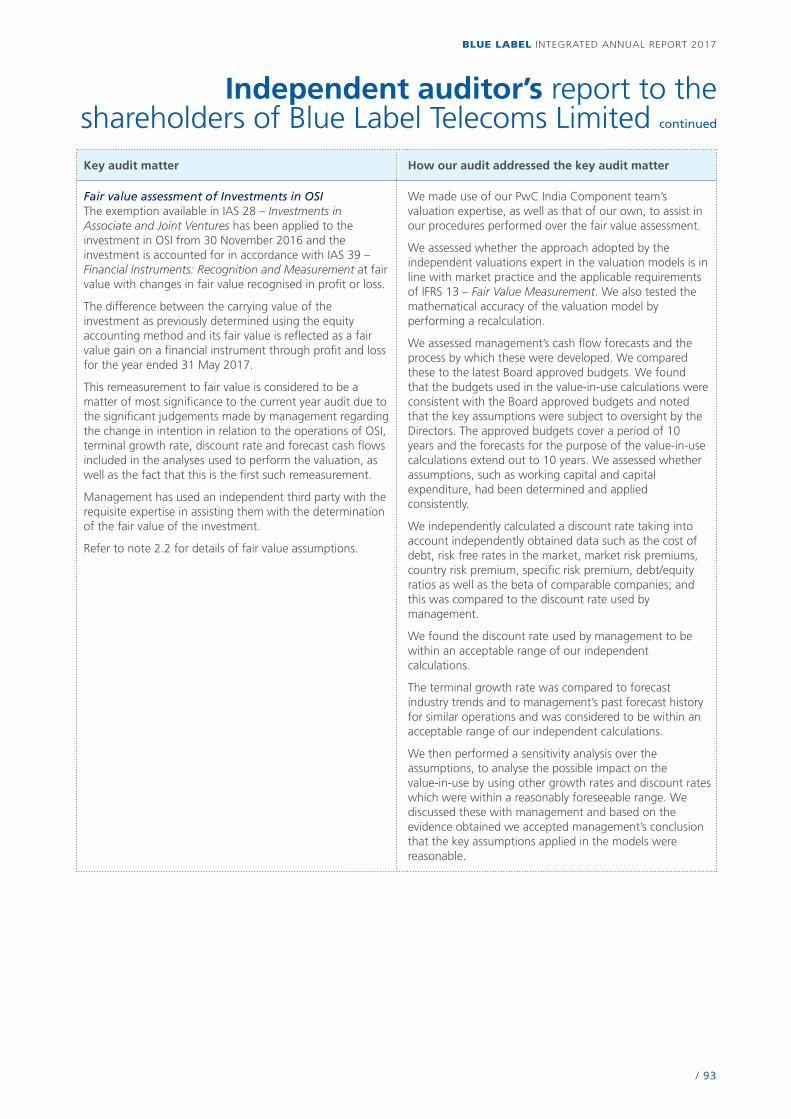
/ 93
BLUE LABEL INTEGRATED ANNUAL REPORT 2017
Key audit matter How our audit addressed the key audit matter
Fair value assessment of Investments in OSIThe exemption available in IAS 28 – Investments in Associate and Joint Ventures has been applied to the investment in OSI from 30 November 2016 and the investment is accounted for in accordance with IAS 39 – Financial Instruments: Recognition and Measurement at fair value with changes in fair value recognised in profit or loss.
The difference between the carrying value of the investment as previously determined using the equity accounting method and its fair value is reflected as a fair value gain on a financial instrument through profit and loss for the year ended 31 May 2017.
This remeasurement to fair value is considered to be a matter of most significance to the current year audit due to the significant judgements made by management regarding the change in intention in relation to the operations of OSI, terminal growth rate, discount rate and forecast cash flows included in the analyses used to perform the valuation, as well as the fact that this is the first such remeasurement.
Management has used an independent third party with the requisite expertise in assisting them with the determination of the fair value of the investment.
Refer to note 2.2 for details of fair value assumptions.
We made use of our PwC India Component team’s valuation expertise, as well as that of our own, to assist in our procedures performed over the fair value assessment.
We assessed whether the approach adopted by the independent valuations expert in the valuation models is in line with market practice and the applicable requirements of IFRS 13 – Fair Value Measurement. We also tested the mathematical accuracy of the valuation model by performing a recalculation.
We assessed management’s cash flow forecasts and the process by which these were developed. We compared these to the latest Board approved budgets. We found that the budgets used in the value-in-use calculations were consistent with the Board approved budgets and noted that the key assumptions were subject to oversight by the Directors. The approved budgets cover a period of 10 years and the forecasts for the purpose of the value-in-use calculations extend out to 10 years. We assessed whether assumptions, such as working capital and capital expenditure, had been determined and applied consistently.
We independently calculated a discount rate taking into account independently obtained data such as the cost of debt, risk free rates in the market, market risk premiums, country risk premium, specific risk premium, debt/equity ratios as well as the beta of comparable companies; and this was compared to the discount rate used by management.
We found the discount rate used by management to be within an acceptable range of our independent calculations.
The terminal growth rate was compared to forecast industry trends and to management’s past forecast history for similar operations and was considered to be within an acceptable range of our independent calculations.
We then performed a sensitivity analysis over the assumptions, to analyse the possible impact on the value-in-use by using other growth rates and discount rates which were within a reasonably foreseeable range. We discussed these with management and based on the evidence obtained we accepted management’s conclusion that the key assumptions applied in the models were reasonable.
Independent auditor’s report to the shareholders of Blue Label Telecoms Limited continued
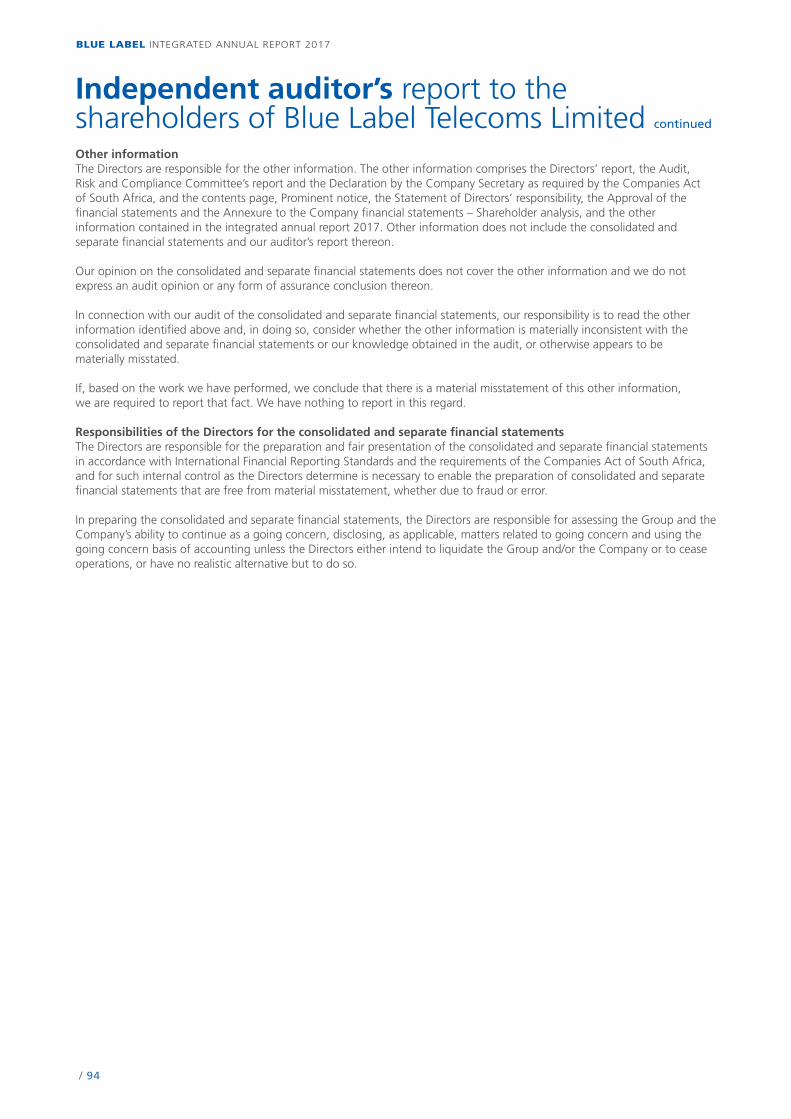
/ 94
BLUE LABEL INTEGRATED ANNUAL REPORT 2017
Other informationThe Directors are responsible for the other information. The other information comprises the Directors’ report, the Audit, Risk and Compliance Committee’s report and the Declaration by the Company Secretary as required by the Companies Act of South Africa, and the contents page, Prominent notice, the Statement of Directors’ responsibility, the Approval of the financial statements and the Annexure to the Company financial statements – Shareholder analysis, and the other information contained in the integrated annual report 2017. Other information does not include the consolidated and separate financial statements and our auditor’s report thereon.
Our opinion on the consolidated and separate financial statements does not cover the other information and we do not express an audit opinion or any form of assurance conclusion thereon.
In connection with our audit of the consolidated and separate financial statements, our responsibility is to read the other information identified above and, in doing so, consider whether the other information is materially inconsistent with the consolidated and separate financial statements or our knowledge obtained in the audit, or otherwise appears to be materially misstated.
If, based on the work we have performed, we conclude that there is a material misstatement of this other information, we are required to report that fact. We have nothing to report in this regard.
Responsibilities of the Directors for the consolidated and separate financial statementsThe Directors are responsible for the preparation and fair presentation of the consolidated and separate financial statements in accordance with International Financial Reporting Standards and the requirements of the Companies Act of South Africa, and for such internal control as the Directors determine is necessary to enable the preparation of consolidated and separate financial statements that are free from material misstatement, whether due to fraud or error.
In preparing the consolidated and separate financial statements, the Directors are responsible for assessing the Group and the Company’s ability to continue as a going concern, disclosing, as applicable, matters related to going concern and using the going concern basis of accounting unless the Directors either intend to liquidate the Group and/or the Company or to cease operations, or have no realistic alternative but to do so.
Independent auditor’s report to the shareholders of Blue Label Telecoms Limited continued

/ 95
BLUE LABEL INTEGRATED ANNUAL REPORT 2017
Auditor’s responsibilities for the audit of the consolidated and separate financial statementsOur objectives are to obtain reasonable assurance about whether the consolidated and separate financial statements as a whole are free from material misstatement, whether due to fraud or error, and to issue an auditor’s report that includes our opinion. Reasonable assurance is a high level of assurance, but is not a guarantee that an audit conducted in accordance with ISAs will always detect a material misstatement when it exists. Misstatements can arise from fraud or error and are considered material if, individually or in the aggregate, they could reasonably be expected to influence the economic decisions of users taken on the basis of these consolidated and separate financial statements.
As part of an audit in accordance with ISAs, we exercise professional judgement and maintain professional scepticism throughout the audit. We also:• Identify and assess the risks of material misstatement of the consolidated and separate financial statements, whether due
to fraud or error, design and perform audit procedures responsive to those risks, and obtain audit evidence that is sufficient and appropriate to provide a basis for our opinion. The risk of not detecting a material misstatement resulting from fraud is higher than for one resulting from error, as fraud may involve collusion, forgery, intentional omissions, misrepresentations, or the override of internal control.
•Obtain an understanding of internal control relevant to the audit in order to design audit procedures that are appropriate in the circumstances, but not for the purpose of expressing an opinion on the effectiveness of the Group’s and the Company’s internal control.
• Evaluate the appropriateness of accounting policies used and the reasonableness of accounting estimates and related disclosures made by the Directors.
•Conclude on the appropriateness of the Directors’ use of the going concern basis of accounting and, based on the audit evidence obtained, whether a material uncertainty exists related to events or conditions that may cast significant doubt on the Group’s and the Company’s ability to continue as a going concern. If we conclude that a material uncertainty exists, we are required to draw attention in our auditor’s report to the related disclosures in the consolidated and separate financial statements or, if such disclosures are inadequate, to modify our opinion. Our conclusions are based on the audit evidence obtained up to the date of our auditor’s report. However, future events or conditions may cause the Group and/or Company to cease to continue as a going concern.
• Evaluate the overall presentation, structure and content of the consolidated and separate financial statements, including the disclosures, and whether the consolidated and separate financial statements represent the underlying transactions and events in a manner that achieves fair presentation.
•Obtain sufficient appropriate audit evidence regarding the financial information of the entities or business activities within the Group to express an opinion on the consolidated financial statements. We are responsible for the direction, supervision and performance of the Group audit. We remain solely responsible for our audit opinion.
We communicate with the Directors regarding, among other matters, the planned scope and timing of the audit and significant audit findings, including any significant deficiencies in internal control that we identify during our audit.
We also provide the Directors with a statement that we have complied with relevant ethical requirements regarding independence, and to communicate with them all relationships and other matters that may reasonably be thought to bear on our independence, and where applicable, related safeguards.
From the matters communicated with the Directors, we determine those matters that were of most significance in the audit of the consolidated and separate financial statements of the current period and are therefore the key audit matters. We describe these matters in our auditor’s report unless law or regulation precludes public disclosure about the matter or when, in extremely rare circumstances, we determine that a matter should not be communicated in our report because the adverse consequences of doing so would reasonably be expected to outweigh the public interest benefits of such communication.
Report on other legal and regulatory requirements In terms of the IRBA Rule published in Government Gazette Number 39475 dated 4 December 2015, we report that PricewaterhouseCoopers Inc. has been the auditor of Blue Label Telecoms Limited for 13 years.
PricewaterhouseCoopers Inc. Director: D StormRegistered AuditorJohannesburg
23 November 2017
Independent auditor’s report to the shareholders of Blue Label Telecoms Limited continued
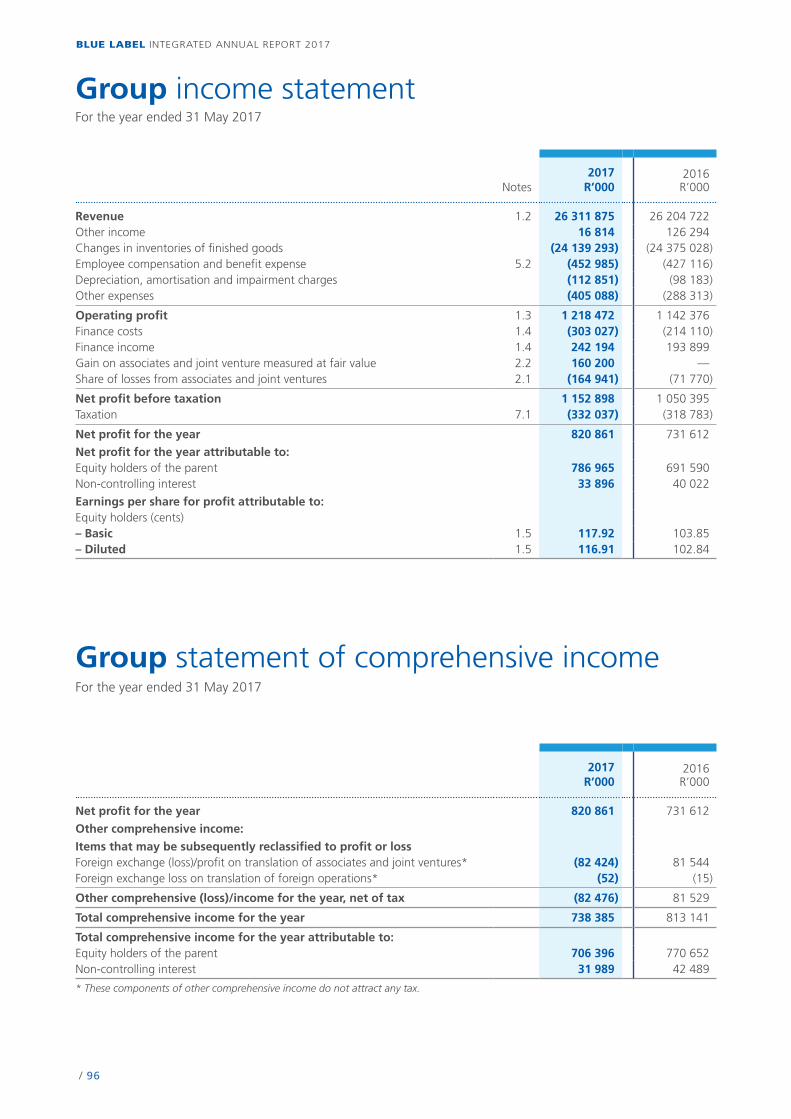
/ 96
BLUE LABEL INTEGRATED ANNUAL REPORT 2017
Group income statement
2017R’000
2016R’000
Net profit for the year 820 861 731 612
Other comprehensive income:
Items that may be subsequently reclassified to profit or lossForeign exchange (loss)/profit on translation of associates and joint ventures* (82 424) 81 544Foreign exchange loss on translation of foreign operations* (52) (15)
Other comprehensive (loss)/income for the year, net of tax (82 476) 81 529
Total comprehensive income for the year 738 385 813 141
Total comprehensive income for the year attributable to:Equity holders of the parent 706 396 770 652Non-controlling interest 31 989 42 489
* These components of other comprehensive income do not attract any tax.
Notes2017
R’0002016
R’000
Revenue 1.2 26 311 875 26 204 722Other income 16 814 126 294Changes in inventories of finished goods (24 139 293) (24 375 028)Employee compensation and benefit expense 5.2 (452 985) (427 116)Depreciation, amortisation and impairment charges (112 851) (98 183)Other expenses (405 088) (288 313)
Operating profit 1.3 1 218 472 1 142 376Finance costs 1.4 (303 027) (214 110)Finance income 1.4 242 194 193 899Gain on associates and joint venture measured at fair value 2.2 160 200 —Share of losses from associates and joint ventures 2.1 (164 941) (71 770)
Net profit before taxation 1 152 898 1 050 395Taxation 7.1 (332 037) (318 783)
Net profit for the year 820 861 731 612
Net profit for the year attributable to:Equity holders of the parent 786 965 691 590Non-controlling interest 33 896 40 022
Earnings per share for profit attributable to:Equity holders (cents)– Basic 1.5 117.92 103.85– Diluted 1.5 116.91 102.84
For the year ended 31 May 2017
Group statement of comprehensive income
For the year ended 31 May 2017
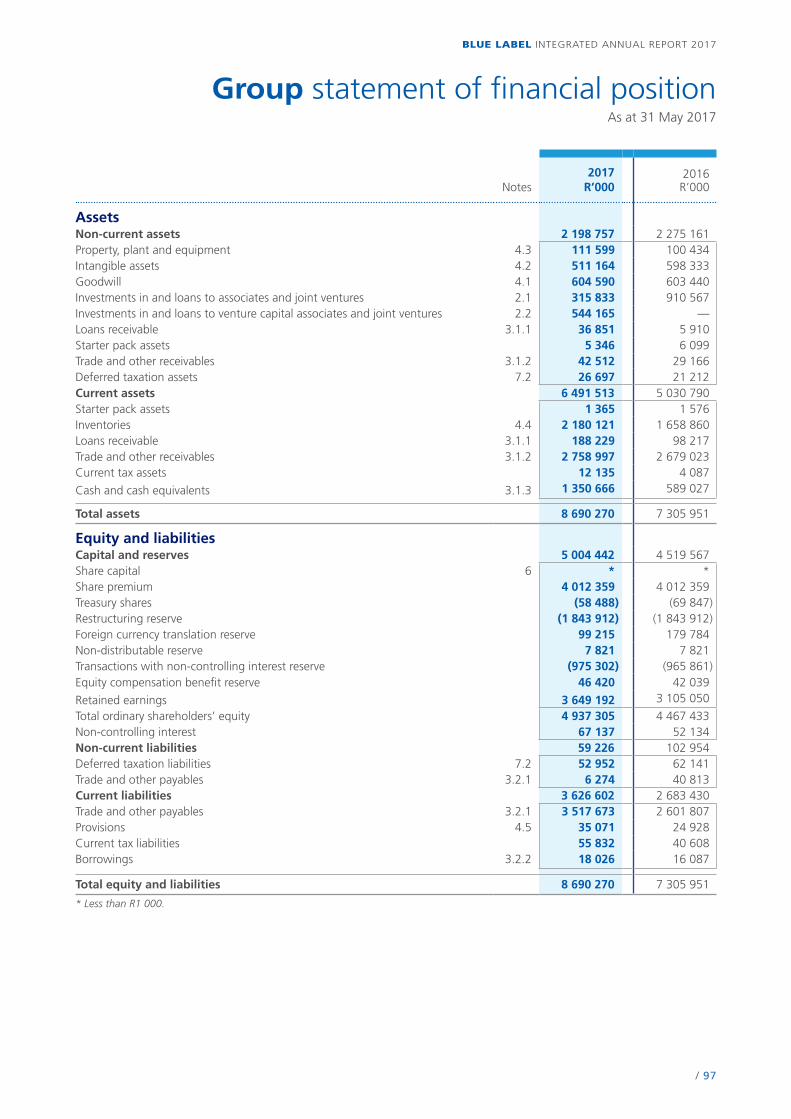
/ 97
BLUE LABEL INTEGRATED ANNUAL REPORT 2017
Group statement of financial position
Notes2017
R’0002016
R’000
AssetsNon-current assets 2 198 757 2 275 161Property, plant and equipment 4.3 111 599 100 434Intangible assets 4.2 511 164 598 333Goodwill 4.1 604 590 603 440Investments in and loans to associates and joint ventures 2.1 315 833 910 567Investments in and loans to venture capital associates and joint ventures 2.2 544 165 —Loans receivable 3.1.1 36 851 5 910Starter pack assets 5 346 6 099Trade and other receivables 3.1.2 42 512 29 166Deferred taxation assets 7.2 26 697 21 212Current assets 6 491 513 5 030 790Starter pack assets 1 365 1 576Inventories 4.4 2 180 121 1 658 860Loans receivable 3.1.1 188 229 98 217Trade and other receivables 3.1.2 2 758 997 2 679 023Current tax assets 12 135 4 087
Cash and cash equivalents 3.1.3 1 350 666 589 027
Total assets 8 690 270 7 305 951
Equity and liabilitiesCapital and reserves 5 004 442 4 519 567Share capital 6 * *Share premium 4 012 359 4 012 359Treasury shares (58 488) (69 847)Restructuring reserve (1 843 912) (1 843 912)Foreign currency translation reserve 99 215 179 784Non-distributable reserve 7 821 7 821Transactions with non-controlling interest reserve (975 302) (965 861)Equity compensation benefit reserve 46 420 42 039
Retained earnings 3 649 192 3 105 050
Total ordinary shareholders’ equity 4 937 305 4 467 433Non-controlling interest 67 137 52 134Non-current liabilities 59 226 102 954Deferred taxation liabilities 7.2 52 952 62 141Trade and other payables 3.2.1 6 274 40 813Current liabilities 3 626 602 2 683 430Trade and other payables 3.2.1 3 517 673 2 601 807Provisions 4.5 35 071 24 928Current tax liabilities 55 832 40 608Borrowings 3.2.2 18 026 16 087
Total equity and liabilities 8 690 270 7 305 951
* Less than R1 000.
As at 31 May 2017
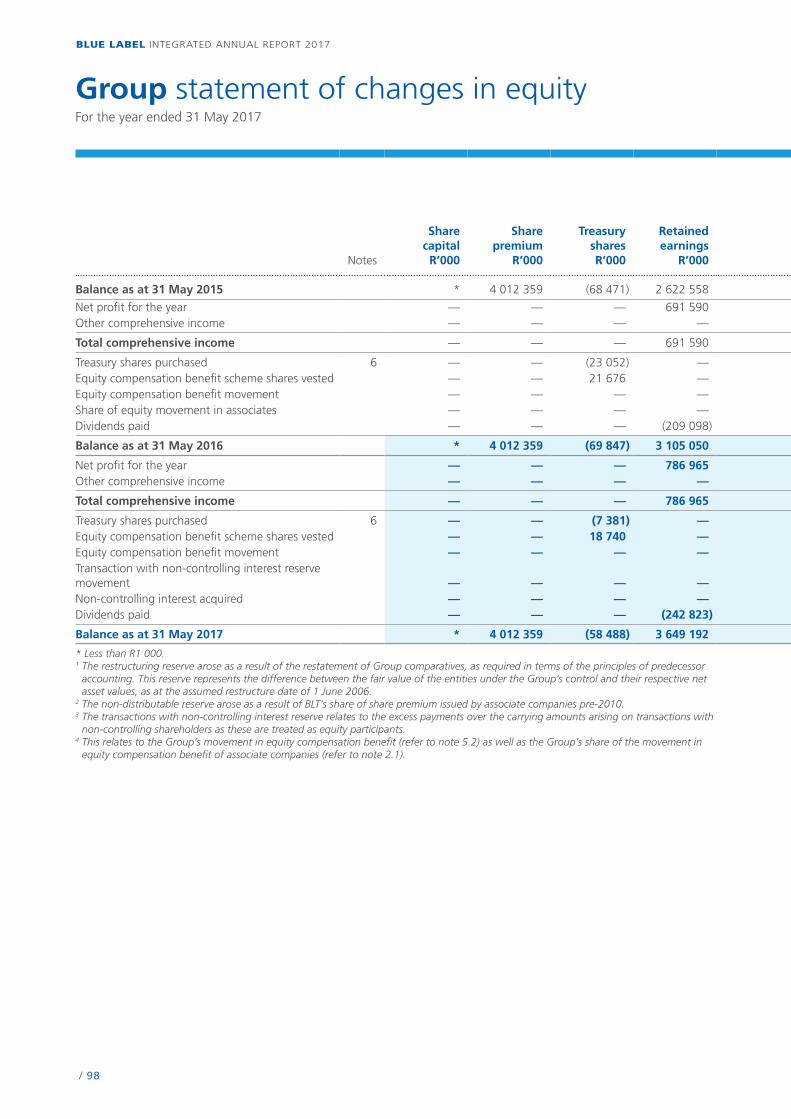
/ 98
BLUE LABEL INTEGRATED ANNUAL REPORT 2017
Group statement of changes in equity
Notes
SharecapitalR’000
Sharepremium
R’000
TreasurysharesR’000
Retainedearnings
R’000
Restruc-turing
reserve1
R’000
Foreigncurrency
translationreserve
R’000
Non-distributable
reserve2
R’000
Transactionswithnon-
controllinginterestreserve3
R’000
Equitycompen-
sationbenefitreserve4
R’000
Totalordinary
share-holders’
equityR’000
Non-controlling
interestR’000
TotalequityR’000
Balance as at 31 May 2015 * 4 012 359 (68 471) 2 622 558 (1 843 912) 100 722 7 821 (965 861) 39 297 3 904 513 13 468 3 917 981
Net profit for the year — — — 691 590 — — — — — 691 590 40 022 731 612Other comprehensive income — — — — — 79 062 — — — 79 062 2 467 81 529
Total comprehensive income — — — 691 590 — 79 062 — — — 770 652 42 489 813 141
Treasury shares purchased 6 — — (23 052) — — — — — — (23 052) — (23 052)Equity compensation benefit scheme shares vested — — 21 676 — — — — — (21 429) 247 (247) —Equity compensation benefit movement — — — — — — — — 23 421 23 421 424 23 845Share of equity movement in associates — — — — — — — — 750 750 — 750Dividends paid — — — (209 098) — — — — — (209 098) (4 000) (213 098)
Balance as at 31 May 2016 * 4 012 359 (69 847) 3 105 050 (1 843 912) 179 784 7 821 (965 861) 42 039 4 467 433 52 134 4 519 567
Net profit for the year — — — 786 965 — — — — — 786 965 33 896 820 861Other comprehensive income — — — — — (80 569) — — — (80 569) (1 907) (82 476)
Total comprehensive income — — — 786 965 — (80 569) — — — 706 396 31 989 738 385
Treasury shares purchased 6 — — (7 381) — — — — — — (7 381) — (7 381)Equity compensation benefit scheme shares vested — — 18 740 — — — — — (18 486) 254 (254) —Equity compensation benefit movement — — — — — — — — 22 867 22 867 550 23 417Transaction with non-controlling interest reserve movement — — — — — — — (9 441) — (9 441) 9 441 —Non-controlling interest acquired — — — — — — — — — — 65 65Dividends paid — — — (242 823) — — — — — (242 823) (26 788) (269 611)
Balance as at 31 May 2017 * 4 012 359 (58 488) 3 649 192 (1 843 912) 99 215 7 821 (975 302) 46 420 4 937 305 67 137 5 004 442
* Less than R1 000.1 The restructuring reserve arose as a result of the restatement of Group comparatives, as required in terms of the principles of predecessor
accounting. This reserve represents the difference between the fair value of the entities under the Group’s control and their respective net asset values, as at the assumed restructure date of 1 June 2006.
2 The non-distributable reserve arose as a result of BLT’s share of share premium issued by associate companies pre-2010.3 The transactions with non-controlling interest reserve relates to the excess payments over the carrying amounts arising on transactions with
non-controlling shareholders as these are treated as equity participants.4 This relates to the Group’s movement in equity compensation benefit (refer to note 5.2) as well as the Group’s share of the movement in
equity compensation benefit of associate companies (refer to note 2.1).
For the year ended 31 May 2017
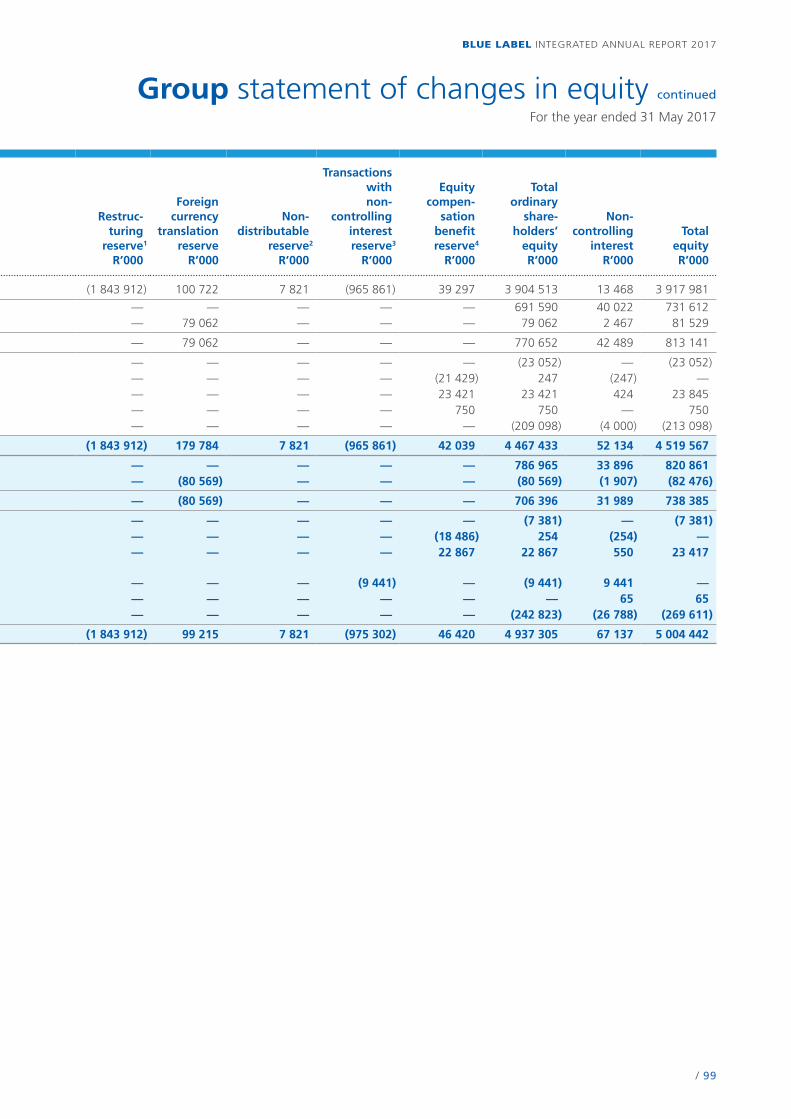
/ 99
BLUE LABEL INTEGRATED ANNUAL REPORT 2017
Group statement of changes in equity continued
Notes
SharecapitalR’000
Sharepremium
R’000
TreasurysharesR’000
Retainedearnings
R’000
Restruc-turing
reserve1
R’000
Foreigncurrency
translationreserve
R’000
Non-distributable
reserve2
R’000
Transactionswithnon-
controllinginterestreserve3
R’000
Equitycompen-
sationbenefitreserve4
R’000
Totalordinary
share-holders’
equityR’000
Non-controlling
interestR’000
TotalequityR’000
Balance as at 31 May 2015 * 4 012 359 (68 471) 2 622 558 (1 843 912) 100 722 7 821 (965 861) 39 297 3 904 513 13 468 3 917 981
Net profit for the year — — — 691 590 — — — — — 691 590 40 022 731 612Other comprehensive income — — — — — 79 062 — — — 79 062 2 467 81 529
Total comprehensive income — — — 691 590 — 79 062 — — — 770 652 42 489 813 141
Treasury shares purchased 6 — — (23 052) — — — — — — (23 052) — (23 052)Equity compensation benefit scheme shares vested — — 21 676 — — — — — (21 429) 247 (247) —Equity compensation benefit movement — — — — — — — — 23 421 23 421 424 23 845Share of equity movement in associates — — — — — — — — 750 750 — 750Dividends paid — — — (209 098) — — — — — (209 098) (4 000) (213 098)
Balance as at 31 May 2016 * 4 012 359 (69 847) 3 105 050 (1 843 912) 179 784 7 821 (965 861) 42 039 4 467 433 52 134 4 519 567
Net profit for the year — — — 786 965 — — — — — 786 965 33 896 820 861Other comprehensive income — — — — — (80 569) — — — (80 569) (1 907) (82 476)
Total comprehensive income — — — 786 965 — (80 569) — — — 706 396 31 989 738 385
Treasury shares purchased 6 — — (7 381) — — — — — — (7 381) — (7 381)Equity compensation benefit scheme shares vested — — 18 740 — — — — — (18 486) 254 (254) —Equity compensation benefit movement — — — — — — — — 22 867 22 867 550 23 417Transaction with non-controlling interest reserve movement — — — — — — — (9 441) — (9 441) 9 441 —Non-controlling interest acquired — — — — — — — — — — 65 65Dividends paid — — — (242 823) — — — — — (242 823) (26 788) (269 611)
Balance as at 31 May 2017 * 4 012 359 (58 488) 3 649 192 (1 843 912) 99 215 7 821 (975 302) 46 420 4 937 305 67 137 5 004 442
* Less than R1 000.1 The restructuring reserve arose as a result of the restatement of Group comparatives, as required in terms of the principles of predecessor
accounting. This reserve represents the difference between the fair value of the entities under the Group’s control and their respective net asset values, as at the assumed restructure date of 1 June 2006.
2 The non-distributable reserve arose as a result of BLT’s share of share premium issued by associate companies pre-2010.3 The transactions with non-controlling interest reserve relates to the excess payments over the carrying amounts arising on transactions with
non-controlling shareholders as these are treated as equity participants.4 This relates to the Group’s movement in equity compensation benefit (refer to note 5.2) as well as the Group’s share of the movement in
equity compensation benefit of associate companies (refer to note 2.1).
For the year ended 31 May 2017
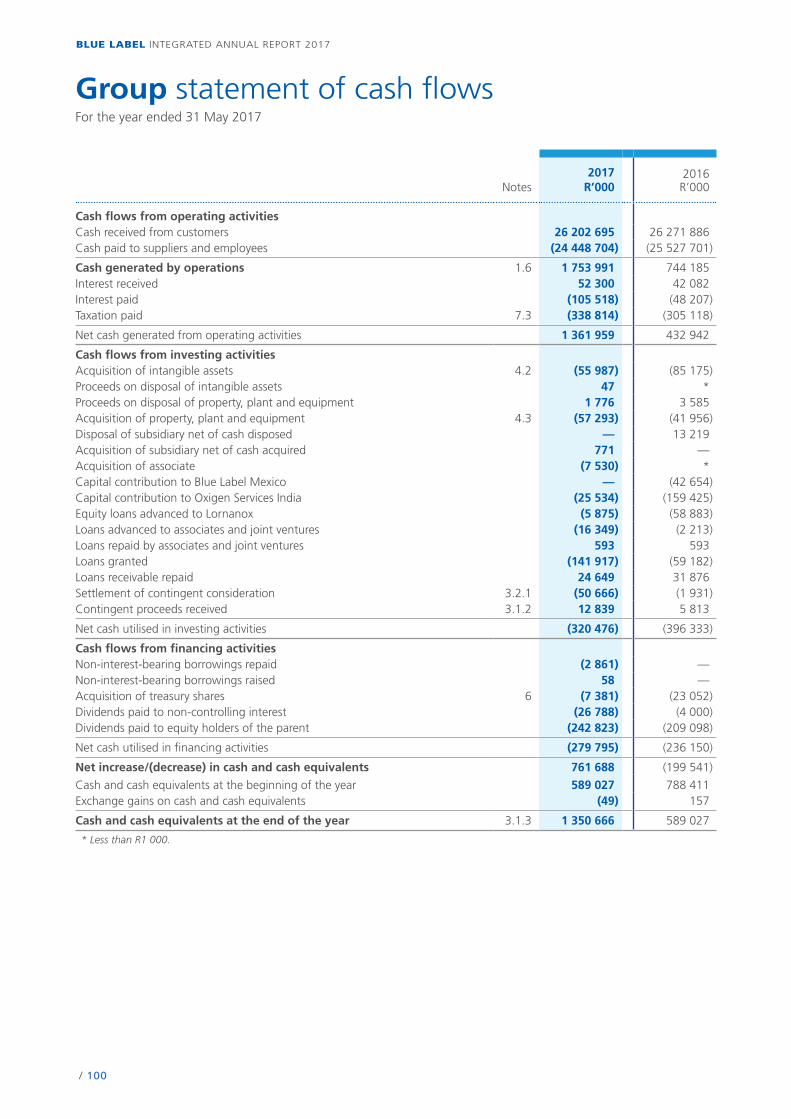
/ 100
BLUE LABEL INTEGRATED ANNUAL REPORT 2017
Notes2017
R’0002016
R’000
Cash flows from operating activitiesCash received from customers 26 202 695 26 271 886Cash paid to suppliers and employees (24 448 704) (25 527 701)
Cash generated by operations 1.6 1 753 991 744 185Interest received 52 300 42 082Interest paid (105 518) (48 207)Taxation paid 7.3 (338 814) (305 118)
Net cash generated from operating activities 1 361 959 432 942
Cash flows from investing activitiesAcquisition of intangible assets 4.2 (55 987) (85 175)Proceeds on disposal of intangible assets 47 *Proceeds on disposal of property, plant and equipment 1 776 3 585Acquisition of property, plant and equipment 4.3 (57 293) (41 956)Disposal of subsidiary net of cash disposed — 13 219Acquisition of subsidiary net of cash acquired 771 —Acquisition of associate (7 530) *Capital contribution to Blue Label Mexico — (42 654)Capital contribution to Oxigen Services India (25 534) (159 425)Equity loans advanced to Lornanox (5 875) (58 883)Loans advanced to associates and joint ventures (16 349) (2 213)Loans repaid by associates and joint ventures 593 593Loans granted (141 917) (59 182)Loans receivable repaid 24 649 31 876Settlement of contingent consideration 3.2.1 (50 666) (1 931)Contingent proceeds received 3.1.2 12 839 5 813
Net cash utilised in investing activities (320 476) (396 333)
Cash flows from financing activitiesNon-interest-bearing borrowings repaid (2 861) —Non-interest-bearing borrowings raised 58 —Acquisition of treasury shares 6 (7 381) (23 052)Dividends paid to non-controlling interest (26 788) (4 000)Dividends paid to equity holders of the parent (242 823) (209 098)
Net cash utilised in financing activities (279 795) (236 150)
Net increase/(decrease) in cash and cash equivalents 761 688 (199 541)
Cash and cash equivalents at the beginning of the year 589 027 788 411Exchange gains on cash and cash equivalents (49) 157
Cash and cash equivalents at the end of the year 3.1.3 1 350 666 589 027
* Less than R1 000.
Group statement of cash flowsFor the year ended 31 May 2017
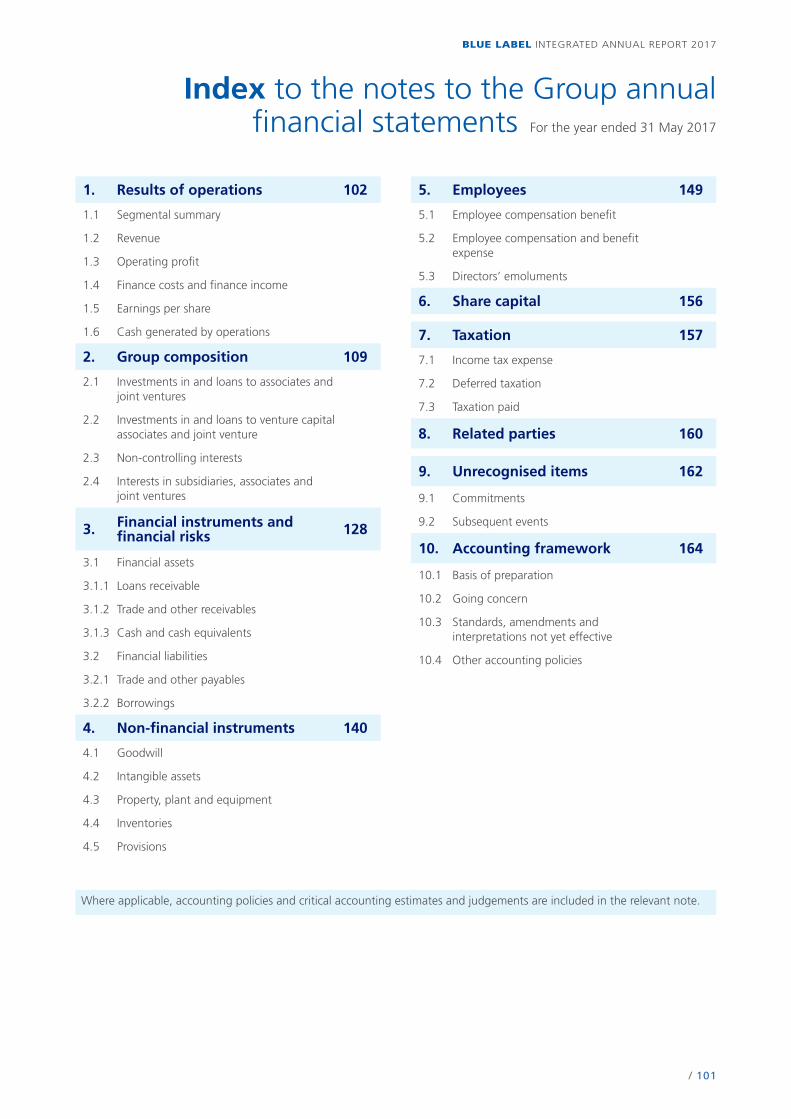
/ 101
BLUE LABEL INTEGRATED ANNUAL REPORT 2017
Index to the notes to the Group annual financial statements For the year ended 31 May 2017
Index to the notes to the Group annual financial statements For the year ended 31 May 2016
1. Results of operations 102
1.1 Segmental summary
1.2 Revenue
1.3 Operating profit
1.4 Finance costs and finance income
1.5 Earnings per share
1.6 Cash generated by operations
2. Group composition 109
2.1 Investments in and loans to associates and joint ventures
2.2 Investments in and loans to venture capital associates and joint venture
2.3 Non-controlling interests
2.4 Interests in subsidiaries, associates and joint ventures
3. Financial instruments and financial risks 128
3.1 Financial assets
3.1.1 Loans receivable
3.1.2 Trade and other receivables
3.1.3 Cash and cash equivalents
3.2 Financial liabilities
3.2.1 Trade and other payables
3.2.2 Borrowings
4. Non-financial instruments 140
4.1 Goodwill
4.2 Intangible assets
4.3 Property, plant and equipment
4.4 Inventories
4.5 Provisions
5. Employees 149
5.1 Employee compensation benefit
5.2 Employee compensation and benefit expense
5.3 Directors’ emoluments
6. Share capital 156
7. Taxation 157
7.1 Income tax expense
7.2 Deferred taxation
7.3 Taxation paid
8. Related parties 160
9. Unrecognised items 162
9.1 Commitments
9.2 Subsequent events
10. Accounting framework 164
10.1 Basis of preparation
10.2 Going concern
10.3 Standards, amendments and interpretations not yet effective
10.4 Other accounting policies
Where applicable, accounting policies and critical accounting estimates and judgements are included in the relevant note.

/ 102
BLUE LABEL INTEGRATED ANNUAL REPORT 2017
Notes to the Group annual financial statements continued
For the year ended 31 May 2017
1. Results of operations1.1 Segmental summary
The Group’s segment reporting follows the organisational structure as reflected in its internal management reporting systems, which are the basis for assessing the financial performance of the business segments and for allocating resources to these segments. Management’s assessment of the Group’s organisational structure takes the geographical location of the segments into account.
Operating segments are reported internally to the chief operating decision-maker in a manner consistent with the financial statements. In addition, the chief operating decision-maker uses core net profit and core headline earnings as non-IFRS measures in evaluating the Group’s performance on a segmental level. The chief operating decision-maker, who is responsible for allocating resources and assessing performance of the operating segments, has been identified as the executive directors, who are responsible for making strategic decisions on behalf of the Group.
Transactions between reportable segments are conducted on similar terms as other transactions of a similar nature.
The segment results for the year ended 31 May are as follows:
Total South Africa Distribution International Mobile Solutions Corporate
2017R’000
2016R’000
2017R’000
2016R’000
2017R’000
2016R’000
2017R’000
2016R’000
2017R’000
2016R’000
2017R’000
2016R’000
Total segment revenue 32 724 069 32 558 421 32 058 672 31 934 736 — — 361 754 307 661 178 286 196 703 125 357 119 321 Internal revenue (6 412 194) (6 353 699) (6 272 276) (6 212 196) — — (13 896) (15 805) (665) (6 377) (125 357) (119 321) Revenue 26 311 875 26 204 722 25 786 396 25 722 540 — — 347 858 291 856 177 621 190 326 — — Segment result Operating profit/(loss) before depreciation, amortisation and impairment charges 1 331 323 1 240 559 1 388 296 1 133 433 (31 792) 44 152 99 101 111 142 34 020 35 889 (158 302) (84 057) Depreciation, amortisation and impairment charges (112 851) (95 615) (92 554) (74 562) — — (14 866) (13 288) (657) (1 521) (4 774) (6 244) Impairment of intangible assets — (2 568) — (1 042) — — — (1 526) — — — — Finance costs (303 027) (214 110) (297 889) (203 713) (507) (1) (1 105) (2 584) (1) — (3 525) (7 812) Finance income 242 194 193 899 211 386 169 198 13 285 10 224 5 523 3 277 1 018 933 10 982 10 267 Gain on associate and joint venture measured at fair value 160 200 — — — 160 200 — — — — — — — Share of (losses)/profits from associates and joint ventures (164 941) (71 770) (5 406) (4 937) (162 218) (70 283) 2 228 2 690 455 760 — — Taxation (332 037) (318 783) (303 040) (258 313) 1 953 (16 062) (25 066) (23 826) (11 361) (14 680) 5 477 (5 902) Net profit/(loss) for the year 820 861 731 612 900 793 760 064 (19 079) (31 970) 65 815 75 885 23 474 21 381 (150 142) (93 748) Reconciliation of net profit for the year to core headline earnings for the year Net profit/(loss) for the year 820 861 731 612 900 793 760 064 (19 079) (31 970) 65 815 75 885 23 474 21 381 (150 142) (93 748) Amortisation of intangibles raised through business combinations net of tax 14 833 17 457 9 775 11 617 1 859 2 641 3 199 3 199 — — — — Core net profit/(loss) for the year* 835 694 749 069 910 568 771 681 (17 220) (29 329) 69 014 79 084 23 474 21 381 (150 142) (93 748) Headline earnings adjustment 362 (23 029) 22 435 339 (29 975) (38) 1 060 — 5 448 39 3 Core headline earnings for the year* 836 056 726 040 910 590 772 116 (16 881) (59 304) 68 976 80 144 23 474 26 829 (150 103) (93 745) Core headline earnings for the year attributable to: Equity holders of parent 801 396 684 911 893 128 751 086 (16 874) (59 327) 56 289 65 333 18 956 21 564 (150 103) (93 745) Non-controlling interest 34 660 41 129 17 462 21 030 (7) 23 12 687 14 811 4 518 5 265 — — Non-cash items Net (loss)/profit on sale of subsidiaries — (3 885) — — — — — — — (3 885) — — Net profit on disposal of associates — — — — — — — — — — — — Discounting of receivables 163 069 129 633 163 069 129 633 — — — — — — — — Discounting of payables (197 509) (165 903) (197 509) (165 903) — — — — — — — — The segment assets and liabilities at 31 May are as follows: Assets excluding investments in and loans to associates and joint ventures 7 830 272 6 395 384 7 113 582 5 725 082 22 959 16 608 545 379 489 351 137 834 135 841 10 518 28 502 Investments in and loans to associates and joint ventures 315 833 910 567 87 945 62 649 176 406 792 488 48 216 54 210 3 266 1 220 — — Investments in and loans to venture capital associates and joint venture 544 165 — — — 544 165 — — — — — — —Total assets 8 690 270 7 305 951 7 201 527 5 787 731 743 530 809 096 593 595 543 561 141 100 137 061 10 518 28 502 Additions to non-current assets Property, plant and equipment 57 655 41 956 51 074 37 706 — — 4 494 2 469 38 928 2 049 853 Intangible assets and goodwill 57 137 85 175 52 138 53 562 — — 4 983 31 198 — 407 16 8 Investment in associates 21 306 210 416 21 306 — — 210 416 — — — — — — Total liabilities (3 685 828) (2 786 387) (3 446 376) (2 482 650) (26 155) (35 974) (119 998) (120 457) (11 281) (17 101) (82 018) (130 205)
The Company is domiciled in the Republic of South Africa. The result of its revenue from external customers in South Africa is R26.294 billion (2016: R26.188 billion), and the total revenue from external customers from other countries is R17.7 million (2016: R16.9 million).
The total non-current assets other than financial instruments and deferred tax assets located in South Africa is R1.372 billion (2016: R1.426 billion), and the total non-current assets located in other countries is R721 million (2016: R792 million).
The South African Distribution segment includes revenues of R7.737 billion and R4.901 billion earned from two external customers.
* Core net profit and core headline earningsCore net profit and core headline earnings are non-IFRS measures used by the Group in evaluating the Group’s performance. These supplement the IFRS measures. Core net profit is calculated by adjusting net profit for the year with the amortisation of intangible assets net of deferred taxation and non-controlling interests that arise as a consequence of the purchase price allocations completed in terms of IFRS 3 – Business Combinations. Core headline earnings is calculated by adjusting core net profit with the headline earnings adjustments required by SAICA circular 2/2015.
Reconciliation of core net profit and core headline earnings to relevant IFRS measures are presented in note 1.5.
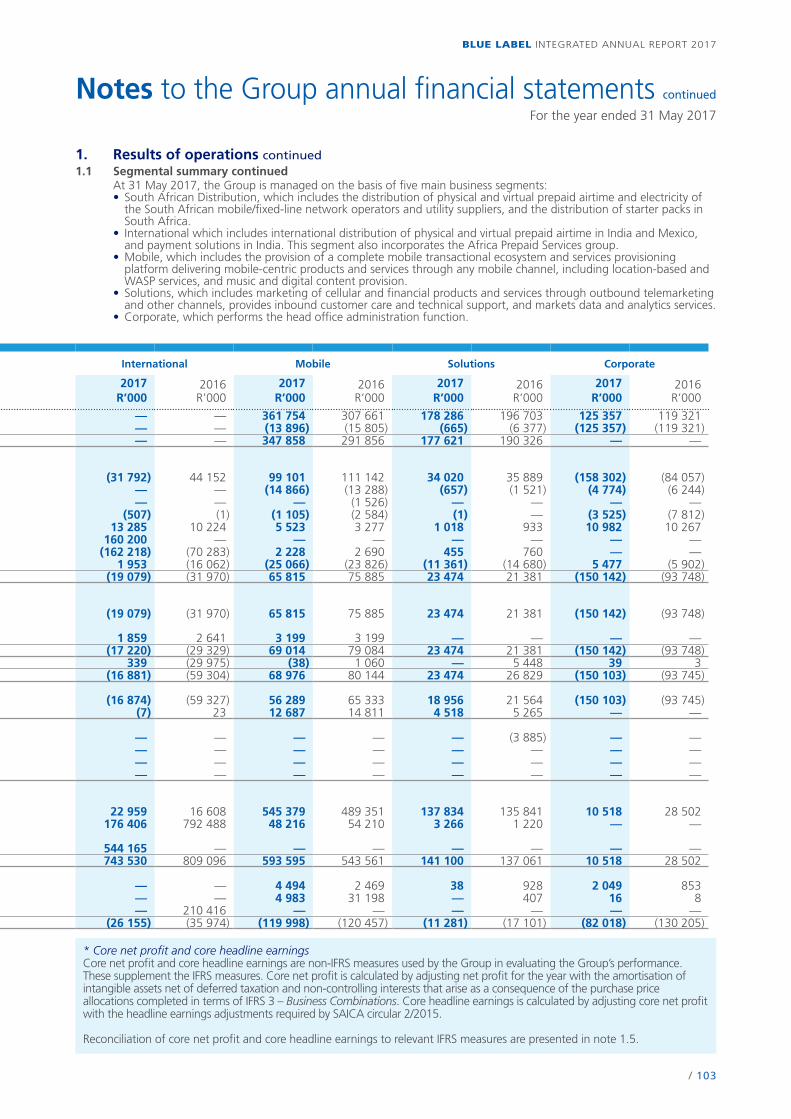
/ 103
BLUE LABEL INTEGRATED ANNUAL REPORT 2017
Notes to the Group annual financial statements continued
For the year ended 31 May 2017
1. Results of operations continued1.1 Segmental summary continued
At 31 May 2017, the Group is managed on the basis of five main business segments:• South African Distribution, which includes the distribution of physical and virtual prepaid airtime and electricity of
the South African mobile/fixed-line network operators and utility suppliers, and the distribution of starter packs in South Africa.
• International which includes international distribution of physical and virtual prepaid airtime in India and Mexico, and payment solutions in India. This segment also incorporates the Africa Prepaid Services group.
•Mobile, which includes the provision of a complete mobile transactional ecosystem and services provisioning platform delivering mobile-centric products and services through any mobile channel, including location-based and WASP services, and music and digital content provision.
• Solutions, which includes marketing of cellular and financial products and services through outbound telemarketing and other channels, provides inbound customer care and technical support, and markets data and analytics services.
•Corporate, which performs the head office administration function.The segment results for the year ended 31 May are as follows:
Total South Africa Distribution International Mobile Solutions Corporate
2017R’000
2016R’000
2017R’000
2016R’000
2017R’000
2016R’000
2017R’000
2016R’000
2017R’000
2016R’000
2017R’000
2016R’000
Total segment revenue 32 724 069 32 558 421 32 058 672 31 934 736 — — 361 754 307 661 178 286 196 703 125 357 119 321 Internal revenue (6 412 194) (6 353 699) (6 272 276) (6 212 196) — — (13 896) (15 805) (665) (6 377) (125 357) (119 321) Revenue 26 311 875 26 204 722 25 786 396 25 722 540 — — 347 858 291 856 177 621 190 326 — — Segment result Operating profit/(loss) before depreciation, amortisation and impairment charges 1 331 323 1 240 559 1 388 296 1 133 433 (31 792) 44 152 99 101 111 142 34 020 35 889 (158 302) (84 057) Depreciation, amortisation and impairment charges (112 851) (95 615) (92 554) (74 562) — — (14 866) (13 288) (657) (1 521) (4 774) (6 244) Impairment of intangible assets — (2 568) — (1 042) — — — (1 526) — — — — Finance costs (303 027) (214 110) (297 889) (203 713) (507) (1) (1 105) (2 584) (1) — (3 525) (7 812) Finance income 242 194 193 899 211 386 169 198 13 285 10 224 5 523 3 277 1 018 933 10 982 10 267 Gain on associate and joint venture measured at fair value 160 200 — — — 160 200 — — — — — — — Share of (losses)/profits from associates and joint ventures (164 941) (71 770) (5 406) (4 937) (162 218) (70 283) 2 228 2 690 455 760 — — Taxation (332 037) (318 783) (303 040) (258 313) 1 953 (16 062) (25 066) (23 826) (11 361) (14 680) 5 477 (5 902) Net profit/(loss) for the year 820 861 731 612 900 793 760 064 (19 079) (31 970) 65 815 75 885 23 474 21 381 (150 142) (93 748) Reconciliation of net profit for the year to core headline earnings for the year Net profit/(loss) for the year 820 861 731 612 900 793 760 064 (19 079) (31 970) 65 815 75 885 23 474 21 381 (150 142) (93 748) Amortisation of intangibles raised through business combinations net of tax 14 833 17 457 9 775 11 617 1 859 2 641 3 199 3 199 — — — — Core net profit/(loss) for the year* 835 694 749 069 910 568 771 681 (17 220) (29 329) 69 014 79 084 23 474 21 381 (150 142) (93 748) Headline earnings adjustment 362 (23 029) 22 435 339 (29 975) (38) 1 060 — 5 448 39 3 Core headline earnings for the year* 836 056 726 040 910 590 772 116 (16 881) (59 304) 68 976 80 144 23 474 26 829 (150 103) (93 745) Core headline earnings for the year attributable to: Equity holders of parent 801 396 684 911 893 128 751 086 (16 874) (59 327) 56 289 65 333 18 956 21 564 (150 103) (93 745) Non-controlling interest 34 660 41 129 17 462 21 030 (7) 23 12 687 14 811 4 518 5 265 — — Non-cash items Net (loss)/profit on sale of subsidiaries — (3 885) — — — — — — — (3 885) — — Net profit on disposal of associates — — — — — — — — — — — — Discounting of receivables 163 069 129 633 163 069 129 633 — — — — — — — — Discounting of payables (197 509) (165 903) (197 509) (165 903) — — — — — — — — The segment assets and liabilities at 31 May are as follows: Assets excluding investments in and loans to associates and joint ventures 7 830 272 6 395 384 7 113 582 5 725 082 22 959 16 608 545 379 489 351 137 834 135 841 10 518 28 502 Investments in and loans to associates and joint ventures 315 833 910 567 87 945 62 649 176 406 792 488 48 216 54 210 3 266 1 220 — — Investments in and loans to venture capital associates and joint venture 544 165 — — — 544 165 — — — — — — —Total assets 8 690 270 7 305 951 7 201 527 5 787 731 743 530 809 096 593 595 543 561 141 100 137 061 10 518 28 502 Additions to non-current assets Property, plant and equipment 57 655 41 956 51 074 37 706 — — 4 494 2 469 38 928 2 049 853 Intangible assets and goodwill 57 137 85 175 52 138 53 562 — — 4 983 31 198 — 407 16 8 Investment in associates 21 306 210 416 21 306 — — 210 416 — — — — — — Total liabilities (3 685 828) (2 786 387) (3 446 376) (2 482 650) (26 155) (35 974) (119 998) (120 457) (11 281) (17 101) (82 018) (130 205)
The Company is domiciled in the Republic of South Africa. The result of its revenue from external customers in South Africa is R26.294 billion (2016: R26.188 billion), and the total revenue from external customers from other countries is R17.7 million (2016: R16.9 million).
The total non-current assets other than financial instruments and deferred tax assets located in South Africa is R1.372 billion (2016: R1.426 billion), and the total non-current assets located in other countries is R721 million (2016: R792 million).
The South African Distribution segment includes revenues of R7.737 billion and R4.901 billion earned from two external customers.
* Core net profit and core headline earningsCore net profit and core headline earnings are non-IFRS measures used by the Group in evaluating the Group’s performance. These supplement the IFRS measures. Core net profit is calculated by adjusting net profit for the year with the amortisation of intangible assets net of deferred taxation and non-controlling interests that arise as a consequence of the purchase price allocations completed in terms of IFRS 3 – Business Combinations. Core headline earnings is calculated by adjusting core net profit with the headline earnings adjustments required by SAICA circular 2/2015.
Reconciliation of core net profit and core headline earnings to relevant IFRS measures are presented in note 1.5.
/ 104
BLUE LABEL INTEGRATED ANNUAL REPORT 2017
Notes to the Group annual financial statements continued
For the year ended 31 May 2017
1. Results of operations continued1.2 Revenue
Revenue recognitionRevenue comprises the fair value of the consideration received or receivable for the sale of goods and services in the ordinary course of the Group’s activities. Revenue is shown net of indirect taxes, estimated returns, rebates and discounts, and after eliminated sales within the Group.
Revenue from the sale of goods is recognised when: • the Group has transferred to the customer the risks and rewards of ownership of the goods; and• the Group retains neither continuing managerial involvement to the degree usually associated with ownership nor
effective control over the goods sold; and• the amount of revenue, and associated costs incurred or to be incurred, can be measured reliably; and• it is probable that the economic benefits associated with a transaction will flow to the Group.
Revenue from the rendering of a service is recognised when:• the amount of revenue, and associated costs incurred or to be incurred, can be measured reliably; and • it is probable that the economic benefits associated with a transaction will flow to the Group; and• the stage of completion of the transaction at the end of the reporting period can be measured reliably.
The main categories of revenue are as follows:(a) Prepaid airtime, data and related revenueSales of prepaid airtime and data are recognised when the Group sells airtime and data to the customer. Incentives relating to these sales, based on contractual criteria, are recognised only once the associated criteria have been met. For this category of revenue the Group will act as either a principal or an agent.
(b) Postpaid airtime, data and related revenueSales of postpaid airtime and data are recognised on airtime and data contracted to be delivered to customers for a period of time and billed on a monthly basis in arrears. Incentives relating to these sales, based on contractual criteria, are recognised only once the associated criteria have been met. For this category of revenue the Group will act as either a principal or an agent.
(c) Prepaid and postpaid SIM cardsRevenue is recognised when a SIM card is initially sold to the customer. Activation bonuses received from the networks are recognised when the SIM card is activated on the relevant cellular network. Ongoing revenue and other incentives are recognised once the associated contractual criteria have been met. The point of activation is determined by the relevant cellular networks. For this category of revenue the Group acts as a principal.
(d) Sales of servicesSales of services are recognised in the accounting period in which the services are rendered, by reference to completion of the specific transaction assessed on the basis of the actual service provided as a proportion of the total services to be provided. These services include location-based services, SMS transaction services, media, call centre and data transaction revenue, and technology revenue. For this category of revenue the Group will act as either a principal or an agent.
(e) Electricity commissionCommissions on the sale of prepaid electricity are recognised when the Group sells electricity to the customer on behalf of the utility suppliers. Commissions are recorded based on agreed rates per the contracts. For this category of revenue the Group acts as an agent.
(f) Sales of handsets, tablets and other devicesRevenue is recognised when the handset, tablet or device is sold to the customer. For this category of revenue the Group acts as a principal.
Critical accounting estimates and assumptionsSignificant judgements are made by management when concluding whether the Group is transacting as an agent or a principal. The assessment is performed for each separate revenue stream in the Group. The assessment requires an analysis of key indicators, specifically whether the Group:• carries any inventory risk; • has the primary responsibility for providing the goods or services to the customer;• has the latitude to establish pricing; and• bears the customer’s credit risk.
These indicators are used to determine whether the Group has exposure to the significant risks and rewards associated with the sale of goods or rendering of services. For example, any sale relating to inventory that is held by the Group, not on consignment, is a strong indicator that the Group is acting as a principal.
Where the Group acts in its capacity as principal for the sale of goods or the rendering of services, as it does in the sale of physical prepaid airtime and the sale of handsets, revenue is recognised as the fair value of the consideration receivable net of discounts and taxes. Where the Group acts in its capacity as an agent, as it does in the sale of electricity and PINless airtime, the amount of revenue recorded is the fair value of commission received or receivable.
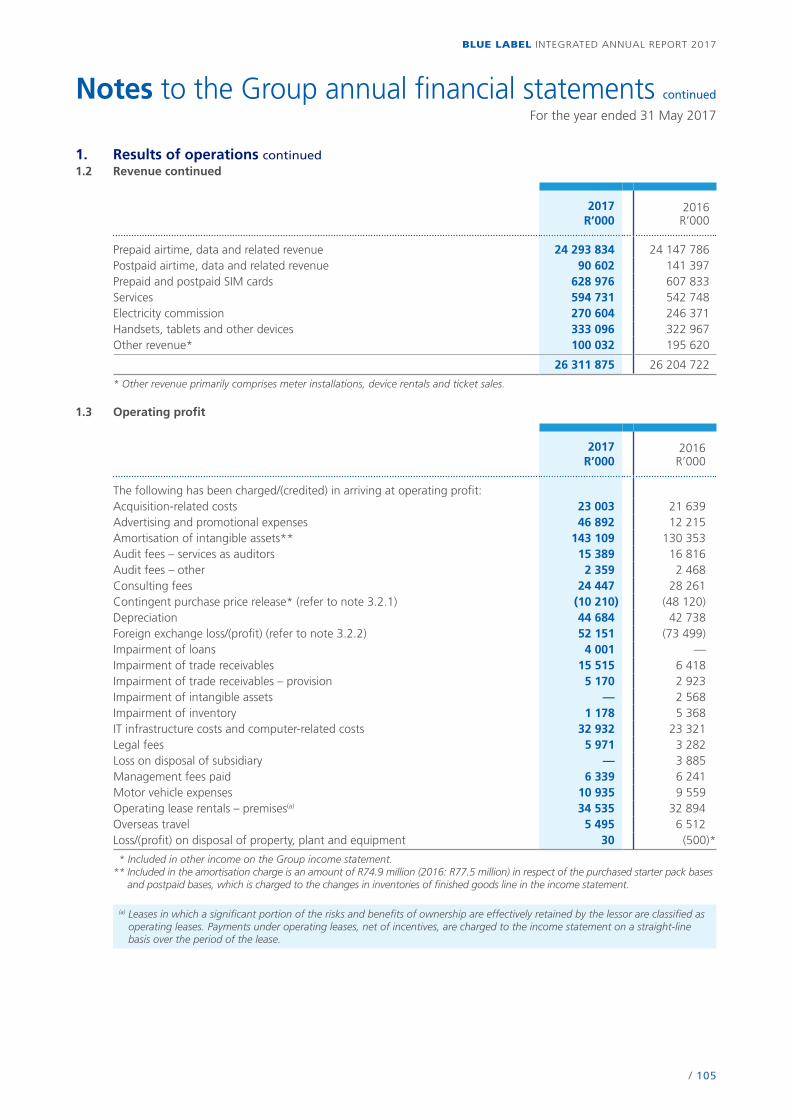
/ 105
BLUE LABEL INTEGRATED ANNUAL REPORT 2017
Notes to the Group annual financial statements continued
For the year ended 31 May 2017
1. Results of operations continued1.2 Revenue
Revenue recognitionRevenue comprises the fair value of the consideration received or receivable for the sale of goods and services in the ordinary course of the Group’s activities. Revenue is shown net of indirect taxes, estimated returns, rebates and discounts, and after eliminated sales within the Group.
Revenue from the sale of goods is recognised when: • the Group has transferred to the customer the risks and rewards of ownership of the goods; and• the Group retains neither continuing managerial involvement to the degree usually associated with ownership nor
effective control over the goods sold; and• the amount of revenue, and associated costs incurred or to be incurred, can be measured reliably; and• it is probable that the economic benefits associated with a transaction will flow to the Group.
Revenue from the rendering of a service is recognised when:• the amount of revenue, and associated costs incurred or to be incurred, can be measured reliably; and • it is probable that the economic benefits associated with a transaction will flow to the Group; and• the stage of completion of the transaction at the end of the reporting period can be measured reliably.
The main categories of revenue are as follows:(a) Prepaid airtime, data and related revenueSales of prepaid airtime and data are recognised when the Group sells airtime and data to the customer. Incentives relating to these sales, based on contractual criteria, are recognised only once the associated criteria have been met. For this category of revenue the Group will act as either a principal or an agent.
(b) Postpaid airtime, data and related revenueSales of postpaid airtime and data are recognised on airtime and data contracted to be delivered to customers for a period of time and billed on a monthly basis in arrears. Incentives relating to these sales, based on contractual criteria, are recognised only once the associated criteria have been met. For this category of revenue the Group will act as either a principal or an agent.
(c) Prepaid and postpaid SIM cardsRevenue is recognised when a SIM card is initially sold to the customer. Activation bonuses received from the networks are recognised when the SIM card is activated on the relevant cellular network. Ongoing revenue and other incentives are recognised once the associated contractual criteria have been met. The point of activation is determined by the relevant cellular networks. For this category of revenue the Group acts as a principal.
(d) Sales of servicesSales of services are recognised in the accounting period in which the services are rendered, by reference to completion of the specific transaction assessed on the basis of the actual service provided as a proportion of the total services to be provided. These services include location-based services, SMS transaction services, media, call centre and data transaction revenue, and technology revenue. For this category of revenue the Group will act as either a principal or an agent.
(e) Electricity commissionCommissions on the sale of prepaid electricity are recognised when the Group sells electricity to the customer on behalf of the utility suppliers. Commissions are recorded based on agreed rates per the contracts. For this category of revenue the Group acts as an agent.
(f) Sales of handsets, tablets and other devicesRevenue is recognised when the handset, tablet or device is sold to the customer. For this category of revenue the Group acts as a principal.
Critical accounting estimates and assumptionsSignificant judgements are made by management when concluding whether the Group is transacting as an agent or a principal. The assessment is performed for each separate revenue stream in the Group. The assessment requires an analysis of key indicators, specifically whether the Group:• carries any inventory risk; • has the primary responsibility for providing the goods or services to the customer;• has the latitude to establish pricing; and• bears the customer’s credit risk.
These indicators are used to determine whether the Group has exposure to the significant risks and rewards associated with the sale of goods or rendering of services. For example, any sale relating to inventory that is held by the Group, not on consignment, is a strong indicator that the Group is acting as a principal.
Where the Group acts in its capacity as principal for the sale of goods or the rendering of services, as it does in the sale of physical prepaid airtime and the sale of handsets, revenue is recognised as the fair value of the consideration receivable net of discounts and taxes. Where the Group acts in its capacity as an agent, as it does in the sale of electricity and PINless airtime, the amount of revenue recorded is the fair value of commission received or receivable.
1. Results of operations continued1.2 Revenue continued
2017R’000
2016R’000
Prepaid airtime, data and related revenue 24 293 834 24 147 786Postpaid airtime, data and related revenue 90 602 141 397Prepaid and postpaid SIM cards 628 976 607 833Services 594 731 542 748Electricity commission 270 604 246 371Handsets, tablets and other devices 333 096 322 967Other revenue* 100 032 195 620
26 311 875 26 204 722
* Other revenue primarily comprises meter installations, device rentals and ticket sales.
1.3 Operating profit
2017R’000
2016R’000
The following has been charged/(credited) in arriving at operating profit:Acquisition-related costs 23 003 21 639 Advertising and promotional expenses 46 892 12 215 Amortisation of intangible assets** 143 109 130 353 Audit fees – services as auditors 15 389 16 816 Audit fees – other 2 359 2 468 Consulting fees 24 447 28 261 Contingent purchase price release* (refer to note 3.2.1) (10 210) (48 120) Depreciation 44 684 42 738 Foreign exchange loss/(profit) (refer to note 3.2.2) 52 151 (73 499) Impairment of loans 4 001 — Impairment of trade receivables 15 515 6 418 Impairment of trade receivables – provision 5 170 2 923 Impairment of intangible assets — 2 568 Impairment of inventory 1 178 5 368 IT infrastructure costs and computer-related costs 32 932 23 321 Legal fees 5 971 3 282 Loss on disposal of subsidiary — 3 885 Management fees paid 6 339 6 241 Motor vehicle expenses 10 935 9 559 Operating lease rentals – premises(a) 34 535 32 894 Overseas travel 5 495 6 512 Loss/(profit) on disposal of property, plant and equipment 30 (500)*
* Included in other income on the Group income statement.** Included in the amortisation charge is an amount of R74.9 million (2016: R77.5 million) in respect of the purchased starter pack bases
and postpaid bases, which is charged to the changes in inventories of finished goods line in the income statement.
(a) Leases in which a significant portion of the risks and benefits of ownership are effectively retained by the lessor are classified as operating leases. Payments under operating leases, net of incentives, are charged to the income statement on a straight-line basis over the period of the lease.

/ 106
BLUE LABEL INTEGRATED ANNUAL REPORT 2017
Notes to the Group annual financial statements continued
For the year ended 31 May 2017
1. Results of operations continued1.4 Finance costs and finance income
Finance costs/income are recognised in profit and loss using the effective interest rate method as the instruments to which this relates are measured at amortised cost.
2017R’000
2016R’000
Finance costs– Bank 29 61– Loans and facilities 97 474 33 851– Unwinding of contingent purchase price 4 621 9 712– Other 3 394 4 583– Discounting of payables 197 509 165 903
303 027 214 110
Finance income– Bank (23 557) (34 002)– Loans (22 444) (4 336)– Related-party loans (refer to note 8) (31 237) (25 351)– Other (1 887) (577)– Discounting of receivables (163 069) (129 633)
(242 194) (193 899)
Net finance costs 60 833 20 211
1.5 Earnings per share
(a) BasicBasic earnings per share are calculated by dividing the profit attributable to equity holders of the Company by the weighted average number of ordinary shares in issue during the year.
(b) HeadlineHeadline earnings are calculated by applying the principles contained in Circular 2/2015 as issued by the South African Institute of Chartered Accountants, as required by JSE Limited.
The weighted average number of ordinary shares used is the same as that used for the basic earnings per share.
(c) Diluted – basic and headlineDiluted earnings per share are calculated by adjusting the number of ordinary shares outstanding to assume conversion of all dilutive potential ordinary shares. The dilutive potential ordinary shares of the Company are the forfeitable shares granted. For this calculation, an adjustment is made for the number of shares that would be issued on vesting under the forfeitable share plan.
(d) Core headlineCore headline earnings per share are calculated by adding back to headline earnings, the amortisation of intangible assets net of deferred taxation and non-controlling interests as a consequence of the purchase price allocations completed in terms of IFRS 3(R) – Business Combinations.
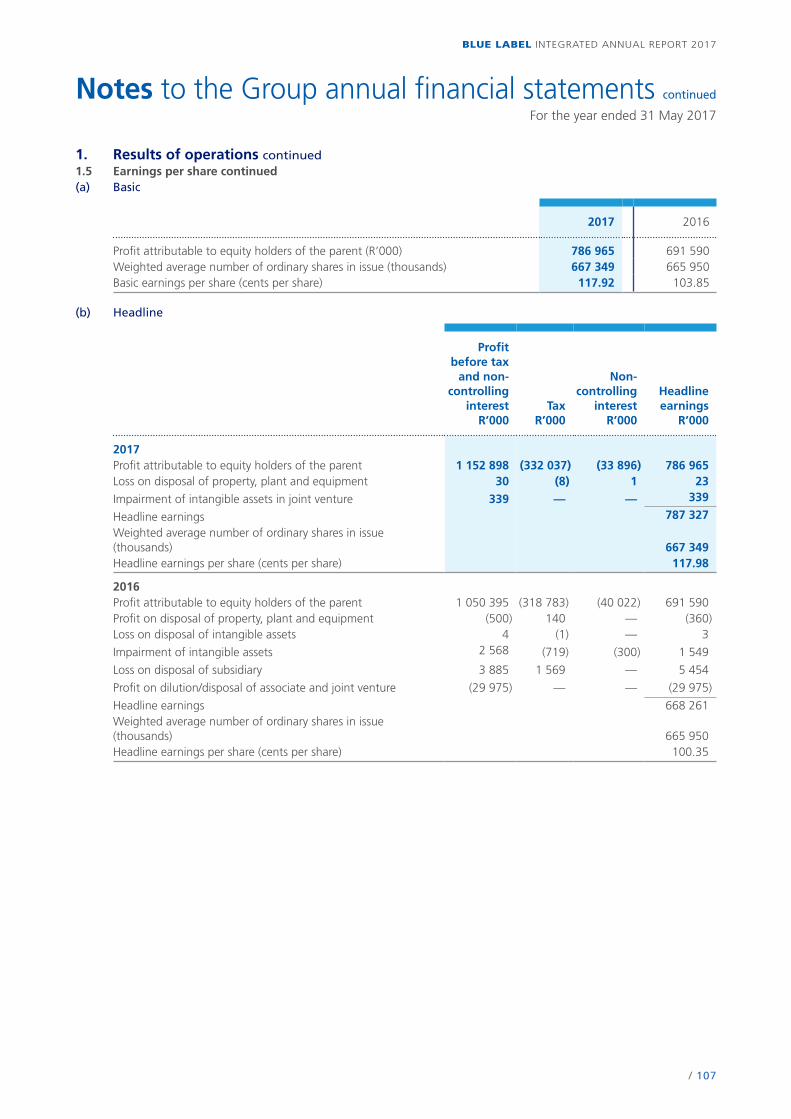
/ 107
BLUE LABEL INTEGRATED ANNUAL REPORT 2017
Notes to the Group annual financial statements continued
For the year ended 31 May 2017
1. Results of operations continued1.5 Earnings per share continued(a) Basic
2017 2016
Profit attributable to equity holders of the parent (R’000) 786 965 691 590Weighted average number of ordinary shares in issue (thousands) 667 349 665 950Basic earnings per share (cents per share) 117.92 103.85
(b) Headline
Profitbefore tax
and non-controlling
interestR’000
TaxR’000
Non-controlling
interestR’000
Headlineearnings
R’000
2017Profit attributable to equity holders of the parent 1 152 898 (332 037) (33 896) 786 965 Loss on disposal of property, plant and equipment 30 (8) 1 23
Impairment of intangible assets in joint venture 339 — — 339
Headline earnings 787 327
Weighted average number of ordinary shares in issue (thousands) 667 349Headline earnings per share (cents per share) 117.98
2016Profit attributable to equity holders of the parent 1 050 395 (318 783) (40 022) 691 590Profit on disposal of property, plant and equipment (500) 140 — (360)Loss on disposal of intangible assets 4 (1) — 3
Impairment of intangible assets 2 568 (719) (300) 1 549
Loss on disposal of subsidiary 3 885 1 569 — 5 454
Profit on dilution/disposal of associate and joint venture (29 975) — — (29 975)
Headline earnings 668 261Weighted average number of ordinary shares in issue (thousands) 665 950Headline earnings per share (cents per share) 100.35
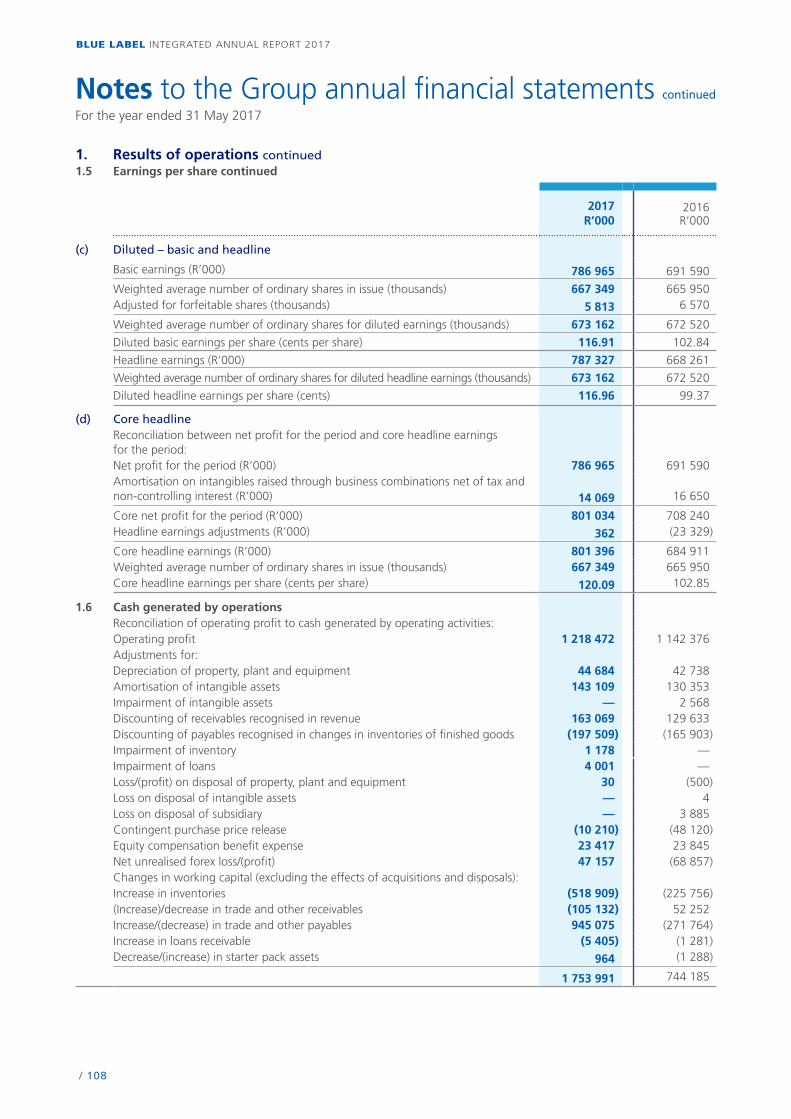
/ 108
BLUE LABEL INTEGRATED ANNUAL REPORT 2017
Notes to the Group annual financial statements continued
For the year ended 31 May 2017
1. Results of operations continued1.5 Earnings per share continued
2017R’000
2016R’000
(c) Diluted – basic and headline
Basic earnings (R’000) 786 965 691 590
Weighted average number of ordinary shares in issue (thousands) 667 349 665 950Adjusted for forfeitable shares (thousands) 5 813 6 570
Weighted average number of ordinary shares for diluted earnings (thousands) 673 162 672 520
Diluted basic earnings per share (cents per share) 116.91 102.84
Headline earnings (R’000) 787 327 668 261
Weighted average number of ordinary shares for diluted headline earnings (thousands) 673 162 672 520
Diluted headline earnings per share (cents) 116.96 99.37
(d) Core headlineReconciliation between net profit for the period and core headline earnings for the period:Net profit for the period (R’000) 786 965 691 590Amortisation on intangibles raised through business combinations net of tax and non-controlling interest (R’000) 14 069 16 650
Core net profit for the period (R’000) 801 034 708 240Headline earnings adjustments (R’000) 362 (23 329)
Core headline earnings (R’000) 801 396 684 911Weighted average number of ordinary shares in issue (thousands) 667 349 665 950Core headline earnings per share (cents per share) 120.09 102.85
1.6 Cash generated by operationsReconciliation of operating profit to cash generated by operating activities:Operating profit 1 218 472 1 142 376Adjustments for:Depreciation of property, plant and equipment 44 684 42 738Amortisation of intangible assets 143 109 130 353Impairment of intangible assets — 2 568Discounting of receivables recognised in revenue 163 069 129 633Discounting of payables recognised in changes in inventories of finished goods (197 509) (165 903)Impairment of inventory 1 178 —Impairment of loans 4 001 —Loss/(profit) on disposal of property, plant and equipment 30 (500)Loss on disposal of intangible assets — 4Loss on disposal of subsidiary — 3 885Contingent purchase price release (10 210) (48 120)Equity compensation benefit expense 23 417 23 845Net unrealised forex loss/(profit) 47 157 (68 857)Changes in working capital (excluding the effects of acquisitions and disposals):Increase in inventories (518 909) (225 756)(Increase)/decrease in trade and other receivables (105 132) 52 252Increase/(decrease) in trade and other payables 945 075 (271 764)Increase in loans receivable (5 405) (1 281)Decrease/(increase) in starter pack assets 964 (1 288)
1 753 991 744 185
/ 109
BLUE LABEL INTEGRATED ANNUAL REPORT 2017
Notes to the Group annual financial statements continued
For the year ended 31 May 2017
2. Group compositionBasis of consolidation
(a) SubsidiariesSubsidiaries are all entities (including structured entities) over which the Group has control. The Group controls an entity when the Group is exposed to, or has rights to, variable returns from its involvement with the entity and has the ability to affect those returns through its power over the entity. Subsidiaries are fully consolidated from the date on which control is transferred to the Group. They are deconsolidated from the date that control ceases.
The Group applies the acquisition method to account for business combinations. The consideration transferred for the acquisition of a subsidiary is the fair value of the assets transferred, the liabilities incurred to the former owners of the acquiree and the equity interests issued by the Group. The consideration transferred includes the fair value of any asset or liability resulting from a contingent consideration arrangement. Identifiable assets acquired and liabilities and contingent liabilities assumed in a business combination are measured initially at their fair values at the acquisition date. The Group recognises any non-controlling interest in the acquiree on an acquisition-by-acquisition basis, either at fair value or at the non-controlling interest’s proportionate share of the recognised amounts of acquiree’s identifiable net assets. If the business combination is achieved in stages, the acquisition date carrying value of the acquirer’s previously held equity interest in the acquiree is remeasured to fair value at the acquisition date; any gains or losses arising from such remeasurement are recognised in profit or loss.
Acquisition-related costs are expensed as incurred.
Any contingent consideration to be transferred is recognised at fair value at the acquisition date. Subsequent changes to the fair value of the contingent consideration that is deemed to be an asset or liability are recognised in profit or loss in other income or other expenses.
The excess of the consideration transferred, the amount of any non-controlling interest in the acquiree and the acquisition date fair value of any previous equity interest in the acquiree over the fair value of the identifiable net assets acquired is recorded as goodwill. If the total consideration transferred, non-controlling interest recognised and previously held interest measured is less than the fair value of the net assets of the subsidiary acquired in the case of a bargain purchase, the difference is recognised directly in the income statement.
Inter-company transactions, balances and unrealised gains on transactions between Group companies are eliminated. Unrealised losses are also eliminated. When necessary, amounts reported by subsidiaries have been adjusted to conform with the Group’s accounting policies.
The Company accounts for investment in subsidiaries at cost, less accumulated impairment losses.
(b) Changes in ownership interests in subsidiaries without change of controlTransactions with non-controlling interests that do not result in loss of control are accounted for as equity transactions, i.e. transactions with the owners in their capacity as owners. The difference between fair value of any consideration paid and the relevant share acquired of the carrying value of net assets of the subsidiary is recorded in equity. Gains or losses on disposals to non-controlling interests are also recorded in equity.
(c) Disposal of subsidiariesWhen the Group ceases to have control, any retained interest in the entity is remeasured to its fair value at the date when control is lost, with the change in carrying amount recognised in profit or loss. The fair value is the initial carrying amount for the purposes of subsequently accounting for the retained interest as an associate, joint venture or financial asset. In addition, any amounts previously recognised in other comprehensive income in respect of that entity are accounted for as if the Group had directly disposed of the related assets or liabilities. This may mean that amounts previously recognised in other comprehensive income are reclassified to profit or loss.
/ 110
BLUE LABEL INTEGRATED ANNUAL REPORT 2017
Notes to the Group annual financial statements continued
For the year ended 31 May 2017
2. Group composition continued
Basis of consolidation continued
(d) Associates and joint venturesInvestments in associates and joint ventures are accounted for using the equity method of accounting. Under the equity method, the investment is initially recognised at cost, and the carrying amount is increased or decreased to recognise the investor’s share of the profit or loss of the investee after the date of acquisition. The Group’s investment in associates and joint ventures includes goodwill identified on acquisition. Loans made to associates and joint ventures that are equity in nature are treated as part of the cost of the investment made.
Associates are all entities over which the Group has significant influence but not control, generally accompanying a shareholding of between 20% and 50% of the voting rights.
Investments in joint arrangements are classified as either joint operations or joint ventures depending on the contractual rights and obligations of each investor. The Group has assessed the nature of its joint arrangements and determined them to be joint ventures.
The Group’s share of post-acquisition profit or loss is recognised in the income statement, and its share of post-acquisition movements in other comprehensive income is recognised in other comprehensive income with a corresponding adjustment to the carrying amount of the investment. The carrying amount of the investment is also adjusted for the Group’s share of post-acquisition movements in other net assets.
The Group determines at each reporting date whether there is any objective evidence that the investment in the associate or joint venture is impaired. If this is the case, the Group calculates the amount of impairment as the difference between the recoverable amount of the associate or joint venture and its carrying value and recognises the amount adjacent to share of profit/(loss) from associates in the income statement.
Profits and losses resulting from upstream and downstream transactions between the Group and its associates and joint ventures are recognised in the Group’s financial statements only to the extent of unrelated investors’ interests in the associates and joint ventures. Unrealised losses are eliminated unless the transaction provides evidence of an impairment of the asset transferred. Accounting policies of associates and joint ventures have been changed where necessary to ensure consistency with the policies adopted by the Group.
Dilution gains and losses arising in investments in associates and joint ventures are recognised in the income statement.
If the ownership interest in an associate is reduced but significant influence is retained, only a proportionate share of the amounts previously recognised in other comprehensive income is reclassified to profit or loss where appropriate.
When the Group’s share of losses in an associate or joint venture equals or exceeds its interests in the associate or joint venture (which includes any long-term interests that, in substance, form part of the Group’s net investment in the associate or joint venture), the Group does not recognise further losses, unless it has incurred obligations or made payments on behalf of the associate or joint venture.
/ 111
BLUE LABEL INTEGRATED ANNUAL REPORT 2017
Notes to the Group annual financial statements continued
For the year ended 31 May 2017
2. Group composition continued
Critical accounting judgements and assumptions
(a) Valuation of intangible assets acquired as part of a business combinationThe fair values of all identifiable intangible assets acquired as part of a business combination are determined using recognised valuation techniques. Such techniques often rely on forecasts of future cash flows and the use of appropriate discount rates that reflect the risk factors associated with the cash flows.
These valuations are based on information at the time of the acquisition and the expectations and assumptions that have been deemed reasonable by the Group’s management. The risk exists that the underlying assumptions or events associated with such assets will not occur as projected. For these reasons, among others, the actual cash flows may vary from forecasts of future cash flows.
(b) Assessment of investment in associates and joint ventures for impairmentThe Group tests annually whether investment in associates and joint ventures has suffered any impairment, in accordance with the accounting policy. The recoverable amounts of the investment in associates and joint ventures have been determined based on value-in-use calculations. These calculations require the use of estimates. Refer to note 2.1 for details on these estimates.
(c) Classification of significant joint arrangementsThe Group exercises judgement in determining the classification of its joint arrangements.
Blue Label Mexico S.A. de C.V.The Group holds an effective interest of 47.56% in the issued ordinary share capital of Blue Label Mexico S.A. de C.V. The joint arrangement provides the Group and the other parties to the agreement with rights to the net assets of the entity. The investment is classified as a joint venture as unanimous approval of the shareholders is required for decisions.
2DFine Holdings Mauritius The Group holds an effective interest of 50% in the issued ordinary share capital of 2DFine Holdings Mauritius. The joint arrangement provides the Group and the other parties to the agreement with rights to the net assets of the entity. Prior to 30 November 2016, the investment was classified as a joint venture as unanimous approval of the shareholders is required for decisions. Refer to note 2.2 for the classification subsequent to 30 November 2016.
SupaPesa Africa LimitedViamedia Proprietary Limited (75% owned by the Group) holds 50% of SupaPesa Africa Limited. Therefore the Group equity accounts for 50% of net assets. The joint arrangement provides the Group and the other parties to the agreement with rights to the net assets of the entity. The investment is classified as a joint venture as unanimous approval of the shareholders is required for decisions.
(d) Classification of significant associatesThese classifications below refer to pre 30 November 2016. Refer to note 2.2 for the classification subsequent to 30 November 2016.
Oxigen Services India Private Limited (Oxigen Services India)Blue Label Telecoms Limited (BLT) acting through its wholly owned subsidiary, Gold Label Investments Proprietary Limited (GLI), acquired a 50% interest in 2DFine Holdings Mauritius. The investment is classified as a joint venture as unanimous approval of the shareholders is required for decisions. 2DFine Holdings Mauritius and GLI hold 33.85% and 41.96% respectively of Oxigen Services India. In terms of IFRS, an entity does not aggregate its interests held through associates and joint ventures when assessing for control as BLT through this relationship cannot direct the financial and operating policies of Oxigen Services India. Therefore, even though BLT has an effective interest of 58.88% in Oxigen Services India, the Group neither controls nor jointly controls Oxigen Services India.
The Group has the right to appoint two directors out of a total of five. Therefore we have concluded that the Group has significant influence over the financial and operating policies of Oxigen Services India.
Oxigen Online Services India Private Limited (Oxigen Online)BLT acting through its wholly owned subsidiary, GLI, acquired a 50% interest in 2DFine Holdings Mauritius. The investment is classified as a joint venture as unanimous approval of the shareholders is required for decisions. 2DFine Holdings Mauritius and GLI hold 34.42% and 40.96% respectively of Oxigen Online. In terms of IFRS, an entity does not aggregate its interests held through associates and joint ventures when assessing for control as BLT through this relationship cannot direct the financial and operating policies of Oxigen Online. Therefore, even though BLT has an effective interest of 58.18% in Oxigen Online, the Group neither controls nor jointly controls Oxigen Online.
The Group has the right to appoint two directors out of a total of five. Therefore we have concluded that the Group has significant influence over the financial and operating policies of Oxigen Online.
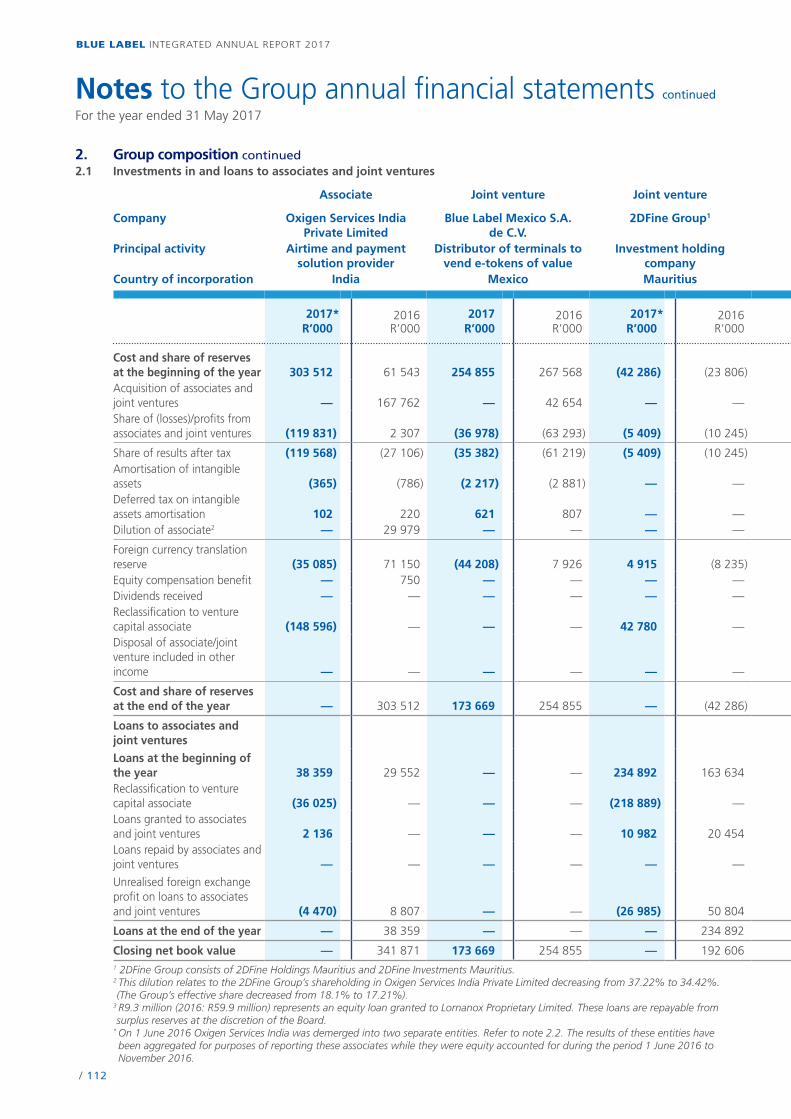
/ 112
BLUE LABEL INTEGRATED ANNUAL REPORT 2017
2. Group composition continued2.1 Investments in and loans to associates and joint ventures
Associate Joint venture Joint venture Joint venture Other associates Other joint ventures Total
Company Oxigen Services India Private Limited
Blue Label Mexico S.A. de C.V.
2DFine Group1 SupaPesa Africa Limited
Principal activity Airtime and payment solution provider
Distributor of terminals to vend e-tokens of value
Investment holding company
Content provider
Country of incorporation India Mexico Mauritius Mauritius
2017* R’000
2016 R’000
2017 R’000
2016 R’000
2017* R’000
2016 R’000
2017 R’000
2016 R’000
2017 R’000
2016 R’000
2017 R’000
2016 R’000
2017 R’000
2016 R’000
Cost and share of reserves at the beginning of the year 303 512 61 543 254 855 267 568 (42 286) (23 806) 44 464 33 908 64 547 7 709 3 279 564 628 371 347 486Acquisition of associates and joint ventures — 167 762 — 42 654 — — — — 21 3053 59 9493 — — 21 305 270 365Share of (losses)/profits from associates and joint ventures (119 831) 2 307 (36 978) (63 293) (5 409) (10 245) 2 012 348 (2 885) (3 606) (1 850) 2 719 (164 941) (71 770)
Share of results after tax (119 568) (27 106) (35 382) (61 219) (5 409) (10 245) 2 012 348 (2 885) (3 606) (1 850) 2 719 (163 082) (99 109)Amortisation of intangible assets (365) (786) (2 217) (2 881) — — — — — — — — (2 582) (3 667)Deferred tax on intangible assets amortisation 102 220 621 807 — — — — — — — — 723 1 027Dilution of associate2 — 29 979 — — — — — — — — — — — 29 979
Foreign currency translation reserve (35 085) 71 150 (44 208) 7 926 4 915 (8 235) (7 630) 10 208 (416) 495 — — (82 424) 81 544Equity compensation benefit — 750 — — — — — — — — — — — 750Dividends received — — — — — — — — — — — — — —Reclassification to venture capital associate (148 596) — — — 42 780 — — — — — — — (105 816) —Disposal of associate/joint venture included in other income — — — — — — — — — — — (4) — (4)
Cost and share of reserves at the end of the year — 303 512 173 669 254 855 — (42 286) 38 846 44 464 82 551 64 547 1 429 3 279 296 495 628 371
Loans to associates and joint ventures
Loans at the beginning of the year 38 359 29 552 — — 234 892 163 634 — — — — 8 945 7 900 282 196 201 086Reclassification to venture capital associate (36 025) — — — (218 889) — — — — — — — (254 914) —Loans granted to associates and joint ventures 2 136 — — — 10 982 20 454 — — — — 10 986 1 638 24 104 22 092Loans repaid by associates and joint ventures — — — — — — — — — — (593) (593) (593) (593)
Unrealised foreign exchange profit on loans to associates and joint ventures (4 470) 8 807 — — (26 985) 50 804 — — — — — — (31 455) 59 611
Loans at the end of the year — 38 359 — — — 234 892 — — — — 19 338 8 945 19 338 282 196
Closing net book value — 341 871 173 669 254 855 — 192 606 38 846 44 464 82 551 64 547 20 767 12 224 315 833 910 5671 2DFine Group consists of 2DFine Holdings Mauritius and 2DFine Investments Mauritius.2 This dilution relates to the 2DFine Group’s shareholding in Oxigen Services India Private Limited decreasing from 37.22% to 34.42%. (The Group’s effective share decreased from 18.1% to 17.21%).
3 R9.3 million (2016: R59.9 million) represents an equity loan granted to Lornanox Proprietary Limited. These loans are repayable from surplus reserves at the discretion of the Board.
* On 1 June 2016 Oxigen Services India was demerged into two separate entities. Refer to note 2.2. The results of these entities have been aggregated for purposes of reporting these associates while they were equity accounted for during the period 1 June 2016 to November 2016.
Notes to the Group annual financial statements continued
For the year ended 31 May 2017
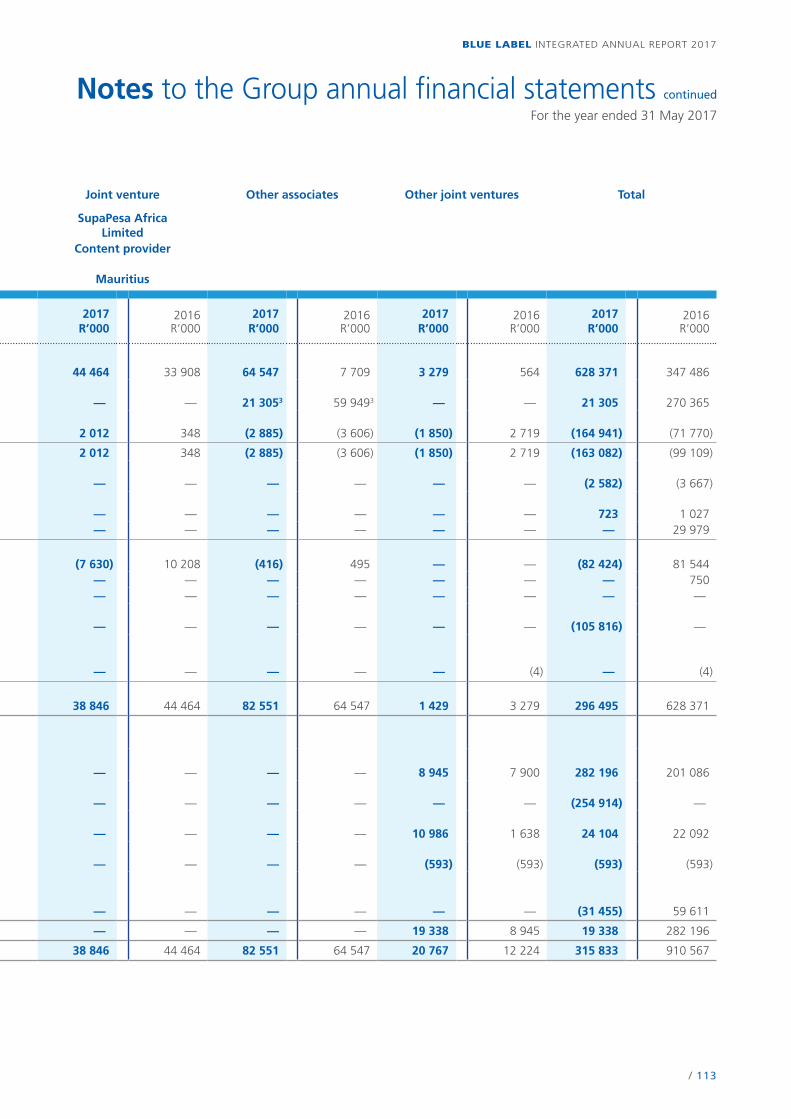
/ 113
BLUE LABEL INTEGRATED ANNUAL REPORT 2017
2. Group composition continued2.1 Investments in and loans to associates and joint ventures
Associate Joint venture Joint venture Joint venture Other associates Other joint ventures Total
Company Oxigen Services India Private Limited
Blue Label Mexico S.A. de C.V.
2DFine Group1 SupaPesa Africa Limited
Principal activity Airtime and payment solution provider
Distributor of terminals to vend e-tokens of value
Investment holding company
Content provider
Country of incorporation India Mexico Mauritius Mauritius
2017* R’000
2016 R’000
2017 R’000
2016 R’000
2017* R’000
2016 R’000
2017 R’000
2016 R’000
2017 R’000
2016 R’000
2017 R’000
2016 R’000
2017 R’000
2016 R’000
Cost and share of reserves at the beginning of the year 303 512 61 543 254 855 267 568 (42 286) (23 806) 44 464 33 908 64 547 7 709 3 279 564 628 371 347 486Acquisition of associates and joint ventures — 167 762 — 42 654 — — — — 21 3053 59 9493 — — 21 305 270 365Share of (losses)/profits from associates and joint ventures (119 831) 2 307 (36 978) (63 293) (5 409) (10 245) 2 012 348 (2 885) (3 606) (1 850) 2 719 (164 941) (71 770)
Share of results after tax (119 568) (27 106) (35 382) (61 219) (5 409) (10 245) 2 012 348 (2 885) (3 606) (1 850) 2 719 (163 082) (99 109)Amortisation of intangible assets (365) (786) (2 217) (2 881) — — — — — — — — (2 582) (3 667)Deferred tax on intangible assets amortisation 102 220 621 807 — — — — — — — — 723 1 027Dilution of associate2 — 29 979 — — — — — — — — — — — 29 979
Foreign currency translation reserve (35 085) 71 150 (44 208) 7 926 4 915 (8 235) (7 630) 10 208 (416) 495 — — (82 424) 81 544Equity compensation benefit — 750 — — — — — — — — — — — 750Dividends received — — — — — — — — — — — — — —Reclassification to venture capital associate (148 596) — — — 42 780 — — — — — — — (105 816) —Disposal of associate/joint venture included in other income — — — — — — — — — — — (4) — (4)
Cost and share of reserves at the end of the year — 303 512 173 669 254 855 — (42 286) 38 846 44 464 82 551 64 547 1 429 3 279 296 495 628 371
Loans to associates and joint ventures
Loans at the beginning of the year 38 359 29 552 — — 234 892 163 634 — — — — 8 945 7 900 282 196 201 086Reclassification to venture capital associate (36 025) — — — (218 889) — — — — — — — (254 914) —Loans granted to associates and joint ventures 2 136 — — — 10 982 20 454 — — — — 10 986 1 638 24 104 22 092Loans repaid by associates and joint ventures — — — — — — — — — — (593) (593) (593) (593)
Unrealised foreign exchange profit on loans to associates and joint ventures (4 470) 8 807 — — (26 985) 50 804 — — — — — — (31 455) 59 611
Loans at the end of the year — 38 359 — — — 234 892 — — — — 19 338 8 945 19 338 282 196
Closing net book value — 341 871 173 669 254 855 — 192 606 38 846 44 464 82 551 64 547 20 767 12 224 315 833 910 5671 2DFine Group consists of 2DFine Holdings Mauritius and 2DFine Investments Mauritius.2 This dilution relates to the 2DFine Group’s shareholding in Oxigen Services India Private Limited decreasing from 37.22% to 34.42%. (The Group’s effective share decreased from 18.1% to 17.21%).
3 R9.3 million (2016: R59.9 million) represents an equity loan granted to Lornanox Proprietary Limited. These loans are repayable from surplus reserves at the discretion of the Board.
* On 1 June 2016 Oxigen Services India was demerged into two separate entities. Refer to note 2.2. The results of these entities have been aggregated for purposes of reporting these associates while they were equity accounted for during the period 1 June 2016 to November 2016.
Notes to the Group annual financial statements continued
For the year ended 31 May 2017
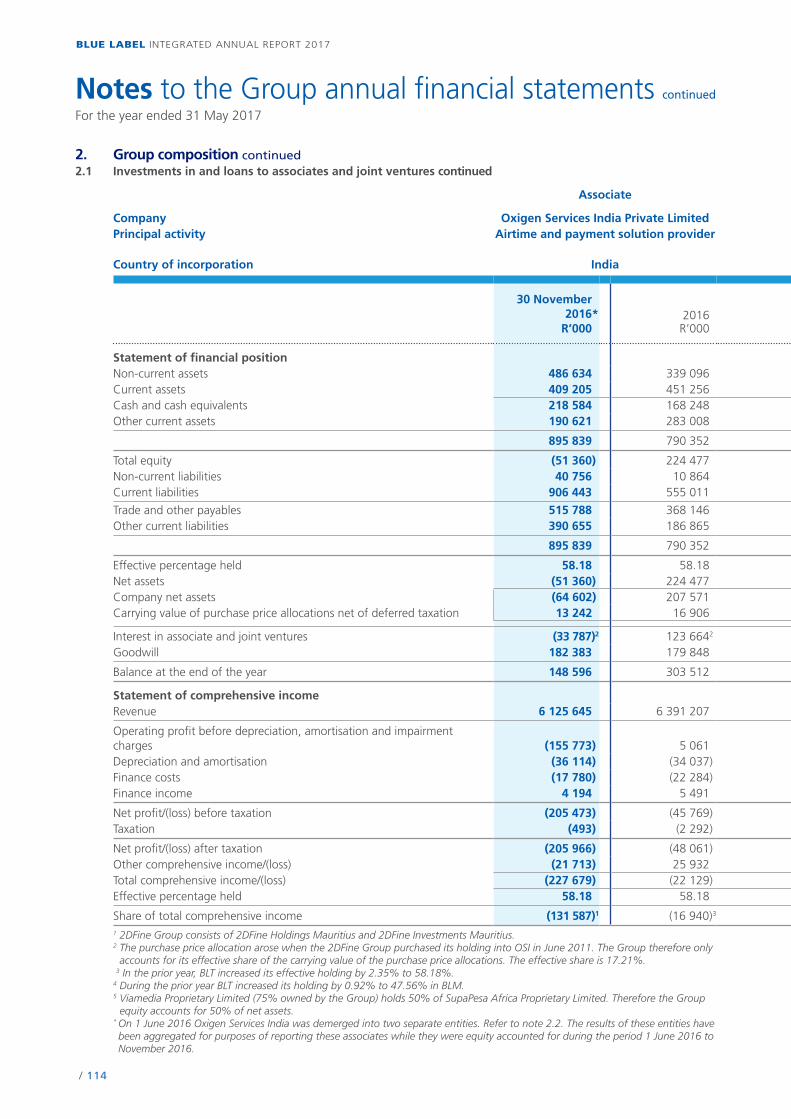
/ 114
BLUE LABEL INTEGRATED ANNUAL REPORT 2017
2. Group composition continued2.1 Investments in and loans to associates and joint ventures continued
Associate Joint venture Joint venture Joint venture
Company Oxigen Services India Private Limited Blue Label Mexico S.A. de C.V. 2DFine Group1 SupaPesa Africa Proprietary LimitedPrincipal activity Airtime and payment solution provider Distributor of terminals to vend
e-tokens of valueInvestment holding company Content provider
Country of incorporation India Mexico Mauritius Mauritius
30 November2016*
R’0002016
R’0002017
R’0002016
R’000
30 November2016*
R’0002016
R’0002017
R’0002016 R’000
Statement of financial positionNon-current assets 486 634 339 096 97 857 171 701 138 007 154 706 8 862 10 654 Current assets 409 205 451 256 162 885 193 490 52 59 10 927 8 645 Cash and cash equivalents 218 584 168 248 64 515 88 498 2 2 5 324 4 702 Other current assets 190 621 283 008 98 370 104 992 50 57 5 603 3 943
895 839 790 352 260 742 365 191 138 059 154 765 19 789 19 299
Total equity (51 360) 224 477 112 560 228 233 (85 560) (84 570) 10 283 7 889 Non-current liabilities 40 756 10 864 4 839 7 464 — — 7 533 9 855 Current liabilities 906 443 555 011 143 343 129 494 223 619 239 335 1 973 1 555
Trade and other payables 515 788 368 146 143 062 129 090 1 279 897 1 973 1 311 Other current liabilities 390 655 186 865 281 404 222 340 238 438 — 244
895 839 790 352 260 742 365 191 138 059 154 765 19 789 19 299
Effective percentage held 58.18 58.18 47.56 47.56 50 50 37.5 37.5 Net assets (51 360) 224 477 112 560 228 233 (85 560) (84 570) 10 283 7 889 Company net assets (64 602) 207 571 100 118 209 039 (85 560) (84 570) 10 283 7 889 Carrying value of purchase price allocations net of deferred taxation 13 242 16 906 12 442 19 194 — — — —
Interest in associate and joint ventures (33 787)2 123 6642 53 534 108 548 (42 780) (42 286) 5 1425 3 9445 Goodwill 182 383 179 848 120 135 146 307 — — 33 707 40 520
Balance at the end of the year 148 596 303 512 173 669 254 855 (42 780) (42 286) 38 849 44 464
Statement of comprehensive incomeRevenue 6 125 645 6 391 207 3 075 053 4 016 614 — — 13 364 13 052
Operating profit before depreciation, amortisation and impairment charges (155 773) 5 061 (27 358) (70 042) (264) (645) 4 970 1 583 Depreciation and amortisation (36 114) (34 037) (52 516) (67 425) — — — — Finance costs (17 780) (22 284) — — (10 555) (19 844) (816) (865)Finance income 4 194 5 491 1 859 1 927 — — — —
Net profit/(loss) before taxation (205 473) (45 769) (78 015) (135 540) (10 819) (20 489) 4 154 718 Taxation (493) (2 292) 265 1 109 — — (125) (22)
Net profit/(loss) after taxation (205 966) (48 061) (77 750) (134 431) (10 819) (20 489) 4 029 696 Other comprehensive income/(loss) (21 713) 25 932 (37 922) 16 370 9 830 (16 470) (1 635) 1 811 Total comprehensive income/(loss) (227 679) (22 129) (115 672) (118 061) (989) (36 959) 2 394 2 507 Effective percentage held 58.18 58.18 47.56 47.56 50 50 37.55 37.55
Share of total comprehensive income (131 587)1 (16 940)3 (55 014) (55 696)4 (495) (18 479) 1 197 1 2541 2DFine Group consists of 2DFine Holdings Mauritius and 2DFine Investments Mauritius.2 The purchase price allocation arose when the 2DFine Group purchased its holding into OSI in June 2011. The Group therefore only
accounts for its effective share of the carrying value of the purchase price allocations. The effective share is 17.21%. 3 In the prior year, BLT increased its effective holding by 2.35% to 58.18%.4 During the prior year BLT increased its holding by 0.92% to 47.56% in BLM.5 Viamedia Proprietary Limited (75% owned by the Group) holds 50% of SupaPesa Africa Proprietary Limited. Therefore the Group
equity accounts for 50% of net assets.* On 1 June 2016 Oxigen Services India was demerged into two separate entities. Refer to note 2.2. The results of these entities have been aggregated for purposes of reporting these associates while they were equity accounted for during the period 1 June 2016 to November 2016.
Notes to the Group annual financial statements continued
For the year ended 31 May 2017
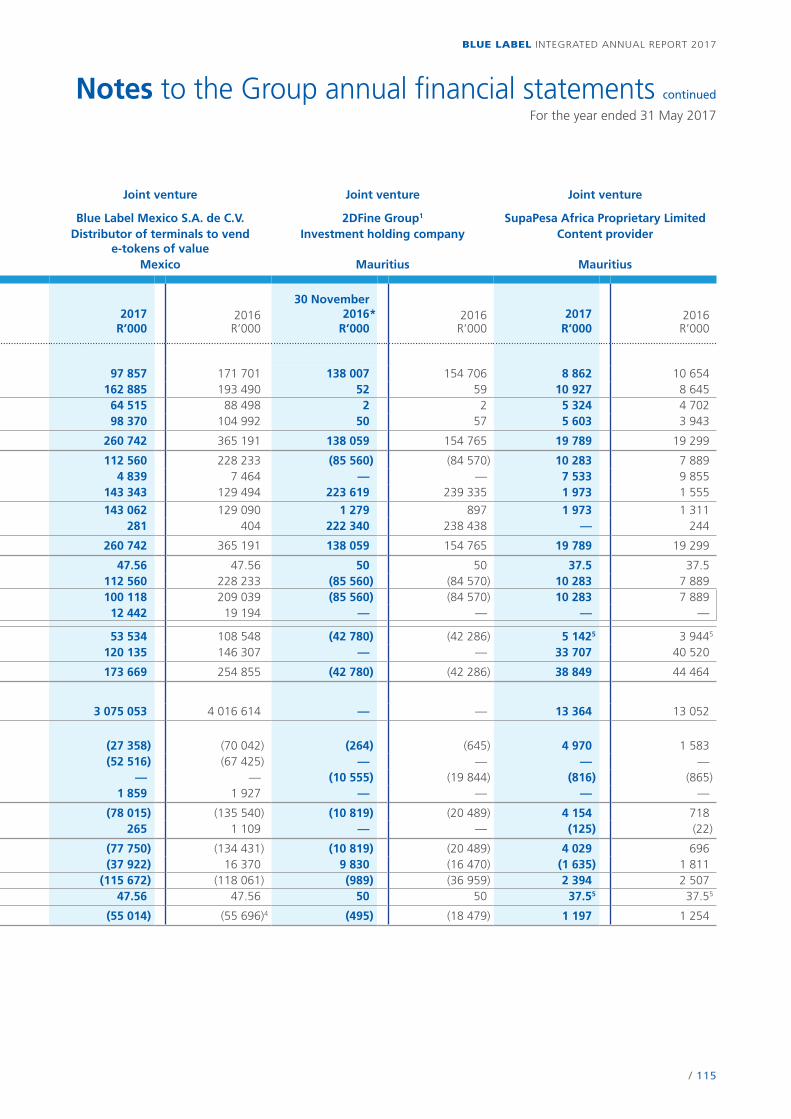
/ 115
BLUE LABEL INTEGRATED ANNUAL REPORT 2017
2. Group composition continued2.1 Investments in and loans to associates and joint ventures continued
Associate Joint venture Joint venture Joint venture
Company Oxigen Services India Private Limited Blue Label Mexico S.A. de C.V. 2DFine Group1 SupaPesa Africa Proprietary LimitedPrincipal activity Airtime and payment solution provider Distributor of terminals to vend
e-tokens of valueInvestment holding company Content provider
Country of incorporation India Mexico Mauritius Mauritius
30 November2016*
R’0002016 R’000
2017 R’000
2016 R’000
30 November2016*
R’0002016
R’0002017
R’0002016
R’000
Statement of financial positionNon-current assets 486 634 339 096 97 857 171 701 138 007 154 706 8 862 10 654 Current assets 409 205 451 256 162 885 193 490 52 59 10 927 8 645 Cash and cash equivalents 218 584 168 248 64 515 88 498 2 2 5 324 4 702 Other current assets 190 621 283 008 98 370 104 992 50 57 5 603 3 943
895 839 790 352 260 742 365 191 138 059 154 765 19 789 19 299
Total equity (51 360) 224 477 112 560 228 233 (85 560) (84 570) 10 283 7 889 Non-current liabilities 40 756 10 864 4 839 7 464 — — 7 533 9 855 Current liabilities 906 443 555 011 143 343 129 494 223 619 239 335 1 973 1 555
Trade and other payables 515 788 368 146 143 062 129 090 1 279 897 1 973 1 311 Other current liabilities 390 655 186 865 281 404 222 340 238 438 — 244
895 839 790 352 260 742 365 191 138 059 154 765 19 789 19 299
Effective percentage held 58.18 58.18 47.56 47.56 50 50 37.5 37.5 Net assets (51 360) 224 477 112 560 228 233 (85 560) (84 570) 10 283 7 889 Company net assets (64 602) 207 571 100 118 209 039 (85 560) (84 570) 10 283 7 889 Carrying value of purchase price allocations net of deferred taxation 13 242 16 906 12 442 19 194 — — — —
Interest in associate and joint ventures (33 787)2 123 6642 53 534 108 548 (42 780) (42 286) 5 1425 3 9445 Goodwill 182 383 179 848 120 135 146 307 — — 33 707 40 520
Balance at the end of the year 148 596 303 512 173 669 254 855 (42 780) (42 286) 38 849 44 464
Statement of comprehensive incomeRevenue 6 125 645 6 391 207 3 075 053 4 016 614 — — 13 364 13 052
Operating profit before depreciation, amortisation and impairment charges (155 773) 5 061 (27 358) (70 042) (264) (645) 4 970 1 583 Depreciation and amortisation (36 114) (34 037) (52 516) (67 425) — — — — Finance costs (17 780) (22 284) — — (10 555) (19 844) (816) (865)Finance income 4 194 5 491 1 859 1 927 — — — —
Net profit/(loss) before taxation (205 473) (45 769) (78 015) (135 540) (10 819) (20 489) 4 154 718 Taxation (493) (2 292) 265 1 109 — — (125) (22)
Net profit/(loss) after taxation (205 966) (48 061) (77 750) (134 431) (10 819) (20 489) 4 029 696 Other comprehensive income/(loss) (21 713) 25 932 (37 922) 16 370 9 830 (16 470) (1 635) 1 811 Total comprehensive income/(loss) (227 679) (22 129) (115 672) (118 061) (989) (36 959) 2 394 2 507 Effective percentage held 58.18 58.18 47.56 47.56 50 50 37.55 37.55
Share of total comprehensive income (131 587)1 (16 940)3 (55 014) (55 696)4 (495) (18 479) 1 197 1 2541 2DFine Group consists of 2DFine Holdings Mauritius and 2DFine Investments Mauritius.2 The purchase price allocation arose when the 2DFine Group purchased its holding into OSI in June 2011. The Group therefore only
accounts for its effective share of the carrying value of the purchase price allocations. The effective share is 17.21%. 3 In the prior year, BLT increased its effective holding by 2.35% to 58.18%.4 During the prior year BLT increased its holding by 0.92% to 47.56% in BLM.5 Viamedia Proprietary Limited (75% owned by the Group) holds 50% of SupaPesa Africa Proprietary Limited. Therefore the Group
equity accounts for 50% of net assets.* On 1 June 2016 Oxigen Services India was demerged into two separate entities. Refer to note 2.2. The results of these entities have been aggregated for purposes of reporting these associates while they were equity accounted for during the period 1 June 2016 to November 2016.
Notes to the Group annual financial statements continued
For the year ended 31 May 2017
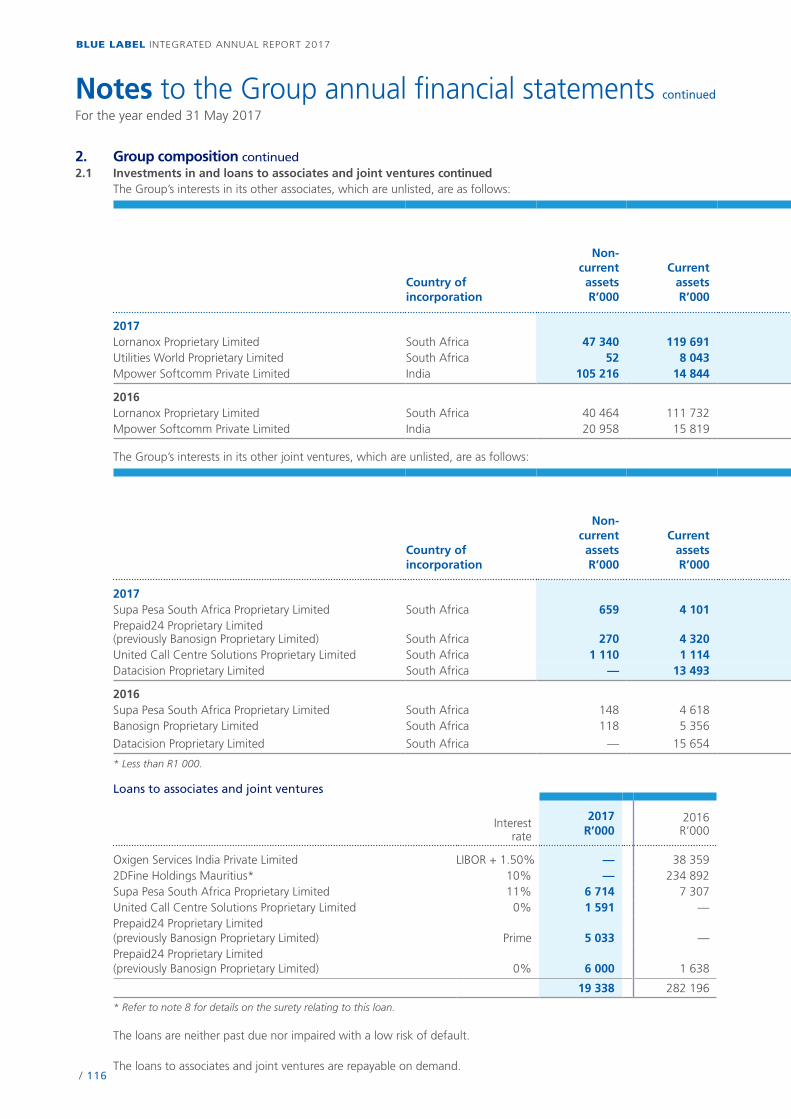
/ 116
BLUE LABEL INTEGRATED ANNUAL REPORT 2017
Notes to the Group annual financial statements continued
For the year ended 31 May 2017
2. Group composition continued2.1 Investments in and loans to associates and joint ventures continued
The Group’s interests in its other associates, which are unlisted, are as follows:
Country ofincorporation
Non-currentassetsR’000
CurrentassetsR’000
Non-currentliabilities
R’000
Currentliabilities
R’000Revenues
R’000
Net profit/
(loss)R’000
Totalcompre-hensive
profit/(loss)
R’000
Effectivepercentage
interestheld
%
Carryingvalue of
investmentR’000
2017Lornanox Proprietary Limited South Africa 47 340 119 691 — 189 870 248 105 (11 451) (11 451) 40 66 073Utilities World Proprietary Limited South Africa 52 8 043 — 549 45 819 6 752 6 752 25.1 13 741Mpower Softcomm Private Limited India 105 216 14 844 2 348 8 746 50 448 * * 21.6 2 737
2016Lornanox Proprietary Limited South Africa 40 464 111 732 — 97 626 149 044 (11 389) (11 389) 40 61 394Mpower Softcomm Private Limited India 20 958 15 819 3 170 11 632 49 160 6 711 6 711 21.6 3 153
The Group’s interests in its other joint ventures, which are unlisted, are as follows:
Country ofincorporation
Non-currentassetsR’000
CurrentassetsR’000
Non-currentliabilities
R’000
Currentliabilities
R’000Revenues
R’000
Net profit/
(loss)R’000
Totalcompre-hensive
profit/(loss)
R’000
Effectivepercentage
interestheld
%
Carryingvalue of
investmentR’000
2017Supa Pesa South Africa Proprietary Limited South Africa 659 4 101 6 715 410 3 738 427 427 37.5 9 370Prepaid24 Proprietary Limited (previously Banosign Proprietary Limited) South Africa 270 4 320 — 10 380 13 974 (5 027) (5 027) 50.1 8 132United Call Centre Solutions Proprietary Limited South Africa 1 110 1 114 — 3 693 4 040 (1 469) (1 469) 50 1 591Datacision Proprietary Limited South Africa — 13 493 26 724 8 823 910 910 40.5 1 674
2016Supa Pesa South Africa Proprietary Limited South Africa 148 4 618 7 308 404 973 4 530 4 530 37.5 9 750Banosign Proprietary Limited South Africa 118 5 356 1 638 4 600 2 414 (764) (764) 50.1 1 254
Datacision Proprietary Limited South Africa — 15 654 37 3 784 10 858 1 520 1 520 40.5 1 220
* Less than R1 000.
Loans to associates and joint ventures
Interestrate
2017R’000
2016R’000
Oxigen Services India Private Limited LIBOR + 1.50% — 38 3592DFine Holdings Mauritius* 10% — 234 892Supa Pesa South Africa Proprietary Limited 11% 6 714 7 307United Call Centre Solutions Proprietary Limited 0% 1 591 —Prepaid24 Proprietary Limited (previously Banosign Proprietary Limited) Prime 5 033 —Prepaid24 Proprietary Limited (previously Banosign Proprietary Limited) 0% 6 000 1 638
19 338 282 196
* Refer to note 8 for details on the surety relating to this loan.
The loans are neither past due nor impaired with a low risk of default.
The loans to associates and joint ventures are repayable on demand.
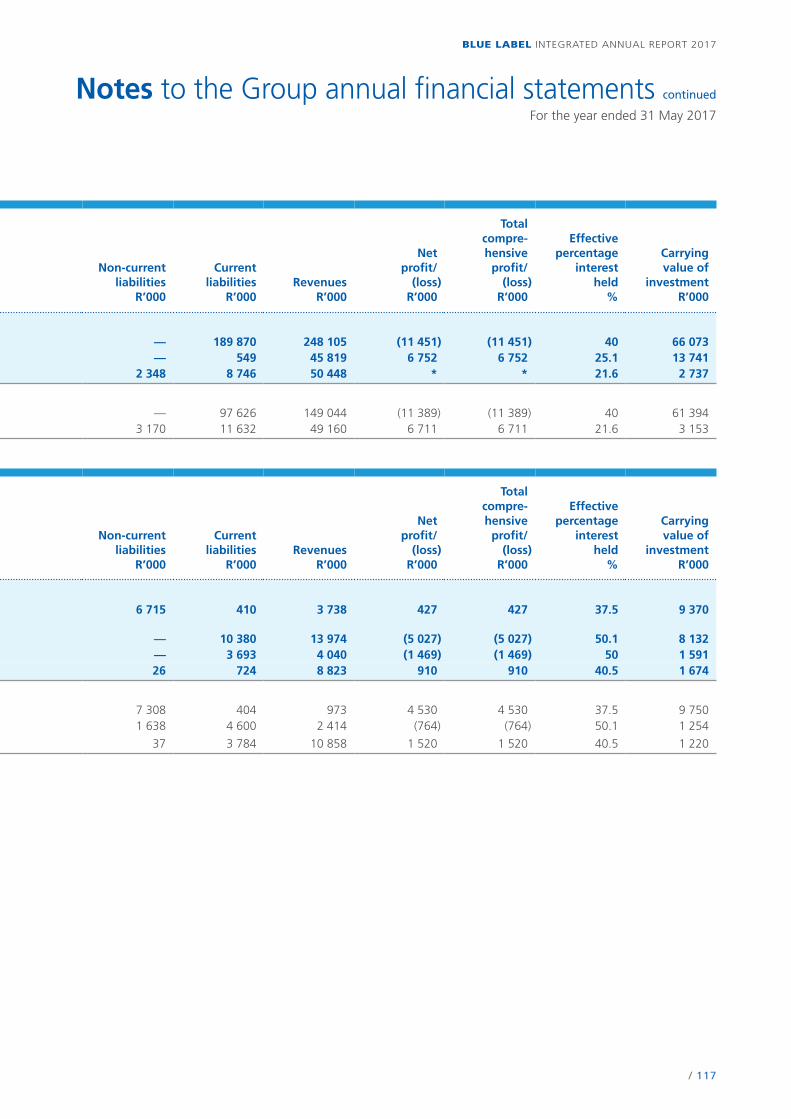
/ 117
BLUE LABEL INTEGRATED ANNUAL REPORT 2017
Notes to the Group annual financial statements continued
For the year ended 31 May 2017
2. Group composition continued2.1 Investments in and loans to associates and joint ventures continued
The Group’s interests in its other associates, which are unlisted, are as follows:
Country ofincorporation
Non-currentassetsR’000
CurrentassetsR’000
Non-currentliabilities
R’000
Currentliabilities
R’000Revenues
R’000
Net profit/
(loss)R’000
Totalcompre-hensive
profit/(loss)
R’000
Effectivepercentage
interestheld
%
Carryingvalue of
investmentR’000
2017Lornanox Proprietary Limited South Africa 47 340 119 691 — 189 870 248 105 (11 451) (11 451) 40 66 073Utilities World Proprietary Limited South Africa 52 8 043 — 549 45 819 6 752 6 752 25.1 13 741Mpower Softcomm Private Limited India 105 216 14 844 2 348 8 746 50 448 * * 21.6 2 737
2016Lornanox Proprietary Limited South Africa 40 464 111 732 — 97 626 149 044 (11 389) (11 389) 40 61 394Mpower Softcomm Private Limited India 20 958 15 819 3 170 11 632 49 160 6 711 6 711 21.6 3 153
The Group’s interests in its other joint ventures, which are unlisted, are as follows:
Country ofincorporation
Non-currentassetsR’000
CurrentassetsR’000
Non-currentliabilities
R’000
Currentliabilities
R’000Revenues
R’000
Net profit/
(loss)R’000
Totalcompre-hensive
profit/(loss)
R’000
Effectivepercentage
interestheld
%
Carryingvalue of
investmentR’000
2017Supa Pesa South Africa Proprietary Limited South Africa 659 4 101 6 715 410 3 738 427 427 37.5 9 370Prepaid24 Proprietary Limited (previously Banosign Proprietary Limited) South Africa 270 4 320 — 10 380 13 974 (5 027) (5 027) 50.1 8 132United Call Centre Solutions Proprietary Limited South Africa 1 110 1 114 — 3 693 4 040 (1 469) (1 469) 50 1 591Datacision Proprietary Limited South Africa — 13 493 26 724 8 823 910 910 40.5 1 674
2016Supa Pesa South Africa Proprietary Limited South Africa 148 4 618 7 308 404 973 4 530 4 530 37.5 9 750Banosign Proprietary Limited South Africa 118 5 356 1 638 4 600 2 414 (764) (764) 50.1 1 254
Datacision Proprietary Limited South Africa — 15 654 37 3 784 10 858 1 520 1 520 40.5 1 220
* Less than R1 000.
Loans to associates and joint ventures
Interestrate
2017R’000
2016R’000
Oxigen Services India Private Limited LIBOR + 1.50% — 38 3592DFine Holdings Mauritius* 10% — 234 892Supa Pesa South Africa Proprietary Limited 11% 6 714 7 307United Call Centre Solutions Proprietary Limited 0% 1 591 —Prepaid24 Proprietary Limited (previously Banosign Proprietary Limited) Prime 5 033 —Prepaid24 Proprietary Limited (previously Banosign Proprietary Limited) 0% 6 000 1 638
19 338 282 196
* Refer to note 8 for details on the surety relating to this loan.
The loans are neither past due nor impaired with a low risk of default.
The loans to associates and joint ventures are repayable on demand.

/ 118
BLUE LABEL INTEGRATED ANNUAL REPORT 2017
Notes to the Group annual financial statements continued
For the year ended 31 May 2017
2. Group composition continued2.1 Investments in and loans to associates and joint ventures continued
Loans to associates and joint ventures continuedThe Group considers its maximum exposure in respect of these loans, without taking into account any collateral and financial guarantees, to be as follows:
2017 R’000
2016 R’000
Group 1 1 591 —Group 2 11 032 282 196Group 3 6 715 —
19 338 282 196
The rating groups for counterparties are categorised as follows:Group 1 – New customers/related parties (less than six months).Group 2 – Existing customers/related parties (more than six months) with no defaults in the past.Group 3 – Existing customers/related parties (more than six months) with some defaults in the past.
Impairment of associates and joint venturesThere was no impairment of investment in associates and joint ventures. This was tested by comparing the recoverable amount against the carrying value of the investment in associates and joint ventures.
The recoverable amount is the higher of fair value less cost of disposal and the value-in-use. These value-in-use calculations use cash flow projections based on financial budgets approved by the Board of Directors for the forthcoming year and forecasts for up to five years which are based on assumptions of the business, industry and economic growth. Cash flows beyond this period are extrapolated using terminal growth rates, which do not exceed the expected long-term economic growth rate.
The key assumptions used for the value-in-use calculations are as follows:
2017 2016
Growthrate
%
Discountrate
%
Growthrate
%
Discountrate
%
Oxigen Services India Private Limited * * 5 35.00SupaPesa Africa Limited 4 14.97 4 17.74Blue Label Mexico S.A. de C.V. 3.5 15.52 3.5 16.44* Refer to note 2.2.
The discount rates used are post-tax and reflect specific risks relating to the relevant associates and joint ventures. The growth rate is used to extrapolate cash flows beyond the budget period. The growth rates were consistent with publicly available information relating to long-term average growth rates for each of the markets in which the companies operate.
The inputs used when calculating the value-in-use would need to be increased/(decreased) by the following amounts before any impairment would need to be recognised:
2017 2016
Growthrate
%
Discountrate
%
Growthrate
%
Discountrate
%
SupaPesa Africa Limited (2.5) 1.7 (3) 2
For Blue Label Mexico S.A. de C.V., if one or more of the inputs were changed to a reasonable possible alternative, there would be no impairments that would have to be recognised.
Based on these factors, as well as the impairment testing performed the Group has concluded that no impairment is indicated.
The Group has concluded that no impairment of its investment in Blue Label Mexico S.A. de C.V. (BLM) is required. The decline in losses in BLM is primarily due to BLM becoming a multi-carrier distributor as opposed to historically being confined to one network. This has created a more competitive environment amongst the networks to the benefit of BLM. The introduction of the distribution of starter packs that generate monthly compounded annuity income is expected to gain momentum which will result in further declines in losses going forward.

/ 119
BLUE LABEL INTEGRATED ANNUAL REPORT 2017
Notes to the Group annual financial statements continued
For the year ended 31 May 2017
2. Group composition continued2.1 Investments in and loans to associates and joint ventures continued
Shares in associates and joint ventures acquired during the current year
Date acquiredEffective
percentage
United Call Centre Solutions Proprietary Limited Joint venture 19-Dec-16 50Oxigen Online Services India Private Limited Associate 01-Jun-16 58.18Utilities World Proprietary Limited Associate 01-Jun-16 25.1
On 1 June 2016 Oxigen Services India was demerged into two entities. The second entity, Oxigen Online, mirrored the shareholding of Oxigen Services India. Refer to note 2.2.
Utilities World was acquired on 1 June 2016 for a payment of R7.5 million and a further contingent payment of R5 million. The potential undiscounted amount of this contingent payment that the Group could be required to make under this arrangement is between Rnil and R4.97 million.
The fair value of the contingent consideration arrangement of R4.5 million was estimated by applying the income approach. The fair value estimates are based on a discount rate of 10.5%. Management has assumed a probability of 100%. In determining these probabilities management has assessed the cash flow projections based on financial budgets approved by the Board of Directors for the forthcoming year which are based on assumptions of the business, industry and economic growth.
Shares in associates and joint ventures acquired during the prior year
Dateacquired
Effectivepercentage
Banosign Proprietary Limited Joint venture 01-Apr-16 50.1
Oxigen Services India Private Limited Associate 01-Mar-16 2.35Blue Label Mexico S.A. de C.V. Joint venture 01-Sep-15 0.92
The Group’s effective shareholding in OSI prior to March 2016 was 55.83%. Of this shareholding, 37.22% was held by Gold Label Investments (GLI), a wholly owned subsidiary of the Group and 18.61% indirectly through the Group’s 50% shareholding in 2DFine Holdings Mauritius. In March 2016, a rights issue was offered by OSI for USD10.5 million. The Group exercised its rights for the entire amount through GLI congruent with 2DFine Holdings Mauritius waiving its rights. The effect of this is that GLI’s shareholding has increased from 37.22% to 40.97% and its indirect shareholding of 18.61% has been diluted to 17.21%. The latter has in turn resulted in a gain of R30 million on dilution, being the Group’s share of the increased net asset value emanating from the rights issue. The Group’s effective shareholding in OSI therefore increased by 2.35% to 58.18%. The amount paid for this was R159.4 million, the difference of R8.3 million relates to foreign exchange differences.
In September 2015 BLT increased its holding by 0.92% to 47.56% in BLM for an amount of R42.5 million.
Shares in associates disposed of during the prior year
Datedisposed
Effectivepercentage
Forensic Intelligence Data Solutions Proprietary Limited Associate 01-Dec-15 20.25
The Group disposed of Forensic Intelligence Data Solutions Proprietary Limited for a nominal value.
BLT’s co-shareholder in BLM, Grupo Bimbo S.A.B DE C.V (“Bimbo”) has guaranteed the performance of BLM’s obligation to Radiomovil Dipsa S.A. de C.V (trading as Telcel) (“Telcel”). BLT has in turn provided Bimbo with a back to back guarantee in terms of which BLT shall reimburse Bimbo a percentage of any loss it incurs as a result of Telcel calling on the aforesaid guarantee, which percentage it shall pro-rata to BLT’s shareholding in BLM (currently 47.56%). At year-end there is no amount due to Telcel by BLM.
There are no other contingent liabilities relating to the Group’s interest in joint ventures.
For details on related-party transactions, refer to note 8.
/ 120
BLUE LABEL INTEGRATED ANNUAL REPORT 2017
Notes to the Group annual financial statements continued
For the year ended 31 May 2017
2. Group composition continued2.2 Investments in and loans to venture capital associates and joint venture
An associate and joint venture is accounted for as a venture capital investment where the Group has significant influence in an associate or joint venture but the Group considers the investment to be a venture capital investment. This is the case when the Group manages the investment on a fair value basis and has an exit strategy related to the investment whereby the Group intends to recover the value of its investment through sale.
Critical accounting estimates and assumptionsIAS 28 exemption with respect to Oxigen Services India, Oxigen Online and 2DFine Holdings Mauritius.
The exemption available in IAS 28 – Investments in Associates and Joint Ventures has been applied to the investment in Oxigen Services India, Oxigen Online and 2DFine Holdings Mauritius from 30 November 2016 and the investment is accounted for in accordance with IAS 39 – Financial Instruments: Recognition and Measurement at fair value with changes in fair value recognised in profit or loss. The differential between the carrying amount of the investment (previously equity accounted for) and the fair value at this date is reflected as a gain on associate measured at fair value in the Group income statement. Any additional changes in the fair value between 30 November 2016 and year-end have also been recognised in the Group income statement.
Oxigen Services India was demerged into two separate entities with effect from 1 June 2016. This was done in line with the Group’s exit strategy to improve the marketability of these entities to potential investors.
Prior to 30 November 2016, the investment in Oxigen Services India was of a strategic nature as it was expected to emulate the business model of the South African Distribution operations. The original decision to invest in this business was because it was strategically aligned with other Blue Label distribution businesses in South Africa. However, its profile has changed from that of the traditional Group business to one of generating growth in the market value of the investment with a view to unlocking the Group’s share thereof. With the advent of its change in focus to financial services through wallet subscription, it is no longer strategically aligned with the other business units of the Group and is unlikely to generate profitability in the short to medium term. However, the market value of the company is expected to increase exponentially in conjunction with its growth in wallet subscribers. This in turn creates the potential to unlock the investment in value in the future and the Group is pursuing this new strategy with respect to its investment in Oxigen Services India. In line with the Group’s exit strategy Oxigen Services India was demerged into two separate entities with effect from 1 June 2016. This was done to improve the marketability of these entities to potential investors.
2DFine Holdings Mauritius is an investment holding company that holds an effective interest in Oxigen Services India and Oxigen Online.
Consequently, management reviews the results and operations of Oxigen Services India, Oxigen Online and 2DFine Holdings Mauritius on a fair value basis as opposed to the profits/losses that it generates. In addition, management has established an exit strategy that looks to realise this fair value in the foreseeable future.
Accordingly, in accordance with IAS 28 – Investments in Associates and Joint Ventures Oxigen Services, India, Oxigen Online and 2DFine Holdings Mauritius are viewed as venture capital investments which have been accounted for at fair value through profit and loss from 30 November 2016 at which date equity accounting ceased, in line with IFRS 13 Fair Value Measurement.

/ 121
BLUE LABEL INTEGRATED ANNUAL REPORT 2017
Notes to the Group annual financial statements continued
For the year ended 31 May 2017
2. Group composition continued2.2 Investments in and loans to venture capital associates and joint venture continued
Company AssociateOxigen
Services IndiaPrivate Limited
AssociateOxigen
Online ServicesPrivate Limited
Joint venture2DFine Group1
Principal activity Airtime andpayment
solution provider
Online paymentsolution provider
Investmentholding company
Country of incorporation India India Mauritius Total
2017 R’000
2017 R’000
2017 R’000
2017 R’000
Fair value at the beginning of the year — — — —Reclassification 230 103 (81 507) (42 780) 105 816 Fair value adjustment 11 388 101 831 46 981 160 200 Capital contribution 21 1662 4 368 — 25 534
Fair value at the end of the year 262 657 24 692 4 201 291 550
Loans to venture capital associates and joint venture
Loans at the beginning of the year — — — —Reclassification 36 025 218 889 254 914 Loans granted 429 — 12 974 13 403 Unrealised foreign exchange profit (2 144) — (13 558) (15 702)
Loans at the end of the year 34 310 — 218 305 252 615
Closing fair value 296 967 24 692 222 506 544 165 1 2DFine Group consists of 2DFine Holdings Mauritius and 2DFine Investments Mauritius.2 The Group’s effective shareholding in OSI prior to April 2017 was 58.18%. Of this shareholding, 40.96% was held by Gold Label
Investments (GLI), a wholly owned subsidiary of the Group and 17.21% indirectly through the Group’s 50% shareholding in 2DFine Holdings Mauritius. In April 2017, a rights issue was offered by OSI for USD1.5 million. The Group exercised its rights for the entire amount through GLI congruent with 2DFine Holdings Mauritius waiving its rights. The effect of this is that GLI’s shareholding has increased from 40.96% to 41.96% and its indirect shareholding of 17.21% has been diluted to 16.92%. The Group’s effective shareholding in OSI therefore increased by 0.7% to 58.88%. The amount paid for this was R21.2 million.
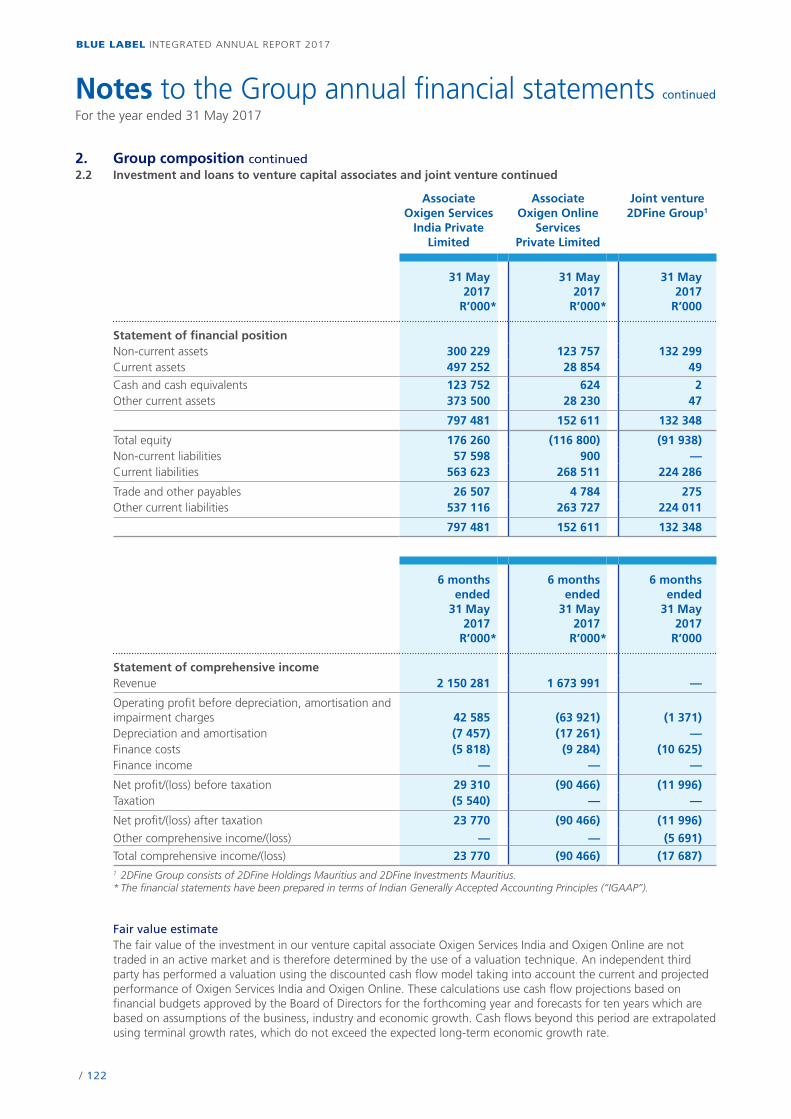
/ 122
BLUE LABEL INTEGRATED ANNUAL REPORT 2017
Notes to the Group annual financial statements continued
For the year ended 31 May 2017
2. Group composition continued2.2 Investment and loans to venture capital associates and joint venture continued
AssociateOxigen Services
India Private Limited
Associate Oxigen Online
Services Private Limited
Joint venture 2DFine Group1
31 May2017
R’000*
31 May2017
R’000*
31 May2017
R’000
Statement of financial positionNon-current assets 300 229 123 757 132 299 Current assets 497 252 28 854 49
Cash and cash equivalents 123 752 624 2 Other current assets 373 500 28 230 47
797 481 152 611 132 348
Total equity 176 260 (116 800) (91 938) Non-current liabilities 57 598 900 —Current liabilities 563 623 268 511 224 286
Trade and other payables 26 507 4 784 275 Other current liabilities 537 116 263 727 224 011
797 481 152 611 132 348
6 months ended
31 May2017
R’000*
6 months ended
31 May2017
R’000*
6 months ended
31 May2017
R’000
Statement of comprehensive incomeRevenue 2 150 281 1 673 991 —
Operating profit before depreciation, amortisation and impairment charges 42 585 (63 921) (1 371) Depreciation and amortisation (7 457) (17 261) —Finance costs (5 818) (9 284) (10 625) Finance income — — —
Net profit/(loss) before taxation 29 310 (90 466) (11 996) Taxation (5 540) — —
Net profit/(loss) after taxation 23 770 (90 466) (11 996)
Other comprehensive income/(loss) — — (5 691)
Total comprehensive income/(loss) 23 770 (90 466) (17 687) 1 2DFine Group consists of 2DFine Holdings Mauritius and 2DFine Investments Mauritius.* The financial statements have been prepared in terms of Indian Generally Accepted Accounting Principles (“IGAAP”).
Fair value estimateThe fair value of the investment in our venture capital associate Oxigen Services India and Oxigen Online are not traded in an active market and is therefore determined by the use of a valuation technique. An independent third party has performed a valuation using the discounted cash flow model taking into account the current and projected performance of Oxigen Services India and Oxigen Online. These calculations use cash flow projections based on financial budgets approved by the Board of Directors for the forthcoming year and forecasts for ten years which are based on assumptions of the business, industry and economic growth. Cash flows beyond this period are extrapolated using terminal growth rates, which do not exceed the expected long-term economic growth rate.
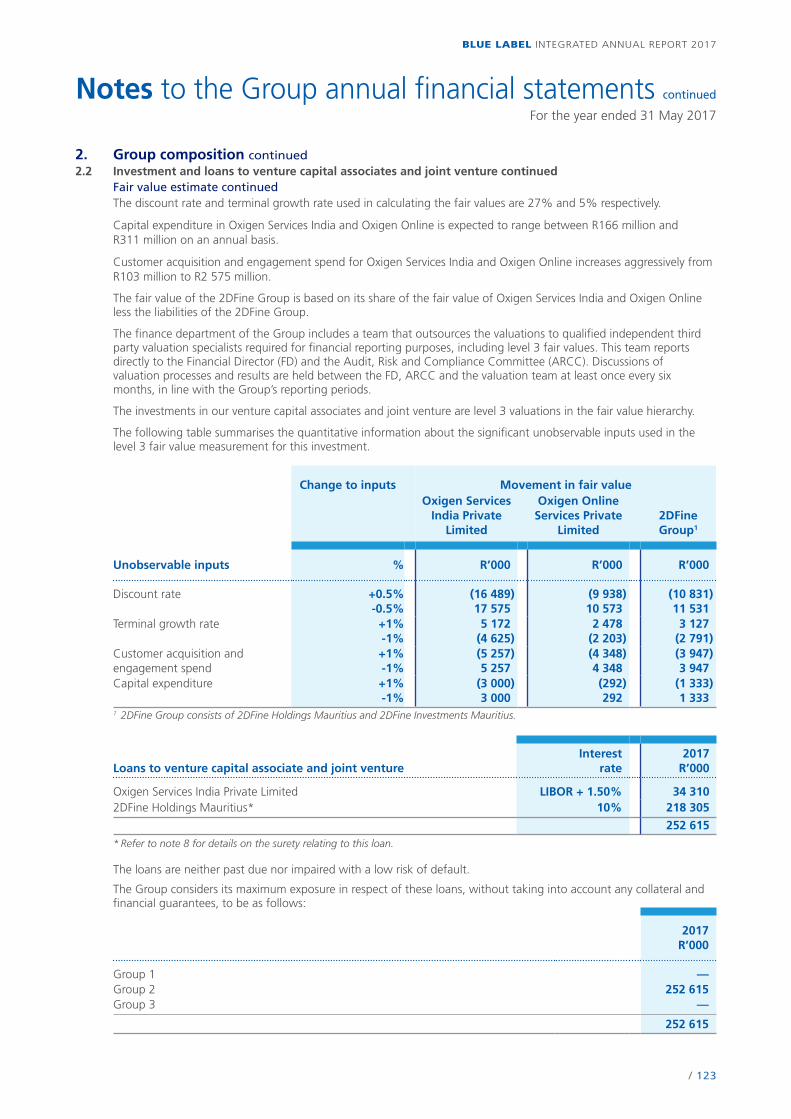
/ 123
BLUE LABEL INTEGRATED ANNUAL REPORT 2017
Notes to the Group annual financial statements continued
For the year ended 31 May 2017
2. Group composition continued2.2 Investment and loans to venture capital associates and joint venture continued
Fair value estimate continuedThe discount rate and terminal growth rate used in calculating the fair values are 27% and 5% respectively.
Capital expenditure in Oxigen Services India and Oxigen Online is expected to range between R166 million and R311 million on an annual basis.
Customer acquisition and engagement spend for Oxigen Services India and Oxigen Online increases aggressively from R103 million to R2 575 million.
The fair value of the 2DFine Group is based on its share of the fair value of Oxigen Services India and Oxigen Online less the liabilities of the 2DFine Group.
The finance department of the Group includes a team that outsources the valuations to qualified independent third party valuation specialists required for financial reporting purposes, including level 3 fair values. This team reports directly to the Financial Director (FD) and the Audit, Risk and Compliance Committee (ARCC). Discussions of valuation processes and results are held between the FD, ARCC and the valuation team at least once every six months, in line with the Group’s reporting periods.
The investments in our venture capital associates and joint venture are level 3 valuations in the fair value hierarchy.
The following table summarises the quantitative information about the significant unobservable inputs used in the level 3 fair value measurement for this investment.
Change to inputs Movement in fair valueOxigen Services
India PrivateLimited
Oxigen OnlineServices Private
Limited2DFineGroup1
Unobservable inputs % R’000 R’000 R’000
Discount rate +0.5%-0.5%
(16 489)17 575
(9 938)10 573
(10 831)11 531
Terminal growth rate +1%-1%
5 172(4 625)
2 478(2 203)
3 127(2 791)
Customer acquisition and engagement spend
+1%-1%
(5 257)5 257
(4 348)4 348
(3 947)3 947
Capital expenditure +1%-1%
(3 000)3 000
(292)292
(1 333)1 333
1 2DFine Group consists of 2DFine Holdings Mauritius and 2DFine Investments Mauritius.
Loans to venture capital associate and joint ventureInterest
rate2017
R’000
Oxigen Services India Private Limited LIBOR + 1.50% 34 310 2DFine Holdings Mauritius* 10% 218 305
252 615
* Refer to note 8 for details on the surety relating to this loan.
The loans are neither past due nor impaired with a low risk of default.
The Group considers its maximum exposure in respect of these loans, without taking into account any collateral and financial guarantees, to be as follows:
2017 R’000
Group 1 —Group 2 252 615 Group 3 —
252 615
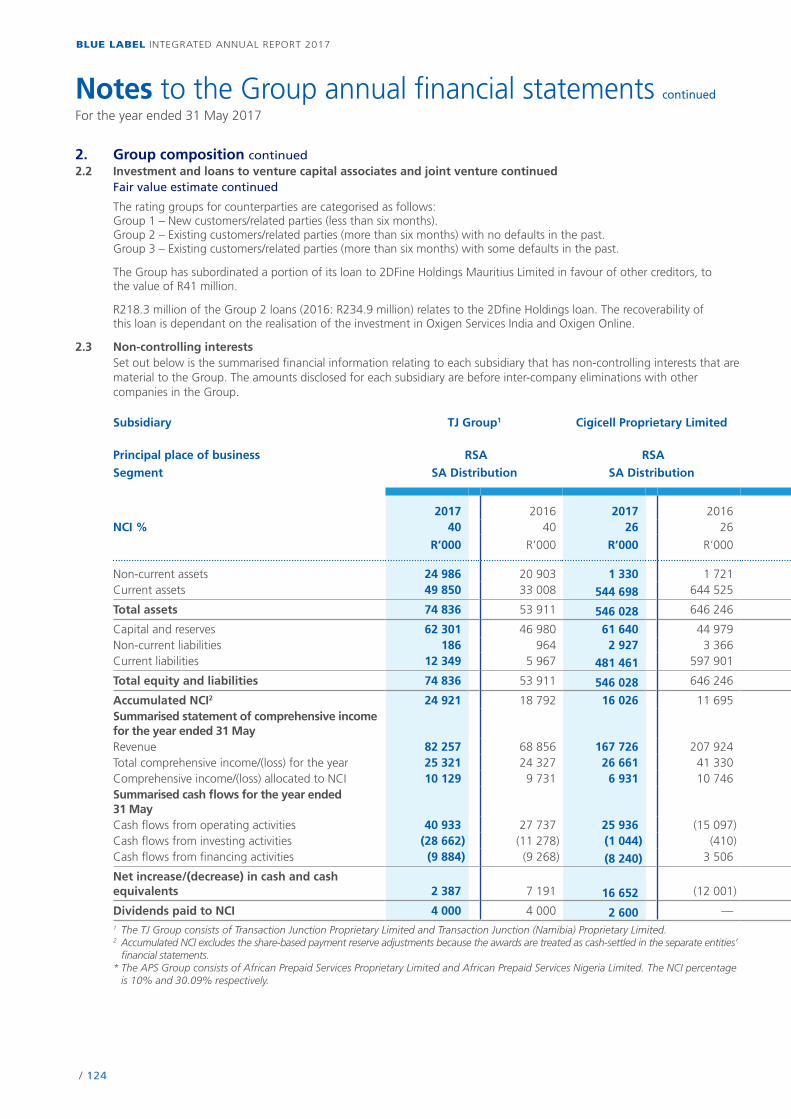
/ 124
BLUE LABEL INTEGRATED ANNUAL REPORT 2017
Notes to the Group annual financial statements continued
For the year ended 31 May 2017
2. Group composition continued2.2 Investment and loans to venture capital associates and joint venture continued
Fair value estimate continued
The rating groups for counterparties are categorised as follows:Group 1 – New customers/related parties (less than six months).Group 2 – Existing customers/related parties (more than six months) with no defaults in the past.Group 3 – Existing customers/related parties (more than six months) with some defaults in the past.
The Group has subordinated a portion of its loan to 2DFine Holdings Mauritius Limited in favour of other creditors, to the value of R41 million.
R218.3 million of the Group 2 loans (2016: R234.9 million) relates to the 2Dfine Holdings loan. The recoverability of this loan is dependant on the realisation of the investment in Oxigen Services India and Oxigen Online.
2.3 Non-controlling interests Set out below is the summarised financial information relating to each subsidiary that has non-controlling interests that are material to the Group. The amounts disclosed for each subsidiary are before inter-company eliminations with other companies in the Group.
Subsidiary TJ Group1 Cigicell Proprietary Limited APS Group* Viamedia Proprietary Limited
Blue Label Data Solutions Proprietary Limited
Principal place of business RSA RSA RSA and Nigeria RSA RSA
Segment SA Distribution SA Distribution International Mobile Solutions
2017 2016 2017 2016 2017 2016 2017 2016 2017 2016NCI % 40 40 26 26 * * 25 25 19 19
R’000 R’000 R’000 R’000 R’000 R’000 R’000 R’000 R’000 R’000
Non-current assets 24 986 20 903 1 330 1 721 — — 112 630 115 492 7 299 7 692 Current assets 49 850 33 008 544 698 644 525 59 61 111 395 92 447 55 690 72 942
Total assets 74 836 53 911 546 028 646 246 59 61 224 025 207 939 62 989 80 634
Capital and reserves 62 301 46 980 61 640 44 979 (130 528) (130 471) 187 605 159 288 39 007 55 226 Non-current liabilities 186 964 2 927 3 366 60 245 60 245 16 244 16 222 873 1 471 Current liabilities 12 349 5 967 481 461 597 901 70 342 70 287 20 176 32 429 23 109 23 937
Total equity and liabilities 74 836 53 911 546 028 646 246 59 61 224 025 207 939 62 989 80 634
Accumulated NCI2 24 921 18 792 16 026 11 695 (29 256) (29 250) 46 901 39 822 7 411 10 493 Summarised statement of comprehensive income for the year ended 31 MayRevenue 82 257 68 856 167 726 207 924 — — 224 883 186 575 172 814 155 881 Total comprehensive income/(loss) for the year 25 321 24 327 26 661 41 330 (57) (1 383) 40 905 67 238 23 781 27 708 Comprehensive income/(loss) allocated to NCI 10 129 9 731 6 931 10 746 (6) (63) 10 226 16 810 4 518 5 265 Summarised cash flows for the year ended 31 MayCash flows from operating activities 40 933 27 737 25 936 (15 097) (105) (2 417) 45 006 35 667 (15 578) 24 628 Cash flows from investing activities (28 662) (11 278) (1 044) (410) — — (17 520) (2 242) (38) (194) Cash flows from financing activities (9 884) (9 268) (8 240) 3 506 103 2 440 206 (2 725) 22 062 (24 848)
Net increase/(decrease) in cash and cash equivalents 2 387 7 191 16 652 (12 001) (2) 23 27 692 30 700 6 446 (414)
Dividends paid to NCI 4 000 4 000 2 600 — — — 12 588 — 7 600 —1 The TJ Group consists of Transaction Junction Proprietary Limited and Transaction Junction (Namibia) Proprietary Limited.2 Accumulated NCI excludes the share-based payment reserve adjustments because the awards are treated as cash-settled in the separate entities’
financial statements.* The APS Group consists of African Prepaid Services Proprietary Limited and African Prepaid Services Nigeria Limited. The NCI percentage
is 10% and 30.09% respectively.

/ 125
BLUE LABEL INTEGRATED ANNUAL REPORT 2017
Notes to the Group annual financial statements continued
For the year ended 31 May 2017
2. Group composition continued2.2 Investment and loans to venture capital associates and joint venture continued
Fair value estimate continued
The rating groups for counterparties are categorised as follows:Group 1 – New customers/related parties (less than six months).Group 2 – Existing customers/related parties (more than six months) with no defaults in the past.Group 3 – Existing customers/related parties (more than six months) with some defaults in the past.
The Group has subordinated a portion of its loan to 2DFine Holdings Mauritius Limited in favour of other creditors, to the value of R41 million.
R218.3 million of the Group 2 loans (2016: R234.9 million) relates to the 2Dfine Holdings loan. The recoverability of this loan is dependant on the realisation of the investment in Oxigen Services India and Oxigen Online.
2.3 Non-controlling interests Set out below is the summarised financial information relating to each subsidiary that has non-controlling interests that are material to the Group. The amounts disclosed for each subsidiary are before inter-company eliminations with other companies in the Group.
Subsidiary TJ Group1 Cigicell Proprietary Limited APS Group* Viamedia Proprietary Limited
Blue Label Data Solutions Proprietary Limited
Principal place of business RSA RSA RSA and Nigeria RSA RSA
Segment SA Distribution SA Distribution International Mobile Solutions
2017 2016 2017 2016 2017 2016 2017 2016 2017 2016NCI % 40 40 26 26 * * 25 25 19 19
R’000 R’000 R’000 R’000 R’000 R’000 R’000 R’000 R’000 R’000
Non-current assets 24 986 20 903 1 330 1 721 — — 112 630 115 492 7 299 7 692 Current assets 49 850 33 008 544 698 644 525 59 61 111 395 92 447 55 690 72 942
Total assets 74 836 53 911 546 028 646 246 59 61 224 025 207 939 62 989 80 634
Capital and reserves 62 301 46 980 61 640 44 979 (130 528) (130 471) 187 605 159 288 39 007 55 226 Non-current liabilities 186 964 2 927 3 366 60 245 60 245 16 244 16 222 873 1 471 Current liabilities 12 349 5 967 481 461 597 901 70 342 70 287 20 176 32 429 23 109 23 937
Total equity and liabilities 74 836 53 911 546 028 646 246 59 61 224 025 207 939 62 989 80 634
Accumulated NCI2 24 921 18 792 16 026 11 695 (29 256) (29 250) 46 901 39 822 7 411 10 493 Summarised statement of comprehensive income for the year ended 31 MayRevenue 82 257 68 856 167 726 207 924 — — 224 883 186 575 172 814 155 881 Total comprehensive income/(loss) for the year 25 321 24 327 26 661 41 330 (57) (1 383) 40 905 67 238 23 781 27 708 Comprehensive income/(loss) allocated to NCI 10 129 9 731 6 931 10 746 (6) (63) 10 226 16 810 4 518 5 265 Summarised cash flows for the year ended 31 MayCash flows from operating activities 40 933 27 737 25 936 (15 097) (105) (2 417) 45 006 35 667 (15 578) 24 628 Cash flows from investing activities (28 662) (11 278) (1 044) (410) — — (17 520) (2 242) (38) (194) Cash flows from financing activities (9 884) (9 268) (8 240) 3 506 103 2 440 206 (2 725) 22 062 (24 848)
Net increase/(decrease) in cash and cash equivalents 2 387 7 191 16 652 (12 001) (2) 23 27 692 30 700 6 446 (414)
Dividends paid to NCI 4 000 4 000 2 600 — — — 12 588 — 7 600 —1 The TJ Group consists of Transaction Junction Proprietary Limited and Transaction Junction (Namibia) Proprietary Limited.2 Accumulated NCI excludes the share-based payment reserve adjustments because the awards are treated as cash-settled in the separate entities’
financial statements.* The APS Group consists of African Prepaid Services Proprietary Limited and African Prepaid Services Nigeria Limited. The NCI percentage
is 10% and 30.09% respectively.

/ 126
BLUE LABEL INTEGRATED ANNUAL REPORT 2017
Notes to the Group annual financial statements continued
For the year ended 31 May 2017
2. Group composition continued2.4 Interest in subsidiaries, associates and joint ventures
Country
Numberof issued
ordinary sharesPercentage
held2017SubsidiariesDirectly held:Subsidiaries of Blue Label Telecoms LimitedActivi Deployment Services Proprietary Limited RSA 100 100Africa Prepaid Services Proprietary Limited RSA 420 90Africa Prepaid Services Nigeria Limited Nigeria 10 000 000 24.01Blue Label Ventures Proprietary Limited trading as Blue Label Accelerator RSA 100 100Blue Label Distribution Proprietary Limited RSA 100 100Blue Label One Proprietary Limited RSA 300 100BLT USA Inc. USA 100 100Budding Trade 1170 Proprietary Limited RSA 100 100Cellfind Proprietary Limited RSA 1 000 100Datacel Direct Proprietary Limited RSA 100 100Gold Label Investments Proprietary Limited RSA 1 000 100Panacea Mobile Proprietary Limited RSA 100 100Reware Proprietary Limited RSA 121 50.41Simigenix Proprietary Limited RSA 120 100The Prepaid Company Proprietary Limited RSA 10 000 100The Post Paid Company Proprietary Limited RSA 200 100TicketPros Proprietary Limited RSA 250 100Transaction Junction Proprietary Limited RSA 120 60Uninex Proprietary Limited RSA 100 100Ventury Group Proprietary Limited RSA 2 000 100Viamedia Proprietary Limited RSA 3 230 000 75Virtual Voucher Proprietary Limited RSA 200 100Indirectly held:Subsidiaries of The Prepaid Company Proprietary LimitedBlue Label Connect Proprietary Limited RSA 42 431 100Robtronics Proprietary Limited RSA 100 51Subsidiary of Ventury Group Proprietary LimitedCigicell Proprietary Limited RSA 100 74Subsidiary of Africa Prepaid Services Proprietary LimitedAfrica Prepaid Services Nigeria Limited Nigeria 10 000 000 51Subsidiaries of Datacel Direct Proprietary LimitedBlue Label Call Centre Proprietary Limited RSA 300 100CNS Call Centre Proprietary Limited RSA 1 000 100Blue Label Data Solutions Proprietary Limited RSA 100 81Subsidiary of Transaction Junction Proprietary LimitedTransaction Junction (Namibia) Proprietary Limited Namibia 100 100Subsidiary of 2DFine Holdings Mauritius2DFine Investments Mauritius Mauritius 1 100Subsidiaries of Blue Label Mexico S.A. de C.V.SGC Servicios Y Gestion Corporation S.A. de C.V. Mexico 500 99.8Connecta Systems LLC USA 1 000 100Pagacel S.A. de C.V. Mexico 500 99.8Transipago S.A. de C.V. Mexico 500 99.8Subsidiary of Viamedia Proprietary LimitedViadigital Proprietary Limited RSA 120 100AssociatesDirectly held:Associates of Blue Label Telecoms LimitedLornanox Proprietary Limited RSA 120 40Utilities World Proprietary Limited RSA 1 000 25.1Indirectly held:Associates of Gold Label Investments Proprietary LimitedOxigen Services India Private Limited India 15 664 785 41.96Oxigen Online Services India Private Limited India 77 010 40.96Mpower Softcomm Private Limited India 16 286 14.4*Associate of 2DFine Investments MauritiusMpower Softcomm Private Limited India 16 286 14.4*Joint venturesDirectly held:Joint ventures of Blue Label Telecoms LimitedBlue Label Mexico S.A. de C.V. Mexico 9 200 47.56**Prepaid24 Proprietary Limited (previously Banosign Proprietary Limited) RSA 501 50.1**Indirectly held:Joint ventures of Blue Label Data Solutions Proprietary LimitedDatacision Proprietary Limited RSA 100 50United Call Centre Solutions Proprietary Limited RSA 100 50Joint venture of Gold Label Investments Proprietary Limited2DFine Holdings Mauritius Mauritius 2 50Joint ventures of 2DFine Investments MauritiusOxigen Services India Private Limited India 15 664 785 33.85**Oxigen Online Services India Private Limited India 77 010 34.42**Joint ventures of Viamedia Proprietary LimitedSupaPesa Africa Limited Mauritius 100 50Supa Pesa South Africa Proprietary Limited RSA 200 50
* Significant influence is demonstrated by the Company as a result of representation on the Board of Directors.** Joint control is demonstrated by the composition of and decision-making powers afforded to the Board of Directors.
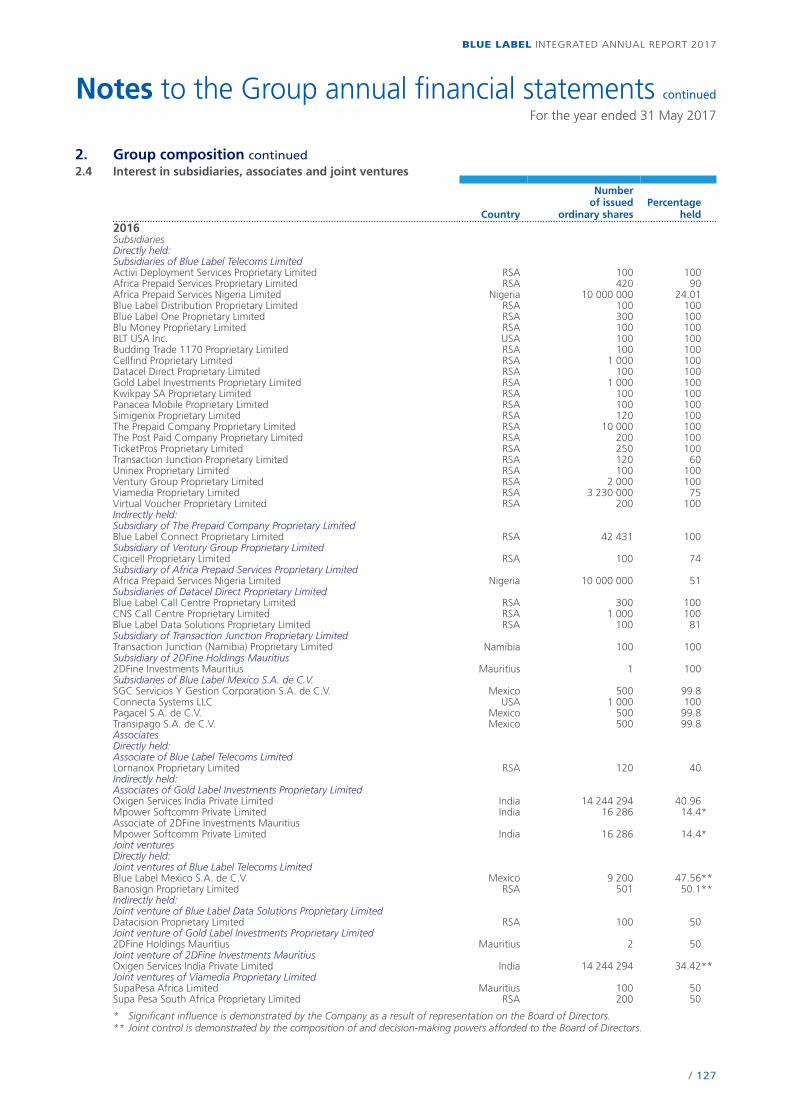
/ 127
BLUE LABEL INTEGRATED ANNUAL REPORT 2017
Notes to the Group annual financial statements continued
For the year ended 31 May 2017
2. Group composition continued2.4 Interest in subsidiaries, associates and joint ventures
Country
Numberof issued
ordinary sharesPercentage
held2016SubsidiariesDirectly held:Subsidiaries of Blue Label Telecoms LimitedActivi Deployment Services Proprietary Limited RSA 100 100Africa Prepaid Services Proprietary Limited RSA 420 90Africa Prepaid Services Nigeria Limited Nigeria 10 000 000 24.01Blue Label Distribution Proprietary Limited RSA 100 100Blue Label One Proprietary Limited RSA 300 100Blu Money Proprietary Limited RSA 100 100BLT USA Inc. USA 100 100Budding Trade 1170 Proprietary Limited RSA 100 100Cellfind Proprietary Limited RSA 1 000 100Datacel Direct Proprietary Limited RSA 100 100Gold Label Investments Proprietary Limited RSA 1 000 100Kwikpay SA Proprietary Limited RSA 100 100Panacea Mobile Proprietary Limited RSA 100 100Simigenix Proprietary Limited RSA 120 100The Prepaid Company Proprietary Limited RSA 10 000 100The Post Paid Company Proprietary Limited RSA 200 100TicketPros Proprietary Limited RSA 250 100Transaction Junction Proprietary Limited RSA 120 60Uninex Proprietary Limited RSA 100 100Ventury Group Proprietary Limited RSA 2 000 100Viamedia Proprietary Limited RSA 3 230 000 75Virtual Voucher Proprietary Limited RSA 200 100Indirectly held:Subsidiary of The Prepaid Company Proprietary LimitedBlue Label Connect Proprietary Limited RSA 42 431 100Subsidiary of Ventury Group Proprietary LimitedCigicell Proprietary Limited RSA 100 74Subsidiary of Africa Prepaid Services Proprietary LimitedAfrica Prepaid Services Nigeria Limited Nigeria 10 000 000 51Subsidiaries of Datacel Direct Proprietary LimitedBlue Label Call Centre Proprietary Limited RSA 300 100CNS Call Centre Proprietary Limited RSA 1 000 100Blue Label Data Solutions Proprietary Limited RSA 100 81Subsidiary of Transaction Junction Proprietary LimitedTransaction Junction (Namibia) Proprietary Limited Namibia 100 100Subsidiary of 2DFine Holdings Mauritius2DFine Investments Mauritius Mauritius 1 100Subsidiaries of Blue Label Mexico S.A. de C.V.SGC Servicios Y Gestion Corporation S.A. de C.V. Mexico 500 99.8Connecta Systems LLC USA 1 000 100Pagacel S.A. de C.V. Mexico 500 99.8Transipago S.A. de C.V. Mexico 500 99.8AssociatesDirectly held:Associate of Blue Label Telecoms LimitedLornanox Proprietary Limited RSA 120 40Indirectly held:Associates of Gold Label Investments Proprietary LimitedOxigen Services India Private Limited India 14 244 294 40.96Mpower Softcomm Private Limited India 16 286 14.4*Associate of 2DFine Investments MauritiusMpower Softcomm Private Limited India 16 286 14.4*Joint venturesDirectly held:Joint ventures of Blue Label Telecoms LimitedBlue Label Mexico S.A. de C.V. Mexico 9 200 47.56**Banosign Proprietary Limited RSA 501 50.1**Indirectly held:Joint venture of Blue Label Data Solutions Proprietary LimitedDatacision Proprietary Limited RSA 100 50Joint venture of Gold Label Investments Proprietary Limited2DFine Holdings Mauritius Mauritius 2 50Joint venture of 2DFine Investments MauritiusOxigen Services India Private Limited India 14 244 294 34.42**Joint ventures of Viamedia Proprietary LimitedSupaPesa Africa Limited Mauritius 100 50Supa Pesa South Africa Proprietary Limited RSA 200 50
* Significant influence is demonstrated by the Company as a result of representation on the Board of Directors.** Joint control is demonstrated by the composition of and decision-making powers afforded to the Board of Directors.
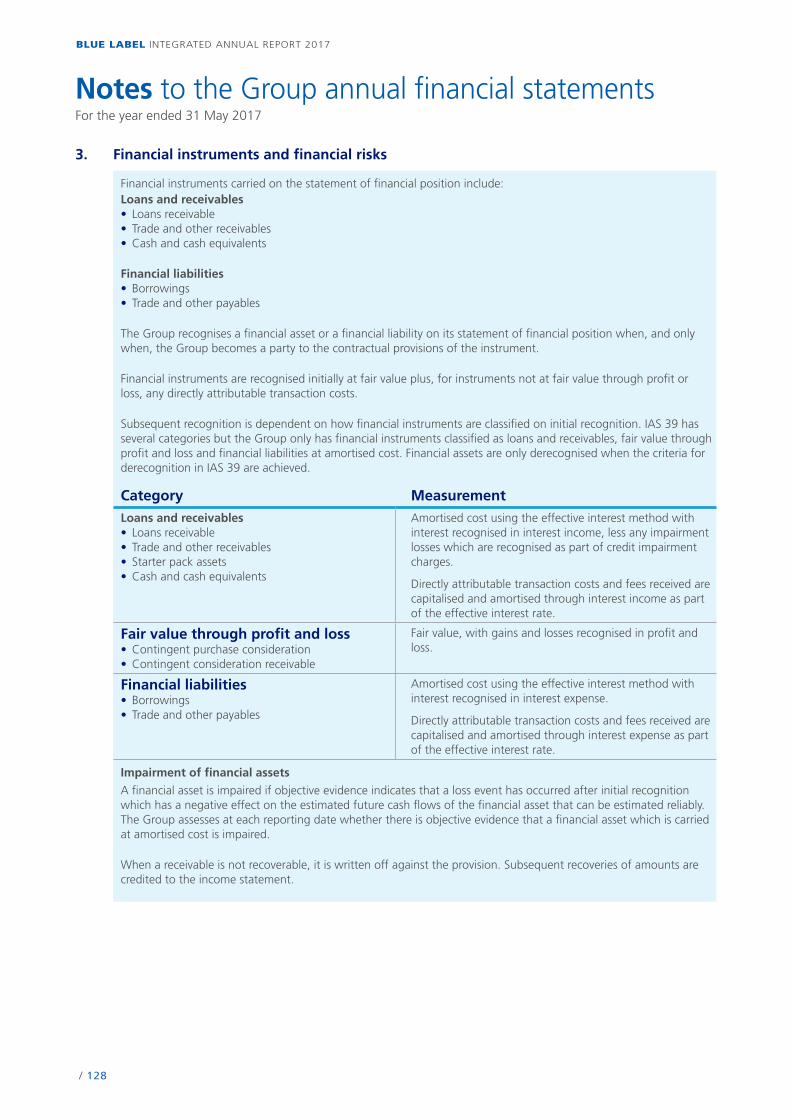
/ 128
BLUE LABEL INTEGRATED ANNUAL REPORT 2017
3. Financial instruments and financial risks
Financial instruments carried on the statement of financial position include:Loans and receivables• Loans receivable• Trade and other receivables•Cash and cash equivalents
Financial liabilities• Borrowings• Trade and other payables
The Group recognises a financial asset or a financial liability on its statement of financial position when, and only when, the Group becomes a party to the contractual provisions of the instrument.
Financial instruments are recognised initially at fair value plus, for instruments not at fair value through profit or loss, any directly attributable transaction costs.
Subsequent recognition is dependent on how financial instruments are classified on initial recognition. IAS 39 has several categories but the Group only has financial instruments classified as loans and receivables, fair value through profit and loss and financial liabilities at amortised cost. Financial assets are only derecognised when the criteria for derecognition in IAS 39 are achieved.
Category MeasurementLoans and receivables• Loans receivable• Trade and other receivables• Starter pack assets•Cash and cash equivalents
Amortised cost using the effective interest method with interest recognised in interest income, less any impairment losses which are recognised as part of credit impairment charges.
Directly attributable transaction costs and fees received are capitalised and amortised through interest income as part of the effective interest rate.
Fair value through profit and loss•Contingent purchase consideration•Contingent consideration receivable
Fair value, with gains and losses recognised in profit and loss.
Financial liabilities• Borrowings• Trade and other payables
Amortised cost using the effective interest method with interest recognised in interest expense.
Directly attributable transaction costs and fees received are capitalised and amortised through interest expense as part of the effective interest rate.
Impairment of financial assets
A financial asset is impaired if objective evidence indicates that a loss event has occurred after initial recognition which has a negative effect on the estimated future cash flows of the financial asset that can be estimated reliably. The Group assesses at each reporting date whether there is objective evidence that a financial asset which is carried at amortised cost is impaired.
When a receivable is not recoverable, it is written off against the provision. Subsequent recoveries of amounts are credited to the income statement.
Notes to the Group annual financial statements For the year ended 31 May 2017
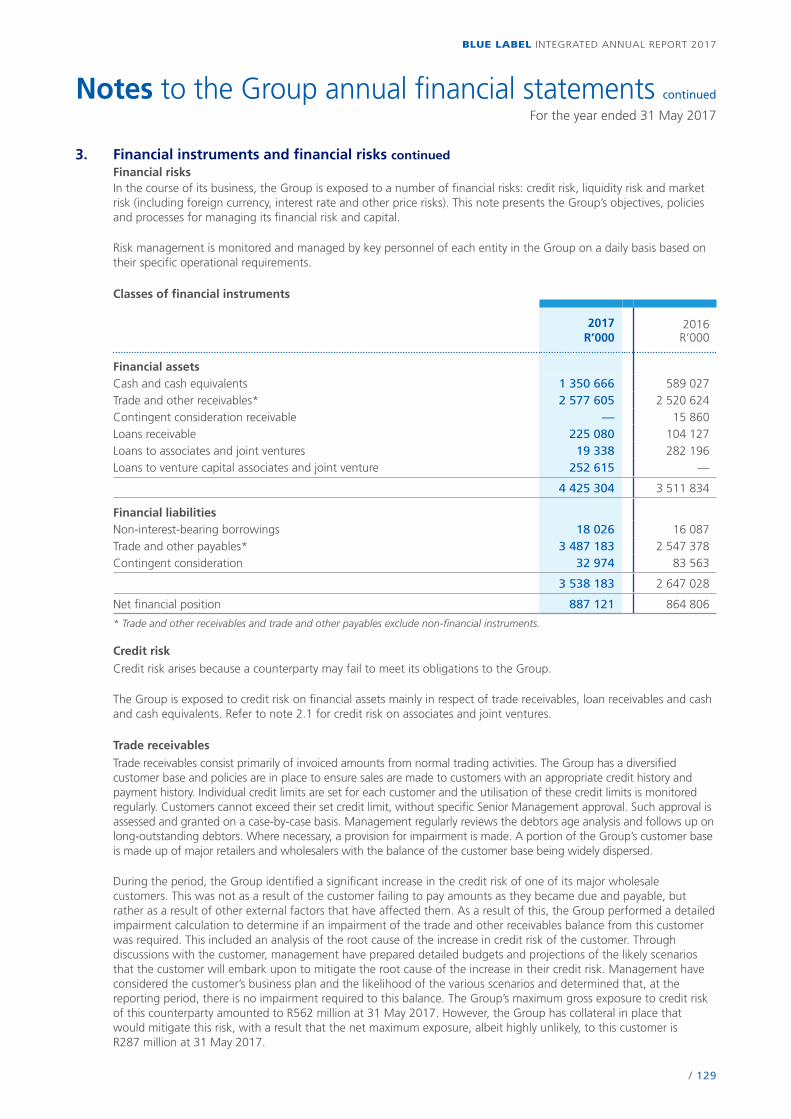
/ 129
BLUE LABEL INTEGRATED ANNUAL REPORT 2017
Notes to the Group annual financial statements continued
For the year ended 31 May 2017
3. Financial instruments and financial risks continuedFinancial risksIn the course of its business, the Group is exposed to a number of financial risks: credit risk, liquidity risk and market risk (including foreign currency, interest rate and other price risks). This note presents the Group’s objectives, policies and processes for managing its financial risk and capital.
Risk management is monitored and managed by key personnel of each entity in the Group on a daily basis based on their specific operational requirements.
Classes of financial instruments
2017R’000
2016R’000
Financial assetsCash and cash equivalents 1 350 666 589 027Trade and other receivables* 2 577 605 2 520 624Contingent consideration receivable — 15 860Loans receivable 225 080 104 127Loans to associates and joint ventures 19 338 282 196Loans to venture capital associates and joint venture 252 615 —
4 425 304 3 511 834
Financial liabilitiesNon-interest-bearing borrowings 18 026 16 087Trade and other payables* 3 487 183 2 547 378Contingent consideration 32 974 83 563
3 538 183 2 647 028
Net financial position 887 121 864 806
* Trade and other receivables and trade and other payables exclude non-financial instruments.
Credit risk
Credit risk arises because a counterparty may fail to meet its obligations to the Group.
The Group is exposed to credit risk on financial assets mainly in respect of trade receivables, loan receivables and cash and cash equivalents. Refer to note 2.1 for credit risk on associates and joint ventures.
Trade receivables
Trade receivables consist primarily of invoiced amounts from normal trading activities. The Group has a diversified customer base and policies are in place to ensure sales are made to customers with an appropriate credit history and payment history. Individual credit limits are set for each customer and the utilisation of these credit limits is monitored regularly. Customers cannot exceed their set credit limit, without specific Senior Management approval. Such approval is assessed and granted on a case-by-case basis. Management regularly reviews the debtors age analysis and follows up on long-outstanding debtors. Where necessary, a provision for impairment is made. A portion of the Group’s customer base is made up of major retailers and wholesalers with the balance of the customer base being widely dispersed.
During the period, the Group identified a significant increase in the credit risk of one of its major wholesale customers. This was not as a result of the customer failing to pay amounts as they became due and payable, but rather as a result of other external factors that have affected them. As a result of this, the Group performed a detailed impairment calculation to determine if an impairment of the trade and other receivables balance from this customer was required. This included an analysis of the root cause of the increase in credit risk of the customer. Through discussions with the customer, management have prepared detailed budgets and projections of the likely scenarios that the customer will embark upon to mitigate the root cause of the increase in their credit risk. Management have considered the customer’s business plan and the likelihood of the various scenarios and determined that, at the reporting period, there is no impairment required to this balance. The Group’s maximum gross exposure to credit risk of this counterparty amounted to R562 million at 31 May 2017. However, the Group has collateral in place that would mitigate this risk, with a result that the net maximum exposure, albeit highly unlikely, to this customer is R287 million at 31 May 2017.
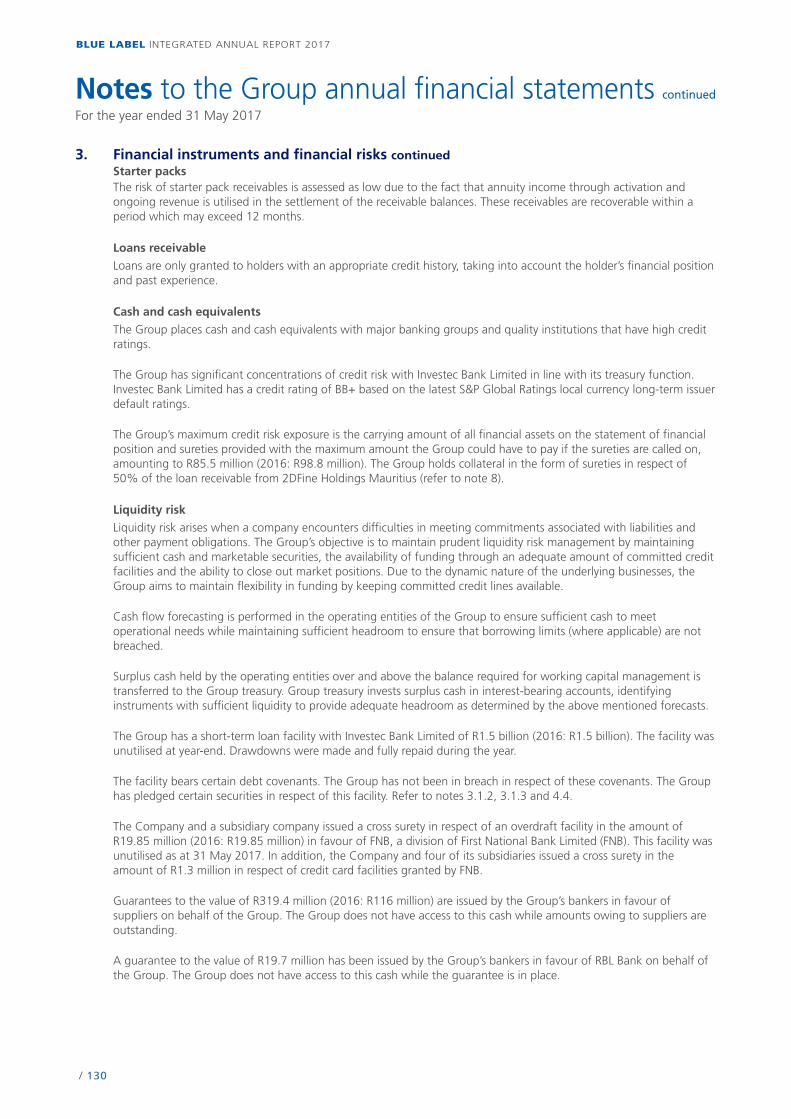
/ 130
BLUE LABEL INTEGRATED ANNUAL REPORT 2017
3. Financial instruments and financial risks continuedStarter packsThe risk of starter pack receivables is assessed as low due to the fact that annuity income through activation and ongoing revenue is utilised in the settlement of the receivable balances. These receivables are recoverable within a period which may exceed 12 months.
Loans receivable
Loans are only granted to holders with an appropriate credit history, taking into account the holder’s financial position and past experience.
Cash and cash equivalents
The Group places cash and cash equivalents with major banking groups and quality institutions that have high credit ratings.
The Group has significant concentrations of credit risk with Investec Bank Limited in line with its treasury function. Investec Bank Limited has a credit rating of BB+ based on the latest S&P Global Ratings local currency long-term issuer default ratings.
The Group’s maximum credit risk exposure is the carrying amount of all financial assets on the statement of financial position and sureties provided with the maximum amount the Group could have to pay if the sureties are called on, amounting to R85.5 million (2016: R98.8 million). The Group holds collateral in the form of sureties in respect of 50% of the loan receivable from 2DFine Holdings Mauritius (refer to note 8).
Liquidity risk
Liquidity risk arises when a company encounters difficulties in meeting commitments associated with liabilities and other payment obligations. The Group’s objective is to maintain prudent liquidity risk management by maintaining sufficient cash and marketable securities, the availability of funding through an adequate amount of committed credit facilities and the ability to close out market positions. Due to the dynamic nature of the underlying businesses, the Group aims to maintain flexibility in funding by keeping committed credit lines available.
Cash flow forecasting is performed in the operating entities of the Group to ensure sufficient cash to meet operational needs while maintaining sufficient headroom to ensure that borrowing limits (where applicable) are not breached.
Surplus cash held by the operating entities over and above the balance required for working capital management is transferred to the Group treasury. Group treasury invests surplus cash in interest-bearing accounts, identifyinginstruments with sufficient liquidity to provide adequate headroom as determined by the above mentioned forecasts.
The Group has a short-term loan facility with Investec Bank Limited of R1.5 billion (2016: R1.5 billion). The facility was unutilised at year-end. Drawdowns were made and fully repaid during the year.
The facility bears certain debt covenants. The Group has not been in breach in respect of these covenants. The Group has pledged certain securities in respect of this facility. Refer to notes 3.1.2, 3.1.3 and 4.4.
The Company and a subsidiary company issued a cross surety in respect of an overdraft facility in the amount of R19.85 million (2016: R19.85 million) in favour of FNB, a division of First National Bank Limited (FNB). This facility was unutilised as at 31 May 2017. In addition, the Company and four of its subsidiaries issued a cross surety in the amount of R1.3 million in respect of credit card facilities granted by FNB.
Guarantees to the value of R319.4 million (2016: R116 million) are issued by the Group’s bankers in favour of suppliers on behalf of the Group. The Group does not have access to this cash while amounts owing to suppliers are outstanding.
A guarantee to the value of R19.7 million has been issued by the Group’s bankers in favour of RBL Bank on behalf of the Group. The Group does not have access to this cash while the guarantee is in place.
Notes to the Group annual financial statements continued
For the year ended 31 May 2017
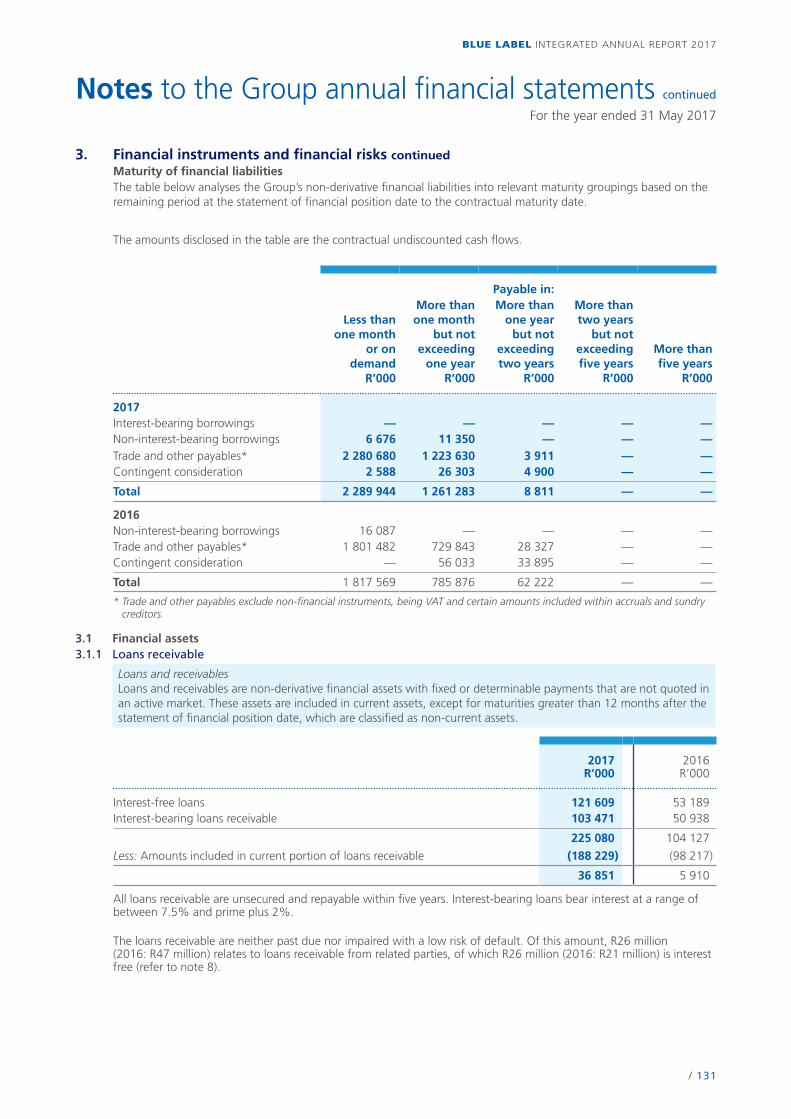
/ 131
BLUE LABEL INTEGRATED ANNUAL REPORT 2017
Notes to the Group annual financial statements continued
For the year ended 31 May 2017
3. Financial instruments and financial risks continuedMaturity of financial liabilitiesThe table below analyses the Group’s non-derivative financial liabilities into relevant maturity groupings based on the remaining period at the statement of financial position date to the contractual maturity date.
The amounts disclosed in the table are the contractual undiscounted cash flows.
Payable in:
Less than one month
or on demand
R’000
More than one month
but not exceeding
one year R’000
More than one year
but not exceeding two years
R’000
More than two years
but not exceeding five years
R’000
More than five years
R’000
2017Interest-bearing borrowings — — — — —Non-interest-bearing borrowings 6 676 11 350 — — —Trade and other payables* 2 280 680 1 223 630 3 911 — —Contingent consideration 2 588 26 303 4 900 — —
Total 2 289 944 1 261 283 8 811 — —
2016Non-interest-bearing borrowings 16 087 — — — —Trade and other payables* 1 801 482 729 843 28 327 — —Contingent consideration — 56 033 33 895 — —
Total 1 817 569 785 876 62 222 — —
* Trade and other payables exclude non-financial instruments, being VAT and certain amounts included within accruals and sundry creditors.
3.1 Financial assets3.1.1 Loans receivable
Loans and receivablesLoans and receivables are non-derivative financial assets with fixed or determinable payments that are not quoted in an active market. These assets are included in current assets, except for maturities greater than 12 months after the statement of financial position date, which are classified as non-current assets.
2017R’000
2016R’000
Interest-free loans 121 609 53 189Interest-bearing loans receivable 103 471 50 938
225 080 104 127
Less: Amounts included in current portion of loans receivable (188 229) (98 217)
36 851 5 910
All loans receivable are unsecured and repayable within five years. Interest-bearing loans bear interest at a range of between 7.5% and prime plus 2%.
The loans receivable are neither past due nor impaired with a low risk of default. Of this amount, R26 million(2016: R47 million) relates to loans receivable from related parties, of which R26 million (2016: R21 million) is interest free (refer to note 8).
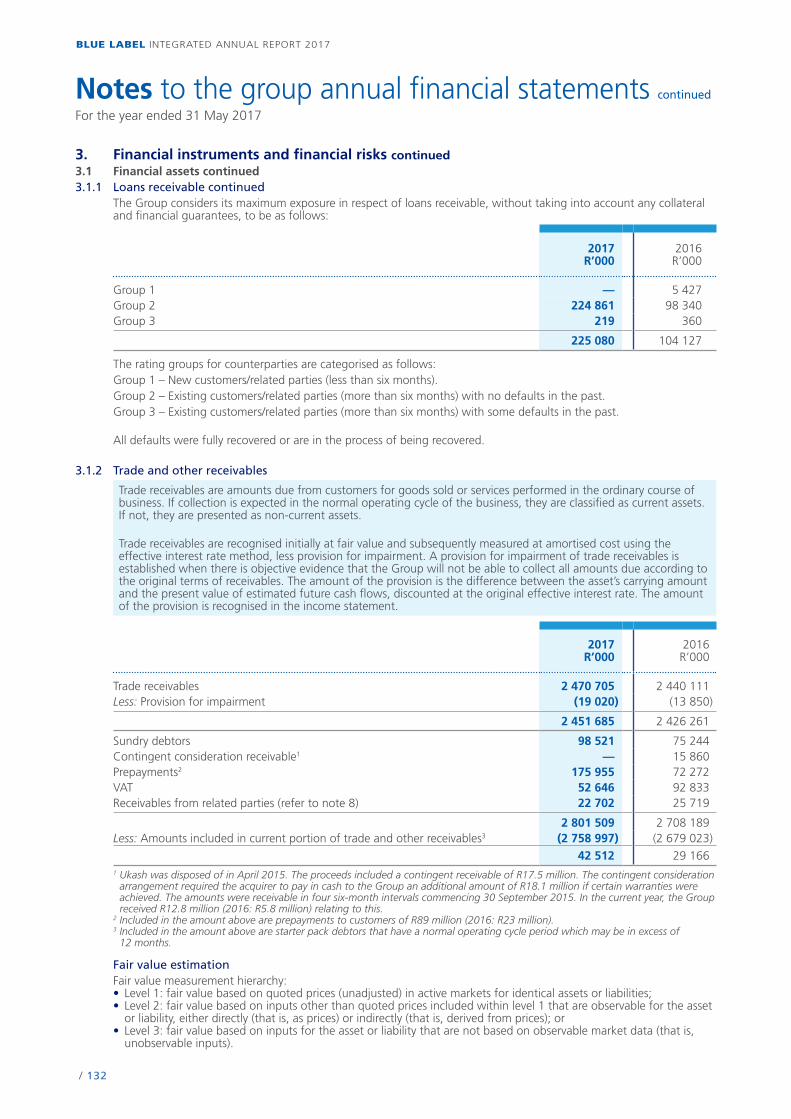
/ 132
BLUE LABEL INTEGRATED ANNUAL REPORT 2017
3. Financial instruments and financial risks continued3.1 Financial assets continued3.1.1 Loans receivable continued
The Group considers its maximum exposure in respect of loans receivable, without taking into account any collateral and financial guarantees, to be as follows:
2017R’000
2016R’000
Group 1 — 5 427Group 2 224 861 98 340Group 3 219 360
225 080 104 127
The rating groups for counterparties are categorised as follows:Group 1 – New customers/related parties (less than six months).Group 2 – Existing customers/related parties (more than six months) with no defaults in the past.Group 3 – Existing customers/related parties (more than six months) with some defaults in the past.
All defaults were fully recovered or are in the process of being recovered.
3.1.2 Trade and other receivables
Trade receivables are amounts due from customers for goods sold or services performed in the ordinary course of business. If collection is expected in the normal operating cycle of the business, they are classified as current assets. If not, they are presented as non-current assets.
Trade receivables are recognised initially at fair value and subsequently measured at amortised cost using the effective interest rate method, less provision for impairment. A provision for impairment of trade receivables is established when there is objective evidence that the Group will not be able to collect all amounts due according to the original terms of receivables. The amount of the provision is the difference between the asset’s carrying amount and the present value of estimated future cash flows, discounted at the original effective interest rate. The amount of the provision is recognised in the income statement.
2017R’000
2016R’000
Trade receivables 2 470 705 2 440 111Less: Provision for impairment (19 020) (13 850)
2 451 685 2 426 261
Sundry debtors 98 521 75 244Contingent consideration receivable1 — 15 860Prepayments2 175 955 72 272VAT 52 646 92 833Receivables from related parties (refer to note 8) 22 702 25 719
2 801 509 2 708 189Less: Amounts included in current portion of trade and other receivables3 (2 758 997) (2 679 023)
42 512 29 1661 Ukash was disposed of in April 2015. The proceeds included a contingent receivable of R17.5 million. The contingent consideration
arrangement required the acquirer to pay in cash to the Group an additional amount of R18.1 million if certain warranties were achieved. The amounts were receivable in four six-month intervals commencing 30 September 2015. In the current year, the Group received R12.8 million (2016: R5.8 million) relating to this.
2 Included in the amount above are prepayments to customers of R89 million (2016: R23 million).3 Included in the amount above are starter pack debtors that have a normal operating cycle period which may be in excess of
12 months.
Fair value estimationFair value measurement hierarchy:• Level 1: fair value based on quoted prices (unadjusted) in active markets for identical assets or liabilities;• Level 2: fair value based on inputs other than quoted prices included within level 1 that are observable for the asset
or liability, either directly (that is, as prices) or indirectly (that is, derived from prices); or• Level 3: fair value based on inputs for the asset or liability that are not based on observable market data (that is,
unobservable inputs).
Notes to the group annual financial statements continued
For the year ended 31 May 2017
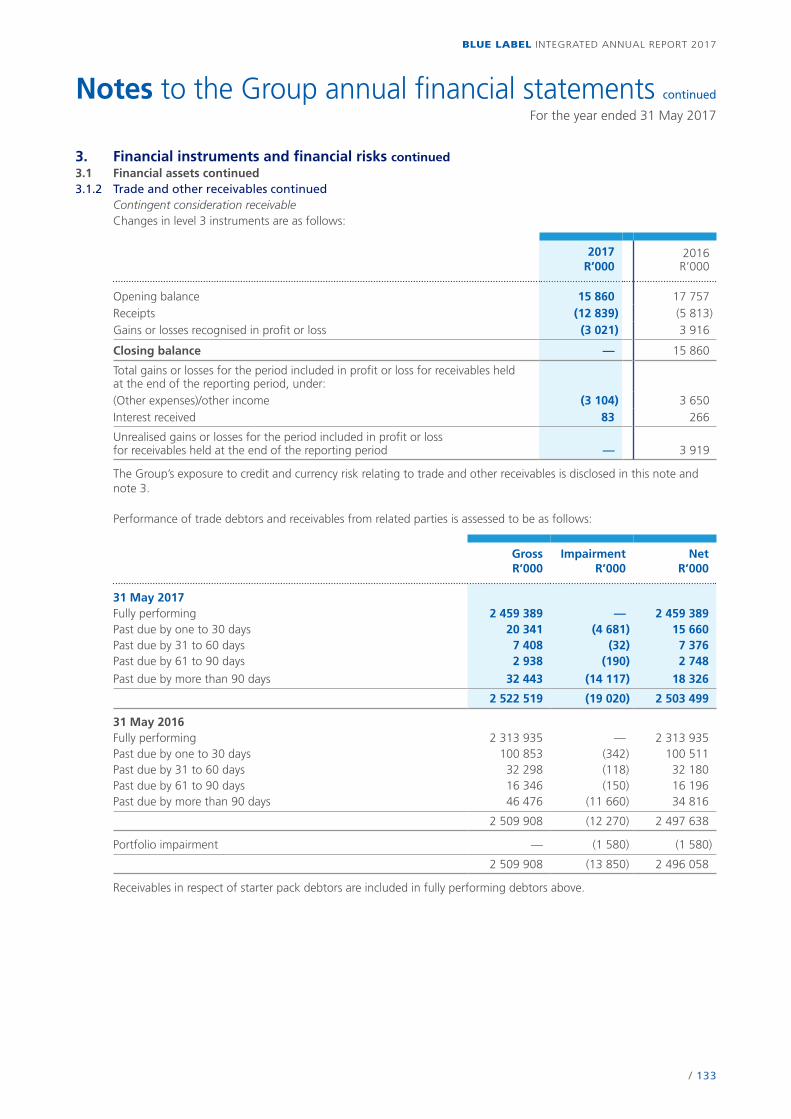
/ 133
BLUE LABEL INTEGRATED ANNUAL REPORT 2017
Notes to the Group annual financial statements continued
For the year ended 31 May 2017
3. Financial instruments and financial risks continued3.1 Financial assets continued3.1.2 Trade and other receivables continued
Contingent consideration receivableChanges in level 3 instruments are as follows:
2017 R’000
2016 R’000
Opening balance 15 860 17 757Receipts (12 839) (5 813)Gains or losses recognised in profit or loss (3 021) 3 916
Closing balance — 15 860
Total gains or losses for the period included in profit or loss for receivables held at the end of the reporting period, under:(Other expenses)/other income (3 104) 3 650Interest received 83 266
Unrealised gains or losses for the period included in profit or loss for receivables held at the end of the reporting period — 3 919
The Group’s exposure to credit and currency risk relating to trade and other receivables is disclosed in this note and note 3.
Performance of trade debtors and receivables from related parties is assessed to be as follows:
GrossR’000
ImpairmentR’000
NetR’000
31 May 2017Fully performing 2 459 389 — 2 459 389Past due by one to 30 days 20 341 (4 681) 15 660Past due by 31 to 60 days 7 408 (32) 7 376Past due by 61 to 90 days 2 938 (190) 2 748
Past due by more than 90 days 32 443 (14 117) 18 326
2 522 519 (19 020) 2 503 499
31 May 2016Fully performing 2 313 935 — 2 313 935Past due by one to 30 days 100 853 (342) 100 511Past due by 31 to 60 days 32 298 (118) 32 180Past due by 61 to 90 days 16 346 (150) 16 196Past due by more than 90 days 46 476 (11 660) 34 816
2 509 908 (12 270) 2 497 638
Portfolio impairment — (1 580) (1 580)
2 509 908 (13 850) 2 496 058
Receivables in respect of starter pack debtors are included in fully performing debtors above.
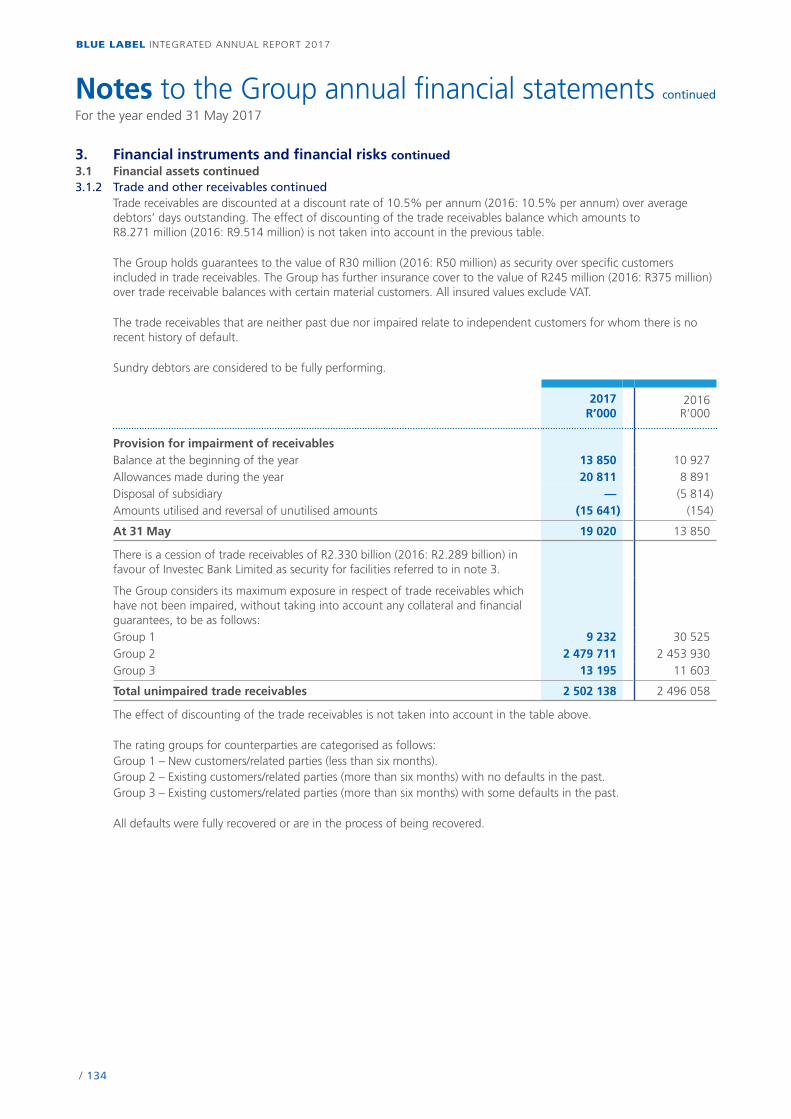
/ 134
BLUE LABEL INTEGRATED ANNUAL REPORT 2017
3. Financial instruments and financial risks continued3.1 Financial assets continued3.1.2 Trade and other receivables continued
Trade receivables are discounted at a discount rate of 10.5% per annum (2016: 10.5% per annum) over average debtors’ days outstanding. The effect of discounting of the trade receivables balance which amounts to R8.271 million (2016: R9.514 million) is not taken into account in the previous table.
The Group holds guarantees to the value of R30 million (2016: R50 million) as security over specific customersincluded in trade receivables. The Group has further insurance cover to the value of R245 million (2016: R375 million)over trade receivable balances with certain material customers. All insured values exclude VAT.
The trade receivables that are neither past due nor impaired relate to independent customers for whom there is norecent history of default.
Sundry debtors are considered to be fully performing.
2017R’000
2016R’000
Provision for impairment of receivablesBalance at the beginning of the year 13 850 10 927Allowances made during the year 20 811 8 891Disposal of subsidiary — (5 814)Amounts utilised and reversal of unutilised amounts (15 641) (154)
At 31 May 19 020 13 850
There is a cession of trade receivables of R2.330 billion (2016: R2.289 billion) in favour of Investec Bank Limited as security for facilities referred to in note 3.
The Group considers its maximum exposure in respect of trade receivables which have not been impaired, without taking into account any collateral and financial guarantees, to be as follows:Group 1 9 232 30 525Group 2 2 479 711 2 453 930Group 3 13 195 11 603
Total unimpaired trade receivables 2 502 138 2 496 058
The effect of discounting of the trade receivables is not taken into account in the table above.
The rating groups for counterparties are categorised as follows:Group 1 – New customers/related parties (less than six months).Group 2 – Existing customers/related parties (more than six months) with no defaults in the past.Group 3 – Existing customers/related parties (more than six months) with some defaults in the past.
All defaults were fully recovered or are in the process of being recovered.
Notes to the Group annual financial statements continued
For the year ended 31 May 2017
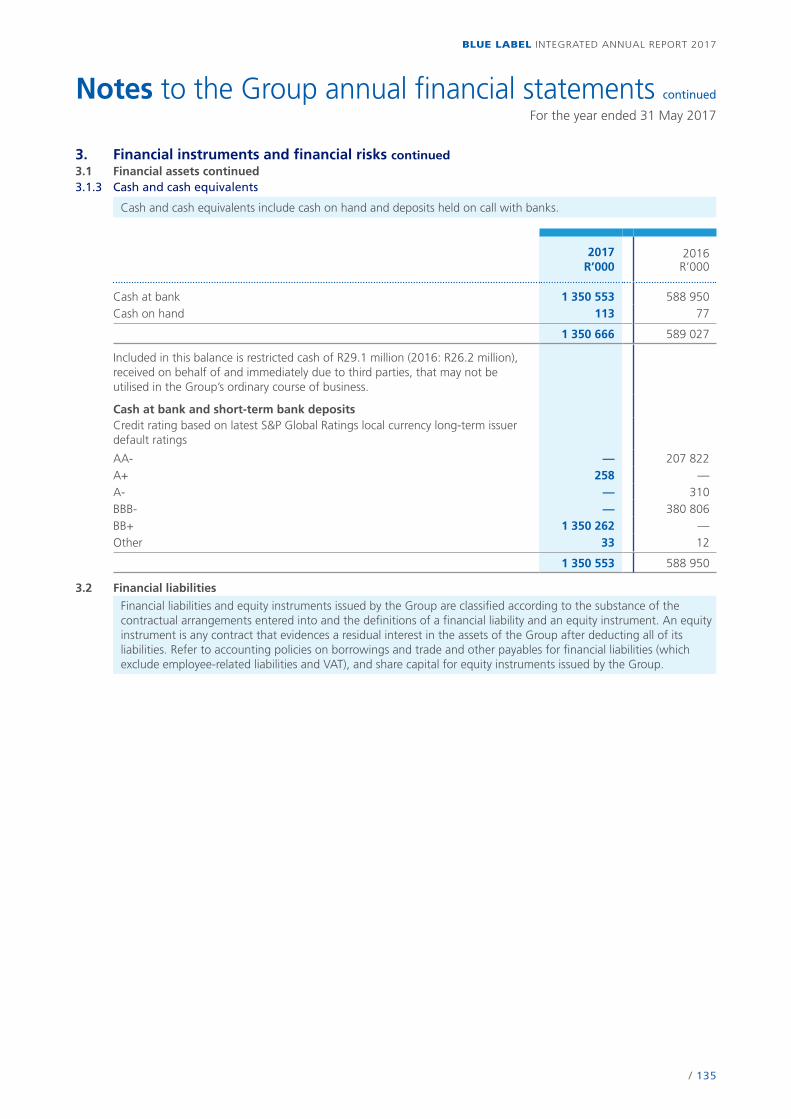
/ 135
BLUE LABEL INTEGRATED ANNUAL REPORT 2017
Notes to the Group annual financial statements continued
For the year ended 31 May 2017
3. Financial instruments and financial risks continued3.1 Financial assets continued3.1.3 Cash and cash equivalents
Cash and cash equivalents include cash on hand and deposits held on call with banks.
2017R’000
2016R’000
Cash at bank 1 350 553 588 950Cash on hand 113 77
1 350 666 589 027
Included in this balance is restricted cash of R29.1 million (2016: R26.2 million), received on behalf of and immediately due to third parties, that may not be utilised in the Group’s ordinary course of business.
Cash at bank and short-term bank depositsCredit rating based on latest S&P Global Ratings local currency long-term issuer default ratings
AA- — 207 822A+ 258 —A- — 310BBB- — 380 806BB+ 1 350 262 —Other 33 12
1 350 553 588 950
3.2 Financial liabilities
Financial liabilities and equity instruments issued by the Group are classified according to the substance of the contractual arrangements entered into and the definitions of a financial liability and an equity instrument. An equity instrument is any contract that evidences a residual interest in the assets of the Group after deducting all of its liabilities. Refer to accounting policies on borrowings and trade and other payables for financial liabilities (which exclude employee-related liabilities and VAT), and share capital for equity instruments issued by the Group.

/ 136
BLUE LABEL INTEGRATED ANNUAL REPORT 2017
Notes to the Group annual financial statements continued
For the year ended 31 May 2017
3. Financial instruments and financial risks continued3.2 Financial liabilities continued3.2.1 Trade and other payables
Trade payables are obligations to pay for goods or services that have been acquired in the ordinary course of business from suppliers. Trade payables are classified as current liabilities if payment is due within the normal operating cycle of the business. If not, they are presented as non-current liabilities.
2017R’000
2016R’000
Trade payables 3 167 171 2 235 245Accruals 138 428 116 240Employee benefits 71 458 70 142Sundry creditors 88 189 103 194Deferred revenue 2 786 2 044Contingent consideration 32 974 83 563VAT 19 332 9 048Payables to related parties (refer to note 8) 3 609 23 144
3 523 947 2 642 620Less: Amounts included in current portion of trade and other payables (3 517 673) (2 601 807)
6 274 40 813
Trade payables are discounted at a discount rate of 10.5% per annum (2016: 10.5% per annum) based on average creditors’ days outstanding. The effect of discounting of the trade payables balance amounts to R21.0 million (2016: R13.6 million).
Fair value estimationFair value measurement hierarchy:• Level 1: fair value based on quoted prices (unadjusted) in active markets for identical assets or liabilities;• Level 2: fair value based on inputs other than quoted prices included within level 1 that are observable for the asset
or liability, either directly (that is, as prices) or indirectly (that is, derived from prices); or• Level 3: fair value based on inputs for the asset or liability that are not based on observable market data (that is,
observable inputs).
Contingent considerationChanges in level 3 instruments are as follows:
2017R’000
2016R’000
Opening balance 83 563 123 902Acquisition of Reware Proprietary Limited 1 150 —Acquisition of Utilities World Proprietary Limited 4 516 —Settlements (50 666) (1 931)Gains or losses recognised in profit or loss (5 589) (38 408)
Closing balance 32 974 83 563
Total gains or losses for the period included in profit or loss for liabilities held at the end of the reporting period, under:Other income (10 210) (48 120)Interest paid 4 621 9 712
Unrealised gains or losses recognised in profit or loss for liabilities held at the end of the reporting period 5 304 9 127
The closing balance includes R5.6 million relating to SupaPesa Africa Limited, R18.3 million relating to Viamedia Proprietary Limited, R4 million to Utilities World Proprietary Limited and R5 million to other contingent considerations.
/ 137
BLUE LABEL INTEGRATED ANNUAL REPORT 2017
Notes to the Group annual financial statements continued
For the year ended 31 May 2017
3. Financial instruments and financial risks continued3.2 Financial liabilities continued3.2.1 Trade and other payables continued
Acquisition of SupaPesa Africa LimitedThe fair value of the contingent consideration arrangement of R29.9 million was originally estimated by applying the income approach. The fair value estimates are based on a discount rate of 9.25%. For all profit targets management has assumed a probability of 100% initially. In determining these probabilities management has assessed the cash flow projections based on financial budgets for the forthcoming three years which are based on assumptions of the business, industry and economic growth.
In the prior year management reassessed the cash flows taking into account the profit targets and the probability of meeting these as well as the forecast financial budget. The probabilities have been adjusted downwards from 100% to between 32% and 55%. This resulted in a release of R17.2 million into the income statement, included in other income.
In the current year management reassessed the cash flows taking into account the profit targets and the probability of meeting these as well as the forecast financial budget. The probabilities have been adjusted downwards from between 32% and 55% to between 13% and 28%. This resulted in a release of R5.5 million into the income statement, included in other income.
Acquisition of Viamedia Proprietary Limited (Viamedia)The contingent consideration arrangement requires Blue Label Telecoms Limited to pay in cash the former ownerof Viamedia, an additional amount of R215.6 million if certain profit warranties are achieved. The first three amounts of R24.1 million are based on the profits of Viamedia for the year ended 31 May 2015 and 31 May 2016, and ending 31 May 2017. The fourth and fifth amounts of R30.9 million and R112.5 million are based on the profits of Viamedia for the three years ending 31 May 2017.
Originally the fair value of the contingent consideration arrangement of R84.8 million was estimated by applying the income approach. The fair value estimates were based on a discount rate of 9%. For the first, second, third and fourth profit targets management had assumed a probability of 100%. For the fifth profit target management had assumed a probability of 0%. In determining these probabilities management had assessed the cash flow projections based on financial budgets for the forthcoming three years which were based on assumptions of the business, industry and economic growth.
In the prior year management reassessed the cash flows taking into account the profit targets and the probability of meeting these as well as the forecast financial budget. For the first, second and third profit targets, the probabilities were adjusted downwards from 100% to between 84% and 100%. For the fourth profit target management had assumed a probability of 0%. This resulted in a release of R30.8 million into the income statement in the prior year, included in other income.
In the current year management reassessed the cash flows taking into account the profit targets and the probability of meeting these as well as the forecast financial budget. For the third profit targets the probability has been adjusted downwards from 100% to 77%. This has resulted in a release of R6.8 million into the income statement, included in other income.
Acquisition of Reware Proprietary LimitedThe contingent consideration arrangement requires Blue Label Telecoms Limited to pay in cash the former owner of Reware an additional amount, totalling 10% of Reware’s net profit for the year ended May 2017 and 5% of Reware’s net profit for the year ended May 2018, if certain profit warranties are achieved. The fair value of the contingent consideration arrangement of R1.1 million was estimated by applying the income approach. The fair value estimates are based on a discount rate of 10.5%.
Management assessed the cash flows taking into account the forecast financial budget, profit targets and the probability of meeting these. The probability of Reware reaching the May 2017 target and May 2018 target was assessed at 0% and 100% respectively. At year-end management reassessed the probability of Reware reaching the May 2018 target based on new forecast financial budgets and adjusted it downwards from 100% to 0%. This has resulted in a release of R1.3 million into the income statement, included in other income.
Acquisition of Utilities World Proprietary LimitedThe contingent consideration arrangement required Blue Label Telecoms Limited to pay in cash the former owner of Utilities World Proprietary Limited (Utilities World) an additional amount of R5 million if certain profit warranties were achieved for the 12 months ended 28 February 2017. The fair value of the contingent consideration arrangement of R4.5 million was estimated by applying the income approach. The fair value estimates were based on a discount rate of 10.5%.
Management assessed the cash flows taking into account the forecast financial budget, profit targets and the probability of meeting these. The probability of Utilities World reaching its target was initially assessed at 100%. While this target was not met, Utilities World did reach a secondary target, requiring management to pay the former owners R4 million post-year end.
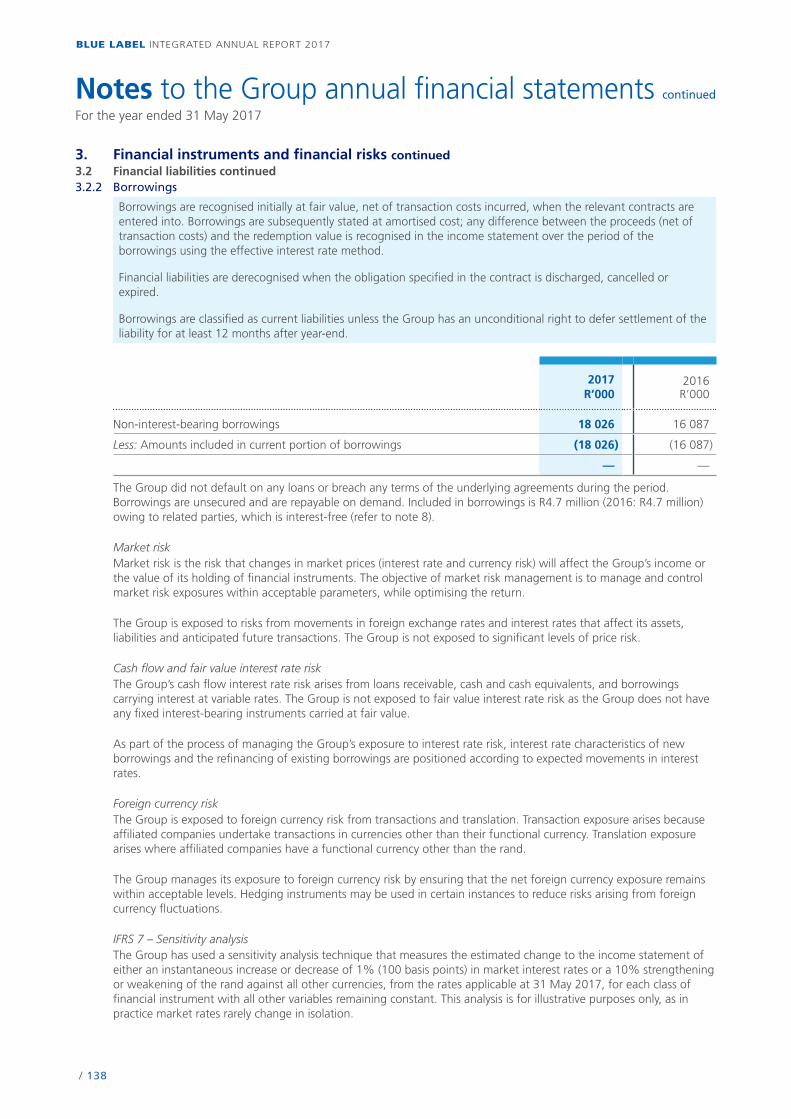
/ 138
BLUE LABEL INTEGRATED ANNUAL REPORT 2017
Notes to the Group annual financial statements continued
For the year ended 31 May 2017
3. Financial instruments and financial risks continued3.2 Financial liabilities continued3.2.2 Borrowings
Borrowings are recognised initially at fair value, net of transaction costs incurred, when the relevant contracts are entered into. Borrowings are subsequently stated at amortised cost; any difference between the proceeds (net of transaction costs) and the redemption value is recognised in the income statement over the period of the borrowings using the effective interest rate method.
Financial liabilities are derecognised when the obligation specified in the contract is discharged, cancelled or expired.
Borrowings are classified as current liabilities unless the Group has an unconditional right to defer settlement of the liability for at least 12 months after year-end.
2017R’000
2016R’000
Non-interest-bearing borrowings 18 026 16 087
Less: Amounts included in current portion of borrowings (18 026) (16 087)
— —
The Group did not default on any loans or breach any terms of the underlying agreements during the period. Borrowings are unsecured and are repayable on demand. Included in borrowings is R4.7 million (2016: R4.7 million) owing to related parties, which is interest-free (refer to note 8).
Market riskMarket risk is the risk that changes in market prices (interest rate and currency risk) will affect the Group’s income or the value of its holding of financial instruments. The objective of market risk management is to manage and control market risk exposures within acceptable parameters, while optimising the return.
The Group is exposed to risks from movements in foreign exchange rates and interest rates that affect its assets, liabilities and anticipated future transactions. The Group is not exposed to significant levels of price risk.
Cash flow and fair value interest rate riskThe Group’s cash flow interest rate risk arises from loans receivable, cash and cash equivalents, and borrowings carrying interest at variable rates. The Group is not exposed to fair value interest rate risk as the Group does not have any fixed interest-bearing instruments carried at fair value.
As part of the process of managing the Group’s exposure to interest rate risk, interest rate characteristics of new borrowings and the refinancing of existing borrowings are positioned according to expected movements in interest rates.
Foreign currency riskThe Group is exposed to foreign currency risk from transactions and translation. Transaction exposure arises because affiliated companies undertake transactions in currencies other than their functional currency. Translation exposure arises where affiliated companies have a functional currency other than the rand.
The Group manages its exposure to foreign currency risk by ensuring that the net foreign currency exposure remains within acceptable levels. Hedging instruments may be used in certain instances to reduce risks arising from foreign currency fluctuations.
IFRS 7 – Sensitivity analysisThe Group has used a sensitivity analysis technique that measures the estimated change to the income statement of either an instantaneous increase or decrease of 1% (100 basis points) in market interest rates or a 10% strengthening or weakening of the rand against all other currencies, from the rates applicable at 31 May 2017, for each class of financial instrument with all other variables remaining constant. This analysis is for illustrative purposes only, as in practice market rates rarely change in isolation.
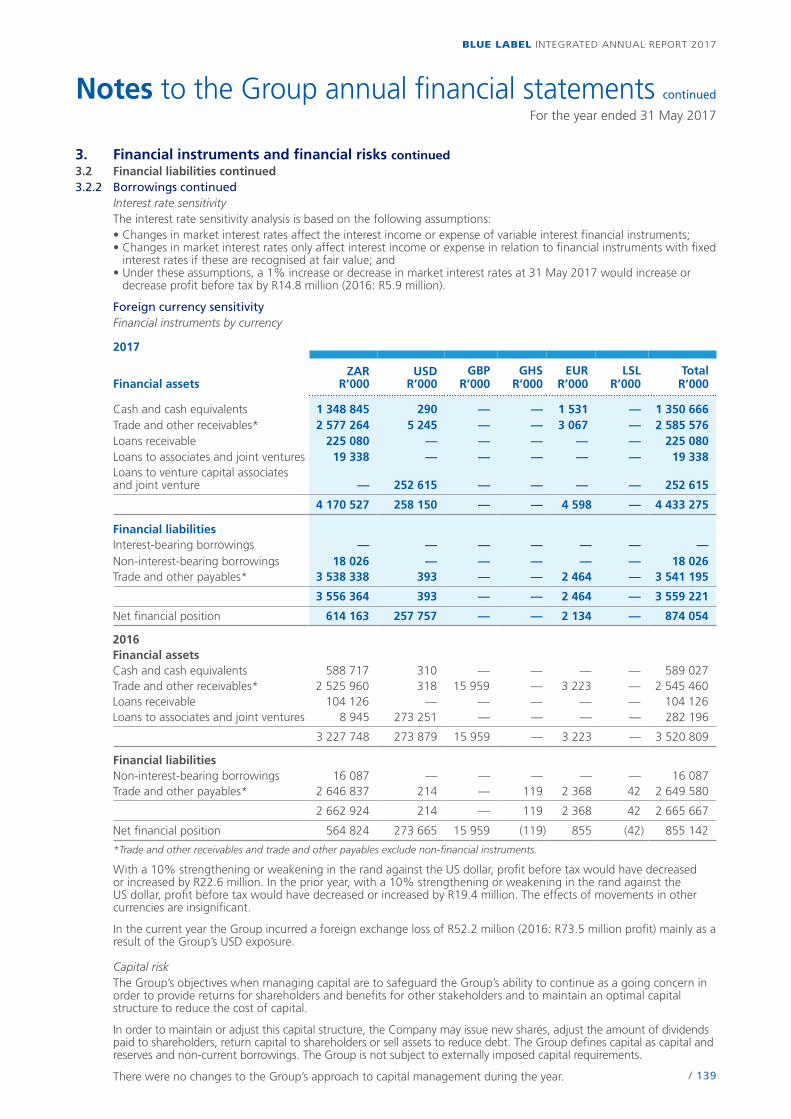
/ 139
BLUE LABEL INTEGRATED ANNUAL REPORT 2017
Notes to the Group annual financial statements continued
For the year ended 31 May 2017
3. Financial instruments and financial risks continued3.2 Financial liabilities continued3.2.2 Borrowings continued
Interest rate sensitivityThe interest rate sensitivity analysis is based on the following assumptions:•Changesinmarketinterestratesaffecttheinterestincomeorexpenseofvariableinterestfinancialinstruments;•Changesinmarketinterestratesonlyaffectinterestincomeorexpenseinrelationtofinancialinstrumentswithfixed
interest rates if these are recognised at fair value; and•Undertheseassumptions,a1%increaseordecreaseinmarketinterestratesat31May2017wouldincreaseor
decrease profit before tax by R14.8 million (2016: R5.9 million).
Foreign currency sensitivityFinancial instruments by currency
2017
Financial assetsZAR
R’000USD
R’000GBP
R’000GHS
R’000EUR
R’000LSL
R’000Total
R’000
Cash and cash equivalents 1 348 845 290 — — 1 531 — 1 350 666 Trade and other receivables* 2 577 264 5 245 — — 3 067 — 2 585 576 Loans receivable 225 080 — — — — — 225 080 Loans to associates and joint ventures 19 338 — — — — — 19 338Loans to venture capital associates and joint venture — 252 615 — — — — 252 615
4 170 527 258 150 — — 4 598 — 4 433 275
Financial liabilitiesInterest-bearing borrowings — — — — — — —Non-interest-bearing borrowings 18 026 — — — — — 18 026 Trade and other payables* 3 538 338 393 — — 2 464 — 3 541 195
3 556 364 393 — — 2 464 — 3 559 221
Net financial position 614 163 257 757 — — 2 134 — 874 054
2016Financial assetsCash and cash equivalents 588 717 310 — — — — 589 027Trade and other receivables* 2 525 960 318 15 959 — 3 223 — 2 545 460Loans receivable 104 126 — — — — — 104 126Loans to associates and joint ventures 8 945 273 251 — — — — 282 196
3 227 748 273 879 15 959 — 3 223 — 3 520 809
Financial liabilitiesNon-interest-bearing borrowings 16 087 — — — — — 16 087Trade and other payables* 2 646 837 214 — 119 2 368 42 2 649 580
2 662 924 214 — 119 2 368 42 2 665 667
Net financial position 564 824 273 665 15 959 (119) 855 (42) 855 142
*Trade and other receivables and trade and other payables exclude non-financial instruments.
With a 10% strengthening or weakening in the rand against the US dollar, profit before tax would have decreased or increased by R22.6 million. In the prior year, with a 10% strengthening or weakening in the rand against the US dollar, profit before tax would have decreased or increased by R19.4 million. The effects of movements in other currencies are insignificant.
In the current year the Group incurred a foreign exchange loss of R52.2 million (2016: R73.5 million profit) mainly as a result of the Group’s USD exposure.
Capital riskThe Group’s objectives when managing capital are to safeguard the Group’s ability to continue as a going concern in order to provide returns for shareholders and benefits for other stakeholders and to maintain an optimal capital structure to reduce the cost of capital.
In order to maintain or adjust this capital structure, the Company may issue new shares, adjust the amount of dividends paid to shareholders, return capital to shareholders or sell assets to reduce debt. The Group defines capital as capital and reserves and non-current borrowings. The Group is not subject to externally imposed capital requirements.
There were no changes to the Group’s approach to capital management during the year.
/ 140
BLUE LABEL INTEGRATED ANNUAL REPORT 2017
Notes to the Group annual financial statements continued
For the year ended 31 May 2017
4. Non-financial instrumentsNon-financial instruments comprise:•Goodwill• Intangible assets• Property, plant and equipment• Inventories• Provisions
Impairment of non-financial assetsThe Group evaluates the carrying value of assets with finite useful lives when events and circumstances indicate that the carrying value may not be recoverable and when there are indicators of impairment. Intangible assets that have an indefinite useful life are not subject to amortisation and are tested annually for impairment.
An impairment loss is recognised in the income statement when the carrying amount of an asset exceeds its recoverable amount. An asset’s recoverable amount is the higher of the fair value less cost of disposal (the amount obtainable from the sale of an asset in an arm’s-length transaction between knowledgeable willing parties), or its value-in-use. Value-in-use is the present value of estimated future cash flows expected to arise from the continuing use of an asset and from its disposal at the end of its useful life. The estimated future cash flows are discounted to their present value using a pre-tax discount rate that reflects current market assessments of the time value of money and the risks specific to the asset. For the purposes of assessing impairment, assets are grouped at the lowest levels for which there are separately identifiable cash flows.
An impairment loss recognised for an asset, other than goodwill, in prior years is reversed if there has been a change in the estimates used to determine the asset’s recoverable amount since the last impairment loss was recognised and the recoverable amount exceeds the new carrying amount. The reversal of the impairment is limited to the carrying amount that would have been determined (net of depreciation or amortisation) had no impairment loss been recognised in prior years. The reversal of such an impairment loss is recognised in the income statement in the same line item as the original impairment charge.
4.1 Goodwill
Goodwill represents the excess of the cost of an acquisition over the fair value of the Group’s share of the net identifiable assets of the acquired subsidiary, associate or jointly controlled entity at the date of acquisition.Goodwill is attributable to synergies that the Group expects to derive from the transaction. If the cost of acquisition is less than the net assets of the subsidiary acquired, the difference is recognised directly in the income statement. Goodwill on the acquisition of subsidiaries is included in “goodwill” in the statement of financial position. Goodwill on acquisitions of associates and joint ventures is included in “investments in and loans to associates and joint ventures”.
Goodwill is allocated to cash-generating units for the purpose of impairment testing. Impairment is determined by assessing the recoverable amount of the cash-generating unit to which the goodwill relates. Where the recoverable amount of the cash-generating unit is less than the carrying amount, an impairment is recognised.
Separately recognised goodwill is tested annually for impairment and carried at cost less accumulated impairment losses. Impairment losses on goodwill are not reversed. Gains and losses on the disposal of an entity include the carrying amount of goodwill relating to the entity sold.
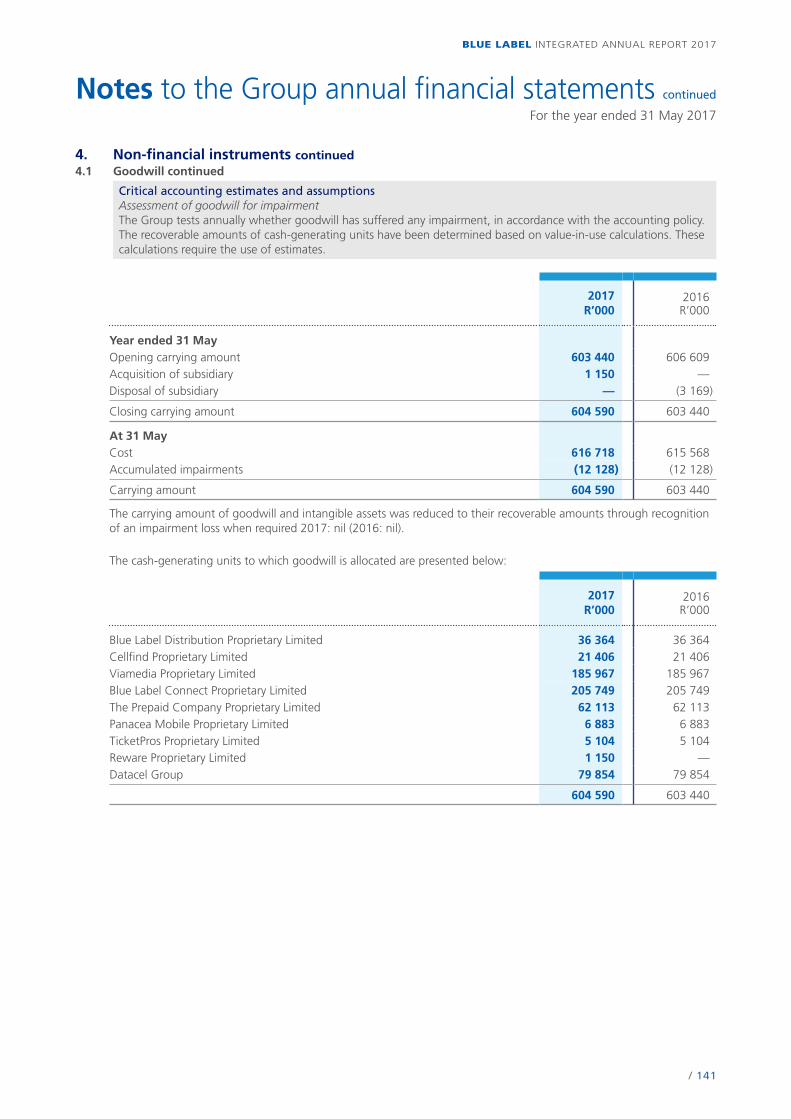
/ 141
BLUE LABEL INTEGRATED ANNUAL REPORT 2017
Notes to the Group annual financial statements continued
For the year ended 31 May 2017
4. Non-financial instruments continued4.1 Goodwill continued
Critical accounting estimates and assumptionsAssessment of goodwill for impairmentThe Group tests annually whether goodwill has suffered any impairment, in accordance with the accounting policy. The recoverable amounts of cash-generating units have been determined based on value-in-use calculations. These calculations require the use of estimates.
2017R’000
2016R’000
Year ended 31 May Opening carrying amount 603 440 606 609Acquisition of subsidiary 1 150 —Disposal of subsidiary — (3 169)
Closing carrying amount 604 590 603 440
At 31 May Cost 616 718 615 568Accumulated impairments (12 128) (12 128)
Carrying amount 604 590 603 440
The carrying amount of goodwill and intangible assets was reduced to their recoverable amounts through recognition of an impairment loss when required 2017: nil (2016: nil).
The cash-generating units to which goodwill is allocated are presented below:
2017R’000
2016R’000
Blue Label Distribution Proprietary Limited 36 364 36 364Cellfind Proprietary Limited 21 406 21 406Viamedia Proprietary Limited 185 967 185 967Blue Label Connect Proprietary Limited 205 749 205 749The Prepaid Company Proprietary Limited 62 113 62 113Panacea Mobile Proprietary Limited 6 883 6 883TicketPros Proprietary Limited 5 104 5 104Reware Proprietary Limited 1 150 —Datacel Group 79 854 79 854
604 590 603 440
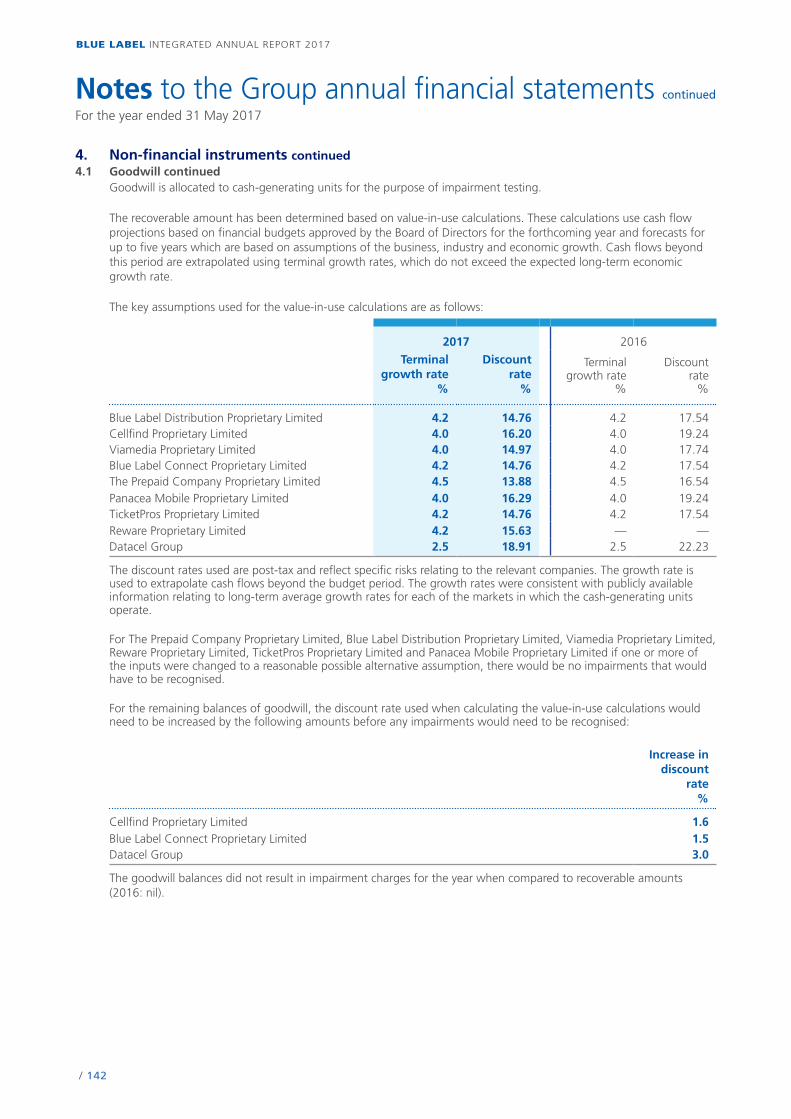
/ 142
BLUE LABEL INTEGRATED ANNUAL REPORT 2017
Notes to the Group annual financial statements continued
For the year ended 31 May 2017
4. Non-financial instruments continued4.1 Goodwill continued
Goodwill is allocated to cash-generating units for the purpose of impairment testing.
The recoverable amount has been determined based on value-in-use calculations. These calculations use cash flow projections based on financial budgets approved by the Board of Directors for the forthcoming year and forecasts for up to five years which are based on assumptions of the business, industry and economic growth. Cash flows beyond this period are extrapolated using terminal growth rates, which do not exceed the expected long-term economic growth rate.
The key assumptions used for the value-in-use calculations are as follows:
2017 2016
Terminalgrowth rate
%
Discountrate
%
Terminalgrowth rate
%
Discountrate
%
Blue Label Distribution Proprietary Limited 4.2 14.76 4.2 17.54Cellfind Proprietary Limited 4.0 16.20 4.0 19.24Viamedia Proprietary Limited 4.0 14.97 4.0 17.74Blue Label Connect Proprietary Limited 4.2 14.76 4.2 17.54The Prepaid Company Proprietary Limited 4.5 13.88 4.5 16.54Panacea Mobile Proprietary Limited 4.0 16.29 4.0 19.24TicketPros Proprietary Limited 4.2 14.76 4.2 17.54Reware Proprietary Limited 4.2 15.63 — —Datacel Group 2.5 18.91 2.5 22.23
The discount rates used are post-tax and reflect specific risks relating to the relevant companies. The growth rate is used to extrapolate cash flows beyond the budget period. The growth rates were consistent with publicly available information relating to long-term average growth rates for each of the markets in which the cash-generating units operate.
For The Prepaid Company Proprietary Limited, Blue Label Distribution Proprietary Limited, Viamedia Proprietary Limited, Reware Proprietary Limited, TicketPros Proprietary Limited and Panacea Mobile Proprietary Limited if one or more of the inputs were changed to a reasonable possible alternative assumption, there would be no impairments that would have to be recognised.
For the remaining balances of goodwill, the discount rate used when calculating the value-in-use calculations would need to be increased by the following amounts before any impairments would need to be recognised:
Increase indiscount
rate%
Cellfind Proprietary Limited 1.6Blue Label Connect Proprietary Limited 1.5Datacel Group 3.0
The goodwill balances did not result in impairment charges for the year when compared to recoverable amounts (2016: nil).
/ 143
BLUE LABEL INTEGRATED ANNUAL REPORT 2017
Notes to the Group annual financial statements continued
For the year ended 31 May 2017
4. Non-financial instruments continued4.2 Intangible assets
(a) Computer softwareAcquired computer software licences are capitalised on the basis of the costs incurred to acquire and bring to use the specific software. Computer software has a finite useful life and is subsequently carried at cost less accumulated amortisation. Amortisation is calculated using the straight-line method to allocate the cost of the computer software over its estimated useful life (three to 10 years).
Costs associated with the maintenance of existing computer software programmes are expensed as incurred.
(b) Trademarks and franchise feesTrademarks and franchise fees are shown at historical cost. They have a finite useful life and are subsequently carried at cost less accumulated amortisation. Amortisation is calculated using the straight-line method to allocate the cost of trademarks and franchise fees over their estimated useful lives (10 years and 20 years respectively).
Trademarks and franchise fees are initially shown at fair value as determined in accordance with IFRS 3 – Business Combinations, and are subsequently carried at the initially determined fair value less accumulated amortisation and impairment losses.
(c) Databases, customer listings, distribution agreements and customer relationshipsDatabases, customer listings, distribution agreements and customer relationships acquired through business combinations are initially shown at fair value as determined in accordance with IFRS 3 – Business Combinations, and are subsequently carried at the initially determined fair value less accumulated amortisation and impairment losses. Amortisation is calculated using the straight-line method to allocate the value of these assets over their estimated useful lives (three to 10 years).
Distribution agreements purchased are initially shown at cost, and are subsequently carried at the initial cost less accumulated amortisation and impairment losses. Amortisation is calculated using the straight-line method to allocate the value of these assets over their estimated useful lives (10 years).
(d) Internally generated software developmentCosts incurred on development projects are recognised as intangible assets when the following criteria are fulfilled:• It is technically feasible to complete the intangible asset and that it will be available for use or sale;•Management intends to complete the intangible asset and use or sell it;• There is an ability to use or sell the intangible asset;• It can be demonstrated how the intangible asset will generate probable future economic benefits;•Adequate technical, financial and other resources to complete the development and to use or sell the intangible
asset are available; and• The expenditure attributable to the intangible asset during its development can be reliably measured.
Research expenditure is recognised as an expense as incurred. Other development expenditures that do not meet these criteria are recognised as an expense as incurred.
Development costs previously recognised as an expense are not recognised as an asset in a subsequent period. Capitalised internally generated software development costs are recorded as intangible assets and amortised from the point at which the asset is available for use (i.e. when it is in the location and condition necessary for it to be capable of operating in the manner intended by management) on a straight-line basis over its useful life (five to 10 years). Direct costs include the product development employee costs and an appropriate portion of relevant overheads. Costs associated with the maintenance of existing products are expensed as incurred.
(e) Purchased starter pack bases and postpaid basesPurchased starter pack bases represent the right to earn future revenue from starter packs already distributed and are initially recognised at the cost to the Group. Starter pack bases have a finite life and are subsequently carried at cost less accumulated amortisation. Amortisation is calculated using the straight-line method over their estimated useful lives (seven years).
Purchased postpaid bases represent the right to earn revenue from the cellular network in respect of contracts forming part of the acquired base. Postpaid bases have a finite life and are subsequently carried at cost less accumulated amortisation. Amortisation is calculated using the straight-line method over their estimated useful lives (10 years).
Critical accounting estimates and assumptionsPurchased starter pack bases and postpaid starter pack basesThe relative size of the Group’s purchased starter pack bases and postpaid starter pack bases makes the judgements surrounding the estimated useful lives and residual values critical to the Group’s financial position and performance. Useful lives are reviewed on an annual basis with the effects of any changes in estimate accounted for on a prospective basis. The residual values of these assets are assumed to be zero. The current useful life of these bases is estimated to be seven to 10 years, based on management’s estimates and taking into account historical experience as well as future events which may impact the useful lives.
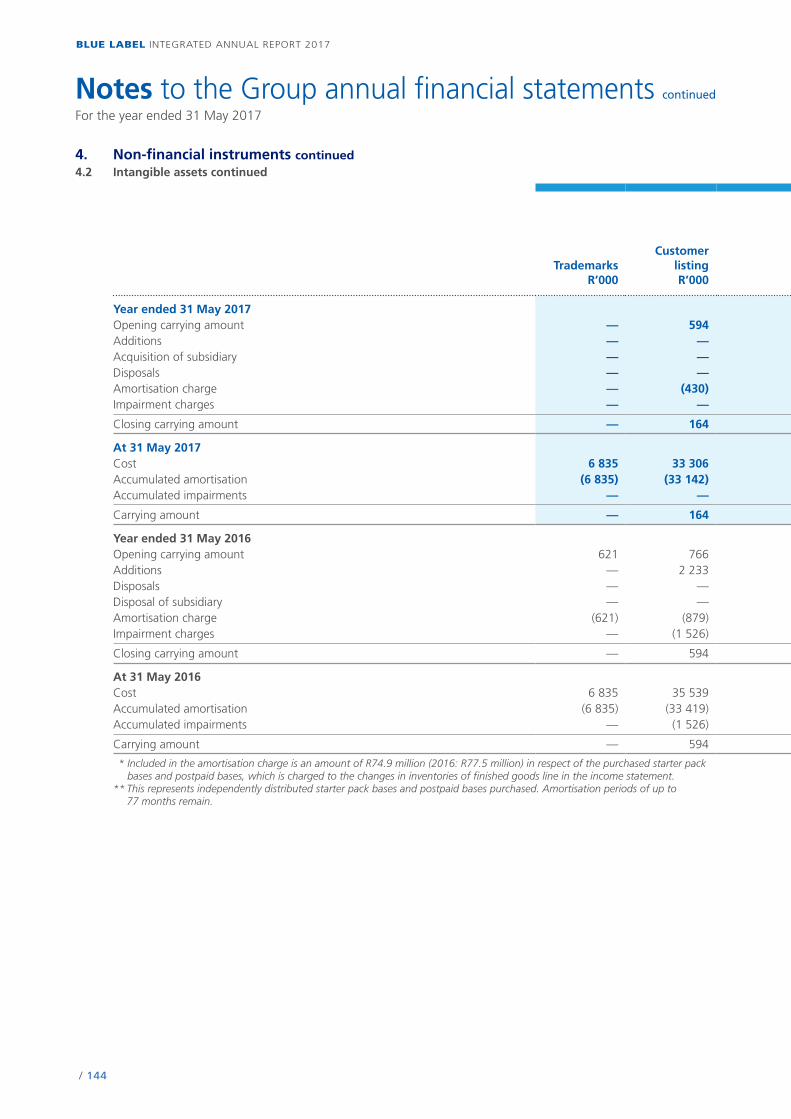
/ 144
BLUE LABEL INTEGRATED ANNUAL REPORT 2017
Notes to the Group annual financial statements continued
For the year ended 31 May 2017
4. Non-financial instruments continued4.2 Intangible assets continued
TrademarksR’000
CustomerlistingR’000
Distributionagreement
R’000
Computersoftware
R’000
Internallygenerated
software development
R’000
Franchisefees
R’000
Customerrelationships
R’000
Purchasedstarter pack
bases andpostpaid
bases**R’000
TotalR’000
Year ended 31 May 2017Opening carrying amount — 594 242 975 57 212 38 040 935 — 258 577 598 333 Additions — — — 28 827 22 577 — — 4 583 55 987 Acquisition of subsidiary — — — — — — — — —Disposals — — — (47) — — — — (47) Amortisation charge — (430) (28 760) (24 487) (14 370) (120) — (74 942)* (143 109) Impairment charges — — — — — — — — —
Closing carrying amount — 164 214 215 61 505 46 247 815 — 188 218 511 164
At 31 May 2017Cost 6 835 33 306 317 451 148 913 103 606 3 118 131 023 579 564 1 323 816 Accumulated amortisation (6 835) (33 142) (101 358) (87 049) (42 770) (2 303) (130 408) (391 346) (795 211) Accumulated impairments — — (1 878) (359) (14 589) — (615) — (17 441)
Carrying amount — 164 214 215 61 505 46 247 815 — 188 218 511 164
Year ended 31 May 2016Opening carrying amount 621 766 253 508 43 573 19 246 1 090 4 500 324 980 648 284Additions — 2 233 17 757 30 273 23 839 — — 11 073 85 175Disposals — — — (4) — — — — (4)Disposal of subsidiary — — — (2 201) — — — — (2 201)Amortisation charge (621) (879) (28 290) (13 409) (5 023) (155) (4 500) (77 476)* (130 353)Impairment charges — (1 526) — (1 020) (22) — — — (2 568)
Closing carrying amount — 594 242 975 57 212 38 040 935 — 258 577 598 333
At 31 May 2016Cost 6 835 35 539 317 451 123 727 81 776 3 118 131 023 574 981 1 274 450Accumulated amortisation (6 835) (33 419) (72 598) (65 085) (29 147) (2 183) (130 408) (316 404) (656 079)Accumulated impairments — (1 526) (1 878) (1 430) (14 589) — (615) — (20 038)
Carrying amount — 594 242 975 57 212 38 040 935 — 258 577 598 333
* Included in the amortisation charge is an amount of R74.9 million (2016: R77.5 million) in respect of the purchased starter pack bases and postpaid bases, which is charged to the changes in inventories of finished goods line in the income statement.
** This represents independently distributed starter pack bases and postpaid bases purchased. Amortisation periods of up to 77 months remain.
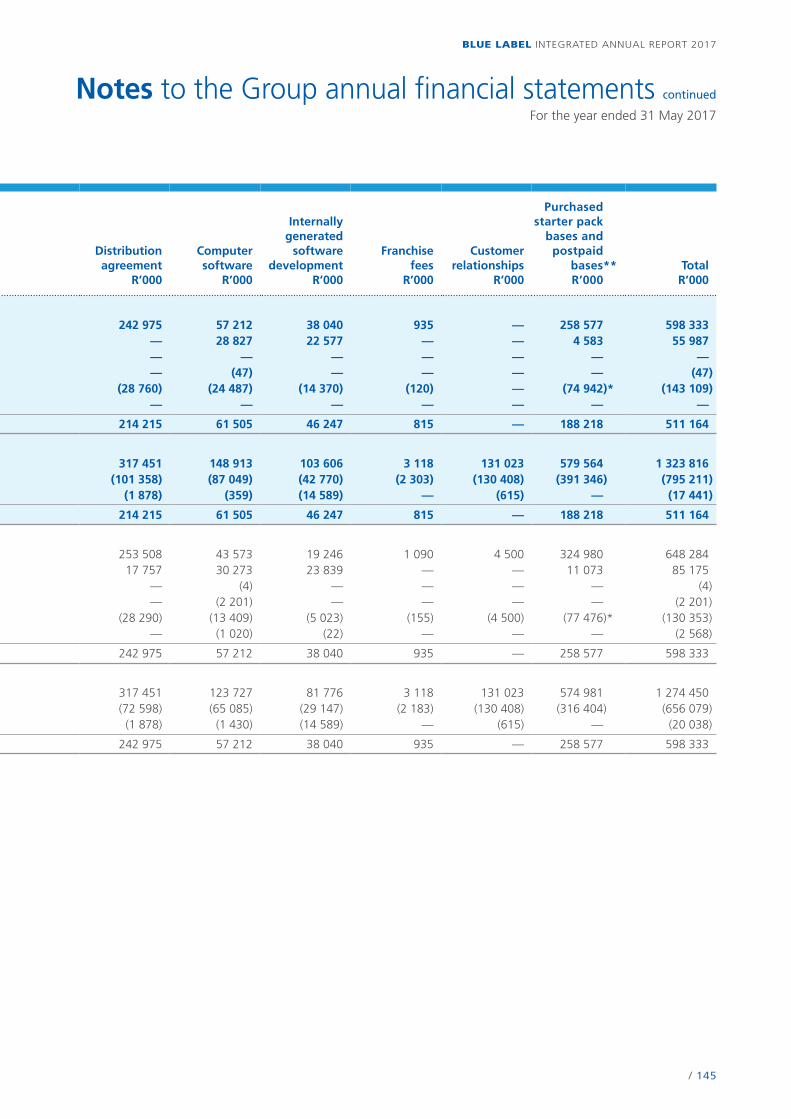
/ 145
BLUE LABEL INTEGRATED ANNUAL REPORT 2017
Notes to the Group annual financial statements continued
For the year ended 31 May 2017
4. Non-financial instruments continued4.2 Intangible assets continued
TrademarksR’000
CustomerlistingR’000
Distributionagreement
R’000
Computersoftware
R’000
Internallygenerated
software development
R’000
Franchisefees
R’000
Customerrelationships
R’000
Purchasedstarter pack
bases andpostpaid
bases**R’000
TotalR’000
Year ended 31 May 2017Opening carrying amount — 594 242 975 57 212 38 040 935 — 258 577 598 333 Additions — — — 28 827 22 577 — — 4 583 55 987 Acquisition of subsidiary — — — — — — — — —Disposals — — — (47) — — — — (47) Amortisation charge — (430) (28 760) (24 487) (14 370) (120) — (74 942)* (143 109) Impairment charges — — — — — — — — —
Closing carrying amount — 164 214 215 61 505 46 247 815 — 188 218 511 164
At 31 May 2017Cost 6 835 33 306 317 451 148 913 103 606 3 118 131 023 579 564 1 323 816 Accumulated amortisation (6 835) (33 142) (101 358) (87 049) (42 770) (2 303) (130 408) (391 346) (795 211) Accumulated impairments — — (1 878) (359) (14 589) — (615) — (17 441)
Carrying amount — 164 214 215 61 505 46 247 815 — 188 218 511 164
Year ended 31 May 2016Opening carrying amount 621 766 253 508 43 573 19 246 1 090 4 500 324 980 648 284Additions — 2 233 17 757 30 273 23 839 — — 11 073 85 175Disposals — — — (4) — — — — (4)Disposal of subsidiary — — — (2 201) — — — — (2 201)Amortisation charge (621) (879) (28 290) (13 409) (5 023) (155) (4 500) (77 476)* (130 353)Impairment charges — (1 526) — (1 020) (22) — — — (2 568)
Closing carrying amount — 594 242 975 57 212 38 040 935 — 258 577 598 333
At 31 May 2016Cost 6 835 35 539 317 451 123 727 81 776 3 118 131 023 574 981 1 274 450Accumulated amortisation (6 835) (33 419) (72 598) (65 085) (29 147) (2 183) (130 408) (316 404) (656 079)Accumulated impairments — (1 526) (1 878) (1 430) (14 589) — (615) — (20 038)
Carrying amount — 594 242 975 57 212 38 040 935 — 258 577 598 333
* Included in the amortisation charge is an amount of R74.9 million (2016: R77.5 million) in respect of the purchased starter pack bases and postpaid bases, which is charged to the changes in inventories of finished goods line in the income statement.
** This represents independently distributed starter pack bases and postpaid bases purchased. Amortisation periods of up to 77 months remain.
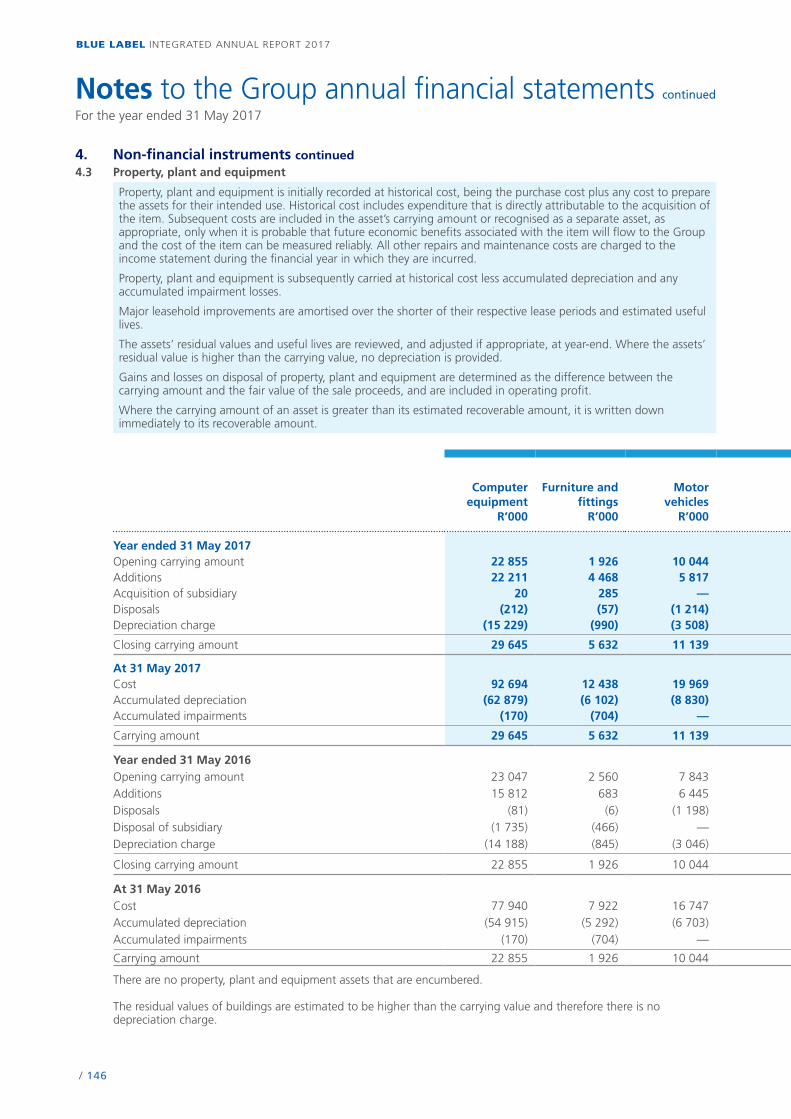
/ 146
BLUE LABEL INTEGRATED ANNUAL REPORT 2017
Notes to the Group annual financial statements continued
For the year ended 31 May 2017
4. Non-financial instruments continued4.3 Property, plant and equipment
Computer equipment
R’000
Furniture and fittings
R’000
Motor vehicles
R’000
Office equipment
R’000
Leasehold improve-
ments R’000
Terminals and vending
machinesR’000
Media equipment
R’000
Plant and machinery
R’000Buildings
R’000TotalR’000
Year ended 31 May 2017Opening carrying amount 22 855 1 926 10 044 814 5 416 48 987 5 723 570 4 099 100 434 Additions 22 211 4 468 5 817 259 2 126 21 578 484 350 — 57 293 Acquisition of subsidiary 20 285 — 57 — — — — — 362 Disposals (212) (57) (1 214) (7) (5) (292) — (19) — (1 806) Depreciation charge (15 229) (990) (3 508) (351) (5 043) (18 391) (969) (203) — (44 684)
Closing carrying amount 29 645 5 632 11 139 772 2 494 51 882 5 238 698 4 099 111 599
At 31 May 2017Cost 92 694 12 438 19 969 6 531 48 316 140 672 6 893 1 349 4 099 332 961 Accumulated depreciation (62 879) (6 102) (8 830) (5 339) (45 384) (85 203) (1 655) (651) — (216 043) Accumulated impairments (170) (704) — (420) (438) (3 587) — — — (5 319)
Carrying amount 29 645 5 632 11 139 772 2 494 51 882 5 238 698 4 099 111 599
Year ended 31 May 2016Opening carrying amount 23 047 2 560 7 843 984 11 960 52 202 3 225 764 4 099 106 684Additions 15 812 683 6 445 558 175 15 112 3 167 4 — 41 956Disposals (81) (6) (1 198) (270) (17) (1 513) — — — (3 085)Disposal of subsidiary (1 735) (466) — (102) (80) — — — — (2 383)Depreciation charge (14 188) (845) (3 046) (356) (6 622) (16 814) (669) (198) — (42 738)
Closing carrying amount 22 855 1 926 10 044 814 5 416 48 987 5 723 570 4 099 100 434
At 31 May 2016Cost 77 940 7 922 16 747 7 081 47 333 124 892 6 409 1 030 4 099 293 453Accumulated depreciation (54 915) (5 292) (6 703) (5 847) (41 479) (72 318) (686) (460) — (187 700)Accumulated impairments (170) (704) — (420) (438) (3 587) — — — (5 319)
Carrying amount 22 855 1 926 10 044 814 5 416 48 987 5 723 570 4 099 100 434
There are no property, plant and equipment assets that are encumbered.
The residual values of buildings are estimated to be higher than the carrying value and therefore there is no depreciation charge.
Depreciation is calculated on the straight-line basis to write off the cost of the assets to their residual values over their estimated useful lives as follows:Computer equipment 25% – 33.3%Furniture and fittings 16.67% – 25%Motor vehicles 20% – 25%Office equipment 25%Terminals and vending machines 16.67%Media equipment 33.33%Plant and machinery 20%Buildings 8.33%
Property, plant and equipment is initially recorded at historical cost, being the purchase cost plus any cost to prepare the assets for their intended use. Historical cost includes expenditure that is directly attributable to the acquisition of the item. Subsequent costs are included in the asset’s carrying amount or recognised as a separate asset, as appropriate, only when it is probable that future economic benefits associated with the item will flow to the Group and the cost of the item can be measured reliably. All other repairs and maintenance costs are charged to the income statement during the financial year in which they are incurred.
Property, plant and equipment is subsequently carried at historical cost less accumulated depreciation and any accumulated impairment losses.
Major leasehold improvements are amortised over the shorter of their respective lease periods and estimated useful lives.
The assets’ residual values and useful lives are reviewed, and adjusted if appropriate, at year-end. Where the assets’ residual value is higher than the carrying value, no depreciation is provided.
Gains and losses on disposal of property, plant and equipment are determined as the difference between the carrying amount and the fair value of the sale proceeds, and are included in operating profit.
Where the carrying amount of an asset is greater than its estimated recoverable amount, it is written down immediately to its recoverable amount.

/ 147
BLUE LABEL INTEGRATED ANNUAL REPORT 2017
Notes to the Group annual financial statements continued
For the year ended 31 May 2017
4. Non-financial instruments continued4.3 Property, plant and equipment
Computer equipment
R’000
Furniture and fittings
R’000
Motor vehicles
R’000
Office equipment
R’000
Leasehold improve-
ments R’000
Terminals and vending
machinesR’000
Media equipment
R’000
Plant and machinery
R’000Buildings
R’000Total
R’000
Year ended 31 May 2017Opening carrying amount 22 855 1 926 10 044 814 5 416 48 987 5 723 570 4 099 100 434 Additions 22 211 4 468 5 817 259 2 126 21 578 484 350 — 57 293 Acquisition of subsidiary 20 285 — 57 — — — — — 362 Disposals (212) (57) (1 214) (7) (5) (292) — (19) — (1 806) Depreciation charge (15 229) (990) (3 508) (351) (5 043) (18 391) (969) (203) — (44 684)
Closing carrying amount 29 645 5 632 11 139 772 2 494 51 882 5 238 698 4 099 111 599
At 31 May 2017Cost 92 694 12 438 19 969 6 531 48 316 140 672 6 893 1 349 4 099 332 961 Accumulated depreciation (62 879) (6 102) (8 830) (5 339) (45 384) (85 203) (1 655) (651) — (216 043) Accumulated impairments (170) (704) — (420) (438) (3 587) — — — (5 319)
Carrying amount 29 645 5 632 11 139 772 2 494 51 882 5 238 698 4 099 111 599
Year ended 31 May 2016Opening carrying amount 23 047 2 560 7 843 984 11 960 52 202 3 225 764 4 099 106 684Additions 15 812 683 6 445 558 175 15 112 3 167 4 — 41 956Disposals (81) (6) (1 198) (270) (17) (1 513) — — — (3 085)Disposal of subsidiary (1 735) (466) — (102) (80) — — — — (2 383)Depreciation charge (14 188) (845) (3 046) (356) (6 622) (16 814) (669) (198) — (42 738)
Closing carrying amount 22 855 1 926 10 044 814 5 416 48 987 5 723 570 4 099 100 434
At 31 May 2016Cost 77 940 7 922 16 747 7 081 47 333 124 892 6 409 1 030 4 099 293 453Accumulated depreciation (54 915) (5 292) (6 703) (5 847) (41 479) (72 318) (686) (460) — (187 700)Accumulated impairments (170) (704) — (420) (438) (3 587) — — — (5 319)
Carrying amount 22 855 1 926 10 044 814 5 416 48 987 5 723 570 4 099 100 434
There are no property, plant and equipment assets that are encumbered.
The residual values of buildings are estimated to be higher than the carrying value and therefore there is no depreciation charge.
Depreciation is calculated on the straight-line basis to write off the cost of the assets to their residual values over their estimated useful lives as follows:Computer equipment 25% – 33.3%Furniture and fittings 16.67% – 25%Motor vehicles 20% – 25%Office equipment 25%Terminals and vending machines 16.67%Media equipment 33.33%Plant and machinery 20%Buildings 8.33%
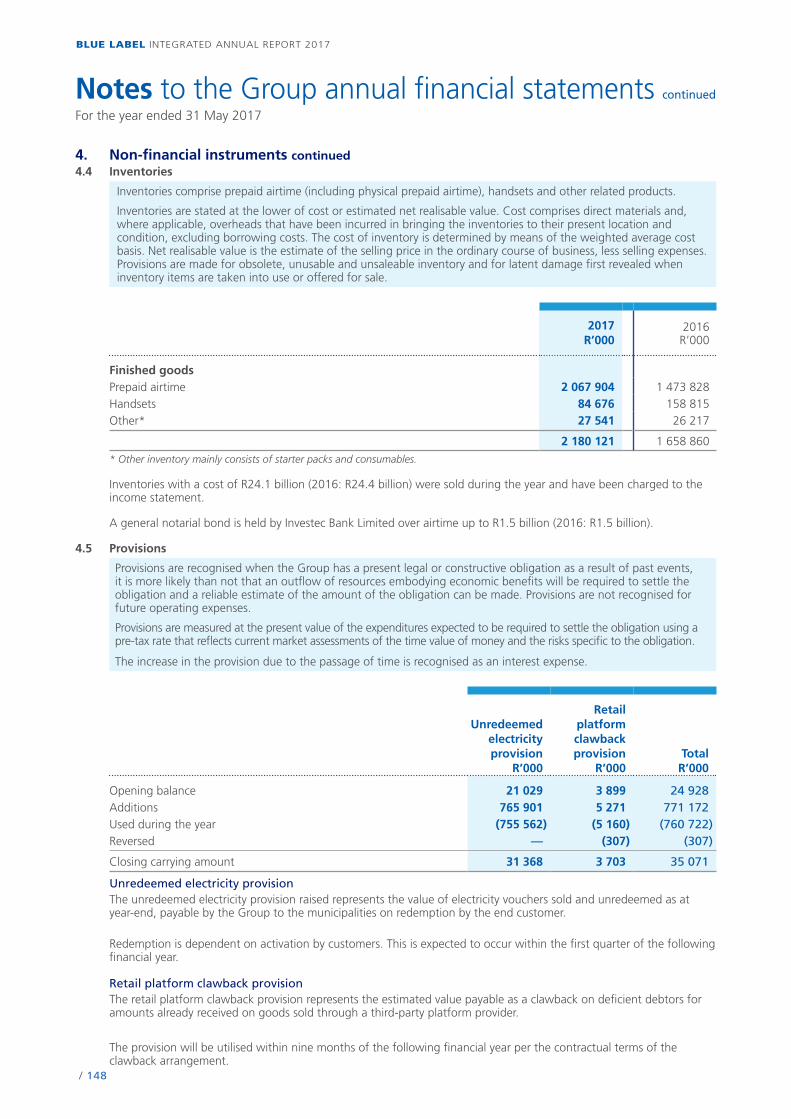
/ 148
BLUE LABEL INTEGRATED ANNUAL REPORT 2017
Notes to the Group annual financial statements continued
For the year ended 31 May 2017
4. Non-financial instruments continued4.4 Inventories
Inventories comprise prepaid airtime (including physical prepaid airtime), handsets and other related products.
Inventories are stated at the lower of cost or estimated net realisable value. Cost comprises direct materials and, where applicable, overheads that have been incurred in bringing the inventories to their present location and condition, excluding borrowing costs. The cost of inventory is determined by means of the weighted average cost basis. Net realisable value is the estimate of the selling price in the ordinary course of business, less selling expenses. Provisions are made for obsolete, unusable and unsaleable inventory and for latent damage first revealed when inventory items are taken into use or offered for sale.
2017R’000
2016R’000
Finished goodsPrepaid airtime 2 067 904 1 473 828Handsets 84 676 158 815Other* 27 541 26 217
2 180 121 1 658 860
* Other inventory mainly consists of starter packs and consumables.
Inventories with a cost of R24.1 billion (2016: R24.4 billion) were sold during the year and have been charged to the income statement.
A general notarial bond is held by Investec Bank Limited over airtime up to R1.5 billion (2016: R1.5 billion).
4.5 Provisions
Provisions are recognised when the Group has a present legal or constructive obligation as a result of past events, it is more likely than not that an outflow of resources embodying economic benefits will be required to settle the obligation and a reliable estimate of the amount of the obligation can be made. Provisions are not recognised for future operating expenses.
Provisions are measured at the present value of the expenditures expected to be required to settle the obligation using a pre-tax rate that reflects current market assessments of the time value of money and the risks specific to the obligation.
The increase in the provision due to the passage of time is recognised as an interest expense.
Unredeemed electricity provision
R’000
Retail platform clawback provision
R’000Total
R’000
Opening balance 21 029 3 899 24 928Additions 765 901 5 271 771 172Used during the year (755 562) (5 160) (760 722)Reversed — (307) (307)
Closing carrying amount 31 368 3 703 35 071
Unredeemed electricity provisionThe unredeemed electricity provision raised represents the value of electricity vouchers sold and unredeemed as at year-end, payable by the Group to the municipalities on redemption by the end customer.
Redemption is dependent on activation by customers. This is expected to occur within the first quarter of the following financial year.
Retail platform clawback provisionThe retail platform clawback provision represents the estimated value payable as a clawback on deficient debtors for amounts already received on goods sold through a third-party platform provider.
The provision will be utilised within nine months of the following financial year per the contractual terms of the clawback arrangement.
/ 149
BLUE LABEL INTEGRATED ANNUAL REPORT 2017
Notes to the Group annual financial statements continued
For the year ended 31 May 2017
5. Employees5.1 Equity compensation benefit
During the year 1 376 257 (2016: 2 591 066) forfeitable shares were granted to Executive Directors and qualifying employees (participant). The participant will forfeit the forfeitable shares if he/she ceases to be an employee of an employer company before the vesting date or if the specified performance conditions have not been met, unless otherwise specified by the rules or determined by the Board. In the event that the participant is not in the employ of the Group, or the performance conditions are not met, the shares allocated to the participant will be forfeited and will either be sold on the open market by the escrow agent and the proceeds will be returned to the participating employer, or may be retained by the Group for future awards.
Dividends declared in respect of these forfeitable shares are held in escrow until such time as the performance conditions are met and the shares have vested. Shares forfeited during the vesting period will forfeit any dividends pertaining to such shares. A dividend of 36 cents (2016: 31 cents) per ordinary share was declared on 23 August 2016 (2016: 18 August 2015).
The performance condition of the forfeitable shares for the sixth, seventh and eighth award vesting on 31 August 2016, 31 August 2017 and 31 August 2018 respectively are as follows:• 40% of the awards are allocated towards retention. In order to receive this portion of the allocation the employee is
required to be employed within the Group at the vesting date.• 60% of the awards are allocated on the basis of 50% for growth in core headline earnings per share and 10% for
shareholder returns.
The 50% for growth in core headline earnings will be based on the following achievements:•Ifgrowthis5%aboveCPIoverthreeyears,20%ofthe50%willvest.•Ifgrowthis10%aboveCPIoverthreeyears,anadditional50%(i.e.atotalof70%)ofthe50%willvest.•Ifgrowthis25%aboveCPIoverthreeyears,afurther30%(i.e.atotalof100%)ofthe50%willvest.
The 50% for growth in core headline earnings in respect of the seventh and eighth awards has been amended to include growth in core headline earnings at subsidiary level with regards to qualifying employees.
The 10% for shareholder return will be based on a 10% compounded growth in the share price over the three-year vesting period measured with reference to the weighted average price per share during the month of the commencement of the allocation and the weighted average share price for the month during which the vesting takes place, plus dividends over the three-year period.
The performance condition for Executive Directors for the ninth award grant vesting on 31 August 2019 is as follows:• 33.33% for retention (three years from date of award); and• 66.67% financial (33.34% for growth in core headline earnings per share and 33.33% based on shareholder
returns);
The 33.34% for growth in core headline earnings per share is based on the following achievements:• If growth is 5% above CPI compounded annually over three years, then 20% of the 33.33% will vest.• If growth is 10% above CPI compounded annually over three years, then an additional 50% (i.e. a total of 70%)
of the 33.33% would vest. If growth is between 5% and 10% above CPI over the three years then the additional 50% will be reduced on a pro-rata basis.
• If growth is 25% above CPI compounded annually over three years, then a further 30% (i.e. a total of 100%) of the 33.33% will vest. If growth is between 10% and 25% above CPI over the three years then the additional 30% will be reduced on a pro-rata basis.
The 33.33% for shareholder return is based on a 10% compounded growth in the share price over the three-year vesting period, measured with reference to the weighted average price per share during the month of the commencement of the allocation plus dividends over the three-year period against the weighted average share price for the month during which the vesting takes place.
The performance condition for senior managers for the ninth award grant vesting on 31 August 2019 is as follows:•40%forretention(threeyearsfromdateofaward);and•60%financial(30%forgrowthincoreheadlineearningspershareand30%basedonshareholderreturns).
The 30% for growth in core headline earnings per share is based on the following achievements:• If growth is 5% above CPI compounded annually over three years, then 20% of the 30% will vest.• If growth is 10% above CPI compounded annually over three years, then an additional 50% (i.e. a total of 70%)
of the 30% would vest. If growth is between 5% and 10% above CPI over the three years then the additional 50% will be reduced on a pro-rata basis.
• If growth is 25% above CPI compounded annually over three years, then a further 30% (i.e. a total of 100%) of the 30% will vest. If growth is between 10% and 25% above CPI over the three years then the additional 30% will be reduced on a pro-rata basis.
The performance criteria for senior managers will be measured at subsidiary level.
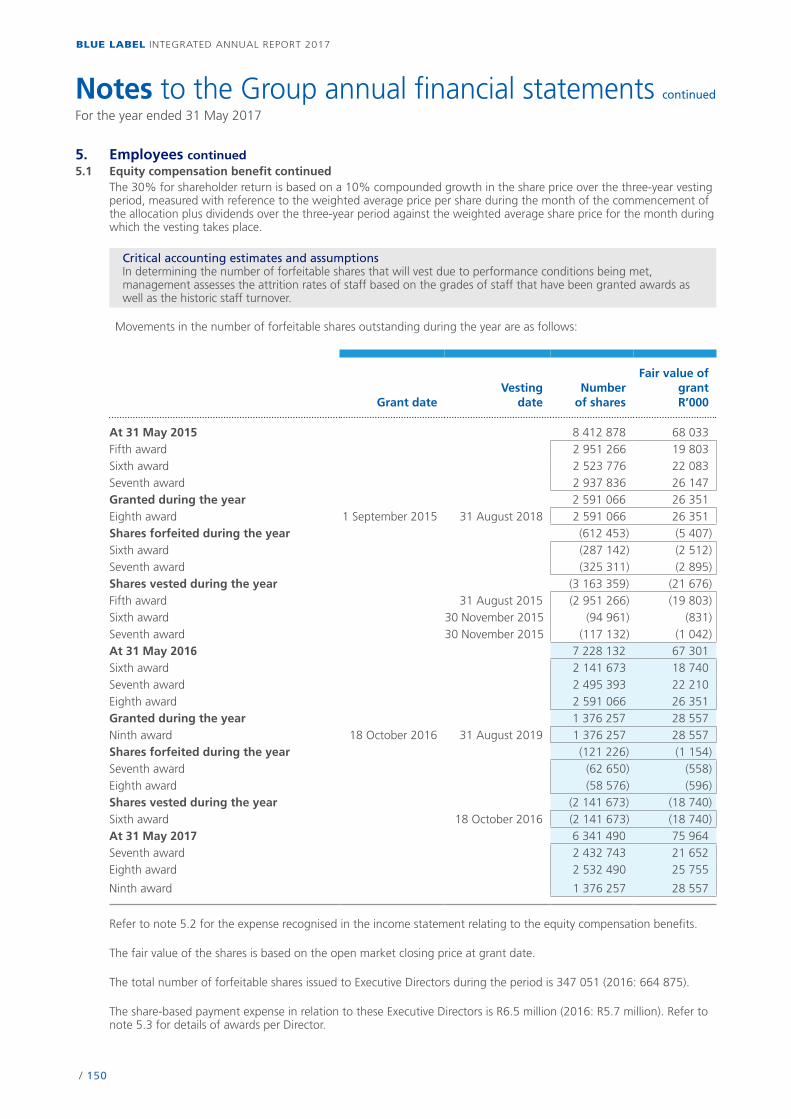
/ 150
BLUE LABEL INTEGRATED ANNUAL REPORT 2017
Notes to the Group annual financial statements continued
For the year ended 31 May 2017
5. Employees continued5.1 Equity compensation benefit continued
The 30% for shareholder return is based on a 10% compounded growth in the share price over the three-year vesting period, measured with reference to the weighted average price per share during the month of the commencement of the allocation plus dividends over the three-year period against the weighted average share price for the month during which the vesting takes place.
Critical accounting estimates and assumptionsIn determining the number of forfeitable shares that will vest due to performance conditions being met, management assesses the attrition rates of staff based on the grades of staff that have been granted awards as well as the historic staff turnover.
Movements in the number of forfeitable shares outstanding during the year are as follows:
Grant dateVesting
dateNumber
of shares
Fair value of grantR’000
At 31 May 2015 8 412 878 68 033Fifth award 2 951 266 19 803Sixth award 2 523 776 22 083Seventh award 2 937 836 26 147Granted during the year 2 591 066 26 351Eighth award 1 September 2015 31 August 2018 2 591 066 26 351Shares forfeited during the year (612 453) (5 407)Sixth award (287 142) (2 512)Seventh award (325 311) (2 895)Shares vested during the year (3 163 359) (21 676)Fifth award 31 August 2015 (2 951 266) (19 803)Sixth award 30 November 2015 (94 961) (831)Seventh award 30 November 2015 (117 132) (1 042)At 31 May 2016 7 228 132 67 301Sixth award 2 141 673 18 740Seventh award 2 495 393 22 210Eighth award 2 591 066 26 351Granted during the year 1 376 257 28 557Ninth award 18 October 2016 31 August 2019 1 376 257 28 557Shares forfeited during the year (121 226) (1 154)Seventh award (62 650) (558)Eighth award (58 576) (596)Shares vested during the year (2 141 673) (18 740)Sixth award 18 October 2016 (2 141 673) (18 740)At 31 May 2017 6 341 490 75 964Seventh award 2 432 743 21 652Eighth award 2 532 490 25 755
Ninth award 1 376 257 28 557
Refer to note 5.2 for the expense recognised in the income statement relating to the equity compensation benefits.
The fair value of the shares is based on the open market closing price at grant date.
The total number of forfeitable shares issued to Executive Directors during the period is 347 051 (2016: 664 875).
The share-based payment expense in relation to these Executive Directors is R6.5 million (2016: R5.7 million). Refer to note 5.3 for details of awards per Director.
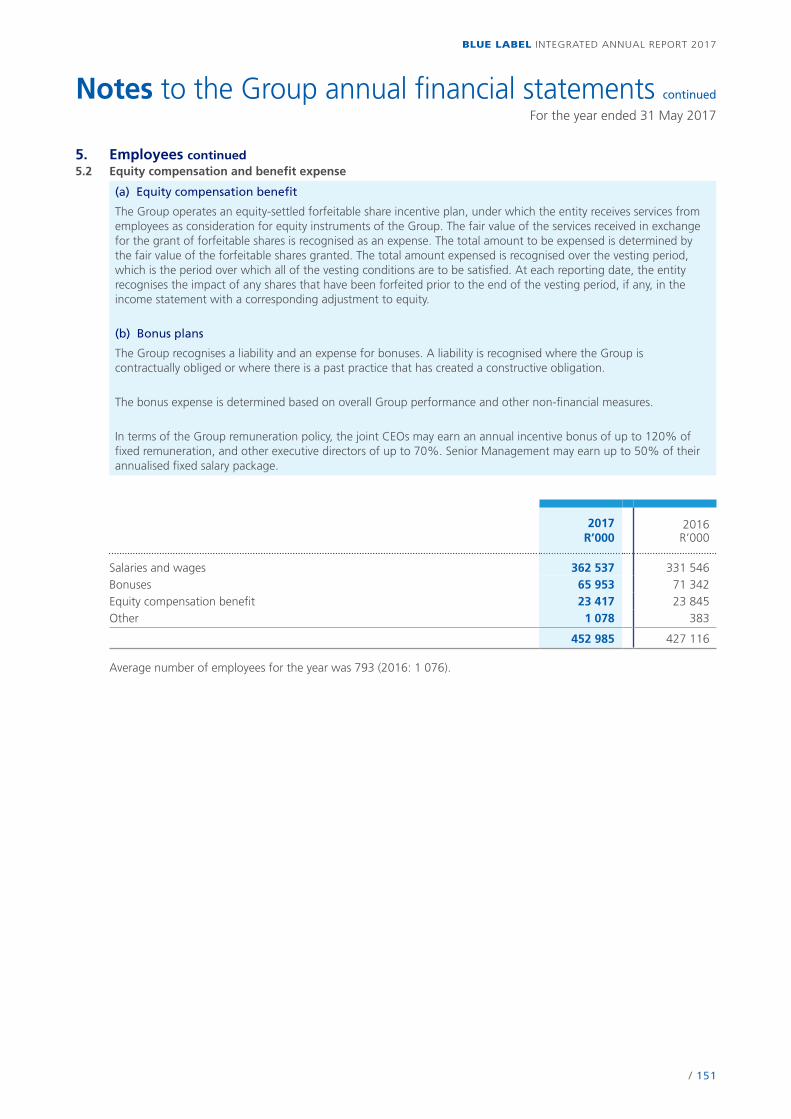
/ 151
BLUE LABEL INTEGRATED ANNUAL REPORT 2017
Notes to the Group annual financial statements continued
For the year ended 31 May 2017
5. Employees continued5.2 Equity compensation and benefit expense
(a) Equity compensation benefit
The Group operates an equity-settled forfeitable share incentive plan, under which the entity receives services from employees as consideration for equity instruments of the Group. The fair value of the services received in exchange for the grant of forfeitable shares is recognised as an expense. The total amount to be expensed is determined by the fair value of the forfeitable shares granted. The total amount expensed is recognised over the vesting period, which is the period over which all of the vesting conditions are to be satisfied. At each reporting date, the entity recognises the impact of any shares that have been forfeited prior to the end of the vesting period, if any, in the income statement with a corresponding adjustment to equity.
(b) Bonus plans
The Group recognises a liability and an expense for bonuses. A liability is recognised where the Group is contractually obliged or where there is a past practice that has created a constructive obligation.
The bonus expense is determined based on overall Group performance and other non-financial measures.
In terms of the Group remuneration policy, the joint CEOs may earn an annual incentive bonus of up to 120% of fixed remuneration, and other executive directors of up to 70%. Senior Management may earn up to 50% of their annualised fixed salary package.
2017R’000
2016R’000
Salaries and wages 362 537 331 546Bonuses 65 953 71 342Equity compensation benefit 23 417 23 845Other 1 078 383
452 985 427 116
Average number of employees for the year was 793 (2016: 1 076).

/ 152
BLUE LABEL INTEGRATED ANNUAL REPORT 2017
Notes to the Group annual financial statements continued
For the year ended 31 May 2017
5. Employees continued5.3 Directors’ emoluments
Blue LabelServices as
Directors ofBlue Label
TelecomsLimited
R’000
Salary andallowances
R’000
Bonuses andperformance-
relatedpayments
R’000
Otherbenefits
R’000Subtotal
R’000
Services asDirectors ofsubsidiaries
of Blue LabelTelecoms
LimitedR’000
Salary andallowances
fromsubsidiaries
R’000
Bonuses andperformance-
relatedpayments
fromsubsidiaries
R’000
Retirementand related
benefits fromsubsidiaries
R’000
Corporatefinance and
legal feesfor servicesrendered to
Blue LabelTelecoms
GroupR’000
TotalR’000
Fair valueof
forfeitablesharesR’000
For the year ended 31 May 2017Executive directorsBM Levy — 7 973 7 808 160 15 941 — — — — — 15 941 10 729 MS Levy — 7 985 7 808 149 15 942 — — — — — 15 942 10 729 DA Suntup — 4 159 2 412 149 6 720 — — — — — 6 720 5 682
— 20 117 18 028 458 38 603 — — — — — 38 603 27 140
Non-executive directorsLM Nestadt 1 214 — — — 1 214 — — — — — 1 214K Ellerine 439 — — — 439 — — — — — 439G Harlow 890 — — — 890 473 — — — — 1 363J Mthimunye 772 — — — 772 48 — — — — 820JS Vilakazi 564 — — — 564 — — — — — 564P Mahanyele** 339 — — — 339 — — — — — 339 Y Mahomed## 231 — — — 231 72 — — — — 303
4 449 — — — 4 449 593 — — — — 5 042
4 449 20 117 18 028 458 43 052 593 — — — — 43 645
For the year ended 31 May 2016Executive directorsBM Levy — 7 492 9 165 146 16 803 — — — — — 16 803 12 843MS Levy — 7 503 9 165 135 16 803 — — — — — 16 803 12 843M Pamensky* — 4 212 — 80 4 292 — — — — — 4 292 —DA Suntup — 3 910 2 831 135 6 876 — — — — — 6 876 6 403
— 23 117 21 161 496 44 774 — — — — — 44 774 32 089
Non-executive directorsLM Nestadt 995 — — — 995 — — — — — 995K Ellerine 369 — — — 369 — — — — — 369G Harlow 658 — — — 658 399 — — — — 1 057J Mthimunye 491 — — — 491 45 — — — — 536JS Vilakazi 311 — — — 311 — — — — — 311Y Mahomed# 152 — — — 152 22 — — — — 174
2 976 — — — 2 976 466 — — — — 3 442
2 976 23 117 21 161 496 47 750 466 — — — — 48 216
* M Pamensky resigned with effect from 30 November 2015.# Y Mahomed appointed with effect from 18 August 2015.** P Mahanyele appointed with effect from 1 September 2016.## Y Mahomed resigned with effect from 11 January 2017.
The fair value of forfeitable shares per Director has been included.
No Director has a notice period of more than one year.
No Director’s service contract includes predetermined compensation as a result of termination that would exceed one year’s salary and benefits.
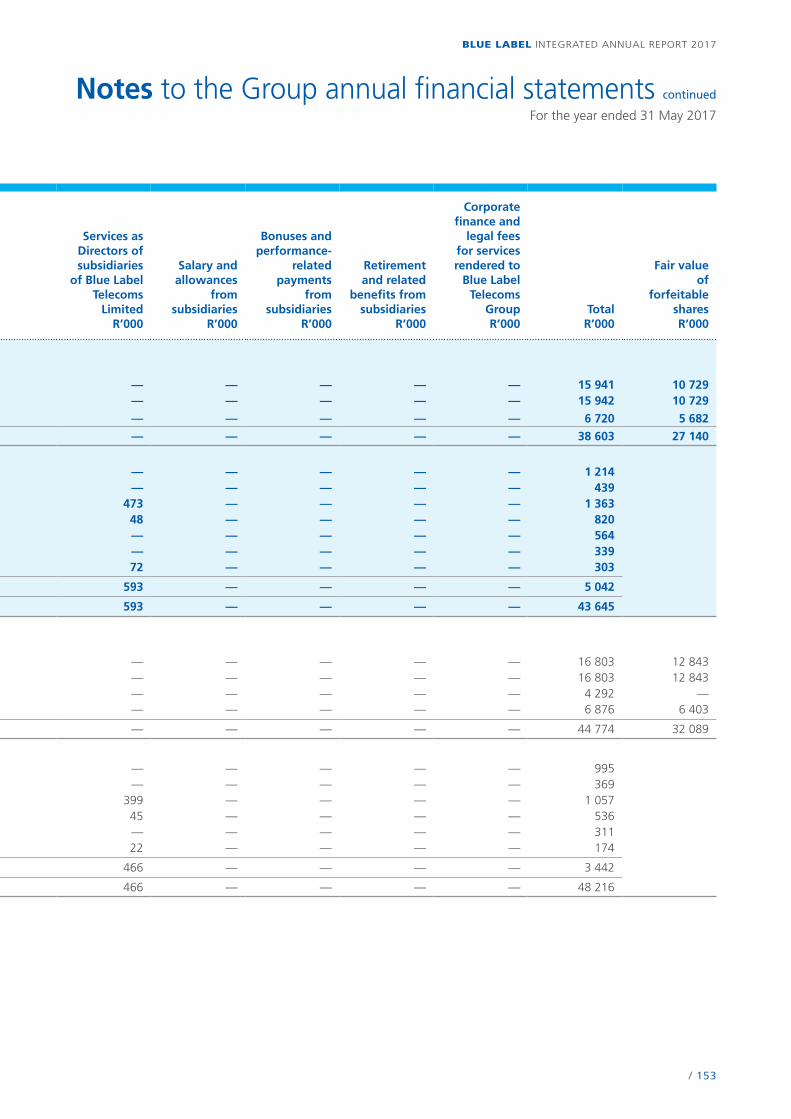
/ 153
BLUE LABEL INTEGRATED ANNUAL REPORT 2017
Notes to the Group annual financial statements continued
For the year ended 31 May 2017
5. Employees continued5.3 Directors’ emoluments
Blue LabelServices as
Directors ofBlue Label
TelecomsLimited
R’000
Salary andallowances
R’000
Bonuses andperformance-
relatedpayments
R’000
Otherbenefits
R’000Subtotal
R’000
Services asDirectors ofsubsidiaries
of Blue LabelTelecoms
LimitedR’000
Salary andallowances
fromsubsidiaries
R’000
Bonuses andperformance-
relatedpayments
fromsubsidiaries
R’000
Retirementand related
benefits fromsubsidiaries
R’000
Corporatefinance and
legal feesfor servicesrendered to
Blue LabelTelecoms
GroupR’000
TotalR’000
Fair valueof
forfeitablesharesR’000
For the year ended 31 May 2017Executive directorsBM Levy — 7 973 7 808 160 15 941 — — — — — 15 941 10 729 MS Levy — 7 985 7 808 149 15 942 — — — — — 15 942 10 729 DA Suntup — 4 159 2 412 149 6 720 — — — — — 6 720 5 682
— 20 117 18 028 458 38 603 — — — — — 38 603 27 140
Non-executive directorsLM Nestadt 1 214 — — — 1 214 — — — — — 1 214K Ellerine 439 — — — 439 — — — — — 439G Harlow 890 — — — 890 473 — — — — 1 363J Mthimunye 772 — — — 772 48 — — — — 820JS Vilakazi 564 — — — 564 — — — — — 564P Mahanyele** 339 — — — 339 — — — — — 339 Y Mahomed## 231 — — — 231 72 — — — — 303
4 449 — — — 4 449 593 — — — — 5 042
4 449 20 117 18 028 458 43 052 593 — — — — 43 645
For the year ended 31 May 2016Executive directorsBM Levy — 7 492 9 165 146 16 803 — — — — — 16 803 12 843MS Levy — 7 503 9 165 135 16 803 — — — — — 16 803 12 843M Pamensky* — 4 212 — 80 4 292 — — — — — 4 292 —DA Suntup — 3 910 2 831 135 6 876 — — — — — 6 876 6 403
— 23 117 21 161 496 44 774 — — — — — 44 774 32 089
Non-executive directorsLM Nestadt 995 — — — 995 — — — — — 995K Ellerine 369 — — — 369 — — — — — 369G Harlow 658 — — — 658 399 — — — — 1 057J Mthimunye 491 — — — 491 45 — — — — 536JS Vilakazi 311 — — — 311 — — — — — 311Y Mahomed# 152 — — — 152 22 — — — — 174
2 976 — — — 2 976 466 — — — — 3 442
2 976 23 117 21 161 496 47 750 466 — — — — 48 216
* M Pamensky resigned with effect from 30 November 2015.# Y Mahomed appointed with effect from 18 August 2015.** P Mahanyele appointed with effect from 1 September 2016.## Y Mahomed resigned with effect from 11 January 2017.
The fair value of forfeitable shares per Director has been included.
No Director has a notice period of more than one year.
No Director’s service contract includes predetermined compensation as a result of termination that would exceed one year’s salary and benefits.
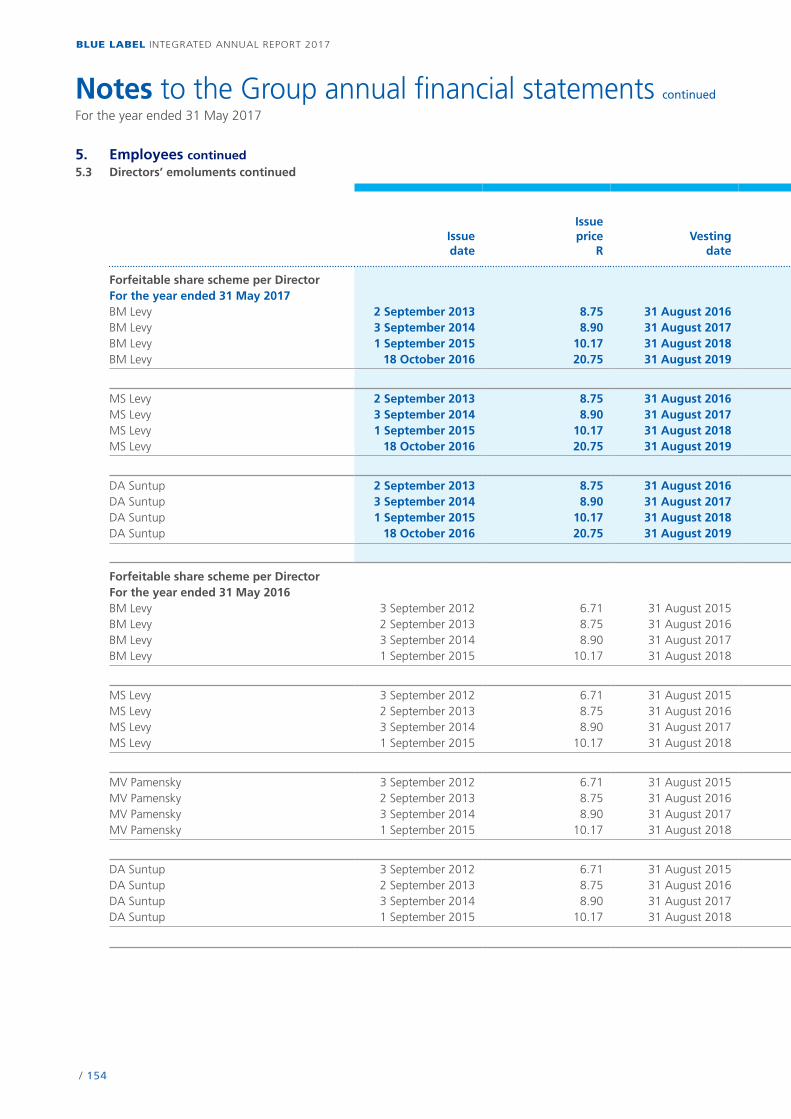
/ 154
BLUE LABEL INTEGRATED ANNUAL REPORT 2017
Notes to the Group annual financial statements continued
For the year ended 31 May 2017
5. Employees continued5.3 Directors’ emoluments continued
Issue date
Issue price
RVesting
date
Awards outstanding as at
the beginningof the year
Number of shares awarded
Awards forfeited
during the year
Awards vested during
the year
Balanceas at
the endof the year
Forfeitable share scheme per DirectorFor the year ended 31 May 2017BM Levy 2 September 2013 8.75 31 August 2016 271 883 — — (271 883) —BM Levy 3 September 2014 8.90 31 August 2017 283 339 — — — 283 339 BM Levy 1 September 2015 10.17 31 August 2018 262 834 — — 262 834 BM Levy 18 October 2016 20.75 31 August 2019 — 137 194 — — 137 194
818 056 137 194 — (271 883) 683 367
MS Levy 2 September 2013 8.75 31 August 2016 271 883 — — (271 883) — MS Levy 3 September 2014 8.90 31 August 2017 283 339 — — — 283 339 MS Levy 1 September 2015 10.17 31 August 2018 262 834 — — 262 834 MS Levy 18 October 2016 20.75 31 August 2019 — 137 194 137 194
818 056 137 194 — (271 883) 683 367
DA Suntup 2 September 2013 8.75 31 August 2016 118 540 — — (118 540) — DA Suntup 3 September 2014 8.90 31 August 2017 150 067 — — — 150 067 DA Suntup 1 September 2015 10.17 31 August 2018 139 207 — — 139 207 DA Suntup 18 October 2016 20.75 31 August 2019 — 72 663 — — 72 663
407 814 72 663 — (118 540) 361 937
Forfeitable share scheme per DirectorFor the year ended 31 May 2016BM Levy 3 September 2012 6.71 31 August 2015 334 474 — — (334 474) —BM Levy 2 September 2013 8.75 31 August 2016 271 883 — — — 271 883BM Levy 3 September 2014 8.90 31 August 2017 283 339 — — — 283 339BM Levy 1 September 2015 10.17 31 August 2018 — 262 834 — — 262 834
889 696 262 834 — (334 474) 818 056
MS Levy 3 September 2012 6.71 31 August 2015 334 474 — — (334 474) —MS Levy 2 September 2013 8.75 31 August 2016 271 883 — — — 271 883MS Levy 3 September 2014 8.90 31 August 2017 283 339 — — — 283 339MS Levy 1 September 2015 10.17 31 August 2018 — 262 834 — — 262 834
889 696 262 834 — (334 474) 818 056
MV Pamensky 3 September 2012 6.71 31 August 2015 281 982 — — (281 982) —MV Pamensky 2 September 2013 8.75 31 August 2016 229 214 — (229 214) — —MV Pamensky 3 September 2014 8.90 31 August 2017 238 872 — (238 872) — —MV Pamensky 1 September 2015 10.17 31 August 2018 — 221 585 (221 585) — —
750 068 221 585 (689 671) (281 982) —
DA Suntup 3 September 2012 6.71 31 August 2015 145 829 — — (145 829) —DA Suntup 2 September 2013 8.75 31 August 2016 118 540 — — — 118 540DA Suntup 3 September 2014 8.90 31 August 2017 150 067 — — — 150 067DA Suntup 1 September 2015 10.17 31 August 2018 — 139 207 — — 139 207
414 436 139 207 — (145 829) 407 814

/ 155
BLUE LABEL INTEGRATED ANNUAL REPORT 2017
Notes to the Group annual financial statements continued
For the year ended 31 May 2017
5. Employees continued5.3 Directors’ emoluments continued
Issue date
Issue price
RVesting
date
Awards outstanding as at
the beginningof the year
Number of shares awarded
Awards forfeited
during the year
Awards vested during
the year
Balanceas at
the endof the year
Forfeitable share scheme per DirectorFor the year ended 31 May 2017BM Levy 2 September 2013 8.75 31 August 2016 271 883 — — (271 883) —BM Levy 3 September 2014 8.90 31 August 2017 283 339 — — — 283 339 BM Levy 1 September 2015 10.17 31 August 2018 262 834 — — 262 834 BM Levy 18 October 2016 20.75 31 August 2019 — 137 194 — — 137 194
818 056 137 194 — (271 883) 683 367
MS Levy 2 September 2013 8.75 31 August 2016 271 883 — — (271 883) — MS Levy 3 September 2014 8.90 31 August 2017 283 339 — — — 283 339 MS Levy 1 September 2015 10.17 31 August 2018 262 834 — — 262 834 MS Levy 18 October 2016 20.75 31 August 2019 — 137 194 137 194
818 056 137 194 — (271 883) 683 367
DA Suntup 2 September 2013 8.75 31 August 2016 118 540 — — (118 540) — DA Suntup 3 September 2014 8.90 31 August 2017 150 067 — — — 150 067 DA Suntup 1 September 2015 10.17 31 August 2018 139 207 — — 139 207 DA Suntup 18 October 2016 20.75 31 August 2019 — 72 663 — — 72 663
407 814 72 663 — (118 540) 361 937
Forfeitable share scheme per DirectorFor the year ended 31 May 2016BM Levy 3 September 2012 6.71 31 August 2015 334 474 — — (334 474) —BM Levy 2 September 2013 8.75 31 August 2016 271 883 — — — 271 883BM Levy 3 September 2014 8.90 31 August 2017 283 339 — — — 283 339BM Levy 1 September 2015 10.17 31 August 2018 — 262 834 — — 262 834
889 696 262 834 — (334 474) 818 056
MS Levy 3 September 2012 6.71 31 August 2015 334 474 — — (334 474) —MS Levy 2 September 2013 8.75 31 August 2016 271 883 — — — 271 883MS Levy 3 September 2014 8.90 31 August 2017 283 339 — — — 283 339MS Levy 1 September 2015 10.17 31 August 2018 — 262 834 — — 262 834
889 696 262 834 — (334 474) 818 056
MV Pamensky 3 September 2012 6.71 31 August 2015 281 982 — — (281 982) —MV Pamensky 2 September 2013 8.75 31 August 2016 229 214 — (229 214) — —MV Pamensky 3 September 2014 8.90 31 August 2017 238 872 — (238 872) — —MV Pamensky 1 September 2015 10.17 31 August 2018 — 221 585 (221 585) — —
750 068 221 585 (689 671) (281 982) —
DA Suntup 3 September 2012 6.71 31 August 2015 145 829 — — (145 829) —DA Suntup 2 September 2013 8.75 31 August 2016 118 540 — — — 118 540DA Suntup 3 September 2014 8.90 31 August 2017 150 067 — — — 150 067DA Suntup 1 September 2015 10.17 31 August 2018 — 139 207 — — 139 207
414 436 139 207 — (145 829) 407 814
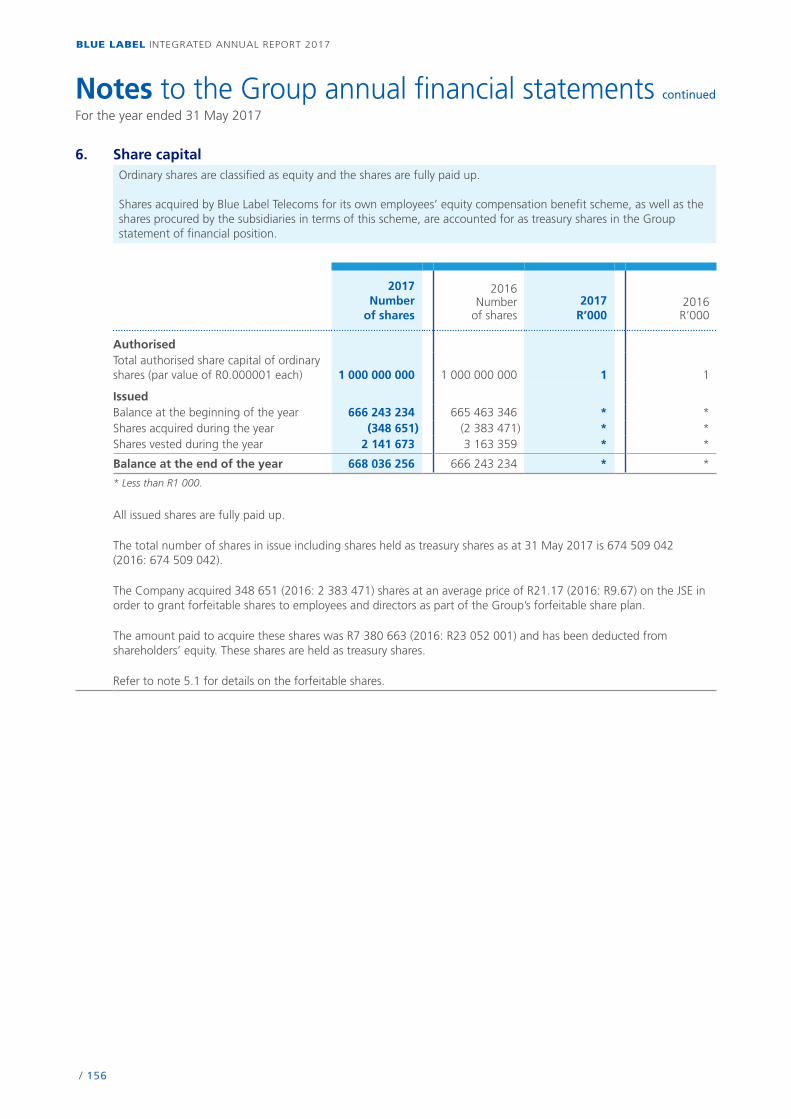
/ 156
BLUE LABEL INTEGRATED ANNUAL REPORT 2017
Notes to the Group annual financial statements continued
For the year ended 31 May 2017
6. Share capitalOrdinary shares are classified as equity and the shares are fully paid up.
Shares acquired by Blue Label Telecoms for its own employees’ equity compensation benefit scheme, as well as the shares procured by the subsidiaries in terms of this scheme, are accounted for as treasury shares in the Group statement of financial position.
2017Number
of shares
2016Number
of shares2017
R’0002016
R’000
AuthorisedTotal authorised share capital of ordinary shares (par value of R0.000001 each) 1 000 000 000 1 000 000 000 1 1
IssuedBalance at the beginning of the year 666 243 234 665 463 346 * *Shares acquired during the year (348 651) (2 383 471) * *Shares vested during the year 2 141 673 3 163 359 * *
Balance at the end of the year 668 036 256 666 243 234 * *
* Less than R1 000.
All issued shares are fully paid up.
The total number of shares in issue including shares held as treasury shares as at 31 May 2017 is 674 509 042 (2016: 674 509 042).
The Company acquired 348 651 (2016: 2 383 471) shares at an average price of R21.17 (2016: R9.67) on the JSE in order to grant forfeitable shares to employees and directors as part of the Group’s forfeitable share plan.
The amount paid to acquire these shares was R7 380 663 (2016: R23 052 001) and has been deducted from shareholders’ equity. These shares are held as treasury shares.
Refer to note 5.1 for details on the forfeitable shares.
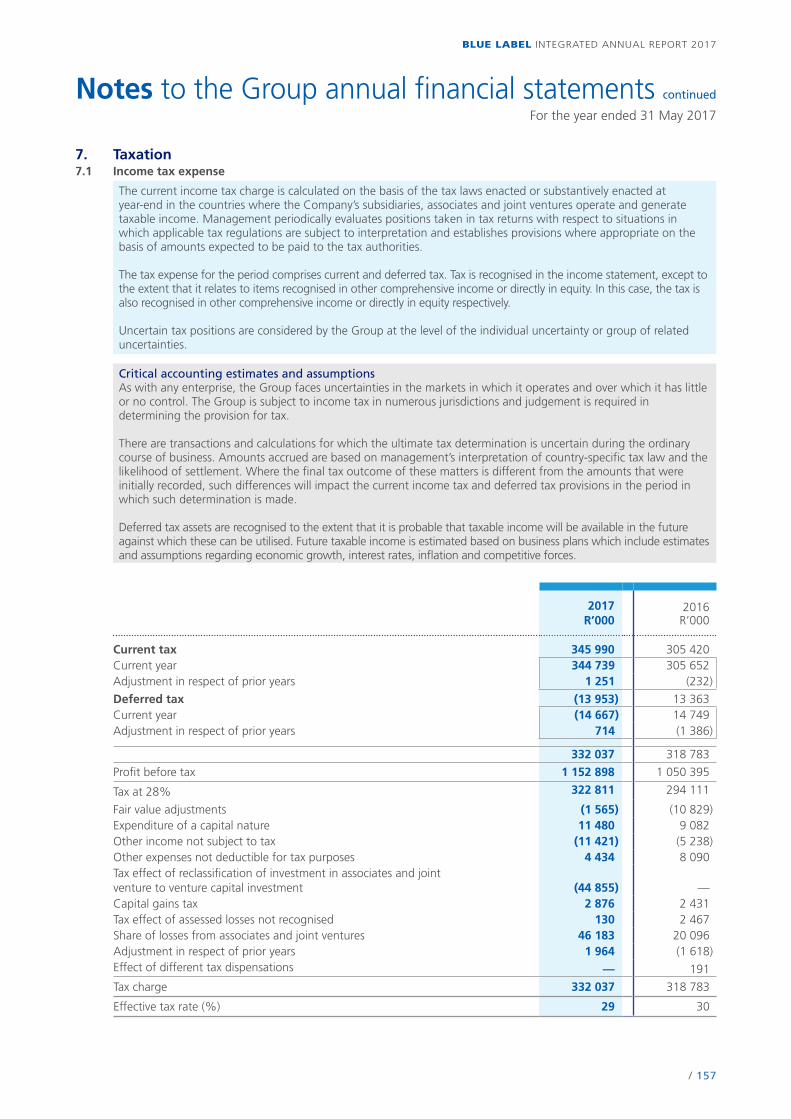
/ 157
BLUE LABEL INTEGRATED ANNUAL REPORT 2017
Notes to the Group annual financial statements continued
For the year ended 31 May 2017
7. Taxation7.1 Income tax expense
The current income tax charge is calculated on the basis of the tax laws enacted or substantively enacted at year-end in the countries where the Company’s subsidiaries, associates and joint ventures operate and generate taxable income. Management periodically evaluates positions taken in tax returns with respect to situations in which applicable tax regulations are subject to interpretation and establishes provisions where appropriate on the basis of amounts expected to be paid to the tax authorities.
The tax expense for the period comprises current and deferred tax. Tax is recognised in the income statement, except to the extent that it relates to items recognised in other comprehensive income or directly in equity. In this case, the tax is also recognised in other comprehensive income or directly in equity respectively.
Uncertain tax positions are considered by the Group at the level of the individual uncertainty or group of related uncertainties.
Critical accounting estimates and assumptionsAs with any enterprise, the Group faces uncertainties in the markets in which it operates and over which it has little or no control. The Group is subject to income tax in numerous jurisdictions and judgement is required in determining the provision for tax.
There are transactions and calculations for which the ultimate tax determination is uncertain during the ordinary course of business. Amounts accrued are based on management’s interpretation of country-specific tax law and the likelihood of settlement. Where the final tax outcome of these matters is different from the amounts that were initially recorded, such differences will impact the current income tax and deferred tax provisions in the period in which such determination is made.
Deferred tax assets are recognised to the extent that it is probable that taxable income will be available in the future against which these can be utilised. Future taxable income is estimated based on business plans which include estimates and assumptions regarding economic growth, interest rates, inflation and competitive forces.
2017 R’000
2016 R’000
Current tax 345 990 305 420Current year 344 739 305 652Adjustment in respect of prior years 1 251 (232)
Deferred tax (13 953) 13 363Current year (14 667) 14 749Adjustment in respect of prior years 714 (1 386)
332 037 318 783
Profit before tax 1 152 898 1 050 395
Tax at 28% 322 811 294 111
Fair value adjustments (1 565) (10 829)Expenditure of a capital nature 11 480 9 082Other income not subject to tax (11 421) (5 238)Other expenses not deductible for tax purposes 4 434 8 090Tax effect of reclassification of investment in associates and joint venture to venture capital investment (44 855) —Capital gains tax 2 876 2 431Tax effect of assessed losses not recognised 130 2 467Share of losses from associates and joint ventures 46 183 20 096Adjustment in respect of prior years 1 964 (1 618)Effect of different tax dispensations — 191
Tax charge 332 037 318 783
Effective tax rate (%) 29 30
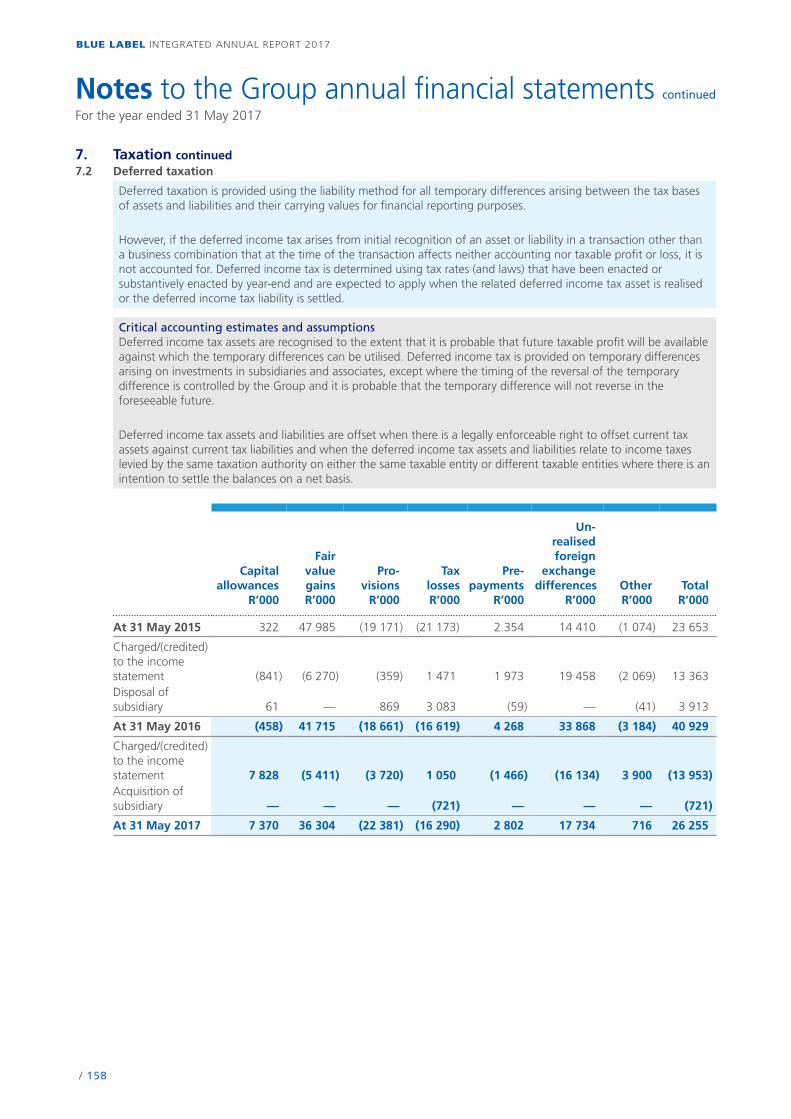
/ 158
Notes to the Group annual financial statements continued
For the year ended 31 May 2017
BLUE LABEL INTEGRATED ANNUAL REPORT 2017
7. Taxation continued7.2 Deferred taxation
Deferred taxation is provided using the liability method for all temporary differences arising between the tax bases of assets and liabilities and their carrying values for financial reporting purposes.
However, if the deferred income tax arises from initial recognition of an asset or liability in a transaction other than a business combination that at the time of the transaction affects neither accounting nor taxable profit or loss, it is not accounted for. Deferred income tax is determined using tax rates (and laws) that have been enacted or substantively enacted by year-end and are expected to apply when the related deferred income tax asset is realised or the deferred income tax liability is settled.
Critical accounting estimates and assumptionsDeferred income tax assets are recognised to the extent that it is probable that future taxable profit will be available against which the temporary differences can be utilised. Deferred income tax is provided on temporary differences arising on investments in subsidiaries and associates, except where the timing of the reversal of the temporary difference is controlled by the Group and it is probable that the temporary difference will not reverse in the foreseeable future.
Deferred income tax assets and liabilities are offset when there is a legally enforceable right to offset current tax assets against current tax liabilities and when the deferred income tax assets and liabilities relate to income taxes levied by the same taxation authority on either the same taxable entity or different taxable entities where there is an intention to settle the balances on a net basis.
Capital allowances
R’000
Fair value gains R’000
Pro-visions
R’000
Tax losses R’000
Pre-payments
R’000
Un-realised foreign
exchange differences
R’000Other R’000
Total R’000
At 31 May 2015 322 47 985 (19 171) (21 173) 2 354 14 410 (1 074) 23 653
Charged/(credited) to the income statement (841) (6 270) (359) 1 471 1 973 19 458 (2 069) 13 363Disposal of subsidiary 61 — 869 3 083 (59) — (41) 3 913
At 31 May 2016 (458) 41 715 (18 661) (16 619) 4 268 33 868 (3 184) 40 929
Charged/(credited) to the income statement 7 828 (5 411) (3 720) 1 050 (1 466) (16 134) 3 900 (13 953) Acquisition of subsidiary — — — (721) — — — (721)
At 31 May 2017 7 370 36 304 (22 381) (16 290) 2 802 17 734 716 26 255
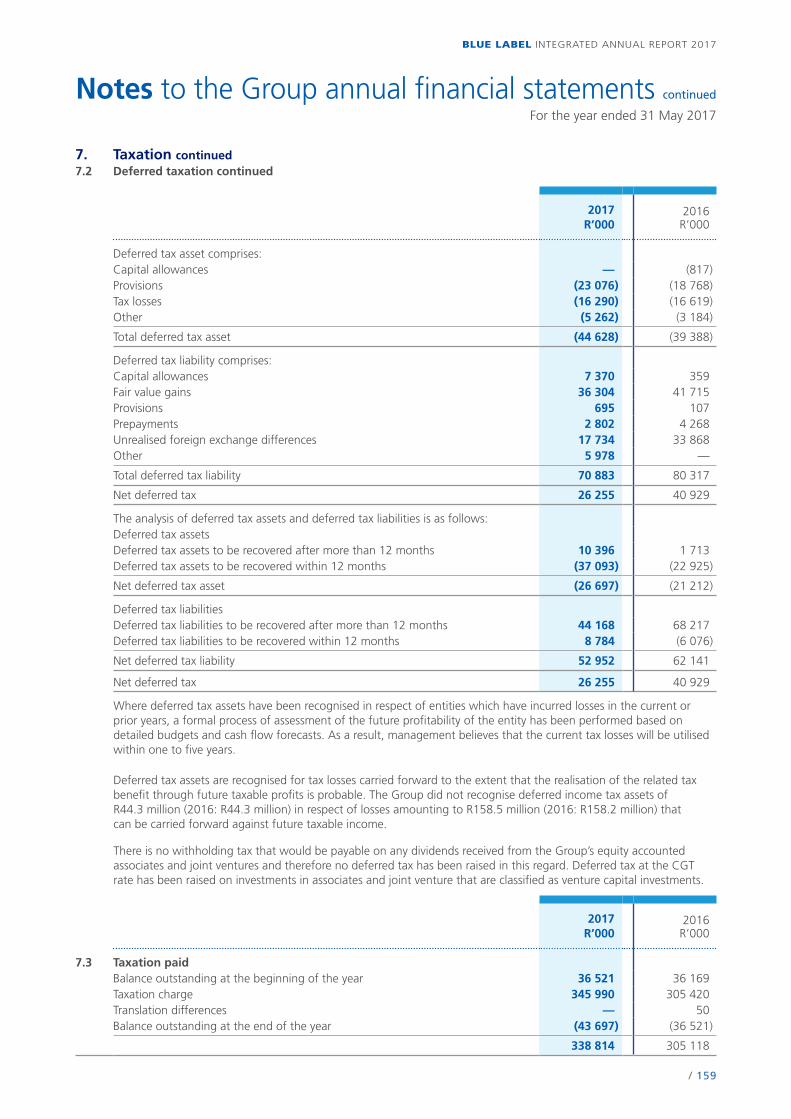
/ 159
Notes to the Group annual financial statements continued
For the year ended 31 May 2017
BLUE LABEL INTEGRATED ANNUAL REPORT 2017
7. Taxation continued7.2 Deferred taxation continued
2017 R’000
2016 R’000
Deferred tax asset comprises:Capital allowances — (817)Provisions (23 076) (18 768)Tax losses (16 290) (16 619)Other (5 262) (3 184)
Total deferred tax asset (44 628) (39 388)
Deferred tax liability comprises:Capital allowances 7 370 359Fair value gains 36 304 41 715Provisions 695 107Prepayments 2 802 4 268Unrealised foreign exchange differences 17 734 33 868Other 5 978 —
Total deferred tax liability 70 883 80 317
Net deferred tax 26 255 40 929
The analysis of deferred tax assets and deferred tax liabilities is as follows:Deferred tax assetsDeferred tax assets to be recovered after more than 12 months 10 396 1 713Deferred tax assets to be recovered within 12 months (37 093) (22 925)
Net deferred tax asset (26 697) (21 212)
Deferred tax liabilitiesDeferred tax liabilities to be recovered after more than 12 months 44 168 68 217Deferred tax liabilities to be recovered within 12 months 8 784 (6 076)
Net deferred tax liability 52 952 62 141
Net deferred tax 26 255 40 929
Where deferred tax assets have been recognised in respect of entities which have incurred losses in the current or prior years, a formal process of assessment of the future profitability of the entity has been performed based on detailed budgets and cash flow forecasts. As a result, management believes that the current tax losses will be utilised within one to five years.
Deferred tax assets are recognised for tax losses carried forward to the extent that the realisation of the related tax benefit through future taxable profits is probable. The Group did not recognise deferred income tax assets of R44.3 million (2016: R44.3 million) in respect of losses amounting to R158.5 million (2016: R158.2 million) that can be carried forward against future taxable income.
There is no withholding tax that would be payable on any dividends received from the Group’s equity accounted associates and joint ventures and therefore no deferred tax has been raised in this regard. Deferred tax at the CGT rate has been raised on investments in associates and joint venture that are classified as venture capital investments.
2017 R’000
2016R’000
7.3 Taxation paidBalance outstanding at the beginning of the year 36 521 36 169Taxation charge 345 990 305 420Translation differences — 50Balance outstanding at the end of the year (43 697) (36 521)
338 814 305 118
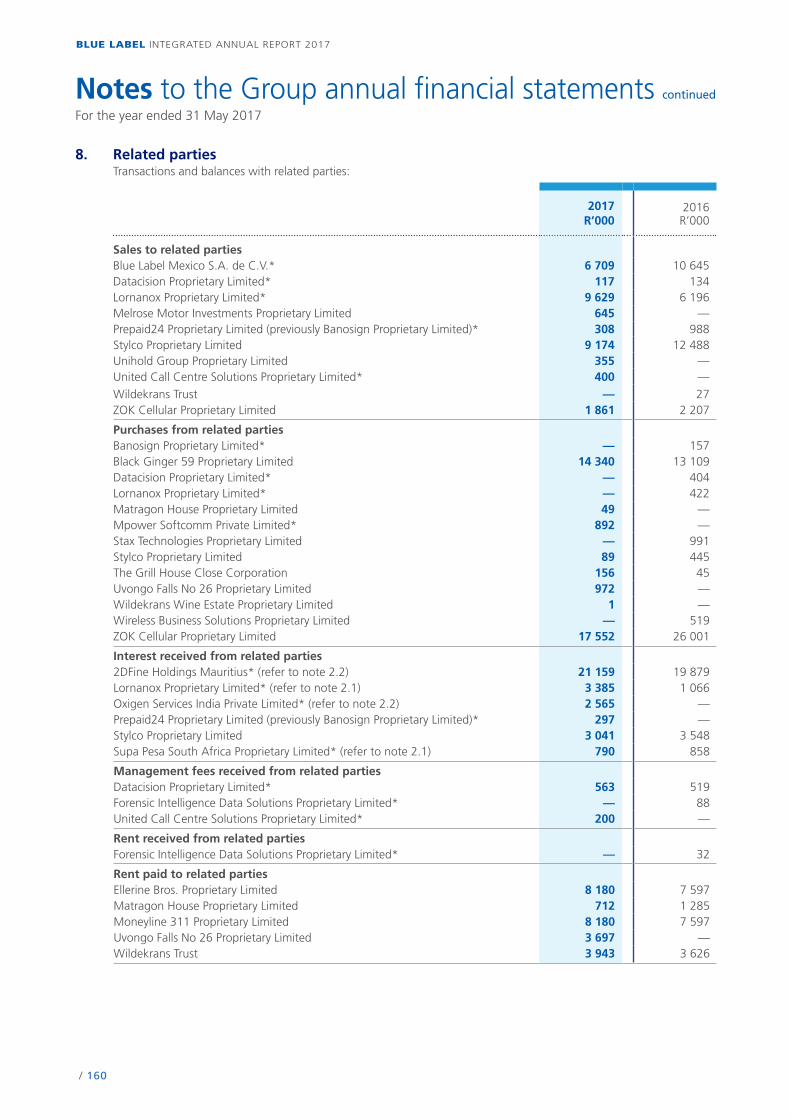
/ 160
Notes to the Group annual financial statements continued
For the year ended 31 May 2017
BLUE LABEL INTEGRATED ANNUAL REPORT 2017
8. Related partiesTransactions and balances with related parties:
2017 R’000
2016R’000
Sales to related partiesBlue Label Mexico S.A. de C.V.* 6 709 10 645Datacision Proprietary Limited* 117 134Lornanox Proprietary Limited* 9 629 6 196Melrose Motor Investments Proprietary Limited 645 —Prepaid24 Proprietary Limited (previously Banosign Proprietary Limited)* 308 988Stylco Proprietary Limited 9 174 12 488Unihold Group Proprietary Limited 355 —United Call Centre Solutions Proprietary Limited* 400 —Wildekrans Trust — 27ZOK Cellular Proprietary Limited 1 861 2 207
Purchases from related partiesBanosign Proprietary Limited* — 157Black Ginger 59 Proprietary Limited 14 340 13 109Datacision Proprietary Limited* — 404Lornanox Proprietary Limited* — 422Matragon House Proprietary Limited 49 —Mpower Softcomm Private Limited* 892 —Stax Technologies Proprietary Limited — 991Stylco Proprietary Limited 89 445The Grill House Close Corporation 156 45Uvongo Falls No 26 Proprietary Limited 972 —Wildekrans Wine Estate Proprietary Limited 1 —Wireless Business Solutions Proprietary Limited — 519ZOK Cellular Proprietary Limited 17 552 26 001
Interest received from related parties2DFine Holdings Mauritius* (refer to note 2.2) 21 159 19 879Lornanox Proprietary Limited* (refer to note 2.1) 3 385 1 066Oxigen Services India Private Limited* (refer to note 2.2) 2 565 —Prepaid24 Proprietary Limited (previously Banosign Proprietary Limited)* 297 —Stylco Proprietary Limited 3 041 3 548Supa Pesa South Africa Proprietary Limited* (refer to note 2.1) 790 858
Management fees received from related partiesDatacision Proprietary Limited* 563 519Forensic Intelligence Data Solutions Proprietary Limited* — 88United Call Centre Solutions Proprietary Limited* 200 —
Rent received from related partiesForensic Intelligence Data Solutions Proprietary Limited* — 32
Rent paid to related partiesEllerine Bros. Proprietary Limited 8 180 7 597Matragon House Proprietary Limited 712 1 285Moneyline 311 Proprietary Limited 8 180 7 597Uvongo Falls No 26 Proprietary Limited 3 697 —Wildekrans Trust 3 943 3 626
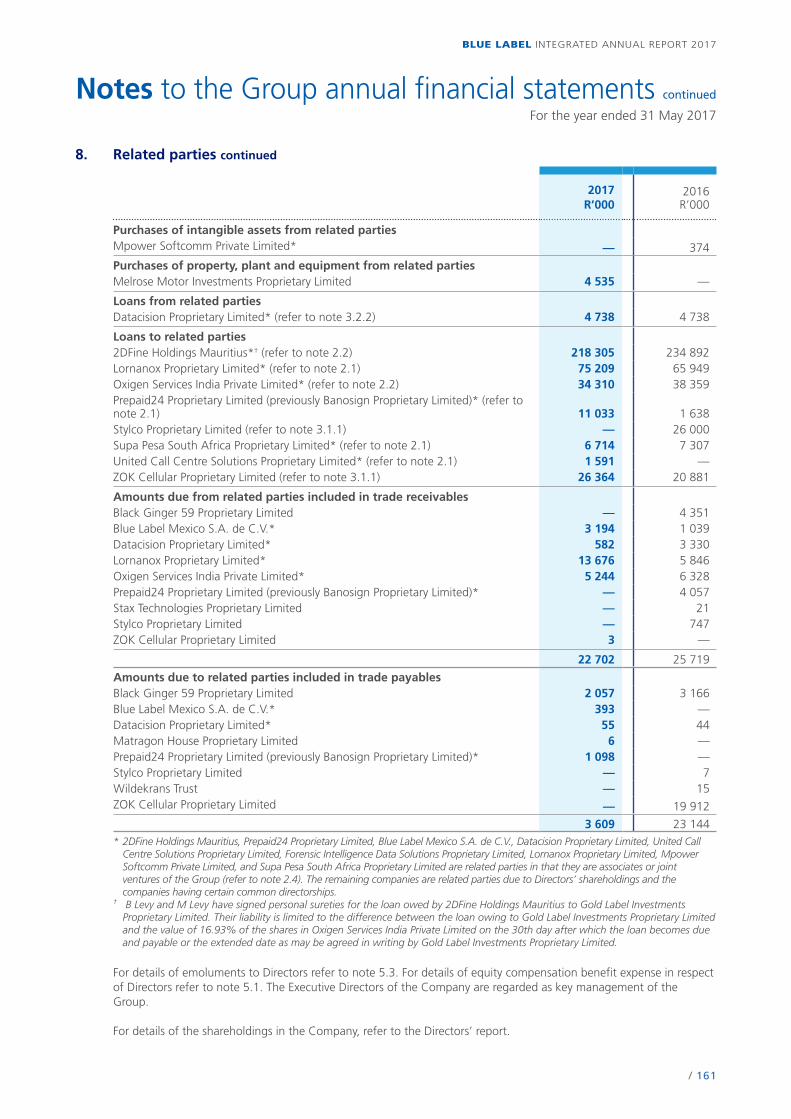
/ 161
Notes to the Group annual financial statements continued
For the year ended 31 May 2017
BLUE LABEL INTEGRATED ANNUAL REPORT 2017
8. Related parties continued
2017 R’000
2016R’000
Purchases of intangible assets from related partiesMpower Softcomm Private Limited* — 374
Purchases of property, plant and equipment from related partiesMelrose Motor Investments Proprietary Limited 4 535 —
Loans from related partiesDatacision Proprietary Limited* (refer to note 3.2.2) 4 738 4 738
Loans to related parties2DFine Holdings Mauritius*† (refer to note 2.2) 218 305 234 892Lornanox Proprietary Limited* (refer to note 2.1) 75 209 65 949Oxigen Services India Private Limited* (refer to note 2.2) 34 310 38 359Prepaid24 Proprietary Limited (previously Banosign Proprietary Limited)* (refer to note 2.1) 11 033 1 638Stylco Proprietary Limited (refer to note 3.1.1) — 26 000Supa Pesa South Africa Proprietary Limited* (refer to note 2.1) 6 714 7 307United Call Centre Solutions Proprietary Limited* (refer to note 2.1) 1 591 —ZOK Cellular Proprietary Limited (refer to note 3.1.1) 26 364 20 881
Amounts due from related parties included in trade receivablesBlack Ginger 59 Proprietary Limited — 4 351Blue Label Mexico S.A. de C.V.* 3 194 1 039Datacision Proprietary Limited* 582 3 330Lornanox Proprietary Limited* 13 676 5 846Oxigen Services India Private Limited* 5 244 6 328Prepaid24 Proprietary Limited (previously Banosign Proprietary Limited)* — 4 057Stax Technologies Proprietary Limited — 21Stylco Proprietary Limited — 747ZOK Cellular Proprietary Limited 3 —
22 702 25 719
Amounts due to related parties included in trade payablesBlack Ginger 59 Proprietary Limited 2 057 3 166Blue Label Mexico S.A. de C.V.* 393 —Datacision Proprietary Limited* 55 44Matragon House Proprietary Limited 6 —Prepaid24 Proprietary Limited (previously Banosign Proprietary Limited)* 1 098 —Stylco Proprietary Limited — 7Wildekrans Trust — 15ZOK Cellular Proprietary Limited — 19 912
3 609 23 144* 2DFine Holdings Mauritius, Prepaid24 Proprietary Limited, Blue Label Mexico S.A. de C.V., Datacision Proprietary Limited, United Call
Centre Solutions Proprietary Limited, Forensic Intelligence Data Solutions Proprietary Limited, Lornanox Proprietary Limited, Mpower Softcomm Private Limited, and Supa Pesa South Africa Proprietary Limited are related parties in that they are associates or joint ventures of the Group (refer to note 2.4). The remaining companies are related parties due to Directors’ shareholdings and the companies having certain common directorships.
† B Levy and M Levy have signed personal sureties for the loan owed by 2DFine Holdings Mauritius to Gold Label Investments Proprietary Limited. Their liability is limited to the difference between the loan owing to Gold Label Investments Proprietary Limited and the value of 16.93% of the shares in Oxigen Services India Private Limited on the 30th day after which the loan becomes due and payable or the extended date as may be agreed in writing by Gold Label Investments Proprietary Limited.
For details of emoluments to Directors refer to note 5.3. For details of equity compensation benefit expense in respect of Directors refer to note 5.1. The Executive Directors of the Company are regarded as key management of the Group.
For details of the shareholdings in the Company, refer to the Directors’ report.
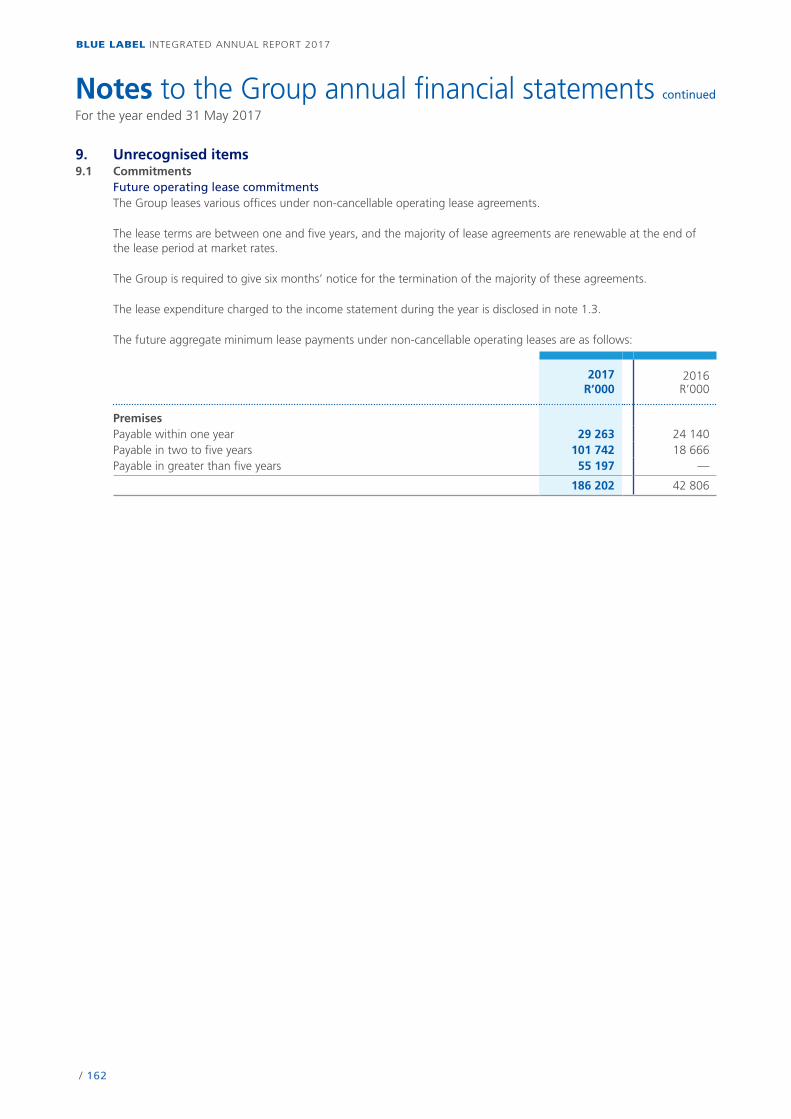
/ 162
Notes to the Group annual financial statements continued
For the year ended 31 May 2017
BLUE LABEL INTEGRATED ANNUAL REPORT 2017
9. Unrecognised items9.1 Commitments
Future operating lease commitmentsThe Group leases various offices under non-cancellable operating lease agreements.
The lease terms are between one and five years, and the majority of lease agreements are renewable at the end of the lease period at market rates.
The Group is required to give six months’ notice for the termination of the majority of these agreements.
The lease expenditure charged to the income statement during the year is disclosed in note 1.3.
The future aggregate minimum lease payments under non-cancellable operating leases are as follows:
2017 R’000
2016 R’000
PremisesPayable within one year 29 263 24 140Payable in two to five years 101 742 18 666Payable in greater than five years 55 197 —
186 202 42 806
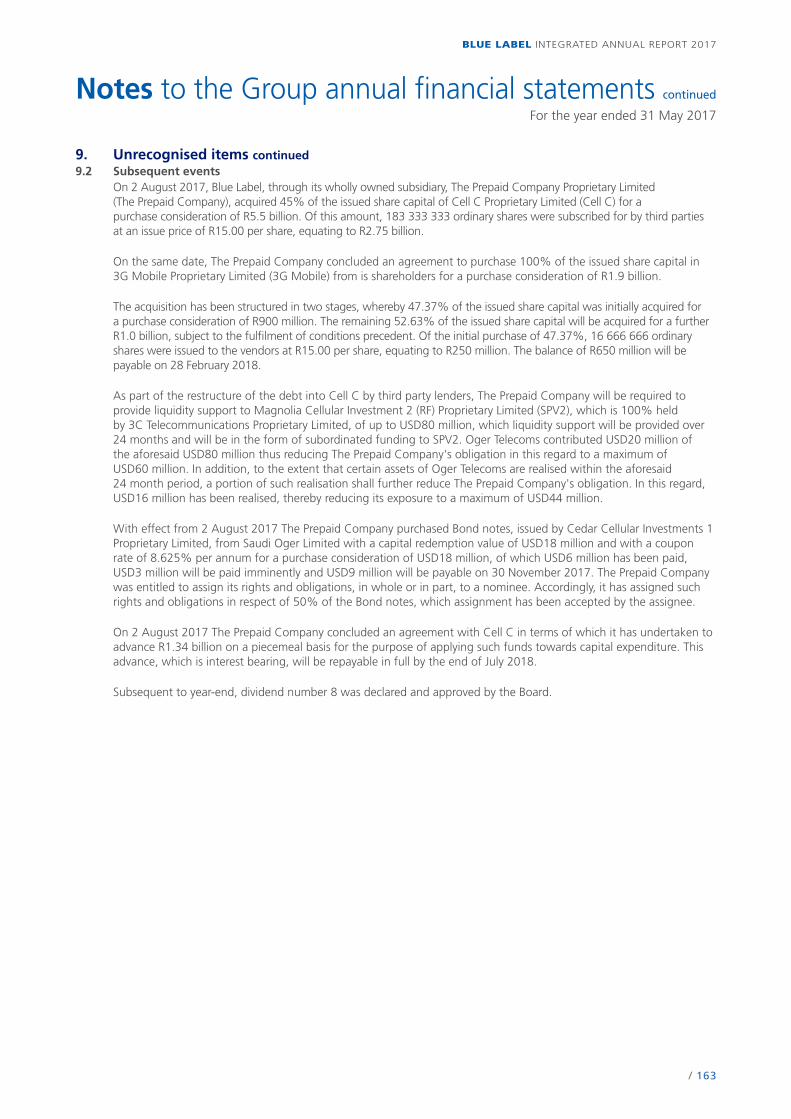
/ 163
Notes to the Group annual financial statements continued
For the year ended 31 May 2017
BLUE LABEL INTEGRATED ANNUAL REPORT 2017
9. Unrecognised items continued9.2 Subsequent events
On 2 August 2017, Blue Label, through its wholly owned subsidiary, The Prepaid Company Proprietary Limited (The Prepaid Company), acquired 45% of the issued share capital of Cell C Proprietary Limited (Cell C) for a purchase consideration of R5.5 billion. Of this amount, 183 333 333 ordinary shares were subscribed for by third parties at an issue price of R15.00 per share, equating to R2.75 billion.
On the same date, The Prepaid Company concluded an agreement to purchase 100% of the issued share capital in 3G Mobile Proprietary Limited (3G Mobile) from is shareholders for a purchase consideration of R1.9 billion.
The acquisition has been structured in two stages, whereby 47.37% of the issued share capital was initially acquired for a purchase consideration of R900 million. The remaining 52.63% of the issued share capital will be acquired for a further R1.0 billion, subject to the fulfilment of conditions precedent. Of the initial purchase of 47.37%, 16 666 666 ordinary shares were issued to the vendors at R15.00 per share, equating to R250 million. The balance of R650 million will be payable on 28 February 2018.
As part of the restructure of the debt into Cell C by third party lenders, The Prepaid Company will be required to provide liquidity support to Magnolia Cellular Investment 2 (RF) Proprietary Limited (SPV2), which is 100% held by 3C Telecommunications Proprietary Limited, of up to USD80 million, which liquidity support will be provided over 24 months and will be in the form of subordinated funding to SPV2. Oger Telecoms contributed USD20 million of the aforesaid USD80 million thus reducing The Prepaid Company's obligation in this regard to a maximum of USD60 million. In addition, to the extent that certain assets of Oger Telecoms are realised within the aforesaid 24 month period, a portion of such realisation shall further reduce The Prepaid Company's obligation. In this regard, USD16 million has been realised, thereby reducing its exposure to a maximum of USD44 million.
With effect from 2 August 2017 The Prepaid Company purchased Bond notes, issued by Cedar Cellular Investments 1 Proprietary Limited, from Saudi Oger Limited with a capital redemption value of USD18 million and with a coupon rate of 8.625% per annum for a purchase consideration of USD18 million, of which USD6 million has been paid, USD3 million will be paid imminently and USD9 million will be payable on 30 November 2017. The Prepaid Company was entitled to assign its rights and obligations, in whole or in part, to a nominee. Accordingly, it has assigned such rights and obligations in respect of 50% of the Bond notes, which assignment has been accepted by the assignee.
On 2 August 2017 The Prepaid Company concluded an agreement with Cell C in terms of which it has undertaken to advance R1.34 billion on a piecemeal basis for the purpose of applying such funds towards capital expenditure. This advance, which is interest bearing, will be repayable in full by the end of July 2018.
Subsequent to year-end, dividend number 8 was declared and approved by the Board.
/ 164
Notes to the Group annual financial statements continued
For the year ended 31 May 2017
BLUE LABEL INTEGRATED ANNUAL REPORT 2017
10. Accounting framework 10.1 Basis of preparation
The principal accounting policies applied in the preparation of the Group and Company annual financial statements are in the related notes and are consistent with those adopted in the prior year, unless otherwise specified.
The Group and Company annual financial statements have been prepared in accordance with International Financial Reporting Standards (IFRS), the SAICA Financial Reporting Guides as issued by the Accounting Practices Committee and Financial Reporting Pronouncements as issued by Financial Reporting Standards Council, the JSE Listings Requirements and the Companies Act, No 71 of 2008.
The term IFRS includes International Financial Reporting Standards (IFRS), International Accounting Standards (IAS) and interpretations issued by the International Financial Reporting Interpretations Committee (IFRIC) or the former Standing Interpretations Committee (SIC). The standards referred to are set by the International Accounting Standards Board (IASB).
The Group and Company annual financial statements are prepared under the historical cost convention, adjusted for financial instruments measured at fair value through profit and loss. Amounts are rounded to the nearest thousand with the exception of earnings per share, ordinary share capital and equity compensation benefit. The preparation of financial statements in conformity with IFRS requires management to make judgements, estimates and assumptions that affect the application of policies and reported amounts of assets and liabilities, income and expenses. The estimates and associated assumptions are based on historical experience and various other factors that are believed to be reasonable under the circumstances. Actual results may differ from these estimates.
The estimates and underlying assumptions are reviewed on an ongoing basis. Revisions to accounting estimates are recognised in the period in which the estimate is revised if the revision affects only that period, or in the period of the revision and future periods if the revision affects both current and future periods.
Judgements made by management in the application of IFRS that have a significant effect on the financial statements and estimates with a significant risk of material adjustment in the next year are discussed in the notes to which they relate.
10.2 Going concernThe Group and Company’s forecasts and projections, taking account of reasonably possible changes in trading performance, show that the Group and Company should be able to operate within its current funding levels into the foreseeable future.
After making enquiries, the directors have a reasonable expectation that the Group and Company have adequate resources to continue in operational existence for the foreseeable future. The Group and Company therefore continue to adopt the going concern basis in preparing the financial statements.
10.3 Standards, amendments and interpretations not yet effectiveThe Group has evaluated the effect of all new standards, amendments and interpretations that have been issued butwhich are not yet effective. Based on the evaluation, management does not expect these standards, amendmentsand interpretations to have a significant impact on the Group’s results and disclosures. The expected implications ofapplicable standards, amendments and interpretations are dealt with below.
IFRS 9 – Financial InstrumentsIFRS 9, ‘Financial instruments’, addresses the classification, measurement and recognition of financial assets and financial liabilities. The complete version of IFRS 9 was issued in July 2014. It replaces the guidance in IAS 39 that relates to the classification and measurement of financial instruments. IFRS 9 retains but simplifies the mixed measurement model and establishes three primary measurement categories for financial assets: amortised cost, fair value through other comprehensive income and fair value through profit and loss. The basis of classification depends on the entity’s business model and the contractual cash flow characteristics of the financial asset. Investments in equity instruments are required to be measured at fair value through profit and loss with the irrevocable option at inception to present changes in fair value in other comprehensive income. There is now a new expected credit losses model that replaces the incurred loss impairment model used in IAS 39. For financial liabilities there were no changes to classification and measurement except for the recognition of changes in own credit risk in other comprehensive income, for liabilities designated at fair value through profit or loss. IFRS 9 relaxes the requirements for hedge effectiveness by replacing the bright line hedge effectiveness tests. It requires an economic relationship between the hedged item and hedging instrument and for the ‘hedged ratio’ to be the same as the one management actually use for risk management purposes.
/ 165
Notes to the Group annual financial statements continued
For the year ended 31 May 2017
BLUE LABEL INTEGRATED ANNUAL REPORT 2017
10. Accounting framework continued 10.3 Standards, amendments and interpretations not yet effective continued
Contemporaneous documentation is still required but is different to that currently prepared under IAS 39.
The standard is effective for accounting periods beginning on or after 1 January 2018. Early adoption is permitted.The Group is currently considering the impact on the consolidated financial statements. The impact on the financialstatements has not yet been fully determined but it is expected to result in a change in the measurement of revenueto adjust for the effects of the time value of money.
IFRS 16 – LeasesIFRS 16, ‘Leases’ states that lessees should be required to recognise assets and liabilities arising from all leases (withlimited exceptions) on the statement of financial position. Lessor accounting has not substantially changed in the newstandard.
The model reflects that, at the start of a lease, the lessee obtains the right to use an asset for a period of time andhas an obligation to pay for that right. In response to concerns expressed about the cost and complexity to apply therequirements to large volumes of small assets, the IASB decided not to require a lessee to recognise assets andliabilities for short-term leases (less than 12 months), and leases for which the underlying asset is of low value (suchas laptops and office furniture).
A lessee measures lease liabilities at the present value of future lease payments. A lessee measures lease assets,initially at the same amount as lease liabilities, and also includes costs directly related to entering into the lease. Leaseassets are amortised in a similar way to other assets such as property, plant and equipment. This approach will resultin a more faithful representation of a lessee’s assets and liabilities and, together with enhanced disclosures, willprovide greater transparency of a lessee’s financial leverage and capital employed.
IFRS 16 supersedes IAS 17, ‘Leases’, IFRIC 4, ‘Determining whether an Arrangement contains a Lease’, SIC 15, ‘Operating Leases – Incentives’ and SIC 27, ‘Evaluating the Substance of Transactions Involving the Legal Form of a Lease’.
The standard is effective for accounting periods beginning on or after 1 January 2019. Early adoption is permitted.The Group is currently considering the impact on the consolidated financial statements. The impact will be significantas the Group currently leases its premises. This will result in an increase in lease liabilities and right of use assets in thestatement of financial position with a corresponding reduction in operating lease expenses and an increase indepreciation and finance costs in the income statement.
Amendments to IFRS 2 – Share-based paymentsThis amendment clarifies the measurement basis for cash-settled, share-based payments and the accounting for modifications that change an award from cash-settled to equity-settled. It also introduces an exception to the principles in IFRS 2 that will require an award to be treated as if it was wholly equity-settled, where an employer is obliged to withhold an amount for the employee’s tax obligation associated with a share-based payment and pay that amount to the tax authority.
This standard is effective for accounting periods beginning on or after 1 January 2018. The Group is currently considering the impact on the consolidated financial statements.
Amendments to IFRS 10 – Consolidated financial statements and IAS 28 – Investments in associates and jointventures on sale or contribution of assetsThe IASB has issued this amendment to eliminate the inconsistency between IFRS 10 and IAS 28. If the non-monetaryassets sold or contributed to an associate or joint venture constitute a ‘business’, then the full gain or loss will berecognised by the investor. A partial gain or loss is recognised when a transaction involves assets that do notconstitute a business, even if these assets are housed in a subsidiary.
No effective date has been set. The Group is currently considering the impact on the consolidated financial statements.
/ 166
Notes to the Group annual financial statements continued
For the year ended 31 May 2017
BLUE LABEL INTEGRATED ANNUAL REPORT 2017
10. Accounting framework continued 10.3 Standards, amendments and interpretations not yet effective continued
Amendment to IAS 7 – Cash Flow StatementsIn January 2016, the IASB issued an amendment to IAS 7 introducing an additional disclosure that will enable usersof financial statements to evaluate changes in liabilities arising from financing activities.
The amendment responds to requests from investors for information that helps them better understand changes inan entity’s debt.
This statement is effective for periods beginning on or after 1 January 2017. The Group does not believe thestatement will have a significant impact as this amendment results only in additional disclosures; there is no financialimpact as a result of this amendment.
Amendment to IAS 12 – Income TaxesThe amendments were issued to clarify the requirements for recognising deferred tax assets on unrealised losses. The amendments clarify the accounting for deferred tax where an asset is measured at fair value and that fair value is below the asset’s tax base. They also clarify certain other aspects of accounting for deferred tax assets.
This statement is effective for periods beginning on or after 1 January 2017. The Group does not believe the statement will have a significant impact, given that this is a clarification to the existing standard; there is no change in the underlying principles for the recognition of deferred tax assets.
IFRS 15 – Revenue From Contracts With CustomersThis statement establishes principles for reporting useful information to users of the financial statements about thenature, amount, timing and uncertainty of revenue and cash flows arising from an entity’s contracts with customers.
This statement is effective for periods beginning on or after 1 January 2017. The Group is currently considering theimpact on the consolidated financial statements.
Amendments to IFRS 15 – Revenue From Contracts With CustomersThe IASB has amended IFRS 15 to clarify the guidance, but there were no major changes to the standard itself. The amendments comprise clarifications of the guidance on identifying performance obligations, accounting for licences of intellectual property and the principal versus agent assessment (gross versus net revenue presentation). New and amended illustrative examples have been added for each of these areas of guidance. The IASB has also included additional practical expedients related to transition to the new revenue standard.
This statement is effective for periods beginning on or after 1 January 2018. The Group is currently considering the impact on the consolidated financial statements.
IFRIC 22 – Foreign currency transactions and advance consideration This IFRIC addresses foreign currency transactions or parts of transactions where there is consideration that is denominated or priced in a foreign currency. The interpretation provides guidance for when a single payment/receipt is made as well as for situations where multiple payment/receipts are made. The guidance aims to reduce diversity in practice.
This interpretation is effective for periods beginning on or after 1 January 2018. The Group is currently considering the impact on the consolidated financial statements.
Annual improvements projectIn December 2016, the IASB issued annual improvements to IFRS 2014 – 2016 Cycle, which contains threeamendments to three standards, excluding consequential amendments. The amendments are effective for annual periods beginning on or after 1 January 2017 and 1 January 2018
/ 167
Notes to the Group annual financial statements continued
For the year ended 31 May 2017
BLUE LABEL INTEGRATED ANNUAL REPORT 2017
10. Accounting framework continued 10.3 Standards, amendments and interpretations not yet effective continued
IFRS 1 – First-time adoption of IFRSThis is an amendment regarding the deletion of short-term exemptions for first-time adopters regarding IFRS 7, IAS 19, and IFRS 10 effective 1 January 2018.
IFRS 12 – Disclosure of interests in other entitiesThis is an amendment regarding clarification of the scope of the standard. The amendment clarified that the disclosures requirement of IFRS 12 are applicable to interest in entities classified as held for sale except for summarised financial information. Previously, it was unclear whether all other IFRS 12 requirements were applicable for these interests. These amendments should be applied retrospectively for annual periods beginning on or after 1 January 2017.
IAS 28 – Investments in associates and joint venturesThis is an amendment regarding measuring an associate or joint venture at fair value. IAS 28 allows venture capital organisations, mutual funds, unit trusts and similar entities to elect measuring their investments in associates or joint ventures at fair value through profit or loss (FVTPL). The Board clarified that this election should be made separately for each associate or joint venture at initial recognition. Effective 1 January 2018.
Management is currently considering the effect of the changes.
/ 168
Notes to the Group annual financial statements continued
For the year ended 31 May 2017
BLUE LABEL INTEGRATED ANNUAL REPORT 2017
10. Accounting framework continued 10.4 Other accounting policies
Starter pack assetsA starter pack is a tool which enables the connection of a mobile device to a mobile network operator, also known asa subscriber identity module (SIM) card.
The starter pack asset represents starter packs which have been distributed but not yet activated. On activation of thestarter pack, the Group has a right to receive cash. Starter packs are stated at cost less provision for impairment andare determined by means of the weighted average cost basis.
Provision for impairments are made for starter packs distributed but not expected to be activated.
Foreign currencies(a) Functional and presentation currencyItems included in the financial statements of each of the Group’s entities are measured using the currency of theprimary economic environment in which the entity operates (the functional currency). The Group financial statementsare presented in South African rand (ZAR), which is the functional and presentation currency of the parent company.
(b) Transactions and balancesForeign currency transactions are translated into the functional currency using the exchange rates prevailing at the dates of the transactions. Foreign exchange gains and losses resulting from the settlement of such transactions and from the translation at year-end exchange rates of monetary assets and liabilities denominated in foreign currencies are recognised in the statement of comprehensive income.
(c) Group companiesThe results and financial position of all the Group entities (none of which has the currency of a hyperinflationaryeconomy) that have a functional currency different from the presentation currency are translated into the presentationcurrency as follows:•Assets and liabilities are translated at the closing rate as at statement of financial position date;• Income and expenses are translated at average exchange rates (unless this average is not a reasonable
approximation of the cumulative effect of the rates prevailing on the transaction dates, in which case income and expenses are translated at the dates of the transactions); and
•All resulting exchange differences are recognised as a separate component of equity.

/ 169
Notes to the Group annual financial statements continued
For the year ended 31 May 2017
BLUE LABEL INTEGRATED ANNUAL REPORT 2017
10. Accounting framework continued 10.4 Other accounting policies continued
On consolidation, exchange differences arising from the translation of the net investment in foreign entities, andof borrowings and other currency instruments designated as hedges of such investments, are taken to othercomprehensive income. When a foreign operation is partially disposed of or sold, such exchange differences arerecognised in the income statement as part of the gain or loss on sale.
Goodwill and fair value adjustments arising on the acquisition of a foreign entity are treated as the foreign entity’sassets and liabilities and are translated at the closing rate.
Dividend taxDividend tax is provided for at 20% of the amount of any dividend paid, subject to certain exemptions. The dividendtax is a tax borne by the beneficial owner of the dividend and will be withheld by either the issuer of the dividend orby regulated intermediaries.
Dividend distributionDividend distribution to the Company’s shareholders is recognised as a liability in the Group and Company’s financialstatements in the period in which they are approved by the shareholders.
Distributions of non-cash assets received from subsidiary companies are recognised as a dividend at the fair value ofthe non-cash assets received.
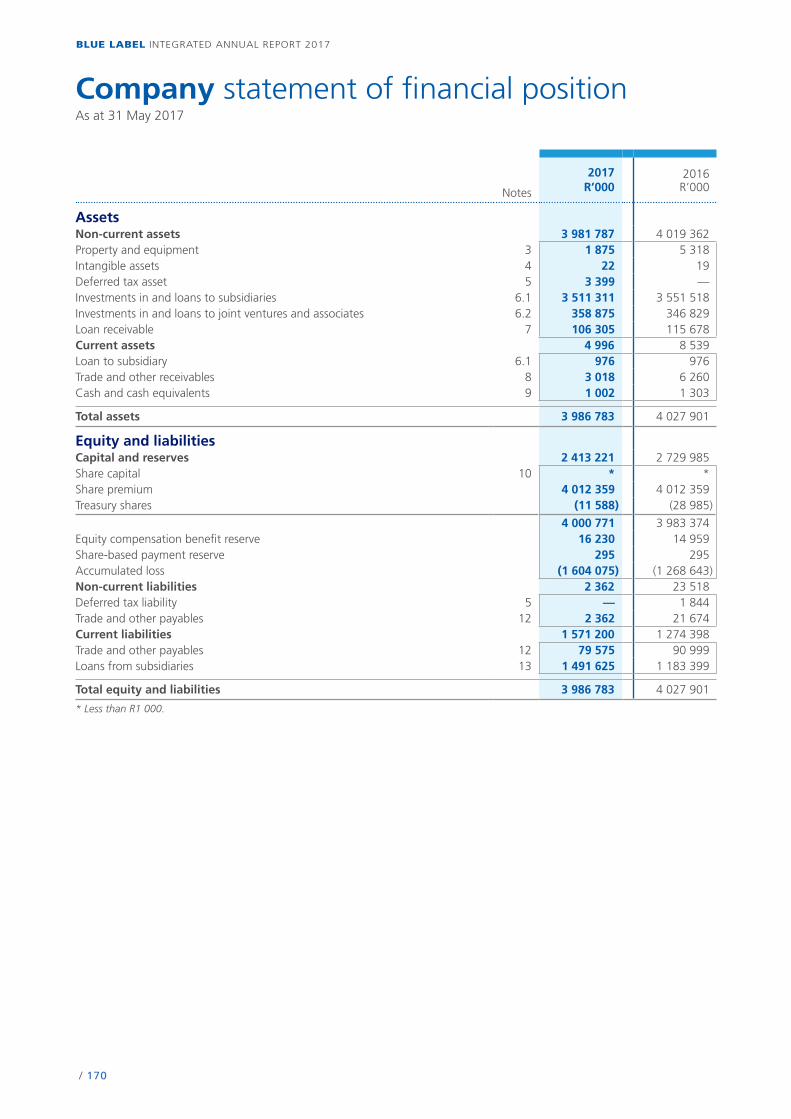
/ 170
BLUE LABEL INTEGRATED ANNUAL REPORT 2017
Company statement of financial positionAs at 31 May 2017
Notes
2017R’000
2016R’000
AssetsNon-current assets 3 981 787 4 019 362Property and equipment 3 1 875 5 318Intangible assets 4 22 19Deferred tax asset 5 3 399 —Investments in and loans to subsidiaries 6.1 3 511 311 3 551 518Investments in and loans to joint ventures and associates 6.2 358 875 346 829Loan receivable 7 106 305 115 678Current assets 4 996 8 539Loan to subsidiary 6.1 976 976Trade and other receivables 8 3 018 6 260Cash and cash equivalents 9 1 002 1 303
Total assets 3 986 783 4 027 901
Equity and liabilitiesCapital and reserves 2 413 221 2 729 985Share capital 10 * *Share premium 4 012 359 4 012 359Treasury shares (11 588) (28 985)
4 000 771 3 983 374Equity compensation benefit reserve 16 230 14 959Share-based payment reserve 295 295Accumulated loss (1 604 075) (1 268 643)Non-current liabilities 2 362 23 518Deferred tax liability 5 — 1 844Trade and other payables 12 2 362 21 674Current liabilities 1 571 200 1 274 398Trade and other payables 12 79 575 90 999Loans from subsidiaries 13 1 491 625 1 183 399
Total equity and liabilities 3 986 783 4 027 901
* Less than R1 000.
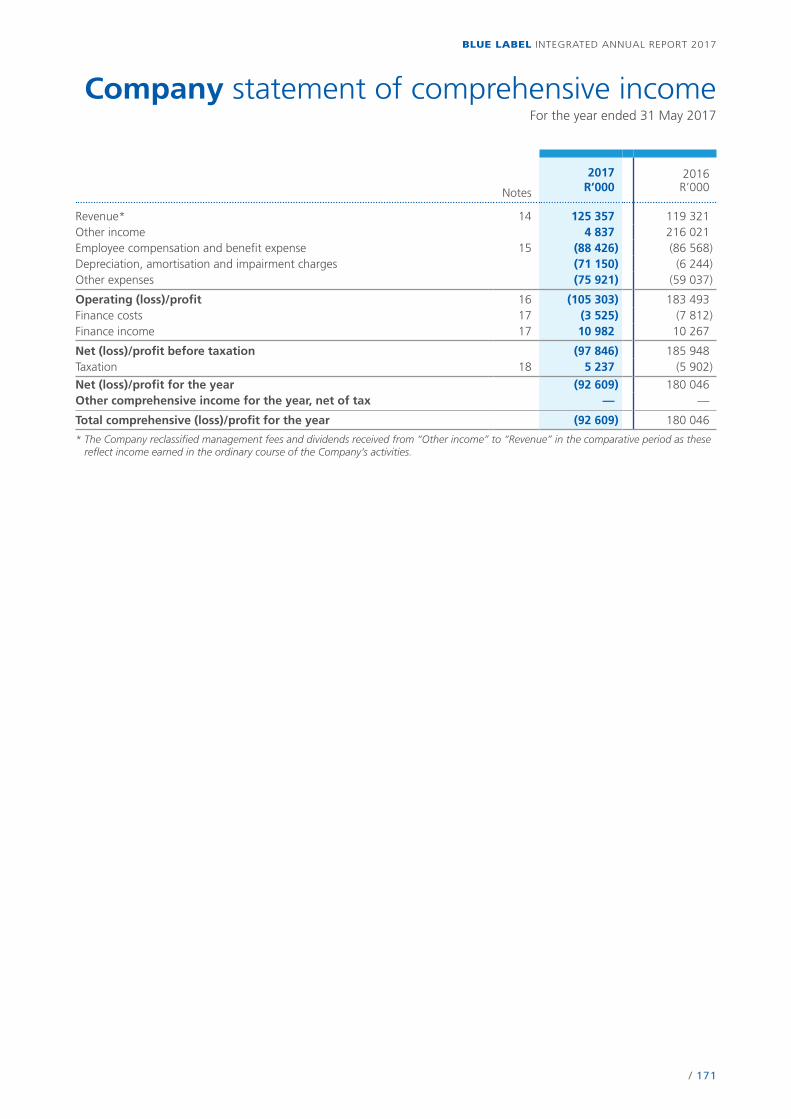
/ 171
BLUE LABEL INTEGRATED ANNUAL REPORT 2017
Company statement of comprehensive incomeFor the year ended 31 May 2017
Notes
2017R’000
2016R’000
Revenue* 14 125 357 119 321 Other income 4 837 216 021Employee compensation and benefit expense 15 (88 426) (86 568)Depreciation, amortisation and impairment charges (71 150) (6 244)Other expenses (75 921) (59 037)
Operating (loss)/profit 16 (105 303) 183 493Finance costs 17 (3 525) (7 812)Finance income 17 10 982 10 267
Net (loss)/profit before taxation (97 846) 185 948Taxation 18 5 237 (5 902)
Net (loss)/profit for the year (92 609) 180 046Other comprehensive income for the year, net of tax — —
Total comprehensive (loss)/profit for the year (92 609) 180 046
* The Company reclassified management fees and dividends received from “Other income” to “Revenue” in the comparative period as these reflect income earned in the ordinary course of the Company’s activities.

/ 172
BLUE LABEL INTEGRATED ANNUAL REPORT 2017
Company statement of changes of equityFor the year ended 31 May 2017
Share capital R’000
Share premium
R’000
Treasury shares R’000
Equity compensation
benefit reserve1
R’000
Share-based payment
reserve R’000
Accumulated loss
R’000
Total equity R’000
Balance as at 31 May 2015 * 4 012 359 (30 295) 15 366 295 (1 239 591) 2 758 134
Net profit for the year — — — — — 180 046 180 046 Other comprehensive income — — — — — — — Total comprehensive profit — — — — — 180 046 180 046 Shares purchased during the year — — (23 052) — — — (23 052)Shares awarded to Group companies as part of equity — — compensation scheme — — 16 989 — — — 16 989 Shares forfeited by Group companies as part of equity — — compensation scheme — — (1 275) — — — (1 275)Equity compensation scheme shares vested — — 8 648 (8 648) — — —
Equity compensation movements — — — 8 241 — — 8 241 Dividends declared — — — — — (209 098) (209 098)
Balance as at 31 May 2016 * 4 012 359 (28 985) 14 959 295 (1 268 643) 2 729 985
Net loss for the year — — — — — (92 609) (92 609)Other comprehensive income — — — — — — — Total comprehensive loss — — — — — (92 609) (92 609)Shares purchased during the year — — (7 381) — — — (7 381)Shares awarded to Group companies as part of equity compensation scheme — — 17 960 — — — 17 960 Shares forfeited by Group companies as part of equity compensation scheme — — (1 153) — — — (1 153)Equity compensation scheme shares vested — — 7 971 (7 971) — — — Equity compensation movements — — — 9 242 — — 9 242
Dividends declared — — — — — (242 823) (242 823)
Balance as at 31 May 2017 * 4 012 359 (11 588) 16 230 295 (1 604 075) 2 413 221
* Less than R1 000.1 This relates to the Company’s movement in equity compensation benefit (refer to note 11).
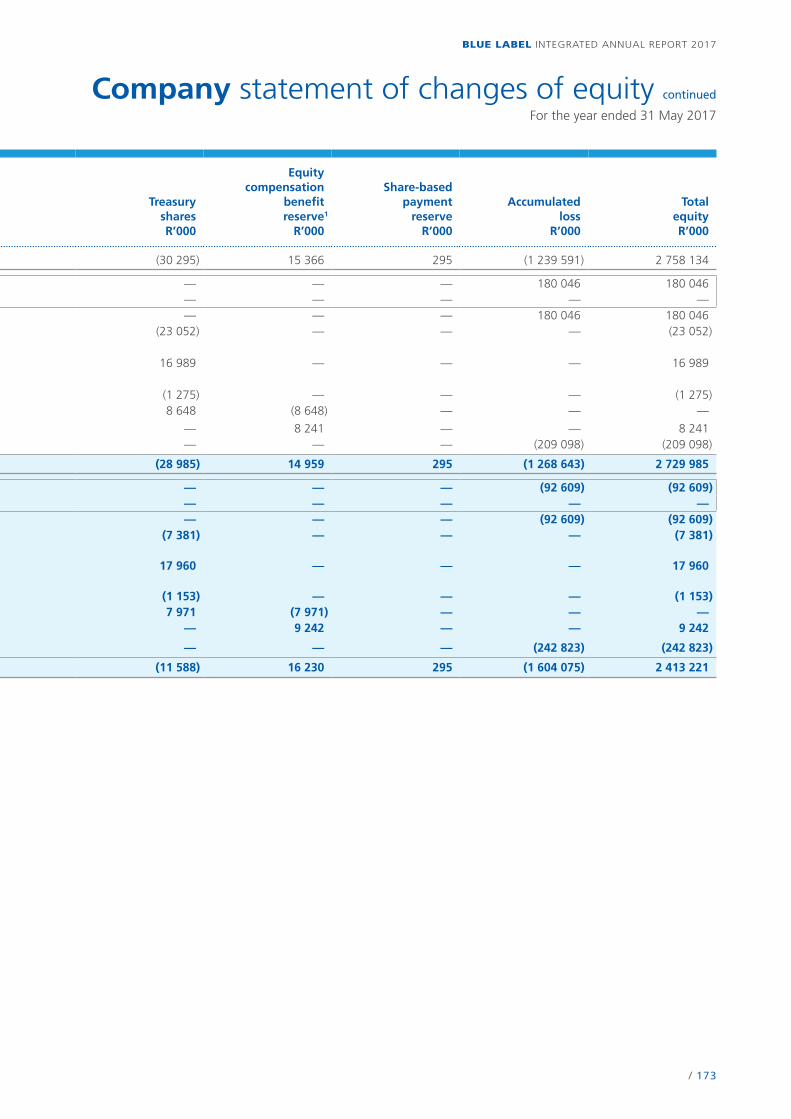
/ 173
BLUE LABEL INTEGRATED ANNUAL REPORT 2017
Company statement of changes of equity continued
For the year ended 31 May 2017
Share capital R’000
Share premium
R’000
Treasury shares R’000
Equity compensation
benefit reserve1
R’000
Share-based payment
reserve R’000
Accumulated loss
R’000
Total equity R’000
Balance as at 31 May 2015 * 4 012 359 (30 295) 15 366 295 (1 239 591) 2 758 134
Net profit for the year — — — — — 180 046 180 046 Other comprehensive income — — — — — — — Total comprehensive profit — — — — — 180 046 180 046 Shares purchased during the year — — (23 052) — — — (23 052)Shares awarded to Group companies as part of equity — — compensation scheme — — 16 989 — — — 16 989 Shares forfeited by Group companies as part of equity — — compensation scheme — — (1 275) — — — (1 275)Equity compensation scheme shares vested — — 8 648 (8 648) — — —
Equity compensation movements — — — 8 241 — — 8 241 Dividends declared — — — — — (209 098) (209 098)
Balance as at 31 May 2016 * 4 012 359 (28 985) 14 959 295 (1 268 643) 2 729 985
Net loss for the year — — — — — (92 609) (92 609)Other comprehensive income — — — — — — — Total comprehensive loss — — — — — (92 609) (92 609)Shares purchased during the year — — (7 381) — — — (7 381)Shares awarded to Group companies as part of equity compensation scheme — — 17 960 — — — 17 960 Shares forfeited by Group companies as part of equity compensation scheme — — (1 153) — — — (1 153)Equity compensation scheme shares vested — — 7 971 (7 971) — — — Equity compensation movements — — — 9 242 — — 9 242
Dividends declared — — — — — (242 823) (242 823)
Balance as at 31 May 2017 * 4 012 359 (11 588) 16 230 295 (1 604 075) 2 413 221
* Less than R1 000.1 This relates to the Company’s movement in equity compensation benefit (refer to note 11).
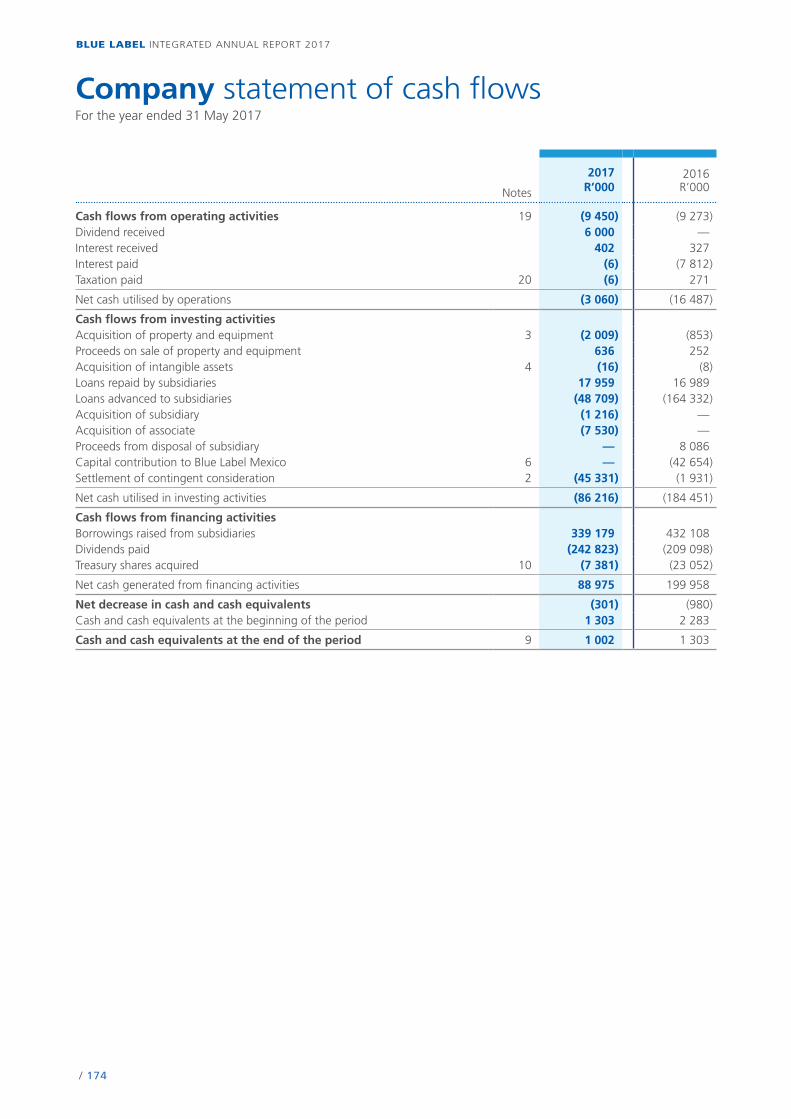
/ 174
BLUE LABEL INTEGRATED ANNUAL REPORT 2017
Company statement of cash flowsFor the year ended 31 May 2017
Notes
2017R’000
2016R’000
Cash flows from operating activities 19 (9 450) (9 273)Dividend received 6 000 —Interest received 402 327Interest paid (6) (7 812)Taxation paid 20 (6) 271
Net cash utilised by operations (3 060) (16 487)
Cash flows from investing activitiesAcquisition of property and equipment 3 (2 009) (853)Proceeds on sale of property and equipment 636 252Acquisition of intangible assets 4 (16) (8)Loans repaid by subsidiaries 17 959 16 989Loans advanced to subsidiaries (48 709) (164 332)Acquisition of subsidiary (1 216) —Acquisition of associate (7 530) —Proceeds from disposal of subsidiary — 8 086Capital contribution to Blue Label Mexico 6 — (42 654)Settlement of contingent consideration 2 (45 331) (1 931)
Net cash utilised in investing activities (86 216) (184 451)
Cash flows from financing activitiesBorrowings raised from subsidiaries 339 179 432 108Dividends paid (242 823) (209 098)Treasury shares acquired 10 (7 381) (23 052)
Net cash generated from financing activities 88 975 199 958
Net decrease in cash and cash equivalents (301) (980)Cash and cash equivalents at the beginning of the period 1 303 2 283
Cash and cash equivalents at the end of the period 9 1 002 1 303
/ 175
BLUE LABEL INTEGRATED ANNUAL REPORT 2017
1. Accounting policies and critical accounting estimates and assumptionsThe accounting policies and critical accounting estimates and assumptions applied to the Company annual financial statements are consistent with the Group accounting policies. Where different, this is stated in the relevant note.
2. Financial risksIn the course of its business, the Company is exposed to a number of financial risks: credit risk, liquidity risk and market risk (including foreign currency and other price risk). This note presents the Company’s objectives, policies and processes for managing its financial risk and capital.
Credit riskCredit risk arises because a counterparty may fail to meet its obligations to the Company. The Company is exposed to credit risks on financial instruments such as receivables, loans receivable and cash.
Trade and other receivablesTrade and other receivables consist primarily of invoiced amounts owing from related parties. The recoverability of these amounts are regularly monitored with reference to the counterparties’ financial performance. Where necessary, a provision for impairment is made.
Cash and cash equivalentsThe Company places cash and cash equivalents with major banking groups and quality institutions that have high credit ratings.
Loans receivableLoans are only granted to holders with an appropriate credit history, taking into account the holder’s financial position and past experience.
The Company’s maximum credit risk exposure is the carrying amount of all financial assets on the statement of financial position and sureties provided with the maximum amount the Company could have to pay if the sureties are called on amounting to R1.5 billion (2016: R1.5 billion).
Notes to the Company annual financial statementsFor the year ended 31 May 2017
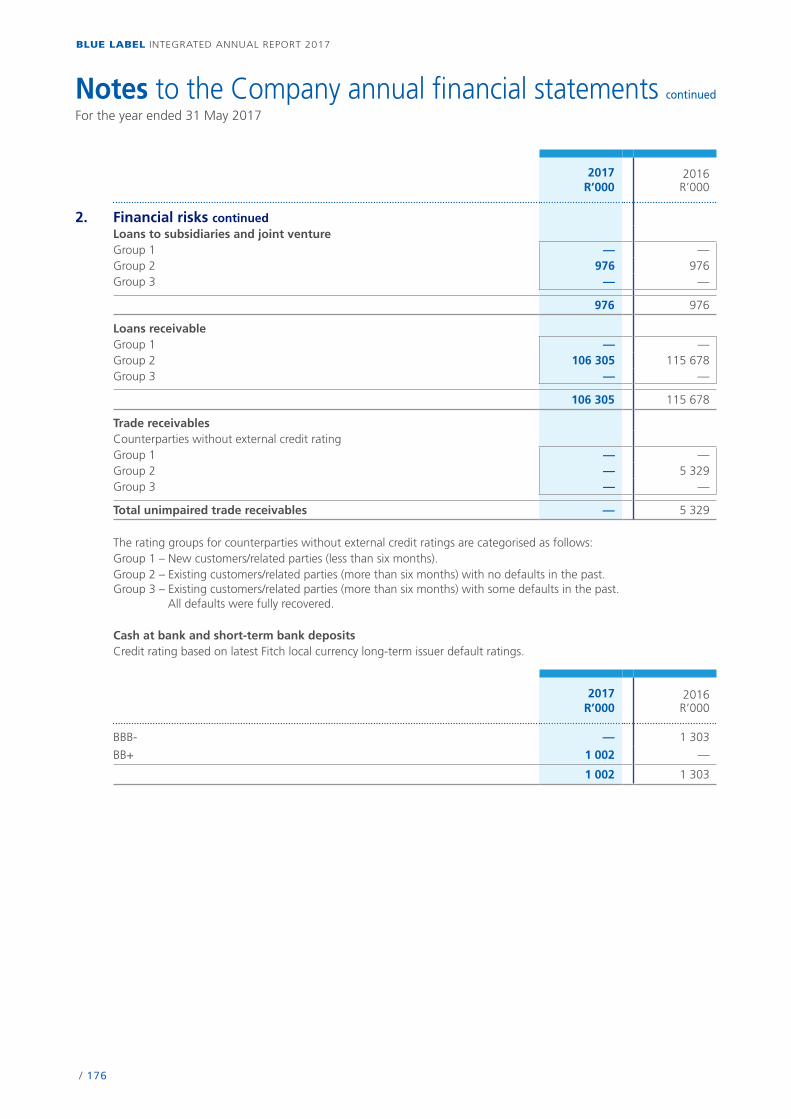
/ 176
BLUE LABEL INTEGRATED ANNUAL REPORT 2017
Notes to the Company annual financial statements continued
For the year ended 31 May 2017
2017R’000
2016R’000
2. Financial risks continuedLoans to subsidiaries and joint ventureGroup 1 — —Group 2 976 976Group 3 — —
976 976
Loans receivableGroup 1 — —Group 2 106 305 115 678Group 3 — —
106 305 115 678
Trade receivablesCounterparties without external credit ratingGroup 1 — —Group 2 — 5 329Group 3 — —
Total unimpaired trade receivables — 5 329
The rating groups for counterparties without external credit ratings are categorised as follows:Group 1 – New customers/related parties (less than six months).Group 2 – Existing customers/related parties (more than six months) with no defaults in the past. Group 3 – Existing customers/related parties (more than six months) with some defaults in the past.
All defaults were fully recovered.
Cash at bank and short-term bank depositsCredit rating based on latest Fitch local currency long-term issuer default ratings.
2017R’000
2016R’000
BBB- — 1 303
BB+ 1 002 —
1 002 1 303
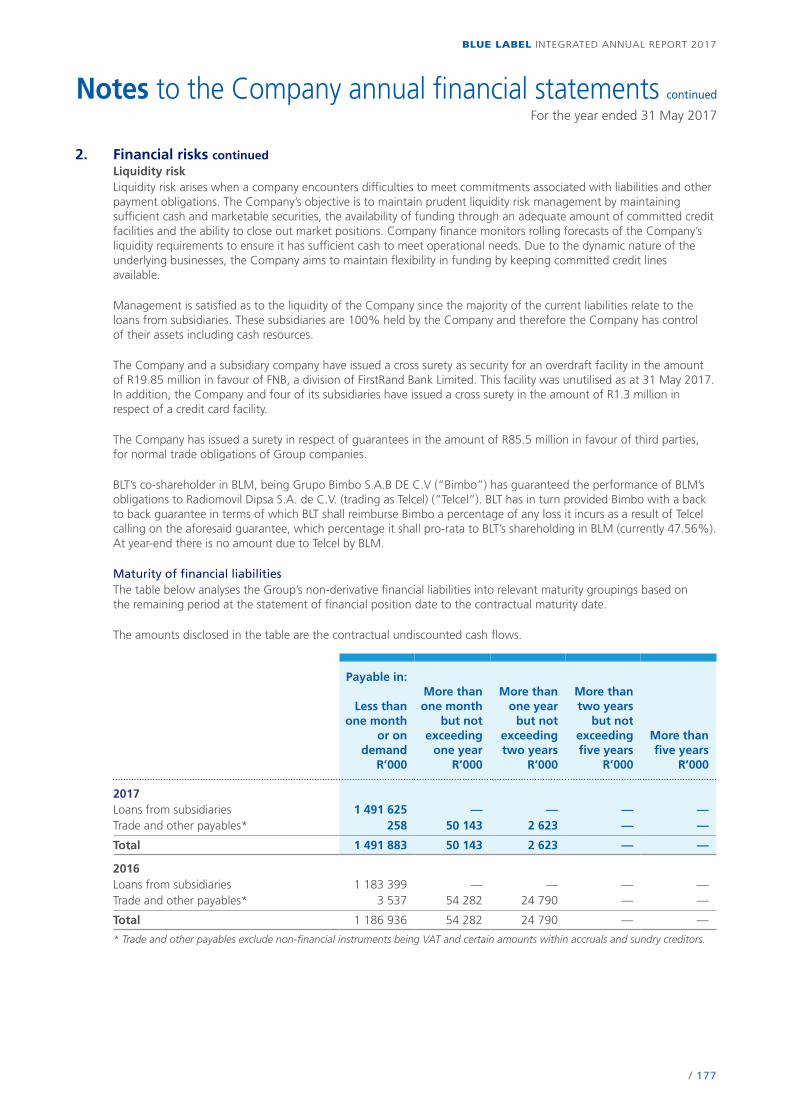
/ 177
BLUE LABEL INTEGRATED ANNUAL REPORT 2017
Notes to the Company annual financial statements continued
For the year ended 31 May 2017
2. Financial risks continuedLiquidity riskLiquidity risk arises when a company encounters difficulties to meet commitments associated with liabilities and other payment obligations. The Company’s objective is to maintain prudent liquidity risk management by maintaining sufficient cash and marketable securities, the availability of funding through an adequate amount of committed credit facilities and the ability to close out market positions. Company finance monitors rolling forecasts of the Company’s liquidity requirements to ensure it has sufficient cash to meet operational needs. Due to the dynamic nature of the underlying businesses, the Company aims to maintain flexibility in funding by keeping committed credit lines available.
Management is satisfied as to the liquidity of the Company since the majority of the current liabilities relate to the loans from subsidiaries. These subsidiaries are 100% held by the Company and therefore the Company has control of their assets including cash resources.
The Company and a subsidiary company have issued a cross surety as security for an overdraft facility in the amount of R19.85 million in favour of FNB, a division of FirstRand Bank Limited. This facility was unutilised as at 31 May 2017. In addition, the Company and four of its subsidiaries have issued a cross surety in the amount of R1.3 million in respect of a credit card facility.
The Company has issued a surety in respect of guarantees in the amount of R85.5 million in favour of third parties, for normal trade obligations of Group companies.
BLT’s co-shareholder in BLM, being Grupo Bimbo S.A.B DE C.V (“Bimbo”) has guaranteed the performance of BLM’s obligations to Radiomovil Dipsa S.A. de C.V. (trading as Telcel) (“Telcel”). BLT has in turn provided Bimbo with a back to back guarantee in terms of which BLT shall reimburse Bimbo a percentage of any loss it incurs as a result of Telcel calling on the aforesaid guarantee, which percentage it shall pro-rata to BLT’s shareholding in BLM (currently 47.56%). At year-end there is no amount due to Telcel by BLM.
Maturity of financial liabilitiesThe table below analyses the Group’s non-derivative financial liabilities into relevant maturity groupings based on the remaining period at the statement of financial position date to the contractual maturity date.
The amounts disclosed in the table are the contractual undiscounted cash flows.
Payable in:
Less thanone month
or ondemand
R’000
More thanone month
but notexceeding
one yearR’000
More thanone year
but notexceedingtwo years
R’000
More thantwo years
but notexceedingfive years
R’000
More than five years
R’000
2017Loans from subsidiaries 1 491 625 — — — —Trade and other payables* 258 50 143 2 623 — —
Total 1 491 883 50 143 2 623 — —
2016Loans from subsidiaries 1 183 399 — — — —Trade and other payables* 3 537 54 282 24 790 — —
Total 1 186 936 54 282 24 790 — —
* Trade and other payables exclude non-financial instruments being VAT and certain amounts within accruals and sundry creditors.
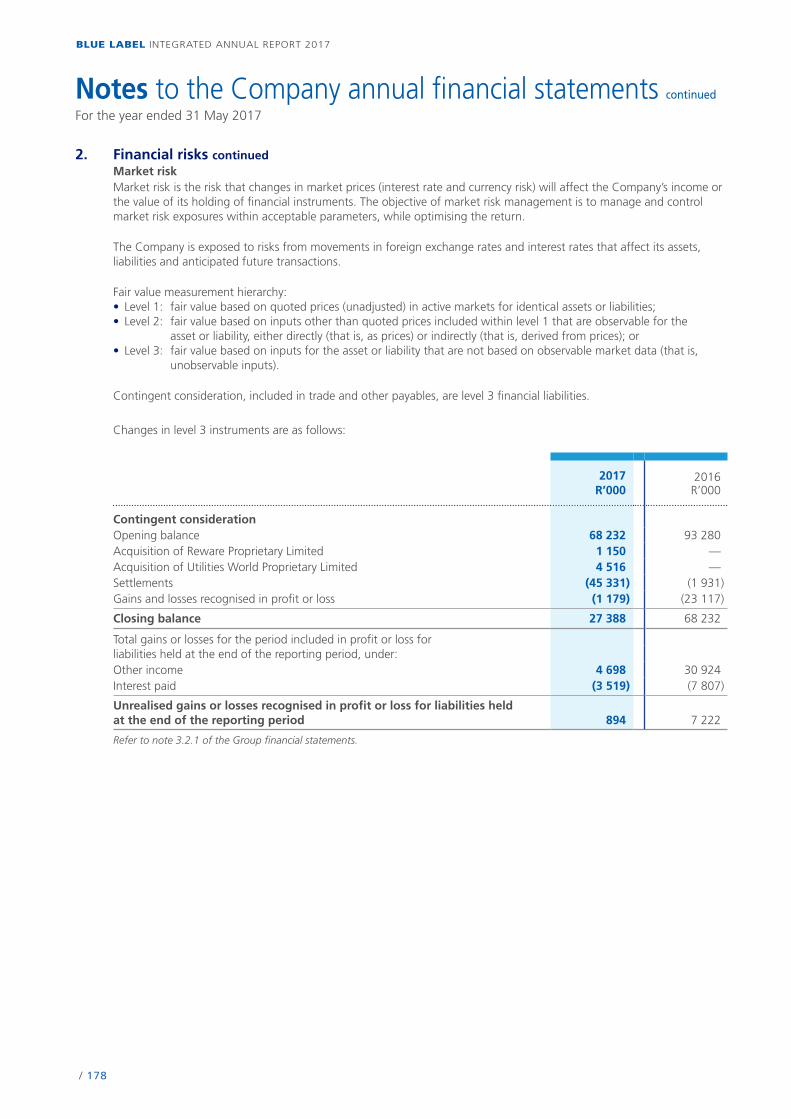
/ 178
BLUE LABEL INTEGRATED ANNUAL REPORT 2017
2. Financial risks continuedMarket riskMarket risk is the risk that changes in market prices (interest rate and currency risk) will affect the Company’s income or the value of its holding of financial instruments. The objective of market risk management is to manage and control market risk exposures within acceptable parameters, while optimising the return.
The Company is exposed to risks from movements in foreign exchange rates and interest rates that affect its assets, liabilities and anticipated future transactions.
Fair value measurement hierarchy:• Level 1: fair value based on quoted prices (unadjusted) in active markets for identical assets or liabilities;• Level 2: fair value based on inputs other than quoted prices included within level 1 that are observable for the
asset or liability, either directly (that is, as prices) or indirectly (that is, derived from prices); or• Level 3: fair value based on inputs for the asset or liability that are not based on observable market data (that is,
unobservable inputs).
Contingent consideration, included in trade and other payables, are level 3 financial liabilities.
Changes in level 3 instruments are as follows:
2017R’000
2016R’000
Contingent considerationOpening balance 68 232 93 280Acquisition of Reware Proprietary Limited 1 150 — Acquisition of Utilities World Proprietary Limited 4 516 — Settlements (45 331) (1 931) Gains and losses recognised in profit or loss (1 179) (23 117)
Closing balance 27 388 68 232
Total gains or losses for the period included in profit or loss forliabilities held at the end of the reporting period, under:Other income 4 698 30 924 Interest paid (3 519) (7 807)
Unrealised gains or losses recognised in profit or loss for liabilities held at the end of the reporting period 894 7 222
Refer to note 3.2.1 of the Group financial statements.
Notes to the Company annual financial statements continued
For the year ended 31 May 2017
/ 179
BLUE LABEL INTEGRATED ANNUAL REPORT 2017
2. Financial risks continuedCash flow and fair value interest rate riskThe Company’s cash flow interest rate risk arises from loans receivable and cash and cash equivalents. The Company is not exposed to fair value interest rate risk as the Company does not have any fixed interest-bearing instruments carried at fair value nor any interest-bearing borrowings.
As part of the process of managing the Company’s exposure to interest rate risk, interest rate characteristics of new borrowings and the refinancing of existing borrowings are positioned according to expected movements in interest rates.
Foreign currency riskThe Company is exposed to foreign currency risk from transactions. Transaction exposure arises due to the Company granting loans to affiliated companies in foreign currencies.
The Company manages its exposure to foreign currency risk by ensuring that the net foreign currency exposure remains within acceptable levels. Hedging instruments are used in certain instances to reduce risks arising from foreign currency fluctuations. The Company did not enter into any forward exchange contracts during the period under review.
IFRS 7 – Sensitivity AnalysisThe Company has used a sensitivity analysis technique that measures the estimated change to the statement of comprehensive income of either an instantaneous increase or decrease of 1% (100 basis points) in market interest rates or a 10% strengthening or weakening of the rand against all other currencies, from the rates applicable at 31 May 2017, for each class of financial instrument with all other variables remaining constant. This analysis is for illustrative purposes only, as in practice market rates rarely change in isolation.
Interest rate sensitivityThe interest rate sensitivity analysis is based on the following assumptions:•Changes in market interest rates affect the interest income or expense of variable interest financial instruments; and•Changes in market interest rates only affect interest income or expense in relation to financial instruments with
fixed interest rates if these are recognised at fair value.
Under these assumptions, a 1% increase or decrease in market interest rates at 31 May 2017 would increase or decrease profit before tax by R10 020 (2016: R13 030).
Notes to the Company annual financial statements continued
For the year ended 31 May 2017
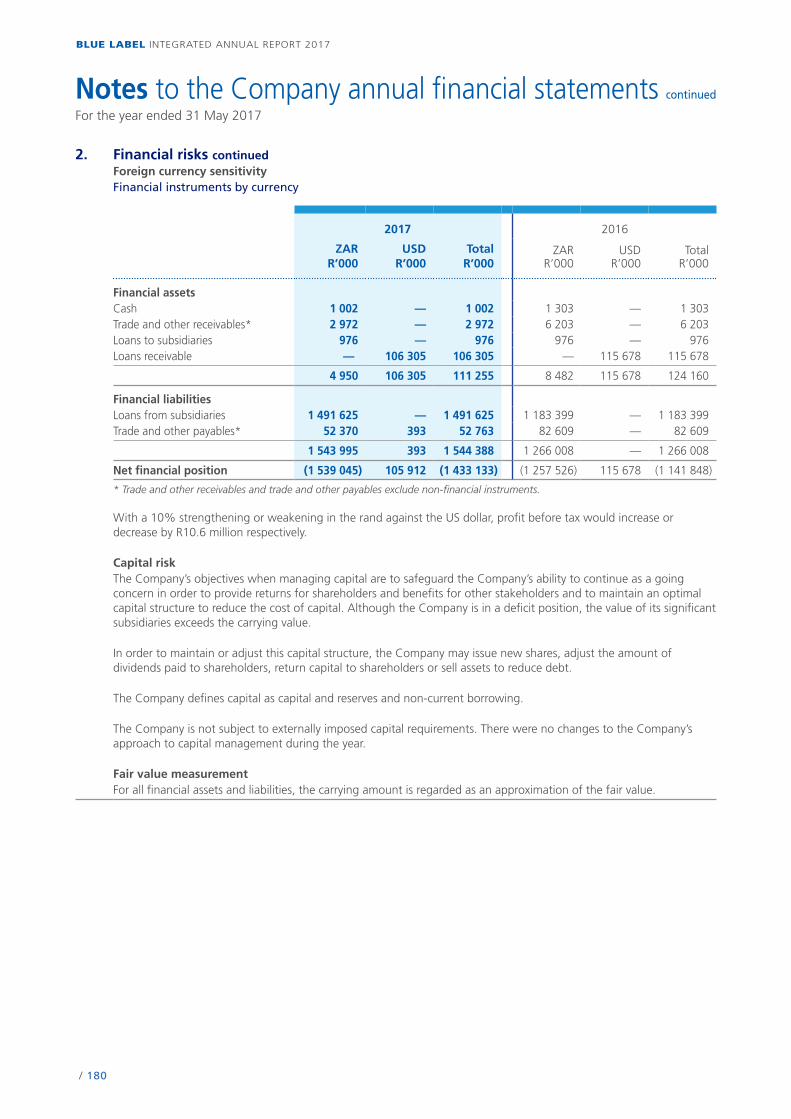
/ 180
BLUE LABEL INTEGRATED ANNUAL REPORT 2017
2. Financial risks continuedForeign currency sensitivityFinancial instruments by currency
2017 2016
ZARR’000
USDR’000
TotalR’000
ZARR’000
USDR’000
TotalR’000
Financial assetsCash 1 002 — 1 002 1 303 — 1 303Trade and other receivables* 2 972 — 2 972 6 203 — 6 203Loans to subsidiaries 976 — 976 976 — 976Loans receivable — 106 305 106 305 — 115 678 115 678
4 950 106 305 111 255 8 482 115 678 124 160
Financial liabilitiesLoans from subsidiaries 1 491 625 — 1 491 625 1 183 399 — 1 183 399Trade and other payables* 52 370 393 52 763 82 609 — 82 609
1 543 995 393 1 544 388 1 266 008 — 1 266 008
Net financial position (1 539 045) 105 912 (1 433 133) (1 257 526) 115 678 (1 141 848)
* Trade and other receivables and trade and other payables exclude non-financial instruments.
With a 10% strengthening or weakening in the rand against the US dollar, profit before tax would increase or decrease by R10.6 million respectively.
Capital riskThe Company’s objectives when managing capital are to safeguard the Company’s ability to continue as a going concern in order to provide returns for shareholders and benefits for other stakeholders and to maintain an optimal capital structure to reduce the cost of capital. Although the Company is in a deficit position, the value of its significant subsidiaries exceeds the carrying value.
In order to maintain or adjust this capital structure, the Company may issue new shares, adjust the amount of dividends paid to shareholders, return capital to shareholders or sell assets to reduce debt.
The Company defines capital as capital and reserves and non-current borrowing.
The Company is not subject to externally imposed capital requirements. There were no changes to the Company’s approach to capital management during the year.
Fair value measurementFor all financial assets and liabilities, the carrying amount is regarded as an approximation of the fair value.
Notes to the Company annual financial statements continued
For the year ended 31 May 2017
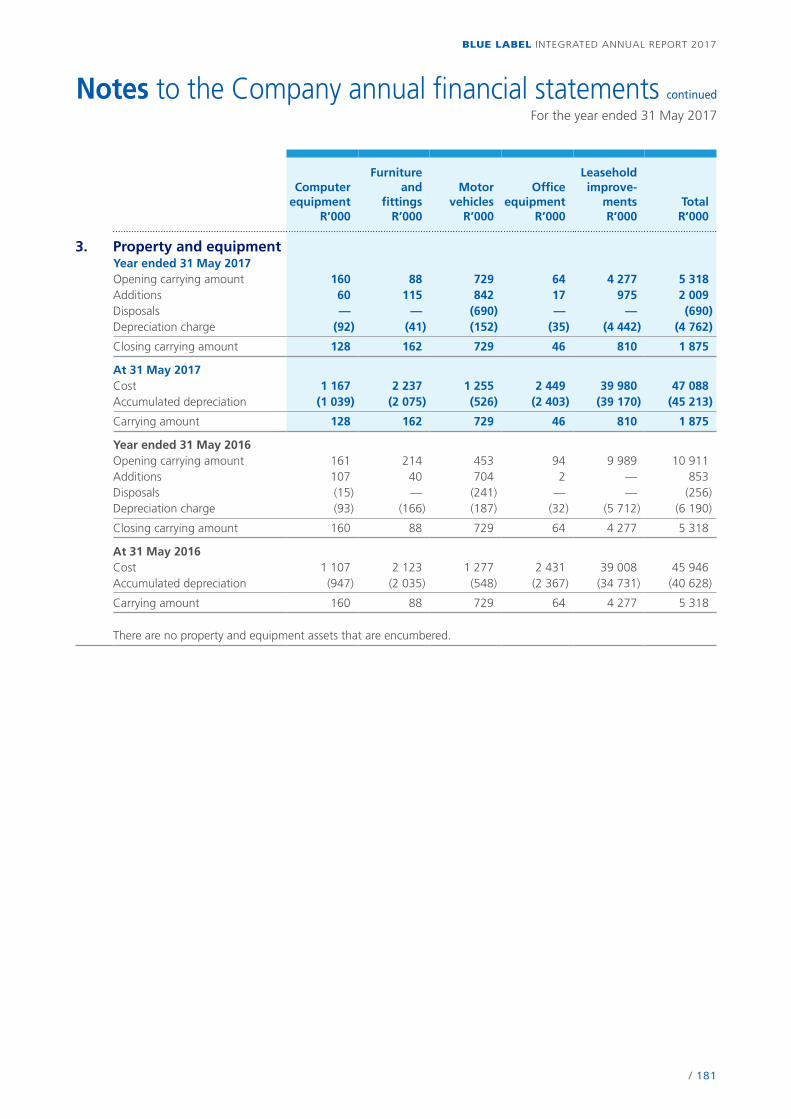
/ 181
BLUE LABEL INTEGRATED ANNUAL REPORT 2017
Computerequipment
R’000
Furnitureand
fittingsR’000
Motorvehicles
R’000
Officeequipment
R’000
Leaseholdimprove-
mentsR’000
TotalR’000
3. Property and equipmentYear ended 31 May 2017Opening carrying amount 160 88 729 64 4 277 5 318 Additions 60 115 842 17 975 2 009 Disposals — — (690) — — (690)Depreciation charge (92) (41) (152) (35) (4 442) (4 762)
Closing carrying amount 128 162 729 46 810 1 875
At 31 May 2017Cost 1 167 2 237 1 255 2 449 39 980 47 088 Accumulated depreciation (1 039) (2 075) (526) (2 403) (39 170) (45 213)
Carrying amount 128 162 729 46 810 1 875
Year ended 31 May 2016Opening carrying amount 161 214 453 94 9 989 10 911Additions 107 40 704 2 — 853Disposals (15) — (241) — — (256)Depreciation charge (93) (166) (187) (32) (5 712) (6 190)
Closing carrying amount 160 88 729 64 4 277 5 318
At 31 May 2016Cost 1 107 2 123 1 277 2 431 39 008 45 946Accumulated depreciation (947) (2 035) (548) (2 367) (34 731) (40 628)
Carrying amount 160 88 729 64 4 277 5 318
There are no property and equipment assets that are encumbered.
Notes to the Company annual financial statements continued
For the year ended 31 May 2017
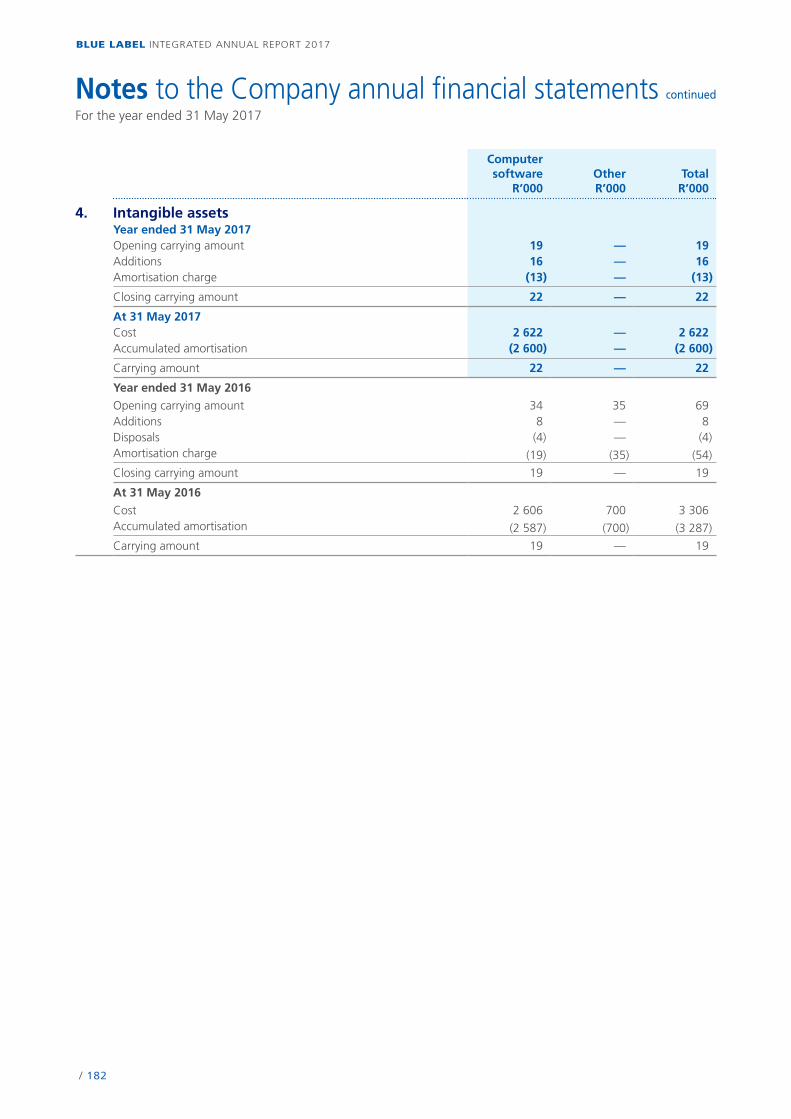
/ 182
BLUE LABEL INTEGRATED ANNUAL REPORT 2017
Computersoftware
R’000OtherR’000
TotalR’000
4. Intangible assetsYear ended 31 May 2017Opening carrying amount 19 — 19Additions 16 — 16Amortisation charge (13) — (13)
Closing carrying amount 22 — 22
At 31 May 2017Cost 2 622 — 2 622Accumulated amortisation (2 600) — (2 600)
Carrying amount 22 — 22
Year ended 31 May 2016
Opening carrying amount 34 35 69Additions 8 — 8Disposals (4) — (4)Amortisation charge (19) (35) (54)
Closing carrying amount 19 — 19
At 31 May 2016
Cost 2 606 700 3 306Accumulated amortisation (2 587) (700) (3 287)
Carrying amount 19 — 19
Notes to the Company annual financial statements continued
For the year ended 31 May 2017
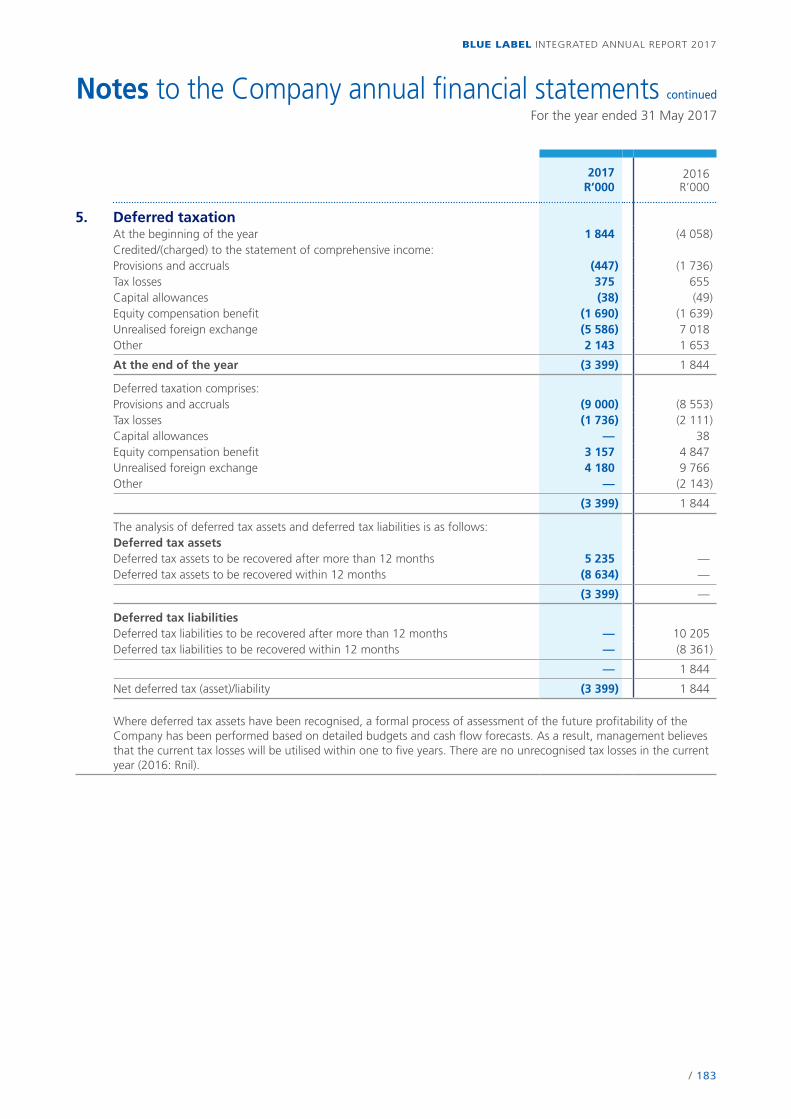
/ 183
BLUE LABEL INTEGRATED ANNUAL REPORT 2017
2017R’000
2016R’000
5. Deferred taxationAt the beginning of the year 1 844 (4 058)Credited/(charged) to the statement of comprehensive income:Provisions and accruals (447) (1 736)Tax losses 375 655Capital allowances (38) (49)Equity compensation benefit (1 690) (1 639)Unrealised foreign exchange (5 586) 7 018Other 2 143 1 653
At the end of the year (3 399) 1 844
Deferred taxation comprises:Provisions and accruals (9 000) (8 553)Tax losses (1 736) (2 111)Capital allowances — 38Equity compensation benefit 3 157 4 847Unrealised foreign exchange 4 180 9 766Other — (2 143)
(3 399) 1 844
The analysis of deferred tax assets and deferred tax liabilities is as follows:Deferred tax assetsDeferred tax assets to be recovered after more than 12 months 5 235 —Deferred tax assets to be recovered within 12 months (8 634) —
(3 399) —
Deferred tax liabilitiesDeferred tax liabilities to be recovered after more than 12 months — 10 205Deferred tax liabilities to be recovered within 12 months — (8 361)
— 1 844
Net deferred tax (asset)/liability (3 399) 1 844
Where deferred tax assets have been recognised, a formal process of assessment of the future profitability of the Company has been performed based on detailed budgets and cash flow forecasts. As a result, management believes that the current tax losses will be utilised within one to five years. There are no unrecognised tax losses in the current year (2016: Rnil).
Notes to the Company annual financial statements continued
For the year ended 31 May 2017
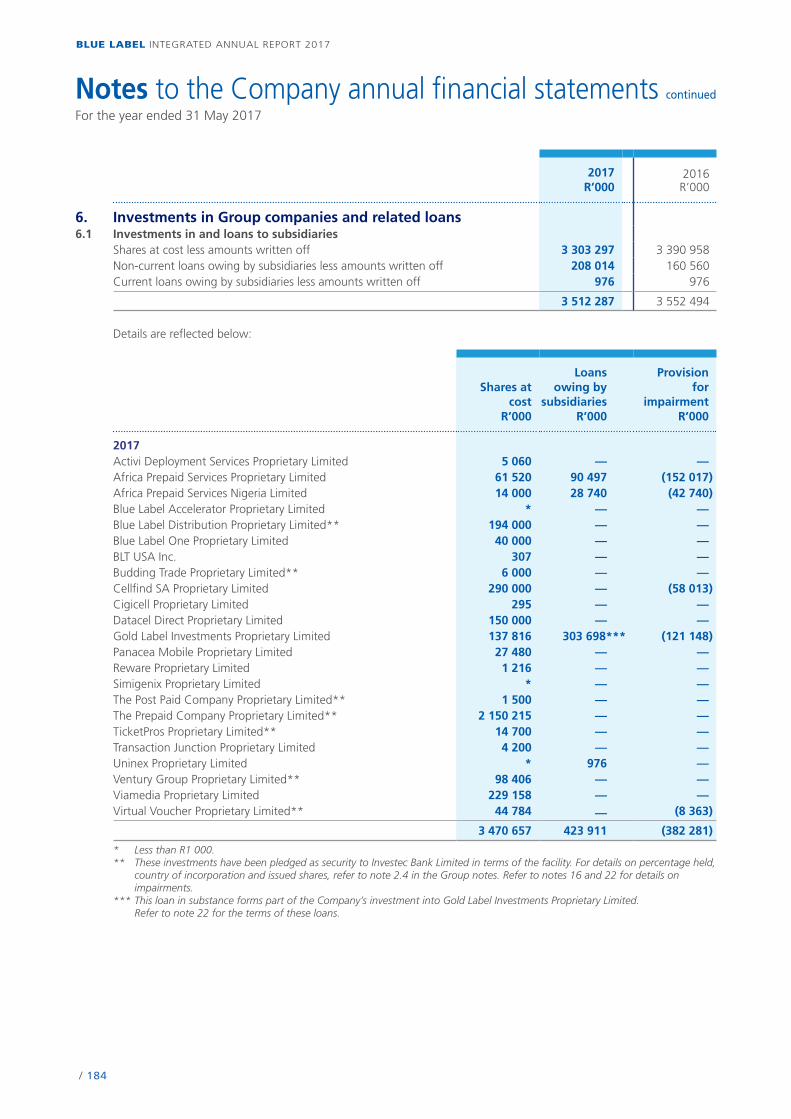
/ 184
BLUE LABEL INTEGRATED ANNUAL REPORT 2017
2017R’000
2016R’000
6. Investments in Group companies and related loans6.1 Investments in and loans to subsidiaries
Shares at cost less amounts written off 3 303 297 3 390 958Non-current loans owing by subsidiaries less amounts written off 208 014 160 560Current loans owing by subsidiaries less amounts written off 976 976
3 512 287 3 552 494
Details are reflected below:
Shares atcost
R’000
Loansowing by
subsidiariesR’000
Provisionfor
impairmentR’000
2017Activi Deployment Services Proprietary Limited 5 060 — —Africa Prepaid Services Proprietary Limited 61 520 90 497 (152 017)Africa Prepaid Services Nigeria Limited 14 000 28 740 (42 740)Blue Label Accelerator Proprietary Limited * — —Blue Label Distribution Proprietary Limited** 194 000 — —Blue Label One Proprietary Limited 40 000 — —BLT USA Inc. 307 — —Budding Trade Proprietary Limited** 6 000 — —Cellfind SA Proprietary Limited 290 000 — (58 013)Cigicell Proprietary Limited 295 — —Datacel Direct Proprietary Limited 150 000 — —Gold Label Investments Proprietary Limited 137 816 303 698*** (121 148)Panacea Mobile Proprietary Limited 27 480 — —Reware Proprietary Limited 1 216 — —Simigenix Proprietary Limited * — —The Post Paid Company Proprietary Limited** 1 500 — —The Prepaid Company Proprietary Limited** 2 150 215 — —TicketPros Proprietary Limited** 14 700 — —Transaction Junction Proprietary Limited 4 200 — —Uninex Proprietary Limited * 976 —Ventury Group Proprietary Limited** 98 406 — —Viamedia Proprietary Limited 229 158 — —Virtual Voucher Proprietary Limited** 44 784 — (8 363)
3 470 657 423 911 (382 281)
* Less than R1 000.** These investments have been pledged as security to Investec Bank Limited in terms of the facility. For details on percentage held,
country of incorporation and issued shares, refer to note 2.4 in the Group notes. Refer to notes 16 and 22 for details on impairments.
*** This loan in substance forms part of the Company’s investment into Gold Label Investments Proprietary Limited. Refer to note 22 for the terms of these loans.
Notes to the Company annual financial statements continued
For the year ended 31 May 2017
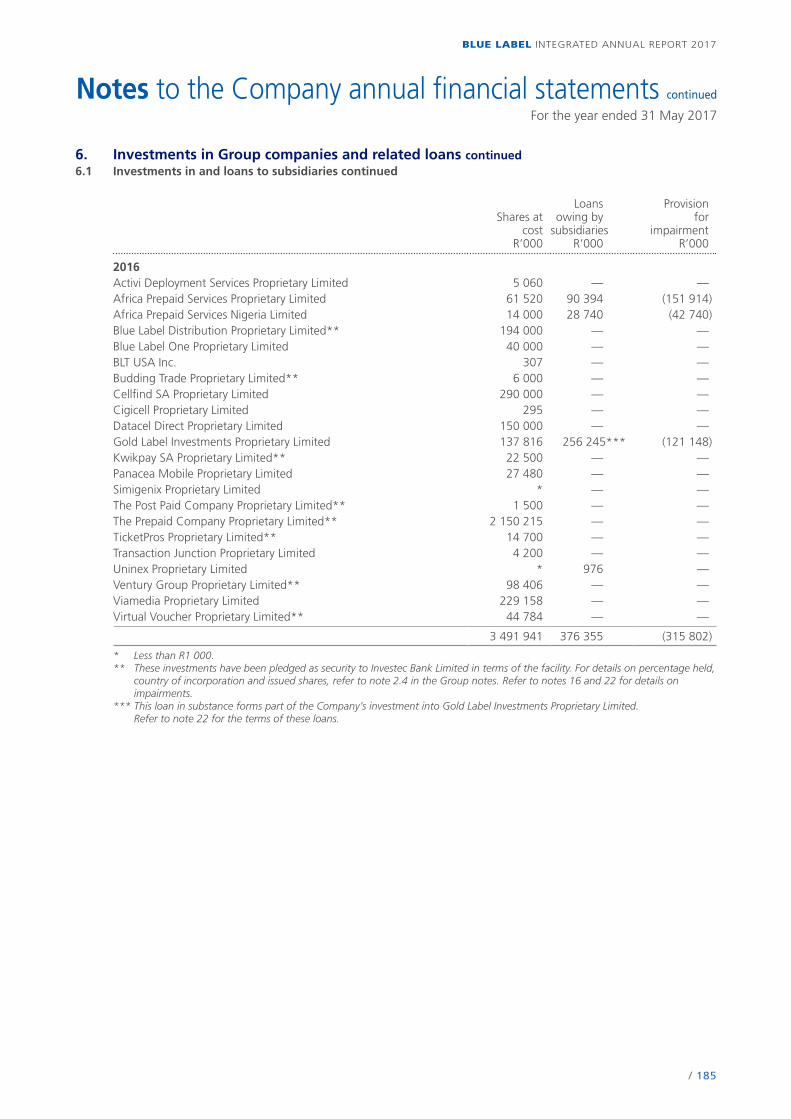
/ 185
BLUE LABEL INTEGRATED ANNUAL REPORT 2017
6. Investments in Group companies and related loans continued6.1 Investments in and loans to subsidiaries continued
Shares atcost
R’000
Loansowing by
subsidiariesR’000
Provisionfor
impairmentR’000
2016Activi Deployment Services Proprietary Limited 5 060 — —Africa Prepaid Services Proprietary Limited 61 520 90 394 (151 914)Africa Prepaid Services Nigeria Limited 14 000 28 740 (42 740)Blue Label Distribution Proprietary Limited** 194 000 — —Blue Label One Proprietary Limited 40 000 — —BLT USA Inc. 307 — —Budding Trade Proprietary Limited** 6 000 — —Cellfind SA Proprietary Limited 290 000 — —Cigicell Proprietary Limited 295 — —Datacel Direct Proprietary Limited 150 000 — —Gold Label Investments Proprietary Limited 137 816 256 245*** (121 148)Kwikpay SA Proprietary Limited** 22 500 — —Panacea Mobile Proprietary Limited 27 480 — —Simigenix Proprietary Limited * — —The Post Paid Company Proprietary Limited** 1 500 — —The Prepaid Company Proprietary Limited** 2 150 215 — —TicketPros Proprietary Limited** 14 700 — —Transaction Junction Proprietary Limited 4 200 — —Uninex Proprietary Limited * 976 —Ventury Group Proprietary Limited** 98 406 — —Viamedia Proprietary Limited 229 158 — —Virtual Voucher Proprietary Limited** 44 784 — —
3 491 941 376 355 (315 802)
* Less than R1 000.** These investments have been pledged as security to Investec Bank Limited in terms of the facility. For details on percentage held,
country of incorporation and issued shares, refer to note 2.4 in the Group notes. Refer to notes 16 and 22 for details on impairments.
*** This loan in substance forms part of the Company’s investment into Gold Label Investments Proprietary Limited. Refer to note 22 for the terms of these loans.
Notes to the Company annual financial statements continued
For the year ended 31 May 2017
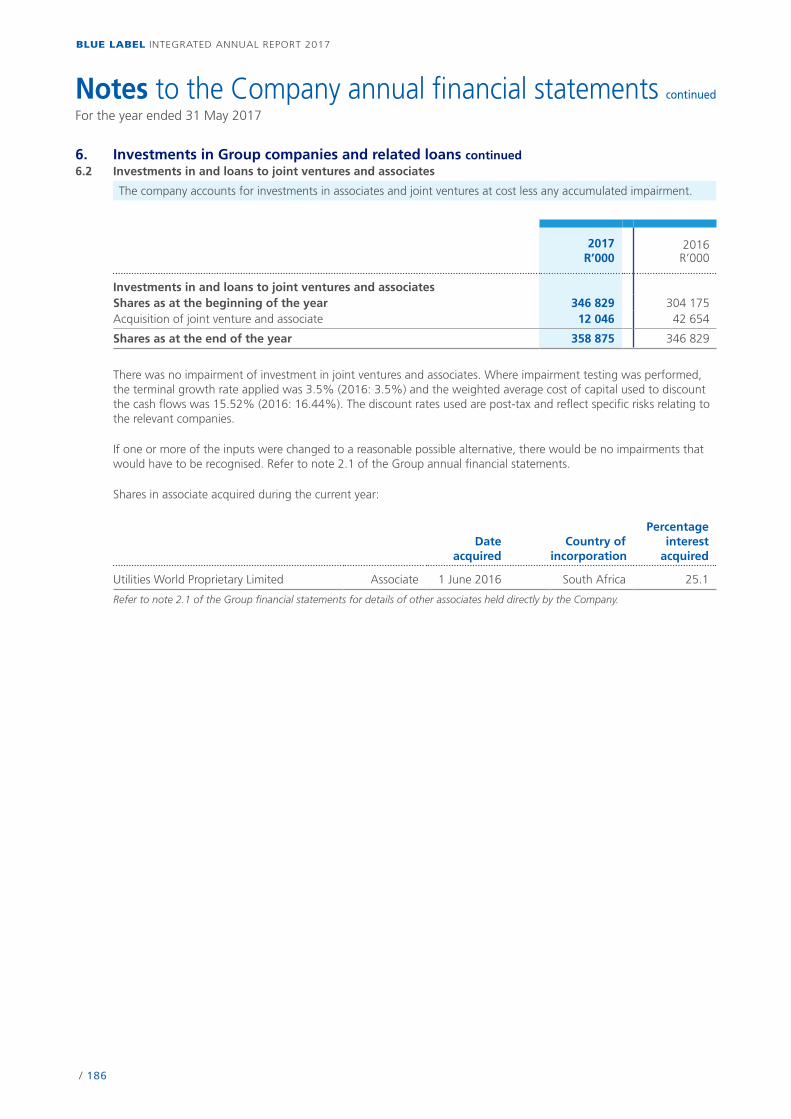
/ 186
BLUE LABEL INTEGRATED ANNUAL REPORT 2017
6. Investments in Group companies and related loans continued6.2 Investments in and loans to joint ventures and associates
The company accounts for investments in associates and joint ventures at cost less any accumulated impairment.
2017R’000
2016R’000
Investments in and loans to joint ventures and associatesShares as at the beginning of the year 346 829 304 175Acquisition of joint venture and associate 12 046 42 654
Shares as at the end of the year 358 875 346 829
There was no impairment of investment in joint ventures and associates. Where impairment testing was performed, the terminal growth rate applied was 3.5% (2016: 3.5%) and the weighted average cost of capital used to discount the cash flows was 15.52% (2016: 16.44%). The discount rates used are post-tax and reflect specific risks relating to the relevant companies.
If one or more of the inputs were changed to a reasonable possible alternative, there would be no impairments that would have to be recognised. Refer to note 2.1 of the Group annual financial statements.
Shares in associate acquired during the current year:
Dateacquired
Country ofincorporation
Percentageinterest
acquired
Utilities World Proprietary Limited Associate 1 June 2016 South Africa 25.1
Refer to note 2.1 of the Group financial statements for details of other associates held directly by the Company.
Notes to the Company annual financial statements continued
For the year ended 31 May 2017
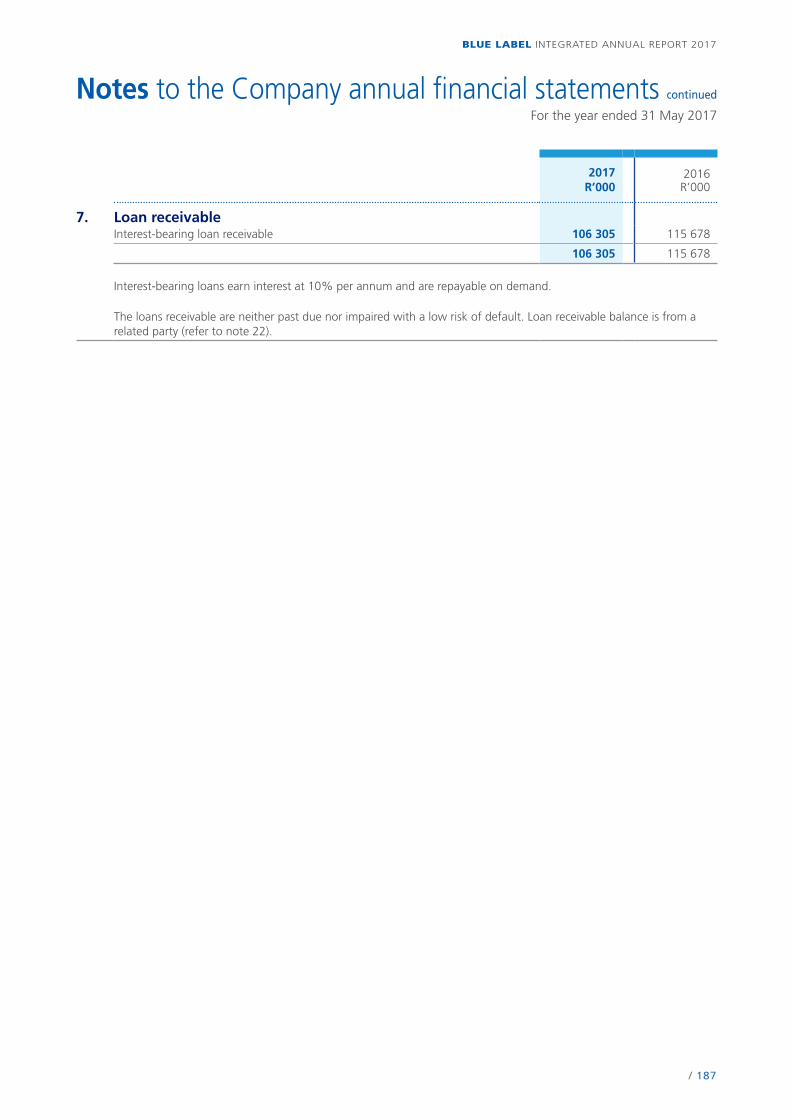
/ 187
BLUE LABEL INTEGRATED ANNUAL REPORT 2017
2017R’000
2016R’000
7. Loan receivableInterest-bearing loan receivable 106 305 115 678
106 305 115 678
Interest-bearing loans earn interest at 10% per annum and are repayable on demand.
The loans receivable are neither past due nor impaired with a low risk of default. Loan receivable balance is from a related party (refer to note 22).
Notes to the Company annual financial statements continued
For the year ended 31 May 2017

/ 188
BLUE LABEL INTEGRATED ANNUAL REPORT 2017
2017R’000
2016R’000
8. Trade and other receivablesSundry debtors 2 972 889Prepayments 46 42Amounts due from related parties (refer to note 22) — 5 329
3 018 6 260
The ageing of trade receivables, including amounts due from related parties, at the reporting date is as follows:
GrossR’000
ImpairmentR’000
NetR’000
31 May 2017Fully performing — — —Past due by one to 30 days — — —Past due by 31 to 60 days — — —Past due by 61 to 90 days — — —Past due by more than 90 days — — —
— — —
31 May 2016Fully performing 5 329 — 5 329Past due by one to 30 days — — —Past due by 31 to 60 days — — —Past due by 61 to 90 days — — —Past due by more than 90 days — — —
5 329 — 5 329
Based on the financial performance of the relevant debtors, management does not consider there to be any indications of potential default in respect of the fully performing book.
Notes to the Company annual financial statements continued
For the year ended 31 May 2017
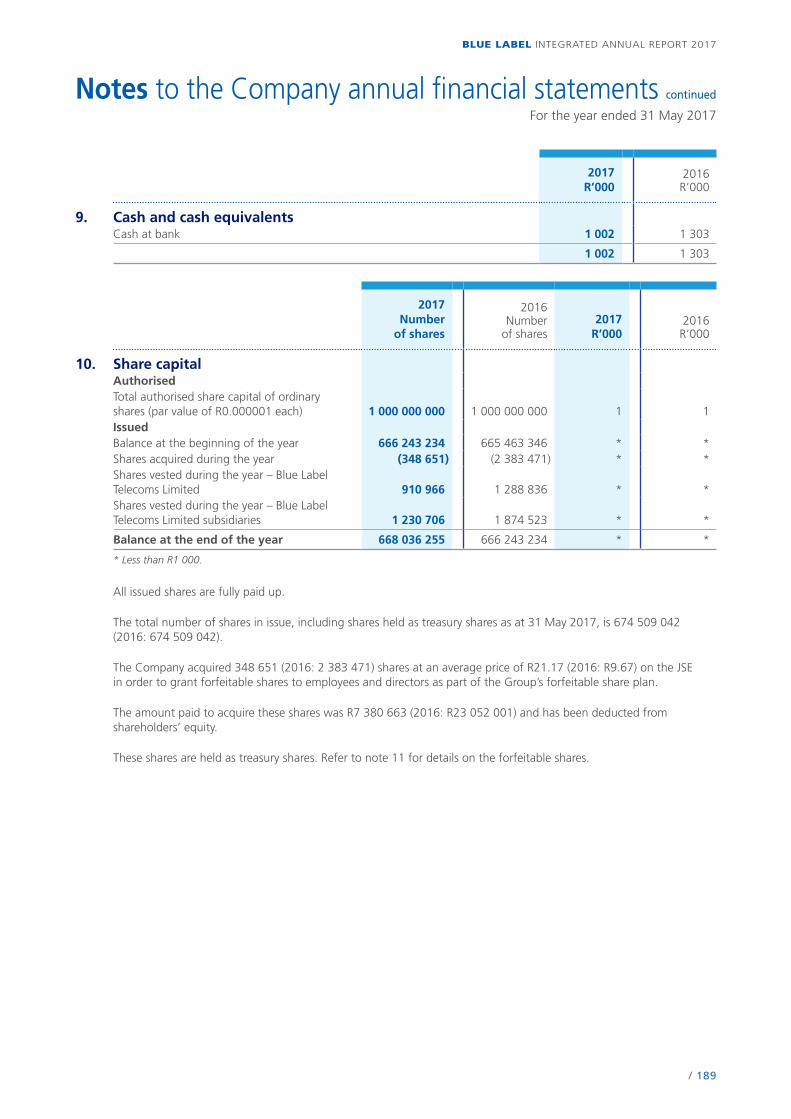
/ 189
BLUE LABEL INTEGRATED ANNUAL REPORT 2017
2017 R’000
2016R’000
9. Cash and cash equivalentsCash at bank 1 002 1 303
1 002 1 303
2017Number
of shares
2016Number
of shares2017
R’0002016
R’000
10. Share capital Authorised Total authorised share capital of ordinary shares (par value of R0.000001 each) 1 000 000 000 1 000 000 000 1 1 Issued Balance at the beginning of the year 666 243 234 665 463 346 * * Shares acquired during the year (348 651) (2 383 471) * * Shares vested during the year – Blue Label Telecoms Limited 910 966 1 288 836 * * Shares vested during the year – Blue Label Telecoms Limited subsidiaries 1 230 706 1 874 523 * *
Balance at the end of the year 668 036 255 666 243 234 * *
* Less than R1 000.
All issued shares are fully paid up.
The total number of shares in issue, including shares held as treasury shares as at 31 May 2017, is 674 509 042 (2016: 674 509 042).
The Company acquired 348 651 (2016: 2 383 471) shares at an average price of R21.17 (2016: R9.67) on the JSE in order to grant forfeitable shares to employees and directors as part of the Group’s forfeitable share plan.
The amount paid to acquire these shares was R7 380 663 (2016: R23 052 001) and has been deducted from shareholders’ equity.
These shares are held as treasury shares. Refer to note 11 for details on the forfeitable shares.
Notes to the Company annual financial statements continued
For the year ended 31 May 2017
/ 190
BLUE LABEL INTEGRATED ANNUAL REPORT 2017
11. Equity compensation benefitForfeitable sharesDuring the year 510 675 (2016: 920 592) forfeitable shares were granted to executive directors and qualifying employees (participant). The participant will forfeit the forfeitable shares if he/she ceases to be an employee of an employer company before the vesting date or if the specified performance conditions have not been met, unless otherwise specified by the rules or determined by the Board. In the event that the participant is not in the employ of the Group, or the performance conditions are not met, the shares allocated to the participant will be forfeited and will either be sold on the open market by the escrow agent and the proceeds will be returned to the participating employer, or may be retained by the Group for future awards.
Dividends declared in respect of these forfeitable shares are held in escrow until such time as the performance conditions are met and the shares have vested. Shares forfeited during the vesting period will forfeit any dividends pertaining to such shares. A dividend of 36 cents (2016: 31 cents) per ordinary share was declared on 23 August 2016 (2016: 18 August 2015).
The performance condition of the forfeitable shares for the sixth, seventh and eighth award vesting on 31 August 2016, 31 August 2017 and 31 August 2018 respectively are as follows:• 40% of the awards are allocated towards retention. In order to receive this portion of the allocation the employee
is required to be employed within the Group at the vesting date.• 60% of the awards are allocated on the basis of 50% for growth in core headline earnings per share and 10% for
shareholder returns.
The 50% for growth in core headline earnings will be based on the following achievements:• If growth is 5% above CPI over three years, 20% of the 50% will vest.• If growth is 10% above CPI over three years, an additional 50% (i.e. a total of 70%) of the 50% will vest.• If growth is 25% above CPI over three years, a further 30% (i.e. a total of 100%) of the 50% will vest.
The 10% for shareholder return will be based on a 10% compounded growth in the share price over the three-year vesting period measured with reference to the weighted average price per share during the month of the commencement of the allocation and the weighted average share price for the month during which the vesting takes place, plus dividends over the three-year period.
The performance condition for Executive Directors for the ninth award grant vesting on 31 August 2019 is as follows:• 33.33% for retention (three years from date of award); and• 66.67% financial (33.34% for growth in core headline earnings per share and 33.33% based on shareholder
returns);
The 33.34% for growth in core headline earnings per share is based on the following achievements:• If growth is 5% above CPI compounded annually over three years, then 20% of the 33.33% will vest.• If growth is 10% above CPI compounded annually over three years, then an additional 50% (i.e. a total of 70%)
of the 33.33% would vest. If growth is between 5% and 10% above CPI over the three years then the additional 50% will be reduced on a pro-rata basis.
• If growth is 25% above CPI compounded annually over three years, then a further 30% (i.e. a total of 100%) of the 33.33% will vest. If growth is between 10% and 25% above CPI over the three years then the additional 30% will be reduced on a pro-rata basis.
The 33.33% for shareholder return is based on a 10% compounded growth in the share price over the three-year vesting period, measured with reference to the weighted average price per share during the month of the commencement of the allocation plus dividends over the three-year period against the weighted average share price for the month during which the vesting takes place.
Notes to the Company annual financial statements continued
For the year ended 31 May 2017
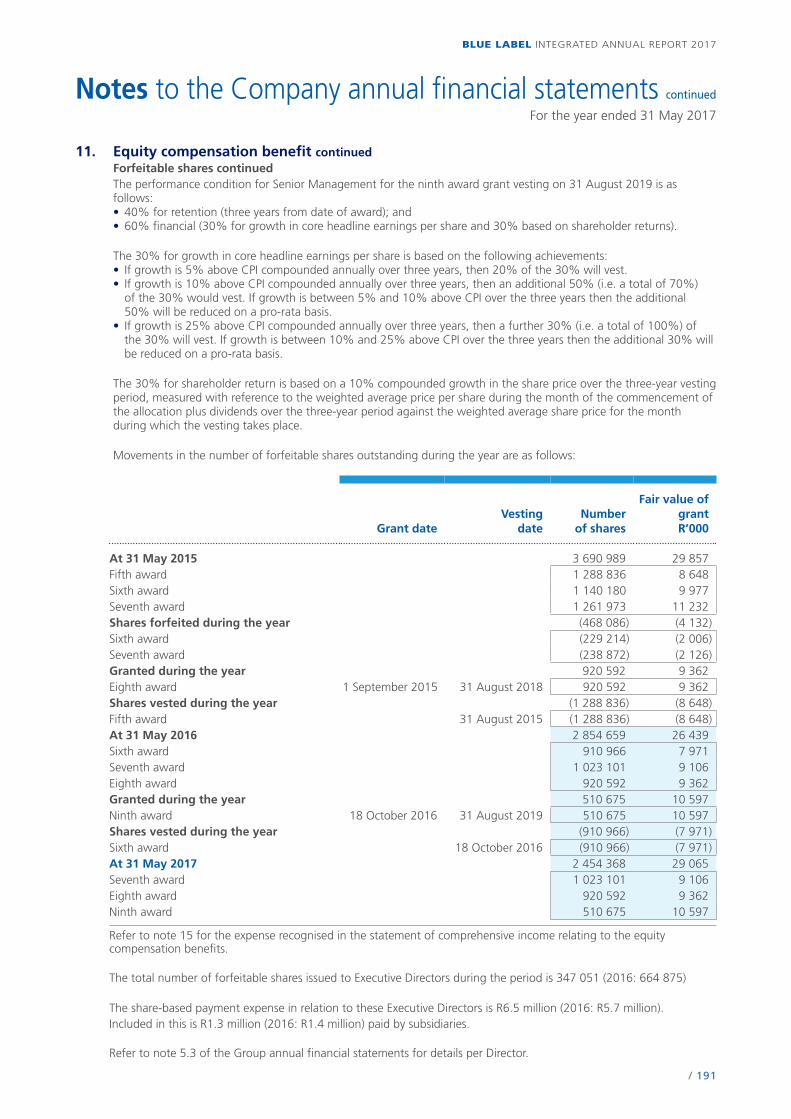
/ 191
BLUE LABEL INTEGRATED ANNUAL REPORT 2017
11. Equity compensation benefit continuedForfeitable shares continuedThe performance condition for Senior Management for the ninth award grant vesting on 31 August 2019 is as follows:• 40% for retention (three years from date of award); and• 60% financial (30% for growth in core headline earnings per share and 30% based on shareholder returns).
The 30% for growth in core headline earnings per share is based on the following achievements:• If growth is 5% above CPI compounded annually over three years, then 20% of the 30% will vest.• If growth is 10% above CPI compounded annually over three years, then an additional 50% (i.e. a total of 70%)
of the 30% would vest. If growth is between 5% and 10% above CPI over the three years then the additional 50% will be reduced on a pro-rata basis.
• If growth is 25% above CPI compounded annually over three years, then a further 30% (i.e. a total of 100%) of the 30% will vest. If growth is between 10% and 25% above CPI over the three years then the additional 30% will be reduced on a pro-rata basis.
The 30% for shareholder return is based on a 10% compounded growth in the share price over the three-year vesting period, measured with reference to the weighted average price per share during the month of the commencement of the allocation plus dividends over the three-year period against the weighted average share price for the month during which the vesting takes place.
Movements in the number of forfeitable shares outstanding during the year are as follows:
Grant dateVesting
dateNumber
of shares
Fair value of grantR’000
At 31 May 2015 3 690 989 29 857Fifth award 1 288 836 8 648Sixth award 1 140 180 9 977Seventh award 1 261 973 11 232Shares forfeited during the year (468 086) (4 132)Sixth award (229 214) (2 006)Seventh award (238 872) (2 126)Granted during the year 920 592 9 362Eighth award 1 September 2015 31 August 2018 920 592 9 362Shares vested during the year (1 288 836) (8 648)Fifth award 31 August 2015 (1 288 836) (8 648)At 31 May 2016 2 854 659 26 439Sixth award 910 966 7 971Seventh award 1 023 101 9 106Eighth award 920 592 9 362Granted during the year 510 675 10 597Ninth award 18 October 2016 31 August 2019 510 675 10 597Shares vested during the year (910 966) (7 971)Sixth award 18 October 2016 (910 966) (7 971)At 31 May 2017 2 454 368 29 065Seventh award 1 023 101 9 106Eighth award 920 592 9 362Ninth award 510 675 10 597
Refer to note 15 for the expense recognised in the statement of comprehensive income relating to the equity compensation benefits.
The total number of forfeitable shares issued to Executive Directors during the period is 347 051 (2016: 664 875)
The share-based payment expense in relation to these Executive Directors is R6.5 million (2016: R5.7 million).Included in this is R1.3 million (2016: R1.4 million) paid by subsidiaries.
Refer to note 5.3 of the Group annual financial statements for details per Director.
Notes to the Company annual financial statements continued
For the year ended 31 May 2017
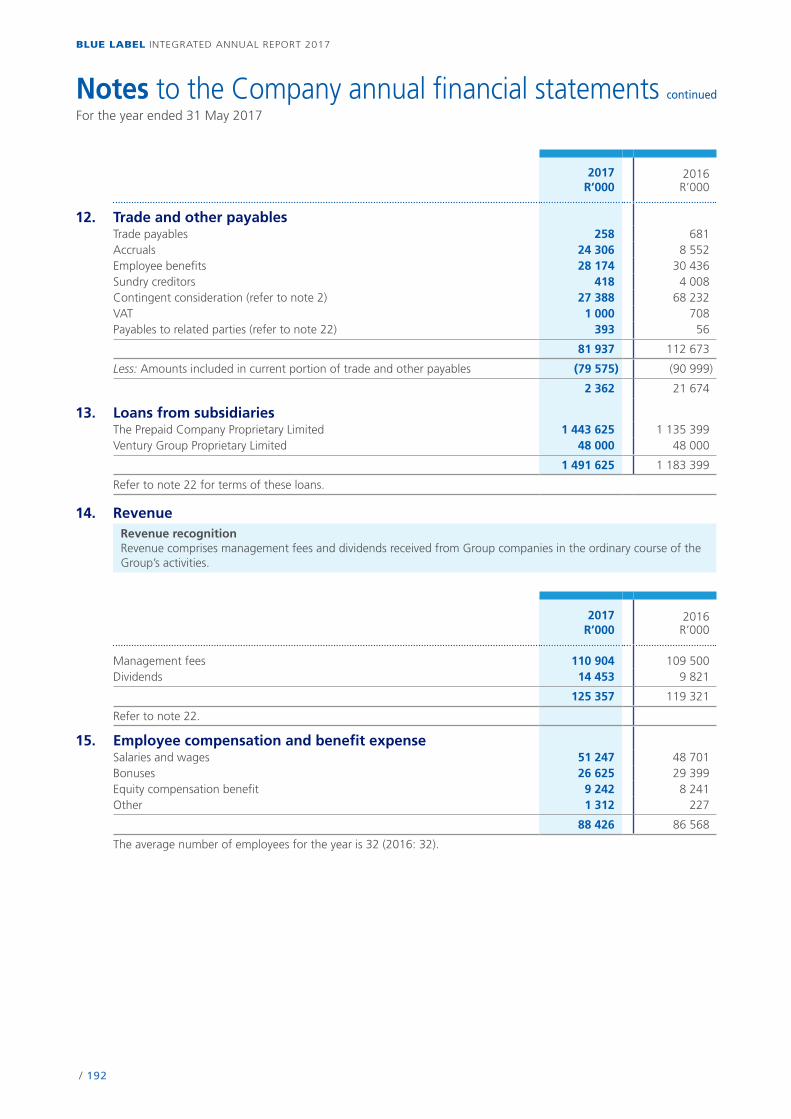
/ 192
BLUE LABEL INTEGRATED ANNUAL REPORT 2017
2017 R’000
2016R’000
12. Trade and other payables Trade payables 258 681Accruals 24 306 8 552Employee benefits 28 174 30 436Sundry creditors 418 4 008Contingent consideration (refer to note 2) 27 388 68 232VAT 1 000 708Payables to related parties (refer to note 22) 393 56
81 937 112 673
Less: Amounts included in current portion of trade and other payables (79 575) (90 999)
2 362 21 674
13. Loans from subsidiaries The Prepaid Company Proprietary Limited 1 443 625 1 135 399 Ventury Group Proprietary Limited 48 000 48 000
1 491 625 1 183 399
Refer to note 22 for terms of these loans.
14. RevenueRevenue recognitionRevenue comprises management fees and dividends received from Group companies in the ordinary course of the Group’s activities.
2017 R’000
2016R’000
Management fees 110 904 109 500Dividends 14 453 9 821
125 357 119 321
Refer to note 22.
15. Employee compensation and benefit expense Salaries and wages 51 247 48 701Bonuses 26 625 29 399Equity compensation benefit 9 242 8 241Other 1 312 227
88 426 86 568
The average number of employees for the year is 32 (2016: 32).
Notes to the Company annual financial statements continued
For the year ended 31 May 2017
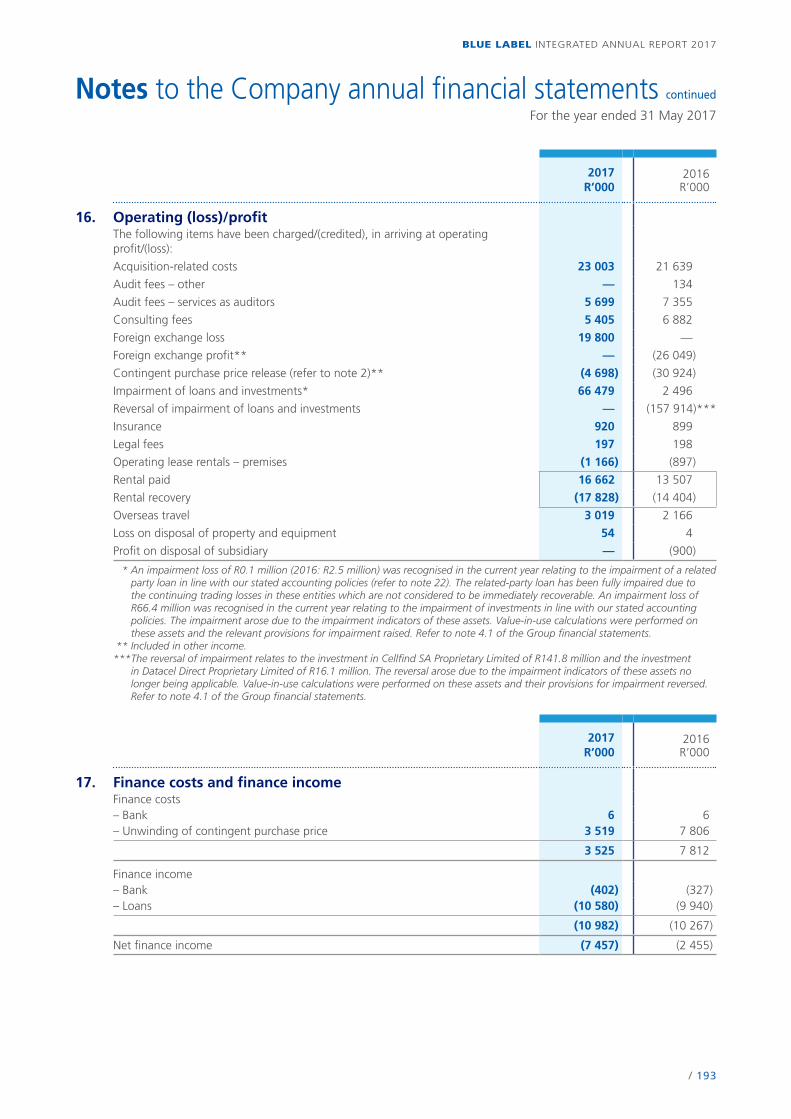
/ 193
BLUE LABEL INTEGRATED ANNUAL REPORT 2017
2017 R’000
2016R’000
16. Operating (loss)/profit The following items have been charged/(credited), in arriving at operating profit/(loss):
Acquisition-related costs 23 003 21 639
Audit fees – other — 134
Audit fees – services as auditors 5 699 7 355
Consulting fees 5 405 6 882
Foreign exchange loss 19 800 —
Foreign exchange profit** — (26 049)
Contingent purchase price release (refer to note 2)** (4 698) (30 924)
Impairment of loans and investments* 66 479 2 496
Reversal of impairment of loans and investments — (157 914)***
Insurance 920 899
Legal fees 197 198
Operating lease rentals – premises (1 166) (897)
Rental paid 16 662 13 507
Rental recovery (17 828) (14 404)
Overseas travel 3 019 2 166
Loss on disposal of property and equipment 54 4
Profit on disposal of subsidiary — (900)
* An impairment loss of R0.1 million (2016: R2.5 million) was recognised in the current year relating to the impairment of a related party loan in line with our stated accounting policies (refer to note 22). The related-party loan has been fully impaired due to the continuing trading losses in these entities which are not considered to be immediately recoverable. An impairment loss of R66.4 million was recognised in the current year relating to the impairment of investments in line with our stated accounting policies. The impairment arose due to the impairment indicators of these assets. Value-in-use calculations were performed on these assets and the relevant provisions for impairment raised. Refer to note 4.1 of the Group financial statements.
** Included in other income.*** The reversal of impairment relates to the investment in Cellfind SA Proprietary Limited of R141.8 million and the investment
in Datacel Direct Proprietary Limited of R16.1 million. The reversal arose due to the impairment indicators of these assets no longer being applicable. Value-in-use calculations were performed on these assets and their provisions for impairment reversed. Refer to note 4.1 of the Group financial statements.
2017 R’000
2016R’000
17. Finance costs and finance income Finance costs – Bank 6 6– Unwinding of contingent purchase price 3 519 7 806
3 525 7 812
Finance income – Bank (402) (327)– Loans (10 580) (9 940)
(10 982) (10 267)
Net finance income (7 457) (2 455)
Notes to the Company annual financial statements continued
For the year ended 31 May 2017

/ 194
BLUE LABEL INTEGRATED ANNUAL REPORT 2017
2017 R’000
2016R’000
18. Taxation Current tax 6 —Current year — —Adjustment in respect of prior year 6 —Deferred tax (5 243) 5 902Current year (5 304) 6 241Adjustment in respect of prior year 61 (339)
(5 237) 5 902
Tax rate reconciliation Net profit before tax (97 846) 185 948Tax at 28% (27 397) 52 065Dividends received (4 047) (2 749)Fair value adjustments (329) (6 473)Investment impairment reversal — (44 216)Impairment of investments 18 585 —Expenditure not deductible for tax purposes 76 1 212Expenditure of a capital nature 7 808 6 654Adjustment in respect of prior year 67 (339)Capital gains tax — (252)
(5 237) 5 902
Effective tax rate 5% 3%
2017 R’000
2016R’000
19. Cash utilised by operations Reconciliation of operating loss to cash flows from operating activities Operating (loss)/profit (105 303) 183 493Adjustments for: Dividends received (14 453) (3 598)Depreciation of property and equipment 4 762 6 190Amortisation on intangible assets 13 54Impairment of loans and investments 66 479 2 496Reversal of impairment of loans and investments — (157 914)Loss on disposal of property and equipment 54 4Profit on disposal of subsidiaries — (900)Equity compensation benefit expense 9 242 8 241Net unrealised foreign exchange loss/(profit) 19 954 (25 066)Changes in working capital: Decrease/(increase) in trade and other receivables 3 242 (2 051)Increase/(decrease) in trade and other payables 6 560 (20 222)
(9 450) (9 273)
Notes to the Company annual financial statements continued
For the year ended 31 May 2017
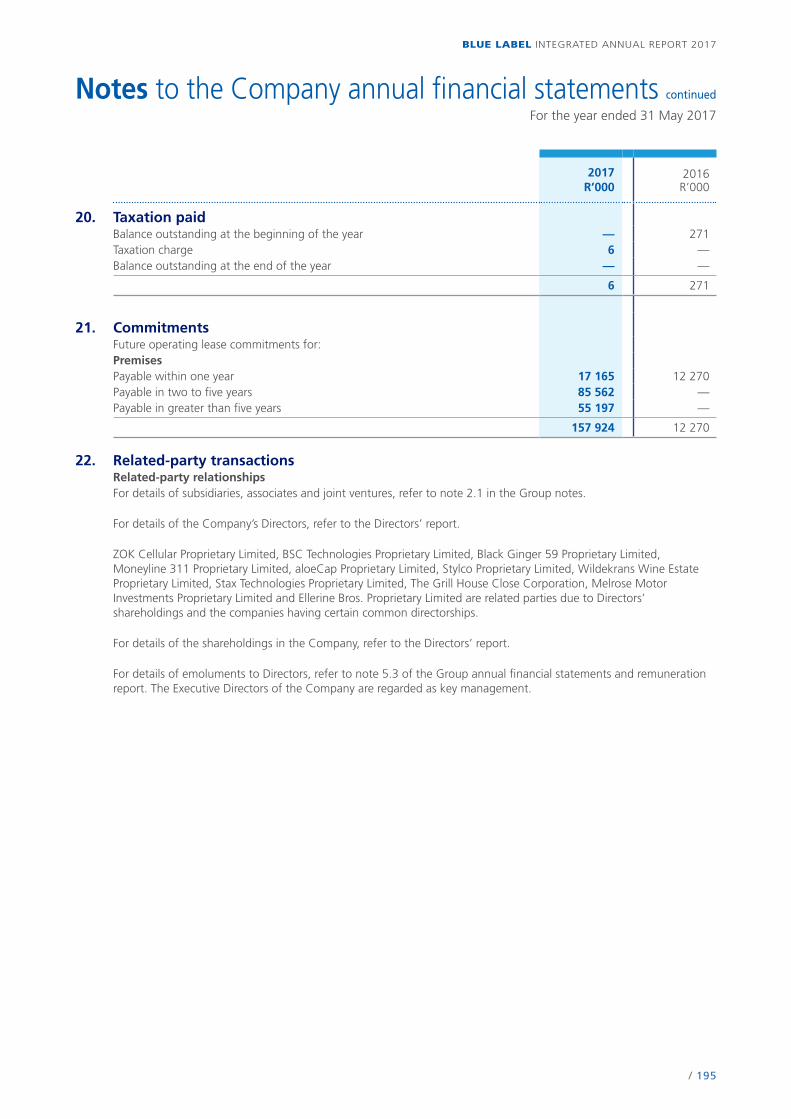
/ 195
BLUE LABEL INTEGRATED ANNUAL REPORT 2017
2017 R’000
2016R’000
20. Taxation paid Balance outstanding at the beginning of the year — 271 Taxation charge 6 —Balance outstanding at the end of the year — —
6 271
21. Commitments Future operating lease commitments for: Premises Payable within one year 17 165 12 270 Payable in two to five years 85 562 —Payable in greater than five years 55 197 —
157 924 12 270
22. Related-party transactionsRelated-party relationshipsFor details of subsidiaries, associates and joint ventures, refer to note 2.1 in the Group notes.
For details of the Company’s Directors, refer to the Directors’ report.
ZOK Cellular Proprietary Limited, BSC Technologies Proprietary Limited, Black Ginger 59 Proprietary Limited, Moneyline 311 Proprietary Limited, aloeCap Proprietary Limited, Stylco Proprietary Limited, Wildekrans Wine Estate Proprietary Limited, Stax Technologies Proprietary Limited, The Grill House Close Corporation, Melrose Motor Investments Proprietary Limited and Ellerine Bros. Proprietary Limited are related parties due to Directors’ shareholdings and the companies having certain common directorships.
For details of the shareholdings in the Company, refer to the Directors’ report.
For details of emoluments to Directors, refer to note 5.3 of the Group annual financial statements and remuneration report. The Executive Directors of the Company are regarded as key management.
Notes to the Company annual financial statements continued
For the year ended 31 May 2017
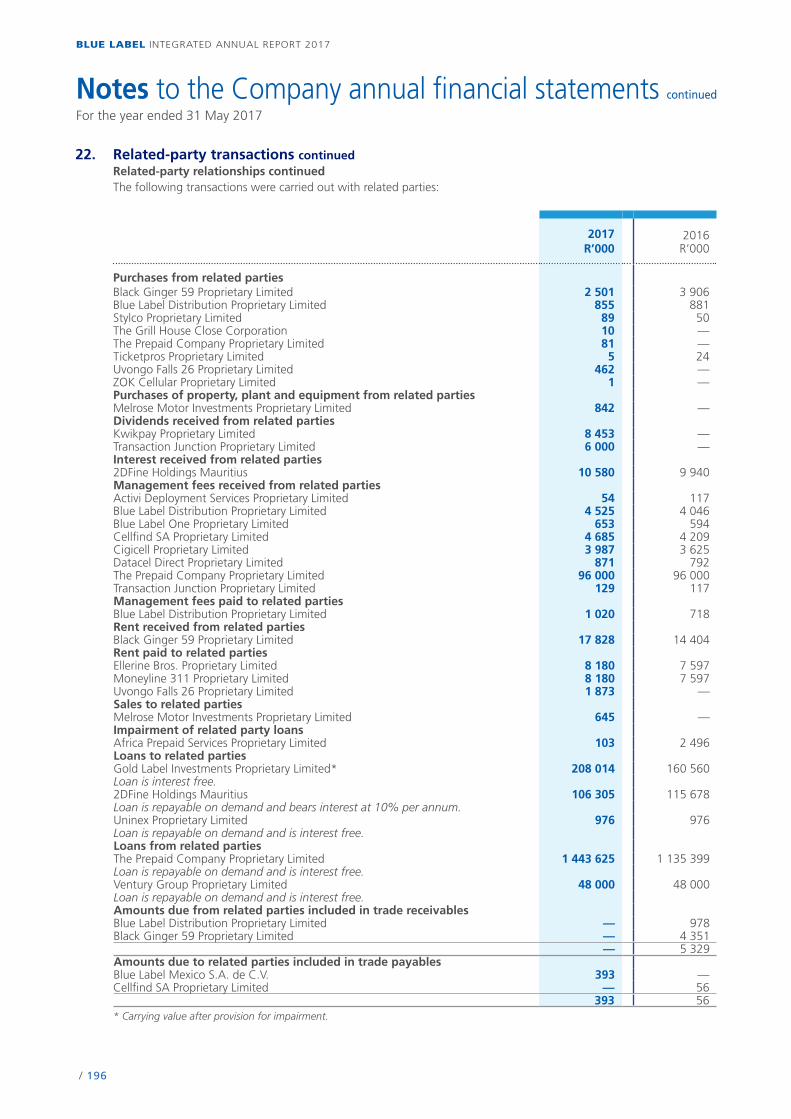
/ 196
BLUE LABEL INTEGRATED ANNUAL REPORT 2017
22. Related-party transactions continuedRelated-party relationships continuedThe following transactions were carried out with related parties:
2017 R’000
2016R’000
Purchases from related parties Black Ginger 59 Proprietary Limited 2 501 3 906Blue Label Distribution Proprietary Limited 855 881Stylco Proprietary Limited 89 50The Grill House Close Corporation 10 —The Prepaid Company Proprietary Limited 81 —Ticketpros Proprietary Limited 5 24Uvongo Falls 26 Proprietary Limited 462 —ZOK Cellular Proprietary Limited 1 —Purchases of property, plant and equipment from related partiesMelrose Motor Investments Proprietary Limited 842 —Dividends received from related parties Kwikpay Proprietary Limited 8 453 —Transaction Junction Proprietary Limited 6 000 —Interest received from related parties 2DFine Holdings Mauritius 10 580 9 940Management fees received from related parties Activi Deployment Services Proprietary Limited 54 117Blue Label Distribution Proprietary Limited 4 525 4 046Blue Label One Proprietary Limited 653 594Cellfind SA Proprietary Limited 4 685 4 209Cigicell Proprietary Limited 3 987 3 625Datacel Direct Proprietary Limited 871 792The Prepaid Company Proprietary Limited 96 000 96 000Transaction Junction Proprietary Limited 129 117Management fees paid to related parties Blue Label Distribution Proprietary Limited 1 020 718Rent received from related parties Black Ginger 59 Proprietary Limited 17 828 14 404Rent paid to related parties Ellerine Bros. Proprietary Limited 8 180 7 597Moneyline 311 Proprietary Limited 8 180 7 597Uvongo Falls 26 Proprietary Limited 1 873 —Sales to related parties Melrose Motor Investments Proprietary Limited 645 —Impairment of related party loans Africa Prepaid Services Proprietary Limited 103 2 496 Loans to related parties Gold Label Investments Proprietary Limited* 208 014 160 560 Loan is interest free. 2DFine Holdings Mauritius 106 305 115 678 Loan is repayable on demand and bears interest at 10% per annum. Uninex Proprietary Limited 976 976 Loan is repayable on demand and is interest free. Loans from related parties The Prepaid Company Proprietary Limited 1 443 625 1 135 399 Loan is repayable on demand and is interest free. Ventury Group Proprietary Limited 48 000 48 000 Loan is repayable on demand and is interest free. Amounts due from related parties included in trade receivables Blue Label Distribution Proprietary Limited — 978 Black Ginger 59 Proprietary Limited — 4 351
— 5 329 Amounts due to related parties included in trade payables Blue Label Mexico S.A. de C.V. 393 — Cellfind SA Proprietary Limited — 56
393 56 * Carrying value after provision for impairment.
Notes to the Company annual financial statements continued
For the year ended 31 May 2017

/ 197
BLUE LABEL INTEGRATED ANNUAL REPORT 2017
23. Subsequent eventsRefer to note 9.2 of the Group annual financial statements for details of subsequent events.
Notes to the Company annual financial statements continued
For the year ended 31 May 2017
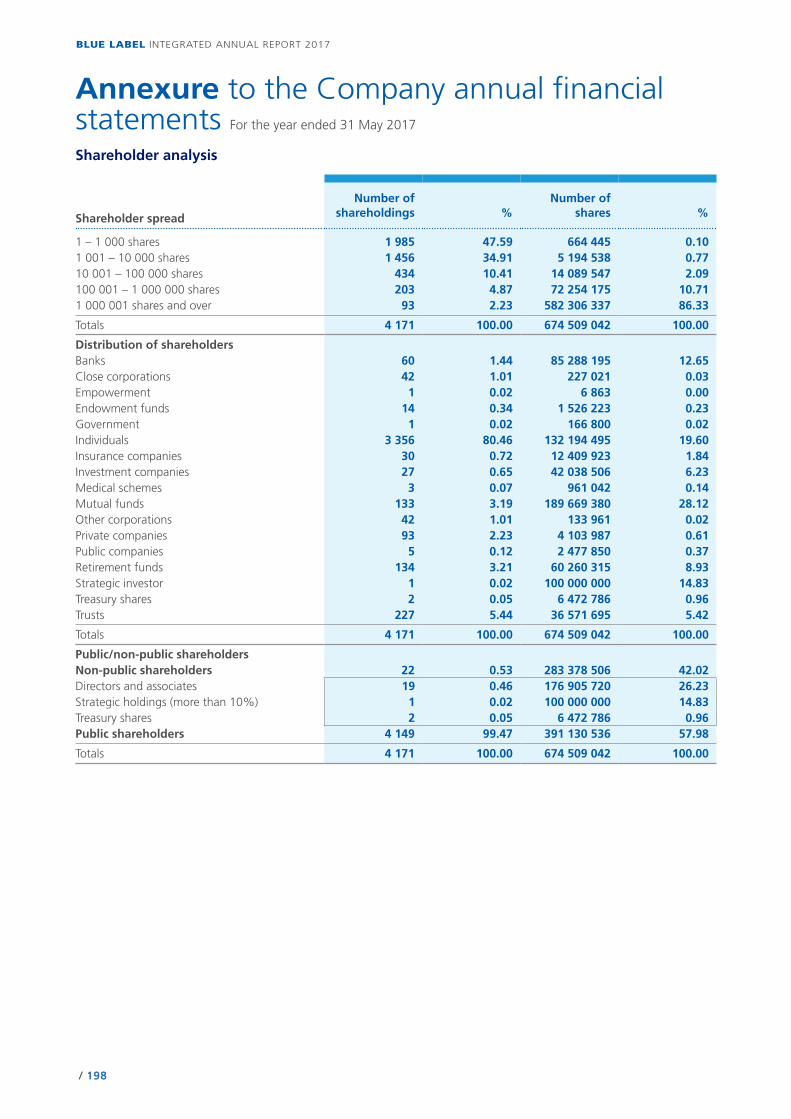
/ 198
BLUE LABEL INTEGRATED ANNUAL REPORT 2017
Annexure to the Company annual financial statements For the year ended 31 May 2017
/ 198
Shareholder analysis
Shareholder spread
Number of shareholdings %
Number of shares %
1 – 1 000 shares 1 985 47.59 664 445 0.101 001 – 10 000 shares 1 456 34.91 5 194 538 0.7710 001 – 100 000 shares 434 10.41 14 089 547 2.09100 001 – 1 000 000 shares 203 4.87 72 254 175 10.711 000 001 shares and over 93 2.23 582 306 337 86.33
Totals 4 171 100.00 674 509 042 100.00
Distribution of shareholdersBanks 60 1.44 85 288 195 12.65Close corporations 42 1.01 227 021 0.03Empowerment 1 0.02 6 863 0.00Endowment funds 14 0.34 1 526 223 0.23Government 1 0.02 166 800 0.02Individuals 3 356 80.46 132 194 495 19.60Insurance companies 30 0.72 12 409 923 1.84Investment companies 27 0.65 42 038 506 6.23Medical schemes 3 0.07 961 042 0.14Mutual funds 133 3.19 189 669 380 28.12Other corporations 42 1.01 133 961 0.02Private companies 93 2.23 4 103 987 0.61Public companies 5 0.12 2 477 850 0.37Retirement funds 134 3.21 60 260 315 8.93Strategic investor 1 0.02 100 000 000 14.83Treasury shares 2 0.05 6 472 786 0.96Trusts 227 5.44 36 571 695 5.42
Totals 4 171 100.00 674 509 042 100.00
Public/non-public shareholdersNon-public shareholders 22 0.53 283 378 506 42.02Directors and associates 19 0.46 176 905 720 26.23Strategic holdings (more than 10%) 1 0.02 100 000 000 14.83Treasury shares 2 0.05 6 472 786 0.96Public shareholders 4 149 99.47 391 130 536 57.98
Totals 4 171 100.00 674 509 042 100.00
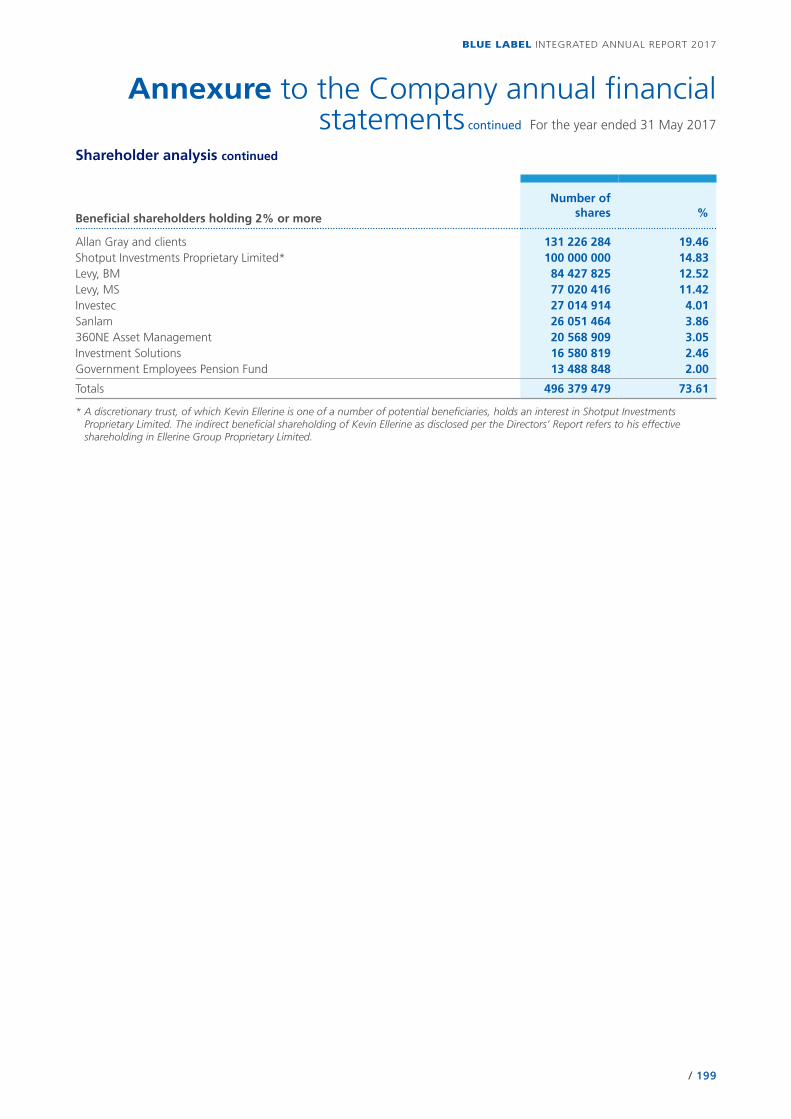
/ 199
BLUE LABEL INTEGRATED ANNUAL REPORT 2017
/ 199
Annexure to the Company annual financial statements continued For the year ended 31 May 2017
Shareholder analysis continued
Beneficial shareholders holding 2% or more
Number of shares %
Allan Gray and clients 131 226 284 19.46Shotput Investments Proprietary Limited* 100 000 000 14.83Levy, BM 84 427 825 12.52Levy, MS 77 020 416 11.42Investec 27 014 914 4.01Sanlam 26 051 464 3.86360NE Asset Management 20 568 909 3.05Investment Solutions 16 580 819 2.46Government Employees Pension Fund 13 488 848 2.00
Totals 496 379 479 73.61
* A discretionary trust, of which Kevin Ellerine is one of a number of potential beneficiaries, holds an interest in Shotput Investments Proprietary Limited. The indirect beneficial shareholding of Kevin Ellerine as disclosed per the Directors’ Report refers to his effective shareholding in Ellerine Group Proprietary Limited.

/ 200
BLUE LABEL INTEGRATED ANNUAL REPORT 2017
Notice is hereby given to Blue Label shareholders recorded in the Company’s securities register on Friday, 24 November 2017, that the tenth Annual General Meeting of shareholders of Blue Label Telecoms Limited will be held in the boardroom, Blue Label corporate offices, 75 Grayston Drive, Sandton, on Monday, 22 January 2018 at 10:00 (South African time) (AGM), to conduct such business as may lawfully be dealt with at the AGM and to consider and, if deemed fit, pass, with or without modification, the ordinary and special resolutions set out hereunder in the manner required by the Companies Act 71 of 2008 (Act or Companies Act), as read with the Listings Requirements.
In terms of section 63(1) of the Act, meeting participants (including proxies) will be required to provide reasonably satisfactory identification before being entitled to participate in or vote at the AGM. Acceptable forms of identification include original and valid identity documents, driving licences and passports.
RECORD DATES, PROXIES AND VOTINGIn terms of sections 59(1)(a) and (b) of the Act, the Board of the Company has set the record date for the purpose of determining which shareholders are entitled to:• receive notice of the AGM (being the date on which a shareholder must be registered in the Company’s shareholders’
register in order to receive notice of the AGM) as Friday, 24 November 2017; and• participate in and vote at the AGM (being the date on which a shareholder must be registered in the Company’s
shareholders’ register in order to participate in and vote at the AGM) as Friday, 12 January 2018.
Certificated shareholders or own-name dematerialised shareholders may attend and vote at the AGM, or alternatively appoint a proxy to attend, speak and, in respect of the applicable resolution(s), vote in their stead by completing the attached form of proxy and returning it to the transfer secretaries at the address given in the form of proxy by no later than 09:00 on Thursday, 18 January 2018.
Shareholders who have dematerialised their shares, other than those shareholders who have dematerialised their shares with own-name registration, should contact their CSDP or broker in the manner and within the time stipulated in the agreement entered into between them and their CSDP or broker: to furnish their voting instructions; or in the event that they wish to attend the AGM, to obtain the necessary letter of representation to do so.
On a show of hands, every shareholder present in person or represented by proxy and entitled to vote shall have only one vote irrespective of the number of shares such shareholder holds. On a poll, every shareholder, present in person or represented by proxy and entitled to vote, shall be entitled to that proportion of the total votes in the Company which the aggregate amount of the nominal value of the shares held by such shareholder bears to the aggregate amount of the nominal value of all shares issued by the Company.
Certificated shareholders or own-name dematerialised shareholders who are entitled to attend and vote at the AGM are entitled to appoint a proxy to attend, participate in and vote at the AGM in their stead. A proxy need not also be a shareholder of the Company. The completion of a form of proxy will not preclude a shareholder from attending the AGM.
ELECTRONIC PARTICIPATIONThe Company will provide for electronic participation in the AGM, as set out in section 63 of the Act. Please refer to the notes on page 210 at the end of this notice.
When reading the resolutions below, please refer to the explanatory notes on pages 208 and 209.
PRESENTATION OF ANNUAL FINANCIAL STATEMENTS AND REPORTSThe audited Group and Company annual financial statements, including the external auditors’, Audit, Risk and Compliance Committee’s and Directors’ reports for the year ended 31 May 2017, have been distributed as required and will be presented to shareholders at the AGM.
The complete set of audited Group and Company annual financial statements, together with the above mentioned reports, are set out on pages 87 to 197 of the integrated annual report. The Audit, Risk and Compliance Committee’s report is set out on pages 67 to 70 of the integrated annual report.
Notice of annual general meeting
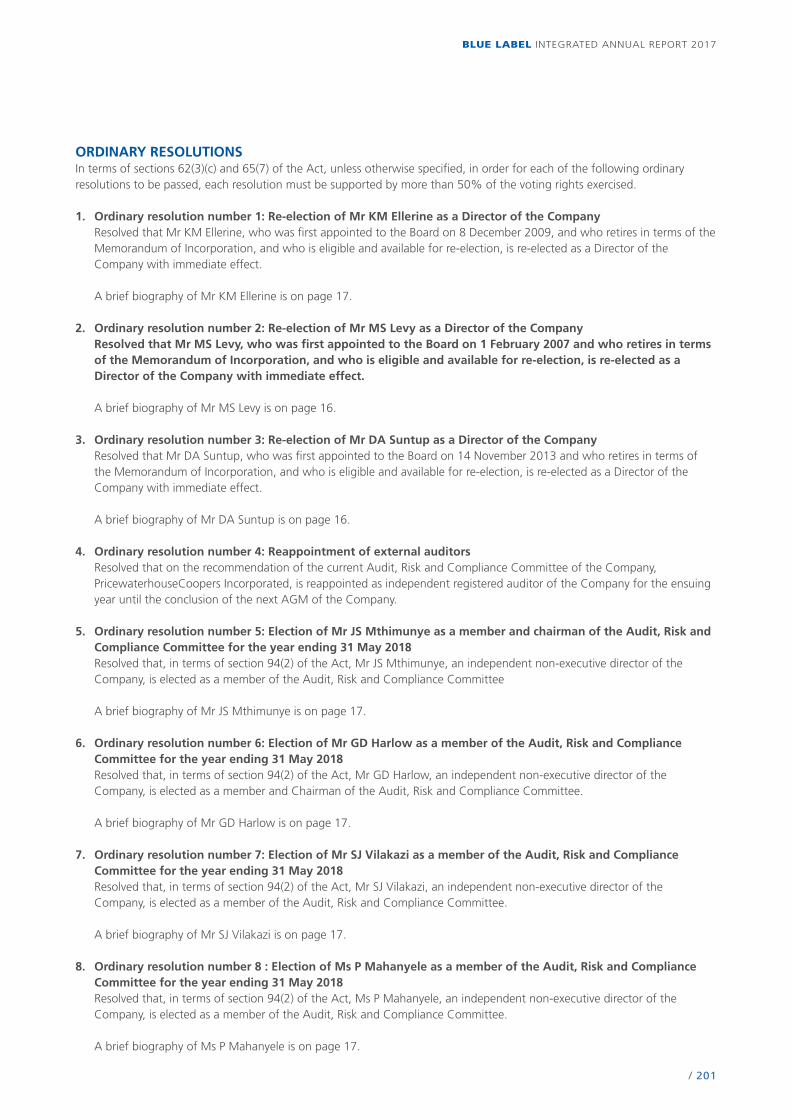
/ 201
BLUE LABEL INTEGRATED ANNUAL REPORT 2017
ORDINARY RESOLUTIONSIn terms of sections 62(3)(c) and 65(7) of the Act, unless otherwise specified, in order for each of the following ordinary resolutions to be passed, each resolution must be supported by more than 50% of the voting rights exercised.
1. Ordinary resolution number 1: Re-election of Mr KM Ellerine as a Director of the Company Resolved that Mr KM Ellerine, who was first appointed to the Board on 8 December 2009, and who retires in terms of the
Memorandum of Incorporation, and who is eligible and available for re-election, is re-elected as a Director of the Company with immediate effect.
A brief biography of Mr KM Ellerine is on page 17.
2. Ordinary resolution number 2: Re-election of Mr MS Levy as a Director of the Company Resolved that Mr MS Levy, who was first appointed to the Board on 1 February 2007 and who retires in terms
of the Memorandum of Incorporation, and who is eligible and available for re-election, is re-elected as a Director of the Company with immediate effect.
A brief biography of Mr MS Levy is on page 16.
3. Ordinary resolution number 3: Re-election of Mr DA Suntup as a Director of the Company Resolved that Mr DA Suntup, who was first appointed to the Board on 14 November 2013 and who retires in terms of
the Memorandum of Incorporation, and who is eligible and available for re-election, is re-elected as a Director of the Company with immediate effect.
A brief biography of Mr DA Suntup is on page 16.
4. Ordinary resolution number 4: Reappointment of external auditors Resolved that on the recommendation of the current Audit, Risk and Compliance Committee of the Company,
PricewaterhouseCoopers Incorporated, is reappointed as independent registered auditor of the Company for the ensuing year until the conclusion of the next AGM of the Company.
5. Ordinary resolution number 5: Election of Mr JS Mthimunye as a member and chairman of the Audit, Risk and Compliance Committee for the year ending 31 May 2018
Resolved that, in terms of section 94(2) of the Act, Mr JS Mthimunye, an independent non-executive director of the Company, is elected as a member of the Audit, Risk and Compliance Committee
A brief biography of Mr JS Mthimunye is on page 17.
6. Ordinary resolution number 6: Election of Mr GD Harlow as a member of the Audit, Risk and Compliance Committee for the year ending 31 May 2018
Resolved that, in terms of section 94(2) of the Act, Mr GD Harlow, an independent non-executive director of the Company, is elected as a member and Chairman of the Audit, Risk and Compliance Committee.
A brief biography of Mr GD Harlow is on page 17.
7. Ordinary resolution number 7: Election of Mr SJ Vilakazi as a member of the Audit, Risk and Compliance Committee for the year ending 31 May 2018
Resolved that, in terms of section 94(2) of the Act, Mr SJ Vilakazi, an independent non-executive director of the Company, is elected as a member of the Audit, Risk and Compliance Committee.
A brief biography of Mr SJ Vilakazi is on page 17.
8. Ordinary resolution number 8 : Election of Ms P Mahanyele as a member of the Audit, Risk and Compliance Committee for the year ending 31 May 2018
Resolved that, in terms of section 94(2) of the Act, Ms P Mahanyele, an independent non-executive director of the Company, is elected as a member of the Audit, Risk and Compliance Committee.
A brief biography of Ms P Mahanyele is on page 17.
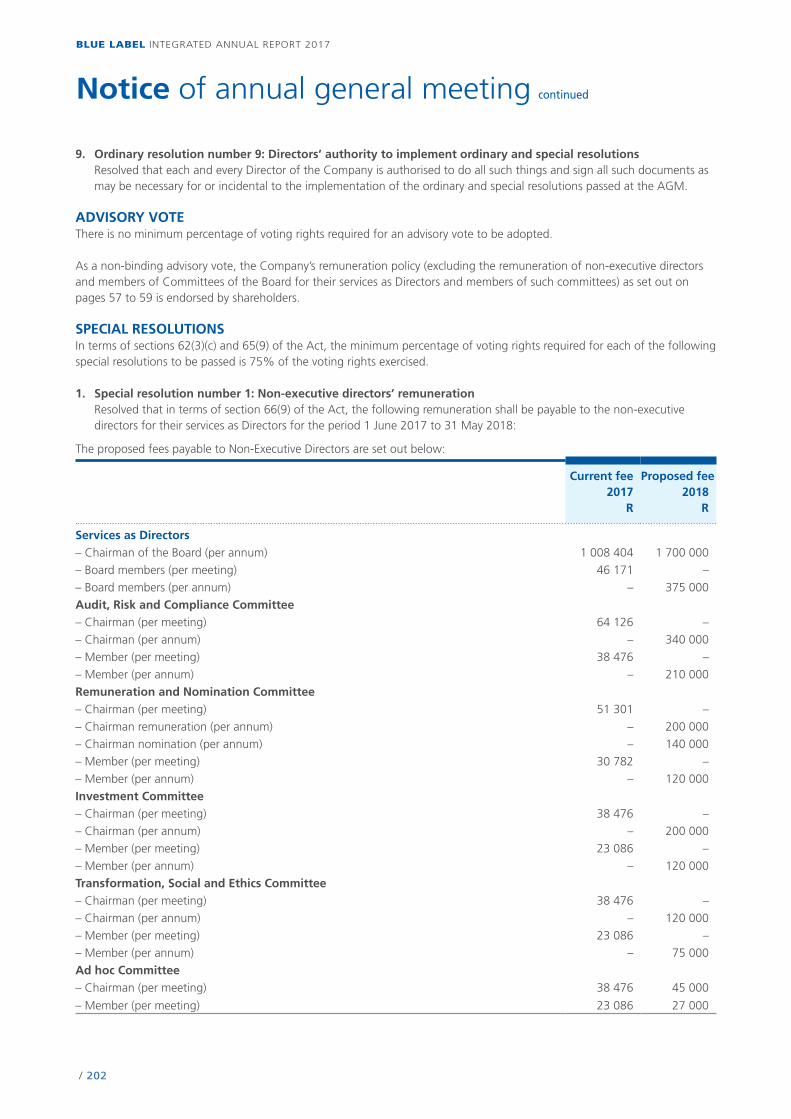
/ 202
BLUE LABEL INTEGRATED ANNUAL REPORT 2017
9. Ordinary resolution number 9: Directors’ authority to implement ordinary and special resolutions Resolved that each and every Director of the Company is authorised to do all such things and sign all such documents as
may be necessary for or incidental to the implementation of the ordinary and special resolutions passed at the AGM.
ADVISORY VOTEThere is no minimum percentage of voting rights required for an advisory vote to be adopted.
As a non-binding advisory vote, the Company’s remuneration policy (excluding the remuneration of non-executive directors and members of Committees of the Board for their services as Directors and members of such committees) as set out on pages 57 to 59 is endorsed by shareholders.
SPECIAL RESOLUTIONSIn terms of sections 62(3)(c) and 65(9) of the Act, the minimum percentage of voting rights required for each of the following special resolutions to be passed is 75% of the voting rights exercised.
1. Special resolution number 1: Non-executive directors’ remuneration Resolved that in terms of section 66(9) of the Act, the following remuneration shall be payable to the non-executive
directors for their services as Directors for the period 1 June 2017 to 31 May 2018:
The proposed fees payable to Non-Executive Directors are set out below:
Current fee2017
R
Proposed fee2018
R
Services as Directors– Chairman of the Board (per annum) 1 008 404 1 700 000
– Board members (per meeting) 46 171 –
– Board members (per annum) – 375 000
Audit, Risk and Compliance Committee– Chairman (per meeting) 64 126 –
– Chairman (per annum) – 340 000
– Member (per meeting) 38 476 –
– Member (per annum) – 210 000
Remuneration and Nomination Committee– Chairman (per meeting) 51 301 –
– Chairman remuneration (per annum) – 200 000
– Chairman nomination (per annum) – 140 000
– Member (per meeting) 30 782 –
– Member (per annum) – 120 000
Investment Committee– Chairman (per meeting) 38 476 –
– Chairman (per annum) – 200 000
– Member (per meeting) 23 086 –
– Member (per annum) – 120 000
Transformation, Social and Ethics Committee – Chairman (per meeting) 38 476 –
– Chairman (per annum) – 120 000
– Member (per meeting) 23 086 –
– Member (per annum) – 75 000
Ad hoc Committee– Chairman (per meeting) 38 476 45 000
– Member (per meeting) 23 086 27 000
Notice of annual general meeting continued
/ 203
BLUE LABEL INTEGRATED ANNUAL REPORT 2017
2. Special resolution number 2: General authority to repurchase shares Resolved that pursuant to the MOI, the Company or any of its subsidiaries are hereby authorised by way of a general
approval, from time to time, to acquire ordinary shares in the share capital of the Company in accordance with the Act and the Listings Requirements, provided that:
(a) the number of its own ordinary shares acquired by the Company in any one financial year shall not exceed 20% of the ordinary shares in issue at the date on which this resolution is passed;
(b) this authority shall lapse on the earlier of the date of the next AGM of the Company or the date 15 months after the date on which this resolution is passed;
(c) the Board has resolved to authorise the acquisition and that the Group will satisfy the solvency and liquidity test immediately after the acquisition and that since the test there have been no material changes to the financial position of the Group;
(d) the acquisition must be effected through the order book operated by the JSE trading system and done without any prior understanding or arrangement between the Company and the counterparty;
(e) the Company only appoints one agent to effect any acquisition(s) on its behalf; (f) the price paid per ordinary share may not be greater than 10% above the weighted average of the market value of
the ordinary shares for the five business days immediately preceding the date on which an acquisition is made; (g) the number of shares acquired by subsidiaries of the Company shall not exceed 10% in the aggregate of the
number of issued shares in the Company at the relevant times; (h) the acquisition of shares by the Company or its subsidiaries may not be effected during a prohibited period, as
defined in the Listings Requirements; and (i) an announcement containing full details of such acquisitions of shares will be published as soon as the Company
and/or its subsidiaries have acquired shares constituting, on a cumulative basis 3% (three percent) of the number of shares in issue at the date of the meeting at which this special resolution is considered and if approved, passed, and for each 3% in aggregate of the initial number acquired thereafter.
3. Special resolution number 3: Conversion of ordinary shares from par value to no par value Resolved that, in terms of Regulation 31 of the Companies Regulations, 2011 (Regulations) issued pursuant to the Act,
the share capital of the Company, comprising 1 000 000 000 (one billion) authorised ordinary shares with a par value of R0.000001 each (of which 874 509 041 ordinary shares having a par value of R0.000001 have been issued), are, without altering the substance of the specific rights and privileges associated therewith, converted into 1 000 000 000 (one billion) authorised ordinary shares having no par value (of which 874 509 041 ordinary shares with no par value have been issued) and that the Memorandum of Incorporation of the Company (MOI) is amended by the deletion of the introductory paragraph to paragraph of 5.1 of the MOI and the replacement thereof with the following paragraph:
“The Company is authorised to issue 1 000 000 000 (one billion) ordinary shares of no par value, and of the same class, each of which ranks pari passu in respect of all rights and shall entitle the holder thereof to the following rights.”
The conversion of the authorised and issued ordinary shares of the Company from par value shares to no par value shares (conversion) shall be implemented on the basis that each ordinary no par value share shall have the same value, rights and privileges as the value, rights and privileges which attached to such share immediately prior to the passing of this special resolution number 3 and that all amounts standing to the credit of the share capital account and the share premium account of the Company be transferred to the stated capital account of the Company.
The resolution of the Board of Directors of the Company (Board) and its report in terms of Regulation 31(7) is included at the end of this notice.
Reason for and effect of this resolutionIn terms of Regulation 31(2), a pre-existing company may not authorise any new par value shares, or shares having a nominal par value, on or after the effective date of the Companies Act (being 1 May 2011). In order to increase the authorised share capital of the Company, the Companies Act therefore requires that the share capital, authorised and issued, of the Company, be converted from pre-existing par value shares to no par value shares. The proposed change does not and will not result in any rights of any existing shareholder being affected.
The effect of special resolution number 3 is to convert the ordinary shares in the Company’s authorised and issued share capital from ordinary par value shares into ordinary shares of no par value.
/ 204
BLUE LABEL INTEGRATED ANNUAL REPORT 2017
4. Special resolution number 4: Increase in authorised share capital Resolved that, subject to the adoption of special resolution number 3 and the filing of special resolution number 3 with
the Companies and Intellectual Property Commission, the authorised ordinary no par value shares of the Company be increased by the creation of a further 1 000 000 000 (one billion) ordinary no par value shares, ranking pari passu in all respects with the existing no par value shares in the authorised ordinary share capital of the Company so as to result in a total of 2 000 000 000 (two billion) ordinary no par value shares in the authorised ordinary share capital of the Company and that the MOI be amended by the deletion in its entirety of the introductory paragraph to paragraph of 5.1 of the MOI (as amended in terms of special resolution number 3) that forms part of the MOI, and the substitution thereof with the following paragraph:
“The Company is authorised to issue 2 000 000 000 (two billion) ordinary shares of no par value, and of the same class, each of which ranks pari passu in respect of all rights and shall entitle the holder thereof to the following rights.”
Reason for and effect of this resolutionThe reason for special resolution number 4 is to increase the authorised share capital of the Company, allowing for the allotment and issue of shares in the Company for possible acquisitions or capital raisings as permitted by the MOI, but subject to the necessary consents and approvals remaining in place and/or to the extent granted in future by shareholders, the JSE or any other regulatory authorities.
The effect of special resolution number 4 is that the Company’s authorised share capital be increased to 2 000 000 000 (two billion) ordinary shares of no par value. The increased share capital will be subject to such consents and approvals as may be required in terms of the MOI or any of the Listings Requirements of the JSE (Listings Requirements) applicable to the Company.
5. Special resolution number 5: Issues of securities Resolved that paragraph 5.6 of the MOI be deleted and replaced with the following new paragraph 5.6 and 5.6A: “5.6 The Board may only authorise the issue of any securities to any person/s
5.6.1 in accordance with the Act and, in particular, with the approval by way of a special resolution of the shareholders of the Company, if required by section 41;
5.6.2 in accordance with the Listings Requirements;
5.6.3 in accordance with this Memorandum of Incorporation and, in particular, any rights specifically conferred on any class of issued securities;
5.6.4 if such securities, being shares, have first been offered to all existing holders of shares of that class of shares (or, if there are no shares of that class in issue, to the ordinary shareholders) in the same proportions as their existing holdings of those shares (or, if there are no shares of that class in issue, of ordinary shares) at a subscription price which (ignoring any commission payable or any discount not exceeding 10% which may be granted instead of such commission) is not higher than the subscription price at which they will be issued to that person/s; provided that the pre-emptive right stipulated in this 5.6.4 shall not apply to any issue of ordinary shares in consideration of the acquisition by the Company of any assets, including any securities in another company or has otherwise been approved in terms of 5.6A. Save as provided for in this 5.6.4 or specifically included as one of the preferences, rights, limitations or other terms upon which any class of shares is issued, no shareholder shall have any pre-emptive or other similar preferential right to be offered or to subscribe for any additional securities issued by the Company.
5.6A The shareholders may in general meeting authorise the Board to issue Company securities at any time and/or grant options to subscribe for Company securities as the Directors in their discretion deem fit; provided that such transaction/s has/have been approved by the JSE and comply/ies with the JSE Listings Requirements.”
Reason for and effect of this resolutionThe reason for and effect of special resolution number 5 is, in line with best practice, to align the MOI with the JSE Listings Requirements and to ensure that the Company has flexibility in managing capital resources by allowing the directors to undertake pro rata issues of shares.
Notice of annual general meeting continued
/ 205
BLUE LABEL INTEGRATED ANNUAL REPORT 2017
6. Special resolution number 6: Fractional entitlements Resolved that paragraph 9 of the MOI be deleted and replaced with the following new paragraph 9: “If, pursuant to any corporate action or event, including any capitalisation issue or rights issue, a holder of a security
would, but for the provisions of this article 9, become entitled to fractions of securities (fractional entitlements), such fractional entitlements shall be dealt with in accordance with the Listings Requirements and any other requirements of the JSE from time to time.”
Reason for and effect of this resolutionThe reason for special resolution number 6 is to align the MOI with the JSE Listings Requirements in relation to fractional entitlements and the effect is to align it.
The Listings Requirements require, in terms of paragraph 11.26, the following disclosures, which appear in the integrated annual report:Major shareholders – refer to pages 198 and 199.
Material change – there were no material changes.
Share capital of the Company – refer to page 156.
Responsibility statement – refer to page 85.
By order of the Board
J van EdenGroup Company Secretary
Sandton23 November 2017
/ 206
BLUE LABEL INTEGRATED ANNUAL REPORT 2017
REPORT OF THE BOARD OF DIRECTORS IN TERMS OF REGULATION 31(7) AND 31(8) OF THE COMPANIES REGULATIONS, 2011 (THE REGULATIONS) REGARDING THE CONVERSION OF THE COMPANY’S SHARE CAPITAL TO NO PAR VALUE SHARES
1. INTRODUCTION 1.1 The Companies Act, No 71 of 2008, as amended (the Companies Act) does not allow for new par value shares or
shares with a nominal value. In terms of the Companies Act and the Companies Regulations, 2011 (the Regulations), companies that already had par value shares may not increase its authorised share capital of par value shares.
1.2 Blue Label Telecoms Limited (BLT) may be required to raise capital from its shareholders to finance acquisitions and the Board of BLT is thus of the view that it should increase its authorised ordinary share capital as only 125 490 959 shares in BLT’s authorised share capital remain unissued.
1.3 In order for BLT to increase its authorised share capital it is required in terms of the Companies Act to first convert its par value shares into shares with no par value.
1.4 In terms of Regulation 31(6) of the Regulations, a company may amend its Memorandum of Incorporation (MOI) to effect a conversion of its authorised and issued par value shares to shares with no par value via a resolution proposed by the Board of Directors after the date on which the Companies Act came into effect and is approved by special resolution adopted by the holders of shares of each such class of shares and a special resolution adopted by a meeting of the members of the Company called for that purpose.
1.5 In terms of paragraph 41.1.2.8 of the MOI BLT may by a special resolution of shareholders convert par value shares into shares of no par value.
1.6 BLT’s shareholders will at its 2017 annual general meeting be asked to pass a special resolution to convert BLT’s authorised and issued ordinary shares of R0.000001 each into ordinary shares of no par value, on the basis that each existing share will be converted into one no par value ordinary share.
1.7 Regulation 31(7) of the Regulations requires the Board of Directors of BLT to compile a report in respect of any resolution to convert any par value shares into no par value shares and this document constitutes such report.
2. REPORT 2.1 In terms of Regulation 31(7) of the Regulations the report is required to, at a minimum: 2.1.1 state all information that may affect the value of BLT’s securities pursuant to the proposed conversion; 2.1.2 identify the class of holders of BLT’s securities affected by the proposed conversion; 2.1.3 describe the material effects that the proposed conversion will have on the rights of the holders of BLT
securities that are affected by the proposed conversion; and 2.1.4 evaluate any material adverse effects of the proposed arrangement against the compensation to those
persons receiving compensation as a result of the conversion. 2.2 Information that may affect the value of the securities affected by the conversion 2.2.1 The rights attaching to the shares after the conversion will be identical to the rights attaching to the shares
prior to the conversion. Accordingly, the Directors of BLT are of the opinion that the conversion will not affect the value of shares.
2.2.2 Pertinent financial information in relation to BLT are detailed in the published financial statements of BLT for the year ended 31 May 2017.
2.2.4 The securities affected by the proposed conversion are the authorised ordinary shares in the share capital of BLT, being one billion authorised shares of R0.000001 each of which 874 509 041 shares have been issued, there being no other securities in the capital of BLT.
2.3 Shareholders affected by the proposed conversion Given that all shares will be converted from par value shares of R0.000001 into shares of no par value, shareholders
will be affected equally by the conversion and on the same terms and conditions. 2.4 Material effects that the proposed conversion will have on the rights of the holders of BLT securities The rights attaching to BLT’s no par value shares will, upon their conversion from par value shares, be identical to the
rights currently attaching to BLT’s par value shares. Accordingly, the conversion will not have any material effects on the rights of shareholders.
2.5 Evaluation of material adverse effects of the proposed conversion against compensation offered The conversion will not have any material adverse effect on any of the BLT shareholders and no shareholders will
receive any compensation pursuant to the conversion.
Notice of annual general meeting continued
/ 207
BLUE LABEL INTEGRATED ANNUAL REPORT 2017
3. CERTIFICATED SHAREHOLDERS Notwithstanding the conversion of authorised ordinary of R0.000001 into authorised ordinary shares of no par value,
certificated shareholders are not required to return their share certificates to BLT and may retain such share certificates which will evidence their title to the no par value shares held by them resulting from the conversion, notwithstanding that such share certificates make reference to shares having a par value. Certificated shareholders are however, reminded that they will not be able to trade such no par value shares on the JSE until these shares have been dematerialised, which may take between 1 (one) and 10 (ten) days, depending on the volumes being processed by Strate at the time.
4. GENERAL In terms of Regulation 31(8)(b) of the Regulations, a copy of this report will be filed at the Companies and Intellectual
Property Commission and at the South African Revenue Services at the same time as this report is published to the shareholders of the Company.
By order of the Board of Directors of Blue Label Telecoms Limited
23 November 2017
/ 208
BLUE LABEL INTEGRATED ANNUAL REPORT 2017
Notice of annual general meeting continued
/ 208
EXPLANATORY NOTESPresentation of the annual financial statementsIn terms of section 61(8)(a) of the Act, the Directors’ report, audited Group and Company annual financial statements for the immediately preceding financial year and the Audit, Risk and Compliance Committee report is to be presented to shareholders at the AGM.
Ordinary resolution numbers 1 to 3 (inclusive): Re-election of DirectorsIn accordance with the MOI, one-third of the Directors are required to retire at each AGM and may offer themselves for re-election. Messrs KM Ellerine, MS Levy and DA Suntup retire by rotation at the AGM in accordance with article 25.17 of the MOI, and have offered themselves for re-election.
Brief biographies of the Directors are on pages 16 and 17.
The Board is satisfied with the performance of each of the Directors standing for re-election and that they will continue to make an effective and valuable contribution to the Company and to the Board.
The Board recommends to shareholders that they should vote in favour of each of the re-election of the Directors referred to in ordinary resolution numbers 1 to 3 (inclusive).
Ordinary resolution number 4: Reappointment of external auditorsIn terms of section 90(1) of the Act, each year at its AGM, the Company must appoint an auditor meeting the requirements of section 90(2) of the Act.
PricewaterhouseCoopers (PwC) expressed its willingness to continue in office and this resolution proposes the reappointment of PwC as the Company’s auditors until the next AGM. In addition, Mr D Storm is appointed as the individual registered auditor for the ensuing year as contemplated in section 90(3) of the Act.
The Audit, Risk and Compliance Committee has satisfied itself that the proposed auditors, PwC and Mr D Storm, are independent of the Company in accordance with sections 90 and 94 of the Act and the applicable rules of the International Federation of Accountants.
The Audit, Risk and Compliance Committee has recommended the reappointment of PwC as independent registered auditor of Blue Label for the 2018 financial year.
Ordinary resolution numbers 5 to 8 (inclusive): Election of Audit, Risk and Compliance Committee membersIn terms of section 94(2) of the Act, each Audit Committee member must be elected by shareholders at its AGM. King IV likewise requires shareholders of a public company to elect each member of an audit committee at an AGM.
In terms of Regulation 42 of the Companies Regulations 2011, relating to the Act, at least one-third of the members of the Company’s Audit, Risk and Compliance Committee at any particular time must have academic qualifications, or experience in economics, law, corporate governance, finance, accounting, commerce, industry, public affairs or human resource management. Each of the proposed members is duly qualified, as is evident from the biographies of each member, as contained on pages 16 and 17.
Ordinary resolution number 9: Directors’ authority to implement ordinary and special resolutionsThe reason for ordinary resolution number 9 is to authorise any Director of the Company to do all things necessary to implement the ordinary and special resolutions passed at the AGM and to sign all such documentation required to give effect and to record the ordinary and special resolutions.
/ 209
BLUE LABEL INTEGRATED ANNUAL REPORT 2017
/ 209
Advisory vote: Endorsement of the remuneration and reward policyKing IV requires a company to put its remuneration and reward policy for a non-binding advisory vote by shareholders at its AGM. This vote enables shareholders to endorse the remuneration policy adopted for Executive Directors. The Blue Label remuneration policy is contained on pages 57 to 59.
The advisory vote is of a non-binding nature only and therefore failure to pass this resolution will not have any legal consequences relating to existing arrangements. However, the Board will take cognisance of the outcome of the vote when considering the Company’s remuneration and reward policy and the remuneration of Executive Directors. In the event that this non-binding advisory endorsement approving the Company’s remuneration and reward policy is voted against by shareholders exercising 25% or more of the voting rights exercised, the Company undertakes to engage with its shareholders.
Special resolution number 1: Non-executive directors’ remunerationSpecial resolution number 1 is proposed to enable the Company to comply with the provisions of sections 65(11)(h), 66(8) and 66(9) of the Act, which stipulate that remuneration to Directors for their services as Directors may be paid only in accordance with a special resolution approved by shareholders.
Special resolution number 2: General authority to repurchase sharesSpecial resolution number 2 seeks to allow the Group, by way of a general authority, to acquire its own issued shares (reducing the total number of ordinary shares of the Company in issue in the case of an acquisition by the Company of its own shares). This resolution is required in order to allow the Company to take advantage of any opportunity that presents itself to enhance shareholder value by repurchasing shares where the Company’s share price is at a level which results in a share repurchase being to the benefit of shareholders. Any decision by the Directors to use the general authority to acquire shares of the Company will be taken with regard to the prevailing market conditions, share price, cash needs of the Group, together with various other factors, and in compliance with the Act, Listings Requirements and the MOI.
Special resolution number 3: Conversion of ordinary shares from par value to no par valueThe Company’s authorised share capital of one billion shares is almost fully issued, with 874 509 041 shares currently being in issue. In order to have adequate authorised share capital for equity future capital raises and/or acquisitions, the Company seeks to increase its authorised shares capital in terms of special resolution number 4. In terms of Regulation 31 of the Act, a company may not increase its authorised capital until it has converted its par value shares to shares of no par value. As such, the Company seeks in terms of special resolution number 3 to convert its current par value shares into shares of no par value.
Special resolution number 4: Increase in authorised share capitalSpecial resolution number 4 is required in order to increase the authorised share capital of the Company, allowing for the allotment and issue of shares in the Company for possible acquisitions or capital raisings as permitted by the MOI, but subject to the necessary consents and approvals remaining in place and/or to the extent granted in future by shareholders, the JSE or any other regulatory authorities.
Special resolution number 5: Issues of securitiesSpecial resolution number 5 is required to align the Company’s MOI with best practice and with the JSE Listings Requirements and to ensure that the Company has flexibility in managing capital resources by allowing the directors to undertake pro rata issues of shares.
Special resolution number 6: Fractional EntitlementsSpecial resolution number 6 is required to align the MOI with the JSE Listings Requirements in relation to fractional entitlements.
/ 210
BLUE LABEL INTEGRATED ANNUAL REPORT 2017
Notice of annual general meeting continued
/ 210
Electronic participation at the AGM(a) Shareholders wishing to participate electronically in the AGM are required to: (i) deliver written notice to the Company at 75 Grayston Drive, corner Benmore Road, Morningside Extension 5, 2196
(marked for the attention of the Group Company Secretary) that they wish to participate via electronic communication at the AGM; or
(ii) register on the Company’s website at www.bluelabeltelecoms.co.za, where a link to the registration page will be placed, by no later than 09:00 on Thursday, 18 January 2018 (electronic notice).
(b) In order for the electronic notice to be valid it must contain: (i) where the Blue Label shareholder is an individual, a certified copy of his/her identity document and/or driving licence
and/or passport; (ii) where the Blue Label shareholder is not an individual, a certified copy of a resolution or letter of representation by the
relevant entity and a certified copy of the identity documents and/or passports of the persons who passed the relevant resolution or signed the relevant letter of representation. The letter of representation or resolution must set out from whom the relevant entity is authorised to represent the entity at the AGM via electronic communication;
(iii) a valid e-mail address and/or facsimile number (contact address/number); and (iv) by no later than 24 (twenty-four) hours before the AGM the Company shall use its reasonable endeavours to notify a
shareholder at its contact address/number of the relevant details through which the shareholder can participate via electronic communication.
(c) Should a shareholder wish to participate in the AGM by way of electronic communication as aforesaid, the shareholder, or his/her/its proxy/ies, will be required to dial-in on the date and commencement time of the AGM. The dial-in facility will be linked to the venue at which the AGM will take place. The dial-in facility will enable all persons to participate electronically in the AGM in this manner (and as contemplated in section 63(2) of the Act) and to communicate concurrently with each other without an intermediary, and to participate reasonably effectively in the AGM. The costs borne by the shareholder or his/her/its proxy/ies in relation to the dial-in facility will be for his/her/its own account.
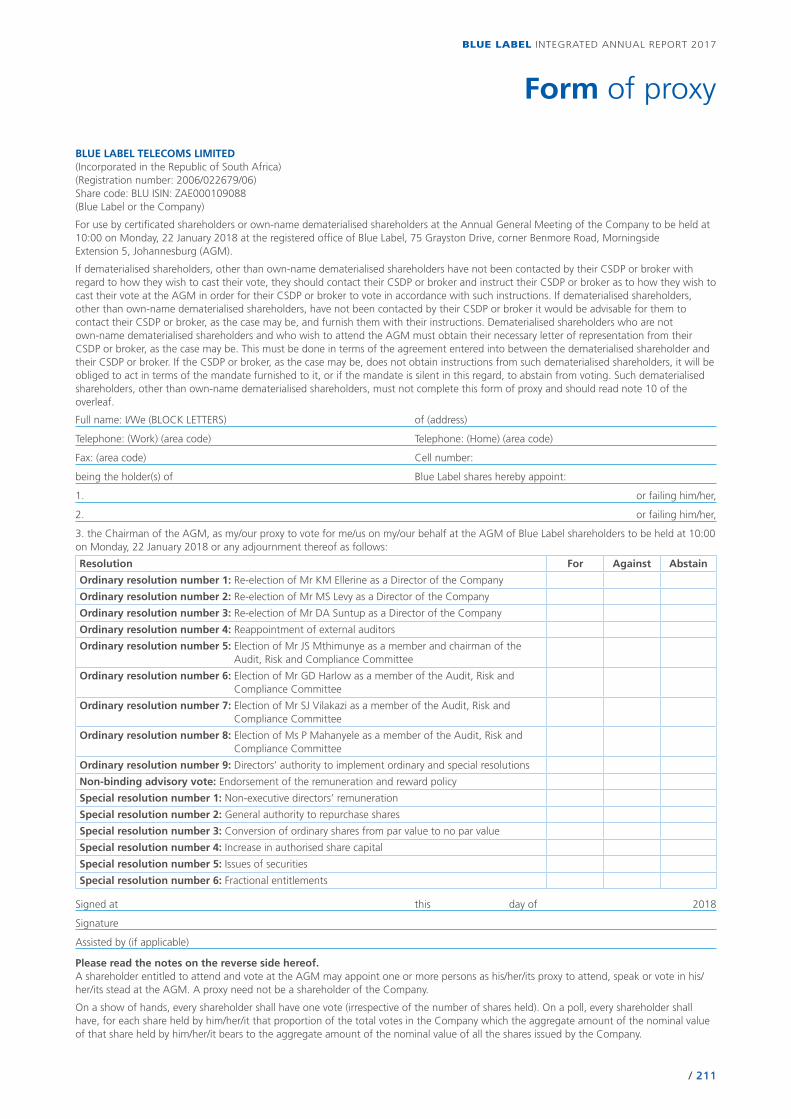
/ 211
BLUE LABEL INTEGRATED ANNUAL REPORT 2017
/ 211
Form of proxy
BLUE LABEL TELECOMS LIMITED(Incorporated in the Republic of South Africa)(Registration number: 2006/022679/06)Share code: BLU ISIN: ZAE000109088(Blue Label or the Company)
For use by certificated shareholders or own-name dematerialised shareholders at the Annual General Meeting of the Company to be held at 10:00 on Monday, 22 January 2018 at the registered office of Blue Label, 75 Grayston Drive, corner Benmore Road, Morningside Extension 5, Johannesburg (AGM).
If dematerialised shareholders, other than own-name dematerialised shareholders have not been contacted by their CSDP or broker with regard to how they wish to cast their vote, they should contact their CSDP or broker and instruct their CSDP or broker as to how they wish to cast their vote at the AGM in order for their CSDP or broker to vote in accordance with such instructions. If dematerialised shareholders, other than own-name dematerialised shareholders, have not been contacted by their CSDP or broker it would be advisable for them to contact their CSDP or broker, as the case may be, and furnish them with their instructions. Dematerialised shareholders who are not own-name dematerialised shareholders and who wish to attend the AGM must obtain their necessary letter of representation from their CSDP or broker, as the case may be. This must be done in terms of the agreement entered into between the dematerialised shareholder and their CSDP or broker. If the CSDP or broker, as the case may be, does not obtain instructions from such dematerialised shareholders, it will be obliged to act in terms of the mandate furnished to it, or if the mandate is silent in this regard, to abstain from voting. Such dematerialised shareholders, other than own-name dematerialised shareholders, must not complete this form of proxy and should read note 10 of the overleaf.
Full name: I/We (BLOCK LETTERS) of (address)
Telephone: (Work) (area code) Telephone: (Home) (area code)
Fax: (area code) Cell number:
being the holder(s) of Blue Label shares hereby appoint:
1. or failing him/her,
2. or failing him/her,
3. the Chairman of the AGM, as my/our proxy to vote for me/us on my/our behalf at the AGM of Blue Label shareholders to be held at 10:00 on Monday, 22 January 2018 or any adjournment thereof as follows:
Resolution For Against Abstain
Ordinary resolution number 1: Re-election of Mr KM Ellerine as a Director of the Company
Ordinary resolution number 2: Re-election of Mr MS Levy as a Director of the Company
Ordinary resolution number 3: Re-election of Mr DA Suntup as a Director of the Company
Ordinary resolution number 4: Reappointment of external auditors
Ordinary resolution number 5: Election of Mr JS Mthimunye as a member and chairman of the Audit, Risk and Compliance Committee
Ordinary resolution number 6: Election of Mr GD Harlow as a member of the Audit, Risk and Compliance Committee
Ordinary resolution number 7: Election of Mr SJ Vilakazi as a member of the Audit, Risk and Compliance Committee
Ordinary resolution number 8: Election of Ms P Mahanyele as a member of the Audit, Risk and Compliance Committee
Ordinary resolution number 9: Directors’ authority to implement ordinary and special resolutions
Non-binding advisory vote: Endorsement of the remuneration and reward policy
Special resolution number 1: Non-executive directors’ remuneration
Special resolution number 2: General authority to repurchase shares
Special resolution number 3: Conversion of ordinary shares from par value to no par value
Special resolution number 4: Increase in authorised share capital
Special resolution number 5: Issues of securities
Special resolution number 6: Fractional entitlements
Signed at this day of 2018
Signature
Assisted by (if applicable)
Please read the notes on the reverse side hereof.A shareholder entitled to attend and vote at the AGM may appoint one or more persons as his/her/its proxy to attend, speak or vote in his/her/its stead at the AGM. A proxy need not be a shareholder of the Company.
On a show of hands, every shareholder shall have one vote (irrespective of the number of shares held). On a poll, every shareholder shall have, for each share held by him/her/it that proportion of the total votes in the Company which the aggregate amount of the nominal value of that share held by him/her/it bears to the aggregate amount of the nominal value of all the shares issued by the Company.
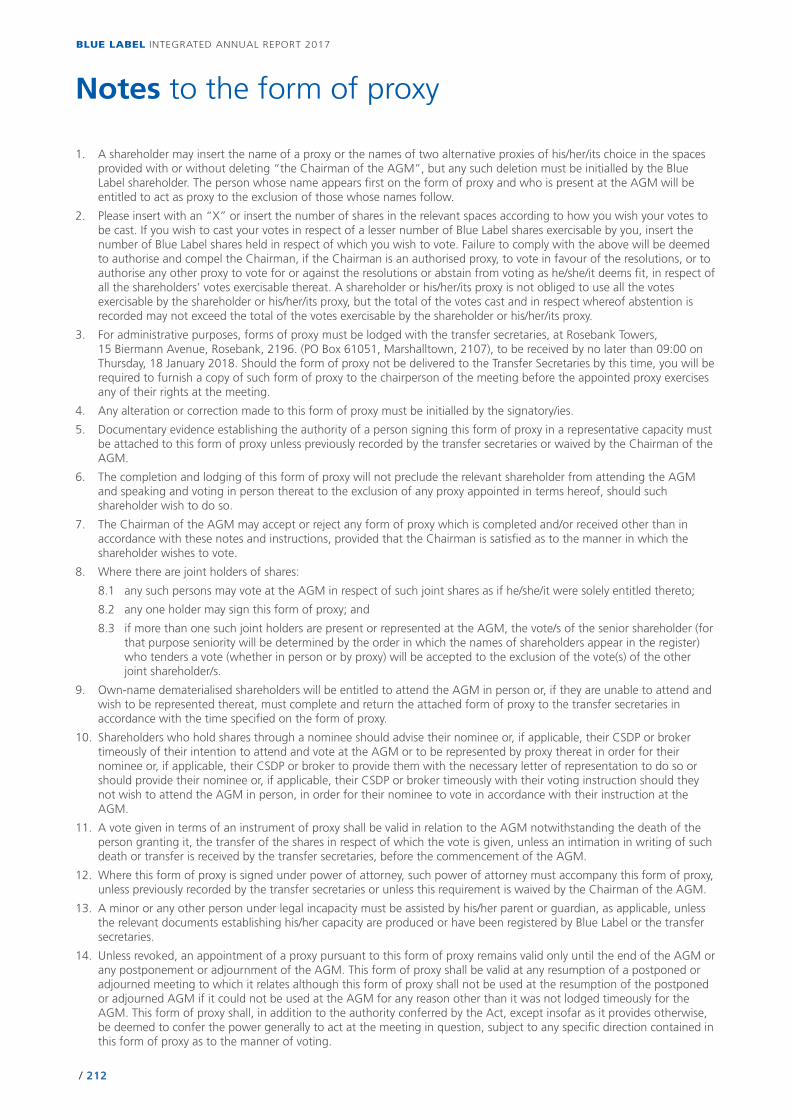
/ 212
BLUE LABEL INTEGRATED ANNUAL REPORT 2017
Notes to the form of proxy
/ 212
1. A shareholder may insert the name of a proxy or the names of two alternative proxies of his/her/its choice in the spaces provided with or without deleting “the Chairman of the AGM”, but any such deletion must be initialled by the Blue Label shareholder. The person whose name appears first on the form of proxy and who is present at the AGM will be entitled to act as proxy to the exclusion of those whose names follow.
2. Please insert with an “X” or insert the number of shares in the relevant spaces according to how you wish your votes to be cast. If you wish to cast your votes in respect of a lesser number of Blue Label shares exercisable by you, insert the number of Blue Label shares held in respect of which you wish to vote. Failure to comply with the above will be deemed to authorise and compel the Chairman, if the Chairman is an authorised proxy, to vote in favour of the resolutions, or to authorise any other proxy to vote for or against the resolutions or abstain from voting as he/she/it deems fit, in respect of all the shareholders’ votes exercisable thereat. A shareholder or his/her/its proxy is not obliged to use all the votes exercisable by the shareholder or his/her/its proxy, but the total of the votes cast and in respect whereof abstention is recorded may not exceed the total of the votes exercisable by the shareholder or his/her/its proxy.
3. For administrative purposes, forms of proxy must be lodged with the transfer secretaries, at Rosebank Towers, 15 Biermann Avenue, Rosebank, 2196. (PO Box 61051, Marshalltown, 2107), to be received by no later than 09:00 on Thursday, 18 January 2018. Should the form of proxy not be delivered to the Transfer Secretaries by this time, you will be required to furnish a copy of such form of proxy to the chairperson of the meeting before the appointed proxy exercises any of their rights at the meeting.
4. Any alteration or correction made to this form of proxy must be initialled by the signatory/ies.
5. Documentary evidence establishing the authority of a person signing this form of proxy in a representative capacity must be attached to this form of proxy unless previously recorded by the transfer secretaries or waived by the Chairman of the AGM.
6. The completion and lodging of this form of proxy will not preclude the relevant shareholder from attending the AGM and speaking and voting in person thereat to the exclusion of any proxy appointed in terms hereof, should such shareholder wish to do so.
7. The Chairman of the AGM may accept or reject any form of proxy which is completed and/or received other than in accordance with these notes and instructions, provided that the Chairman is satisfied as to the manner in which the shareholder wishes to vote.
8. Where there are joint holders of shares:
8.1 any such persons may vote at the AGM in respect of such joint shares as if he/she/it were solely entitled thereto;
8.2 any one holder may sign this form of proxy; and
8.3 if more than one such joint holders are present or represented at the AGM, the vote/s of the senior shareholder (for that purpose seniority will be determined by the order in which the names of shareholders appear in the register) who tenders a vote (whether in person or by proxy) will be accepted to the exclusion of the vote(s) of the other joint shareholder/s.
9. Own-name dematerialised shareholders will be entitled to attend the AGM in person or, if they are unable to attend and wish to be represented thereat, must complete and return the attached form of proxy to the transfer secretaries in accordance with the time specified on the form of proxy.
10. Shareholders who hold shares through a nominee should advise their nominee or, if applicable, their CSDP or broker timeously of their intention to attend and vote at the AGM or to be represented by proxy thereat in order for their nominee or, if applicable, their CSDP or broker to provide them with the necessary letter of representation to do so or should provide their nominee or, if applicable, their CSDP or broker timeously with their voting instruction should they not wish to attend the AGM in person, in order for their nominee to vote in accordance with their instruction at the AGM.
11. A vote given in terms of an instrument of proxy shall be valid in relation to the AGM notwithstanding the death of the person granting it, the transfer of the shares in respect of which the vote is given, unless an intimation in writing of such death or transfer is received by the transfer secretaries, before the commencement of the AGM.
12. Where this form of proxy is signed under power of attorney, such power of attorney must accompany this form of proxy, unless previously recorded by the transfer secretaries or unless this requirement is waived by the Chairman of the AGM.
13. A minor or any other person under legal incapacity must be assisted by his/her parent or guardian, as applicable, unless the relevant documents establishing his/her capacity are produced or have been registered by Blue Label or the transfer secretaries.
14. Unless revoked, an appointment of a proxy pursuant to this form of proxy remains valid only until the end of the AGM or any postponement or adjournment of the AGM. This form of proxy shall be valid at any resumption of a postponed or adjourned meeting to which it relates although this form of proxy shall not be used at the resumption of the postponed or adjourned AGM if it could not be used at the AGM for any reason other than it was not lodged timeously for the AGM. This form of proxy shall, in addition to the authority conferred by the Act, except insofar as it provides otherwise, be deemed to confer the power generally to act at the meeting in question, subject to any specific direction contained in this form of proxy as to the manner of voting.

BLUE LABEL INTEGRATED ANNUAL REPORT 2017
213 /
Glossary
Word Definition
3G Mobile 3G Mobile Proprietary Limited, a private company which procures high end branded mobile handsets for supply to Cell C and major retailers in South Africa and beyond. Its wholly owned subsidiary, Comm Equipment Company (CEC), provides the financing to Cell C for the mobile handset element of postpaid contracts
Act/the Act/Companies Act Companies Act, No 71 of 2008, as amended from time to time
ADRs American Depository Receipts
AEON Blue Label’s proprietary switch through which all transactional capability is accessed. Banking grade transactions are switched through the Postilion platform
AEON EVD The Aeon Electronic Voucher Distribution platform is a central repository in which electronic (or virtual) stock is housed. It is referenced by other internal platforms like EVMS, AMS and AEON
AGM Annual General Meeting
AMS Airtime management system
ARCC Audit, Risk and Compliance Committee
ARPU Average revenue per user
B2B Business-to-business, a commercial transaction between businesses
B2C Business-to-consumer, a commercial transaction between a business and a consumer
B-BBEE Broad-based black economic empowerment
BGCSA Boys & Girls Club of South Africa
BLD Blue Label Distribution Proprietary Limited
BLDS Blue Label Data Solutions Proprietary Limited
BLM Blue Label Mexico S.A. de C.V.
BLT Blue Label Telecoms Limited
Blue Label/Blue Label Telecoms Blue Label Telecoms Limited
Cell C Cell C Proprietary Limited, launched operations in 2001, seven years after the launch of the two incumbents, Vodacom and MTN (launched in 1994)
CEO Chief Executive Officer
CIO Chief Information Officer
CIPC Companies and Intellectual Property Commission
Company Blue Label Telecoms Limited
content aggregator An organisation which gathers web content and applications from different online sources for reuse and resale
CPA Consumer Protection Act
CRC Customer relation consultant
CRM Customer relationship management
CSDP Central Securities Depository Participant
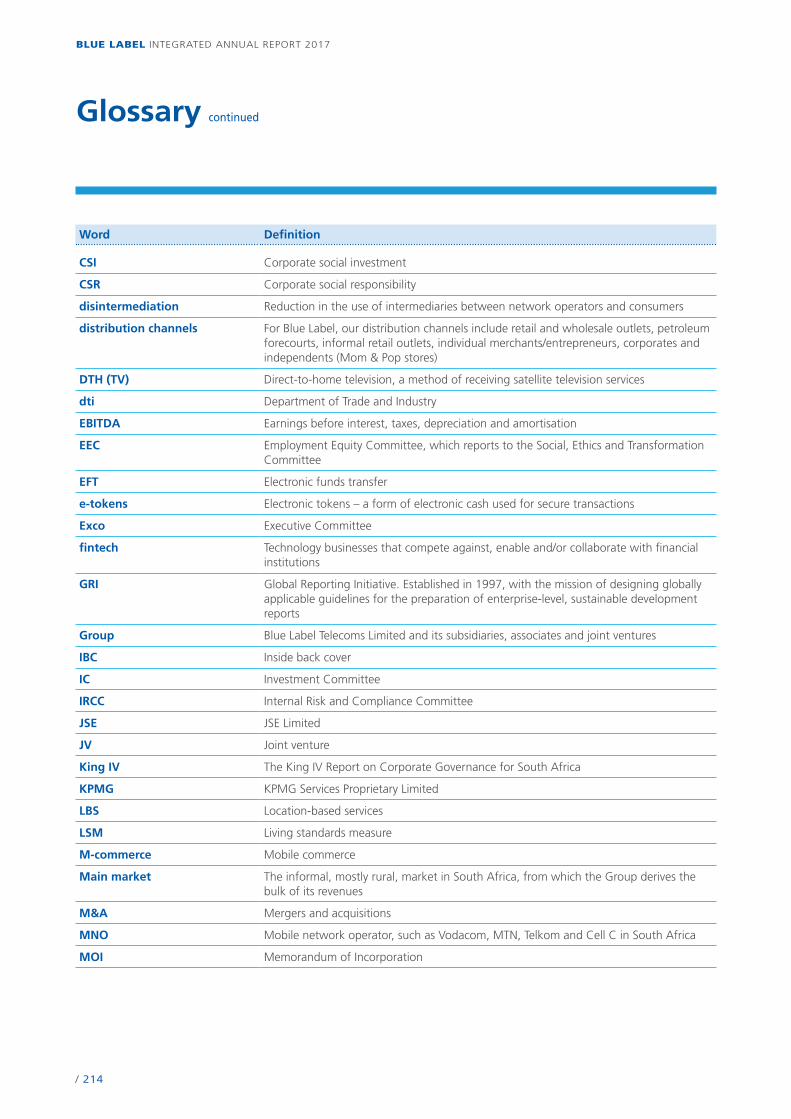
BLUE LABEL INTEGRATED ANNUAL REPORT 2017
/ 214
Glossary continued
Word Definition
CSI Corporate social investment
CSR Corporate social responsibility
disintermediation Reduction in the use of intermediaries between network operators and consumers
distribution channels For Blue Label, our distribution channels include retail and wholesale outlets, petroleum forecourts, informal retail outlets, individual merchants/entrepreneurs, corporates and independents (Mom & Pop stores)
DTH (TV) Direct-to-home television, a method of receiving satellite television services
dti Department of Trade and Industry
EBITDA Earnings before interest, taxes, depreciation and amortisation
EEC Employment Equity Committee, which reports to the Social, Ethics and Transformation Committee
EFT Electronic funds transfer
e-tokens Electronic tokens – a form of electronic cash used for secure transactions
Exco Executive Committee
fintech Technology businesses that compete against, enable and/or collaborate with financial institutions
GRI Global Reporting Initiative. Established in 1997, with the mission of designing globally applicable guidelines for the preparation of enterprise-level, sustainable development reports
Group Blue Label Telecoms Limited and its subsidiaries, associates and joint ventures
IBC Inside back cover
IC Investment Committee
IRCC Internal Risk and Compliance Committee
JSE JSE Limited
JV Joint venture
King IV The King IV Report on Corporate Governance for South Africa
KPMG KPMG Services Proprietary Limited
LBS Location-based services
LSM Living standards measure
M-commerce Mobile commerce
Main market The informal, mostly rural, market in South Africa, from which the Group derives the bulk of its revenues
M&A Mergers and acquisitions
MNO Mobile network operator, such as Vodacom, MTN, Telkom and Cell C in South Africa
MOI Memorandum of Incorporation
BLUE LABEL INTEGRATED ANNUAL REPORT 2017
215 /
Word Definition
money remittances The ability to transfer money to another individual without a bank account
NAV Net asset value
NC Nomination Committee, part of the Remuneration and Nomination Committee
NERA National Empowerment Rating Agency
NPCI National Payments Corporation of India, the national transactions switch
NQF National Qualifications Framework, the system that records levels of learning activities
Oxigen/Oxigen India Oxigen Services (India) Private Limited
Oxigen Online Oxigen Online Services (India) Private Limited
physical prepaid airtime Prepaid vouchers that are available as physical items
PINless top-up E-token recharge directly to mobile phone via a POS device
POP Points of presence
POPI Protection of Personal Information Act
POS Point of sale, usually a place or a device
PowerPin voucher Offline prepaid electricity top-up, consolidates the purchase of prepaid electricity across national municipalities
PwC PricewaterhouseCoopers Inc.
Reware Reware is a distributor of certified pre-owned smartphones
RC Remuneration Committee, part of the Remuneration and Nomination Committee
RNC Remuneration and Nomination Committee
SAICA South African Institute of Chartered Accountants
SBI State Bank of India
SED Socio-economic development
SHEQ Safety, Health, Environment and Quality
SIM card Subscriber identification module card
SMS Short message service
spaza shop An informal convenience outlet
SRI Index Socially Responsible Investment Index
SSETA Services Sector Education and Training Authorities
TJ Transaction Junction Proprietary Limited
touch points Devices through which consumers are able to purchase Blue Label products and services
TPC The Prepaid Company Proprietary Limited
transactional services Includes money transfers, payments of bills and the like
unbanked People without bank accounts

BLUE LABEL INTEGRATED ANNUAL REPORT 2017
/ 216
Glossary continued
Word Definition
underbanked/badly banked People with poor access to mainstream financial services, such as banks and therefore rely on alternative financial services or alternatively people with bank accounts who do not make effective use of the broader services offered by the bank – they merely deposit and withdraw cash from their accounts
UniPIN Universal PIN for prepaid electricity
USSD Unstructured supplementary service data
value added Measure of wealth the Group has created in its operation by “adding value” to the cost of products and services
VAS Value-added services
Viamedia Viamedia Proprietary Limited
virtual distributor Distribution of e-tokens of value in electronic format
virtual prepaid airtime Airtime top-up in an electronic format
WAP Wireless application protocol
WASP Wireless application service provider
WASPA Wireless Application Service Providers Association

BLUE LABEL INTEGRATED ANNUAL REPORT 2017
Administration
DirectorsLM Nestadt (Chairman)*, BM Levy, MS Levy, KM Ellerine**, GD Harlow*, P Mahanyele* (appointed 1 September 2016), Y Mohamed (resigned 11 January 2017), JS Mthimunye*, DA Suntup, SJ Vilakazi** Independent non-executive** Non-executive
Company SecretaryJ van Eden
SponsorInvestec Bank Limited
Commercial BankerFirst National Bank
External auditorPricewaterhouseCoopers Inc.
Internal auditorKPMG Services Proprietary Limited
American Depository Receipt (ADR) ProgrammeCusip number: 095648101Ticker name: BULBYADR to ordinary share: 1:10Depository: BNY Mellon 101 Barclay StreetNew York NY 10286 USA
Blue Label Telecoms Limited(Incorporated in the Republic of South Africa)Registration number 2006/022679/06
Registered address: 75 Grayston Drive, Corner Benmore Road, Morningside Ext 5, Sandton, 2196Postal address: PO Box 652261, Benmore, 2010Contacts: +27 11 523 3000/[email protected]/www.bluelabeltelecoms.co.zaLinkedIn: Blue Label TelecomsFacebook: www.facebook.com/BlueLabelTelecomsTwitter: @BlueLabelTelecoInstagram: bluelabeltelecomsYoutube: Blue Label Telecoms
JSE Share codeBLU
ISINZAE000109088(Blue Label or BLT or the Company or the Group)

www.bluelabeltelecoms.co.za
BL
UE
LA
BE
L IN
TE
GR
AT
ED
AN
NU
AL
RE
PO
RT
20
17