Blue Hen State Bird zzzz Peach Blossom State Flower State ...

2016 ANNUAL REPORT
1/1/2016 – 12/31/2016
Blue Hen Investment Club

INTRODUCTIONS
PresidentJoshua Carruthers
SeniorFinance & Economics
Executive Board
Vice PresidentColin Miller
SeniorFinance & Accounting
Portfolio StrategistTheodore Walker
SeniorFinance
Economic StrategistMichael McCormick
SeniorFinance & Accounting
OperationsJack Benotti
JuniorFinance

INTRODUCTIONS
Organizational Chart
Consumer Discretionary Consumer Staples Energy & Utilities Financials
A.J. Smiley & Joe Schwab Justin Ferrarie & Matthew Gordon Jack Benotti Joshua Stern & Timothy Friedmann
Analysts Analysts Analysts AnalystsCarter Compello Anthony Manno Frank Haendel Tony Liu
Ryan Fante Zachary Weisel Matthew Renzi Alexander FishSamantha Besold Allie Trimble Andrew Tom Amanda Sluzewski
Kristen Rossi Kody Clark James HamoryAndrew Sargent Jack Hoffman
Healthcare Industrials & Materials IT & Telecomm
Jake Fertell & Jake Perrone Rory Smith & Ryan O’Donnell S.J. Desai & Rees Tillotson
Analysts Analysts AnalystsHannah Crismon Fletcher Comrie Colt Armstrong
Luke Malone Brandon Zenick Markus KoenigerRoy Geng Thomas Burkhart Ryan BondWill Visser Alan Concha Trey Brunson
Courtney Zozulia Joe Colontonio

TABLE OF CONTENTS
New Developments
Portfolio Performance
Investment Highlights
6
13
22
Future Initiatives 29

Future Initiatives
TABLE OF CONTENTS
New Developments
Portfolio Performance
Investment Highlights
6
13
22
29

NEW DEVELOPMENTS
AMT Financial Modeling• Leading investment banking & private equity training firm
− Provides training programs for Credit Suisse, Deutsche Bank, Mizuho, Goldman Sachs, etc
• Two 8-hour sessions led by former Goldman Sachs banker− Accounting Fundamentals− Integrated Financial Model Standards− Valuation Fundamentals− Trading Comparables− DCF Analysis

NEW DEVELOPMENTS
Portfolio Management Committee• Committee was created to streamline portfolio oversight and performance reporting
− Comprised of an analyst from each sector− Analysts contribute to performance analysis through weekly and quarterly reports
• Performance Reporting:− Quarterly reports discuss trends in the capital markets, sector highlights, and the overall performance
of the portfolio − Introduction of weekly reports to cover recent news, position returns, and an overview of the
portfolio’s performance
• Portfolio Oversight:− An alert system was established for each holding based on price target− Committee analysts update sector heads on position movements relative to established price targets

NEW DEVELOPMENTS
Benchmark-Weighted Strategy• New strategy implemented to focus on generating alpha through stock-selection, rather than
sector asset allocation• Previous allocation strategy was ineffective:
− Sector allocation decisions were conducted with much less research than equity selection− Most sector allocation divergences were too insignificant to provide allocation-based returns − A benchmark-weighted strategy falls in line with the club’s traditional “bottom-up” investment
approach

NEW DEVELOPMENTS
Charitable Grant Committee• Grant Committee established to provide financial backing to University of Delaware
Registered Students Organizations• No more than 2% of the portfolio’s trailing three-year average value can be distributed in a
given year− No minimum amount of capital required to be donated− Grants are to be reassessed each year
• RSO’s and Non-Profits apply and interview through a formalized procedure− Distribution decisions made by the Committee− Semester reporting is mandated and made available to all club members
• 2017 YTD, the Grant Committee has already extended $12,000 in donations− Organizations: UDance, Engineers Without Borders, Honors Engaging in Neighborhood Service

NEW DEVELOPMENTS
Recruitment Success• Increased networking abilities have led to greater job placement
− Club members continue to build a professional network through the use of LinkedIn, cold-emailing, and various other networking mediums
− Use of BHIC resources such as interview guides, email templates, and resume/cover letter guides
• Alumni speakers at club meetings continue to benefit members− Provide insight into different industries and career paths of previous graduates− Speakers this fall included a BlackRock portfolio manager, private derivatives trader for Diamond
Carter Trading, and a partner at Greyrock Capital Group

NEW DEVELOPMENTS
Career & Internship Placement
Position Name Placement Division LocationsPresident Joshua Carruthers Mizuho Securitization New York, NYVice President Colin Miller Mizuho Acquisition Finance New York, NYPortfolio Strategist Theodore Walker Marshall & Stevens Structured Finance New York, NYHealthcare Jake Fertell Hamilton Lane Private Equity Philadelphia, PAEnergy & Utilities Frank Haendel Bank of America Corporate Finance Wilmington, DEFinancials Joshua Stern Franklin Templeton Asset Management New York, NYInformation Technology Colt Armstrong Northwestern Mutual Financial Planning King of Prussia, PAInformation Technology Ryan Bond Morgan Stanley Wealth Management Greenspring, MDInformation Technology Trey Brunson Grant Thornton Advisory Alexandria, VA
Operations Jack Benotti Mizuho Credit Risk New York, NYOperations (hiatus) Hayley TenHoopen KPMG Advisory New York, NYEnergy & Utilities Andrew Tom Deloitte Advisory New York, NYIndustrials & Materials Alan Concha Merril Lynch Wealth Management New York, NYHealthcare Hannah Crismon Vanguard Asset Management Malvern, PAConsumer Discretionary Kristen Rossi J.P Morgan Corporate Finance Newark, DEFinancials Alexander Fish J.P Morgan Asset Management Newark, DEInformation Technology S.J. Desai PwC Advisory New York, NYConsumer Discretionary Andrew Sargent Urban Outfitters Corporate Finance Philadelphia, PAFinancials Jack Hoffman Boston Financial Management Asset Management Boston, MAEnergy & Utilities Matthew Renzi Suntrust Robinson Humphreys Investment Banking Atlanta, GAHealthcare Roy Geng Protiviti Risk New York, NYFinancials Amanda Sluzewski Bloomberg Data Analytics Princeton, NJConsumer Discretionary Samantha Besold J.P Morgan Treasury Services New York, NY
Full Time Placement
Internship Placement

Future Initiatives
TABLE OF CONTENTS
New Developments
Portfolio Performance
Investment Highlights
6
13
22
29

PORTFOLIO PERFORMANCE
BHIC vs. S&P 500
6.3%
11.9%
-10.0%
-5.0%
0.0%
5.0%
10.0%
15.0%
Beg Jan January February March April May June July August September October November December
BHIC S&P500

PORTFOLIO PERFORMANCE
Monthly Returns vs. S&P 500
-6.7%
-0.1%
7.0%
-0.4%
1.0%
-0.7%
3.7%
0.7%
-0.6%
-2.4%
3.5%
1.8%
-5.0%
-0.1%
6.8%
0.4%
1.8%
0.3%
3.7%
0.1% 0.0%
-1.8%
3.7%
2.0%
-8.0%
-6.0%
-4.0%
-2.0%
0.0%
2.0%
4.0%
6.0%
8.0%
January February March April May June July August September October November December
BHIC S&P 500

PORTFOLIO PERFORMANCE
Sector Performance vs. S&P 500
2.7%
0.8%
6.2%
21.2%
-9.9%
-3.7%
12.2%
5.9%
5.4%
23.9%
18.2%
-2.8%
18.0%
14.9%
-15.0% -10.0% -5.0% 0.0% 5.0% 10.0% 15.0% 20.0% 25.0% 30.0%
Consumer Discretionary
Consumer Staples
Energy & Utilities
Financials & Real Estate
Health Care
Industrials & Materials
IT & Telecomm
S&P 500 BHIC
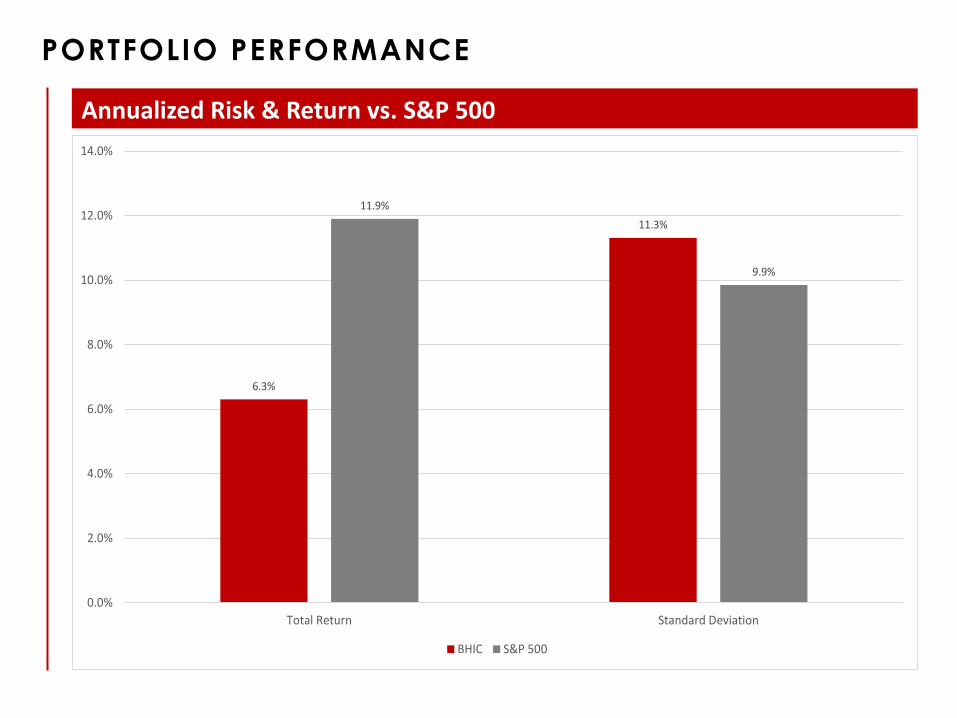
PORTFOLIO PERFORMANCE
Annualized Risk & Return vs. S&P 500
6.3%
11.3%11.9%
9.9%
0.0%
2.0%
4.0%
6.0%
8.0%
10.0%
12.0%
14.0%
Total Return Standard Deviation
BHIC S&P 500

PORTFOLIO PERFORMANCE
Sharpe Ratio & Alpha vs. Large Cap Value Fund Peers
0.00
0.20
0.40
0.60
0.80
1.00
1.20
1.40
1.60
Sharpe Ratio
BHIC Sharpe: .53
-1.00
-0.80
-0.60
-0.40
-0.20
0.00
0.20
0.40
Alpha
BHIC Alpha: -.56
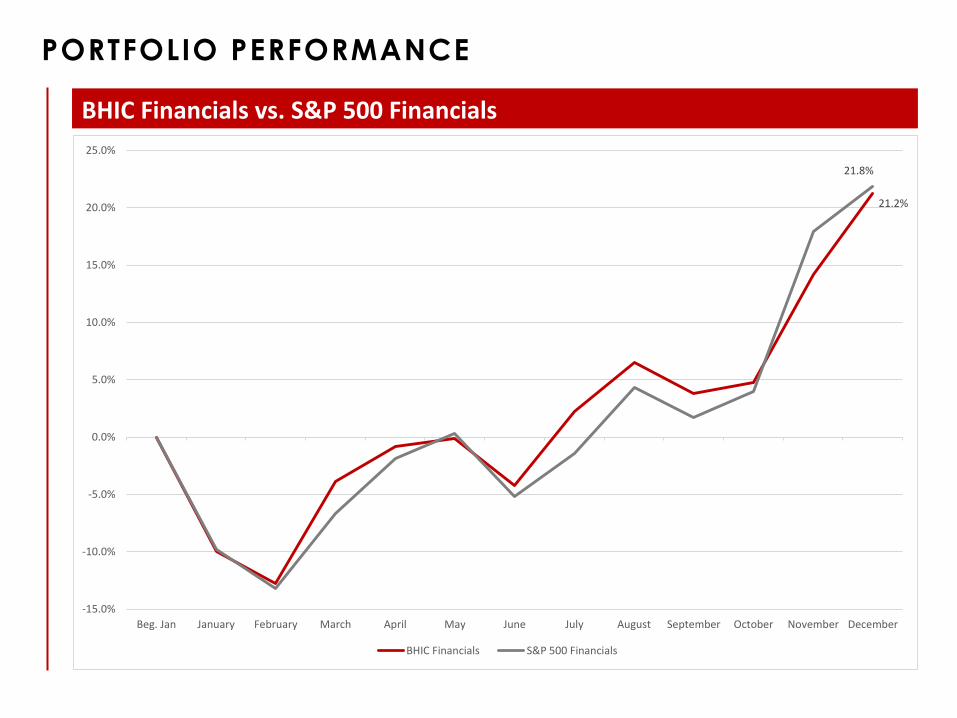
PORTFOLIO PERFORMANCE
BHIC Financials vs. S&P 500 Financials
21.2%
21.8%
-15.0%
-10.0%
-5.0%
0.0%
5.0%
10.0%
15.0%
20.0%
25.0%
Beg. Jan January February March April May June July August September October November December
BHIC Financials S&P 500 Financials

PORTFOLIO PERFORMANCE
BHIC Health Care vs. S&P 500 Health Care
-9.9%
-2.8%
-12.0%
-10.0%
-8.0%
-6.0%
-4.0%
-2.0%
0.0%
2.0%
4.0%
6.0%
8.0%
Beg. Jan January February March April May June July August September October November December
BHIC Healthcare S&P 500 Healthcare

PORTFOLIO PERFORMANCE
Portfolio P/E Ratio & Dividend Yield
20.0
20.9
14.0
15.0
16.0
17.0
18.0
19.0
20.0
21.0
22.0
January February March April May June July August September October November December
BHIC S&P 500
2.5%
2.1%2.0%
2.2%
2.4%
2.6%
2.8%
3.0%
January February March April May June July August September October November December
BHIC S&P 500

TABLE OF CONTENTS
New Developments
Portfolio Performance
Investment Highlights
6
13
22
Future Initiatives 29

INVESTMENT HIGHLIGHTS
Strategy & Summary Statistics
MetricsNumber of Holdings 33
Holdings Outside Benchmark 17
Avg. Position Size 3.1%
Avg. Market Capitalization ($B) 79.4
Management Fee 0.0%
• Increase position concentration− Reduction from 43 holdings
• Increased emphasis on competitive advantage
− Story, catalysts, pricing
• Smarter capital allocation
− Attention to position entry and exit

INVESTMENT HIGHLIGHTS
Position Analysis – Largest Holdings
Weight Dividend Yield
Market Cap. ($B) P/E Ratio 3yr. Rev.
GrowthAnnual Return
4.6% 3.3% $1.5 13.6 10.7% 31.6%
4.5% 1.9% $608.7 14.1 9.0% 12.5%
4.2% 3.7% $197.1 16.4 .90% 4.5%

INVESTMENT HIGHLIGHTS
Position Analysis – Top & Bottom Equity Contributions
1.1% 1.1%
0.6%
-0.7%
-0.9%-1.0%
-1.5%
-1.0%
-0.5%
0.0%
0.5%
1.0%
1.5%
Dick's Sporting Goods Maiden Holdings Wal-Mart CVS United Rentals Gilead Sciences

INVESTMENT HIGHLIGHTS
• Sector: Financials
• Company Description: Investment Banking & Advisory Services
• Investment Update:− Purchased in November, 2014 citing accelerating revenue growth, strong management, and a global
environment warming to the usage of M&A and advisory services
− Traded relatively flat since purchase, but speculation over financial services deregulation post election, significantly increased valuation
− Profits realized after a sharp run up in financials following Trump’s election
Top Performers: Evercore Partners +29.5%
40
45
50
55
60
65
70
75
January February March April May June July August September October November December
Position Sold: $65.55

INVESTMENT HIGHLIGHTS
• Sector: Health Care• Company Description: Biotechnology• Investment Update:
− Weakening demand for core product segment − Significant future expenses as Myriad builds its molecular diagnostic tests business− Margin contraction resulting from recent acquisitions and new product commercialization;
management expectations of 30% operating margin by 2020 appear unrealistic− Increased pricing pressure on Biotechnology and Health Care in general
Worst Performers: Myriad Genetics -46.2%
10
15
20
25
30
35
40
45
January February March April May June July August September October November December
Position Sold: $20.10

INVESTMENT HIGHLIGHTS
ETF Picks: Regional Banking & Information Technology
30
35
40
45
50
55
60
January February March April May June July August September October November December
Regional Banking ETF
Position Exited: $50.63
Position Entered: $41.16
38
40
42
44
46
48
50
January February March April May June July August September October November December
Information Technology ETF

TABLE OF CONTENTS
New Developments
Portfolio Performance
Investment Highlights
6
13
22
Future Initiatives 29

FUTURE INITIATIVES
Cross Sector & Macroeconomic Workshops• Introduce workshop series in which sectors will present an overview of their sector in front
of the club− Series will educate analysts on macroeconomic drivers and how they apply to particular sectors, key
players, recent news, and valuation highlights − Presentations will include discussions on the effects of macroeconomic shifts on particular sectors

FUTURE INITIATIVES
Sector Head Education• Provide educational training to sector heads covering topics: delegation, communication,
accountability, and various technical skills− Technical skills will be focused on developing strategies to increase analysts’ accounting, research,
and valuation capabilities− Increased sector head education will improve analysts’ ability to participate in the pitch process
• Create a platform from which analysts can provide both formal and informal feedback to their sector heads

CONCLUSION
The fund’s performance in 2016 was disappointing. Goingforward, more attention will be given towards generatingreturns through an selection-based investment strategy. Wehope to generate large selection-based returns in years tocome.
We are very pleased with the changes that have taken placethis year that will greatly enhance the fund experience. Weexpect both performance and quality of analysis to increase.
The fund has evolved so much just in the past year in terms oftalent, structure, and research. We are highly optimistic abouthow these changes will translate into returns in the future.
Fund Performance
OrganizationalDevelopments
Future Outlook