
bls_employnews_196903.pdf
9
NEWS U.S. DEPARTMENT OF LABOR OFFICE OF INFORMATION, WASHINGTON, D. C. 20210 USDL - 10-371 Bureau of Labor Statistics (202) 961-2531 FOR RELEASE: ll:OO A.M. Tuesday, April 8, 1969 THE EMPLOYMENT SITUATION: MARCH 1969 Employment rose moderately in March, while the number of unemployed persons fell less than usual for the month, the U. S. Department of Labor1 s Bureau of Labor Statistics reported today. The March increase in nonfarm payroll employment was the smallest in 6 months0 Employment increases were recorded in all major industry sectors except contract construction. The overall unemployment rate was 30 4 percent in March, compared with the 3. 3 percent rates recorded in the past 3 months. The change was attributable to a small advance in teenage unemployment. Unemployment rates for adult workers remained at their low February levels. Industry Employment Nonagricultural payroll employment was 69. 2 million in March. After seasonal adjustment, payroll employment was up 145, 000 from February, with about 30, 000 of the increase due to the net return to payrolls of striking workers. The employment increase was slightly less than half the average seasonally-adjusted gain registered in the past 5 months but was about the same as during most of last year. Employment in contract construction rose less than seasonally for the February-to-March period but was at the highest March level since 1966 (3.1 million). On a seasonally adjusted basis, construction employment declined by 65, 000 in March, following a very large increase of 110, 000 in February. Manufacturing employment increased by 65,000 in March after seasonal adjustment. The largest increases occurred in the transportation equipment and petroleum products industries, almost entirely as a result of the return to payrolls of striking workers. Small over-the-month gains were recorded in several other manufacturing industries, mainly primary metals, fabrica- ted metals, electrical equipment, and apparel. Digitized for FRASER http://fraser.stlouisfed.org/ Federal Reserve Bank of St. Louis
Transcript of bls_employnews_196903.pdf
NEWS U . S . D E P A R T M E N T OF LABORO F F I C E OF I N F O R M A T I O N , W A S H I N G T O N , D. C. 2 0 2 1 0
USDL - 10-371Bureau of Labor Statistics(202) 961-2531
FOR RELEASE : ll:OO A .M .Tuesday, A p r i l 8, 1969
THE E M P L O Y M E N T S ITUATION : M ARCH 1969
Employment rose m oderate ly in March, while the number of unemployed
persons fe l l less than usual fo r the month, the U. S. Department of L a b o r1 s
Bureau of Labor Statistics reported today.
The March increase in nonfarm payro ll employment was the sm allest in 6 months0 Employment increases were recorded in a ll m a jor industry sectors except contract construction.
The overa ll unemployment rate was 30 4 percent in March, compared with the 3. 3 percent rates recorded in the past 3 months. The change was attributable to a small advance in teenage unemployment. Unemployment rates fo r adult w orkers remained at their low February le ve ls .
Industry Employment
Nonagricultural payro ll employment was 69. 2 m ill ion in March. A fte r seasonal adjustment, payro ll employment was up 145, 000 from February , with about 30, 000 of the increase due to the net return to payro lls of striking w orkers . The employment increase was slightly less than half the average seasonally-adjusted gain reg is te red in the past 5 months but was about the same as during most of last year.
Employment in contract construction rose less than seasonally fo r the F eb ru a ry -to -M arch period but was at the highest March le ve l since 1966 (3.1 m i l l io n ) . On a seasonally adjusted basis, construction employment declined by 65, 000 in March, fo llow ing a v e ry la rge increase of 110, 000 in February.
Manufacturing employment increased by 65,000 in M arch after seasonal adjustment. The la rges t in creases occurred in the transportation equipment and petroleum products industries, almost en tire ly as a resu lt of the return to payro lls of striking w orkers . Small over-the-m onth gains w ere recorded in severa l other manufacturing industries, main ly p r im ary m etals, fa b r ica ted m etals, e le c tr ic a l equipment, and apparel.
Digitized for FRASER http://fraser.stlouisfed.org/ Federal Reserve Bank of St. Louis
- 2 -
Employment in government rose by 55, 000 in M arch after seasonal adjustment; all of the gain occurred in the State and loca l sector. E m p loyment in se rv ices increased by 20, 000, s lightly m ore than one-third of the average gain reg is te red during the past 5 months. Increases also occurred in transportation and public utilities (30, 000), where about one-third of the increase was due to the net return to work of s tr ikers ; trade (30, 000); and finance, insurance, and rea l estate (10,000).
Over the year, payro ll employment was up by 2. 5 m illion . Four-f i fths of the increase resulted from nearly equal gains in manufacturing, trade, se rv ices , and government.
Hours and Earnings
The seasonally adjusted workweek in manufacturing was up 0. 5 hour to 40. 6 hours in March. This represented a re co ve ry from the sharp drop in February (to 40. 1 hours, as r e v is e d ) , which was attributable to adverse weather conditions in the Northeast region of the country. Despite the rebound, the March workweek in manufacturing was still half an hour low er than the 1968 peak in September. Factory overt im e, which also fe l l in February, continued in the high range which has preva iled since May 1968, r is ing two-tenths of an hour in March to 3. 7 hours.
The average workweek fo r all rank and f i le w orkers on nonagricultural payro lls edged up to37.7hours (seasonally adjusted) but remained below the le ve ls recorded in the M ay-Septem ber 1968 period. The large increase in the manufacturing workweek, along with slight gains in trade and finance, m ore than offset over-the-m onth declines in construction and mining.
A verage hourly earnings rose 1 cent in M arch to $2. 98 fo r all rank and f i le w orkers . Compared with M arch 1968, hourly earnings were up 19 cents, or 6.8 percent. A verage weekly earnings, at $111.75, increased by 97 cents over the month, re f lec t ing small increases in both the average workweek and hourly earnings. Compared with M arch 1968, weekly ea rn ings rose by $6. 85 (6. 5 percent) .
U nemployme nt
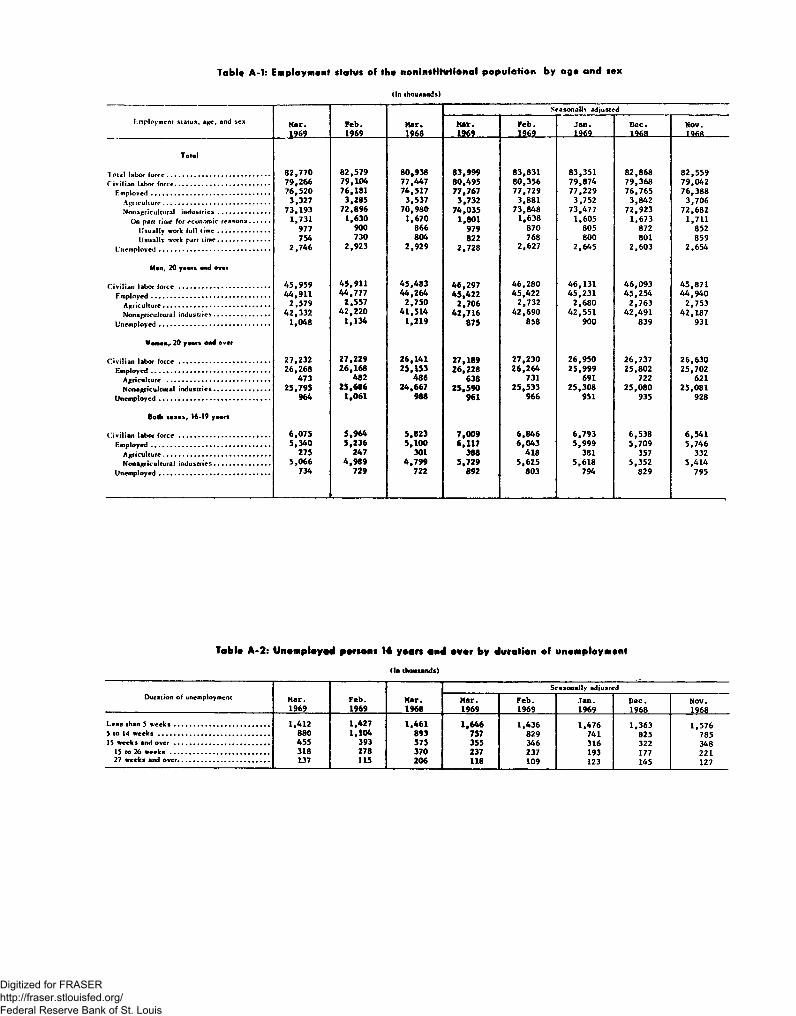
Unemployment in March, at 2. 7 m illion , was down 175,000 from F eb ru a ry - - le s s than the usual seasonal decline for the month. A fte r seasonal adjustment, unemployment rose 100, 000 over the month, p r i m ar i ly among teenagers.
The ove ra l l unemployment rate in M a rc h - -3. 4 percen t--w ks v ir tua lly unchanged from the 3. 3 percent rates of D ecem ber, January^,—and February, which were the lowest job less rates in over 15 yea rs .
Digitized for FRASER http://fraser.stlouisfed.org/ Federal Reserve Bank of St. Louis
- 3 -
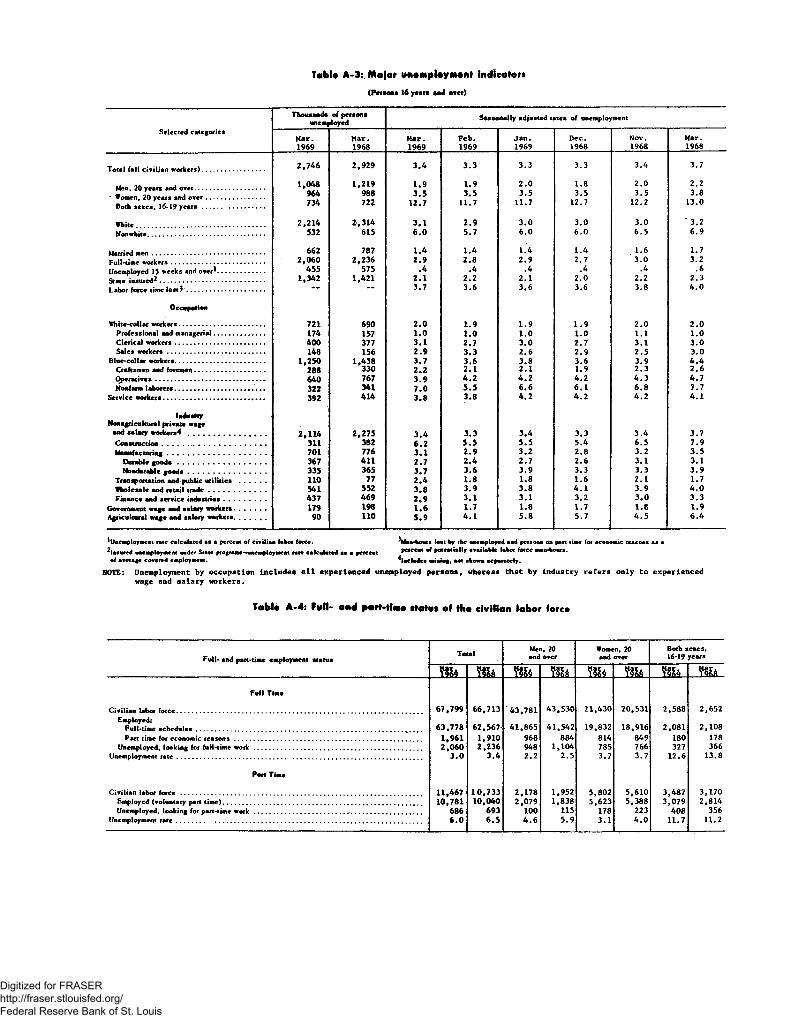
The unemployment rate for adult men rem ained at 1*9 percent in March, near the record low of 1.8 percent reached in Decem ber 1968. The rate fo r adult women held steady at 3. 5 percent fo r the fifth straight month* the lowest in 15 years . The unemployment rate fo r fu ll- t im e w orkers was essentia lly unchanged at 2.9 percent, while the rate fo r m a rr ied men continued at 1.4 percent, its lowest point since that se r ies began in 1955.
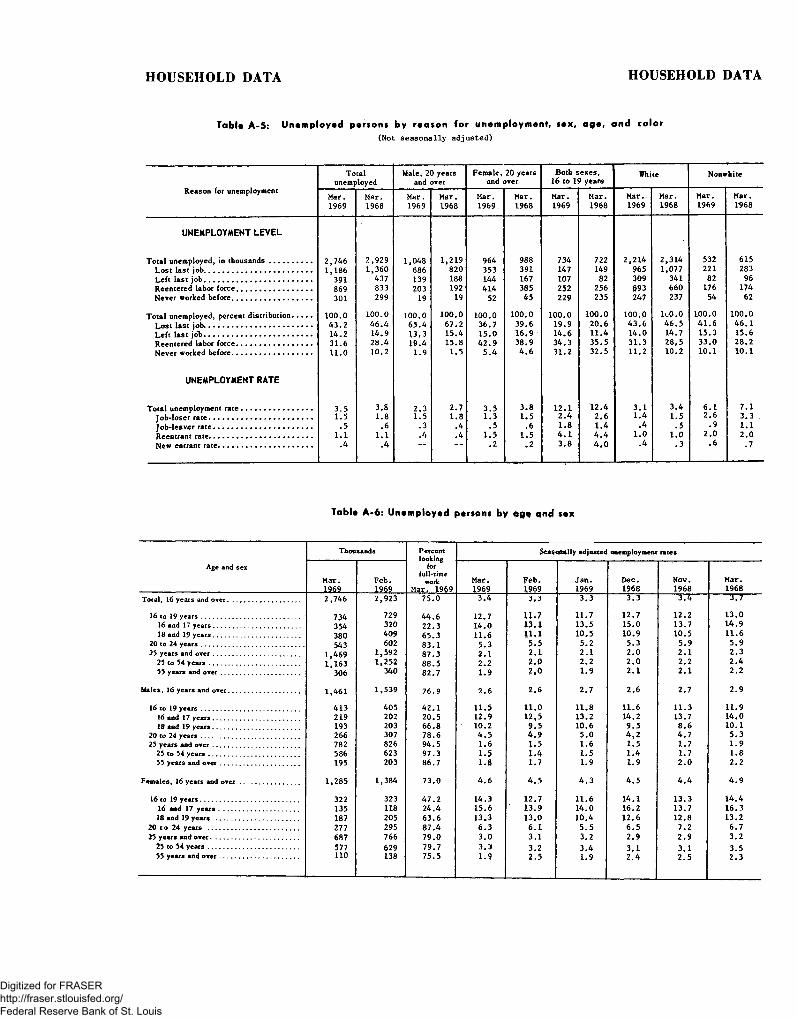
Unemployment among teenage w orkers rose slightly in March, as employment gains fa iled to match the increase in their labor fo rce . Their job less rate was 12. 7 percent, the same as in Decem ber but up from 11.7 percent in both January and February . The increase occurred exc lus ive ly among white teenagers. Despite the M arch increase, the teenage rate in the f i r s t quarter of 1969 averaged 12. 1 percent, the lowest quarter ly average in the last 2 years . The quarter ly rate has been as low as the 12 .0-12.2 percent range in only 2 other quarters since 1957.
While the white unemployment rate fo r the f i r s t quarter of 1969 was unchanged from the last quarter of 1968 at 3. 0 percent, the nonwhite rate m oved down substantially in the f i r s t quarter, from 6. 6 to 5.9 percent.Th is decline was espec ia lly marked among adult w orkers . Although the nonwhite job less rate was tw ice that of whites, the ratio between the two rates was at its lowest quarter ly le v e l since 1965.
The unemployment rate fo r persons covered under State unemployment insurance program s edged down slightly in M arch. At 2. 1 percent, the rate was near the post-W orld War II low of 2.0 percent posted in Decem ber.
Tota l unemployment was down by nearly 200, 000 w orkers since last March. N ea r ly a ll of the im provem ent occurred among adult men.
Tota l Employment and C iv il ian Labor F o rce
The number of nonagricultural w orkers on part-t im e schedules fo r econom ic reasons rose sharply in M arch. The increase was nearly 175,000 (seasonally adjusted) and was the second straight monthly r is e . Tw o-th irds of the March increase occurred among persons who usually work full time. P a r t - t im e employment fo r economic reasons, at 1.7 m illion , was up 100,000 from a year ago.
Over the year, the c iv ilian labor fo rce increased 1. 8 m illion . Total employment was up by 2. 0 m i l l io n - -650, 000 adult men, 1. 1 m il l ion adult women, and 250,000 teenagers. A lm ost two-fifths of the gain was among voluntary part-t im e w orkers .
Digitized for FRASER http://fraser.stlouisfed.org/ Federal Reserve Bank of St. Louis
- 4 -
This release presents and analyzes statistics from two major surveys* Data on labor force , total employment, and unemployment are derived from the sample surveys of households conducted and tabulated by the Bureau of the Census for the Bureau of Labor Statistics. Statistics on industry employment, hours, and earnings are collected by State agencies from payroll records of em ployers and are tabulated by the Bureau of Labor Statistics* A description of the two surveys appears in the BLS publication Employment and Earnings and Monthly Report on the Labor F orce .
Digitized for FRASER http://fraser.stlouisfed.org/ Federal Reserve Bank of St. Louis
TabU A-l: Employment status of tho noninsHtutlonal population by age and sex
(In thounands)
Seasonally adjusted
Employment status, age, and sex Mar.1969
Feb.1969
Mar.1968
Mar.1169______
Feb.1969
Jan.1969
Dec.1968
Nov.___ 1968
Totol
82,770 82,579 80,938 83,999 83,831 83,351 82,868 82,55979,266 79,104 77,447 80,495 80,356 79,874 79,368 79,04276,520 76,181 74,517 77,767 77,729 77,229 76,765 76,388
3,327 3,285 3,537 3,732 3,881 3,752 3,842 3,706Nonagricultural industries...................... 73,193 72,896 70,980 74,035 73,848 73,477 72,923 72,682
On part time for economic reasons......... 1,731 1,630 1,670 1,801 1,638 1,605 1,673 1,711Wsuallv work full time...................... 977 900 866 979 870 805 872 852Usually work part time...................... 754 730 804 822 768 800 801 859
Unemployed............................................... 2,746 2,923 2,929 2,728 2,627 2,645 2,603 2,654
Men, 20 years and over
Civilian labor force ....................................... 45,959 45,911 45,483 46,297 46,280 46,131 46,093 45,87144,911 44,777 44,264 45,422 45,422 45,231 45,254 44,940
2,579 2,557 2,750 2,706 2,732 2,680 2,763 2,753Nonagriculcurai industries........................ 42,332 42,220 41,514 42,716 42,690 42,551 42,491 42,187
1,048 1,134 1,219 875 858 900 839 931
Women,. 20 years and evar
T \ h i 27,232 27,229 26,141 27,18926,228
27,230 26,950 26,737 26,630Employed................................................... 26,268 26,168 25,153 26,264 25,999 25,802 25,702
Agriculture ............................................ 473 482 486 638 731 691 722 621Nonagricultural industries........................ 25,795 25,686 24,667 25,590 25,533 25,308 25,080 25,081
Unemployed............................................... 964 1,061 988 961 966 951 935 928
Beth saxes, 16-19 years
Civilian labor force....................................... 6,075 5,964 5,823 7,009 6,846 6,793 6,538 6,541Employed................................................... 5,340 5,236 5,100 6,117 6,043 5,999 5,709 5,746
Agriculture.............................................. 275 247 301 388 418 381 357 332Nonagricultural industries........................ 5,066 4,989 4,799 5,729 5,625 5,618 5,352 5,414
Unemployed............................................... 734 729 722 892 803 794 829 795
Table A-2: Unemployed parsons 16 years and ever by duration of unemployment
(In thousands)
Duration of unemployment Mar.1969
Feb.1969
Mar.1966
Seasonally adjusted
Mar.1969
Feb.1969
Jan.1969
Dec.1968
Nov.1968
Less than 5 weeks......................................... 1,412 1,427 1,461 1,646 1,436 1,476 1,363 1,5765 to 14 weeks................................................ 880 1,104 893 757 829 741 825 7851) weeks and o ver......................................... 455 393 575 355 346 316 322 348
13 to 26 weeks.......................................... 318 278 370 237 237 193 177 22127 weeks and over....................................... 137 115 206 118 109 123 145 127
Digitized for FRASER http://fraser.stlouisfed.org/ Federal Reserve Bank of St. Louis
TabU A-3: Major unomptoymont Indicators
(Persona 16 years and over)
Thousands of persons unemployed
Seasonally adjusted rates of unemployment
Selected categoriesMar. Mar. Mar. Feb. Jan. Dec. Nov. Mar.1969 1968 1969 1969 1969 1968 1968 1968
Total (all civilian workers)............................ 2,746 2,929 3 .4 3.3 3.3 3.3 3.4 3.7
Men, 20 years and over................................* Women, 20 years and over...........................
Both sexes, 16-19 years.............................
1,048964734
1,219988722
1.93.5
12.7
1.93.5
11.7
2 .03.5
11.7
1.83.5
12.7
2.03 .5
12.2
2.23.8
13.0
2,214 2,314 3.1 2.9 3.0 3.0 3.0 ' 3.2532 615 6 .0 5.7 6.0 6 .0 6 .5 6.9
662 787 1.4 1.4 1.4 1.4 1.6 1.7Full-time workers.......................................... 2,060 2,236 2.9 2.8 2.9 2.7 3.0 3.2Unemployed 15 weeks and over*..................... 455 575 .4 .4 .4 .4 .4 .6State insured?................................................ 1,342 1,421 2.1 2.2 2.1 2.0 2.2 2.3Labor force time lost3................................... — — 3.7 3.6 3.6 3.6 3.8 4 .0
Occupation
White-collar workers...................................... 721 690 2 .0 1.9 1 .9 1 .9 2.0 2 .0Professional and managerial....................... 174 157 1.0 1.0 1.0 1.0 1.1 1.0Clerical workers......................................... 400 377 3 .1 2.7 3.0 2.7 3.1 3.0Sales workers............................................ 148 156 2 .9 3.3 2.6 2.9 2.5 3.0
Blue-collar workers......................................... 1,250 1,438 3.7 3.6 3.8 3.6 3.9 4 .4Craftsmen and foremen............................... 288 330 2.2 2.1 2.1 1.9 2.3 2 .6Operatives.............................. -.................. 640 767 3 .9 4 .2 4 .2 4.2 4 .3 4.7Nonfarm laborers........................................ 322 341 7 .0 5 .5 6 .6 6 .1 6.8 7.7
Service workers..................................... ......... 392 414 3.8 3.8 4 .2 4 .2 4 .2 4.1
IndustryNonagricultural private wage
end salary workers^.................................... 2,114311
2,275 3 .46 .2
3.3 3.4 3.3 3 .4 3.7Construction................................................ 382 5 .5 5.5 5.4 6.5 7.9Manufacturing............................................. 701 776 3 .1 2 .9 3 .2 2.8 3.2 3.5
Durable g o o d s ........................................ 367 411 2.7 2.4 2.7 2.6 3.1 3.1Nondurable goods . .................................. 335 365 3.7 3.6 3.9 3.3 3.3 3 .9
Transportation and public utilities ............ 110 77 2.4 1.8 1.8 1.6 2.1 1.7Wholesale and retail trade.......................... 541 552 3.8 3.9 3.8 4 .1 3.9 4 .0Finance and service industries................... 437 469 2 .9 3.1 3.1 3.2 3 .0 3 .3
Government wage and salary workers.............. 179 198 1 .6 1.7 1.8 1.7 1.8 1.9Agricultural wage and salary workers............... 90 110 5.9 4 .1 5 .8 5.7 4 .5 6 .4
1 Unemployment rate calculated aa a percent of civilian labor force. Htan-boura loot by the unemployed and persons on part time for economic reasons as ainsured unemployment under State p'ojr.m.-unempioyment rate calculated a . • percent P*,cem ° * P « « K « H y su ita b le labor force man-hours,of average covered employment. 4Includes mining, not shown separately.
NOTE: Unemployment by occupation includes a ll experienced unemployed persons, whereas that by Industry refers only to experiencedwage and salary workers.
Tobl« A-4: fall- and part-tlm# status of tba civilian labor forco
Full- and part-time employment statusTotal
Men, 20 and over
Women, 20 and over
Both sexes, 16-19 years
m m ???A VISA VISA W h
Full Time
Civilian labor force................................................................................................................ 67,799 66,713 '43 ,781 43,530 21,430 20,531 2,588 2,652Employed:
Full-time schedules.............................................................................................. .. 63,778 62,567 41,865 41,542 19,832 18,916 2,081 2,108Part time for economic reasons..................................................................................... 1,961 1,910 968 884 814 849 180 178
Unemployed, looking for fuH-time work............................................................................ 2,060 2,236 948 1,104 785 766 327 366Unemployment rate................................................................................................................ 3 .0 3.4 2.2 2.5 3.7 3.7 12.6 13.8
Port Time
Civilian labor fo rce ............................................................................................................ 11,467 10,733 2,178 1,952 5,802 5,610 3,487 3,170Employed (voluntary part time)........................................................................... 10,781 10,040 2,079 1,838 5,623 5,388 3,079 2,814Unemployed, looking for pan-time work......................................... ................................ 686 693 100 115 178 223 408 356
Unemployment rate................................................................................................ 6 .0 6 .5 4 .6 5.9 3.1 4 .0 11.7 11.2
Digitized for FRASER http://fraser.stlouisfed.org/ Federal Reserve Bank of St. Louis
HOUSEHOLD DATA HOUSEHOLD DATA
Table A-5: Unemployed persons by reason for unemployment, sex, age, and color(Not seasonally ad justed )
Reason for unemployment
Totalunemployed
Male, 20 years and over
Female, 20 years and over
Both sexes, 16 to 19 years
White Nonwhite
Mar.1969
Mar.1968
Mar. 1969
Mar.1968
Mar. 1969 .
Mar.1968
Mar.1969
Mar.1968
Mar..1969
Mar.1968
Mar.1969
Mar.1968
UNEMPLOYMENT LEVEL
Total unemployed, in thousands .................. 2,746 2,929 1,048 1,219 964 988 734 722 2,214 2,314 532 615Lost last job.............................................. 1,186 1,360 686 820 353 391 147 149 965 1,077 221 283Left last job.............................................. 391 437 139 188 144 167 107 82 309 341 82 96Reentered labor force................................ 869 833 203 192 414 385 252 256 693 660 176 174Never worked before.................................. 301 299 19 19 52 45 229 235 247 237 54 62
Total unemployed, percent distribution........ 100.0 100.0 100.0 100.0 100.0 100.0 100.0 100.0 100,0 luO. 0 100.0 100.0Lost last job............................................. 43.2 46.4 65.4 67.2 36.7 39.6 19.9 20.6 43.6 46.5 41.6 46.1Left last job.............................................. 14.2 14.9 13.3 15.4 15.0 16.9 14.6 11.4 14.0 14.7 15.3 15.6Reentered labor force................................ 31.6 28.4 19.4 15.8 42.9 38.9 34.3 35.5 31.3 28.5 33.0 28.2Never worked before.................................. 11.0 10.2 1.9 1.5 5.4 4.6 31.2 32.5 11,2 10.2 10.1 10.1
UNEMPLOYMENT RATE
Total unemployment rate.............................. 3.5 3.S 2.3 2.7 3.5 3.8 12.1 12.4 3.1 3.4 6.1 7.1Job-loser ra te............................................ 1.5 1.8 1.5 1.8 1.3 1.5 2.4 2.6 1.4 1.5 2.6 3.3Job-leaver rate.................. ....................... .5 .6 .3 .4 .5 .6 1.8 1.4 .4 .5 .9 1.1Reentrant rate........................................... 1.1 1.1 .4 .4 1.5 1.5 4.1 4.4 1.0 1.0 2.0 2.0New entrant rate........................................ .4 .4
"
.2 .2 3.8 4.0 .4 .3 .6 .7
Table A-6: Unemployed persons by age and sex
Age and sex
Thousands Percentlooking
forfull-time
workMar. 1969
Seasonally adjusted unemployment rates
Mar.1969
Feb.1969
Mar.1969
Feb.1969
Jan.1969
Dec.1968
Nov.1968
Mar.1968
Total, 16 years and over............................... 2,746 2,923 75.0 3.4 3,3 3.3 3.3 ------ 375----- -------377------
16 to 19 years.......................................... 734 729 44.6 12.7 u .7 11.7 12.7 12.2 13.016 and 17 years..................................... 354 320 22.3 14.0 13.1 13.5 15.0 13.7 14.918 and 19 years..................................... 380 409 65.3 11.6 11.1 10.5 10.9 10.5 11.6
20 to 24 years............................................ 543 602 83.1 5.3 5.5 5.2 5.3 5.9 5.925 years and over..................................... 1,469 1,592 87.3 2.1 2,1 2.1 2.0 2.1 2.3
25 to 54 years....................................... 1,163 1,252 88.5 2.2 2,0 2.2 2.0 2.2 2.455 years and over.................................. 306 340 82.7 1.9 2,0 1.9 2.1 2.1. 2.2
Males, 16 years and over.............................. 1,461 1,539 76.9 2.6 2.6 2.7 2.6 2.7 2.9
16 to 19 years.......................................... 413 405 42.1 11.5 11.0 11.8 11.6 11.3 11.916 and 17 years..................................... 219 202 20.5 12.9 12,5 13.2 14.2 13.7 14.018 and 19 years................................... 193 203 66.8 10.2 9.5 10.6 9.5 8.6 10.1
20 to 24 years........................................ 266 307 78.6 4.5 4.9 5.0 4.2 4.7 5.325 years and over................................... 782 826 94.5 1.6 1.5 1.6 1.5 1.7 1.9
25 to 54 years....................................... 586 623 97.3 1.5 1.4 1.5 1.4 1.7 1.855 years and over.................................. 195 203 86.7 1.8 1.7 1.9 1.9 2.0 2.2
Females, 16 years and over......................... 1,285 1,384 73,0 4.6 4.5 4 .3 4.5 4.4 4.9
16 to 19 years.......................................... 322 323 47.2 14.3 12.7 11.6 14.1 13.3 14.416 and 17 years .................................. 135 118 24.4 15.6 13.9 14.0 16.2 13.7 16.318 and 19 years ................................... 187 205 63.6 13.3 13.0 10.4 12.6 12.8 13.2
20 to 24 years ....................................... 277 295 87.4 6.3 6.1 5.5 6.5 7.2 6.725 years and over...................................... 687 766 79.0 3.0 3.1 3.2 2.9 2.9 3.2
25 to 54 years............ ........................ 577 629 79.7 3.3 3.2 3.4 3.1 3.1 3.555 years and over.................................. 110 138 75.5 1.9 2.5 1.9 2.4 2.5 2.3
Digitized for FRASER http://fraser.stlouisfed.org/ Federal Reserve Bank of St. Louis
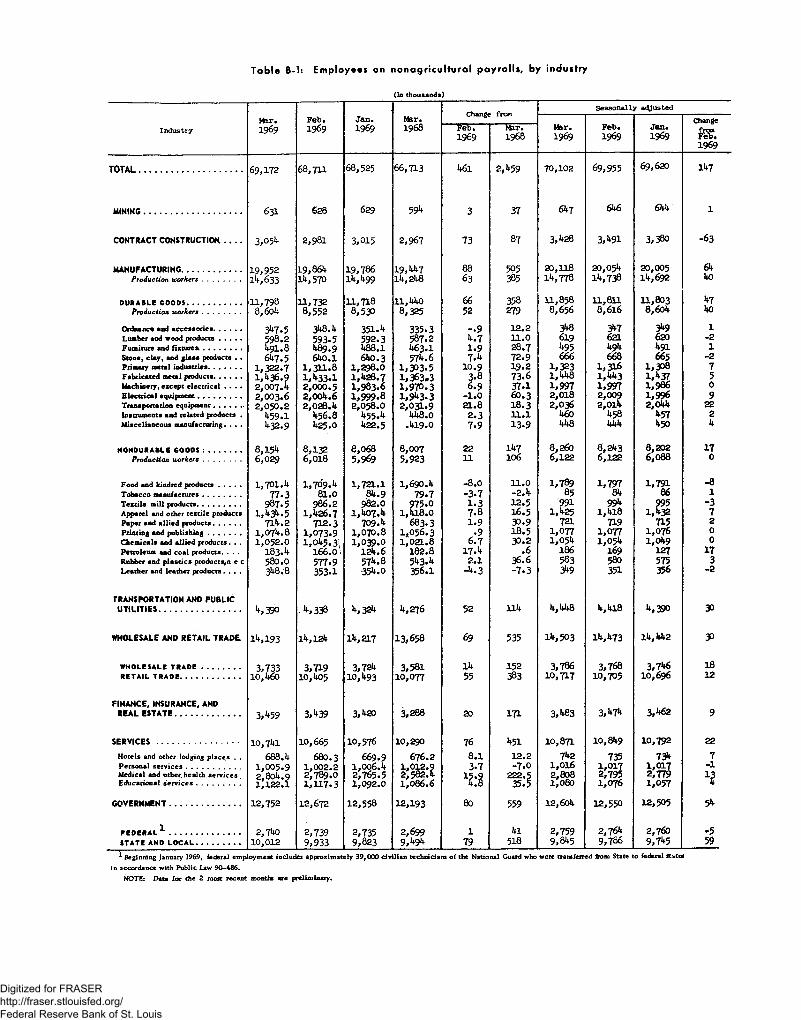
Table B-1: Employees on nonagricultural payro lls , by industry
(In thousands)
Seasonally adjustedChange from
Max, Feb. Jan. Mar.Feb.1969
Jan.1969
ChangeIndustry 1969 1969 1969 1968 f s e :
1969Mar.1968
Mar.1969 IBS'.
1969
TOTAL .................... 6 9 ,17 2
631
3, 05^
68,711
628
68,525 66,713 1*61 2,1*59
37
70 ,10 2
61*7
69,955 69,620 ll*7
m i n i n g ...................................................... 629 59I* 3 61*6 61*4 1
C O N TR A CT C O N STRU CTIO N .------ 2 ,9 8 1 3,015 2,967 73 87 3,1*28 3,1*91 3,380 -63
M ANUFACTURING................................. 19,952 19,864 19 ,7 8 6 19,1*1*7 88 505 20,118 20, 051* 20,005 61*Production workers....... 1^ ,6 3 3 1^,570 1U A99 ll* ,2 1*8 63 385 ll*,778 ll*,738 lk , 692 1*0
DURABLE GOODS.................. 11 ,7 9 88 ,6 c *
U ,7 3 28,552
11,7188,530
n ,M *o8,325
66 358 11,858 11,811 11,803 1*7Production workers....... 52 279 8 ,656 8 ,6 16 8,601* 1*0
Ordnance and accessories............ 3^7.5 31*8.1* coq <;
351* ** 335.3 - 9 12 .2 31*8 3**7 3»*9 1
598.21*91,8
592.31*88.1
587.21*63.1
i*.71.9
11.028.7
6191*95
621 620 -2Furniture and fixture*................ 1*89.9 l*9l* 1*91 1Stone, clay, and glass products . . 61*7.5
1,322.71,1*36.9
61*0.1 61*0.3 57l*.6 7.1* 72.9 666 668 665 -21,311.81,U33.1
1,298.01A26.7
1,303.51,363*3
10.93.8
CVJVO9
P 1,323 1, W*8
1,316 1,1*1*3
1,308 7Fabricated metal products............ 5Machinery, except electrical . . . . 2,007.1* 2,000.5 1,983.6 1,970.3 6.9 37.1 1,997 1,997 1,986 0
2,003.62,050.2
2,00l*.62,028.1*
1,999.82,058.0
1,91*3.32,031.9
-1.021.8
60.318.3
2,0182,036
2,009 2 , O ik
1,9962,0l*l*
9Transportation equipment............ 22Instruments and related products . U59.1 1*56.8 5̂5.*> 1*1*8.0 2.3 n . i U60 1*58 1*57 2Miscellaneous manufacturing. . . . 1*32.9 1*25.0 1*22.5 .1*19.0 7.9 13.9 1*1*8 1*1*1* 1*50 1*
NONDURAB LE G000S: ........... 8,151* 8,132 8,068 8,007 22 ll*7 8,260 8,2»*3 8,202 17Production workers....... 6,029 6,018 5,969 5,923 11 106 6,122 6,122 6,088 0
Food and kindred products.......... 1,701.1* 1,709.1* 1,721.1 1,690.1* —8.0 11.0 1,789 1,797 1,791 -8Tobacco manufactures . .............. 77.3 81.0 81*.9 79.7 -3.7 -2.1* 85 81* 86 1Textile mill products................... 987.5 986.2 982.0 975.0 1.3 12.5 991 99** 995 -3Apparel and other textile products l,i*3i*.5 1,1*26.7 1,1*07.1* 1,1*18.0 7.8 16.5 1,1*25 1,1*18 1,1*32 7Paper and allied products............ 711*.2 712.3 709.1* 683.3 1.9 30.9 721 719 715 2Printing and publishing.............. 1,071*. 8 1,073.9 1,070.8 1,056.3 .9 18.5 1,077 1,077 1,076 0Chemicals and allied products. . . 1,052.0 1,01*5.3\ 1,039.0 1,021.8 6.7 30.2 1,051* 1,051* l,ol*9 0Petroleum and coal products. . . . 183.1* 166.0\ 12!*.6 182.8 17.1* •6 186 169 127 17Rubber and plastics products,n e c 580.0 577.9 57l*. 8 51*3.1* 2.1 36.6 583 580 575 3Leather and leather products. . . . 31*8.8 353.1 •351*.0 356.1 -!*.3 -7.3 3l*9 351 356 -2
TRANSPORTATION AND P U B LIC1*, M*8U T IL IT IE S ............. ............................ l*,390 >,338 l*,32l* 1*,276 52 111* l*,l*l8 l*,390 30
W H O LESALE AND R E T A IL TRA D E, ll*, 193 ll*,12l* ll*,217 13,658 69 535 ll*,503 1M73 ll*, 1*1*2 30
WHOLESALE TRADE ..................... 3,733 3,719 3,721* 3,581 ll* 152 3,786 3,768 3 ,7 k 6 18R E T A IL T R A O E ................................ 10,1*60 10,1*05 10,1*93 10,077 55 383 10,717 10,705 10,696 12
F IN A N C E, IN SURAN CE, AND3,1*62R E A L E S T A T E .................................... 3,1*59 3,1*39 3,1*20 3,288 20 171 3,1*83 3,l*7l* 9
S E R V I C E S ............................................. 10,71*1 10,665 10,576 10,290 76 1*51 10,871 10,81*9 10,792 22Hotels and other lodging places . . 688.1* 680.3 669.9 676.2 8.1 12.2 71*2 735 73** 7Personal services.......................Medical and other.health services.
1,005.92,80l*.9
1,002.22,789.0
1,006.1*2,765.5
3.7
*2:1
-7.0222.5
1,0162,808 2^79?
-113
Educational services................... 1,122.1 1,117.3 1,092.0 1,086.6 35.5 1,080 1,076 1,057 k
GOVERN M EN T ........................................ 12,752 12,672 12,558 12,193 80 559 12,6ol* 12,550 12,505 5k
F E D E R A L 1 ...................................... 2,7l*0 2,739 2,735 2,699 1 1*1 2,759 2,76* 2,760 -5STA TE AND L O C A L ........................ 10,012 9,933 9,823 9 ,k $ k 79 518 9,81*5 9,786 9,7**5 59* Beginning January 1969, federal employment includes approximately 39,000 civilian technicians of the National Guard who were transferred from State to federal status
in accordance with Public Law 90-486.NOTE: Data for the 2 most recent months are preliminary.
Digitized for FRASER http://fraser.stlouisfed.org/ Federal Reserve Bank of St. Louis
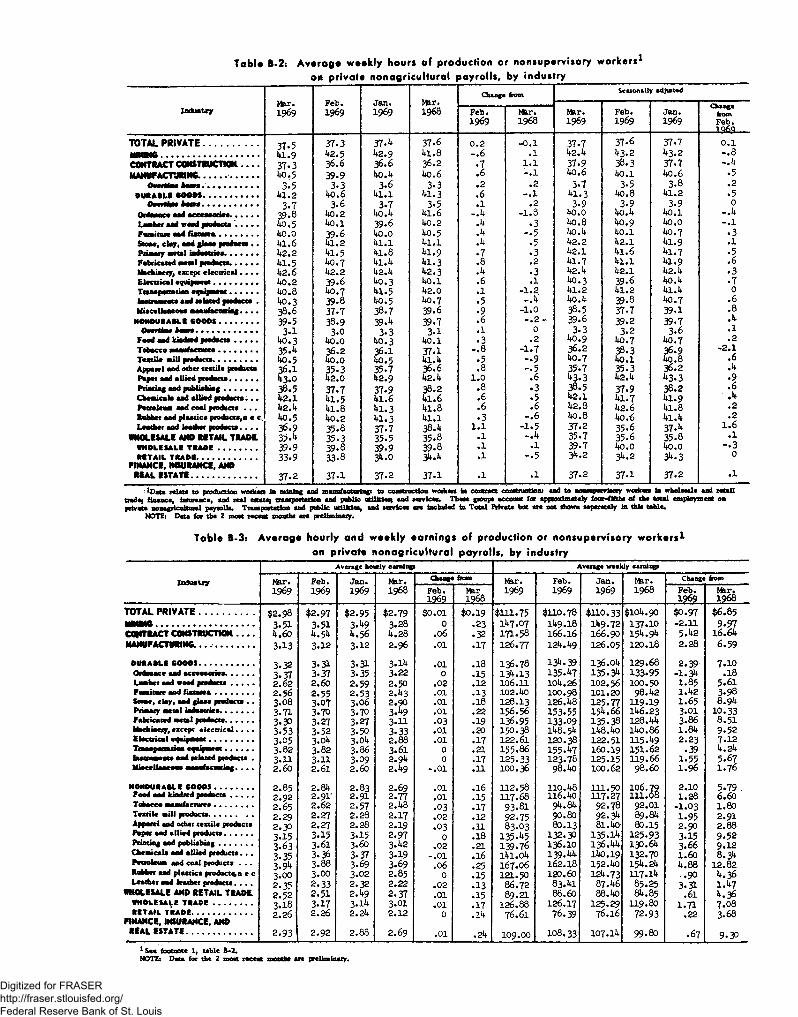
Table B-2: Average weekly hours a! production or nonsupervisory workers1on private nonagricultural payrolls, by industry
IndustryMar.1969
Feb.1969
Jan.1969
M as1968
Change fromSeasonally adjusted
H er.1969
Feb.1969
Jan.1969
ChangefromFeb.1060
Feb.1969
Mar.1968
TOTAL PRIVATE................... 37.5 37 .3 37-4 37 *6 0 .2 -0 .1 37.7 37-6 37.7 0 .1Mttivrffi ..................................... 1*1.9 1*2.5 1*2.9 1*1.8 - .6 .1 1*2.1* 1*3.2 1*3.2 - .8CONTRACT CONSTRUCTION.------- 37*3 36.6 36.6 36.2 .7 1 .1 37.9 38.3 37.7 -.1*
M ANUFACTURING ............ ............... U o.5 39.9 1*0.1* 1*0.6 •6 - .1 1*0.6 1*0.1 1*0.6 .5p — a-—- . ....................... 3*5 3 .3 3.6 3*3 .2 .2 3 .7 3.5 3.8 .2
d u r a b l e e o o e s ........................ 1*1.2 1*0.6 1*1.1 41-3 .6 - .1 1*1.3 1*0.8 1*1.2 .5
3*7 3.6 3 .7 3*5 .1 .2 3 .9 3 .9 3.9 0Ordnance and accessories........... 39.8 1*0.2 1*0.1* 1*1.6 -.1* -1 .8 1*0.0 1*0.1* 1*0.1 -.1*Lumber and vsod ptedneta . . . . . 1*0.5 1*0.1 39-6 1*0.2 .1* .3 1*0.8 1*0.9 1*0.0 - .1Furniture and fixture*.................. 1*0.0 39.6 1*0.0 1*0.5 .1* 1*0.1* 1*0.1 1*0.7 • 3Scene, clay, and glass ptedneta . . 1*1.6 1*1.2 1*1.1 1*1.1 .1* .5 1*2.2 1*2.1 1*1.9 .1Primary metal industries.............. 1*2.2 41.5 1*1.8 1*1.9 .7 .3 1*2.1 1*1.6 1*1.7 .5Fabricated metal products........... 1*1.5 1*0.7 1*1.1* 41 .3 .8 .2 1*1.7 1*1.1 1*1.9 • 6Machinery, except electrical. . . . 1*2.6 1*2.2 1*2.1* 1*2.3 .1* • 3 1*2.1* 1*2.1 . 1*2.1* .3Electrical equipment............... 1*0.2 39.6 1*0.3 1*0.1 .6 .1 1*0.3 39.6 1*0.1* .7Transportation equipment............. 1*0.8 1*0.7 1*1.5 1*2.0 .1 -1 .2 1*1.2 1*1.2 1*1.1* 0Internments and enlaced fadacte • 1*0.3 39.8 1*0.5 1*0.7 .5 -.1* 1*0.1* 39.8 1*0.7 •6
38.6 37.7 38 .7 39*6 .9 -1 .0 38.5 37-7 39.1 .8
HONOURABLE 6 0 00 1 .................. 39.5 38.9 39-4 39*7 •6 - .2 - 39.6 39.2 39 .7 .1*
3 .1 3.0 3*3 3*1 .1 0 3 .3 3 .2 3 .6 •1Food aad kiodred prodnet*.......... 1*0.3 1*0.0 1*0.3 1*0.1 .3 .2 1*0.9 1*0.7 1*0.7 .2
35-4 36.2 36.1 37*1 - .8 -1 .7 36 .2 38.3 36.9 -2 .1Textile mill products................... 1*0.5 1*0.0 1*0.5 1*1.1* • 5 - .9 1*0.7 1*0.1 1*0.8 •6Apparel and other -textile ptedneta 36 .1 35.3 35*7 36.6 .8 - .5 35 .7 35 .3 36.2 .1*Paper and allied prodocta............. 1*3.0 1*2.0 1*2.9 1*2.1* 1 .0 .6 43*3 1*2.1* 43-3 .9Printing nod publishing.......... . . 38.5 37.7 37*9 38.2 .8 .3 38.5 37.9 38.2 •6Chemicals and allied products. • . 1*2.1 1*1.5 1*1.6 1*1.6 .6 .5 1*2.1 1*1.7 1*1.9 .1*Petroleum aad coal ptedneta . . . 1*2.1* 1*1.8 1*1.3 1*1.8 .6 •6 1*2.8 1*2.6 1*1.8 .2Rubber aad plastics ptedneta,a e c 1*0.5 1*0.2 1*1.3 1*1.1 .3 - .6 1*0.8 1*0.6 1*1.1* .2Leather and leather products. . . . 36 .9 35.8 37*7 38.1* 1 .1 -1 .5 37.2 35.6 37-4 1 .6
WHOLESALE AND R E TAIL TRADE. 35.4 35.3 35*5 35.8 .1 -.1* 35.7 35.6 35.8 •1
WHOLE SALK T R A D E .................. 39 .9 39.8 39*9 39.8 .1 .1 39.7 1*0.0 1*0.0 - .3EETAIL TEAOE........................... 33.9 33.8 3l*.0 34.1* .1 - .5 3l*.2 3^-2 34.3 0
FINANCE, INSURANCE. ANDREAL E STATE ................................ 37 .2 37.1 37*2 37.1 .1 .1 37.2 37.1 37.2 .1
*D «u relate to production workers in mining end manufacturing: to construction worker* In coatrnct contructloni end to nonsupervisory worker* In wholesale end retell trade; finance, lmurance, end real ematej transportation and public utilities} and service*. These group* account for approximately four-fifths of the total employment on private nonagricultural payrolls. Transportation and public utilities, and services ate Included in Total Private but are not shown seperstely in this table.
NOTE: Data for the 2 most recent months are preliminary.
Table B-3: Average hourly and weekly earnings of production or nonsupervisory workers1on private nonagricultural payrolls, by industry
Average hoiely earnings Average weekly earnings
Industry Mar. Feb. Jem. Mar. Change! from Mar. Feb. Jan. Mar. Change from
1969 1969 1969 1968 Feb.1969
Ifer1968
1969 1969 1969 1968 Feb.1969
Mar.1968
TOTAL PRIVATE................... $2.98 $2.97 $2.95 $2.79 $0.01 $0.19 $111.75 $110.78 $110.33 $10i*.90 $0.97 $6.85IN N IN G ................................................ 3.51 3*51 3.49 3.28 0 .23 11*7.07 11*9.18 11*9.72 137.10 -2.11 9.97CONTRACT CONSTRUCTION------- i*.6o l*.5l* 1*.56 1*.28 .06 .32 171-58 166.16 166.90 154.94 5.42 16.6kM ANUFACTURING .. . .............. 3.13 3.12 3.12 2.96 .01 .17 126.77 121*. 1*9 126.05 120.18 2.28 6.59
OUR ABLE GOODS......................... 3.32 3.31 3.31 3.11* .01 .18 136.78 13k.39 136.01* 129.68 2.39 7.10Ordaaacc aad accessories............. 3.37 3.37 3.35 3.22 0 .15 134.13 135.k7 135.3k 133.95 -1.3k .18Lumber aad weed ptadacta . . . . . 2.62 2.60 2.59 2.50 .02 .12 106.11 10l*.26 102.56 100.50 1.85 5.61Furniture aad iistates.................. 2.56 2.55 2.53 2.1*3 .01 .13 102.1*0 IOO.98 101.20 98.42 1.1*2 3.98Stone, clay, aad glass ptadacta . . 3.08 3.07 3.06 2.90 .01 .18 128.13 126.1*8 125.77 119.19 1.65 8.94Priamiy metal iaduacrics.............. 3.71 3.70 3.70 3.̂ 9 .01 .22 156.56 153.55 154.66 11*6.23 3.01 10.33Fabricated a t n l ptadacta............. 3-30 3.27 3.27 3.11 .03 .19 136.95 133.09 135.38 128.1*1* 3.86 8.51Machinery, except electrical. . . . 3.53 3.52 3.50 3.33 .01 .20 150.38 lkQ.3k 11*8.1*0 11*0.86 1.81* 9.52Electrical equipment.................... 3.05 3.01* 3.0l* 2.88 .01 .17 122.61 120.38 122.51 115.49 2.23 7.12Transportation equipment............. 3.82 3.82 3.86 3.61 0 .21 155-86 155.k7 160.19 151.62 .39 l*.2kinnmumeats and tainted products . 3.H 3.11 3*09 2.91* 0 .17 125.33 123.78 125.15 119.66 1.55 5.67Miscellaneous manufacturing. . . . 2.60 2.61 2.60 2.1*9 -.01 .11 100.36 98.1*0 100.62 98.60 1.96 1.76
HONOURABLE GOODS.................. 2.85 2.81* 2.83 2.69 .01 .16 112.58 110.1*8 H l.50 106.79111.08
2.10 5.79Food and kindred ptadacta.......... 2.92 2.91’ 2.91 2.77 .01 .15 117.68 116.1*0 117.27 1.28 6.60Tobacco manufactures.................. 2.65 2.62 2.57 2.1*8 .03 .17 93.81 94.8k 92.78 92.01 -1.03 1.80Textile mill products.................... 2.29 2.27 2.28 2.17 .02 .12 92.75 90.80 92.34 89.8k 1.95 2.91Apparel and ocher textile products 2.30 2,27 2.28 2.19 .03 .11 83.03 80.13 81.1*0- 80.15 2.90 2.88Paper aad allied products............. 3.15 3.15 3.15 2.97 0 .18 135*45 132.30 135.14 125.93 3.15 9.52Printing aad publishing............... 3-^3 3.61 3.60 3.1*2 .02 .21 139.76 136.10 136.1*4 130.61* 3.66 9.12Cheaucals and allied products. . . 3-35 3.36 3-37 3.19 -.01 .16 ll*1.0l* 139.1*1* 11*0.19 132.70 1.60 8.34Petroleum and coni products . . . 3.91* 3.88 3-69 3.69 .06 .25 167.06 162.18 152.1*0 154.2k l*.88 12.82Rubber and plastics product%a e c 3.00 3.00 3.02 2.85 0 .15 121.50 120.60 12U.73 117.14 ..90 4.36Leather aad leather products. . . . 2.35 2.33 2.32 2.22 .02 .13 86.72 83.1*1 87.46 85.25 3.31 1.47
WHOLESALE AND RETAIL TRADE. 2.52 2.51 2.1*9 2.37 .01 .15 89.21 88.60 88.1*0 81*.85 .61 k.36WHOLESALE TE A O E .................. 3.18 3.17 3.11* 3.01 .01 .17 126.88 126.17 125.29 119.80 1.71 7.08EETAIL TEAOE...........................
FINANCE, INSURANCE. AND2.26 2.26 2.2l* 2.12 0 . Ik 76.61 76.39 76.16 72.93 .22 3.68
REAL E STATE ................................ 2.93 2.92 2.88 2.69 .01 .2k 109.00 108.33 i07.ll* 99.80 .67 9.301 See footnote 1, table B-2.NOTE* Dete for the 2 moat recent month* are preliminary.
Digitized for FRASER http://fraser.stlouisfed.org/ Federal Reserve Bank of St. Louis


