
bls_1725-29_1972.pdf
36
L x . 3 -' - n x i ' 7- ? \ Dayton & Montgomery Cct ruhiic Library ^ R 121972 s * DOCUMENT COLLECTION AREA WAGE SURVEY The Louisville, Kentucky—Indiana, Metropolitan Area, November 1971 C Bulletin 1725-29 U.S. DEPARTMENT OF LABOR / Bureau of Labor Statistics Digitized for FRASER http://fraser.stlouisfed.org/ Federal Reserve Bank of St. Louis
Transcript of bls_1725-29_1972.pdf

L x . 3 -' -
n x i ' 7 - ?
\
Dayton & Montgomery Cct ruhiic Library
^ R 121972 s *
DOCUMENT COLLECTION
AREA WAGE SURVEYT h e L o u is v i l l e , K e n t u c k y — In d ia n a , M e t r o p o l i t a n A r e a ,
N o v e m b e r 1 9 7 1
C
Bulletin 1 7 2 5 -2 9
U.S. DEPARTMENT OF LABOR / Bureau of Labor StatisticsDigitized for FRASER http://fraser.stlouisfed.org/ Federal Reserve Bank of St. Louis

Region I1603-JFK Federal Building Government Center Boston, Mass. 02203 Phone: 223-6761 (Area Code 617)
Region II341 Ninth Ave., Rm. 1003New York, N .Y . 10001Phone: 971-5405 (Area Code 212)
Region II I406 Penn Square Building 1317 Filbert St.Philadelphia, Pa. 19107Phone: 597-7796 (Area Code 215)
Region IV Suite 5401371 Peachtree St. N E .Atlanta, Ga. 30309Phone: 526-5418 (Area Code 404)
Region V8th Floor, 300 South Wacker DriveChicago, III. 60606Phone: 3 5 3 -1880 (Area Code 312)
Region VI1100 Commerce St., Rm. 6B7Dallas, Tex. 75202Phone: 749-3516 (Area Code 214)
R egionsVIl and V I I IFederal Office Building 911 W alnut S t., 10th Floor Kansas C ity , M o. 64106 Phone: 374-2481 (Area Code 816)
Regions IX and X450 Golden Gate Ave.Box 36017San Francisco, Calif. 94102 Phone: 556-4678 (Area Code 415)
Regions V II and V I I I w ill be serviced by Kansas C ity . Regions IX and X w ill be serviced by San Francisco.
Digitized for FRASER http://fraser.stlouisfed.org/ Federal Reserve Bank of St. Louis

AREA WAGE SURVEY Bulletin 1725-29M a rc h 1 9 7 2
U.S. DEPARTMENT OF LABOR, J. D. Hodgson, Secretary BUREAU OF LABOR STATISTICS, Geoffrey H. Moore, Commissioner
v
T h e Lou isville , K e n tu c k y —Indiana, M e tro p o litan A rea , N o v e m b e r 1971
C O N T E N T S
P age
1. Introduction5. Wage trends fo r selected occupational groups
T ab les :
4.6.
7.10.11.12.13.
15.16.17.18. 19. 22.
1. Establishments and w orkers within scope of survey and number studied2. Indexes of standard weekly sa laries and stra ight-tim e hourly earnings fo r selected occupational
groups, and percents of in crease fo r selected periods
A. Occupational earnings:A - l . O ffice occupations—men and womenA-2 . P ro fessiona l and technical occupations—men and womenA -3 . O ffice, professional, and technical occupations—men and women combined A -4 . Maintenance and powerplant occupations A -5 . Custodial and m ateria l m ovem ent occupations
B. Establishment practices and supplementary wage provisions:B - l. Minimum entrance sa laries fo r women o fficew orkers B-2. Shift d ifferen tia lsB-3. Scheduled weekly hours and days B-4. Paid holidays B-5. Paid vacationsB-6. Health, insurance, and pension plans
24. Appendix. Occupational descriptions
For sale by the Superintendent of Documents, U.S. Government Printing Office, Washington, D.C., 20402 — Price 35 cents
Digitized for FRASER http://fraser.stlouisfed.org/ Federal Reserve Bank of St. Louis

Preface
The Bureau o f Labor Statistics p rogram of annual occupational wage surveys in m etropolitan areas is designed to provide data on occupational earnings, and establishment practices and supplem entary wage p rovis ions. It y ie lds detailed data by selected industry d ivision fo r each o f the areas studied, fo r geographic regions, and for the United States. A m a jor consideration in the program is the need fo r g rea te r insight into (1) the m ovem ent o f wages by occupational category and sk ill le ve l, and (2) the structure and leve l o f wages among areas and industry d ivisions.
A t the end o f each survey, an individual area bulletin p re sents the resu lts. A fte r com pletion o f a ll individual area bulletins fo r a round o f surveys, two summary bulletins are issued. The firs t brings data fo r each o f the m etropolitan areas studied into one bulletin. The second presents in form ation which has been projected from individual m etropolitan area data to re la te to geographic regions and the United States.
N inety areas currently are included in the program . In each area , in form ation on occupational earnings is collected annually and on establishment p ractices and supplementary wage provisions biennially.
This bulletin presents results o f the survey in Lou isv ille , Ky.—Ind., in Novem ber 1971. The Standard M etropolitan Statistical A rea , as defined by the O ffice o f Management and Budget (fo rm er ly the Bureau o f the Budget) through January 1968, consists of Jefferson County, Ky.; and C lark and Floyd Counties, Ind. This study was conducted by the Bureau's regiona l o ffice in Atlanta, Ga., under the gene ra l d irection o f Donald M. Cruse, Assistant Regional D irector fo r Operations.
N o te :
S im ilar reports are available fo r other areas. (See inside back cover.)
A current report on occupational earnings and supplementa ry wage provisions in the Lou isv ille area is also availab le fo r paints and varnishes (Novem ber 1970). Union wage rates, indicative o f p reva iling pay le ve ls , are ava ilab le for building construction; printing; loca l-tran s it operating em ployees; loca l truckdrivers and helpers; and g ro ce ry store em ployees.
Digitized for FRASER http://fraser.stlouisfed.org/ Federal Reserve Bank of St. Louis

In troduction
This area is 1 o f 90 in which the U.S. Department o f Labor's Bureau o f Labor Statistics conducts surveys of occupational earnings and related benefits on an areawide bas is .1 In this area, data w ere obtained by personal v is its of Bureau fie ld economists to representative establishments within six broad industry divisions: Manufacturing;transportation, communication, and other public u tilities; wholesale trade; re ta il trade; finance, insurance, and rea l estate; and serv ices . M ajor industry groups excluded from these studies are government operations and the construction and extractive industries. Establishments having few er than a p rescribed number of workers are om itted because they tend to furnish insufficient employment in the occupations studied to warrant inclusion. Separate tabulations are provided for each o f the broad industry d ivisions which m eet publication c r ite r ia .
These surveys are conducted on a sample basis because o f the unnecessary cost involved in surveying a ll establishments. To obtain optimum accuracy at minimum cost, a grea ter proportion of la rge than o f sm all establishments is studied. In combining the data, however, all establishments are given their appropriate weight. E s timates based on the establishments studied are presented, th erefore, as relating to a ll establishments in the industry grouping and area, except fo r those below the minimum size studied.
Occupations and Earnings
The occupations selected fo r study are common to a varie ty o f manufacturing and nonmanufacturing industries, and are of the follow ing types: (1) O ffice c le r ica l; (2) professional and technical;(3) maintenance and powerplant; and (4) custodial and m ateria l m ovement. Occupational c lassification is based on a uniform set o f job descriptions designed to take account of interestablishm ent variation in duties within the same job. The occupations selected for study are listed and described in the appendix. Unless otherw ise indicated, the earnings data follow ing the job titles are fo r a ll industries com bined. Earnings data fo r some of the occupations listed and described, or fo r some industry divisions within occupations, are not presented in the A -s e r ie s tables, because either (1) employment in the occupation is too sm all to provide enough data to m er it presentation, or (2) there is poss ib ility o f d isclosure of individual establishment data. Earnings data not shown separately fo r industry divisions are included in a ll industries combined data, where shown. L ikew ise, data are included in the o vera ll c lassifica tion when a subclassification o f sec re taries or tru ckdrivers is not shown or in form ation to subclassify is not ava ilab le.
1 Included in the 90 areas are four studies conducted under contract with die New York State Department of Labor. These areas are Binghamton (New York portion only); Rochester (office occupations only); Syracuse; and Utica—Rome. In addition, the Bureau conducts more limited area studies in 65 areas at the request of the Employment Standards Administration of the U. S. Department of Labor.
Occupational employment and earnings data are shown for fu ll-tim e workers, i.e ., those h ired to work a regular weekly schedule. Earnings data exclude prem ium pay fo r overtim e and fo r work on weekends, holidays, and late shifts. Nonproduction bonuses are ex cluded, but cos t-o f- liv in g allowances and incentive earnings are in cluded. Where weekly hours are reported, as for o ffice c le r ica l occupations, re ference is to the standard workweek (rounded to the nearest half hour) fo r which em ployees rece ive their regular straight-tim e sa laries (exclusive o f pay fo r overtim e at regular and/or prem ium rates). A verage weekly earnings fo r these occupations have been rounded to the nearest half dollar.
These surveys m easure the le v e l of occupational earnings in an area at a particu lar tim e. Comparisons o f individual occupational averages over tim e may not re fle c t expected wage changes. The averages fo r individual jobs are affected by changes in wages and employment patterns. For example, proportions o f workers employed by high- or low -w age firm s m ay change or high-wage workers may advance to better jobs and be replaced by new workers at lower rates. Such shifts in employment could decrease an occupational average even though m ost establishments in an area increase wages during the year. Trends in earnings of occupational groups, shown in table 2, are better indicators o f wage trends than individual jobs within the groups.
The averages presented re fle c t composite, areawide e s tim ates. Industries and establishments d iffe r in pay leve l and job staffing and, thus, contribute d ifferen tly to the estim ates for each job. The pay relationship obtainable from the averages m ay fa il to re flec t accurately the wage spread or d ifferen tia l maintained among jobs in individual establishm ents. S im ilarly , d ifferences in average pay levels fo r men and women in any o f the selected occupations should not be assumed to re fle c t d ifferences in pay treatm ent of the sexes within individual establishm ents. Other possible factors which may contribute to d ifferences in pay fo r men and women include: D ifferences in progress ion within established rate ranges, since only the actual rates paid incumbents are co llected ; and d ifferences in specific duties perform ed, although the w orkers are c lassified appropriately within the same survey job description. Job descriptions used in classify ing em ployees in these surveys are usually m ore genera lized than those used in individual establishments and allow for m inor d ifferences among establishments in the specific duties perform ed.
Occupational employment estim ates represent the total in a ll establishments within the scope of the study and not the number actua lly surveyed. Because o f d ifferences in occupational structure among establishments, the estim ates o f occupational employment obtained
Digitized for FRASER http://fraser.stlouisfed.org/ Federal Reserve Bank of St. Louis

2
from the sample of establishments studied serve only to indicate the re la tive im portance o f the jobs studied. These d ifferences in occupational structure do not a ffect m a ter ia lly the accuracy o f the earnings data.
Establishment P ractices and Supplementary Wage Provis ions
Inform ation is presented (in the B -s e r ie s tables) on selected establishment p ractices and supplementary wage provisions as they relate to plant- and o fficew orkers . Data fo r industry divisions not presented separately are included in the estim ates for "a ll industries." Adm in istrative, executive, and p ro fessiona l em ployees, and construction workers who are u tilized as a separate work force are excluded. "P lan tw orkers " include working forem en and a ll nonsupervisory w orkers (including leadmen and tra in ees ) engaged in nonoffice functions. "O ffic ew o rk ers " include w o r k i n g supervisors and nonsupervisory w orkers perform ing c le r ica l or re la ted functions. C afeteria workers and routemen are excluded in manufacturing industries, but included in nonmanufacturing industries.
Minimum entrance sa laries fo r women o fficew orkers (table B- l ) re la te only to the establishments v is ited . Because o f the optimum sampling techniques used, and the probability that la rge estab lishments are m ore lik e ly to have fo rm a l entrance rates fo r workers above the subclerica l le v e l than sm all establishments, the table is m ore-rep resen ta tive of p o lic ies in medium and la rge establishments.
Shift d ifferen tia l data (table B -2 ) a re lim ited to plantworkers in manufacturing industries. This in form ation is presented both in term s o f (1) establishment po licy , 2 presented in term s o f total plant- w orker employment, and (2) e ffec tive practice , presented in term s of w orkers actually em ployed on the specified shift at the tim e of the survey. In establishments having va ried d ifferen tia ls , the amount applying to a m a jo rity was used or, i f no amount applied to a m a jority , the c lassifica tion "o th er" was used. In establishments in which some la te-sh ift hours are paid at norm al rates, a d ifferen tia l was recorded only i f it applied to a m a jo r ity o f the shift hours.
The scheduled weekly hours and days (table B -3 ) o f a m ajo r ity o f the firs t-sh ift w orkers in an establishment are tabulated as applying to a ll o f the plant- or o fficew orkers of that establishment. Scheduled w eekly hours and days are those which a m a jo rity of fu lltim e em ployees w ere expected to work, whether they w ere paid fo r at stra igh t-tim e or overtim e rates.
Paid holidays; paid vacations; and health, insurance, and pension plans (tables B -4 through B -6 ) are treated sta tis tica lly on the basis that these are applicable to a ll plant- or o fficew orkers i f a
2 An establishment was considered as having a policy if it met either of the following conditions: (1) Operated late shifts at the time of the survey, or (2) had formal provisions covering lateshifts. An establishment was considered as having formal provisions if it (1) had operated late shifts during the 12 months prior to the survey, or (2) had provisions in written form for operating late shifts.
m ajority o f such w orkers are e lig ib le or m ay eventually qualify fo r the practices listed . Sums o f individual item s in tables B -2 through B-6 m ay not equal totals because of rounding.
Data on paid holidays (table B -4 ) are lim ited to data on h o lidays granted annually on a fo rm a l basis; i.e ., (1) are provided fo r in w ritten form , or (2) have been established by custom. Holidays o rd inarily granted are included even though they m ay fa ll on a nonworkday and the w orker is not granted another day off. The f ir s t part of the paid holidays table presents the number o f whole and half holidays actually granted. The second part combines whole and half holidays to show total holiday t im e .
The summary o f vacation plans (table B -5 ) is lim ited to a statistical m easure o f vacation p rovis ions. It is not intended as a m easure of the proportion o f w orkers actually rece iv in g specific benefits . P rov is ion s o f an establishm ent fo r a ll lengths o f serv ice w ere tabulated as applying to a ll plant- or o fficew orkers o f the establishment, regard less o f length o f se rv ic e . P rov is ion s fo r payment on other than a tim e basis w ere converted to a tim e basis; fo r example, a payment o f 2 percent o f annual earnings was considered as the equivalent o f 1 w eek 's pay. Only basic plans are included. Estim ates ex clude vacation bonus and vacation-savings plans and those which o ffe r "extended" or "sabbatica l" benefits beyond basic plans with qualifying lengths o f se rv ic e . Such exclusions are typ ica l in the steel, aluminum, and can industries.
Data on health, insurance, and pension plans (table B -6 ) in clude those plans fo r which the em ployer pays at least a part o f the cost. Such plans include those underwritten by a com m erc ia l insurance company and those provided through a union fund or paid d irec tly by the em ployer out o f current operating funds or from a fund set aside fo r this purpose. An establishment was considered to have a plan i f the m a jo rity o f em ployees was e lig ib le to be covered under the plan, even i f less than a m a jo rity elected to participate because em ployees w ere requ ired to contribute toward the cost o f the plan. L ega lly r e quired plans, such as workm en's compensation, socia l security, and ra ilroad retirem en t w ere excluded.
Sickness and accident insurance is lim ited to that type of in surance under which predeterm ined cash payments are made d irec tly to the insured during tem porary illn ess or accident d isab ility. In fo rmation is presented fo r a ll such plans to which the em ployer contributes. H ow ever, in New York and New Jersey , which have enacted tem porary d isab ility insurance laws which requ ire em ployer contributions, 3 plans are included only i f the em ployer (1) contributes m ore than is lega lly required, or (2) provides the em ployee with benefits which exceed the requirem ents o f the law. Tabulations of paid sick
3 The temporary disability laws in California and Rhode Island do not require employer contributions.
Digitized for FRASER http://fraser.stlouisfed.org/ Federal Reserve Bank of St. Louis
leave plans are lim ited to form al plans 4 which provide fu ll pay or a proportion o f the w orker 's pay during absence from work because of illn ess . Separate tabulations are presented according to (1) plans which provide fu ll pay and no waiting period , and (2) plans which p ro vide either partia l pay or a waiting period. In addition to the presen tation of the proportions o f workers who are provided sickness and accident insurance or paid sick leave, an unduplicated total is shown o f workers who rece ive either or both types o f benefits.
Long-term d isab ility plans provide payments to tota lly d is abled em ployees upon the expiration o f their paid sick leave and/or sickness and accident insurance, or after a predeterm ined period of d isab ility (typ ica lly 6 months). Payments are made until the end of
4 An establishment was considered as having a formal plan if it established at least the minimum number of days of sick leave available to each employee. Such a plan need not be written, but informal sick leave allowances, determined on an individual basis, were excluded.
3
the d isab ility, a maximum age, or e lig ib ility fo r retirem ent benefits. Payments m ay be at fu ll o r partia l pay but are almost always r e duced by socia l security, workm en 's compensation, and private pension benefits payable to the disabled em ployee.
M ajor m ed ica l insurance includes those plans which are designed to protect em ployees in case o f sickness and injury involving expenses beyond the coverage o f basic hospitalization, m edical, and surgical plans. M edica l insurance re fe rs to plans providing fo r com plete or partia l payment of doctors ' fees . Dental insurance usually covers fillin gs , extractions, and X -ra ys . Excluded are plans which cover only o ra l su rgery or accident damage. Plans may be underw ritten by com m erica l insurance companies or nonprofit organizations or they m ay be paid fo r by the em ployer out o f a fund set aside fo r this purpose. Tabulations o f retirem en t pension plans are lim ited to those plans that provide regu lar payments fo r the rem ainder o f the w orker 's life .
Digitized for FRASER http://fraser.stlouisfed.org/ Federal Reserve Bank of St. Louis

4
T a b le 1. E stab lishm ents and w o rk e rs w ith in scope of survey and nu m b er studied in L o u isv ille , K y .—ln d .,1 by m a jo r industry d iv is io n /N o v e m b e r 1971
Industry division
Minimum employment in establish
ments in scope of study
Number of establishments Workers in establishments
Within scope of study3 Studied
Within scope of studyStudied
Total4Plant Office
Number Percent Total4
A ll divisions----------------------------------------- _ 612 133 169,998 100 117,828 23, 927 106,735
Manufacturing___________________________________ 50 223 53 100,813 59 77,315 9,278 72,261Nonmanufacturing---------------------------------------- - 389 80 69, 185 41 40,513 14,649 34,474
Transportation, communication, andother public utilities 5_____________________ 50 56 18 17,884 11 10,167 3, 040 13,581
Wholesale trade_____________________________ 50 69 11 8, 152 5 (M (‘ ) 3,457Retail trade__________________________________ 50 143 19 26,191 15 (6) 0 9,294Finance, insurance, and real estate_______ 50 56 14 9, 554 6 n (‘ ) 5, 134Services 8---------------------------------------------- 50 65 18 7,404 4 (6) (6) 3, 008
1 The Louisville Standard Metropolitan Statistical Area, as defined by the Office of Management and Budget (form erly the Bureau of the Budget) through January 1968, consists of Jefferson County, Ky.; and Clark and Floyd Counties, Ind. The "workers within scope of study" estimates shown in this table provide a reasonably accurate description of the size and composition of the labor force included in the survey. The estimates are not intended, however, to serve as a basis of comparison with other employment indexes for the area to measure employment trends or levels since (1) planning o f wage surveys requires the use of establishment data compiled considerably in advance of the payroll period studied, and (2) small establishments are excluded from the scope of the survey.
2 The 1967 edition of the Standard Industrial Classification Manual was used in classifying establishments by industry division.3 Includes all establishments with total employment at or above the minimum limitation. A ll outlets (within the area) of companies in such industries as trade, finance, auto repair service,
and motion picture theaters are considered as 1 establishment.4 Includes executive, professional, and other workers excluded from the separate plant and office categories.5 Abbreviated to "public utilities" in the A- and B-series tables. Taxicabs and services incidental to water transportation were excluded.6 This industry division is represented in estimates for "a ll industries" and "nonmanufacturing" in the Series A tables, and for "all industries" in the Series B tables. Separate presentation
of data for this division is not made for one or more of the following reasons: (1) Employment in the division is too small to provide enough data to m erit separate study, (2) the sample was not designed initially to permit separate presentation, (3) response was insufficient or inadequate to permit separate presentation, and (4) there is possibility of disclosure of individual establishment data.
7 Workers from this entire industry division are represented in estimates for "a ll industries" and "nonmanufacturing" in the Series A tables, but from the real estate portion only in estimatesfor "a ll industries" in the Series B tables. Separate presentation of data for this division is not made for one or more of the reasons given in footnote 6 above.
8 Hotels and motels; laundries and other personal services; business services; automobile repair, rental, and parking; motion pictures; nonprofit membership organizations (excluding religiousand charitable organizations); and engineering and architectural services.
Almost two-thirds of the workers within scope of survey in the Louisville area were employed in manufacturing firm s. The following presents the major industry groups and specific industries as a percent of all manufacturing:
Industry groups
Electrical equipment andsupplies_______________________ 20
Food and kindred products------ 11Tobacco manufactures------------ 10Chemicals and allied
products.._____________________ 9Fabricated metal products------ 8Machinery, except electrical... 8Transportation equipment_____ 7Printing and publishing________ 6Ordnance and accessories_____ 5
Specific industries
Household appliances__________ 20Cigarettes______________________ 10Motor vehicles and
equipment_____________________ 6Beverages______________________ 5Ordnance_______________________ 5
This information is based on estimates of total employment derived from universe materials compiled prior to actual survey. Proportions in various industry divisions may differ from proportions based on the results of the survey as shown in table 1 above.
Digitized for FRASER http://fraser.stlouisfed.org/ Federal Reserve Bank of St. Louis
W ag e T ren d s fo r S e le c te d O ccupational G roups
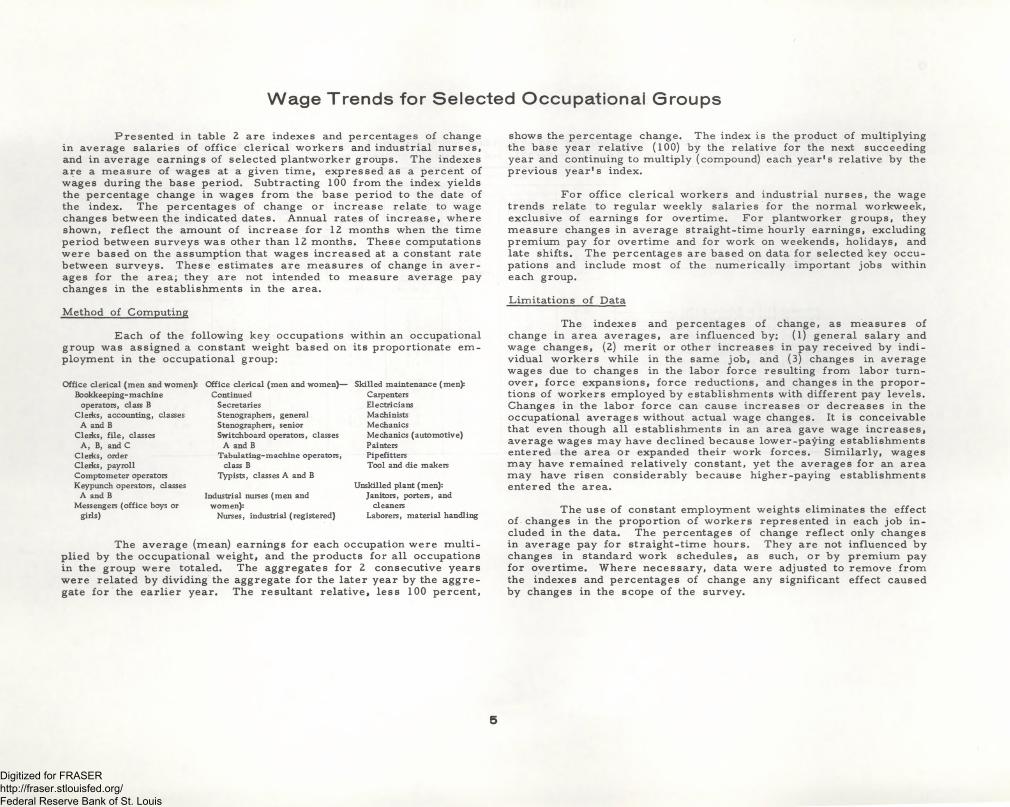
Presen ted in table 2 are indexes and percentages of change in average sa laries o f o ffice c le r ica l w orkers and industrial nurses, and in average earnings of selected plantworker groups. The indexes are a measure of wages at a given tim e, expressed as a percent of wages during the base period. Subtracting 100 from the index yields the percentage change in wages from the base period to the date of the index. The percentages of change or increase relate to wage changes between the indicated dates. Annual rates of increase, where shown, re flec t the amount o f increase fo r 12 months when the tim e period between surveys was other than 12 months. These computations w ere based on the assumption that wages increased at a constant rate between surveys. These estim ates are m easures of change in a ve rages for the area; they are not intended to m easure average pay changes in the establishments in the area.
Method of Computing
Each o f the follow ing key occupations within an occupational group was assigned a constant weight based on its proportionate em ployment in the occupational group:
Office clerical (men and women): Bookkeeping-machine
operators, class B Clerks, accounting, classes
A and BClerks, file, classes
A , B, and C Clerks, order Clerks, payroll Comptometer operators Keypunch operators, classes
A and BMessengers (office boys or
girls)
Office clerical (men and women)— Continued
SecretariesStenographers, general Stenographers, senior Switchboard operators, classes
A and BTabulating-machine operators,
class BTypists, classes A and B
Industrial nurses (men and women):
Nurses, industrial (registered)
Skilled maintenance (men): Carpenters Electricians Machinists MechanicsMechanics (automotive)PaintersPipefittersTool and die makers
Unskilled plant (men):Janitors, porters, and
cleanersLaborers, material handling
The average (mean) earnings fo r each occupation w ere m u ltip lied by the occupational weight, and the products fo r a ll occupations in the group w ere totaled. The aggregates fo r 2 consecutive years w ere related by dividing the aggregate fo r the la ter year by the a gg re gate fo r the e a r lie r year. The resultant re la tive , less 100 percent,
shows the percentage change. The index is the product of multiplying the base year re la tive (100) by the re la tive fo r the next succeeding year and continuing to m ultiply (compound) each yea r 's relative by the previous y ea r 's index.
F or o ffice c le r ica l w orkers and industrial nurses, the wage trends relate to regu lar weekly sa laries fo r the normal workweek, exclusive o f earnings fo r overtim e. F o r plantworker groups, they m easure changes in average stra ight-tim e hourly earnings, excluding prem ium pay fo r overtim e and fo r work on weekends, holidays, and late shifts. The percentages are based on data fo r selected key occupations and include most of the num erica lly important jobs within each group.
Lim itations of Data
The indexes and percentages o f change, as m easures of change in area averages, are influenced by: (1) general salary andwage changes, (2) m erit or other increases in pay received by ind ividual w orkers while in the same job, and (3) changes in average wages due to changes in the labor fo rce resulting from labor turnover, fo rce expansions, fo rce reductions, and changes in the p roportions o f w orkers employed by establishments with d ifferent pay levels . Changes in the labor fo rce can cause increases or decreases in the occupational averages without actual wage changes. It is conceivable that even though a ll establishments in an area gave wage increases, average wages may have declined because lower-paying establishments entered the area or expanded their work forces . S im ilarly , wages m ay have remained re la tiv e ly constant, yet the averages fo r an area m ay have risen considerably because h igher-paying establishments entered the area.
The use o f constant employment weights elim inates the effect of changes in the proportion o f w orkers represented in each job in cluded in the data. The percentages of change re flec t only changes in average pay fo r stra ight-tim e hours. They are not influenced by changes in standard work schedules, as such, or by prem ium pay for overtim e. W here necessary, data w ere adjusted to rem ove from the indexes and percentages of change any significant effect caused by changes in the scope o f the survey.
5
Digitized for FRASER http://fraser.stlouisfed.org/ Federal Reserve Bank of St. Louis

T a b le 2 . In d ex es o f s tand ard w ee k ly sa laries and s tra ig h t-tim e hourly ea rn ing s fo r se lec ted occupational g roups in L o u isv ille , K y .—Ind., N o v e m b e r 1 9 7 0 and N o v e m b e r 1971, and p e rc en ts o f in c re ase fo r se lec ted p erio ds
Period
All industries Manufacturing
Office clerical
(men and women)
Industrial nurses
(men and women)
Skilledmaintenance
trades(men)
Unskilledplant
workers(men)
Office clerical
(men and women)
Industrial nurses
(men and women)
Skilledmaintenance
trades(men)
Unskilled plant
wo rkers (men)
Indexes (February 1967=100)
November 1970------------------------------------------- 120. 6 127. 7 122. 9 125. 4 119. 1 127. 2 122. 2 125. 1November 1971__________________________________ 126. 8 141. 7 133. 7 133. 3 127. 2 142. 1 133. 3 132.9
Percents of increase
February 1961 to February 1962_______________ 2.9 2. 6 2.9 3. 5 3. 7 2. 1 2. 7 4. 1February 1962 to February 1963------------------- 3.4 2. 0 3. 1 1. 4 1.9 2. 5 3. 1 1. 3February 1963 to February 1964_______________ 3. 1 3. 5 2. 6 3. 6 3. 1 3.9 2.4 4. 6February 1964 to February 1965------------------- 3. 6 0 1.4 3.6 4. 3 0 . 9 4. 1February 1965 to February 1966------------------- 3. 1 4. 3 3.0 1. 7 2. 8 4. 3 2.9 1. 1February 1966 to February 1967------------------- 5. 5 5. 6 4. 6 2. 5 4. 0 4. 6 4. 8 1. 8February 1967 to February 1968------------------- 3.6 8. 8 4. 7 6. 1 4.4 8. 8 4. 5 6. 0February 1968 to November 1968:
9-month increase------------------------------------ 3. 7 4. 0 5. 2 5. 0 3. 0 4. 4 5.4 5. 6Annual rate of increase — --------------------- 5. 0 5. 4 7. 0 6. 7 4. 0 5.9 7. 3 7. 5
November 1968 to November 1969----------------- 5. 8 3.9 4. 8 4. 2 4. 1 3. 5 5. 0 3.9November 1969 to November 1970----------------- 6. 2 8. 6 6. 5 8. 0 6. 4 8. 2 5. 7 7. 6November 1970 to November 1971----------------- 5. 1 11. 0 8. 8 6. 3 6. 8 11. 7 9. 1 6. 2
Digitized for FRASER http://fraser.stlouisfed.org/ Federal Reserve Bank of St. Louis

A. Occupational earnings
T a b le A -1 . O f f ic e o c c u p a t io n s —m en and w o m e n
(A verage stra igh t-tim e w eek ly hours and earnings fo r se lected occupations studied on an area basis by industry d iv is ion , L o u is v ille , K y.—Ind., N ovem ber 1971)
7
Weekly(stan
earnings 1 dard) Number of worke rs receiving straight-time weekly earning s of—
Sex, occupation, and industry divisionNumber
ofwoikere
Averageweekly
(standard)Mean2 Median2 Middle range2
% %60
andunder
65*
70$
75t
80% %
85 90*
95*
1 0 0$
105$
n o$
1 1 5*
1 2 0$
130*
1*0*
150*
160%
170s
180i —
190i — •
2 0 0
and
65 70 75 80 85 90 95 100 105 110 11 5 120 130 1*0 150 160 170 180 190 200 over
HEN
CLERKS. ACCOUNTING, CLASS A 2*8 * 0 . 0* 0 . 0
$ $16 6.0 016 9 .5 01 5 7 .0 0
$ $1 3 9 . 0 0 - 1 7 7 . 5 01 6 1 . 0 0 - 18 7 .0 01 3 6 . 0 0 - 1 7 5 . 5 0
11
1 12 13 * 1 16 21 352540
23 2 01 7 1 . 0 01 5 5 . 5 0 1 12 8loZ * 0 . 0 4 8
CLERKS. ACCOUNTING. NONMANUF AC TURING
CLASS 51*5
* 0 . 0* 0 . 0
3 "0 2 10 5136 30 1 * 1 . 0 0 1 2 5 .0 0 1 1 7 . 5 0 - 1 6 9 . 0 0 2
;
24 19 156 * 0 . 0 1 3 7 . 5 0 1 * 3 . 0 0 1 1 3 . 0 0 - 1 * 9 . 0 0CLERKS, ORDER
9 1 . 5 0 88.50 8 0 .5 0 - 93 .50 2* 15 25 3* 1 1j u t s i
NONMANUFACTURING30 ' 3 9 .0 T~*'0 88.00 8 0.00 - 93 .50
-20 12 18 22 1 192
WOMEN
BILLERS. MACHINE (BILLING* 0 . 0 1 0 1 . 5 0 1 1 0 . 5 0 8 1 . 0 0 - 1 1 9 . 5 0 8 1■ ■
BOOKKEEPING-MACHINE OPERATORS,102.00109.00
95.00
13 2017
20 17 1 01 0
1 11
7.: 33*0 10A.009 7 .5 0
9 3 . 0 0 - 1 3 5 . 5 0 8 * . 5 0 - 1 0 6 . 0 050 * 0 . 0 13 16
817
31
1
10 3216
* 52520
30CLASS A 1 7 *176
* 0 .0 1 3 * .0 01 1 9 .0 0
126150 1 1 3 . 5 0 - 1 5 9 . 0 0 1538
1720
12 29nonmanufacturing 10 1* 2 1
*
703931
n o* 565
522131
00 "0 32 -CLA^j
219 10 5.0095.00
10210095.00
9 5 . 0 0 - 1 1 5 . 0 07 8 . 5 0 - 1 0 7 . 0 0
1529
1330
223*
7 I14
NONMANUFACTURING *32_ _ 27 18 33 27 25 23 -J O .O
CLERKS, FILE, CLASS 59 * 0 . 0 10 8.50 93 .5 0 9 1 . 0 0 - 1 1 * . 5 0 10 2626
8 1 1_
A 2
CLERKS, FILE, CLASS 22 1*10
209o o * nn 9'* 0 0 2
1zZ£ * *
CLERKS, FILE, CLASS NONMANUFACTURING
„ r „ _____ 39 16 18 _ _1c
9 3 .50 10 0.50
8 7.5 0
92.00 9 * . 5 0 9 1 . 5 0
8 6 .5 0 - 95.008 6 . 0 0 - 109.008 7.0 0 - 93 .50
17 2*2*
271215
931875
1312
1 01 0
1717
11 5 * 0 . 0 17
30 5 1 2 * . 5 01 2 1 . 5 01 2 7 . 5 0
12 3 .0 0 13 0 .5 01 1 9 .0 0
1 0 0 . 5 0 - 1 3 9 . 5 01 0 2 . 0 0 - 1 3 9 . 0 0
9 5 . 0 0 - 1 8 1 . 0 0
1 16 10 1* 11 221210
8 1 2 51 1 11
111̂ * 0 . 020
1t2rir 12 10m 39.0 1 1
6558
3 9.03 9.0
1 1 3 . 5 01 1 2 . 5 0
1 1 0 . 0 099.00
7 7 . 0 0 - 1 5 9 . 5 07 5 . 5 0 - 1 6 5 . 5 0
88
1 5
* W orkers w ere distributed as fo llow s: 12 at $ 200 to $210; and 2 at $210 to $ 220.
See footnotes at end of tables.
Digitized for FRASER http://fraser.stlouisfed.org/ Federal Reserve Bank of St. Louis

8
Table A-1. Office occupations—men and wom en-----Continued
(Average straight-time weekly hours and earnings for selected occupations studied on an area basis by industry division, Louisville, K y—Ind., November 1971)
Sex, occupation, and industry division
Weekly(stan
earnings * dard) Number of workers receiving straight-time we ekly earnings of—
Numberof
» S S S $ S f * i s $ $ ( % t i $ t t 1 ----1 ---weekly 60 65 70 75 80 85 90 95 100 105 110 115 120 130 1*0 150 160 170 180 190 200
workers hours 1 Mean 2 Median2 Middle range2 and(standard) under and
65 70 75 80 85 90 95 100 105 110 115 120 139 1*0 . 150 160 w o 180 190 200
$ $ $ $3*6 39.5 115.00 10*.00 97.00-121.50 - “ 5 29 39 37 79 35 16 18 22 12 2 * 3 27 15 2 173 39.5 117.00 116.50 102.50-129.00 - - - - 5 2 * 16 2 5 10 13 8 1 * 3273 39.5 11*.50 103.00 95.50-115.00 “ “ 5 2* 37 33 63 33 11 8 9 * 1 - - 27 15 2 i502 39.5 101.00 98.00 86.50-115.50 3 2 18 *9 *1 *6 51 73 *1 23 2* 61 31 13 6 3 11 * 2 - -200 39.5 111.50 115.50 97.00-120.00 - - - * 7 15 13 29 5 9 12 59 28 2 6 3 2 * 2 - -302 39.5 9*.00 92.50 81.00-101.50 3 2 18 *5 3* 31 38 ** 36 1* 12 2 3 11 “ “ 9 * * *
73 38.0 83.50 86.00 69.00- 9*.50 10 10 5 6 5 5 17 9 3 1 - 1 - 1 - - - - - - -25 39.0 92.00 93.00 82.50- 99.50 - - 3 3 2 8 * 2 1 1 - 1 - - - - -*a 37.5 79.00 79.00 66.00- 92.00 10 10 2 3 5 3 9 5 1
1, *19 39.0 130.00 130.00 107.50-1*7.50 1 1 2 7 12 31 68 115 62 113 69 70 15* 237 186 75 8* 56 *5 15 168*5 39.5 137.00 13*.00 120.50-1*9.50 - - - - 1 12 21 55 27 35 21 35 81 200 156 50 61 30 32 12 1657* 38.5 119.50 113.00 99.50-13*.00 1 1 2 7 11 19 *7 60 35 78 *8 35 73 37 30 25 23 26 13 3 -120 39.5 158.00 159.00 1**.00-172.50 2 3 16 22 21 20 23 10 3 *90 39.5 1*2.00 138.00 126.50-159.50 - - - - - - - * * 5 1 - 20 18 7 10 2 8 9 1 155 *0.0 1*3.50 139.00 129.00-160.00 - - - - - - - * * • - - 7 16 3 8 2 5 5 - 135 38.5 1*0.00 129.50 126.00-160.00 5 1 - 13 2 * 2 - 3 * 1 -
273 39.0 135.50 132.00 109.50-161.50 - - - - - 1 3 38 18 9 19 20 20 27 18 23 3* 15 22 1 51*7 39.5 1*8.00 155.00 130.50-170.00 - - - - - - - 23 * 1 3 2 3 12 15 16 32 9 22 - 5126 38.5 121.00 117.00 10*.50-131.50 - - - - - 1 3 15 1* 8 16 18 17 15 3 7 2 6 - 1
*70 39.5 137.50 139.50 121.00-1*9.50 - _ . - 1 3 17 2* 11 20 10 25 70 56 130 29 29 1* 9 12 10306 39.5 1**.00 1*6.00 131.00-1*9.50 - - - - - 1 10 9 1 6 1 11 33 ** 120 20 17 8 3 12 1016* 38.5 126.00 122.00 107.00-1*3.00 - - - - 1 2 7 15 10 1* 9 l* 37 12 10 9 12 6 6 - -55 38.5 153.50 153.00 1*0.00-166.50 1 3 10 10 9 11 6 5
561 39.5 118.50 11*.00 99.50-133.00 1 1 2 7 11 27 *8 *9 27 1e 39 21 *2 130 26 13 16 19 3 1 -315 *0.0 12*.00 130.00 109.00-133.50 - - - - 1 11 11 19 16 27 17 18 36 122 16 6 7 8 - - -2*6 38.5 111.00 106.00 93.50-11*.50 1 1 2 7 10 16 37 30 11 51 22 3 6 8 10 7 9 11 3 1 **53 39.0 110.50 108.00 96.00-119.50 1 3 1 12 22 *8 15 58 38 *5 *3 62 17 *2 3 20 16 5 2 - -217 39.5 110.00 111.00 100.00-118.00 - - - - 1 21 12 20 21 30 23 58 13 9 2 7 - - - - -236 39.0 111.50 103.50 89.00-132.00 1 3 1 12 21 27 3 38 17 15 20 * * 33 1 13 16 5 2 - -101 39.0 13*.00 133.00 112.00-159.50 1 2 1 1 1 8 2 8 * * 2 30 1 13 16 5 2 -
366 39.0 125.00 121.50 106.00-139.00 - - _ - - 2 28 30 21 *5 16 3* 5* 52 12 30 19 16 6 1 -178 39.5 129.00 126.00 113.50-1*9.00 - - - 2 2 9 1* 9 12 23 33 22 9 26 6 7 * - -188 38.5 121.50 115.00 100.00-137.50 - “ “ “ “ 26 21 7 36 * 11 21 30 3 * 13 9 2 1 -
137 39.5 89.50 85.00 76.50- 98.00 3 5 21 18 22 2 29 6 5 3 * 12 2 1 3 1 - - . - -32 38.5 101.00 110.50 83.00-117.50 - “ - - 13 - 1 - 1 1 * 9 2 - 1 - - - - -
105 39.5 86.00 83.50 7*.50- 9*.00 3 5 21 18 9 2 28 6 * 2 * 3 “ 1 2 1 * * * “
2*1 39.5 98.00 96.00 89.00-10*.00 - - 13 19 3 3* *3 39 38 7 8 10 17 5 2 3 _ - _ _ -130 *0.0 97.50 96.50 86.00-108.50 - 13 16 22 12 9 22 6 8 6 6 5 2 3 - - - - -111 39.0 98.50 96.00 91.50-101.50 3 3 12 31 30 16 1 * 11
** 39.5 130.00 131.50 99.00-135.00 2 * 2 * 5 - • 1 16 1 • 1 1 1 * 225 39.5 131.00 105.00 92.50-191.00 2 * 3 * 1 3 1 1 * 2
WOMEN - CONTINUED
KEYPUNCH OPERATORS, CLASS A -----------MANUFACTURING -------------------------------NONMANUFACTURING --------------------------
KEYPUNCH OPERATORS, CLASS B ------------MANUFACTURING-------------------------------NONMANUFACTURING --------------------------
MESSENGERS IOFFICE CIRLSI ---------------MANUFACTURING -------------------------------NONMANUFACTURING --------------------------
SECRETARIES ----------------------------------------MANUFACTURING -------------------------------NONMANUFACTURING --------------------------
PUBLIC UTILITIES ----------------------
SECRETARIES, CLASS A --------------------MANUFACTURING -------------------------------NONMANUFACTURING --------------------------
SECRETARIES, CLASS B ---------------------MANUFACTURING -------------------------------NONMANUFACTURING --------------------------
SECRETARIES, CLASS C --------------------MANUFACTURING-------------------------------NONMANUFACTURING --------------------------
PUBLIC UTILITIES ----------------------
SECRETARIES, CLASS D --------------------MANUFACTURING-------------------------------NONMANUFACTURING --------------------------
STENOGRAPHERS, GENERAL --------------------MANUFACTURING -------------------------------NONMANUFACTURING --------------------------
PUBLIC UTILITIES ----------------------
STENOGRAPHERS, SENIOR ----------------------MANUFACTURING ------------------------------NONMANUFACTURING -------------------------
SWITCHBOARD OPERATORS, CLASS B ------MANUFACTURING -------------------------------NONMANUFACTURING-------------------------
SWITCHBOARD OPERATOR-RECEPTIONISTS-MANUFACTURING -------------------------------NONHANUFACTURING -------------------------
TABULATING-MACHINE OPERATORS,CLASS B ---------------------------------------------
NONMANUFACTURING -------------------------
See footnotes at end of tables.
Digitized for FRASER http://fraser.stlouisfed.org/ Federal Reserve Bank of St. Louis

(A v e r a g e s t r a ig h t - t im e w e e k ly h o u r s an d e a r n in g s f o r s e le c t e d o c c u p a t io n s s tu d ie d on an a r e a b a s i s b y in d u s t r y d iv is io n , L o u i s v i l l e , K y .—In d ., N o v e m b e r 1971 )
T a b l e A - 1 . O f f i c e o c c u p a t i o n s — m e n a n d w o m e n ----- C o n t i n u e d
9
Sex, occupation, and industry divisionNumber
ofAverageweekly
(standard)
Weekly earnings 1 (standard) Number of w o rk e rs re cei ving s tra ig ht-t ime we ekly earnings of---
Mean* Median* Middle range*
» S60
andunder
65
S65
70
t70
75
75
80
t80
85
$85
90
t90
95
*95
100
t100
105
$105
110
S110
1 1 5
1 1 5
120
i120
130
$130
160
S S160
150
150
160
$160
170
$170
180
S180
190
1 ------- i ------190 200
- and
WOMEN - CONTINUED
TRANSCRIBING-MACHINE OPERATORS, $ $ $ $GENERAL----------------------------------------------- 289 3 9 . 5 10 5.00 9 7 .5 0 9 1 . 5 0 - 1 1 8 . 0 0 * 18 30 81 30 20 6 27 10 37 20 - 10 ~ - -
TYPISTS, CLASS A -------------------------------- 163 3 9 .5 1 1 6 .0 0 1 1 3 . 0 0 9 3 . 0 0 - 1 3 5 .0 0 - - 1 - 18 12 17 20 8 2 7 13 23 25 2 6 6 7 _ _
MANUFACTURING------------------------------------ 66 3 9.0 1 1 9 .0 0 1 2 5 .5 0 9 6 . 5 0 - 1 2 9 . 5 0 - - 1 - 6 3 2 2 - - 1 6 17 1 2 4 3 - - - -NONMANUFACTURING------------------------------ 1 1 7 60 .0 1 1 2 . 0 0 10 3.0 0 9 3 . 0 0 - 1 3 5 . 5 0 - - 12 9 15 18 8 2 6 9 6 26 - - 1 7 - -
TYPISTS, CLASS B ------------------------------------ 527 3 9.0 88.50 88.50 7 7 . 5 0 - 95 .5 0 - 69 56 66 66 66 107 70 9 18 15 7 11 1 1 i 8 - - -
MANUFACTURING ------------------------------------ 109 3 9 . 5 9 2 .5 0 9 1 .0 0 8 2 . 0 0 -10 0 .0 0 8 6 9 11 18 16 15 7 10 “ 2 6 1 1 i - - - -
NONMANUFACTURING ------------------------------ 618 3 9.0 8 7.50 87.00 7 6 . 5 0 - 95.00 61 68 55 55 28 91 55 2 8 15 5 7 8
S e e fo o tn o te s a t en d o f t a b le s .
Digitized for FRASER http://fraser.stlouisfed.org/ Federal Reserve Bank of St. Louis

10
T a b l e A - 2 . P r o f e s s i o n a l a n d t e c h n i c a l o c c u p a t i o n s — m e n a n d w o m e n
(A v e r a g e s t r a i g h t - t im e w e e k ly h o u r s an d e a r n in g s f o r s e le c t e d o c c u p a t io n s s tu d ie d on an a r e a b a s i s b y in d u s t ry d iv is io n , L o u i s v i l l e , K y . —In d . , N o v e m b e r 1971)
Weekly earnings 1 (standard) Number of w ork ers re cei ving st ra ig ht-t ime weekly earnings of---
S ex , occupation, and industry divisionNumber
ofAverageweeklyhours1
standard)Mean * ** Median2 Middle range2
180
andunder
t90
*100
*11 0
$120
*130
»140
% t150 160
$170
>180
t190
*200
$210
*220
i230
s240
*250
»260
$270
S280
and
90 100 110 120 130 140 150 160 170 180 190 200 210 220 230 240 250 260 270 280 over
HEN$ $ $ $
8 10 2423
11A3 3 9 , 5 18 8.0 0 1 9 7 . 5 0
16 5 .0 0
140 .00
1 9 5 .0 0 -2 0 0 .0 01 5 0 . 5 0 - 1 8 7 . 5 0
1 2 4 . 5 0 - 1 7 5 .0 0
1
21
8
1 4 8 .5 0 12 20 19 1940*0
73
35
3 9 . 5
3 9 . 5
1 3 1* 5 0
1 2 2 . 5 0
13 0.0 0
1 2 1 . 0 0
12 0 . 0 0 - 1 4 4 .0 0
9 9 .0 0 - 1 4 7 . 0 0
11 19 1
10 1 6 2 3
COMPUTER PROGRAMERS,5636
3 9 . 53 9 . 5
22 0.5 02 3 2 .5 0
2 2 7 . 5 0247.00
1 8 4 . 0 0 - 248.002 0 3 .0 0 - 249.50
19182
COMPUTER PROGRAMERS*8
35 2 1 5 .0 0 2 1 2 . 5 0 2 1 0 . 0 0 - 2 1 4 . 5 0 1 1 2 19
COMPUTER PROGRAMERS,
COMPUTER SYSTEMS ANALYSTS,244.00-3217. 50 i 2 3 2
39*5 *503
MA NUFACTURING ™^ ——
COMPUTER SYSTEMS ANALYSTS*5446
40 .040 .0
2 6 1 . 5 026 9.50
26 2 .50 2 4 1 . 0 0 - 29 0.502 4 9 .0 0 - 2 9 5.5 0
i 31
11
3 2
2
8
53BUSINESS* CLASS B
1272.00 6 5 r9
COMPUTER SYSTEMS ANALYSTS,22 6.00
207.00
i
25
1
2
i
88
DRAFTSMEN, CLASS A ---------------------------- 128 3 9 . 5 208.50 1 7 8 . 5 0 - 2 3 2 . 0 0 - - - - 3 6 - - 4 8 9 1312
1210
1312
1717
6 2
MANUFACTURING ------------------------------- 222 4 0 .0 1 7 2 . 0 0 16 9 .5 0 1 6 1 . 0 0 - 1 9 1 . 5 0 - 4 4 - 13 14 12 67 34 8 46 4 - 3 10 i 1 - 1 -
40 0 2624
11MANUFACTURING ------------------------------- 199 40 .0 1 4 2 . 5 0 1 4 8 . 5 0 1 3 7 . 5 0 - 1 5 6 . 0 0 - 22 - 9 1 1 15 54 54 4 2 1 - 1 - i - - - -
WOMEN
35 1 1 7 . 0 0 1 1 3 . 5 0 1 1 0 . 5 0 - 1 2 0 . 0 0 19 230*5
40 40 .04 0 .0
10 7 .0 010 6.50
10 8.501 0 8 .5 0
9 9 . 0 0 - 1 1 6 . 0 09 7 . 5 0 - 1 1 6 . 0 0
13 29 2
COMPUTER PROGRAMERS,
32 1 4 5 .5 0 1 5 4 .0 0 1 1 3 . 0 0 - 16 4 .0 01 1 2 . 0 0 - 16 3.00
31
3Zl 38.0 1 4 1 . 0 0 l v l . ^ 0 5 2 3 9 2
NURSES, INDUSTRIAL (REGISTERED) ----- 8681
3 9 . 53 9 . 5
160.001 6 1 . 0 0
1 6 1 . 5 016 2.0 0
1 4 9 . 0 0 - 1 6 8 . 5 01 4 9 . 5 0 - 1 6 9 . 0 0
- 2 1 - - 6 1513
1312
3130
7 4 3 4
* W o r k e r s w e r e d is t r ib u t e d a s f o l lo w s : 6 a t $280 to $300 ; 4 a t $300 to $320 ; 7 a t $320 to $340 ; 2 a t $340 to $360 ; an d 2 a t $360 to $380 .* * W o r k e r s w e r e d is t r ib u t e d a s f o l lo w s : 12 a t $2 80 to $300 ; 4 a t $300 to $320 ; an d 3 a t $320 to $340 .
See footnotes at end o f tab les.
Digitized for FRASER http://fraser.stlouisfed.org/ Federal Reserve Bank of St. Louis
11
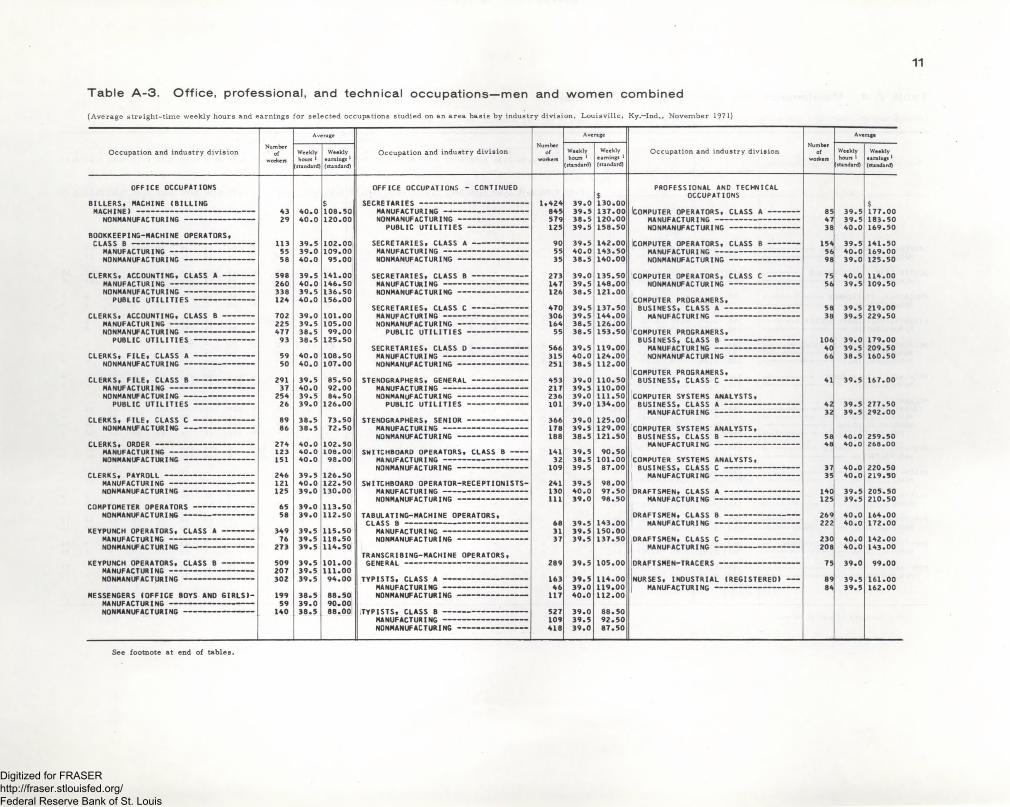
T a b l e A - 3 . O f f i c e , p r o f e s s i o n a l , a n d t e c h n i c a l o c c u p a t i o n s — m e n a n d w o m e n c o m b i n e d
(A v e r a g e s t r a ig h t - t im e w e e k ly h o u r s a n d e a r n in g s f o r s e le c t e d o c c u p a t io n s s tu d ie d on a n a r e a b a s i s b y in d u s t r y d iv is i o n , L o u i s v i l l e , K y .—In d ., N o v e m b e r 1971)
Average Average Average
O c c u p a t io n an d in d u s t ry d iv is i o nNumber
of Weekly
’standard)
Weekly earnings 1 (standard)
O c c u p a t io n an d in d u s t ry d iv is io nNumber
ofworkers
Weekly hours 1
(standard)
Weekly earnings 1 (standard)
O c c u p a t io n an d in d u s t ry d iv is io nNumber
of Weekly hours 1
(standard)
Weekly earnings 1 (standard)
OFFICE OCCUPATIONS
BILLERS, MACHINE (BILLING
OFFICE OCCUPATIONS - CONTINUED PROFESSIONAL AN0 TECHNICAL OCCUPATIONS
A32 9
40 .0 10 8.50120.00
845579
3 9 . 53 8 . 53 9 . 5
3 9 . 540 .03 8 . 5
3 9 .03 9 . 5
r30"13 7 .0 0120.0015 8 .5 0
14 2 .0 01 4 3 . 5 0140 .00
1 3 5 . 5 014 8 .0 0
.-r.-n r, . -r f . * r- r A 8547
$1 7 7 .0 01 8 3 .5 016 9 .5 0
40 .0
BOOKKEEPING-MACHINE OPERATORS,11 3
55102.00109.00
95 .0 0
1 4 1 .0 0 1 4 6 .5 0
1543 9.0 5 5
3 5
273147
40 .0 16 9.001 2 5 .5 0
11 4 .0 0109.50
90
598260
3 9 . 54 0 .0
7 556
40 .03 9 . 5
j tU K b 1A K lta f tLA ao O
156 .0 03 0 .3
COMPUTER PROGRAMERS,1Z * 40 .056 7 io nn
_ _ _3 9.0 1 91 99 79*^ 144 .0 0
105*00 7n ~229.50
f 77 99.001 2 5 .5 0
*55 79 ** 1 5 3 . 5 0 COMPUTER PROGRAMERS,on ^
3 8 . 5179 0093 3 0 .5
566 3 9 . 540 .0
1 1 9 .0 012 4.0 0
40 3 9 .5 209.5059 40 .0 10 8.50
jLI,KL 1 AH i L w 1 LLAuu 1J ™ "66 16 0.50
8 5.5 0COMPUTER PROGRAMERS,
3 9 . 5 16 7.0 0291110*00
254 8 4.5012 6 .0 0
1 1 1 . 5 013 4.00
COMPUTER SYSTEMS ANALYSTS,26
39 5 3 9 .0 3 9.0 42 3 9 . 5
3 9 . 52 7 7 .5 0BUSINESS* CLASS A ——————————————
7a R9 | 79 s 1 C nn3 9 ^ 1 ?9 nn3 0 . 5 TZ .-aO|
1 -n274 40 .0 1 0 2 .5 0
1 Z 1 . 3 040 268.00
on «;n •f JJ 10 1* 000.0 9 . 0
1 no 7 9 *? 87.00109 3 9 . 5
t i t 4n ’ n 126 50_____ _ 79 « « ««70 O . _ _ . . . * J
lZ 3 * 39*0 O O ' OCOMPTOMETER OPERATORS ----------------------- 65 3 9 .0
3 9 .01 1 3 . 5 0
3 9 . 5 143 .0 0 77779 - 1 1 5 50
1 2.00
79*9 1 1 8 . 5 0 7 9 *?273 33 5
3 9 . 5 13 7 . ^ 0200
_ n _
1 0 1 . 0 01 1 1 . 0 0
94 .0 0
TRANSCRIBING-MACHINE OPERATORS,l\t YrUNUn Ur tKA 1 UK jy ULA jb B
MANUFACTURING -------------------------------- 207 3 9 I 53 9 . 5
UK Ar 1 j f l t N 1 KAl/tKj
302 ** 1 w . w l a j j^46 1 1 9 I 00
18 501 40*0MANUFACTURING ------------------------------- 59
30 53 9 . 03 8 . 5
90.0000.00
3 9 . 53 9 . 0
9***^0NONMANUFACTURING -------------------------- 418 8 7 .5 0
See footnote at end of tables,
Digitized for FRASER http://fraser.stlouisfed.org/ Federal Reserve Bank of St. Louis

1 2
T a b l e A - 4 . M a i n t e n a n c e a n d p o w e r p l a n t o c c u p a t i o n s
(A ve rage s tra igh t-tim e hourly earnings fo r se lected occupations studied on an a rea basis by industry d iv is ion , L ou isv ille , K y —Ind., N ovem ber 1971)
Hourly earnings3
S ex , occupation, and industry divisionNumber
ofworkers Mean 2 vledian2 Middle range 2
HEN
CARPENTERS, MAINTENANCE ------------------- 171 4.86 4.88 4.77- 5.16
4.99 *•78 5.65601 -».09
ENGINEERS, STATIONARY ---------------------- 97 4.73 4.72 4.48- 4.97
1*0 **21 ***5 ? *o * 4*62
| ^ \ * ̂lOO 3*75 3*30
'it 1*?5 5*28
MECHANICS, AUTOMOTIVEfc ” ns A* aT
A ' *56 _ ,.* . 4.57 , _ -3+0 *•03 4.5Z 3.Z0
MECHANICS, MAINTENANCE --------------------- 834 4.54 4.73 4.22- 4.89
MILLWRIGHTS ---------------------------------------- 280 5.29 5.54 4.89- 5.60
11̂ ) "
360 5.16 5.16 4.91 3.50360
SHEET-METAL WORKERS, MAINTENANCE — 82 5.41 5.56 5.01- 5.85
397 5.25 5.24 5.16- 5.29
T t t t i $ i i 5 tU n d e r2 *60 2 *70 2 * 80 2 * 90 3 ,0 0 3 *10 3 *20 3 *30 3 ,6 0 3 *50
and
Number of w o rk e rs rec ei ving st ra ig ht-t ime hourly earnings of—
2.70 2.80 2.90 3.00 3.10 3.20 3.30 3.40 3.50 3.60
t t t t t t t t t t t t 3.60 3.80 4.00 4.20 4.40 4.60 4.80 5.00 5.20 5.40 5.60 5.80
3.80 4.00 4.20 4.40 4.60 4.80 5.00 5.20 5.40 5.60 5.80 6.00
1313
16
16
15
15
3124
1010
299
20
2020
232
21
1211
10 - 4 - 23 61 30 - 14 1 7 -
8 “ 4 - 23 60 28 “ 14 17
11 24 16 22 101 148 11 5 • 20 167 3011 24 16 13 96 148 68 20 167 30
- 8 12 18 30 5 6 6 1 4 5“ - 8 15 30 4 5 6 - 4 5
- 11 24 39 14 11 6 - 1 5 -
11 24 36 14 11 6 - 1 5 -
65 1 13 - - 3 - _ _ - _
26 1 13 - - 3 - - - - -
39
16 24 - 1 1 9 30 11 4 46 55 120 _ -
16 24 * 1 1 9 30 1 1 4 45 44 120 ” “
15 15 25 224 16 60 29 36 63 40- - 6 14 5 50 16 1 36 - -
15 15 19 210 11 10 13 35 27 40 -
* 19 201 11 1 13 35 27 40 -
72 44 103 14 219 192 21 59 16 14 _
71 40 100 8 198 192 21 59 16 14 -
- - _ _ - 62 - - 140 63 _
* “ 62 - 140 63 -
1 5 1 3 41 34 23 _ 6 2 -
“ 5 * 3 41 34 23 6 1 -
4 - 21 . 21 96 72 15 63 66 104 21 21 96 72 15 63 66 10
7 13 19 _ 4 3 367 13 19 - 4 3 36
1 10 20 52 24 205 8 - 771 10 20 52 24 205 8 - 77
See footnotes at end o f tab les.
Digitized for FRASER http://fraser.stlouisfed.org/ Federal Reserve Bank of St. Louis

T a b l e A - 5 . C u s t o d i a l a n d m a t e r i a l m o v e m e n t o c c u p a t i o n s
(A ve ra g e s tra igh t-tim e hourly earnings fo r se lected occupations studied on an area basis by industry d iv is ion , L o u isv ille , Ky.—Ind., N ovem ber 1971)
1 3
Sex, occupation, and industry division
HEN
GUARDS AND WATCHMEN -------------------------MANUFACTURING-------------------------------NONMANUFACTURING -------------------------
GUARDSMANUFACTURING -------------------------------
WATCHMENMANUFACTURING -------------------------------
JANITORS, PORTERS, AND CLEANERS ----MANUFACTURING -------------------------------NONMANUFACTURING -------------------------
PUBLIC UTILITIES ----------------------
LABORERS, MATERIAL HANDLING -----------MANUFACTURING -------------------------------NONMANUFACTURING -------------------------
ORDER FILLERS ----------------------------------MANUFACTURING-------------------------------NONMANUFACTURING-------------------------
PACKERS, SHIPPING -----------------------------MANUFACTURING -------------------------------
RECEIVING CLERKS -------------------------------MANUFACTURING -------------------------------NONMANUFACTURING -------------------------
SHIPPING CLERKS --------------------------------MANUFACTURING-------------------------------
SHIPPING AND RECEIVING CLERKS --------MANUFACTURING -------------------------------
TRUCKDRIVERS ------------------------------------MANUFACTURING -------------------------------NONMANUFACTURING --------------------------
PUBLIC UTILITIES ----------------------
TRUCKDRIVERS, LIGHT (UNDER1 - 1 / 2 TONS) ----------------------------------MANUFACTURING -------------------------------NONMANUFACTURING --------------------------
TRUCKDRIVERS, MEDIUM ( 1 - 1 / 2 TOAND INCLUDING A TONS) -----------------MANUFACTURING -------------------------------NONMANUFACTURING -------------------------
TRUCKDRIVERS, HEAVY (OVER A TONS,TRAILER TYPE) -------------------------------MANUFACTURING -------------------------------NONMANUFACTURING --------------------------
PUBLIC UTILITIES ----------------------
Hourly earnings3
Number * S1 . 6 0 1 . 7 0
i1 . 8 0
t1 . 9 0
S2.00
t2 . 1 0
workers Mean ^ Median^ Middle range ^ andunder
1 . 7 0 1 . 8 0 1 . 9 0 2.00 2 . 1 0 2.2 0
1 , 3 1 7$2 . 4 5
$1 . 6 9
$ $ 1 . 6 5 - 3 .6 7 712 36 3 6 24 18
5 1 1 3 .5 0 3 .8 5 2 . 9 3 - 3 .95 36 - - 8 -806 1 . 7 8 1 . 6 6 1 . 6 3 - 1 . 6 9 71 2 3 6 16 18
388 3 .8 6 3 .9 2 3 . 8 0 - 3 .9 7 - - - - -
123 2 . 3 7 2 . 5 2 1 . 7 9 - 2.6 0 36 - - 8 -
2 ,2 0 1 2 . 7 6 2 .7 8 1 . 9 2 - 3 .5 2 19 7 244 86 106 81 731 , 2 8 1 3 . 2 7 3 .2 9 3 . 0 1 - 3 .6 7 - - 10 4 16 34
920 2 .0 5 1 . 8 3 1 . 7 1 - 2 . 1 2 197 244 76 102 65 3955 3 .4 5 3 .3 9 3 . 3 2 - 3 .6 9
1 , 7 0 2 3.2 8 3.2 2 2 . 7 2 - 4 .0 2 - 1 10 37 141 ,4 4 0 3 .2 5 3 . 1 9 2 . 7 1 - 3 .9 6 - - - 8 34 8
262 3 .4 4 3 .7 3 2 . 9 1 - 4 .0 4 - 1 2 3 6
914 3 .5 9 3 .48 3 . 1 3 - 4 . 3 4587 3 .6 9 3 .48 3 . 3 6 - 4 .43327 3 .4 2 3 .38 2 . 9 8 - 3 .68
412 3 .3 2 3 .3 6 2 . 9 2 - 3 .88 _ - 28 _ -
369 3 . 3 7 3 .3 9 3 . 0 2 - 3 .9 2 “ 28 *
346 3 . 7 3 3 . 7 1 3 . 3 4 - 4 . 3 3 _ - - 11 -230 3 .98 3 .98 3 . 5 0 - 4 . 5 2 - - - -1 1 6 3 . 2 5 3 . 2 7 2 . 9 5 - 3 .6 3 “ 11 *
122 3 .5 3 3 .6 4 3 . 3 4 - 3 .6 9 _ - - - -
99 3 .4 6 3 .6 2 3 . 3 1 - 3 .6 9 “ ” ”
13 1 3 . 1 6 3 .0 1 2 . 7 2 - 3.82 _ - - - -
103 3 .0 3 2.88 2 . 6 8 - 3 .38 “
2 , 2 1 2 4 . 3 4 4 . 5 6 3 . 6 9 - 5 . 2 6 2 - - 4 53451 3.8 6 3 .9 3 3 . 2 9 - 4 .4 5 - - - - 4 -
1 , 7 6 1 4 . 4 6 5 . 2 1 3 . 7 6 - 5 .2 6 2 - - 531 , 0 1 1 5. 00 5 . 2 4 5 . 2 1 - 5 . 2 7
132 2 . 9 6 3 .2 4 2 . 2 9 - 3 .6 3 2 - _ 4 2364 2 . 9 3 3.00 2 . 4 6 - 3 .3 3 - - - 4 -68 2 . 9 9 3 .6 2 2 . 1 7 - 3 .6 7 2 * “ 23
988 4.00 3 .9 7 3 . 2 6 - 5 .2 3 _ _ _ 30165 4 . 0 6 4 . 2 5 2 . 9 5 - 4 .8 9 - “ - - -
823 3 .9 9 3 .8 9 3 . 3 3 - 5 . 2 4 ” “ 30
1 , 0 0 1 4 . 8 9 5 . 2 3 4 . 4 5 - 5 .28146 3 .9 8 3 .9 5 3 . 9 0 - 4 . 3 5855 5 .0 4 5 . 2 5 5 . 2 1 - 5 .2 9535 5 . 2 4 5 . 2 5 5 . 2 3 - 5 .28
Number of workers receiving straight-time hourly earnings of—S t * S t % S S $ $ S t S $ S $ $2.2 0 2.4 0 2.60 2 .80 3.00 3.2 0 3 .4 0 3.6 0 3.8 0 4.00 4 .20 4.40 4.60 4.80 5.00 5. 20 5 .4 0
2.40 2.60 2.80 3 .00 3.20 3.4 0 3.6 0 3.80 4.0 0 4.20 4 .40 4.60 4.80 5. 00 5.20 5.40 5 .6 0
15 50 31 15 1 28 9 64 243 20 14 288 47 25 15 1 19 - 58 243 9 14 28 - - - -7 3 6 ” ” 9 9 6 “ 11 * * “ *
- 5 17 4 1 13 - 54 243 9 14 28 - - - - -
8 42 8 11 - 6 - 4
155 101 64 37 106 310 217 1 1 7 144 158 4 - 1 - _ - -107 73 46 26 98 290 216 101 103 15 7 - - - - - -
48 28 18 11 8 20 1 16 41 1 4 - 1 - - - -10 - 1 20 1 16 1 1 4 “ 1 - * * *
134 139 206 90 203 100 150 90 76 376 71 - 5 - - - -116 128 191 56 195 95 134 59 67 288 56 - 5 - - -
18 11 15 34 8 5 16 31 9 88 15 “ *
11 7 76 41 98 205 60 2 60 46 209 . - - - -
98 - 16 52 174 - 2 20 16 209 - - - - -
19 76 25 46 31 60 ~ 40 30 * “ *
- 28 29 37 19 97 54 17 69 2 17 3 12 - . - -
- 28 21 13 13 92 54 17 69 2 17 3 12 “ -
6 22 11 6 38 48 41 40 28 18 73 _ * - _ -
- 4 12 - - 13 30 26 40 11 18 72 - 4 - -
- 2 10 11 6 25 18 15 17 * 1 * ” *
12 8 - _ . 21 - 57 1 - 10 13 - - - - -
12 8 - - 21 42 1 - 2 13 * *
4 13 34 14 9 16 5 1 19 10 3 3 - - _ - -
4 13 25 13 9 16 4 1 18
167 25 24 12 27 81 100 19 1 110 166 77 90 1 46 12 997 2712 25 24 12 25 37 37 18 83 34 17 30 1 46 12 7 27
155 - - - 2 44 63 17 3 27 132 60 60 - - - 990 -2 7 18 126 3 ” “ “ 855 *
9 13 11 29 _ 30 1 8 2 _ _
4 13 11 - 29 1 - - 2 - - - - -5 * 30 “ 8 *
158 12 13 8 13 32 66 142 25 85 4 46 _ 327 278 12 13 8 13 - 14 - 9 4 4 - - 46 - 7 27
150 * 32 52 142 16 81 ” * * 320
4 12 12 6 11 83 43 69 78 1 _ 12 6704 12 8 - 10 72 - 9 18 1 - 12 -
4 6 1 11 43 60 60 - - - 670535
See footnotes at end o f tables,
Digitized for FRASER http://fraser.stlouisfed.org/ Federal Reserve Bank of St. Louis

1 4
T a b l e A - 5 . C u s t o d i a l a n d m a t e r i a l m o v e m e n t o c c u p a t i o n s ----- C o n t i n u e d
(Average straight-time hourly earnings for selected occupations studied on an area basis by industry division, Louisville, Ky.—Ind., November 1971)
Hourly earnings3 Numbe r of w o r k e r s re cei ving st ra ig ht-t ime hourly earnings of—
S I * $ S t * t * i t i i * * $ i i t $ t SS ex , occupation, and industry division of 1 . 6 0 1 . 7 0 1 . 8 0 1 . 9 0 2.00 2 . 1 0 2.2 0 2.60 2.60 2.8 0 3 .00 3 .2 0 3 .6 0 3.6 0 3 .8 0 6.0 0 6 . 2 0 6 . 6 0 6.60 6 . 8 0 5.00 5.2 0 5.60
workers Mean2 Median2 Middle range 2 andunder
1 . 7 0 1 . 8 0 1 . 9 0 2.0 0 2 . 1 0 2.2 0 2.60 2.6 0 2.8 0 3.00 3.2 0 3.6 0 3.6 0 3.8 0 6.0 0 6.20 6.60 6.60 6.60 5 . 0 0 5.2 0 5.60 5 . 6 0
MEN - CONTINUED
$ $ $ $TRUCKERS, POWER I FORKLIFT) ------------- 1 ,8 6 2 3 .6 3 3 . 5 9 3 . 3 5 - 6 . 0 1 - - - - 19 126 52 66 366 332 336 96 96 266 133 - - - - -
MANUFACTURING ------------------------------- 1 , 7 1 6 3 .6 3 3 . 5 7 3 . 3 5 - 6.03 - - - - - - - 18 121 51 65 365 326 250 96 96 217 133 - _ _ - _
NONMANUFACTURING -------------------------- 166 3 .6 8 3 . 7 2 3 . 6 1 - 3 .7 9 “ - - - - 1 5 1 19 1 8 86 - - 27 - - - - - -
TRUCKERS, POWER (OTHER THANFORKLIFT) ------------------------------------------ 167 3 .9 5 6 . 2 6 3 . 6 7 - 6 .3 5 - - - - - 6 12 - - 1 1 28 - 5 19 88 - - - - _ -
MANUFACTURING ------------------------------- 165 3 .9 6 6 . 2 5 3 . 6 8 - 6 .3 5 ~ * “ 6 12 9 28 5 19 88 - - - - - -
WOMEN
JANITORS, PORTERS, AND CLEANERS ---- 600 2 . 3 7 1 . 9 7 1 . 7 0 - 3 .2 5 150 70 12 96 21 20 1 12 6 11 31 98 29 2 60 1
NONMANUFACTURING -------------------------- 361 1 . 8 1 1 . 7 6 1 . 6 6 - 1 . 9 5 150 70 8 83 19 16 1 6 7 2 - 1 - - - - - - -
636 2 . 3 1 2 . 2 0 - 2 .56 26 20,
433 2 . 3 3 2 . 3 1 2 . 2 0 - 2 .5 6 26 20 68 12 176 96 26 28
See footnotes at end of tables.
Digitized for FRASER http://fraser.stlouisfed.org/ Federal Reserve Bank of St. Louis

B. Establishment practices and supplementary w a g e provisionsT a b l e B -1 . M i n i m u m e n t r a n c e s a la r ie s fo r w o m e n o f f i c e w o r k e r s
15
(D istribution o f establishments studied in a ll industries and in industry divis ions by minimum entrance sa lary fo r selected categories o f inexperienced women o ffic ew o rk e rs , L o u is v ille , K y .—Ind. , Novem ber 1971)
Minimum weekly straight-tim e sa la ry4
Inexperienced typists
M an u fa ctu r in g Nonmanufacturing
Based on standard weekly hours 6
O ther i n e x p e r i e n c e d c l e r i c a l w o r k e r s
M an u fa ctur in g Nonmanufacturing
Based on standard weekly hours 6i n d u s t r i e s
A l ls c h e d u le s 4 0
A l ls c h e d u le s 37 V2 4 0
i n d u s t r i e sA l l
s c h e d u le s 4 0A l l
s c h e d u le s 37 Vz 4 0
E s t a b l i s h m e n t s s t u d i e d __________________________________________________ 133 53 XXX 80 XXX XXX 133 53 XXX 80 XXX XXX
E s t a b l i s h m e n t s h a v in g a s p e c i f i e d m i n i m u m ________________________ 42 22 18 20 5 11 60 26 22 34 8 19
$ 5 5 .0 0 a n d u n d e r $ 5 7 .5 0 ___________ ___ - _______________________ ___ 1 _ _ 1 _ _ 1 . . 1 . .
$ 5 7 .5 0 a n d u n d e r $ 6 0 .0 0 ____________________________________________________ - - - - - _ 1 _ _ 1 _ _
$ 6 0 .0 0 a n d u n d e r $ 6 2 .5 0 ______________ _______________________ ___ _ - - - - - - 1 _ - 1 _ _
$ 6 2 .5 0 a n d u n d e r $ 6 5 .0 0 ____________________________________________________ 4 1 1 3 1 1 6 1 1 5 1 3$ 6 5 .0 0 a n d u n d e r $ 6 7 .5 0 _________________________________________________ 1 - - 1 - 1 3 1 1 2 _ 1$ 6 7 .5 0 a n d u n d e r $ 7 0 .0 0 _________________________________________________ 3 1 1 2 1 - 5 2 2 3 2 _
$ 7 0 .0 0 a n d u n d e r $ 7 2 .5 0 ___________________________________________________ 4 1 1 3 - 2 7 1 1 6 1 4$ 7 2 .5 0 a n d u n d e r $ 7 5 .0 0 ________________________ _______________________ 2 2 2 - - - 3 2 2 1 _ 1$ 7 5 .0 0 a n d u n d e r $ 7 7 .5 0 ____________________________________________________ 2 - - 2 - 2 2 - - 2 1 1$ 7 7 .5 0 a n d u n d e r $ 8 0 .0 0 ____________________________________________________ 1 - - 1 - 1 2 1 1 1 _ 1$ 8 0 .0 0 a n d u n d e r $ 8 2 .5 0 ____________________________________________________ 5 3 2 2 1 1 7 3 2 4 2 2$ 8 2 .5 0 a n d u n d e r $ 8 5 .0 0 ____________________________________________________ 1 1 - - - - 1 1 - _ - -$ 8 5 .0 0 a n d u n d e r $ 8 7 .5 0 ____________________________________________________ 4 2 1 2 2 - 3 1 - 2 1 1$ 8 7 .5 0 a n d u n d e r $ 9 0 .0 0 ____________________________________________________ 2 2 1 - - - 3 2 1 1 _ 1$ 9 0 .0 0 a n d u n d e r $ 9 2 .5 0 ____________________________________________________ 4 3 3 1 - 1 5 3 3 2 - 2$ 9 2 .5 0 a n d u n d e r $ 9 5 .0 0 ____________________________________________________ 1 - - 1 - 1 - * - - - -
$ 9 5 .0 0 a n d u n d e r $ 1 0 0 .0 0 ------------------------------------------------------------------- 1 1 1 _ _ _ 2 2 2 _ _ _
$ 1 0 ,0 .00 a n d u n d e r $ 1 0 5 .0 0 ________________________________________________ 1 1 1 - - - 1 1 1 _ _ -$ 1 0 5 .0 0 a n d u n d e r $ 1 1 0 .0 0 ________________________________________________ - - - - - - 1 - - i - 1$ 1 1 0 .0 0 a n d u n d e r $ 1 1 5 .0 0 -_________________________________ __________ 1 - - 1 - 1 - - - - - _
$ 1 1 5 .0 0 a n d u n d e r $ 1 2 0 .0 0 ________________________________________________ 2 2 2 - - - 2 2 2 - - -
$ 1 2 0 .0 0 a n d u n d e r $ 1 2 5 .0 0 ________________________________________________ 1 1 1 - - - 2 2 2 - - -
$ 1 2 5 .0 0 a n d o v e r ------------------------------------------------------------------------------------------ 1 1 1 - - - 2 1 1 i - 1
E s t a b l i s h m e n t s h a v in g n o s p e c i f i e d m i n i m u m } ------------------------------- 13 7 XXX 6 XXX XXX 36 18 XXX 18 XXX XXX
E s t a b l i s h m e n t s w h i c h d i d n o t e m p lo y w o r k e r s78 24 XXX 54 XXX XXX 37 9 XXX 28 XXX XXX
See footnotes at end o f tables.
Digitized for FRASER http://fraser.stlouisfed.org/ Federal Reserve Bank of St. Louis

T a b le B -2 . Shift differentials
(Late-sh ift pay provisions for m anufacturing plantworkers by type and amount of pay d ifferential, Lou isv ille , Ky.—Ind., November 1971)
(All plant-workers in .manufacturing = 100 percent)Percent of manufacturing plantw orkers—
L ate-sh ift pay provisionIn establishm ents having provisions 7
for late shifts Actually working on late shifts
Second shift Third or other shift Second shift Third or other
shift
T o ta l ............................... ....................................... 92.6 83.5 21.0 6.3
No pay d ifferential for work on late sh ift_____ 1.2 _ 0.3 _
Pay d ifferential for work on late sh ift .. . . __ 91.4 83.5 20.7 6.3
Type and amount of d ifferential:
Uniform cents (per hour)_______________ 57.0 49.8 11.2 4.3
5 cents . ______________ ___________ 4.5 _ 1.0 _7V? ce n ts__ _______________________ - 1.2 - .18 ce n ts_________________ ____________ - 1.4 - -10 cents_____________________________ 16.2 .4 2.3 (8 )11 cents_____________________________ 1.2 - .512 cents_____________________________ 4.5 1.0 1.0 (8 )13 cents______ __________ _____ ______ 4.8 1.2 1.1 (8 )14 cents_____________________________ .8 - .115 cents________ ___________________ 5.8 10.5 .7 .316 cents__________________________ __ 1.7 - .4 -18 cents_____________________________ - 1.9 - (8 )19 cents_____________________________ 5.7 2.9 .6 .320 cents_____________________________ .5 8.5 - .822 cents_____________________________ 6.3 - .123 cents____________________________ _ - 1.1 - .125 cents_______________________ __ 6.0 2.0 1.9 .127 cents _________________ ________ 3.9 - 1.4 -
28 cents_____________________________ 1.4 - .1 -
33 cents______________________ ____ - 3.9 - .735 cents. . _________________________ - 7.4 - 1.7
Uniform percen tage____________________ 32.6 32.6 9.1 2.0
5 percen t____________________________ 6.9 .8 1.9 -
6 percen t____________________________ 5.6 5.6 .6 .310 percent- _________________________ 20.2 26.3 6.6 1.7
Other form al pay d iffe ren tia l___________ 1.8 1.1 .4
See footnotes at end of tab les.
Digitized for FRASER http://fraser.stlouisfed.org/ Federal Reserve Bank of St. Louis

1 7
T a b l e B - 3 . S c h e d u l e d w e e k l y h o u r s a n d d a y s
(Percent distribution of plant- and officeworkers in all industries and in industry divisions by scheduled weekly hours and days of first-sh ift workers, Louisville, Ky.—Ind., November 1971)
Weekly hoursPlantworkers Officeworkers
A ll industries Manufacturing Public utilities A ll industries Manufacturing Public utilities
A ll workers------------------------------------------ 100 100 100 100 100 100
Under 37 hours— 5 days________________________ 3 337 hours— 5 days ______________________________ 4 - - 2 - -37l/z hours— 5 days ____________________________ 12 14 - 21 12 3238 hours— 5 days ______________________________ - - - 1 - -383U hours---5 days__ __ _____________________ - - - 3 4 -39 hours_________________________________________ (?) - - 2 - -
5 days________ ____________________________ ( ’ ) - - (9) - -5 Vz days_____________________________________ - - - 1 - -
40 hour s _________________________________________ 74 81 94 66 80 684 days________________________________________ (9) - - - - -5 days________________________________________ 73 81 94 66 80 68
Over 40 and under 44 hours— 5 days________ - (* ) - - 1 2 -
44 hours______ _________________________________ 1 - 4 1 - -
5Vz days_________________________ __________ 1 - - 1 - -
6 days________________________________________ (9) - 4 - - -
45 hours— 5 days ______________________________ 1 2 - 1 1 -
48 hours— 6 days________________________________ 1 - 2 - - -
Over 48 hours________________________________ - 3 3 - (9) - -
5 days________________________________________ 1 - - (9) - -
5Vi days—____________________________________ (9) - - - - -
6 days______ __________________ - _____ 2 3
See footnote at end of tables.
Digitized for FRASER http://fraser.stlouisfed.org/ Federal Reserve Bank of St. Louis

1 8
T a b l e B - 4 . P a i d h o l i d a y s
(P ercen t distribution o f plant- and o fficew ork ers in a ll industries and in industry d ivisions by number o f paid holidaysprovided annually, L o u is v ille , Ky.—Ind., Novem ber 1971)
Item
Plantworkers Officeworkers
A ll industries Manufacturing Public utilities A ll industries Manufacturing Public utilities
A ll workers - . . . 100 100 100 100 100 100
Workers in establishments providingpaid holidays 97 100 100 99 100 100
Workers in establishments providing(*)no paid holidays — - - 3 - - - -
Number of davs
Less than 6 holidays - __ 2 1 _ 2 2 _
6 holidays . — ___ _____ — 21 7 23 29 7 106 holidays plus 1 half day______________________ 1 - - 3 - -6 holidays plus 2 half days . . . . ---- - - - 2 - -7 hol idays. . . . . . __ — . . . 11 10 8 8 10 27 holidays plus 1 half day (9) - - (!) - -7 holidays plus 2 half days_____________________ - - - (9) - -8 holidays 15 12 57 21 9 868 holidays plus 1 half day- 1 1 - 1 3 -8 holidays plus 2 half days_____________________ - - - 3 - -
9 holidays - - - 28 41 11 19 43 210 holidays. ------ - . . . 6 10 - 3 8 -
11 holidays . - — - 4 6 - 3 8 -
12 holidays.. . - 8 13 - 5 10 -13 holidays------------------------------------------------ - * - 1 - -
Total holiday time 10
13 days— ---- - - — __ - ---- _ _ _ 1 _ _
12 days or more - 8 13 - 6 10 -
11 days or more - - -------- ---- — 12 19 - 9 18 -10 days or more — ___ — — — 19 28 - 12 26 -9 days or more ---- -------- ----------- 47 69 11 34 68 28V2 days or m ore--------------------------------------- 47 70 11 35 71 28 days or m ore— ________ . . . . ____ . 62 82 69 56 80 887 V2 days or more ----- . ------------------- 62 82 69 56 80 887 days or m ore— . . . - 73 92 77 66 90 906V2 days or more . . 74 92 77 69 90 906 days or m ore_________________________________ 95 99 100 98 98 1005V2 days or more , 96 99 100 98 98 1005 days or m ore________________________________ 96 100 100 99 100 1004 days or m ore- ____ __ ____ - ___ ______ 96 100 100 99 100 1003 days or m ore_________________________________ 97 100 100 99 100 100
See footnotes at end of tables.
Digitized for FRASER http://fraser.stlouisfed.org/ Federal Reserve Bank of St. Louis

1 9
T a b l e B - 5 . P a i d v a c a t i o n s
(P ercen t distribution o f plant- and o fficew orkers in a ll industries and in industry divis ions by vacation pay provis ions, L ou is v ille , Ky.—Ind., Novem ber 1971)
Plantworkers OfficeworkersVacation policy
A ll industries Manufacturing Public utilities A ll industries Manufacturing Public utilities
A ll workers------------------------------------------ 100 100 100 100 100 100
Method of payment
Workers in establishments providingpaid vacations_________________________________ 98 98 100 100 100 100
Length-of-time payment______ ___________ 94 94 99 100 100 100Percentage payment_________________________ 4 4 (’ ) - - -
Workers in establishments providing!no paid vacations______________________________ 2 2 " “ ~ “
Amount of vacation pay 11
A fter 6 months of service
Under 1 week____________________________________ 3 3 _ 3 1 _1 week___________________________________________ 25 24 23 42 41 33Over 1 and under 2 weeks______________________ (’ ) - - 6 3 -2 weeks_________________________________________ - 2 4 "
A fter 1 year of service
Under 1 week____________________________________ 1 _ _ - - _1 week------------------------------------------------------- 58 54 92 27 18 99Over 1 and under 2 weeks______________________ 1 2 - - - -2 weeks____________________ ___________________ 36 40 8 72 81 13 weeks_________________________________________ 1 1 - 1 1 "
A fter 2 years of service
1 week____ ______________________ ____________ 20 17 30 6 7 11Over 1 and under 2 weeks______________________ 4 4 - 1 1 -2 weeks_________________________________________ 73 75 70 93 89 89Over 2 and under 3 weeks______________________ - - - 1 2 -3 weeks_________________________________________ 1 1 * 1 1 “
A fter 3 years of service
1 week____________ ________________ ___________ 6 5 _ 2 5 _Over 1 and under 2 weeks______________________ 3 1 - 1 1 -2 weeks_________________________________________ 78 74 100 92 80 100Over 2 and under 3 weeks______________________ 9 13 - 2 6 -3 weeks_________________________________________ 3 4 ■ 3 8 “
A fter 4 years of service
1 week___________________________________________ 4 3 _ 2 4 -Over 1 and under 2 weeks______________________ 3 1 - 1 1 -
2 weeks_________________________________________ 80 76 100 92 81 100Over 2 and under 3 weeks_______ ____________ 9 13 - 2 6 -
3 4 3 8
See footnotes at end of tables
Digitized for FRASER http://fraser.stlouisfed.org/ Federal Reserve Bank of St. Louis

20
T a b l e B - 5 . P a i d v a c a t i o n s ------C o n t i n u e d
(P ercen t distribution of p lant- and o fficew ork ers in a ll industries and in industry divis ions by vacation pay provis ions, L o u is v ille , Ky.—Ind., Novem ber 1971)
Plantworkers OfficeworkersVacation policy
A ll industries Manufacturing Public utilities A ll industries Manufacturing Public utilities
Amount of vacation pay 11— Continued
A fter 5 years of service
1 week____________________________________________ 2 _ _ (’ ) .Over 1 and under 2 weeks______________________ 1 - - (9) _ _2 weeks__________________________________________ 75 73 100 81 70 100Over 2 and under 3 weeks______________________ 1 1 - 3 3 _3 weeks----------------------------------------------------- 19 23 - 16 27 -
A fter 10 years of service
1 week____________________________________________ 2 _ _ (9) _2 weeks _____ ___________________________________ 18 14 - 23 18 _Over 2 and under 3 weeks______________________ 1 - - 1 _ _3 weeks__________________________________________ 66 67 100 67 66 100Over 3 and under 4 weeks__ . . _____________ 9 13 - 2 5 _4 weeks_______________________________________ . 2 3 - 7 12 -
A fter 12 vears of service
1 week___________________________________________ 2 _ _ (9) _ .2 weeks__________________________________________ 14 10 - 18 11 _Over 2 and under 3 weeks______ ______________ 1 - - 1 _ _3 weeks__________________________________________ 69 71 100 70 69 100Over 3 and under 4 w eek s______ _____________ 9 13 - 2 5 -4 weeks------------------------------------------------------ 3 4 - 9 15 -
A fter 15 years of service
1 week___________________________________________ 2 _ _ (9) _2 weeks__________________________________________ 8 4 - 10 7 -3 weeks__________________________________________ 43 31 71 64 38 94Over 3 and under 4 weeks______________________ 2 1 - i - -4 weeks____________________ ___________________ 42 60 29 25 55 6Over 4 and under 5 weeks______________________ 1 2 - - - _
5 weeks___________ - _________________ ______ (9) (9) - (9) ' ( 9) -
A fter 20 years of service
1 week______ ___________________________________ 2 _ _ (9) _ _2 weeks_________________________ ________ ___ 8 4 - 9 7 -3 weeks__________________________________________ 20 15 - 29 19 -Over 3 and under 4 weeks______________________ 1 - - - - -4 weeks________________________ ____ ___ ____ 59 69 93 53 58 99Over 4 and under 5 weeks_______ ____ ______ 1 2 - - - -5 weeks__________________________________________ 6 8 7 9 16 16 weeks - - ___ __ . ____ ___________________ (9) (9) - (9) (9) -
A fter 25 years of service
1 week______________________________ ___________ 2 _ - (9 ) _ _
2 weeks___________ ____________________________ 8 4 - 9 7 -3 weeks_________________________ ______________ 17 13 - 22 184 weeks_____ ____________ ______________________ _ 49 53 75 51 49 66Over 4 and under 5 weeks______________________ 2 2 - 1 - -5 weeks__________________________________________ 19 26 20 17 26 346 weeks___________ _____________________________ 1 (9) 4 (9) (9) n
See footnotes at end of tables.
Digitized for FRASER http://fraser.stlouisfed.org/ Federal Reserve Bank of St. Louis

21
T a b le B -5 . P a id vacations-----Continued
(Percent distribution of plant- and officeworkers in all industries and in industry divisions by vacation pay provisions, Louisville, Ky.—Ind., November 1971)
Plantworkers OfficeworkersVacation policy
A ll industries Manufacturing Public utilities A ll industries Manufacturing Public utilities
Amount of vacation pay 11— Continued
A fter 30 years of service
1 week___________________________________________ 2 _ (9) _2 weeks_________________________________________ 8 4 - 9 7 -3 weeks_________________________________________ 17 13 - 22 18 -4 weeks_________________________________________ 34 32 66 43 31 65Over 4 and under 5 weeks______________________ 2 2 - - - .5 weeks_________________________________________ 33 45 29 23 39 356 weeks ____ ____________ ____________________ 2 3 4 2 5 1
Maximum vacation available
1 w eek__________________________________________ 2 _ _ (9) _ _
2 weeks_________________________________________ 8 4 - 9 7 -3 weeks_________________________________________ 17 13 - 22 18 _4 weeks_________________________________________ 34 32 66 43 31 65Over 4 and under 5 weeks____ __________________ 2 2 - - - _5 weeks___________________________ ____________ 31 43 29 22 38 356 weeks_________________________________________ 3 4 4 3 6 1Over 6 weeks. _________ ____________________ 1
See footnotes at end of tables
Digitized for FRASER http://fraser.stlouisfed.org/ Federal Reserve Bank of St. Louis

2 2
T a b le B -6 . Health, insurance, and pension p lans
(Percent of plant- and officeworkers in all industries and in industry divisions employed in establishments providing health, insurance, or pension benefits, Louisville, Ky.—Ind., November 1971)
Type of benefit and financing 12
Plantworkers Officeworker s
A ll industries Manufacturing Public utilities A ll industries Manufacturing Public utilities
A ll workers- __ ____ 100 100 100 100 100 100
Workers in establishments providing atleast 1 of the benefits shown below — 97 100 100 98 100 100
Life insurance — — __ 93 98 100 93 98 100Noncontributory plans __ __ 78 91 72 62 86 89
Accidental death and dismembermentinsurance- - - _______ - 72 80 92 69 86 98
Noncontributory plans___________________ 61 74 64 52 74 88Sickness and accident insurance or
sick leave or both 13 87 92 72 81 87 93
Sickness and accident insurance- - - 70 88 30 51 77 6Noncontributory plans 58 79 25 41 69 5
Sick leave (full pay and nowaiting period)__________________________ 28 26 - 58 68 45
Sick leave (partial pay orwaiting period)- - - _ — ---- 16 8 51 17 6 43
Long-term disability insurance_____________ 23 24 44 36 34 14Noncontributory plans - - - 17 21 21 29 30 4
Hospitalization insurance____ - — ___ 94 100 99 92 99 99Noncontributory plans 75 91 92 56 87 96
Surgical insurance— ________ - - ___ 94 100 100 92 99 100Noncontributory plans - ____ 75 91 92 56 87 97
Medical insurance - - - - - 85 91 98 84 91 99Noncontributory plans — - — — 69 84 90 55 79 96
Major medical insurance- ------ — 63 61 98 85 85 99Noncontributory plans - __ - ____ 48 54 87 63 73 97
Dental insurance------------------------------------ 21 27 20 9 22 4Noncontributory plans 20 27 20 9 22 4
Retirement pension__________________________ 80 93 72 79 94 48Noncontributory plans__ ___ — 56 68 49 58 68 38
See footnotes at end of tables.
Digitized for FRASER http://fraser.stlouisfed.org/ Federal Reserve Bank of St. Louis

2 3
Footnotes
A ll of these standard footnotes may not apply to this bulletin.
1 Standard hours re flec t the workweek fo r which em ployees rece ive their regu lar stra ight-tim e sa laries (exclusive of pay for overtim e at regu lar and/or prem ium rates), and the earnings correspond to these w eek ly hours.
2 The mean is computed fo r each job by totaling the earnings o f a ll w orkers and dividing by the number of w orkers. The mediandesignates position— half o f the em ployees surveyed rece ive m ore than the rate shown; half rece ive less than the rate shown. The middlerange is defined by 2 rates of pay; a fourth o f the w orkers earn less than the low er o f these rates and a fourth earn m ore than the higher rate.
3 Excludes prem ium pay for overtim e and for work on weekends, holidays, and late shifts.4 These sa laries relate .to fo rm a lly established minimum starting (h iring) regu lar stra igh t-tim e sa laries that are paid for standard
workweeks.5 Excludes w orkers in subclerica l jobs such as m essenger.6 Data are presented fo r a ll standard workweeks combined, and fo r the most common standard workweeks reported.7 Includes a ll plantworkers in establishments currently operating late shifts, and establishments whose fo rm al provisions cover late
shifts, even though the establishments w ere not currently operating late shifts.8 juess than 0.05 percent.9 Less than 0.5 percent.10 A ll combinations of fu ll and half days that add to the same amount are combined; for example, the proportion of workers receiving a
total o f 9 days includes those with 9 fu ll days and no half days, 8 fu ll days and 2 half days', 7 fu ll days and 4 half days, and so on. Proportionsthen w ere cumulated.
11 Includes payments other than "length of t im e ," such as percentage o f annual earnings or flat-sum payments, converted to an equivalenttim e basis; fo r example, a payment of 2 percent of annual earnings was considered as 1 w eek 's pay. P er iod s of serv ice w ere chosen a rb itra r ilyand do not n ecessarily re flec t the individual provisions for progression . F o r example, the changes in proportions indicated at 10 years ' serv iceinclude changes in provisions occurring between 5 and 10 years. Estim ates are cumulative. Thus, the proportion e lig ib le fo r 3 weeks' pay orm ore a fter 10 years includes those e lig ib le fo r 3 weeks' pay or m ore after few er years of serv ice .
12 Estim ates listed a fter type of benefit are for a ll plans fo r which at least a part o f the cost is borne by the em ployer. "Noncontributory plans" include only those plans financed en tire ly by the em ployer. Excluded are lega lly requ ired plans, such as workm en's compensation, socia l security, and ra ilroad retirem ent.
13 Unduplicated total of w orkers receiv ing sick leave or sickness and accident insurance shown separately below. Sick leave plans are lim ited to those which defin itely establish at least the minimum number of days' pay that can be expected by each em ployee. In form al sick leave allowances determ ined on an individual basis are excluded.
Digitized for FRASER http://fraser.stlouisfed.org/ Federal Reserve Bank of St. Louis

A ppendix. O ccupational D escrip tions
The primary purpose of preparing job descriptions for the Bureau's wage surveys is to assist its field staff in classifying into appropriate occupations workers who are employed under a variety of payroll titles and different work arrangements from establishment to establishment and from area to area. This permits the grouping of occupational wage rates representing comparable job content. Because of this emphasis on interestablishment and interarea comparability of occupational content, the Bureau's job descriptions may differ significantly from those in use in individual establishments or those prepared for other purposes. In applying these job descriptions, the Bureau's field economists are instructed to exclude working supervisors; apprentices; learners; beginners; trainees; and handicapped, part-time, temporary, and probationary workers.
O FFICE
BILLER, MACHINE
Prepares statements, bills, and invoices on a machine other than an ordinary or electro- matic typewriter. May also keep records as to billings or shipping charges or perform other clerical work incidental to billing operations. For wage study purposes, b illers, machine, are classified by type of machine, as follows:
B iller, machine (billing machine). Uses a special billing machine (combination typing and adding machine) to prepare bills and invoices from customers' purchase orders, internally prepared orders, shipping memorandums, etc. Usually involves application of predetermined discounts and shipping charges and entry of necessary extensions, which may or may not be computed on the billing machine, and totals which are automatically accumulated by machine. The operation usually involves a large number of carbon copies of the bill being prepared and is often done on a fanfold machine.
B iller, machine (bookkeeping machine). Uses a bookkeeping machine (with or without a typewriter keyboard) to prepare customers' bills as part of the accounts receivable operation. Generally involves the simultaneous entry of figures on customers' ledger record. The machine automatically accumulates figures on a number of vertical columns and computes and usually prints automatically the debit or credit balances. Does not involve a knowledge of bookkeeping. Works from uniform and standard types of sales and credit slips.
BOOKKEEPING-MACHINE OPERATOR
Operates a bookkeeping machine (with or without a typewriter keyboard) to keep a record of business transactions.
Class A. Keeps a set of records requiring a knowledge of and experience in basic bookkeeping principles, and fam iliarity with the structure of the particular accounting system used. Determines proper records and distribution of debit and credit items to be used in each phase of the work. May prepare consolidated reports, balance sheets, and other records by hand.
Class B. Keeps a record of one or more phases or sections of a set of records usually requiring little knowledge of basic bookkeeping. Phases or sections include accounts payable, payroll, customers' accounts (not including a simple type of billing described under biller, machine), cost distribution, expense distribution, inventory control, etc. May check or assist in preparation of tria l balances and prepare control sheets for the accounting department.
CLERK, ACCOUNTING
Perform s one or more accounting clerical tasks such as posting to registers and ledgers; reconciling bank accounts; verifying the internal consistency, completeness, and mathematical accuracy of accounting documents; assigning prescribed accounting distribution codes; examining and verifying for clerical accuracy various types of reports, lists, calculations, posting, etc.; or preparing simple or assisting in preparing more complicated journal vouchers. May work in either a manual or automated accounting system.
The work requires a knowledge of clerical methods and office practices and procedures which relates to the clerical processing and recording of transactions and accounting information. With experience, the worker typically becomes fam iliar with the bookkeeping and accounting terms and procedures used in the assigned work, but is not required to have a knowledge of the formal principles of bookkeeping and accounting.
CLERK, ACCOUNTING— Continued
Positions are classified into levels on the basis of the following definitions.Class A . Under general supervision, performs accounting clerical operations which
require the application of experience and judgment, for example, clerica lly processing complicated or nonrepetitive accounting transactions, selecting among a substantial variety of prescribed accounting codes and classifications, or tracing transactions through previous accounting actions to determine sourpe of discrepancies. May be assisted by one or more class B accounting clerks.
Class B. Under close supervision, following detailed instructions and standardized procedures, performs one or more routine accounting clerical operations, such as posting to ledgers, cards, or worksheets where identification of items and locations of postings are clearly indicated; checking accuracy and completeness of standardized and repetitive records or accounting documents; and coding documents using a few prescribed accounting codes.
CLERK, FILE
Files, classifies, and retrieves material in an established filing system. May perform clerical and manual tasks required to maintain files. Positions are classified into levels on the basis of the following definitions.
Class A . Classifies and indexes file material such as correspondence, reports, technical documents, etc., in an established filing system containing a number of varied subject matter files. May also file this material. May keep records of various types in conjunction with the files. May lead a small group of lower level file clerks.
Class B . Sorts, codes, and files unclassified material by simple (subject matter) headings or partly classified material by finer subheadings. Prepares simple related index and cross-reference aids. As requested, locates clearly identified material in files and fo rwards material. May perform related clerical tasks required to maintain and service files.
Class C. Performs routine filing of material that has already been classified or which is easily classified in a simple serial classification system (e.g., alphabetical, chronological, or numerical). As requested, locates readily available material in files and forwards material; and may fi l l out withdrawal charge. May perform simple clerical and manual tasks required to maintain and service files.
CLERK, ORDER
Receives customers' orders for material or merchandise by mail, phone, or personally. Duties involve any combination of the following: Quoting prices to customers; making out an order sheet listing the items to make up the order; checking prices and quantities of items on order sheet; and distributing order sheets to respective departments to be filled. May check with credit department to determine credit rating o { customer, acknowledge receipt of orders from customers, follow up orders to see that they have been filled, keep file of orders received, and check shipping invoices with original orders.
CLERK, PAYROLL
Computes wages of company employees and enters the necessary data on the payroll sheets. Duties involve: Calculating workers' earnings based on time or production records; and posting calculated data on payroll sheet, showing information such as worker's name, working days, time, rate, deductions for insurance, and total wages due. May make out paychecks and assist paymaster in making up and distributing pay envelopes. May use a calculating machine.
NOTE: The Bureau has discontinued collecting data for oilers and plumbers.
2 4Digitized for FRASER http://fraser.stlouisfed.org/ Federal Reserve Bank of St. Louis

COMPTOMETER OPERATOR
Prim ary duty is to operate a Comptometer to perform mathematical computations. This job is not to be confused with that of statistical or other type of clerk, which may involve fr e quent use of a Comptometer but, in which, use of this machine is incidental to performance of other duties.
KEYPUNCH OPERATOR
Operates a keypunch machine to record or verify alphabetic and/or numeric data on tabulating cards or on tape.
Positions are classified into levels on the basis of the following definitions.
Class A . Work requires the application of experience and judgment in selecting procedures to be followed and in searching for, interpreting, selecting, or coding items to be keypunched from a variety of source documents. On occasion may also perform some routine keypunch work. May train inexperienced keypunch operators.
Class B . Work is routine and repetitive. Under close supervision or following specific procedures or instructions, works from various standardized source documents which have been coded, and follows specified procedures which have been prescribed in detail and require little or no selecting, coding, or interpreting of data to be recorded. Refers to supervisor problems arising from erroneous items or codes or missing information.
MESSENGER (Office Boy or Girl)
Performs various routine duties such as running errands, operating minor office machines such as sealers or mailers, opening and distributing mail, and other minor clerical work. Exclude positions that require operation of a motor vehicle as a significant duty.
SECRETARY
Assigned as personal secretary, normally to one individual. Maintains a close and highly responsive relationship to the day-to-day work of the supervisor. Works fa irly independently receiving a minimum of detailed supervision and guidance. Perform s varied clerical and secretarial duties, usually including most of the following:
a. Receives telephone calls, personal callers, and incoming mail, answers routine inquiries, and routes technical inquiries to the proper persons:
b. Establishes, maintains, and revises the supervisor's files;
c. Maintains the supervisor's calendar and makes appointments as instructed;
d. Relays messages from supervisor to subordinates;
e. Reviews correspondence, memorandums, and reports prepared by others for the supervisor's signature to assure procedural and typographic accuracy;
f. Performs stenographic and typing work.
May also perform other clerical and secretarial tasks of comparable nature and difficulty. The work typically requires knowledge of office routine and understanding of the organization, programs, and procedures related to the work of the supervisor.
Exclusions
Not all positions that are titled "secretary" possess the above characteristics. Examples of positions which are excluded from the definition are as follows:
a. Positions which do not meet the "personal" secretary concept described above;
b. Stenographers not fully trained in secretarial type duties;
c. Stenographers serving as office assistants to a group of professional, technical, or managerial persons;
d. Secretary positions in which the duties are either substantially more routine or substantially more complex and responsible than those characterized in the definition;
e. Assistant type positions which involve more difficult or more responsible technical, administrative, supervisory, or specialized clerical duties which are not typical of secretarial work.
2 5
SECRETARY— Continued
NOTE: The term "corporate officer, " used in the level definitions following, refers to those officials who have a significant corporate-wide policymaking role with regard to major company activities. The title "v ice president," though normally indicative of this role, does not in all cases identify such positions. Vice presidents whose primary responsibility is to act personally on individual cases or transactions (e.g., approve or deny individual loan or credit actions; administer individual trust accounts; directly supervise a clerical staff) are not considered to be "corporate o fficers" for purposes of applying the following level definitions.
Class A
1. Secretary to the chairman of the board or president of a company that employs, in all, over 100 but fewer than 5,000 persons; or
2. Secretary to a corporate officer (other than the chairman of the board or president) of a company that employs, in all, over 5, 000 but fewer than 25, 000 persons; or
3. Secretary to the head, immediately below the corporate officer level, of a major segment or subsidiary of a company that employs, in all, over 25,000 persons.
Class B
1. Secretary to the chairman of the board or president of a company that employs, in all, fewer than 100 persons; or
2. Secretary to a corporate officer (other than the chairman of the board or president) of a company that employs, in all, over 100 but fewer than 5,000 persons; or
3. Secretary to the head, immediately below the officer level, over either a major corporate-wide functional activity (e.g., marketing, research, operations, industrial rela- tions, etc.) or a major geographic or organizational segment (e.g., a regional headquarters; a major division) of a company that employs, in all, over 5,000 but fewer than 25,000 employees; or
4. Secretary to the head of an individual plant, factory, etc. (or other equivalent level of official) that employs, in all, over 5,000 persons; or
5. Secretary to the head of a large and important organizational segment (e.g., a middle management supervisor of an organizational segment often involving as many as several hundred persons) or a company that employs, in all, over 25,000 persons.
Class C
1. Secretary to an executive or managerial person whose responsibility is not equivalent to one of the specific level situations in the definition for class B, but whose organizational unit normally numbers at least several dozen employees and is usually divided into organizational segments which are often, in turn, further subdivided. In some companies, this level includes a wide range of organizational echelons; in others, only one or two; or
2. Secretary to the head of an individual plant, factory, etc. (or other equivalent level of official) that employs, in all, fewer than 5,000 persons.
Class D
1. Secretary to the supervisor or head of a small organizational unit (e.g., fewer than about 25 or 30 persons); m;
2. Secretary to a nonsupervisory staff specialist, professional employee, administrative officer, or assistant, skilled technician or expert. (NOTE: Many companies assignstenographers, rather than secretaries as described above, to this level of supervisory or nonsupervisory worker.)
STENOGRAPHER
Prim ary duty is to take dictation using shorthand, and to transcribe the dictation. May also type from written copy. May operate from a stenographic pool. May occasionally transcribe from voice recordings (if primary duty is transcribing from recordings, see Transcribing-Machine Operator, General).
NOTE: This job is distinguished from that of a secretary in that a secretary normally works in a confidential relationship with only one manager or executive and performs more responsible and discretionary tasks as described in the secretary job definition.
Stenographer, General
Dictation involves a normal routine vocabulary. May maintain files, keep simple records, or perform other relatively routine clerical tasks.
Digitized for FRASER http://fraser.stlouisfed.org/ Federal Reserve Bank of St. Louis

26
STENOGRAPHER— Continued
Stenographer, SeniorDictation involves a varied technical or specialized vocabulary such as in legal briefs
or reports on scientific research. May also set up and maintain files, keep records, etc.
ORPerform s stenographic duties requiring significantly greater independence and respon
sibility than stenographer, general, as evidenced by the following: Work requires a highdegree of stenographic speed and accuracy; a thorough working knowledge of general business and office procedure; and of the specific business operations, organization, policies, procedures, files, workflow, etc. Uses this knowledge in performing stenographic duties and responsible clerical tasks such as maintaining followup files; assembling material for reports, memorandums, and letters; composing simple letters from general instructions; reading and routing incoming mail; and answering routine questions,_ etc.
SWITCHBOARD OPERATORClass A . Operates a single- or multiple-position telephone switchboard handling incoming,
outgoing, intraplant or office calls. Performs full telephone information service or handles complex calls, such as conference, collect, overseas, or sim ilar calls, either in addition to doing routine work as described for switchboard operator, class B, or as a full-time assignment. ("Fu ll" telephone information service occurs when the establishment has varied functions that are not readily understandable for telephone information purposes, e.g., because of overlapping or interrelated functions, and consequently present frequent problems as to which extensions are appropriate for calls.)
Class B . Operates a single- or multiple-position telephone switchboard handling incoming, outgoing, intraplant or office calls. May handle routine long distance calls and record tolls. May perform lim ited telephone information service. ("L im ited" telephone information service occurs i f the functions of the establishment serviced are readily understandable for telephone information purposes, or if the requests are routine, e.g., giving extension numbers when specific names are furnished, or i f complex calls are referred to another operator.)
These classifications do not include switchboard operators in telephone companies who assist customers in placing calls.
SWITCHBOARD OPERATOR-RECEPTIONISTIn addition to performing duties of operator on a single-position or monitor-type switch
board, acts as receptionist and may also type or perform routine clerical work as part of regular duties. This typing or clerical work may take the major part of this worker's time while at switchboard.
TABULATING-MACHINE OPERATOR (E lectric Accounting Machine Operator)Operates one or a variety of machines such as the tabulator, calculator, collator, inter
preter, sorter, reproducing punch, etc. Excluded from this definition are working supervisors. Also excluded are operators of electronic digital computers, even though they may also operate EAM equipment.
TABULATING-MACHINE OPERATOR (E lectric Accounting Machine Operator)— Continued
Positions are classified into levels on the basis of the following definitions.
Class A . Perform s complete reporting and tabulating assignments including devising difficult control panel wiring under general supervision. Assignments typically involve a variety of long and complex reports which often are irregular or nonrecurring, requiring some planning of the nature and sequencing of operations, and the use of a variety of machines. Is typically involved in training new operators in machine operations or training lower level operators in wiring from diagrams and in the operating sequences of long and complex reports. Does not include positions in which wiring responsibility is limited to selection and insertion of prewired boards.
Class B . Perform s work according to established procedures and under specific instructions. Assignments typically involve complete but routine and recurring reports or parts of larger and more complex reports. Operates more difficult tabulating or electrical accounting machines such as the tabulator and calculator, in addition to the simpler machines used by class C operators. May be required to do some wiring from diagrams. May train new employees in basic machine operations.
Class C. Under specific instructions, operates simple tabulating or electrical accounting machines such as the sorter, interpreter, reproducing punch, collator, etc. Assignments typically involve portions of a work unit, for example, individual sorting or collating runs, or repetitive operations. May perform simple wiring from diagrams, and do some filing work.
TRANSCRIBING-MACHINE OPERATOR, GENERAL
Prim ary duty is to transcribe dictation involving a normal routine vocabulary from transcribing-machine records. May also type from written copy and do simple clerical work. Workers transcribing dictation involving a varied technical or specialized vocabulary such as legal briefs or reports on scientific research are not included. A worker who takes dictation in shorthand or by Stenotype or similar machine is classified as a stenographer.
TYPIST
Uses a typewriter to make copies of various materials or to make out bills after calculations have been made by another person. May include typing of stencils, mats, or similar materials for use in duplicating processes. May do clerical work involving little special training, such as keeping simple records, filing records and reports, or sorting and distributing incoming mail.
Class A . Perform s one or more of the following: Typing material in final form when it involves combining material from several sources; or responsibility for correct spelling, syllabication, punctuation, etc., of technical or unusual words or foreign language material; or planning layout and typing of complicated statistical tables to maintain uniformity and balance in spacing. May type routine form letters, varying details to suit circumstances.
Class B . Perform s one or more of the following: Copy typing from rough or clear drafts; or routine typing of forms, insurance policies, etc.; or setting up simple standard tabulations; or copying more complex tables already set up and spaced properly.
P R O F E S S IO N A L A N D T E C H N IC A L
COMPUTER OPERATOR
Monitors and operates the control console of a digital computer to process data according to operating instructions, usually prepared by a programer. Work includes most of the following: Studies instructions to determine equipment setup and operations; loads equipment with required items (tape reels, cards, etc.); switches necessary auxiliary equipment into circuit, and starts and operates computer; makes adjustments to computer to correct operating problems and meet special conditions; reviews errors made during operation and determines cause or refers problem to supervisor or programer; and maintains operating records. May test and assist in correcting program.
For wage study purposes, computer operators are classified as follows:
Class A. Operates independently, or under only general direction, a computer running programs with most of the following characteristics: New programs are frequently testedand introduced; scheduling requirements are of critical importance to minimize downtime; the programs are of complex design so that identification of error source often requires a working knowledge of the total program, and alternate programs may not be available. May give direction and guidance to lower level operators.
Class B. Operates independently, or under only general direction, a computer running programs with most of the following characteristics: Most of the programs are established production runs, typically run on a regularly recurring basis; there is little or no testing
COMPUTER OPERATOR— Continued
of new programs required; alternate programs are provided in case original program needs major change or cannot be corrected within a reasonable time. In common error situations, diagnoses cause and takes corrective action. This usually involves applying previously programed corrective steps, or using standard correction techniques.
OR
Operates under direct supervision a computer running programs or segments of programs with the characteristics described for class A. May assist a higher level operator by independently performing less difficult tasks assigned, and performing difficult tasks following detailed instructions and with frequent review of operations performed.
Class C. Works on routine programs under close supervision. Is expected to develop working knowledge of the computer equipment used and ability to detect problems involved in running routine programs. Usually has received some formal training in computer operation. May assist higher level operator on complex programs.
COMPUTER PROGRAMER, BUSINESS
Converts statements of business problems, typically prepared by a systems analyst, into a sequence of detailed instructions which are required to solve the problems by automatic data processing equipment. Working from charts or diagrams, the programer develops the precise instructions which, when entered into the computer system in coded language, cause the manipulation
Digitized for FRASER http://fraser.stlouisfed.org/ Federal Reserve Bank of St. Louis

COMPUTER PROGRAMER, BUSINESS— Continued
of data to achieve desired results. Work involves most of the following: Applies knowledge ofcomputer capabilities, mathematics, logic employed by computers, and particular subject matter involved to analyze charts and diagrams of the problem to be programed; develops sequence of program steps; writes detailed flow charts to show order in which data will be processed; converts these charts to coded instructions for machine to follow; tests and corrects programs; prepares instructions for operating personnel during production run; analyzes, reviews, and alters programs to increase operating efficiency or adapt to new requirements; maintains records of program development and revisions. (NOTE: Workers performing both systems analysis and programing should be classified as systems analysts i f this is the skill used to determine their pay.)
Does not include employees primarily responsible for the management or supervision of other electronic data processing employees, or programers prim arily concerned with scientific and/or engineering problems.
For wage study purposes, programers are classified as follows:Class A . Works independently or under only general direction on complex problems which
require competence in all phases of programing concepts and practices. Working from diagrams and charts which identify the nature of desired results, major processing steps to be accomplished, and the relationships between various steps of the problem solving routine; plans the full range of programing actions needed to efficiently utilize the computer system in achieving desired end products.
At this level, programing is difficult because computer equipment must be organized to produce several interrelated but diverse products from numerous and diverse data elements. A wide variety and extensive number of internal processing actions must occur. This requires such actions as development of common operations which can be reused, establishment of linkage points between operations, adjustments to data when program requirements exceed computer storage capacity, and substantial manipulation and resequencing of data elements to form a highly integrated program.
May provide functional direction to lower level programers who are assigned to assist.
Class B . Works independently or under only general direction on relatively simple programs, or on simple segments of complex programs. Programs (or segments) usually process information to produce data in two or three varied sequences or formats. Reports and listings are produced by refining, adapting, arraying, or making minor additions to or deletions from input data which are readily available. While numerous records may be processed, the data have been refined in prior actions so that the accuracy and sequencing of data can be tested by using a few routine checks. Typically, the program deals with routine record-keeping type operations.
ORWorks on complex programs (as described for class A) under close direction of a higher
level programer or supervisor. May assist higher level programer by independently performing less difficult tasks assigned, and performing more difficult tasks under fa irly close direction.
May guide or instruct lower level programers.Class C. Makes practical applications of programing practices and concepts usually
learned in formal training courses. Assignments are designed to develop competence in the application of standard procedures to routine problems. Receives close supervision on new aspects of assignments; and work is reviewed to verify its accuracy and conformance with required procedures.
COMPUTER SYSTEMS ANALYST, BUSINESSAnalyzes business problems to formulate procedures for solving them by use of electronic
data processing equipment. Develops a complete description of all specifications needed to enable programers to prepare required digital computer programs. Work involves most of the following: Analyzes subject-matter operations to be automated and identifies conditions and criteria required to achieve satisfactory results; specifies number and types of records, files, and documents to be used: outlines actions to be performed by personnel and computers in sufficient detail for presentation to management and for programing (typically this involves preparation of work and data flow charts); coordinates the development of test problems and participates in tria l runs of new and revised systems; and recommends equipment changes to obtain more effective overall operations. (NOTE: Workers performing both systems analysis and programing should be classified as systems analysts if this is the skill used to determine their pay.)
Does not include employees primarily responsible for the management or supervision of other electronic data processing employees, or systems analysts primarily concerned with scientific or engineering problems.
For wage study purposes, systems analysts are classified as follows:Class A . Works independently or under only general direction on complex problems in
volving all phases of systems analysis. Problems are complex because of diverse sources of input data and multiple-use requirements of output data. (For example, develops an integrated production scheduling, inventory control, cost analysis, and sales analysis record in which
27
COMPUTER SYSTEMS ANALYST, BUSINESS— Continued
every item of each type is automatically processed through the full system of records and appropriate followup actions are initiated by the computer.) Confers with persons concerned to determine the data processing problems and advises subject-matter personnel on the implications of new or revised systems of data processing operations. Makes recommendations, if needed, for approval of major systems installations or changes and for obtaining equipment.
May provide functional direction to lower level systems analysts who are assigned to assist.
Class B. Works independently or under only general direction on problems that are relatively uncomplicated to analyze, plan, program, and operate. Problems are of limited complexity because sources of input data are homogeneous and the output data are closely related. (For example, develops systems for maintaining depositor accounts in a bank, maintaining accounts receivable in a retail establishment, or maintaining inventory accounts in a manufacturing or wholesale establishment.) Confers with persons concerned to determine the data processing problems and advises subject-matter personnel on the implications of the data processing systems to be applied.
ORWorks on a segment of a complex data processing scheme or system, as described for
class A. Works independently on routine assignments and receives instruction and guidance on complex assignments. Work is reviewed for accuracy of judgment, compliance with instructions, and to insure proper alinement with the overall system.
Class C. Works under immediate supervision, carrying out analyses as assigned, usually of a single activity. Assignments are designed to develop and expand practical experience in the application of procedures and skills required for systems analysis work. For example, may assist a higher level systems analyst by preparing the detailed specifications required by programers from information developed by the higher level analyst.
DRAFTSMAN
Class A . Plans the graphic presentation of complex items having distinctive design features that differ significantly from established drafting precedents. Works in close support with the design originator, and may recommend minor design changes. Analyzes the effect of each change on the details of form , function, and positional relationships of components and parts. Works with a minimum of supervisory assistance. Completed work is reviewed by design originator for consistency with prior engineering determinations. May either prepare drawings, or direct their preparation by lower level draftsmen.
Class B. Perform s nonroutine and complex drafting assignments that require the application of most of the standardized drawing techniques regularly used. Duties typically involve such work as: Prepares working drawings of subassemblies with irregular shapes,multiple functions, and precise positional relationships between components: prepares architectural drawings for construction of a building including detail drawings of foundations, wall sections, floor plans, and roof. Uses accepted formulas and manuals in making necessary computations to determine quantities of materials to be used, load capacities, strengths, stresses, etc. Receives initial instructions, requirements, and advice from supervisor. Completed work is checked for technical adequacy.
Class C. Prepares detail drawings of single units or parts for engineering, construction, manufacturing, or repair purposes. Types of drawings prepared include isometric projections (depicting three dimensions in accurate scale) and sectional views to clarify positioning of components and convey needed information. Consolidates details from a number of sources and adjusts or transposes scale as required. Suggested methods of approach, applicable precedents, and advice on source materials are given with initial assignments. Instructions are less complete when assignments recur. Work may be spot-checked during progress.
DRAFTSMAN-TRACER
Copies plans and drawings prepared by others by placing tracing cloth or paper over drawings and tracing with pen or pencil. (Does not include tracing limited to plans primarily consisting of straight lines and a large scale not requiring close delineation.)
AND/OR
Prepares simple or repetitive drawings of easily visualized items. Work is closely supervised during progress.
ELECTRONIC TECHNICIAN
Works on various types of electronic equipment or systems by performing one or more of the following operations: Modifying, installing, repairing, and overhauling. These operations require the performance of most or all of the following tasks: Assembling, testing, adjusting,calibrating, tuning, and alining.
Work is nonrepetitive and requires a knowledge of the theory and practice of electronics pertaining to the use of general and specialized electronic test equipment; trouble analysis; and the operation, relationship, and alinement of electronic systems, subsystems, and circuits having a variety of component parts.
Digitized for FRASER http://fraser.stlouisfed.org/ Federal Reserve Bank of St. Louis

2 8
ELECTRONIC TECHNICIAN— Continued
Electronic equipment or systems worked on typically include one or more of the following: Ground, vehicle, or airborne radio communications systems, relay systems, navigation aids; airborne or ground radar systems; radio and television transmitting or recording systems; e lectronic computers; m issile and spacecraft guidance and control systems; industrial and medical measuring, indicating and controlling devices; etc.
(Exclude production assemblers and testers, craftsmen, draftsmen, designers, engineers, and repairmen of such standard electronic equipment as office machines, radio and television receiving sets.)
NURSE, INDUSTRIAL (Registered)
A registered nurse who gives nursing service under general medical direction to i l l or injured employees or other persons who become il l or suffer an accident on the premises of a factory or other establishment. Duties involve a combination of the following: Giving first aidto the ill or injured; attending to subsequent dressing of employees' injuries; keeping records of patients treated; preparing accident reports for compensation or other purposes; assisting in physical examinations and health evaluations of applicants and employees; and planning and carrying out programs involving health education, accident prevention, evaluation of plant environment, or other activities affecting the health, welfare, and safety of all personnel. Nursing supervisors or head nurses in establishments employing more than one nurse are excluded.
M A IN T E N A N C E A N D P O W E R P L A N T
CARPENTER, MAINTENANCE
Perform s the carpentry duties necessary to construct and maintain in good repair building woodwork and equipment such as bins, cribs, counters, benches, partitions, doors, floors, stairs, casings, and trim made of wood in an establishment. Work involves most of the following: Planning and laying out of work from blueprints, drawings, models, or verbal instructions; using a variety of carpenter's handtools, portable power tools, and standard measuring instruments; making standard shop computations relating to dimensions of work; and selecting materials necessary for the work. In general, the work of the maintenance carpenter requires rounded training and experience usually acquired through a formal apprenticeship or equivalent training and experience.ELECTRICIAN, MAINTENANCE
Perform s a variety of electrical trade functions such as the installation, maintenance, or repair of equipment for the generation, distribution, or utilization of electric energy in an establishment. Work involves most of the following: Installing or repairing any of a variety of electrical equipment such as generators, transformers, switchboards, controllers, circuit breakers, motors, heating units, conduit systems, or other transmission equipment; working from blueprints, drawings, layouts, or other specifications; locating and diagnosing trouble in the electrical system or equipment; working standard computations relating to load requirements of wiring or electrical equipment; and using a variety of electrician's handtools and measuring and testing instruments. In general, the work of the maintenance electrician requires rounded training and experience usually acquired through a formal apprenticeship or equivalent training and experience. ENGINEER, STATIONARY
Operates and maintains and may also supervise the operation of stationary engines and equipment (mechanical or e lectrical) to supply the establishment in which employed with power, heat, refrigeration, or air-conditioning. Work involves: Operating and maintaining equipmentsuch as steam engines, air compressors, generators, motors, turbines, ventilating and re fr ig erating equipment, steam boilers and boiler-fed water pumps; making equipment repairs; and keeping a record of operation of machinery, temperature, and fuel consumption. May also supervise these operations. Head or chief engineers in establishments employing more than one engineer are excluded.
FIREMAN, STATIONARY BOILERFires stationary boilers to furnish the establishment in which employed with heat, power,
or steam. Feeds fuels to fire by hand or operates a mechanical stoker, gas, or oil burner; and checks water and safety valves. May clean, oil, or assist in repairing boilerroom equipment.
HELPER, MAINTENANCE TRADESAssists one or more workers in the skilled maintenance trades, by performing specific
or general duties of lesser skill, such as keeping a worker supplied with materials and tools; cleaning working area, machine, and equipment; assisting journeyman by holding materials or tools; and performing other unskilled tasks as directed by journeyman. The kind of work the helper is permitted to perform varies from trade to trade: In some trades the helper is confined to supplying, lifting, and holding materials and tools, and cleaning working areas; and in others he is permitted to perform specialized machine operations, or parts of a trade that are also performed by workers on a full-time basis.MACHINE-TOOL OPERATOR, TOOLROOM
Specializes in the operation of one or more types of machine tools, such as jig borers, cylindrical or surface grinders, engine lathes, or milling machines, in the construction of machine-shop tools, gages, jigs, fixtures, or dies. Work involves most of the following: Planning and performing difficult machining operations; processing items requiring complicated setups or a high degree of accuracy; using a variety of precision measuring instruments; selecting feeds, speeds, tooling, and operation sequence; and making necessary adjustments during operation to achieve requisite tolerances or dimensions. May be required to recognize when tools need dressing, to dress tools, and to select proper coolants and cutting and lubricating oils. For cross-industry wage study purposes, machine-tool operators, toolroom, in tool and die jobbing shops are excluded from this classification.
MACHINIST, MAINTENANCE
Produces replacement parts and new parts in making repairs of metal parts of mechanical equipment operated in an establishment. Work involves most of the following: Interpreting written instructions and specifications; planning and laying out of work; using a variety of machinist's handtools and precision measuring instruments; setting up and operating standard machine tools; shaping of metal parts to close tolerances; making standard shop computations relating to dimensions of work, tooling, feeds, and speeds of machining; knowledge of the working properties of the common metals; selecting standard materials, parts, and equipment required for his work; and fitting and assembling parts into mechanical equipment. In general, the machinist's work normally requires a rounded training in machine-shop practice usually acquired through a formal apprenticeship or equivalent training and experience.
MECHANIC, AUTOMOTIVE (Maintenance)
Repairs automobiles, buses, motortrucks, and tractors of an establishment. Work involves most of the following: Examining automotive equipment to diagnose source of trouble; disassembling equipment and performing repairs that involve the use of such handtools as wrenches, gages, drills , or specialized equipment in disassembling or fitting parts; replacing broken or defective parts from stock; grinding and adjusting valves; reassembling and installing the various assemblies in the vehicle and making necessary adjustments; and alining wheels, adjusting brakes and lights, or tightening body bolts. In general, the work of the automotive mechanic requires rounded training and experience usually acquired through a formal apprenticeship or equivalent training and experience.
This classification does not include mechanics who repair customers' vehicles in automobile repair shops.
MECHANIC, MAINTENANCE
Repairs machinery or mechanical equipment of an establishment. Work involves most of the following: Examining machines and mechanical equipment to diagnose source of trouble;dismantling or partly dismantling machines and performing repairs that mainly involve the use of handtools in scraping and fitting parts; replacing broken or defective parts with items obtained from stock; ordering the production of a replacement part by a machine shop or sending of the machine to a machine shop for major repairs; preparing written specifications for major repairs or for the production of parts ordered from machine shop; reassembling machines; and making all necessary adjustments for operation. In general, the work of a maintenance mechanic requires rounded training and experience usually acquired through a formal apprenticeship or equivalent training and experience. Excluded from this classification are workers whose primary duties involve setting up or adjusting machines.
MILLWRIGHT
Installs new machines or heavy equipment, and dismantles and installs machines or heavy equipment when changes in the plant layout are required. Work involves most of the following; Planning and laying out of the work; interpreting blueprints or other specifications; using a variety of handtools and rigging; making standard shop computations relating to stresses, strength of materials, and centers of gravity; alining and balancing of equipment; selecting standard tools, equipment, and parts to be used; and installing and maintaining in good order power transmission equipment such as drives and speed reducers. In general, the m illwright's work normally requires a rounded training and experience in the trade acquired through a formal apprenticeship or equivalent training and experience.
PAINTER, MAINTENANCE
Paints and redecorates walls, woodwork, and fixtures of an establishment. Work involves the following: Knowledge of surface peculiarities and types of paint required for different applications; preparing surface for painting by removing old finish or by placing putty or fille r in nail
Digitized for FRASER http://fraser.stlouisfed.org/ Federal Reserve Bank of St. Louis

2 9
PAINTER, MAINTENANCE— Continued
holes and interstices; and applying paint with spray gun or brush. May mix colors, oils, white lead, and other paint ingredients to obtain proper color or consistency. In general, the work of the maintenance painter requires rounded training and experience usually acquired through a formal apprenticeship or equivalent training and experience.
PIPEFITTER, MAINTENANCEInstalls or repairs water, steam, gas, or other types of pipe and pipefittings in an
establishment. Work involves most of the following: Laying out of work and measuring to locate position of pipe from drawings or other written specifications; cutting various sizes of pipe to correct lengths with chisel and hammer or oxyacetylene torch or pipe-cutting machines; threading pipe with stocks and dies; bending pipe by hand-driven or power-driven machines; assembling pipe with couplings and fastening pipe to hangers; making standard shop computations relating to pressures, flow, and size of pipe required; and making standard tests to determine whether finished pipes meet specifications. In general, the work of the maintenance pipefitter requires rounded training and experience usually acquired through a formal apprenticeship or equivalent training and experience. Workers prim arily engaged in installing and repairing building sanitation or heating systems are excluded.
SHEET-METAL WORKER, MAINTENANCEFabricates, installs, and maintains in good repair the sheet-metal equipment and fixtures
(such as machine guards, grease pans, shelves, lockers, tanks, ventilators, chutes, ducts, metal roofing) of an establishment. Work involves most of the following: Planning and laying out alltypes-of sheet-metal maintenance work from blueprints, models, or other specifications; setting
SHEET-M ETAL WORKER, MAINTENANCE---Continued
up and operating all available types of sheet-metal working machines; using a variety of handtools in cutting, bending, forming, shaping, fitting, and assembling; and installing sheet-metal articles as required. In general, the work of the maintenance sheet-metal worker requires rounded training and experience usually acquired through a formal apprenticeship or equivalent training and experience.
TOOL AND DIE MAKER
(Die maker; jig maker; tool maker; fixture maker; gage maker)
Constructs and repairs machine-shop tools, gages, jigs, fixtures or dies for forgings, punching, and other metal-forming work. Work involves most of the following; Planning and laying out of work from models, blueprints, drawings, or other oral and written specifications; using a variety of tool and die maker's handtools and precision measuring instruments; understanding of the working properties of common metals and alloys; setting up and operating of machine tools and related equipment; making necessary shop computations relating to dimensions of work, speeds, feeds, and tooling of machines; heat-treating of metal parts during fabrication as well as of finished tools and dies to achieve required qualities; working to closfe tolerances; fitting and assembling of parts to prescribed tolerances and allowances; and selecting appropriate materials, tools, and processes. In general, the tool and die maker's work requires a rounded training in machine-shop and toolroom practice usually acquired through a formal apprenticeship or equivalent training and experience.
For cross-industry wage study purposes, tool and die makers in tool and die jobbing shops are excluded from this classification.
C U S T O D IA L A N D M A T E R IA L M O V E M E N T
GUARD AND WATCHMAN
Guard. Performs routine police duties, either at fixed post or on tour, maintaining order, using arms or force where necessary. Includes gatemen who are stationed at gate and check on identity of employees and other persons entering.
Watchman. Makes rounds of premises periodically in protecting property against fire , theft, and illegal entry.
JANITOR, PORTER, OR CLEANER
(Sweeper; charwoman; janitress)Cleans and keeps in an orderly condition factory working areas and washrooms, or
premises of an office, apartment house, or commercial or other establishment. Duties involve a combination of the following: Sweeping, mopping or scrubbing, and polishing floors; removing chips, trash, and other refuse; dusting equipment, furniture, or fixtures; polishing metal fix tures or trimmings; providing supplies and minor maintenance services; and cleaning lavatories, showers, and restrooms. Workers who specialize in window washing are excluded.
LABORER, M ATERIAL HANDLING
(Loader and unloader; handler and stacker; shelver; trucker; stockman or stock helper; warehouseman or warehouse helper)
A worker employed in a warehouse, manufacturing plant, store, or other establishment whose duties involve one or more of the following: Loading and unloading various materials and merchandise on or from freight cars, trucks, or other transporting devices; unpacking, shelving, or placing materials or merchandise in proper storage location; and transporting materials or merchandise by handtruck, car, or wheelbarrow. Longshoremen, who load and unload ships are excluded.
ORDER FILLER(Order picker; stock selector; warehouse stockman)
F ills shipping or transfer orders for finished goods from stored merchandise in accordance with specifications on sales slips, customers' orders, or other instructions. May, in addition to filling orders and indicating items filled or omitted, keep records of outgoing orders, requisition additional stock or report short supplies to supervisor, and perform other related duties.
PACKER, SHIPPINGPrepares finished products .for shipment or storage by placing them in shipping con
tainers, the specific . operations performed being dependent upon the type, size, and number of units to be packed, the type of container employed, and method of shipment. Work requires the placing of items in shipping containers and may involve one or more of the following: Knowledge of various items of stock in order to verify content; selection of appropriate type
PACKER, SHIPPING— Continued
and size of container; inserting enclosures in container; using excelsior or other material to prevent breakage or damage; closing and sealing container; and applying labels or entering identifying data on container. Packers who also make wooden boxes or crates are excluded.SHIPPING AND RECEIVING CLERK
Prepares merchandise for shipment, or receives and is responsible for incoming shipments of merchandise or other materials. Shipping work involves: A knowledge of shipping procedures, practices, routes, available means of transportation, and rates; and preparing records of the goods shipped, making up bills of lading, posting weight and shipping charges, and keeping a file of shipping records. May direct or assist in preparing the merchandise for shipment. Receiving work involves: Verifying or directing others in verifying the correctness of shipments against bills of lading, invoices, or other records; checking for shortages and rejecting damaged goods; routing merchandise or materials to proper departments; and maintaining necessary records and files.
For wage study purposes, workers are classified as follows:Receiving clerkShipping clerkShipping and receiving clerk
TRUCKDRIVERDrives a truck within a city or industrial area to transport materials, merchandise,
equipment, or men between various types of establishments such as: Manufacturing plants, freight depots, warehouses, wholesale and retail establishments, or between retail establishments and customers' houses or places of business. May also load or unload truck with or without helpers, make minor mechanical repairs, and keep truck in good working order. Driver-salesmen and over-the-road drivers are excluded.
For wage study purposes, truckdrivers are classified by size and type of equipment, as follows: (Tractor-tra iler should be rated on the basis of tra iler capacity.)
Truckdriver (combination of sizes listed separately)Truckdriver, light (under l'/z tons)Truckdriver, medium ( 1 V2 to and including 4 tons)Truckdriver, heavy (over 4 tons, tra iler type)Truckdriver, heavy (over 4 tons, other than trailer type)
TRUCKER, POWEROperates a manually controlled gasoline- or electric-powered truck or tractor to transport
goods and materials of all kinds about a warehouse, manufacturing plant, or other establishment.
For wage study purposes, workers are classified by type of truck, as follows:
Trucker, power (forklift)Trucker, power (other than forklift)
Digitized for FRASER http://fraser.stlouisfed.org/ Federal Reserve Bank of St. Louis

Available O n Request-----
The following areas are surveyed periodically for use in administering the Service Contract Act of 1965. available at no cost while supplies last from any of the BLS regional offices shown on the inside front cover.
Copies of public releases are
Alaska Albany, Ga.Alpena, Standish, and Tawas City, Mich. Am arillo , Tex.Asheville, N.C.Atlantic City, N.J.Augusta, G a—S.C.Austin, Tex.Bakersfield, Calif.Baton Rouge, La.B iloxi, Gulfport, and Pascagoula, Miss. Bridgeport, Norwalk, and Stamford, Conn. Charleston, S.C.C larksville , Tenn., and Hopkinsville, Ky. Colorado Springs, Colo.Columbia, S.C.Columbus, G a—Ala.Crane, Ind.Dothan, Ala.Duluth—Superior, Minn.—Wis.Durham, N.C.El Paso, Tex.Eugene, Oreg.Fargo—Moorhead, N. Dak.—Minn. Fayetteville, N.C.Fitchburg—Leom inster, Mass.Fort Smith, Ark.—Okla.Frederick—Hagerstown, M d.-Pa.-W . Va. Great Falls, Mont.Greensboro-Winston Salem—High Point, N.C. Harrisburg, Pa.Huntsville, Ala.Knoxville, Tenn.
Laredo, Tex.Las Vegas, Nev.Lexington, Ky.Lower Eastern Shore, Md.-Va.Macon, Ga.Marquette, Escanaba, Sault Ste. M arie, Mich. Meridian, M iss.Middlesex, Monmouth, Ocean and Somerset
Cos., N.J.Mobile, A la., and Pensacola, Fla. Montgomery, Ala.Nashville, Tenn.New London—Groton—Norwich, Conn. Northeastern Maine Ogden, Utah Orlando, Fla.Oxnard—Ventura, Calif.Panama City, Fla.Pine Bluff, Ark.Portsmouth, N.H.—Maine—Mass.Pueblo, Colo.Reno, Nev.Sacramento, Calif.Santa Barbara, Calif.Shreveport, La.Springfield—Chicopee—Holyoke, Mass.—Conn. Stockton, Calif.Tacoma, Wash.Topeka, Kans.Tucson, A r iz .Valle jo—Napa, Calif.Wichita Falls, Tex.Wilmington, D e l— N.J.—Md.
The eleventh annual report on salaries for accountants, auditors, chief accountants, attorneys, job analysts, d irectors o f personnel, buyers, chemists, engineers, engineering technicians, draftsmen, and c lerica l employees. Order as BLS Bulletin 1693, National Survey of Professional, Adm inistrative, Technical, and C lerica l Pay, June 1970, $1.00 a copy, from the Superintendent of Documents, U.S. Government Printing O ffice, Washington, D.C., 20402, or any of its regional sales offices.
☆ U . S . G O V E R N M E N T P R I N T I N G O F F I C E : 1 9 7 2 — 7 4 - 5 - 1 0 2 / 5 3
Digitized for FRASER http://fraser.stlouisfed.org/ Federal Reserve Bank of St. Louis

Area W ag e Surveys
A l is t o f the la te s t a v a ila b le b u lle tin s is p res e n ted b e lo w . A d ir e c to r y o f a r ea w a ge stud ies in clu d in g m o re l im ite d stud ies conducted at the requ es t o f the E m p loym en t S tandards A d m in is tra t io n o f the D epa rtm en t o f L a b o r is a v a ila b le on requ es t. B u lle t in s m a y be p u rch ased fr o m the Superintendent o f D ocu m ents, U .S . G o ve rn m en t P r in t in g O f f ic e , W ash ington , D .C ., 20402, o r f r o m any o f the B L S re g io n a l sa le s o f f ic e s shown on the in s id e fro n t c o v e r .
B u lle t in num berA r e a and p r ic e
Akron, Ohio, July 1971 1---------------------------------------- 1685-87, 40 centsAlbany—Schenectady—Troy, N .Y ., Mar. 1971 1---------- 1685-54, 35 centsAlbuquerque, N. M ex., Mar. 1971__________ __________ 1685-58, 30 centsAllentown—Bethlehem—Easton, Pa.—N.J., May 1971— 1685-75, 30 centsAtlanta, Ga., May 1971----------------------------------------- 1685-69, 40 centsBaltimore, Md., Aug. 1971_____________ ———------------ 1725-16, 35 centsBeaumont-Port Arthur-Orange, Tex., May 1971 1---- 1685-68, 35 centsBinghamton, N .Y., July 1971 1 ------------------------------- 1725-6, 35 centsBirmingham, A la., Mar. 1971 1 ----------------------------- 1685-63, 40 centsBoise City, Idaho, Nov. 1971--------------------------------- 1725-27, 30 centsBoston, Mass., Aug. 1971-------------------------------------- 1725-11, 40 centsBuffalo, N .Y ., Oct. 19701_____________________________ 1685-43, 50 centsBurlington, V t., Dec. 1971------------------------------------- 1725-25, 25 centsCanton, Ohio, May 1971 ---------------------------------------- 1685-71, 30 centsCharleston, W. Va., Mar. 1971------------------------------ 1685-57, 30 centsCharlotte, N.C., Jan. 1971------------------------------------- 1685-48, 30 centsChattanooga, Tenn.—Ga., Sept. 1971------------------------ 1725-14, 30 centsChicago, 111., June 1970---------------------------------------- 1660-90, 60 centsCincinnati, Ohio—Ky.—Ind., Feb. 1971 1------------------- 1685-53, 45 centsCleveland, Ohio, Sept. 1971---------------------------------- 1725-17, 40 centsColumbus, Ohio, Oct. 1971 ------------------------------------ 1725-19, 30 centsDallas, Tex., Oct. 1971________________________________ 1725-26, 35 centsDavenport—Rock Island—Moline, Iowa—111.,
Feb. 1971______________________________________________ 1685-51, 30 centsDayton, Ohio, Dec. 1970 1------------------------------------- 1685-45, 40 centsDenver, Colo., Dec. 1970______ _____— ___--------- -—— 1685-41, 35 centsDes Moines, Iowa, May 1971__________________________ 1685-70, 30 centsDetroit, Mich., Feb. 1971 1____________________________ 1685-77, 50 centsFort Worth, Tex., Oct. 1971--------------------------------- 1725-21, 30 centsGreen Bay, W is., July 1971 ---------------------------------- 1725-3, 30 centsGreenville, S.C., May 1971 1--------------------------------- 1685-78, 35 centsHouston, Tex., Apr. 1971 1 _________-— ------------ ----— 1685-67, 50 centsIndianapolis, Ind., Oct. 1971---------------------------------- 1725-23, 30 centsJackson, M iss ., Jan. 1971 1___________________________ 1685-39, 35 centsJacksonville, F la ., Dec. 1970 1------------------------------ 1685-37, 35 centsKansas City, Mo.—Kans., Sept. 1971 ----------------------- 1725- 18, 35 centsLawrence—Haverhill, Mass.—N.H., June 1971---------- 1685-83, 30 centsLittle Rock—North L ittle Rock, Ark., July 1971------- 1725-4, 30 centsLos Angeles—Long Beach and Anaheim—Santa Ana— .
Garden Grove, C a lif., Mar. 1971 1 ----------------------- 1685-66, 50 centsLouisville, Ky.—Ind., Nov, 1971 1------------------------- — 1725-29, 35 centsLubbock, T ex ., Mar. 1971_____________________________ 1685-60, 30 centsManchester, N.H., July 1971-------------- ------------------- 1725-2, 30 centsMemphis, Tenn.—A rk ., Nov. 1970--------------------------- 1685-30, 30 centsMiami, F la ., Nov. 1971-------------------- ------------------- 1725-28, 30 centsMidland and Odessa, T ex., J an. 1971--------— ---------- 1685-40, 30 centsMilwaukee, W is., May 1971----------------------------- —— 1685-76, 35 centsMinneapolis—St. Paul, Minn., J an. 19 71 ------------------- 1685-44, 40 cents
Data on establishment practices and supplementary wage provisions are also presented.
B u lle t in num berA r e a and p r ic e
Muskegon—Muskegon Heights, Mich., June 1971______ 1685-82, 30 centsNewark and Jersey City, N.J., Jan. 1971____________ 1685-47, 40 centsNew Haven, Conn., J an. 1971________________________ 1685-35, 30 centsNew Orleans, L a ., J an. 1971 1------------------------------ 1685-36, 40 centsNew York, N .Y ., Apr. 1971___________________________ 1685-89, 65 centsNorfolk-Portsmouth and Newport News—
Hampton, V a., J an. 1971 1__________________________ 1685-46, 35 centsOklahoma City, Okla., J uly 1971 1___________________ 1725-8, 3 5 centsOmaha, Nebr.—Iowa, Sept. 1971 1 -------------------------- 1725-13, 35 centsPaterson—Clifton—Passaic, N.J., June 1971_________ 1685-84, 35 centsPhiladelphia, Pa.—N .J., Nov. 1970------------------------- 1685-34, 50 centsPhoenix, A r iz . , June 1971____________________________ 1685-86, 30 centsPittsburgh, Pa., J an. 1971 1__________________________ 1685-49, 50 centsPortland, Maine, Nov. 1971 1________________________ 1725-22, 35 centsPortland, Oreg.—Wash., May 1971___________________ 1685-85, 35 centsProvidence—Pawtucket—Warwick, R.I.—M ass.,
May 1971 1____________________________________________ 1685-80, 40 centsRaleigh, N.C., Aug. 1971_____________________________ 1725-5, 30 centsRichmond, Va., Mar. 1971----------------------------------- 1685-62, 30 centsRochester, N.Y. (office occupations only),
July 1971 1 -------------------------------------------------------- 1725-7, 35 centsRockford, 111., May 1971_____________________________ 1685-79, 30 centsSt. Louis, Mo.—111., Mar. 1971 1---------------------------- 1685-65, 50 centsSalt Lake City, Utah, Nov. 1971______________________ 1725-24, 30 centsSan Antonio, T ex ., May 1971 1------------------------------ 1685-81, 35 centsSan Bernardino—Riverside—Ontario, Calif.,
Dec. 1970 1-------------------------------------------------------- 1685-42, 40 centsSan Diego, C a lif., Nov. 1970_________________________ 1685-20, 30 centsSan Francisco—Oakland, Calif., Oct. 1970____________ 1685-23, 40 centsSan Jose, C a lif., Aug. 1971 1-------------------------------- 1725-15, 35 centsSavannah, Ga., May 1971_____________________________ 1685-72, 30 centsScranton, P a ., July 1971__________________________ __ 1725-1, 30 centsSeattle—Eve re tt, W ash., J an. 1971 1----------------------- 1685-52, 35 centsSioux F a lls , S. Dak., Dec. 1970 1 -------------------------- 1685-38, 35 centsSouth Bend, Ind., Mar. 1971_____________________ _____ 1685-61, 30 centsSpokane, Wash., June 1971___________________________ 1685-88, 30 centsSyracuse, N .Y., July 1971 1 --------------------------------- 1725-10, 35 centsTampar-St. Petersburg, F la., Nov. 1970---------------- 1685-17, 30 centsToledo, Ohio—M ich., Apr. 1971 1______________ ______ 1685-74, 40 centsTrenton, N.J., Sept. 1971________ ______________ ______ 1725-12, 30 centsUtica-Rome, N .Y ., July 1971 1 _______________________ 1725-9, 35 centsWashington, D.C.—Md.—Va., Apr. 1971 ______________ 1685-56, 40 centsWaterbury, Conn., Mar. 1971________________________ 1685-55, 30 centsWaterloo, Iowa, Nov. 1971------------------------------------ 1725-20, 30 centsWichita, Kans., Apr. 1971___________________ ______ _ 1685-64, 30 centsW orcester, M ass., May 1971------------------------------- 1685-73, 30 centsYork, Pa., Feb. 1971__________________________________ 1685-50, 30 centsYoungstown—Warren, Ohio, Nov. 1970_______________ 1685-24, 30 cents
l
Digitized for FRASER http://fraser.stlouisfed.org/ Federal Reserve Bank of St. Louis

FIRST CLASS MAILU.S. DEPARTMENT OF LABOR BUREAU OF LABOR STATISTICS
W A S H IN G TO N , D.C. 20212POSTAGE A N D FEES P A ID
U.S. DEPARTMENT OF LABOR
O F F IC IA L BUSINESS
PENALTY FOR PRIVATE USE, $300
Digitized for FRASER http://fraser.stlouisfed.org/ Federal Reserve Bank of St. Louis


