Blowout - A cost benefit analysis of the Australian Grand Prix ...
26
© NPANSW
Transcript of Blowout - A cost benefit analysis of the Australian Grand Prix ...

© NPANSW
Blowout! A cost benefit analysis of the Australian Grand Prix. 2
Report prepared by:
Economists at Large Pty Ltd Melbourne, Australia www.ecolarge.com [email protected]
Phone: +61 3 9005 0154 | Fax: +61 3 8080 1604 65 Bevan St, Albert Park, VIC 3065, Melbourne, Australia
Citation:
Economists at Large, 2013, Blowout! A cost benefit analysis of the Australian Grand Prix, a report for Save Albert Park, prepared by Economists at Large, Melbourne, Australia.
Report author(s):
Roderick Campbell
Disclaimer:
The views expressed in this report are those of the authors and may not in any circumstances be regarded as stating an official position of the organisations involved.
This report is distributed with the understanding that the authors are not responsible for the results of any actions undertaken on the basis of the information that is contained within, nor for any omission from, or error in, this publication.
Blowout! A cost benefit analysis of the Australian Grand Prix. 3
CONTENTS Executive summary ................................................................................................................................ 4
Introduction ........................................................................................................................................... 6
About the Australian Formula 1 Grand Prix. ...................................................................................... 6
About cost benefit analysis ................................................................................................................ 6
Scope of analysis ................................................................................................................................ 7
Geography ......................................................................................................................................... 7
Timing ................................................................................................................................................ 7
Conversions ....................................................................................................................................... 7
Quality of data ................................................................................................................................... 7
Financial Costs ....................................................................................................................................... 9
Operating costs .................................................................................................................................. 9
Other Government costs ................................................................................................................... 9
Costs to Victorian community ............................................................................................................. 11
Loss of park use and amenity .......................................................................................................... 11
Traffic congestion and diversion costs ............................................................................................ 12
Noise costs ....................................................................................................................................... 13
Benefits of the Grand Prix ................................................................................................................... 14
Sales and sponsorship revenue ....................................................................................................... 14
Values related to attendance .......................................................................................................... 14
Consumer surplus to Victorian attendees ....................................................................................... 15
Surpluses relating to associated events .......................................................................................... 15
Surpluses relating to increased visitation ........................................................................................ 15
Benefits of media exposure ............................................................................................................. 18
Overall cost benefit results for 2011 Grand Prix ................................................................................. 19
Costs and benefits with high degree of reliability ........................................................................... 19
Sensitivity analysis ........................................................................................................................... 20
Implications for 2012 Grand Prix ......................................................................................................... 21
Implications for the continuation of the grand prix ............................................................................ 24
Conclusion ........................................................................................................................................... 24
References ........................................................................................................................................... 25

Blowout! A cost benefit analysis of the Australian Grand Prix. 4
EXECUTIVE SUMMARY The 2012 Australian Grand Prix resulted in a net economic loss to Victoria of between $48.7m and $66.7m dollars, with a mid estimate of $60.6m. These estimates include not only financial losses to the state, but also consideration of non-‐market values such as noise and park amenity, benefits of increased visitation to Victoria and the media exposure of the event. Sensitivity analysis on the less certain variables indicates that the magnitude of the loss is not affected by these values. There is no doubt that the race reduced the welfare of Victorians in 2012 by tens of millions of dollars. Save Albert Park (SAP) have commissioned Economists at Large to conduct this cost benefit analysis (CBA) of the Australian Formula 1 Grand Prix. CBA is the preferred economic assessment tool of the Victorian Department of Treasury and Finance and was recommended for ongoing assessment of the Grand Prix by the Victorian Auditor General’s Office (VAGO) in 2007. In 2007 VAGO estimated the race resulted in a net loss of $6.7 million. Since that time the increasing costs of the race have been well publicised, but no further CBA study has been conducted. Our analysis closely follows the methodology of VAGO (2007), allowing the results to be compared:
The most important costs and benefits are based on financial data from the Australian Grand Prix Corporation annual reports. Like VAGO (2007), we include consideration of other economic and non-‐market costs and benefits, estimated with various methodologies. These costs and benefits
VAGO (2007)
analysis of 2005 Grand Prix
Economists at Large analysis of 2011
Grand Prix
Economists at Large analysis of 2012
Grand Prix
Total operating costs 68,100,000 85,132,000 97,185,000
Total revenues 41,500,000 32,421,000 35,609,000 Net operating loss -‐26,600,000 -‐52,711,000 -‐61,576,000
Less other economic costs: Other government costs 500,000 415,000 419,150
Loss of park use and amenity 400,000 2,689,506 2,716,401 Congestion 500,000 598,000 603,980
Noise 200,000 283,936 286,775
Plus other economic benefits
Victorian spectator and public consumer surplus 5,300,000 1,854,775 1,873,322
Net benefits of increased visitation 5,400,000 2,878,000 2,906,780
Media exposure and induced tourism 0 263,000 265,630
Mid estimate of net loss -‐6,700,000 -‐51,701,668 -‐60,556,574
Blowout! A cost benefit analysis of the Australian Grand Prix. 5
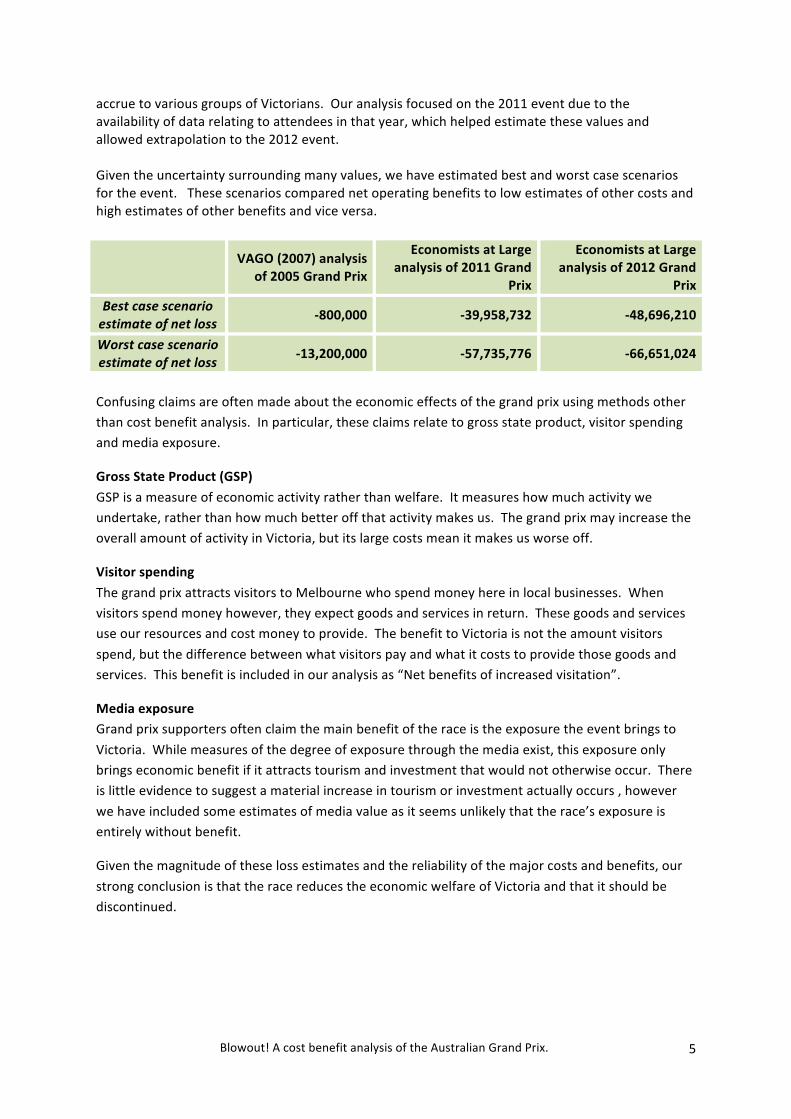
accrue to various groups of Victorians. Our analysis focused on the 2011 event due to the availability of data relating to attendees in that year, which helped estimate these values and allowed extrapolation to the 2012 event. Given the uncertainty surrounding many values, we have estimated best and worst case scenarios for the event. These scenarios compared net operating benefits to low estimates of other costs and high estimates of other benefits and vice versa.
VAGO (2007) analysis of 2005 Grand Prix
Economists at Large analysis of 2011 Grand
Prix
Economists at Large analysis of 2012 Grand
Prix Best case scenario estimate of net loss -‐800,000 -‐39,958,732 -‐48,696,210
Worst case scenario estimate of net loss -‐13,200,000 -‐57,735,776 -‐66,651,024
Confusing claims are often made about the economic effects of the grand prix using methods other than cost benefit analysis. In particular, these claims relate to gross state product, visitor spending and media exposure.
Gross State Product (GSP) GSP is a measure of economic activity rather than welfare. It measures how much activity we undertake, rather than how much better off that activity makes us. The grand prix may increase the overall amount of activity in Victoria, but its large costs mean it makes us worse off.
Visitor spending The grand prix attracts visitors to Melbourne who spend money here in local businesses. When visitors spend money however, they expect goods and services in return. These goods and services use our resources and cost money to provide. The benefit to Victoria is not the amount visitors spend, but the difference between what visitors pay and what it costs to provide those goods and services. This benefit is included in our analysis as “Net benefits of increased visitation”.
Media exposure Grand prix supporters often claim the main benefit of the race is the exposure the event brings to Victoria. While measures of the degree of exposure through the media exist, this exposure only brings economic benefit if it attracts tourism and investment that would not otherwise occur. There is little evidence to suggest a material increase in tourism or investment actually occurs , however we have included some estimates of media value as it seems unlikely that the race’s exposure is entirely without benefit.
Given the magnitude of these loss estimates and the reliability of the major costs and benefits, our strong conclusion is that the race reduces the economic welfare of Victoria and that it should be discontinued.

Blowout! A cost benefit analysis of the Australian Grand Prix. 6
INTRODUCTION Save Albert Park (SAP) have commissioned Economists at Large to conduct a cost benefit analysis (CBA) of the Australian Formula 1 Grand Prix. In recent years much attention has been given to the finances and economic value of the race, as it attracts considerable public subsidy. In 2007 the Victorian Auditor General’s office conducted an inquiry into investment in major events, including cost benefit analysis and economic impact assessment of the grand prix. The cost benefit analysis commissioned by the Auditor General concluded the most likely result was a net cost of $6.7m. The Auditor General also recommended that cost benefit analysis be conducted at both a pre and post event stages. Despite public debate around the finances of the race and the Auditor General’s recommendation of further cost benefit analysis, this report is the first formal cost benefit analysis conducted since VAGO (2007). The only more recent assessment of the grand prix has been an economic impact assessment, (Ernst and Young, 2011). This report estimated impacts on GSP, but did not include cost benefit analysis.
ABOUT THE AUSTRALIAN FORMULA 1 GRAND PRIX. The grand prix has been held annually in Melbourne since 1996. The event takes place over most of a week in March, with the main race on a Sunday, qualifying and other events occurring from the preceding Thursday. In 2013 the race will be held from the 14th to the 17th of March. The race takes place in Albert Park, an area of public parkland only kilometres from Melbourne’s city centre. The grand prix affects public use of Albert Park, public access is closed to the park during the race week, while construction and pack-‐up affects park use and amenity for several months per year. The use of public open space for the event has been controversial since the first race in 1996.
ABOUT COST BENEFIT ANALYSIS Cost benefit analysis is an economic decision making tool drawing on welfare economics. It involves comparing financial revenues and costs in addition to non-‐monetary impacts on people’s welfare, such as consumer surplus, environmental and social externalities.
Cost benefit analysis the preferred evaluation method of almost all economists, treasuries and finance departments. See for example Government of Victoria, (2011); NSW Treasury, (2007); Qld DIP, (2011); Department of Finance and Administration, (2006) Abelson, (2011; Dobes & Bennett, (2009); Ergas, (2009). As Ernst and Young (2011) pointed out:
To understand whether the Grand Prix delivers net welfare improvements to Victoria, a full cost benefit analysis would need to be prepared. (p55)
Cost-‐benefit analysis is necessary as other economic modelling only shows the impact on the state’s economic output, not on welfare. Change in gross state product (GSP) is not an appropriate measure of welfare for three reasons identified by Abelson (2011) p49:
1. GSP includes output produced by, and income accruing to:
Blowout! A cost benefit analysis of the Australian Grand Prix. 7
• non-‐resident owners of capital employed in the state; • non-‐resident labour including short-‐term casual labour arriving for a major event; • the Australian government via income and indirect taxes.
2. GSP makes no allowance for the real cost of labour, i.e. the loss of household production or leisure which is embodied in labour’s reservation price. Therefore, it does not measure the net benefit to labour.
3. GSP does not account for any other non-‐market goods including consumer surpluses, health status, travel in non-‐work time or environmental impacts.
Despite the recommendations of the Auditor General and the agreement between treasuries and economists, this is the first cost benefit analysis performed on the grand prix since VAGO 2007. To allow for comparability with VAGO 2007 we have adopted similar methodology to that study.
SCOPE OF ANALYSIS
GEOGRAPHY Setting a consistent scope is vital for cost benefit analysis. As Victorian Government is the sole owner of the Australian Grand Prix Corporation, funds the grand prix and is responsible for negotiating with Formula 1 management, the most appropriate scope for this analysis is Victoria. This analysis will consider the changes in welfare that the 2011 Grand Prix caused to Victorian producers and consumers.
TIMING The main focus of our report is the 2011 Grand Prix. We have chosen to focus on this year due to the availability of crowd data presented in (Ernst and Young, 2011). Ernst and Young detail the results of a survey of attendees providing information on their places of origin, spending estimates and intentions. This information is useful in calculating several values relevant to cost benefit analysis. Such crowd survey data was not collected in 2012, making analysis more difficult. However, it is likely that most costs and benefits were of similar magnitude and the implications for the 2012 event and future events are discussed.
CONVERSIONS All conversions of Australian dollar units between years have been done using the Australian Bureau of Statistics’ Consumer Price Index Inflation Calculator, available at: www.abs.gov.au/websitedbs/d3310114.nsf/home/consumer+price+index+inflation+calculator
QUALITY OF DATA Cost benefit analysis involves a range of values, some of which are difficult to estimate. The bulk of the costs and benefits of the grand prix are financial, relating to operating costs and sales revenue.
Blowout! A cost benefit analysis of the Australian Grand Prix. 8
These values are relatively easy to measure, have been independently audited and therefore have a high degree of reliability. Other values are less certain. The impacts on local residents due to noise, or the values of induced tourism through international exposure are difficult to measure. We have therefore included a range of estimates for these values and calculated net values of the grand prix based on mid estimates, along with consideration of best and worst case scenarios to reflect the uncertainty in the analysis.
Blowout! A cost benefit analysis of the Australian Grand Prix. 9
FINANCIAL COSTS
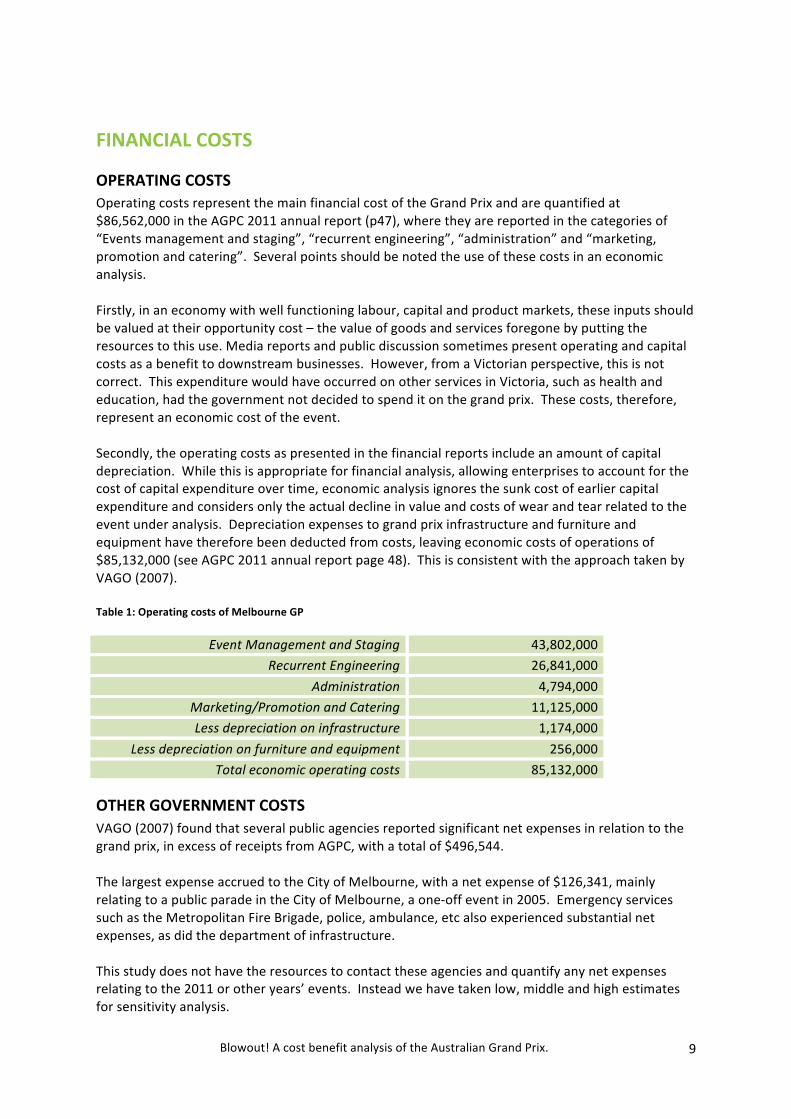
OPERATING COSTS Operating costs represent the main financial cost of the Grand Prix and are quantified at $86,562,000 in the AGPC 2011 annual report (p47), where they are reported in the categories of “Events management and staging”, “recurrent engineering”, “administration” and “marketing, promotion and catering”. Several points should be noted the use of these costs in an economic analysis. Firstly, in an economy with well functioning labour, capital and product markets, these inputs should be valued at their opportunity cost – the value of goods and services foregone by putting the resources to this use. Media reports and public discussion sometimes present operating and capital costs as a benefit to downstream businesses. However, from a Victorian perspective, this is not correct. This expenditure would have occurred on other services in Victoria, such as health and education, had the government not decided to spend it on the grand prix. These costs, therefore, represent an economic cost of the event. Secondly, the operating costs as presented in the financial reports include an amount of capital depreciation. While this is appropriate for financial analysis, allowing enterprises to account for the cost of capital expenditure over time, economic analysis ignores the sunk cost of earlier capital expenditure and considers only the actual decline in value and costs of wear and tear related to the event under analysis. Depreciation expenses to grand prix infrastructure and furniture and equipment have therefore been deducted from costs, leaving economic costs of operations of $85,132,000 (see AGPC 2011 annual report page 48). This is consistent with the approach taken by VAGO (2007). Table 1: Operating costs of Melbourne GP
Event Management and Staging 43,802,000 Recurrent Engineering 26,841,000
Administration 4,794,000 Marketing/Promotion and Catering 11,125,000 Less depreciation on infrastructure 1,174,000
Less depreciation on furniture and equipment 256,000 Total economic operating costs 85,132,000
OTHER GOVERNMENT COSTS VAGO (2007) found that several public agencies reported significant net expenses in relation to the grand prix, in excess of receipts from AGPC, with a total of $496,544. The largest expense accrued to the City of Melbourne, with a net expense of $126,341, mainly relating to a public parade in the City of Melbourne, a one-‐off event in 2005. Emergency services such as the Metropolitan Fire Brigade, police, ambulance, etc also experienced substantial net expenses, as did the department of infrastructure. This study does not have the resources to contact these agencies and quantify any net expenses relating to the 2011 or other years’ events. Instead we have taken low, middle and high estimates for sensitivity analysis.

Blowout! A cost benefit analysis of the Australian Grand Prix. 10
Our low estimate is zero, which assumes that either these agencies no longer incur any expenses, or they are completely reimbursed by the AGPC. This seems unlikely as at least some organisations, such as St John Ambulance and the SES rely on volunteer labour. Even though it is not paid for by the agencies, volunteer labour has an opportunity cost to the volunteers and this should be recognised in economic analysis. Our mid estimate was derived by taking VAGO’s estimate of this cost for the 2005 grand prix, deducting the cost of the one off parade and converting this sum to 2011 dollars. Our high estimate is derived by from VAGO’s estimate of this cost for the 2005 grand prix, including parade, converted to 2011 dollars. Table 2: Estimated costs to other government agencies
Low estimate Mid estimate High estimate Other government and
agency costs 0 415,000 595,000
Blowout! A cost benefit analysis of the Australian Grand Prix. 11
COSTS TO VICTORIAN COMMUNITY
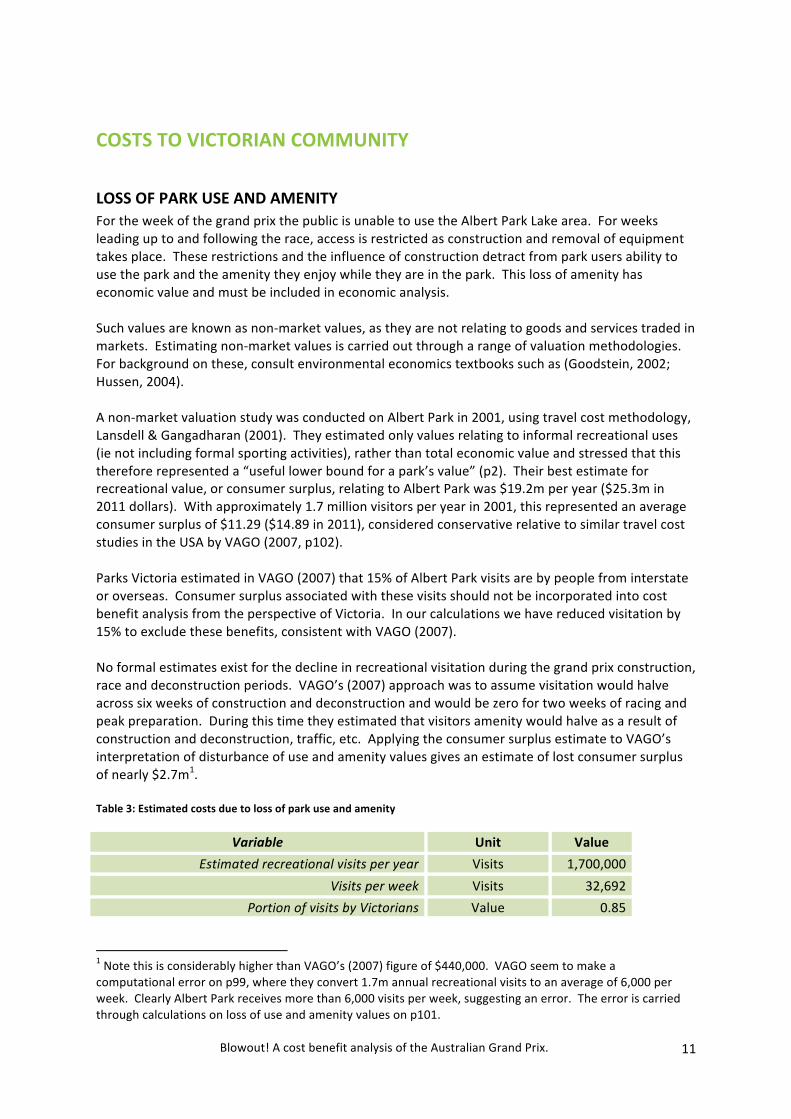
LOSS OF PARK USE AND AMENITY For the week of the grand prix the public is unable to use the Albert Park Lake area. For weeks leading up to and following the race, access is restricted as construction and removal of equipment takes place. These restrictions and the influence of construction detract from park users ability to use the park and the amenity they enjoy while they are in the park. This loss of amenity has economic value and must be included in economic analysis. Such values are known as non-‐market values, as they are not relating to goods and services traded in markets. Estimating non-‐market values is carried out through a range of valuation methodologies. For background on these, consult environmental economics textbooks such as (Goodstein, 2002; Hussen, 2004). A non-‐market valuation study was conducted on Albert Park in 2001, using travel cost methodology, Lansdell & Gangadharan (2001). They estimated only values relating to informal recreational uses (ie not including formal sporting activities), rather than total economic value and stressed that this therefore represented a “useful lower bound for a park’s value” (p2). Their best estimate for recreational value, or consumer surplus, relating to Albert Park was $19.2m per year ($25.3m in 2011 dollars). With approximately 1.7 million visitors per year in 2001, this represented an average consumer surplus of $11.29 ($14.89 in 2011), considered conservative relative to similar travel cost studies in the USA by VAGO (2007, p102). Parks Victoria estimated in VAGO (2007) that 15% of Albert Park visits are by people from interstate or overseas. Consumer surplus associated with these visits should not be incorporated into cost benefit analysis from the perspective of Victoria. In our calculations we have reduced visitation by 15% to exclude these benefits, consistent with VAGO (2007). No formal estimates exist for the decline in recreational visitation during the grand prix construction, race and deconstruction periods. VAGO’s (2007) approach was to assume visitation would halve across six weeks of construction and deconstruction and would be zero for two weeks of racing and peak preparation. During this time they estimated that visitors amenity would halve as a result of construction and deconstruction, traffic, etc. Applying the consumer surplus estimate to VAGO’s interpretation of disturbance of use and amenity values gives an estimate of lost consumer surplus of nearly $2.7m1. Table 3: Estimated costs due to loss of park use and amenity
Variable Unit Value Estimated recreational visits per year Visits 1,700,000
Visits per week Visits 32,692 Portion of visits by Victorians Value 0.85
1 Note this is considerably higher than VAGO’s (2007) figure of $440,000. VAGO seem to make a computational error on p99, where they convert 1.7m annual recreational visits to an average of 6,000 per week. Clearly Albert Park receives more than 6,000 visits per week, suggesting an error. The error is carried through calculations on loss of use and amenity values on p101.

Blowout! A cost benefit analysis of the Australian Grand Prix. 12
Average weekly visits by Victorians Visits 27,788 Consumer surplus per visit 2011 Dollars 14.89
Average consumer surplus from 8 week period 2011 Dollars 3,310,162 Period with no recreational visitation Weeks 2
Period with reduced recreational visitation Weeks 6 Reduced visitation period impact on visitation Value 0.5 Reduced visitation period impact on amenity Value 0.5
Consumer surplus for 8 week period of Grand Prix Dollars 620,655 Loss in consumer surplus due to Grand Prix Dollars 2,689,506
Great uncertainty surrounds many aspects of this estimate. In sensitivity analysis we have included values 50% lower and higher to account for uncertainty.
Table 4: Sensitivity analysis of estimate for loss of use and amenity values
Low estimate Mid estimate High estimate
Losses of park use and amenity 1,344,753 2,689,506 4,034,259
TRAFFIC CONGESTION AND DIVERSION COSTS VAGO (2007) note that there had been little quantification of the effects of traffic diversions associated with the grand prix. Since then, it seems no publicly available research has been undertaken and it is beyond the resources of this report to carry out analysis of traffic diversions. We have based our estimates on converting the findings of VAGO to 2011 dollars. VAGO assumed:
• Diversions of 15,000 vehicles per day during grand prix week, lesser diversions for four weeks earlier and one week following the race
• Each vehicle would take an extra 3 minutes • Travel time cost of $22 per hour ($0.37 per minute), based on 2005 Austroads Road User
Cost estimates which have not been updated since. • Vehicles can carry more than one person and can be used for business or leisure travel
VAGO’s estimate was $500,000, which in 2011 dollars is $598,000. Given the uncertainty surrounding this value we have included values 50% lower and higher in sensitivity analysis. Table 5: Costs of traffic diversion and road congestion
Low estimate Mid estimate High estimate
Traffic diversion and congestion costs 299,000 598,000 897,000

Blowout! A cost benefit analysis of the Australian Grand Prix. 13
NOISE COSTS The noise of the grand prix affects local residents and businesses, creating another non-‐market cost of the race. Economic effects of noise in urban areas are most commonly estimated through their impact on property prices. This valuation method is known as hedonic pricing and was used by VAGO in their 2007 study, where they assumed:
• 2,500 properties would be severely affected and 3,300 others would be moderately affected • Severely affected properties would have rental value decline of 20% for the 4 race days,
while moderately affected households would experience a 10% decline (potential increases in value for accommodation for race goers is considered under surpluses to accommodation providers).
• Average rental value of $500 per week VAGO calculated a cost to local residents relating to noise of $237,143. We do not have the resources to assess and update all the assumptions behind this estimate and its source studies on noise levels and impact on residents and patients in hospitals and aged care facilities. We assume these impacts remain unchanged. We have checked that:
• Median house and apartment values remain reasonably similar • $500 per week still seems a reasonable average rental value • No more recent noise assessments have been carried out than VAGOs source of Vipac
Engineers and Scientists, Albert Park Grand Prix Noise Study, prepared for City of Port Phillip, Melbourne, 1994. However, a study on the noise impacts of the grand prix on swan populations, Payne et al., (2012), suggests there environmental costs relating to noise that are not included in this estimate.
As VAGO’s 2007 estimate still seems valid, we have updated its findings to 2011 dollars and included estimates 50% higher and lower due to the uncertainty surrounding these values. Table 6: Noise and amenity costs
Low estimate Mid estimate High estimate
Noise and amenity costs 141,968 283,936 425,904

Blowout! A cost benefit analysis of the Australian Grand Prix. 14
BENEFITS OF THE GRAND PRIX
SALES AND SPONSORSHIP REVENUE The revenue that the AGPC generates represents a benefit to the Victorian government and taxpayers, and is reported in the 2011 annual report on p47: Table 7: Operating revenues
Item Sales revenue 26,462,000
Sponsorship/Commercial revenue 5,748,000 Other revenue 211,000
Total 32,421,000 Government contributions and interest received appear as income in the AGPC financial statements, but are an expense to the Victorian government, so are not included in cost benefit analysis.
VALUES RELATED TO ATTENDANCE Several values below relate to the number and origin of attendees of the grand prix. The calculation of attendance at the Australian grand prix is a controversial topic. There are no formal counts of attendance through turnstiles or ticket scanning, rather attendance is estimated by the AGPC using “a combination of ticket sales and assumptions based on their experience with the event and their impressions of actual attendances over the four days of the Grand Prix.” (Ernst and Young, 2011 p16). Given their incentive to maintain public subsidy, the AGPC are regularly accused of overstating attendance, most recently by Baum (2013). Ernst and Young (2011) in their assessment of the impact of the 2011 GP used the following figures in their analysis, based on AGPC data and a survey of attendees. Table 8: Breakdown of attendees
Spectator type Estimate Total individual spectators 109,234
Victorian 70,893 Interstate 26,762
International 11,579 Media, teams, staff, officials, etc 14,553
Save Albert Park conduct their own estimates of grand prix attendance, based on counting at entrances to the event. Their estimate for the 2011 event was less than half the AGPC’s publicised total. Our analysis is primarily based on the Ernst and Young figures, while sensitivity analysis of some values will be adjusted to reflect the uncertainty in attendance figures.

Blowout! A cost benefit analysis of the Australian Grand Prix. 15
CONSUMER SURPLUS TO VICTORIAN ATTENDEES Consumer surplus is the extra amount that Victorian spectators would have been willing to pay to attend the race, over and above what their tickets cost them. By paying less than they were willing to pay, these spectators have gained in welfare and this gain should be included in cost benefit analysis. Consumer surplus to non-‐Victorian spectators is not relevant from a Victorian perspective. Estimates of consumer surplus relating to major events is difficult, however, and few comparable empirical studies exist (Hone & Silvers, 2006). VAGO (2007) used an ACT Auditor General’s study as the basis of their estimate of 10.8% of ticket revenues to Victorians. Applying this estimate to the 2011 race, we see: Table 9: Estimate of Victorian consumer surplus
Item Estimate Total ticket sales revenue 26,462,000
Portion of revenue attributable to Victorians 64.9% Revenue attributable to Victorians 17,174,000
Estimate of average consumer surplus 10.8% Estimate of consumer surplus to Victorians 1,855,000
Given the uncertainty surrounding this figure, we have included sensitivity analysis of 50% above and below this figure: Table 10: Sensitivity analysis of Victorian consumer surplus
Low estimate Mid estimate High estimate
Consumer surplus 927,000 1,855,000 2,782,000
SURPLUSES RELATING TO ASSOCIATED EVENTS VAGO (2007) included a benefit to Victorians attending a free parade in the central business district. No such parade or side event seems to have taken place in 2011 or 2012. Associated expenditure was removed from cost estimates above and no benefit is assumed here.
SURPLUSES RELATING TO INCREASED VISITATION The increase in overseas and interstate visitor spending provides benefits to some Victorian businesses and workers. However, this expenditure is not a net benefit, as for their spending the visitors expect goods and services in return which require resources that are a cost to Victoria. The benefit is the difference between the expenditure gained from grand prix visitors and the cost that Victorian businesses incur in providing the goods and services. Cost benefit analysis generally assumes that capital and labour are priced at their opportunity cost, and that they are fully employed – see Department of Finance and Administration (2006). This means that there would be no benefit from extra grand prix visitation, as all businesses and labour would have been fully employed in other activities even in the absence of the race. However VAGO (2007) considered that the short term nature of the event would allow businesses to employ underutilised or unemployed resources for the grand prix period. As these resources would
Blowout! A cost benefit analysis of the Australian Grand Prix. 16
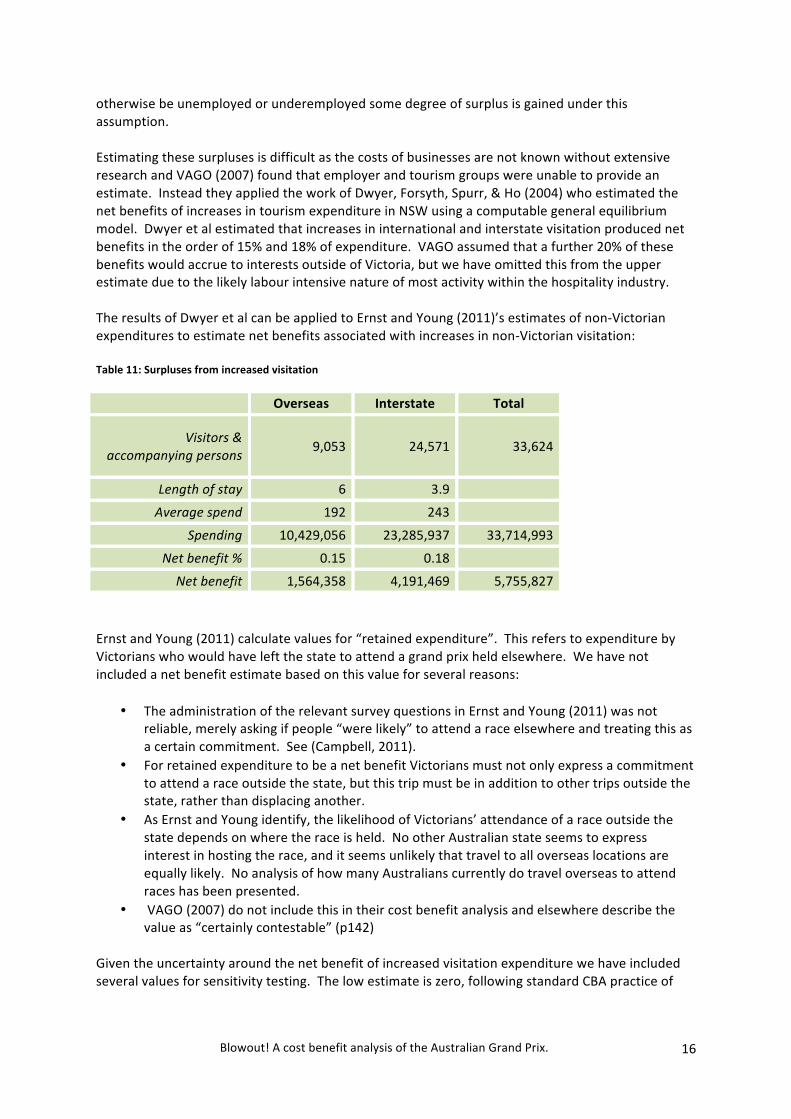
otherwise be unemployed or underemployed some degree of surplus is gained under this assumption. Estimating these surpluses is difficult as the costs of businesses are not known without extensive research and VAGO (2007) found that employer and tourism groups were unable to provide an estimate. Instead they applied the work of Dwyer, Forsyth, Spurr, & Ho (2004) who estimated the net benefits of increases in tourism expenditure in NSW using a computable general equilibrium model. Dwyer et al estimated that increases in international and interstate visitation produced net benefits in the order of 15% and 18% of expenditure. VAGO assumed that a further 20% of these benefits would accrue to interests outside of Victoria, but we have omitted this from the upper estimate due to the likely labour intensive nature of most activity within the hospitality industry. The results of Dwyer et al can be applied to Ernst and Young (2011)’s estimates of non-‐Victorian expenditures to estimate net benefits associated with increases in non-‐Victorian visitation: Table 11: Surpluses from increased visitation
Overseas Interstate Total
Visitors & accompanying persons 9,053 24,571 33,624
Length of stay 6 3.9 Average spend 192 243
Spending 10,429,056 23,285,937 33,714,993
Net benefit % 0.15 0.18 Net benefit 1,564,358 4,191,469 5,755,827
Ernst and Young (2011) calculate values for “retained expenditure”. This refers to expenditure by Victorians who would have left the state to attend a grand prix held elsewhere. We have not included a net benefit estimate based on this value for several reasons:
• The administration of the relevant survey questions in Ernst and Young (2011) was not reliable, merely asking if people “were likely” to attend a race elsewhere and treating this as a certain commitment. See (Campbell, 2011).
• For retained expenditure to be a net benefit Victorians must not only express a commitment to attend a race outside the state, but this trip must be in addition to other trips outside the state, rather than displacing another.
• As Ernst and Young identify, the likelihood of Victorians’ attendance of a race outside the state depends on where the race is held. No other Australian state seems to express interest in hosting the race, and it seems unlikely that travel to all overseas locations are equally likely. No analysis of how many Australians currently do travel overseas to attend races has been presented.
• VAGO (2007) do not include this in their cost benefit analysis and elsewhere describe the value as “certainly contestable” (p142)
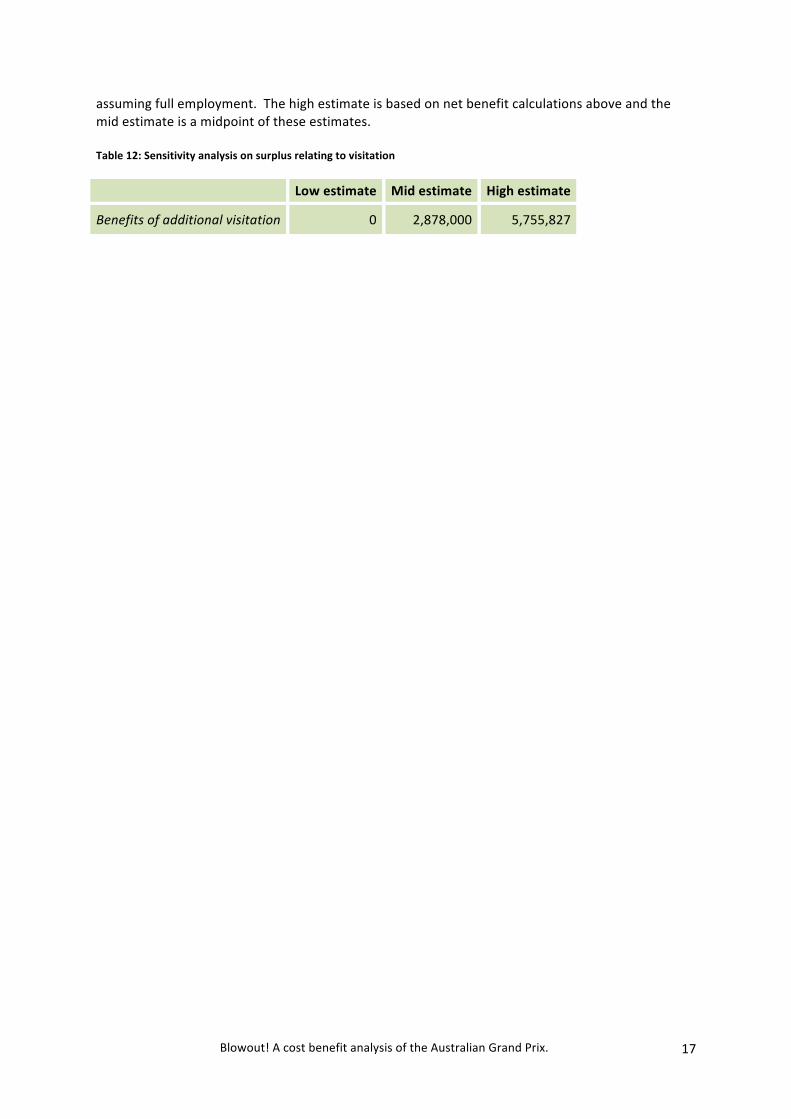
Given the uncertainty around the net benefit of increased visitation expenditure we have included several values for sensitivity testing. The low estimate is zero, following standard CBA practice of
Blowout! A cost benefit analysis of the Australian Grand Prix. 17
assuming full employment. The high estimate is based on net benefit calculations above and the mid estimate is a midpoint of these estimates. Table 12: Sensitivity analysis on surplus relating to visitation
Low estimate Mid estimate High estimate
Benefits of additional visitation 0 2,878,000 5,755,827

Blowout! A cost benefit analysis of the Australian Grand Prix. 18
BENEFITS OF MEDIA EXPOSURE Supporters of the grand prix claim that the race serves to increase Melbourne’s or Victoria’s exposure to world audiences and that this has economic value. See for example (Tourism Victoria, 2011): [the race] is associated with longer-‐term benefits such as induced tourism, …. It can be particularly beneficial in markets that are growing in importance for Victoria in trade and tourism, such as China and India.
Economic literature does not support this claim. Abelson (2011) recommends a conservative approach towards induced tourism and the VAGO (2007) was sceptical about its inclusion in analysis of the GP. Giesecke & Madden (2007) have written the only empirical study that touches on induced tourism in Australia, relating to the Sydney Olympics:
For the three years immediately after the games, foreign willingness to pay for NSW tourism grew by an average 2.2 percentage points less than for Australia as a whole. Only by 2005/06 did the rate of growth in demand for NSW tourism match the Australian average. These results lend no support to the existence of an induced tourism effect.
Induced visitation would need to be in addition to any visit to see the grand prix, as this would be included in the benefits of increased visitation value above. As these benefits are in the future, for inclusion in cost benefit analysis, they would have to be discounted to present values, which is impossible without an estimate of when the induced visitation might occur. While the form, timing and value of such benefits seem dubious, it does seem reasonable that Victoria does derive some value from media exposure. Two studies have attempted to value this exposure, Comperio Research (2009)and Formulamoney (2011). Their estimates relate to “advertising equivalent” value, ie what it would cost to receive similarly wide coverage through paid advertising. See (Campbell, 2012) for further discussion of these estimates. For inclusion in cost benefit analysis, this advertising equivalent value would have to translate into the same amount of increased consumer and producer surplus for Victorians. This seems unlikely given the above discussion on induced tourism, but we have included the “net media value” from Comperio Research and the “Advertising Equivalent value” from Formulamoney for Melbourne. Note that Comperio’s estimate seems to refer to Australia, while Formulamoney’s estimate refers just to the “brand” of Melbourne. Table 13: Sensitivity analysis on value of media coverage
Low estimate Mid estimate High estimate
Benefits of media coverage 0 263,000 6,000,000
Blowout! A cost benefit analysis of the Australian Grand Prix. 19
OVERALL COST BENEFIT RESULTS FOR 2011 GRAND PRIX
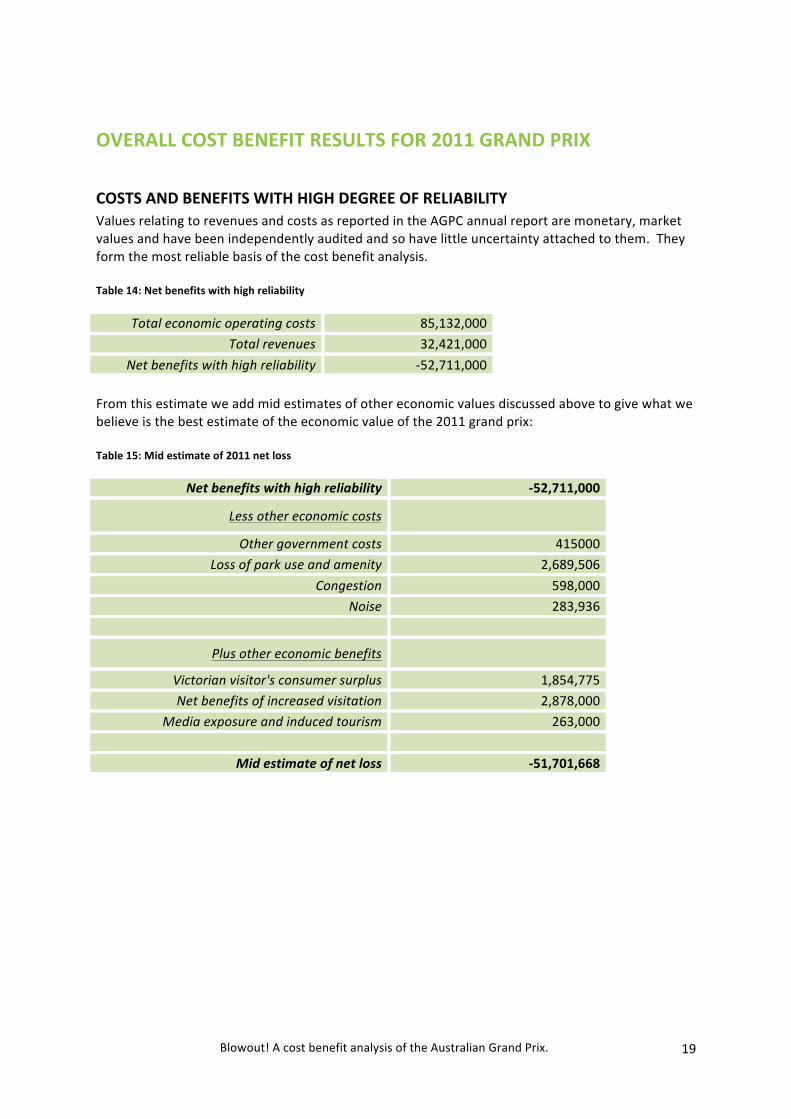
COSTS AND BENEFITS WITH HIGH DEGREE OF RELIABILITY Values relating to revenues and costs as reported in the AGPC annual report are monetary, market values and have been independently audited and so have little uncertainty attached to them. They form the most reliable basis of the cost benefit analysis. Table 14: Net benefits with high reliability
Total economic operating costs 85,132,000 Total revenues 32,421,000
Net benefits with high reliability -‐52,711,000 From this estimate we add mid estimates of other economic values discussed above to give what we believe is the best estimate of the economic value of the 2011 grand prix: Table 15: Mid estimate of 2011 net loss
Net benefits with high reliability -‐52,711,000
Less other economic costs
Other government costs 415000 Loss of park use and amenity 2,689,506
Congestion 598,000 Noise 283,936
Plus other economic benefits
Victorian visitor's consumer surplus 1,854,775 Net benefits of increased visitation 2,878,000
Media exposure and induced tourism 263,000
Mid estimate of net loss -‐51,701,668

Blowout! A cost benefit analysis of the Australian Grand Prix. 20
SENSITIVITY ANALYSIS Given the uncertainty around many economic values, we have calculated best case and worst case scenarios. Under the best case scenario the high estimates of other economic benefits have been included with the low estimates of other economic costs. Under the worst case scenario, vice versa, the low estimates of uncertain economic benefits are included with the high estimates of economic costs: Table 16: Best case scenario of 2011 net loss
Net benefits with high reliability -‐52,711,000
Less other economic costs
Other government costs 0 Loss of park use and amenity 1,344,753
Congestion 299,000 Noise 141,968
Plus other economic benefits
Victorian visitor's consumer surplus 2,782,162 Net benefits of increased visitation 5,755,827
Media exposure and induced tourism 6,000,000
Best case scenario estimate of net benefits -‐39,958,732 Table 17: Worst case scenario of 2011 net loss
Net benefits with high reliability -‐52,711,000
Less other economic costs
Other government costs 595000 Loss of park use and amenity 4,034,259
Congestion 897,000 Noise 425,904
Plus other economic benefits
Victorian visitor's consumer surplus 927,387 Net benefits of increased visitation 0
Media exposure and induced tourism 0
Worst case scenario estimate of net benefits -‐57,735,776
Blowout! A cost benefit analysis of the Australian Grand Prix. 21
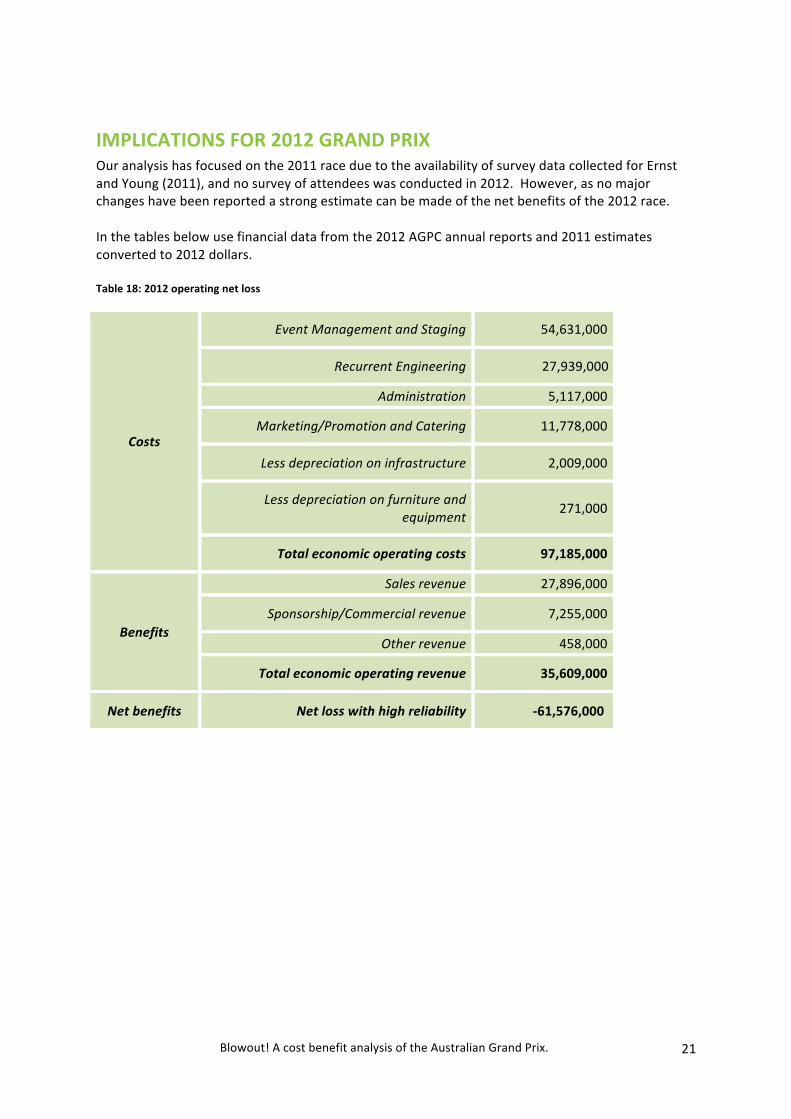
IMPLICATIONS FOR 2012 GRAND PRIX Our analysis has focused on the 2011 race due to the availability of survey data collected for Ernst and Young (2011), and no survey of attendees was conducted in 2012. However, as no major changes have been reported a strong estimate can be made of the net benefits of the 2012 race. In the tables below use financial data from the 2012 AGPC annual reports and 2011 estimates converted to 2012 dollars. Table 18: 2012 operating net loss
Costs
Event Management and Staging 54,631,000
Recurrent Engineering 27,939,000
Administration 5,117,000
Marketing/Promotion and Catering 11,778,000
Less depreciation on infrastructure 2,009,000
Less depreciation on furniture and equipment 271,000
Total economic operating costs 97,185,000
Benefits
Sales revenue 27,896,000
Sponsorship/Commercial revenue 7,255,000
Other revenue 458,000
Total economic operating revenue 35,609,000
Net benefits Net loss with high reliability -‐61,576,000
Blowout! A cost benefit analysis of the Australian Grand Prix. 22
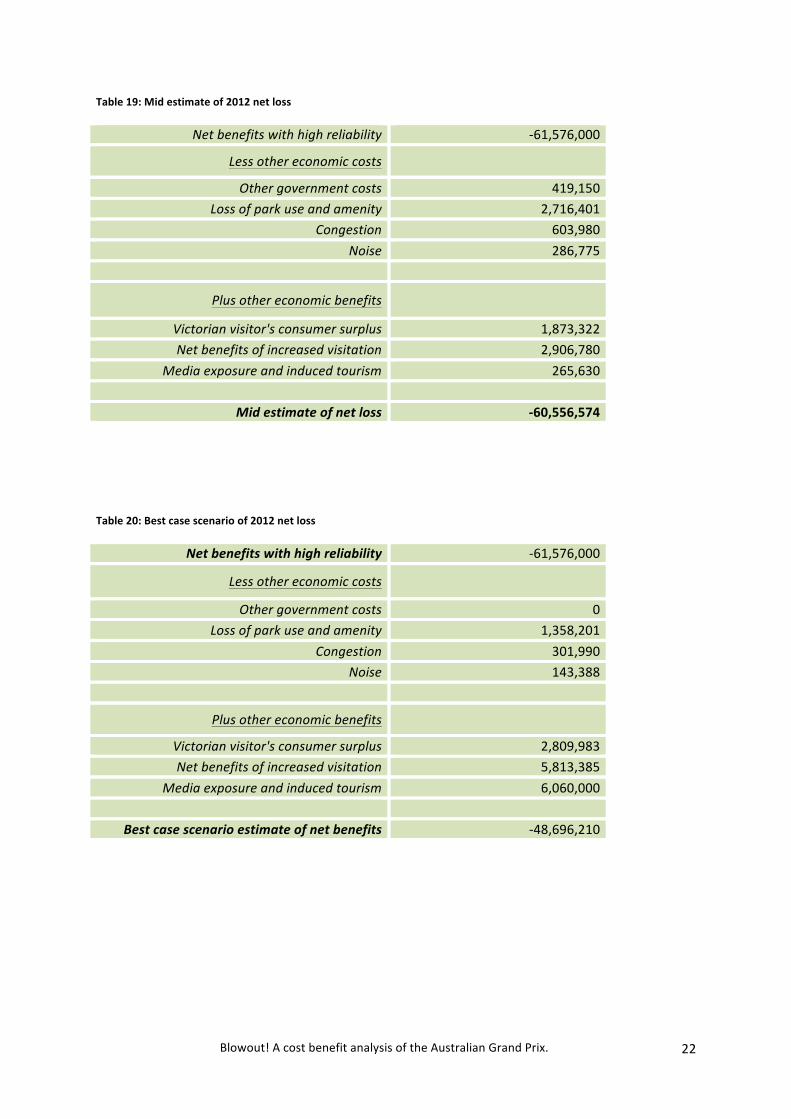
Table 19: Mid estimate of 2012 net loss
Net benefits with high reliability -‐61,576,000
Less other economic costs
Other government costs 419,150 Loss of park use and amenity 2,716,401
Congestion 603,980 Noise 286,775
Plus other economic benefits
Victorian visitor's consumer surplus 1,873,322 Net benefits of increased visitation 2,906,780
Media exposure and induced tourism 265,630
Mid estimate of net loss -‐60,556,574 Table 20: Best case scenario of 2012 net loss
Net benefits with high reliability -‐61,576,000
Less other economic costs
Other government costs 0 Loss of park use and amenity 1,358,201
Congestion 301,990 Noise 143,388
Plus other economic benefits
Victorian visitor's consumer surplus 2,809,983 Net benefits of increased visitation 5,813,385
Media exposure and induced tourism 6,060,000
Best case scenario estimate of net benefits -‐48,696,210

Blowout! A cost benefit analysis of the Australian Grand Prix. 23
Table 21: Worst case scenario of 2012 net loss
Net benefits with high reliability -‐61,576,000
Less other economic costs
Other government costs 600,950 Loss of park use and amenity 4,074,602
Congestion 905,970 Noise 430,163
Plus other economic benefits
Victorian visitor's consumer surplus 936,661 Net benefits of increased visitation 0
Media exposure and induced tourism 0
Worst case scenario estimate of net benefits -‐66,651,024
Blowout! A cost benefit analysis of the Australian Grand Prix. 24
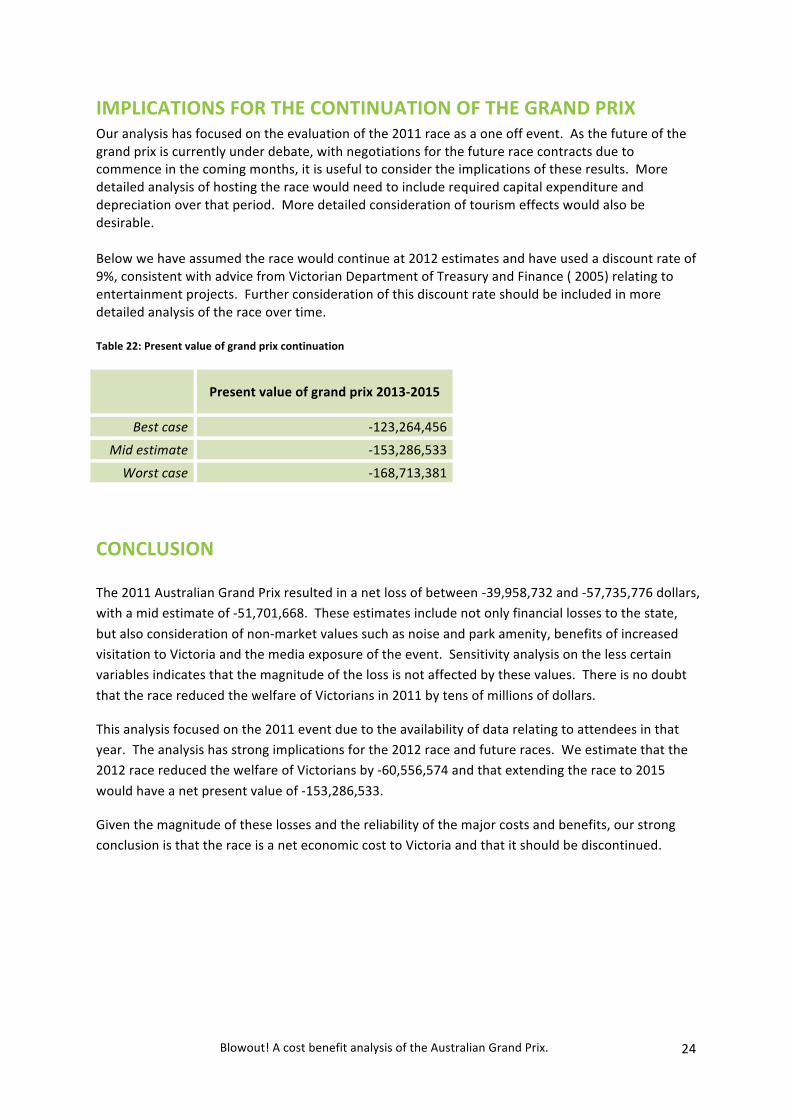
IMPLICATIONS FOR THE CONTINUATION OF THE GRAND PRIX Our analysis has focused on the evaluation of the 2011 race as a one off event. As the future of the grand prix is currently under debate, with negotiations for the future race contracts due to commence in the coming months, it is useful to consider the implications of these results. More detailed analysis of hosting the race would need to include required capital expenditure and depreciation over that period. More detailed consideration of tourism effects would also be desirable. Below we have assumed the race would continue at 2012 estimates and have used a discount rate of 9%, consistent with advice from Victorian Department of Treasury and Finance ( 2005) relating to entertainment projects. Further consideration of this discount rate should be included in more detailed analysis of the race over time. Table 22: Present value of grand prix continuation
Present value of grand prix 2013-‐2015
Best case -‐123,264,456
Mid estimate -‐153,286,533
Worst case -‐168,713,381
CONCLUSION The 2011 Australian Grand Prix resulted in a net loss of between -‐39,958,732 and -‐57,735,776 dollars, with a mid estimate of -‐51,701,668. These estimates include not only financial losses to the state, but also consideration of non-‐market values such as noise and park amenity, benefits of increased visitation to Victoria and the media exposure of the event. Sensitivity analysis on the less certain variables indicates that the magnitude of the loss is not affected by these values. There is no doubt that the race reduced the welfare of Victorians in 2011 by tens of millions of dollars.
This analysis focused on the 2011 event due to the availability of data relating to attendees in that year. The analysis has strong implications for the 2012 race and future races. We estimate that the 2012 race reduced the welfare of Victorians by -‐60,556,574 and that extending the race to 2015 would have a net present value of -‐153,286,533.
Given the magnitude of these losses and the reliability of the major costs and benefits, our strong conclusion is that the race is a net economic cost to Victoria and that it should be discontinued.

Blowout! A cost benefit analysis of the Australian Grand Prix. 25
REFERENCES
Abelson, P. (2011). Evaluating Major Events and Avoiding the Mercantilist Fallacy. Economic Papers: Journal of the Economic Society of Australia, 30(1), 48–59. doi:10.1111/j.1759-‐3441.2011.00096.x
Baum, G. (2013, January 26). Grand prix counts for nothing. The Age. Melbourne. Retrieved from http://www.smh.com.au/sport/grand-‐prix-‐counts-‐for-‐nothing-‐20130125-‐2dc6f.html
Campbell, R. (2011). Review of Tourism Victoria’s report “Formula One Australian Grand Prix: Benefits to Victoria”. prepared by Economists at Large, Melbourne, Australia. Retrieved from http://www.ecolarge.com/news/review-‐grand-‐prix-‐economic-‐assessment/
Campbell, R. (2012). Comperio Research: Masters of Major Events Mathematics. Economists at Large blog. Retrieved January 28, 2013, from http://www.ecolarge.com/blog/comperio-‐research-‐masters-‐of-‐major-‐events-‐mathematics/
Comperio Research. (2009). Comparative Broadcast Analysis 2008-‐2009. Report for Tourism Victoria relating to the F1 Australian Grand Prix.
Department of Finance and Administration. (2006). Handbook of Cost-‐Benefit Analysis. Financial Management. Financial Management Reference Material No.6, Financial Mangement Group, Department of Finance and Administration, Commonwealth of Australia.
Dobes, L., & Bennett, J. (2009). Multi-‐Criteria Analysis: “Good Enough” for Government Work? Agenda, 16(3).
Dwyer, L., Forsyth, P., Spurr, R., & Ho, T. (2004). THE ECONOMIC IMPACTS AND BENEFITS OF TOURISM IN AUSTRALIA -‐ A general equilibrium approach. A report for the Sustainable Tourism Cooperative Research Centre. Retrieved from http://www.crctourism.com.au/wms/upload/images/disc of images and pdfs/for bookshop/documents/dwyer53004_ecoimpacts-‐cge.pdf
Ergas, H. (2009). In Defence of Cost-‐Benefit Analysis. Agenda, 16(3), 31–40.
Ernst and Young. (2011). The economic impact of the 2011 Formula 1 TM Australian Grand Prix. Methodology. Melbourne. Retrieved from http://www.tourism.vic.gov.au/images/stories/Documents/FactsandFigures/2011_gp_eco_impact_final_21_07_11.pdf
Formulamoney. (2011). 2011 Formula 1 Qantas Australian Grand Prix ROI Review. Retrieved from www.formulamoney.com
Giesecke, J., & Madden, J. (2007). The Sydney Olympics , Seven Years On : An Ex-‐Post Dynamic CGE Assessment. Assessment. Centre of Policy Studies, Monash University, General Paper No. G-‐168.
Goodstein, E. S. (2002). Economics and the Environment (3rd ed.). New York, USA: John Wiley & Sons.
Government of Victoria. (2011). Victorian Guide to Regulation. Department of Treasury and Finance, Melbourne. Retrieved from
Blowout! A cost benefit analysis of the Australian Grand Prix. 26
http://www.dtf.vic.gov.au/CA25713E0002EF43/WebObj/VictorianGuidetoRegulationJuly2011/$File/VictorianGuidetoRegulationJuly2011.pdf
Hone, P., & Silvers, R. (2006). Policy Forum : Economics of Sport Measuring the Contribution of Sport to the Economy. Australian Economic Review, 39(4).
Hussen, A. (2004). Principles of Environmental Economics (2nd ed.). New York, USA: Routledge.
Lansdell, N., & Gangadharan, L. (2001). Comparing travel cost models and the prcision of their consumer surplus estimates: Albert Park and Maroondah Reservoir. University of Melbourne, Department of Economics, Research Papers, 796. Retrieved from http://www.economics.unimelb.edu.au/downloads/wpapers-‐00-‐01/796.pdf
NSW Treasury. (2007). NSW Government Guidelines for Economic Appraisal. Office of Financial Management: Policy & Guidelines Paper.
Payne, C. J., Jessop, T. S., Guay, P.-‐J., Johnstone, M., Feore, M., & Mulder, R. a. (2012). Population, behavioural and physiological responses of an urban population of black swans to an intense annual noise event. PloS one, 7(9), e45014. doi:10.1371/journal.pone.0045014
Qld DIP. (2011). Project Assurance Framework: Cost Benefit Analysis. Analysis. Queensland Department of Infrastructure and Planning. Retrieved from http://www.treasury.qld.gov.au/office/knowledge/docs/project-‐assurance-‐framework-‐guidelines/paf-‐cost-‐benefit-‐analysis.pdf
Tourism Victoria. (2011). FORMULA ONE AUSTRALIAN GRAND PRIX : BENEFITS TO VICTORIA. Comparative and General Pharmacology. Published by Tourism Victoria, Melbourne, Australia. Retrieved from http://www.tourism.vic.gov.au/index.php?option=com_content&task=view&id=269&Itemid=2352
Victorian Auditor-‐General. (2007). State Investment in Major Events -‐ Commissioned studies: 2005 Australian Formula 1 Grand Prix. Evaluation.
Victorian Department of Treasury and Finance. (2005). Discount rate advice. Retrieved from http://www.partnerships.vic.gov.au./CA25708500035EB6/WebObj/CurrentratesasatJanuary2005/$File/Current rates as at January 2005.pdf