Blood pressure in teenagers in some EU countries and in USA - comparative study
18
Blood pressure in teenagers in some EU countries and in USA - comparative study Regecová V 1 ., Kellerová E 1 ., Baráková A 2 ., Šimurka P 3 ., Čižmárová E 4 ., Jurko A 5 ., Ondrisková E 6 1 Institute of Normal and Pathological Physiology, Slovak Academy of Sciences Bratislava, 2 National Health Information Center Bratislava, 3 Hospital with Policlinic Trenčín, 4 Cardiology clinic for children and youth, Bratislava, 5 Jessenius Faculty of Medicine, Comenius University, Martin, 6 Pediatric cardiology clinic Myjava
-
Upload
valeria-regecova -
Category
Health & Medicine
-
view
57 -
download
1
Transcript of Blood pressure in teenagers in some EU countries and in USA - comparative study
Blood pressure in teenagers in some EU countries and in USA - comparative study
Regecová V1., Kellerová E1., Baráková A2., Šimurka P3., Čižmárová E4.,Jurko A5., Ondrisková E6
1Institute of Normal and Pathological Physiology, Slovak Academy of SciencesBratislava, 2National Health Information Center Bratislava, 3Hospital with PoliclinicTrenčín, 4Cardiology clinic for children and youth, Bratislava, 5Jessenius Faculty of Medicine, Comenius University, Martin, 6Pediatric cardiology clinic Myjava

Aim
The aim of the study was to compare the age and growth related blood pressure values (BP) in children and adolescents of Slovakia with BP of their peers living in similar (V 4) or rather different geographic and social conditions

‐
Methods
The study includes published representative data on BP and somatometric parameters in children and adolescents in the age range 11 – 18 years (y.) , collected during the last 10 y. in four neighbouringcountries of the Central Europe ‐ (Slovakia (SK), Czech Republic (CZ), Poland (PL), Hungary (HU), in some more distant Italy (IT), and data pooled in NHBEP (USA).
All of the surveys were declared as “National reference BP data”. In most of them including the Slovak, BP was measured sphygmomanometrically, in HU and PL validated oscillometric automatic devices were used.

Data sourcesRosner B, Prineas RJ, Loggie JMH, Daniels SR. Blood pressure nomograms for children and adolescents by height, sex, and age, in the United States. J Pediatr1993; 123: 871‐886.
Menghetti E, Virdis R, Strambi M, Patriarca V, Riccioni MA, Fossali E, Spagnolo A. Blood pressure in childhood and adolescence: the Italian normal standards. Study Group on Hypertension of the Italian Society of Pediatrics. J Hypertens1999;17:1363–1372.
Velemínský M, Janda J, Adámková V, et al. Normal values of Blood pressure in children and adolescents in Czech republic. Praha: Triton; 2003:187.
Park, MK, Menard SW, Schoolfield J. Oscillometric Blood Pressure Standards for Children. Pediatric Cardiology 2005 ; 26, No. 5:601‐607.
Túri S, Baráth A, Boda K, Tichy M, Károly E. Blood pressure reference tables forHungarian adolescents aged 11–16 years. Kidney Blood Press Res 2008; 31: 63–9.
Krzyzaniak A, Krzywińska‐Wiewiorowska M, Stawińska‐Witoszyńska B, Kaczmarek M, Krzych L, Kowalska M, Szilágyi‐Pagowska I, Palczewska I, Karch A, Jośko J, Ostrowska‐Nawarycz L, Nawarycz T. Blood pressure references for Polish children and adolescents. Eur J Pediatr. 2009 Nov;168(11):1335‐42.
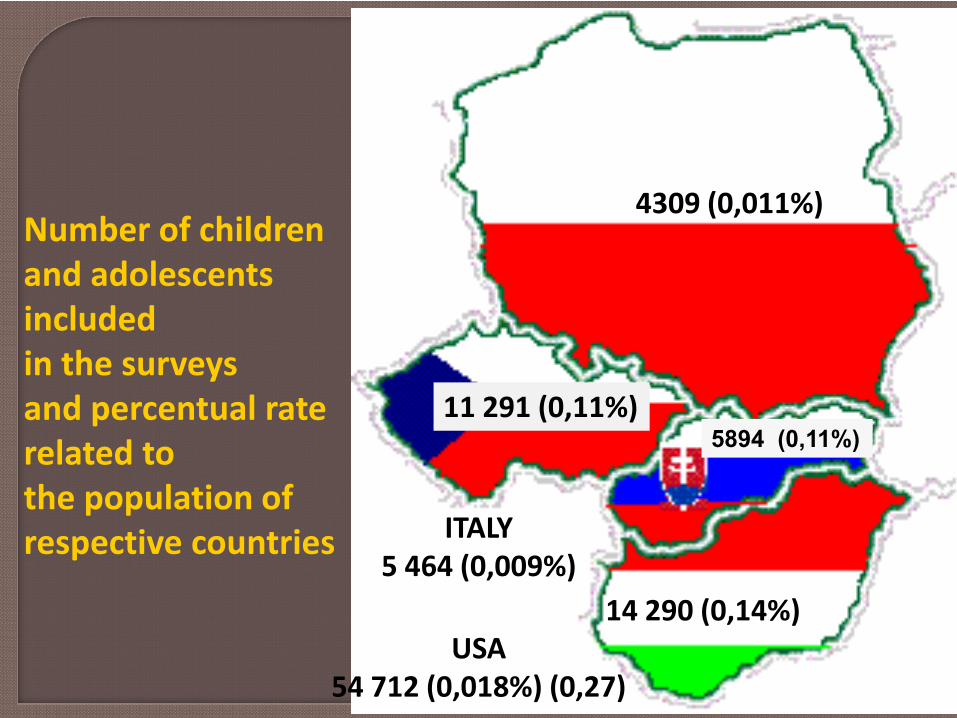
ITALY5 464 (0,009%)
14 290 (0,14%)
5894 (0,11%)11 291 (0,11%)
4309 (0,011%)
USA54 712 (0,018%) (0,27)
Number of childrenand adolescentsincludedin the surveysand percentual rate related to the population ofrespective countries

Anthropometry‐ Body height, weight, body mass index (BMI), ‐ Overweight and obesity calssified according CZ standards from 1990 (Vígnerová et al., 2004).Blood pressure‐With the exception of HU and PL study, where validated oscillometric automatic devices were used, BP was measured by mercury sphygmomanometry, in line with the ESH recommendations.
Methods
The Slovak survey included 2933 boys (B) and 2961 girls (G), aged 11 – 19 y., from all regions of SR.BP and anthropometric measurments were performedduring the decade of 2000‐10.

Methods
Statistical evaluation
Descriptive statistics was used for computation of mean values and variances of all investigated parameters. In BP also percentil distributions were determined.
Significance of the differences in BP among peers of different countries was determined by unpaired T tests.
Incidence of increased BP values higher than optimalBP values according ESH (2009) were estimated by z‐score and Chí – square tests.

Mean body height in SR, Europe and USA
145
155
165
175
185
11 12 13 14 15 16 17 18
cm Boys
SR USA (< 1990)CZ PL (2009)HU (2008) IT (1999)Sloupec1 USA (2005)
Apart from CZ girls , SR adolescents were the highest since the age of 13 y.
145
155
165
175
11 12 13 14 15 16 17 18
cm Girls
SR USA (< 1990)CZ PL (2009)HU (2008) IT (1999)Sloupec1 USA (2005)

Mean body weight in SR, Europe and USA
40
45
50
55
60
65
70
75
11 12 13 14 15 16 17 18
cm Boys
SR USA (< 1990)CZ PL (2009)HU (2008) IT (1999)Sloupec1 USA (2005)
The highest values of body weight in boys were found in SR and HU
In girls in CZ.
35
40
45
50
55
60
65
11 12 13 14 15 16 17 18
cm Girls
SR USA (do r 1990)CZ PL (2009)HU (2008) IT (1999)Sloupec1 USA (2005)

Mean systolic BP in SR, Europe and USA
104
109
114
119
124
11 12 13 14 15 16 17 18
mm Hg BPs Boys
SR USA (< 1990)CZ PL (2009)HU (2008) IT (1999)Sloupec1 USA (2005)
The lowest mean values of BPs were found in past USA data
BPs in SR boys was consistently higher (p<0,001) as compared with HU, PL ,IT, in girls up to age of 15 y.
104
109
114
119
124
11 12 13 14 15 16 17 18
mm Hg BPs Girls
SR USA (do r 1990)CZ PL (2009)HU (2008) IT (1999)Sloupec1 USA (2005)

‐3
‐1
1
3
5
7
9
11 12 13 14 15 16 17 18SR CZ PL (2009) HU (2008)IT (1999) USA (< 1990) USA (2005)
Mean differences in systolic BP between boys and girls
BP in boys is in most countries consistently significantlyhigher since the age of 14 y.

Mean age increments of systolic BP
4,4
3,4
4,6 6,24,9
3,6
3,0
102
108
114
120
mm Hg GirlsΔ 14 ‐ 17 y.Δ 11 ‐ 14 y.11 y.
Increase of BPs in SR, PL and HU was steeper at the age of 11‐14 y. thanin later age period, when by contrast the rate of BP rise was higher in CZ, IT and USA (<1990).
In girls ‐ SR, PL and recent USA no change of BPs was found after the ageof 13 ‐14 y.
8 5,5
8,1 8,36,7
6,7
7,0
102
108
114
120
mm Hg BoysΔ 14 ‐ 17 y.Δ 11 ‐ 14 y.11 y.

9101112131415161718
110 113 116 119 122
years
mm Hg
Boys
SR CZ PL (2009)HU (2008) IT (1999) Sloupec1USA (<1990) USA (2005)
During maturation in SR the same mean BPs values were reachedby 1‐3 y. sooner in comparisson with the rest of Eu.

101112131415161718
112 115 118 121
years
mm Hg
Girls
SR CZ PL (2009)HU (2008) IT (1999) Sloupec1USA (do r 1990) USA (2005)
As with boys also in SR girls the “adult“ BPs values were reached at lowerage (13 y.).
With exception of CZ girls in no other Eu country mean BPs values > 115 mm Hg were found.

Rate of systolic BP≤120 mm Hg
30
40
50
60
70
80
90
100
11 12 13 14 15 16 17 18
% Boys
SR USA (do r 1990)CZ PL (2009)HU (2008) IT (1999)USA (2005)
With increasing age values frequency of optimal BPs dropped to 60% in HU and USA, but in PL, IT, CZ and SR, even below 50% .
In girls with exception of CZ, this decline stopped at the level of 70% at theage of 12 y. (SR), or 13‐14 y. (HU, PL, IT).
30
40
50
60
70
80
90
100
11 12 13 14 15 16 17 18
% Girls
SR USA (< 1990)CZ PL (2009)HU (2008) IT (1999)USA (2005)

Age related changes of BP in normal and owerweight teenagers (SR)
106
112
118
124
130
11 12 13 14 15 16 17 18
mm Hg BPs
Norm Boys Girls Overweight BO G Polyg. (O G)
Mean values of BPs in overweight were higher by 7‐ 10 mm Hg, BPd by 3 – 6 mm Hg.
65
70
75
80
11 12 13 14 15 16 17 18
mm Hg BPd
Norm Boys Girls Overweight B O G

Conclusions
The level and trend of the age related BP development during juvenescence is in EU countries rather variable.
The average BP values in both Slovak and Czech teenagers were the highest in Central Europe, the lowest published in Eu were in Italy.
The BP development is characterized by a steeper increase at the beginning of puberty.
Despite of notable variability in the body height‐for‐age among the peers of the different countries, the BP characteristics cannot be attributed only to this somatic parameter.

Than youfor your attention