Blast load and its analysis
53
Blast Load and Its Analysis Design of Blast Resistant Structures
-
Upload
soumyabrata-saha -
Category
Education
-
view
511 -
download
0
Transcript of Blast load and its analysis

Blast Load and Its AnalysisDesign of Blast Resistant Structures

Typical Examples of Blasts in several important
structures

Attack on World Trade Centre on 11/09/01
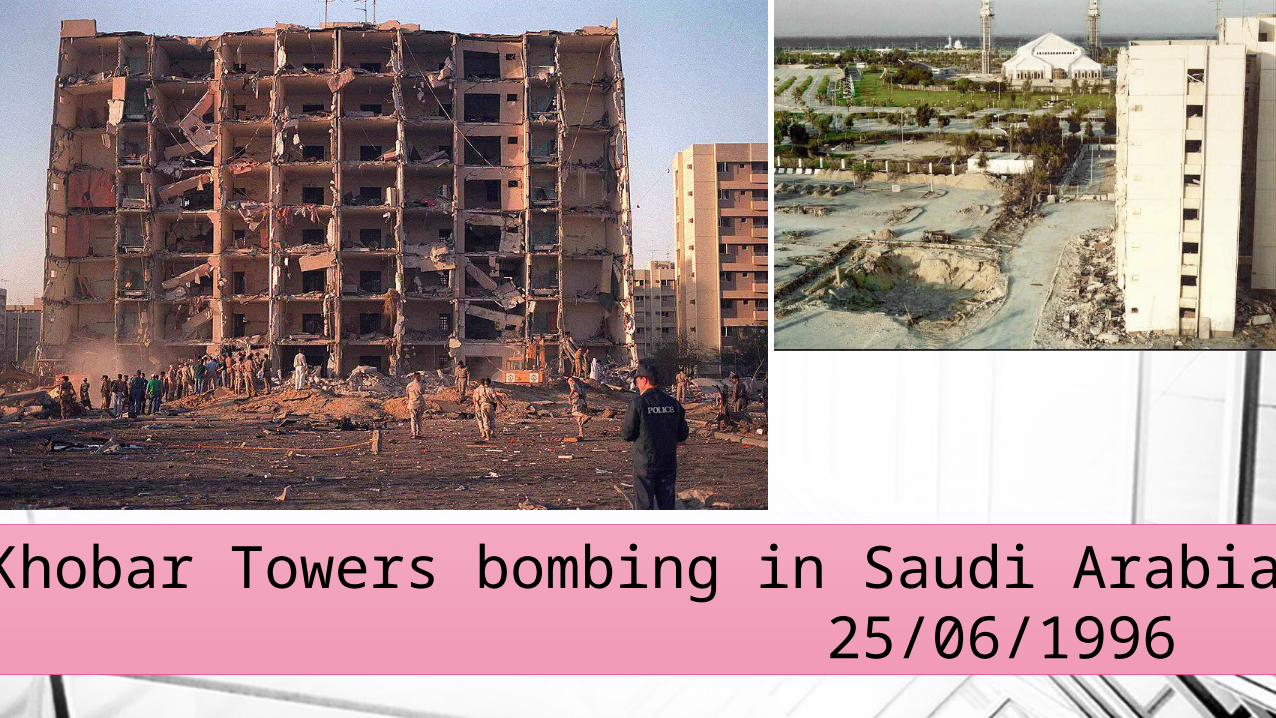
Khobar Towers bombing in Saudi Arabia 25/06/1996
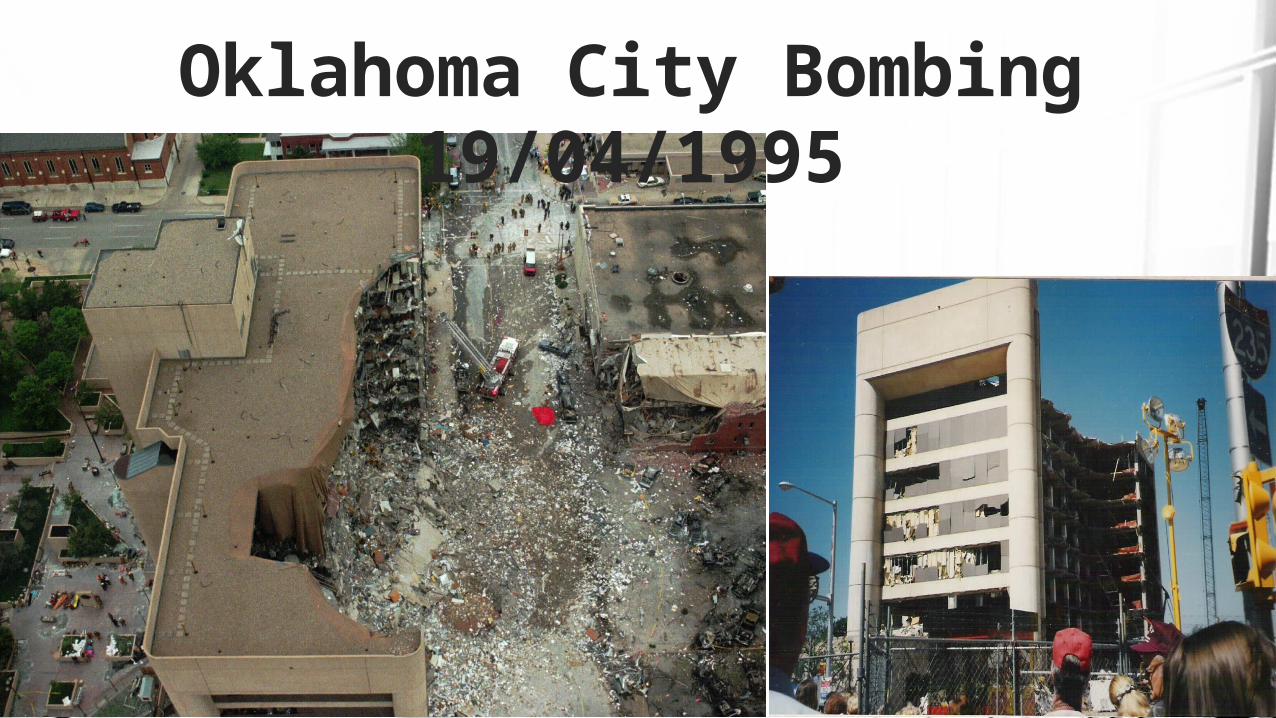
Oklahoma City Bombing 19/04/1995
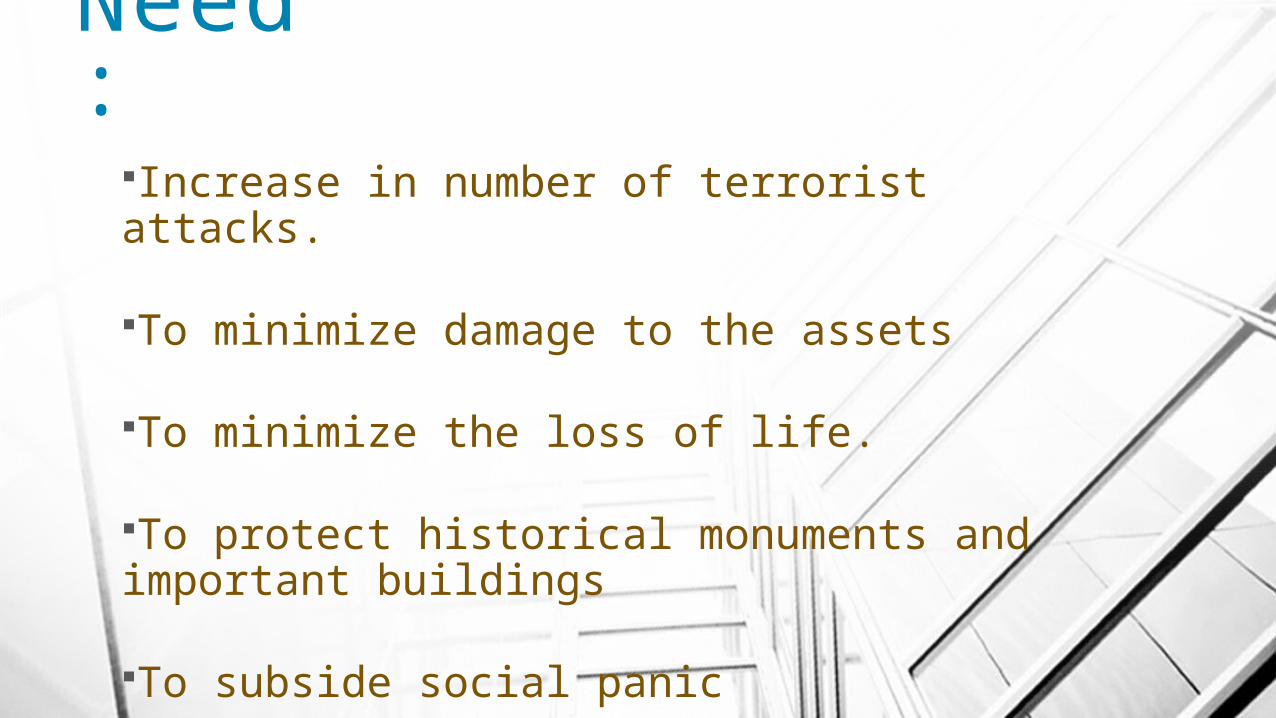
Need:
Increase in number of terrorist attacks.
To minimize damage to the assets
To minimize the loss of life.
To protect historical monuments and important buildings
To subside social panic
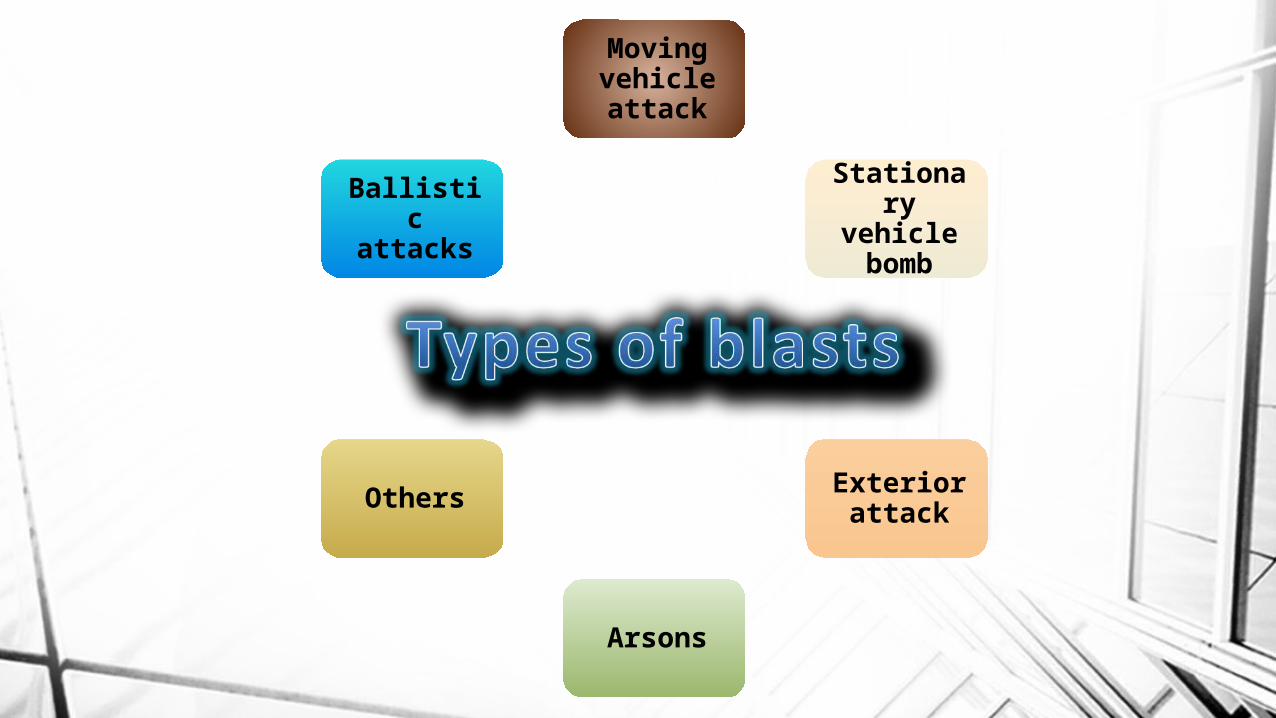
Moving vehicle attack
Stationary vehicle
bomb
Exterior attack
Arsons
Others
Ballistic attacks
What is blast ?The detonation of a condensed high explosive generates hot gases under pressure upto 300 kilobar and a temperature about 3000-4000°C. The resulted compressed air expands outward from the centre of the blast and causes formation of wave in a wind medium having a velocity greater than sound. So this blast wave causes air pressure to rise and which is known as side on overpressure. As the blast wave or shock wave traverses path the overpressure gradually decreases. Now a vaccum pressure zone gets generated behind the shock wave.
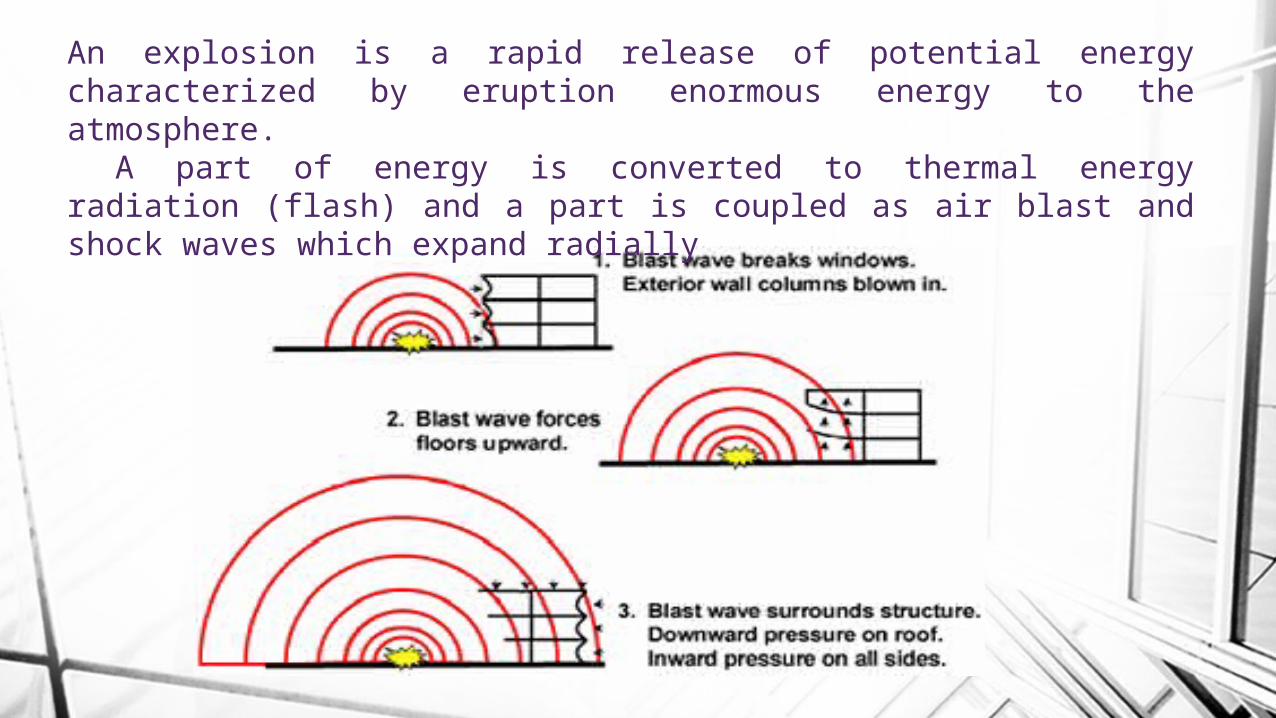
An explosion is a rapid release of potential energy characterized by eruption enormous energy to the atmosphere.
A part of energy is converted to thermal energy radiation (flash) and a part is coupled as air blast and shock waves which expand radially
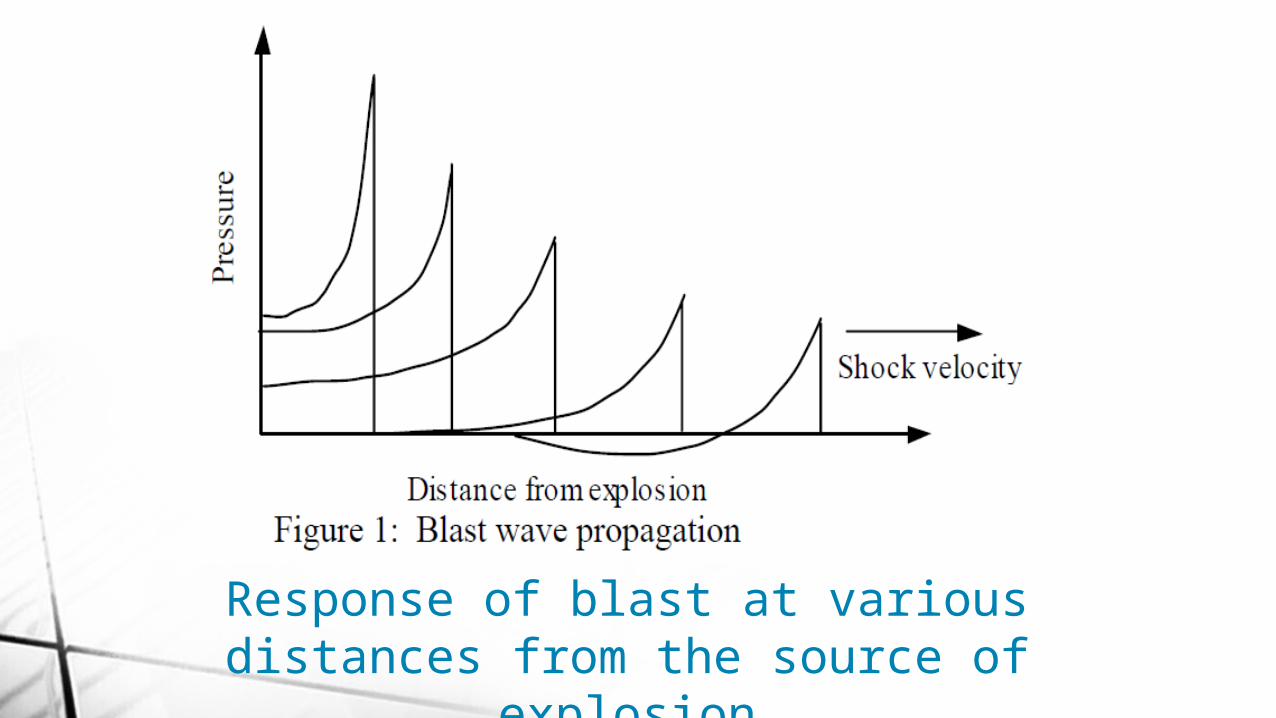
Response of blast at various distances from the source of explosion
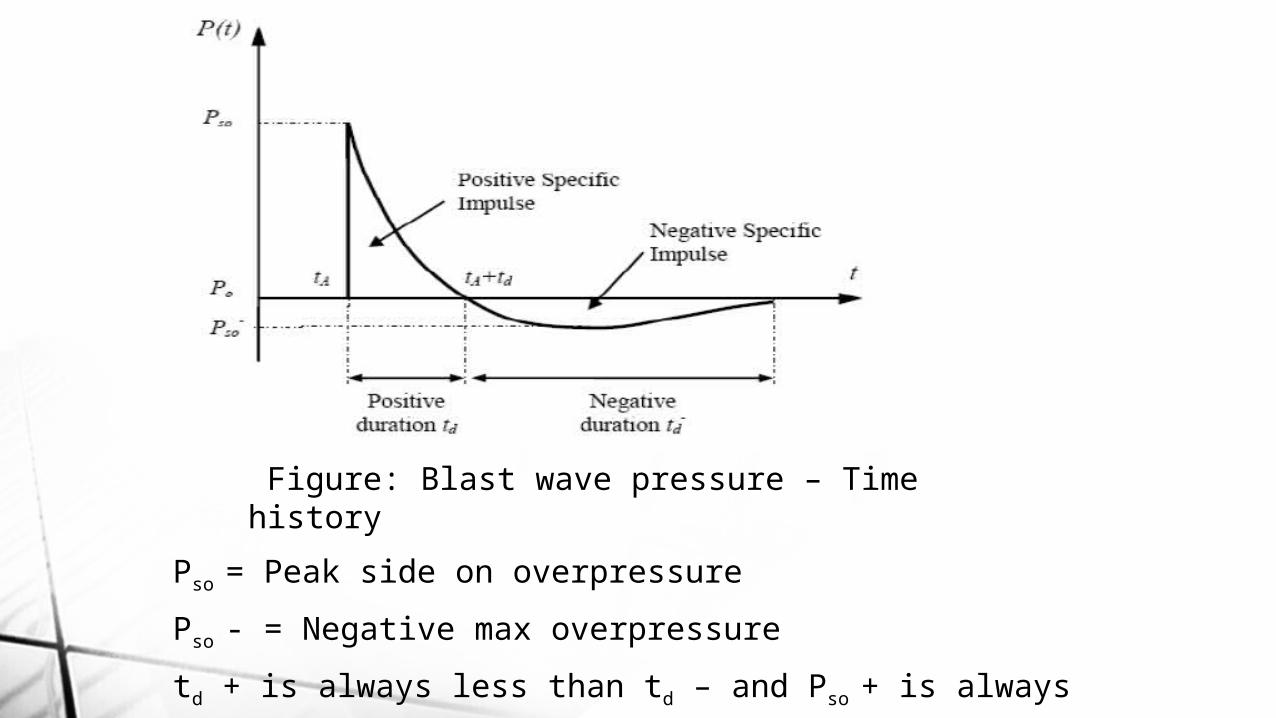
Figure: Blast wave pressure – Time history
Pso = Peak side on overpressurePso - = Negative max overpressuretd + is always less than td – and Pso + is always greater than Pso -
Design ConsiderationAs the impulse of the negative zone is less than the impulse of the positive zone, the negative face is usually not taken into account for the design purpose.
1.Explosive charge weight 2.Stand off distance
Determining factors for blast parameter
This is the distance from the source of explosion at which the blast effect caused by standard charge weight is just equivalent to as caused by W charge at distance R .Scaled distance Z =
Scaled Distance
Empirical relationships :1.Brode
(1955) :
2. Newmark and Hansen (1961) :
3. Mills (1987) :
Dynamic pressure:
The air behind the front of the blast wave moves along the same direction as wind but with smaller velocity. These winds result in loading of duration more than positive phase. So the pressure caused by these winds is called dynamic pressure. q(t) =qo * f(t)
The maximum value of dynamic pressure = Fig: Positive phase duration of over pressure
(parentheses) and dynamic pressure for 1 KN burst
The positive phase duration for overpressure and dynamic pressure can be selected from fig
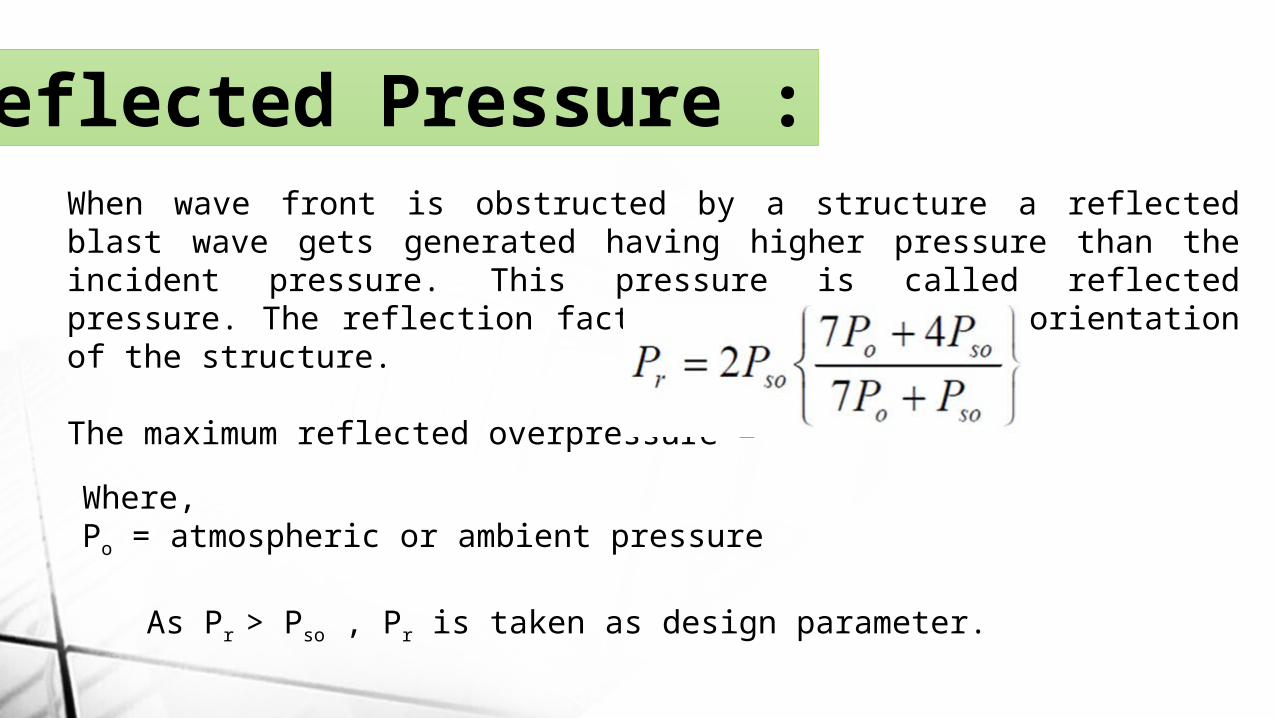
Reflected Pressure :When wave front is obstructed by a structure a reflected blast wave gets generated having higher pressure than the incident pressure. This pressure is called reflected pressure. The reflection factor depends upon the orientation of the structure.
The maximum reflected overpressure =
Where,Po = atmospheric or ambient pressure
As Pr > Pso , Pr is taken as design parameter.
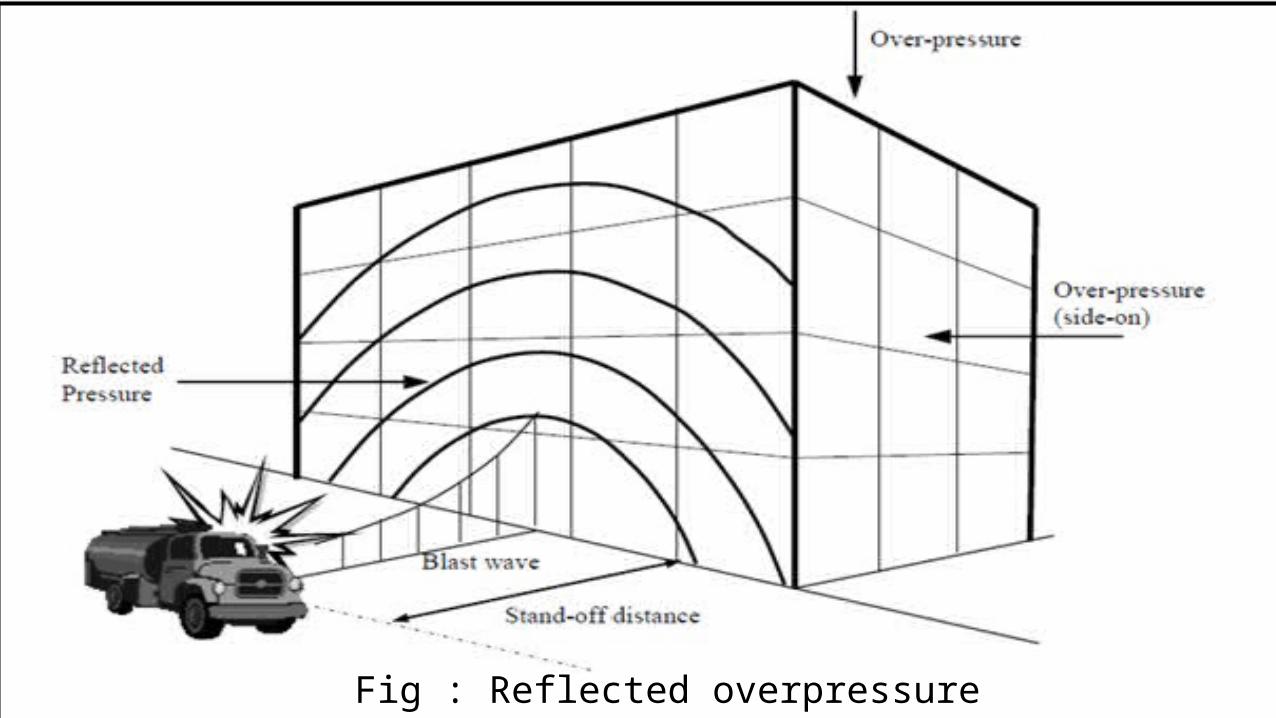
Fig : Reflected overpressure
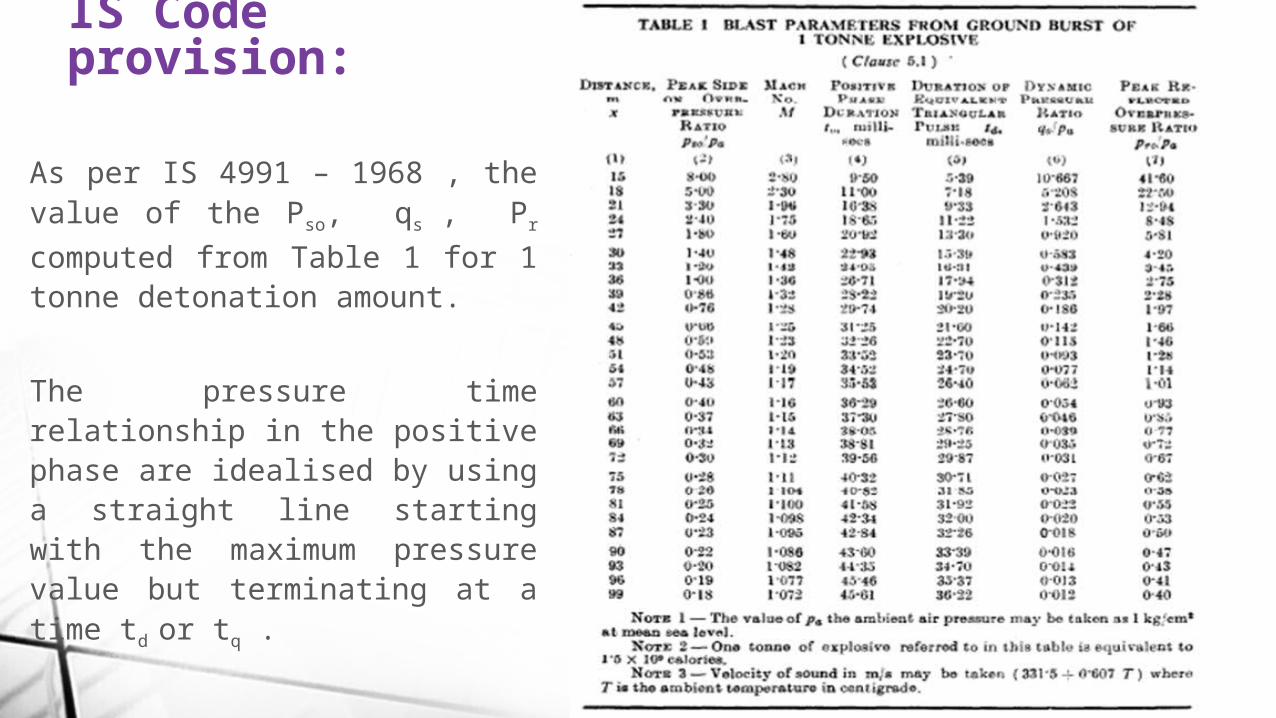
IS Code provision:
As per IS 4991 – 1968 , the value of the Pso, qs , Pr
computed from Table 1 for 1 tonne detonation amount.
The pressure time relationship in the positive phase are idealised by using a straight line starting with the maximum pressure value but terminating at a time td or tq .
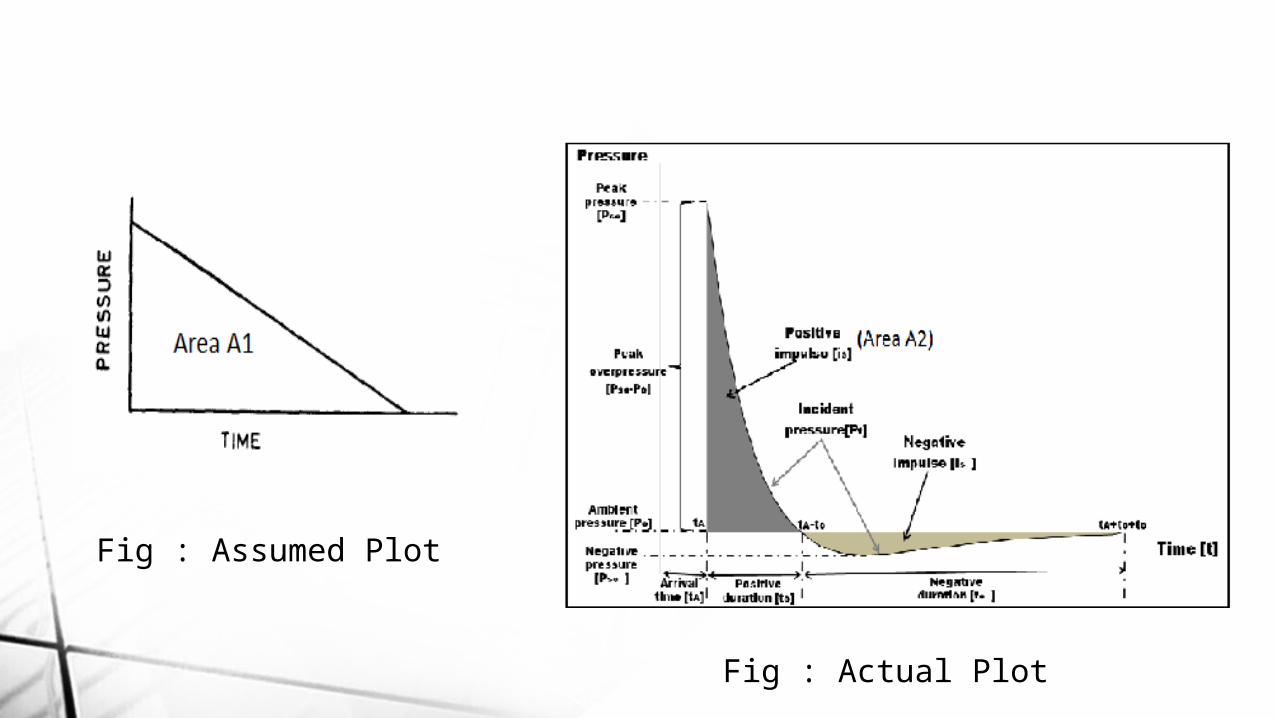
Fig : Assumed Plot
Fig : Actual Plot

Blast load on above ground structure:
Closed Rectangular StructureOpen or Drag type structures
There are two types of structures :
Closed Rectangular Structure
Front face—The net pressure acting on the front face at any time t is reflected overpressure Pr or (Ps + Cd * q) whichever is greater.
Terminology : Cd = drag coefficient given in Table – 2 of IS 4991 - 1968 Pr = reflected overpressure which drops from the peak value Pro to overpressure (Ps + Cd * q) in clearance time tc
tc = Where S = H or B/2 whichever is less U = Shock front velocity = M.a Where a= velocity of sound in air which may be taken as 344m/s at mean sea level at 20° C and M = Mach no. of the incident pulse given by The value of the M for various conditions are also tabulated in Table -1 of IS 4991 - 1968
The maximum reflected overpressure,The net average loading on the front face (B X H) as function of time is
shown in fig depending on whether tc is smaller than or equal to td. The pressure Pro, Pso and qo and time td are for actual explosion determined according to the Scaling laws.
The average loading on the rear face (B X H) is taken as shown in Fig.-7 where the time has been reckoned from the instant the shock first strikes the front face. The time interval are the following: = The travel time of shock from front to rear face = Pressure rise time on back face
Rear face:
Roof and side walls :
When tr > td ,the load on roof and side walls may be considered as moving triangular pulse having the peak value of overpressure Pro or (Ps0 + Cd * q0) and time td as shown in fig 7b.
When td > Transit time (tr) = ,the pressure diagram is given in fig.
Open or Drag Type StructureThe net translation pressure on the obstructing areas of element may be taken as shown in fig.
Where Cd= drag coefficient depending upon shape of the structure tq = ½ to

Blast Load
Problem on
Problem : Calculate the impulse of a blast load on a building for positive phase using the given parameters.Given Parameters
Detonation Amount 0.1tonne
Distance from ground Zero 30m
Height of Building 3m
Width of Building 10m
Length of Building 8m
Pa (ambient pressure) 1kg/cm2
a) Characteristics of the blast Scaled Distance 64.63304m
From table -1 Assume Pa=1 kg/cm2 P 0.35367kg/cm2 Pr 0.806452kg/cm2 Q 0.04219kg/cm2 t 37.70826mil sec t 28.32257mil sec Actual t 17.50262mil sec Actual t 13.14617mil sec M (Mach No.) 1.141554 Velocity of sound 344m/s Shock front velocity (U) 392.6946m/s 0.392695m/mil sec
b)Pressures on the building S (H or B/2 whichever is less) 3 m
Clearance time(t) 22.91858mil sec> td Transit time (t) 20.37207mil sec
Pressure rise time on back face (t) 30.5581mil sec
0 2 4 6 8 10 12 140
0.1
0.2
0.3
0.4
0.5
0.6
0.7
0.8
0.9
0.81
0
Average front face loading
Time (mili sec)
Peak
refl
ecte
d ov
erpr
essu
re
(Kg/
cm2)
Solution: From the graph-Total impulse of force = = (0.81+0) * 13.15 * 102 *(Area) = (0.81+0) * 13.15 * 102 *10*3 N-Sec = 15977 N-sec
Problem: A 25m high full water tank is subjected to a force as shown in the previous graph. Natural time period Tn = 1.12 sec.The force is caused by above ground explosion. Neglecting effect of damping, calculate base shear & moment at the base of tower supporting the tank. The mass of the water tank = 10000 kg.
Lateral deflection at any time, u = umax = = = 0.285 m
Base Shear = K*umax = mw2 *umax
= 10000 * (2∏/1.12)2 * 0.285
= 89604 N = 89.6 KNMaximum Bending Moment = Base Shear * Height = 89.6 * 25 = 2240 KN-m

Variation of Peak Reflected Overpressurewith Detonation Amount
Charge Weight (tonne)
Pr(kg/cm2)
t (mil sec)
t (mil sec)
0.2 1.266034 13.91818 21.72694
0.3 1.679215 14.40166 20.87335
0.4 2.102653 14.5682 20.13651
0.5 2.468371 14.83824 19.58105
1 4.2 15.39 17.63895
Stand off Distance = 30m
0 2 4 6 8 10 12 14 160
0.2
0.4
0.6
0.8
1
1.2
1.4
0
1.266034
Reflected overpressure Vs td
Equivalent Pulse time (mili sec)Refle
cted
ove
rpre
ssur
e (k
g/cm
2)
For Charge weight = 0.2 tonne
0 2 4 6 8 10 12 14 1600.20.40.60.8
11.21.41.61.8
0
1.679215
Reflected overpressure Vs td
For Charge weight = 0.3 tonne
Refle
cted
ove
rpre
ssur
e (
kg/c
m2)
Equivalent Pulse time (mili sec)
0 2 4 6 8 10 12 14 160
0.5
1
1.5
2
2.52.102653
0
Reflected overpressure Vs td
For Charge weight = 0.4 tonne
Refle
cted
ove
rpre
ssur
e (
kg/c
m2)
Equivalent Pulse time (mili sec)
For Charge weight = 0.5 tonne
Refle
cted
ove
rpre
ssur
e (
kg/c
m2)
Equivalent Pulse time (mili sec)0 2 4 6 8 10 12 14 160
0.5
1
1.5
2
2.5
3
2.468371
0
Reflected overpressure Vs td
0 0.5 1 1.5 2 2.5 3 3.5 4 4.502468
1012141618
0
15.39
Reflected overpressure Vs td
For Charge weight = 1 tonne
Refle
cted
ove
rpre
ssur
e (
kg/c
m2)
Equivalent Pulse time (mili sec)
Tonn
e
Pr
0.1 0.8064520.2 1.2660340.3 1.6792150.4 2.1026530.5 2.468371
1 4.2
0 0.2 0.4 0.6 0.8 1 1.20
0.5
1
1.5
2
2.5
3
3.5
4
4.5
f(x) = 0.64899312172 x³ − 1.82762927891 x² + 5.06024347196 x + 0.31832085472R² = 0.999963434967115
Detonation Wt. vs Peak Re-flected Pressure
Detonation Wt (tonne)
Peak
Refl
eced
Pre
ssur
e (K
g/cm
2)

Variation of Peak Reflected Overpressurewith Stand-off Distance
Stand off Distance
(m)
Pr(kg/cm2)
t (mil sec)
t (mil sec)
10 12.13074 4.48978 13.6224
15 3.62087 7.473143 18.19483
20 1.857502 9.611829 20.55338
25 1.146493 11.4432 22.0064
30 0.806452 13.14617 22.91858
Detonation amount = 0.1 tonne
For stand off Distance = 10 m
Refle
cted
ove
rpre
ssur
e (
kg/c
m2)
Equivalent Pulse time (mili sec)0 0.5 1 1.5 2 2.5 3 3.5 4 4.5 50
2
4
6
8
10
12
1412.13074
0
Reflected overpressure Vs td
Refle
cted
ove
rpre
ssur
e (
kg/c
m2)
Equivalent Pulse time (mili sec)
For stand off Distance = 15 m
0 0.5 1 1.5 2 2.5 3 3.5 40
1
2
3
4
5
6
7
8
0
7.473143
Reflected overpressure Vs td
Refle
cted
ove
rpre
ssur
e (
kg/c
m2)
Equivalent Pulse time (mili sec)
For stand off Distance = 20 m
0 0.2 0.4 0.6 0.8 1 1.2 1.4 1.6 1.8 20
2
4
6
8
10
12
0
9.611829
Refle
cted
ove
rpre
ssur
e (
kg/c
m2)
Equivalent Pulse time (mili sec)
For stand off Distance = 25 m
0 0.2 0.4 0.6 0.8 1 1.2 1.40
2
4
6
8
10
12
14
0
11.4432
Reflected overpressure Vs td
Refle
cted
ove
rpre
ssur
e (
kg/c
m2)
Equivalent Pulse time (mili sec)
For stand off Distance = 30 m
0 0.1 0.2 0.3 0.4 0.5 0.6 0.7 0.8 0.90
2
4
6
8
10
12
14
0
13.14617
Reflected overpressure Vs td
Distance from ground Zero (m)
Pr(kg/cm2)
10 12.1307411 8.92781112 6.83063813 5.26922714 4.15947915 3.6208716 3.10677717 2.65202220 1.85750230 0.806452
0 5 10 15 20 25 30 350
2
4
6
8
10
12
14
f(x) = 3013.46426515556 x^-2.45810607648953R² = 0.987446828711927
Distance from ground zero vs Peak reflected overpressure plot (for 0.1tonne detonation
amount)
Distance from ground zero (m)
Peak
refl
ecte
d pr
essu
re
(kg/
cm2)
Scope of the Work :• The main objective of the present study is to design a G+6 storey RCC building considering blast load, earth quake load, wind load.
• It is required to compare the design of the same building without blast load and including the blast load.
• Ductile detailing of the structural members need to be done.
References:
• Ngo, T., Mendis, P., Gupta, A. & Ramsay, J. “Blast Loading and Blast Effects on Structures – An Overview” The University of Melbourne, Australia (2007)
• Activity A5 - Blast Simulation Technology Development “Calculation of Blast Loads for Application to Structural Components” Administrative Arrangement No JRC 32253-2011 with DG-HOME (2013)
• IS 4991 ‘‘CRITERIA FOR BLAST RESISTANT DESIGN OF STRUCTURES FOR EXPLOSIONS ABOVE GROUND” (1968)
• Remennikov, A “A Review of Methods for Predicting Bomb Blast Effects on Buildings” University of Wollongong (2003), [email protected]
• Draganić, H., Sigmund V.“BLAST LOADING ON STRUCTURES” (2003)
• NBM Media article on “Blast Loading and Its Effects on Structures”