BLAST FURNACE GRANULAR COAL INJECTION PROJECT … Library/Research/Coal/major... · This 1997...
41
BLAST FURNACE GRANULAR COAL INJECTION PROJECT Annual Report January - December 1997 Work Performed Under Contract No.: DE-FC21-91MC27362 For U.S. Department of Energy Office of Fossil Energy Morgantown Energy Technology Center P.O. Box 880 Morgantown, West Virginia 26507-0880 BY Bethlehem Steel Corporation Bethlehem, Pennsylvania 18016 April 1998
-
Upload
vuongduong -
Category
Documents
-
view
220 -
download
0
Transcript of BLAST FURNACE GRANULAR COAL INJECTION PROJECT … Library/Research/Coal/major... · This 1997...

BLAST FURNACE GRANULAR COAL INJECTION PROJECT
Annual Report January - December 1997
Work Performed Under Contract No.: DE-FC21-91MC27362
For U.S. Department of Energy
Office of Fossil Energy Morgantown Energy Technology Center
P.O. Box 880 Morgantown, West Virginia 26507-0880
BY Bethlehem Steel Corporation
Bethlehem, Pennsylvania 18016
April 1998
TABLE OF CONTENTS
1.0 INTRODUCTION
2.0 BACKGROUND
3.0 PROJECT TEST PLAN
4.0 BLAST FURNACE OPERATIONS
4.1 FURNACE OPERATING CONDITIONS
4.2 HIGHER ASH INJECTED COAL TRIAL
4.3 FURNACE THERMAL CONDITIONS AND LINING WAR
5.0 SUMMARY
6.0 REFERENCES
gggg
1
1
2
3
3
8
11
12
12


1.0 INTRODUCTION
This 1997 annual report desctibes the Blast Furnace Granular Coal Injection project being implemented at the Burns Ha&or Plant of Bethlehem Steel Corporation. The project is receiving cost-sharing from the U.S. Department of Energy (DOE), and is being administrated by the Morgantown Energy Technology Center in accordance with the DOE Cooperative Agreement No. DE-FC21-91MC27362.
This installation is the first in the United States to use British Steel technologyrJ that uses granular coal to provide a portion of the fuel requirements of blast furnaces. The project will demonstrate/assess a broad range of technical and economic issues associated with the use of coal for injection into blast furnaces. To achieve the program objectives, the demonstration project is divided into the following three Phases:
Phase I - Design Phase II - Construction Phase III - Operation
Preliminary Design (Phase I) be.gan in 1991 with detailed design commencing in 1993. Construction at the Burns Harbor Plant (Phase II) began in August 1993 and was completed at the end of 1994. The demonstration test program (Phase III) started in the fourth quarter of 1995.
2.0 BACKGROUND
Bethlehem Steel Corporation’s Burns Harbor Plant operates two blast furnaces which produce molten iron in support of steelmaking operations. The furnaces are fueled with coke as part of the raw materials charged through the top of the furnace. The coke was supplemented by natural gas injected along with the combustion air through ports (tuyeres) near the base of the furnace. Each furnace produces about 7,000 tons per day of molten iron with the injected fuel providing about 15% of the total fuel requirements.
Because of the uncertainty of the long-term supply and cost of natural gas, Bethlehem submitted a proposal in response to DOE’s CCT-III solicitation to demonstrate the conversion for, optimization of, and commercial performance characteristics of granular coal as a supplemental fuel for steel industry blast furnaces. Operating blast furnaces with coal injected directly through the tuyeres into the combustion zone as a supplemental fuel will result in reduced coke consumption, and thereby, decrease the environmental emissions associated with cokemaking. The envitomnental problems normally associated with the combustion of coal will also be virtually eliminated by direct injection of coal into the blast furnaces as the potential contaminants, e.g., sulfur, are captured in the blast furnace slag.
Economic benefits will be real&d by the reduced demand for coke, the primary blast furnace fuel, and for natural gas and oil, the “conventional” supplementary fuels. Resuming that: (a) the granular coal injection system can be successfully operated at rates of several hundred pounds of coal injected per net ton of hot metal (liquid pig iron produced by the blast furnaces), and that (b) costs for the competing supplemental fuels, natural gas and oil, escalate in a manner projected by the U.S. Department of Energy (DOE), then the annual operating cost savings should make this an attractive investment as well as a technical advancement.
Bethlehem’s Blast Furnace Granular Coal Injection System Demonstration Project was one of 13 demonstration projects accepted for funding in the Clean Coal Technology Program third round of competition. A cooperative agreement with a total estimated cost of $143,800,000 was awarded to Bethlehem on November 26, 1990. Under this cooperative agreement, Bethlehem would provide 78.3% of the total funding requirements for the demonstration project with the DOE providing the remaining 21.7%. As project details were refined, the cost estimate was increased from $143,800,000 to $1!90,650,000. Major project milestone dates are shown in Figure 1. Additional details on the project were presented at the 1993, 1994.1995 and 1996 Clean Coal Technology Conferences.‘“-‘,6
3.0 PROJECT TEST PLAN
The objective of the test program is to determine the effect of coal grind and coal type on blast furnace performance. The start-up operation was conducted with a high volatile coal from eastern Kentucky with 36% volatile matter, 8% ash and 0.63% sulfur. The coal pteparation system has been operated to provide granular coal with nominal size of 30% minus 200 mesh (74 microns).
A trial will be conducted to determine the effect of using pulverized coal with a nominal size of 80% minus 200 mesh. The results of this trial will be of great interest to blast furnace operators and could have a significant effect on the type of coal injection facilities that will be installed in the future.
Another series of trials will be conducted to determine the effect of coal types and coal chemistry on furnace performance. The important furnace performance parameters that will be closely monitored during these trials are coke rate, raw material movement in the furnace, pressure drop in the furnace, gas composition profdes, iron analyses and slag analyses. All results of the blast furnace trials will be. evaluated and documented in a comprehensive report.

3
4.0 BLAST FURNACE OPERATIONS
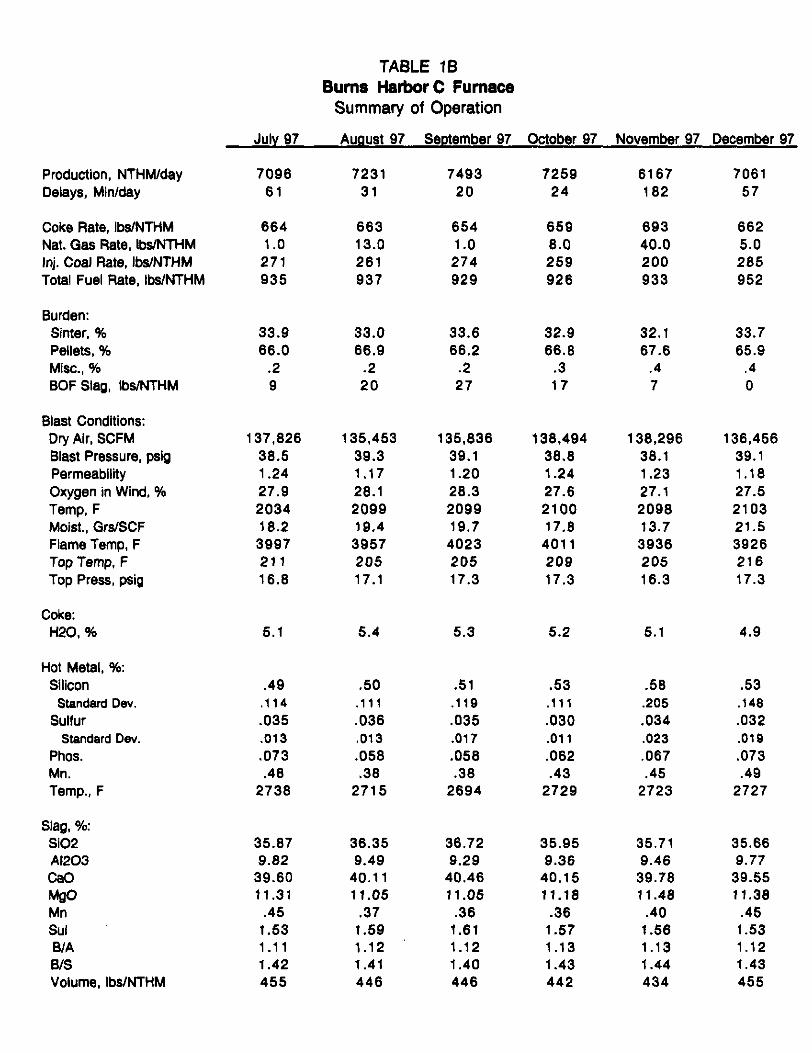
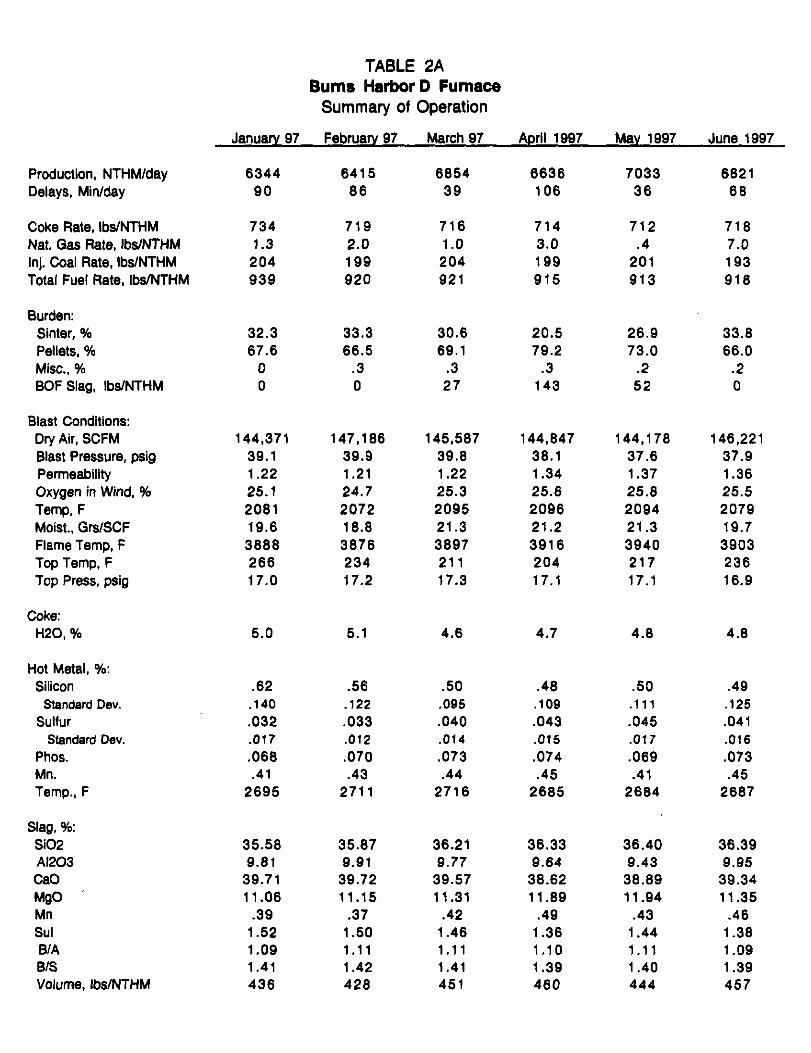
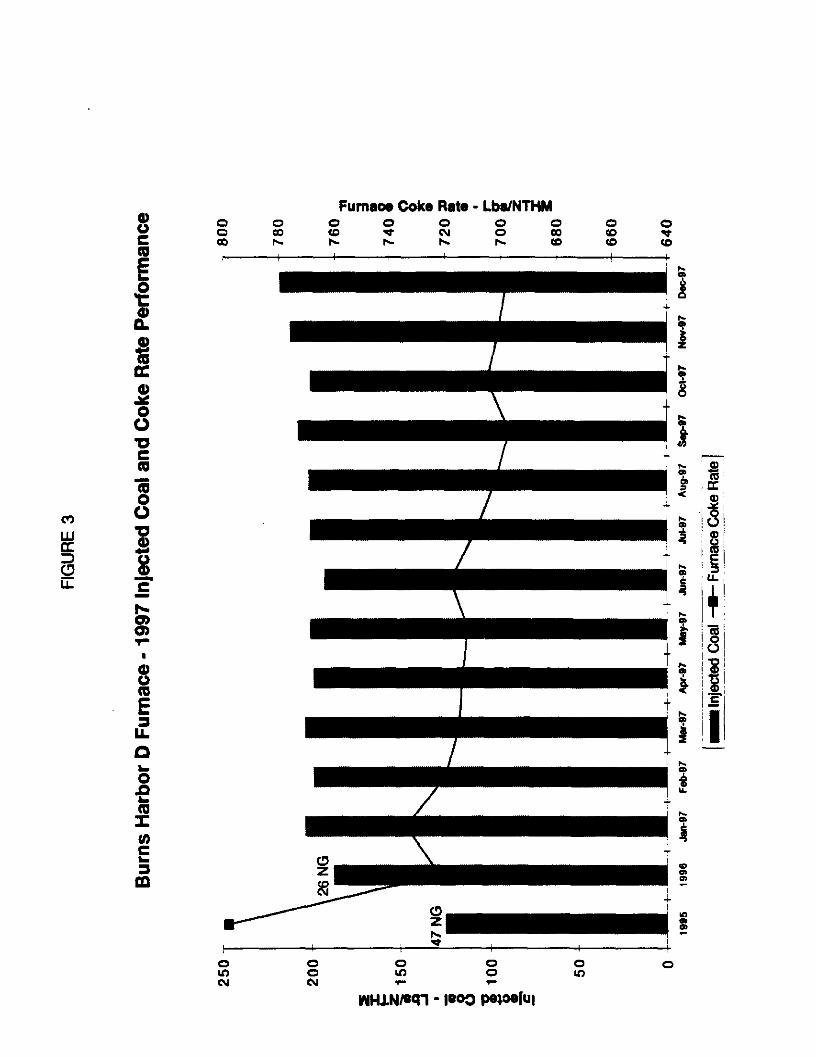
The granulated coal injection facility at Bethlehem Steel’s Burns Harbor blast furnaces has been operating since January 1995. The effects on the furnace operation with granulated coal as the injected fuel has been very different than the previous experience at the blast furnace when natural gas was used as the auxiliary injected fuel. During 1995 a smooth transition from natural gas to coal was accomplished even while major modifications were made to the coal preparation facility. By mid-1995 the coal preparation and delivery systems were operating as designed. The injection rate on C furnace was increased through the summer months and was over 200 lb&on for September, October and November. The injection rate on D furnace was kept in the range of 145-150 lbs/ton during the second half of 1995. The facility started up with high volatile coal but during the latter part of 1995 low volatile coal was successfully used and five different low volatile coals were evaluated. The experience with the low volatile coals led to the exclusive use of low volatile coal during 1996. Successful operating practices were also developed during 1996 in order to reach higher levels of coal injection and lower coke rates than during the previous year. In 1997 the coal facility became mom consistent and coal was injected at higher levels on both furnaces. The coke rate on the furnaces also was lower during 1997 as a consequence of the higher coal rates. Figures 2 and 3 show the progression of increased coal injection rates during 1997 as well as the reduction in furnace coke rates. Tables 1A and 1B provide the monthly operating summary for 1997 on C furnace and Tables 2A and 2B show the same information for D furnace.
4.1 FURNACE OPERATING CONDITIONS
The operation of the furnaces during January was marked by numerous delays and lengthy shutdown periods. On C furnace there were. eleven days during the month that the furnace had shutdown periods of 100 minutes or more. The monthly average delay in minutes/day, shown on Table 1 A, was 118. Even going back as far as July 1992, there has not been as high a monthly average delay period. The primary causes for the outages were a mechanical breakdown and repair of the burden filling equipment on January 12-14, the failure of the cyclone separator at the coal injection facility on January 19 and a gas line collapse on January 24. In addition, ten Nyem failed and had to be changed during the month. The coke rate was increased on C to 716 pounds/NTHM in January compared to 668 pounds/NTHM in December 1996. The inctease was partially in response to a reduction in the injected coal rate due to the coal injection facility problem. Incmases in coke were also necessary to adequately accommodate the lengthy shutdown periods.
The D furnace operation was similar to C, with ten days of outages of 100 minutes or more. The gas line collapse on January 24 also affected the D furnace. Twelve tuyere failures on D furnace were the primary reason for the delays.
4
The most disruptive incident, from a coal injection standpoint, was the failure of the cyclone housing on the Ul Coal Preparation Mill. The cyclone housing is at the very top of the grinding mill circuit On January 19th, the steel housing failed, opening up a hole and allowing air to be sucked into the inert atmosphere of the grinding system. The resultant high oxygen level in the mill caused the emergency abort system and the fi suppression system to activate. After operators isolated the #l Mill from the rest of the system, coal injection was re-established on both furnaces using only the #2 Mill. The coal rate was reduced primarily on C furnace due to this incident. The repair to the steel housmg included the application of a fiberglass and e.poxy material to the interior steel surface to minimize further wear from the abrasion of coal particles. A similar application of this abrasion tesistant material was also done to the #2 Mill cyclone separator during early February as a preventive maintenance measure.
During February the operation was stabilized on both furnaces. Delay time was decreased, coke rates were reduced and ptoductivity increased. Tuyere losses were still high, six on C and nine on D, but manageable.
March was notable for a sustained period of high productivity on the furnaces. The low delay rate on each furnace allowed for a combined average daily production level exceeding 14,OLN TPD for the first tune since February 1995. The low delay rate on C furnace was accomplished in large part by the loss of only three Nyeres for the month. D furnace also recorded only three Nye~ losses.
Combined furnace production increased substantially during the second quarter. The increased demand for hot metal began in February and furnace production increased since then to match steelmaking capacity. The C furnace averaged mom than 7,200 NTHM/day for the March to June period. The average tonnage of 7,479 NTHM/day in June is the highest production during this campaign. Opetations maintained the overall fuel rate during the quarter to around 940 pounds/NTHM. Both injected coal and coke rates were constant at approximately 270 pounds/NJ’HM and 670 pounds/NTHM, respectively. The increase in production on the furnace was accomplished primarily by the reduction in furnace delays. In addition, slight increases in oxygen enrichment helped. Figure 4 shows the increased production trends and reductions in delay periods for 1997 and the last six months of 1996. The decrease in overall delay time, and especially the unscheduled delays, was aided by fewer tuyere losses on both furnaces. Only one Nyexe loss occurred on C furnace in June and D furnace had no faihues.
The D furnace operation during this quarter was similarly consistent in terms of productivity, overaIl fuel rate and delay periods. The coal injection rate. remained at approximately 200 pounds/NTHh4 during the period. Production increases were accomplished by slight increases in both wind rates and enrichment oxygen levels.
5
Reduced demand for hot metal and some necessary maintenance activities at the blast furnace resulted in lower iron production during July and August. In September, C and D furnaces produced a combined daily average production rate of over 14,300 NTHM/day. The increase in productivity during September is a result of lower delays and reductions in coke rates at higher coal injection levels.
In September, the C furnace production averaged 7,493 NTHM/day, an increase of 250 NT per day from August. Although there was a slight increase in the oxygen emichment rate, the reduction in the furnace coke rate to below 660 pounds/NTHM had the greatest effect on the increased production. An increase in the coal injection rate aided the coke reduction. The incremental reduction in coke is noticeable during the third quarter as are the increases in coal injection.
The D furnace operation was similar to C during this three month period. Productivity was lower during July and August than during the month of June. September’s production increased to 6,877 NTHM/day primarily due to an increase in oxygen enrichment and a slight decrease in the coke rate.
In October, the combined production of the furnaces averaged over 14,000 NTHM/day with good fuel rates and relatively high coal injection rates. The coke rate on C furnace during October averaged 659 pounds/NTHM and D was 705 pounds/NTHh4 at coal injection rates of 259 and 201 pounds/NTHM, respectively. The good productivity was a result of the low coke rates and the low monthly average delay rate. The daily delay rate was 24 minutes on C furnace and 40 minutes on D.
During November, major maintenance on C furnace, particularly stockhouse repairs, and the operating problems associated with the lengthy shutdown periods from November 11-17 caused a decline in average productivity to 6,167 NTHM/day. The delay time also increased on D furnace as a result of high Nyme losses during the month.
During December, the operation began to return to normal, however, Nyere losses were high on C and the delays associated with the tuyere changes did not allow for a return to full productivity. The D furnace operation did improve with production levels at over 6.800 NTHMMay and a furnace coke rate of 698 pounds/NTHM.
During the third quarter several major operating parameters were modified. Beginning in November 1996, the furnace coke size was increased to +I%” from +%“. On July 15, 1997 the furnace coke size was changed back to + W”. In addition, the large amount of nut coke that had accumulated during the increased coke size rtial was added to the furnace in larger than normal quantities to reduce the inventory. A detailed analysis on the use of larger sized coke and increased quantities of nut coke are shown in the following section.

6
A trial in which granulated coal and greater quantities of natural gas were injected together began on C furnace on October 24. The trial was to continue for thirty days. However, the problems on the furnace beginning on November 11 caused the trial to be discontinued after seventeen days. Despite the bmvity of the trial, the results were encouraging. The detailed analysis of the trial is discussed later.
On November 5, 1996 a coke size change was made at the screening station of the Coke Ovens to provide a larger coke for the blast furnace. The bottom size of the coke was increased from Y,” to 14”. The increased coke size affected both furnaces. One of the expected benefits to the furnace operation was an increase in the permeability in the furnace. Improved permeability should provide an opportunity to increase the injected coal rate and further reduce the furnace coke rate. Increased permeability should also result in lower furnace blast pressure, enabling operators to increase the furnace wind rate. The following analysis of the performance with the larger coke encompasses approximately four months of use with larger coke. January 1997 should be ignored as a data point due to the operating difficulties previously described.
The increased coke size constitutes a major change to the blast furnace process. The benefits of the larger coke should be reflected by a substantial or notable improvement in the process variables that are. affected by coke size. However, in a comparison of ten months of opemting data prior to the change and five months of data following the change, there was no measurable or quantifiable improvement in the operation of either furnace.
After the change in November 1996, petmeability on both furnaces, with the exception of D furnace during April 1997, did not reach previous high values, furnace blast pressure has not been significantly reduced, and wind rates have not increased. In fact, on C furnace, blast pressures increased at lower wind rates after the coke change.
The furnace coke tates, while very good, did not improve and injected coal rates on both furnaces remained the same during the entire evaluation period.
In general, the combined furnace productivity remained approximately the same. Although the combined furnace production reached a fifteen month high during March 1997, statistically, it appears that the low monthly furnace delay rate was the primary reason for the productivity increase.

Figure 6 shows the C and D furnace monthly average permeability values for the last two years of openttion. The larger the value the better the gas flow through the furnace. This plot shows that, despite the larger coke on the furnaces since November 5, neither furnace has had an increase in permeability that matches previous high values prior to the coke size increase.
Figure 7 shows the amount of injected coal on each furnace. The increased coke size has not led to an increase in injected coal. Another conclusion can be made by comparing Figures 6 and 7. At the levels of coal injection on C and D to date, it does not appear that permeability is adversely affected by the quantity of injected coal.
The furnace results with the larger coke were disappointing. Permeability should have returned to at least the previous levels seen on each furnace in mid-1996. The operating difficulties experienced in January may have clouded some of the operating results. However, the conclusion from this period of time is that process improvements were negligible with the huger sized coke.
As a result of the trial with larger size furnace coke, theze was a large accumulation of - 1 W coke in inventory. After the size change back to furnace coke sired to +%‘I, this large inventory was reclaimed and nscnened to produce a large quantity of nut coke of a nominal size -%“. Nut coke was charged to the furnace in larger than normal quantities to reduce the inventory. The tons per month of nut coke consumed on the furnaces is shown in Figure 5.
The following discussion refers to the results on C furnace with the use of nut coke. The results on C furnace ate the same for D furnace.
The initial response on C furnace to the increase in nut coke was, as expected, a reduction in the permeability. Figure 6 shows that in August 1997 the permeability dropped compared to July 1997. A subsequent reduction in nut coke in September resulted in an improvement in the permeability but not to the previous level shown for June and July. Figure 8 shows the increased blast pressure that accompanied the reduction in permeability. This is also an expected outcome of the use of nut coke.
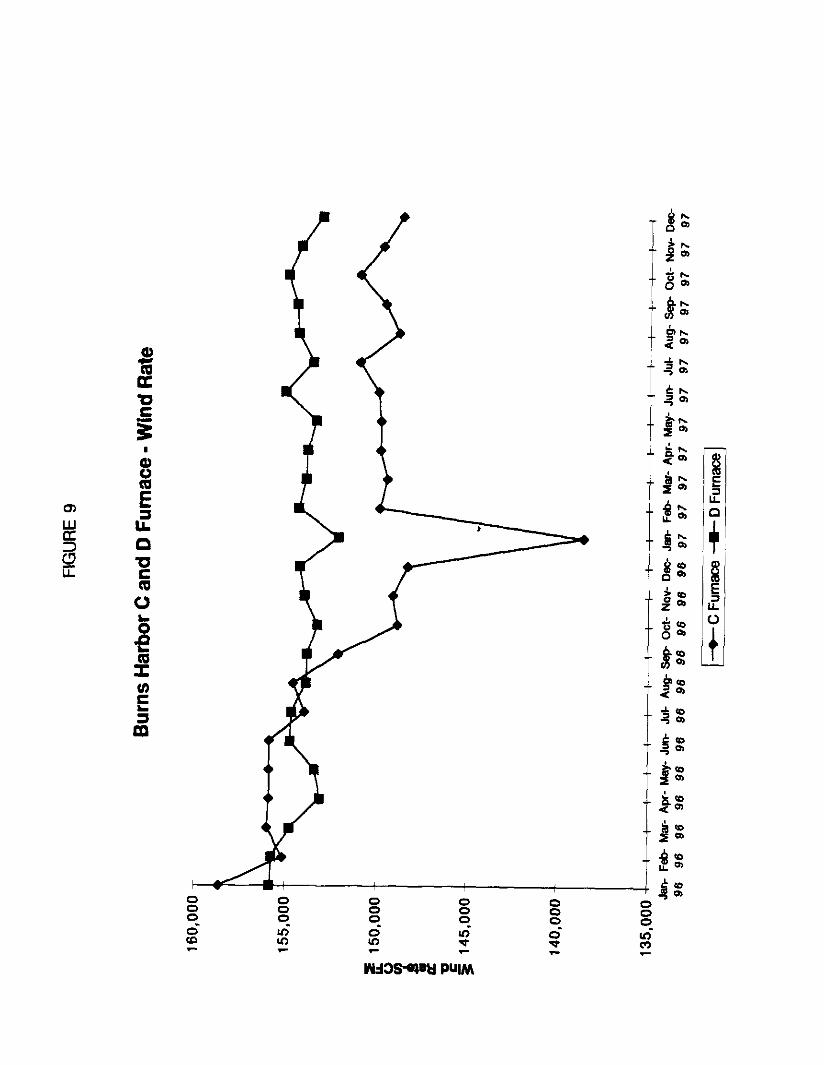
The reduction in furnace permeability with the use of nut coke did not have a deleterious affect on furnace wind rates or furnace production. Figure 9 shows that the operators were able to maintain the total wind rate despite the reduced permeability. Production increases are noted during August and September in Figure 4, despite the incteased quantity of nut coke. The coke rate also improved despite nut coke usage. Usually an increase in blast pressure and the reduction of furnace permeability does not allow operators to reduce the coke rate and increase production.

8
The return to a smaller furnace coke size and increasing the nut coke usage on both furnaces did not adversely affect the productivity or fuel rate on either furnace. In addition, there was no indication of adverse thermal load activity on either furnace during this period.
Co-iniection of Natural Gas and Granulated Coal
Coal injection has enabled operators to reduce furnace coke rates to lower levels than were possible with natural gas injection. Figures 2 and 3 show the progression of lower furnace coke rates on C and D furnaces since coal injection came on stream in January 1995. With coal injection, furnace permeability was adversely affected and necessitated incnases in levels of enrichment oxygen and blast moisture in order to maintain productivity and acceptable burden movement. This trial was done to assess the effect of adding a substantial amount of natural gas while maintaining a constant amount of granular coal. The natural gas was injected on six tuyeres through the coal lances. Granulated coal was used on the remaining 22 myeres. This is not the ideal way to coinject fuels, but major renovations to the furnace blowing stock ate necessary to inject coal and gas through the same tuyere. Although the time period was brief and marred by delays, a review of the data shows signs of improved operation. The relevant data during the trial period is compared in Table 7 to a base period in September 1997, a very good operating month.
The comparison of the two periods shown on Table 7 lead to the following observations:
l The furnace coke rate was 11 potmds/NTHM lower during the trial period. This suggests that coal and gas in combination can support a lower coke rate.
l Operations was able to &ease the furnace wind rate by about 4600 SCFM during the trial.
l Even though the wind rate was increased, the furnace blast pressure was lower during the co-injection period and the furnace permeability was higher.
l It was possible to reduce the moisture additions by 8 grs/SCFM of wind and still maintain good burden movement.
l The third period was brief because of a breakdown of the C furnace stockhouse equipment. The trial will be repeated for a longer period when time permits.
4.2 HIGHER ASH INJECTED COAL TRIAL
The objective of this trial is w quantify the effect of ash content in the injected coal on the blast furnace operation.

9
The Burns H&or C furnace operation immediately prior to the trial period was characterized by high production levels and a steady-state for the major operating variables. During the first half of 1997 the operation was run w achieve maximum furnace production rates. This is unlike most of 1996 when the primary focus was to mazimize coal injection levels and achieve low furnace coke rates.
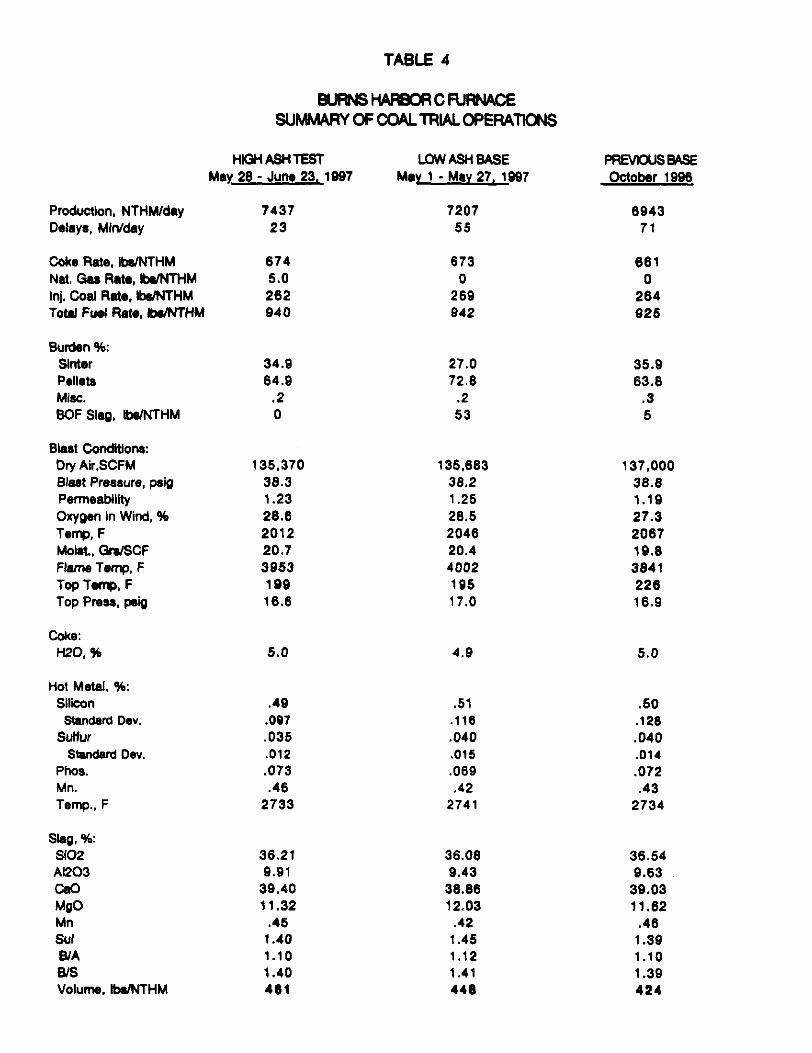
The trial period began on May 28, 1997 and concluded June 23, 1997. The trial period is compared to two previous operating periods: a pre-trial period from May 1 - May 27, 1997, and the previously conducted October 1996 base period.
Trial Coal Selection
During the entire year of 1996 the injection coal used on both furnaces was the low volatile, high carbon content BuchananNirginia Pocahontas. The coal is designated by two names based on two different mine sites and the point of shipment to the plant. However, both coals are from the same seam and am very similar chemically.
The typical analysis of Virginia Pocahontas in October 1996 and the Buchanan coal used on the furnaces immediately prior to the trial period ate shown in Table 3. For a good furnace trial, one that would assess only ash content, it is important to use a coal that only varies in ash so that there would be no confounding issues such as s&fur content or large differences in volatile matter. The coal supplier of the Buchanan coal suggested that ash content could be increased at the mine site cleaning station if one of the usual coal cleaning steps was eliminated. Trials were run at the mine and subsequent coal analysis confumed that the ash content could be increased by this method. The average analysis of the four train trial coal is also shown on Table 3. The trial coal is 2.4% higher in ash than the coal used for the October 1996 base and is 3.0% higher in ash than the coal used during the furnace period immediately prior to the uial.
Also shown in Table 3 is the average size distribution of the final injection product coal during the trial period. The average size distribution satisfies the definition of granular coal; 100% is -4 Mesh, 98% is -7 Mesh and less than 30% is -200 Mesh.
C Furnace Ooerations
The primary concern of the furnace operators, both before and during a blast furnace trial is to maintain a consistent operating practice so that a valid comparison of the trial variable being analyzed can be properly compared and assessed. In addition, if more than one comparison base operating period is compatible with the trial period it should be utilized to validate and support the trial results. Table 4 shows the operating results for the higher ash trial period on C furnace and the two operating periods that are used to make the comparative analysis.

10
The amount of injected coal used during each pericd is similar. In addition, the general blast conditions during the periods are comparable. The wind rates only vary from 135,370 SCFM w 137,000 SCFM. Blast pressure, top pressure and moisture additions are similar.
The primary change in the operation, as expected, was the inctease in the blast furnace slag volume. The increase from 448 pounds/NTHM in the low ash period to 461 pounds/NTHM during the trial is significant. Even more noticeable is the increase from 424 pounds/NTHM slag volume during the OctoLxrr 1996 period. The general conclusion from Table 4 is that higher ash content in the injected coal can be adjusted for by the furnace operators and does not adversely affect overall furnace operations.
Furnace Coke Rate Results
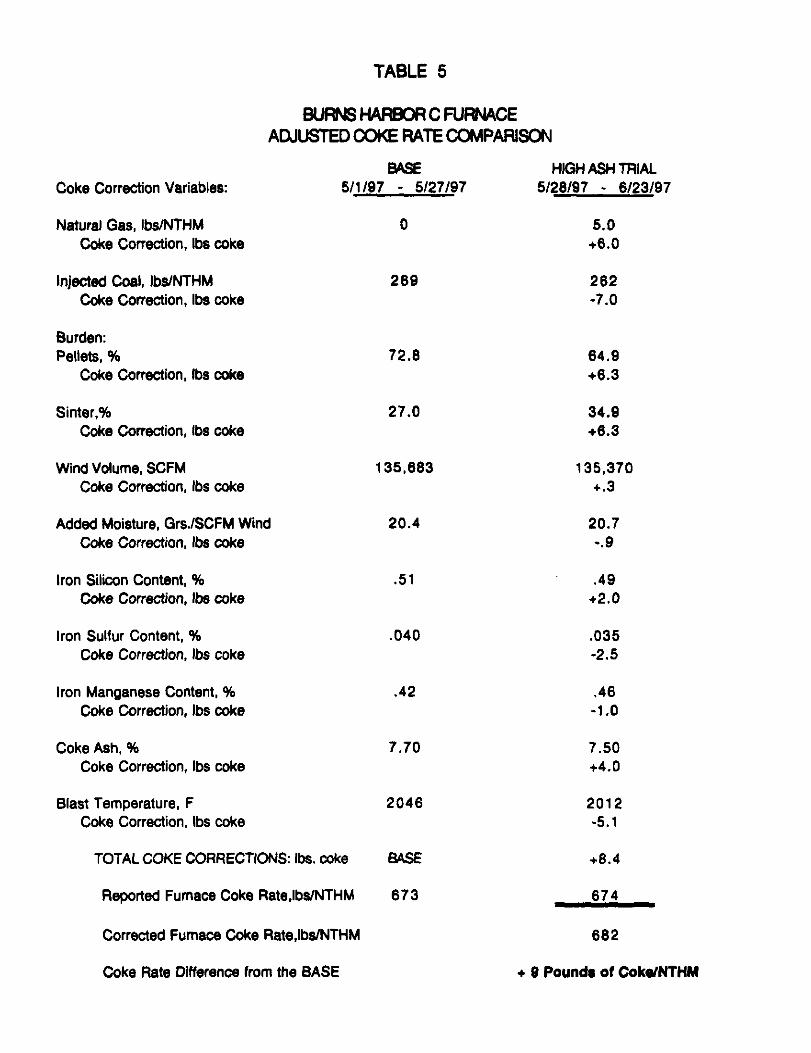
The primary reason for this coal trial is to determine the coke rate penalty w the blast furnace that results from the use of higher ash injection coal. In order to assess the comparative furnace coke rate during a trial all the blast furnace variables that affect the furnace coke rate that are different from the base to the uial must be adjusted by using coke correction factors. The only variables that are not corrected or adjusted are those affected by the operating variable that is heing assessed. After accounting for all operational coke differences between the base period and the trial period, we attribute the coke remaining unaccounted for as a consequence of the variable being Studied. Since the higher ash coal causes an increase in the furnace slag volume and does contribute to higher furnace coke usage, we have not adjusted the coke for changes in the slag volume.
Two comparisons were made using the above logic. Table 5 shows the results of the fust comparison. Here, we have corrected the higher ash trial to the May 1 - May 27, 1997 pre-trial period. The largest adjustment necessary is for the difference in the injected coal amount of seven pounds of coke. Genetally, the total adjusted coke amount for the period comparison is small. That is indicative of a successful trial operation. The conclusion from this table is that a 3% increase in injected coal ash results in a nine pound per NTHM increase in the furnace coke rate with a coal injection rate of 270 pounds/NTHM.
Table 6 shows the values from the second comparative period. As with the previous analysis, only small adjustments are required to establish the overall corrected coke rate. This comparison substantiates the first results. The 2.4% increase in coal ash from the October 1996 base period to the trial period results in a coke penalty of eight pounds per NTHM.
These results will allow operators to assess different ash content of various coals and economically determine which coal w purchase.

11
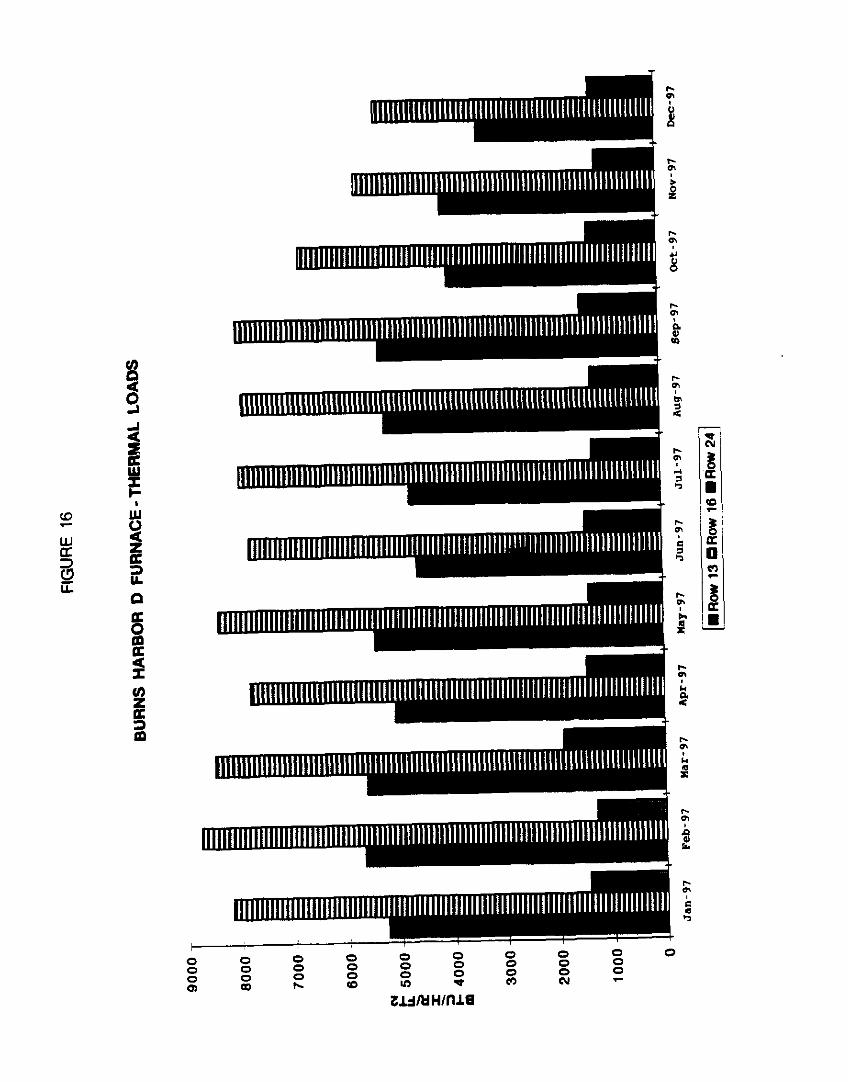
4.3 FURNACE THERMAL CONDITIONS AND LINING WEAR
The use of injected coal caused changes in the thermal conditions on both blast furnaces at Burns Ha&or. The increases in the thermal measurements as a result of coal injection were particularly noticeable during the introduction of coal injection in 1996. During 1997 the coal injection operating practices were stabilised and it became apparent that improved operating conditions can positively impact the thermal conditions. The Thermal Load System at Burns Harbor is used as an indication of the gas flow conditions within the furnace. Refractory temperatures and calculated thermal loads increase as the mducing gases formed at the NyeI’e ascend and move along the refractory lined furnace walls. A loss of central gas flow causes more gas w be diverted to the furnace wall. The increased wall flow is indicated by increases in thermal loads and also may suggest an increase in refractory wear.
Refractory temperatums and themud load values should gradually increase as a furnace campaign continues. High refractory wear is often attributed w brick fracture as a result of rapid and sudden temperat~e changes inside the furnace. The goal is to stabilize the operation and reduce the magninrde of fluctuations of the thertnaJ loads.
C Furnace
Figure 10 shows the in-wall refractory temperatures at four elevations on C furnace for 1997. The thermocouples are embedded in the refractory lining of the furnace at various brick depths. The in-wall temperatures have been fairly consistent with the exception of March.
Figure 11 shows the thermal load values for C furnace at five elevations. Rows 1 l-20, shown on this chart as the solid black bar, had the highest value throughout most of the year and has been the highest tefractory wear area in the furnace. The other four elevations wen consistent for all of the monthly periods.
Figure 12 shows the refractory thickness at three elevations in the furnace. Beginning in January 1997 we observe 1ittJe or no refractory wear during the year compared to large loss of refractory during the middle of 1996.
D Furnace
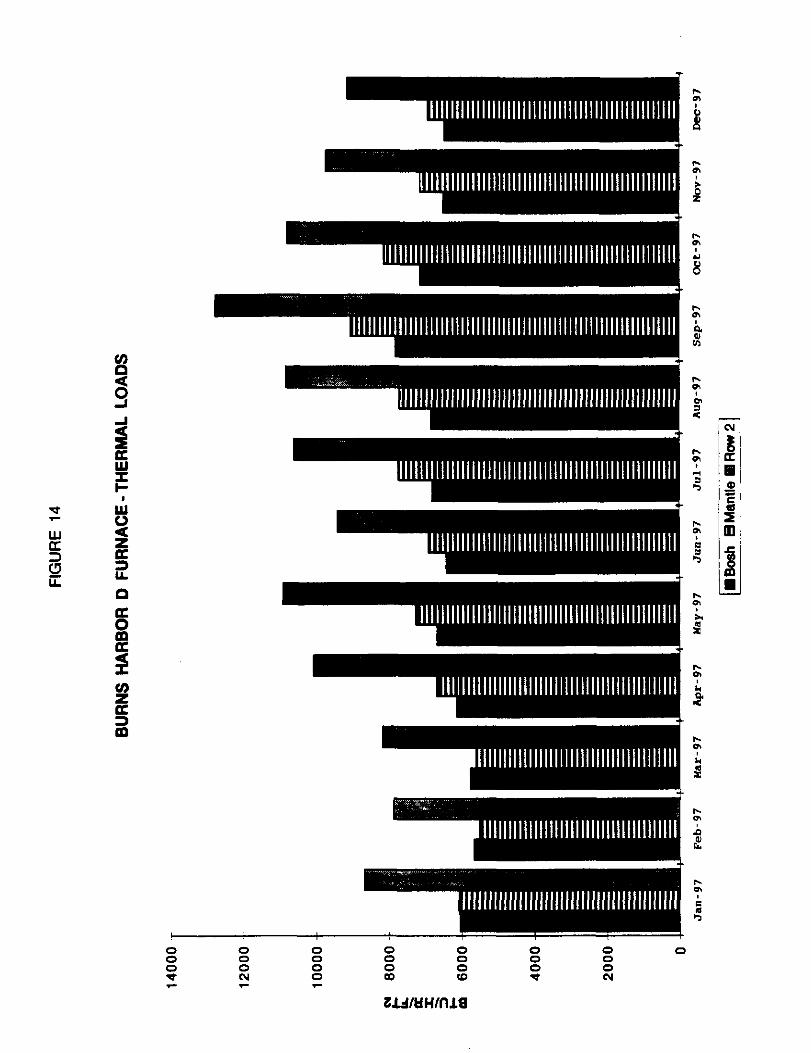
The refractory temperatures and the calculated thermal load values are shown on Figures 13, 14. 15 and 16. All of these values for the entire year are the model of consistency as they were for most of 1996. The amount of injected coal and the general operating conditions on the furnace have changed very little during the last two years.

12
Figure 17 shows the refractory wear measurements for D furnace since 1992. In addition, the injected coal rate is shown. There has been no refractory wear at the three elevations shown during all of 1996 and 1997. We also note that since April 1996 the coal injection rate has remained constant.
5.0 SUMMARY
The blast furnace operation with coal injection significantly matured during 1997. Coal injection at Burns Harbor has enabled lower coke rates and higher production levels than when other injectants were used.
However, in order to take advantage of the positive aspects of coal injection, the operation had to be altered w make coal injection perform properly. The oxygen enrichment level on the furnaces had w be increased to provide proper coal combustion at the Nyere and the moisture addition level was increased to aid in proper burden movement.
The coal injection facility perform& well, however, design shortcomings have appeared. The major example of this was the cyclone failure in January 1997.
Our technical understanding of granular coal injection has improved as a result of trials with higher ash coal, large sized coke and coinjection of coal and natural gas. The important trials with pulverized coal and high volatile coal are planned for 1998.
6.0 REFERENCES
1. D. S. Gathergood, “Coal Injection Into the Blast Furnace”, International Iron 8c Steel Institute Committe.e on Technology, April 26, 1988.
2. D. S. Gathergood and G. Coogcr, “Blast Furnace Injection - Why Granular Coal”?, Steel Technology International, 1988.
3. D. Kwasnoski and L. L. Walter, “Blast Furnace Granular Coal Injection”, Second Annual Clean Coal Technology Confemnce, Atlanta, GA, September 1993.
4. D. Kwasnoski and L. L. Walter. “Blast Furnace Granular Coal Injection”, Thiml Annual Clean Coal Technology Conference, Chicago, IL, September 1994.
5. L. L. Walter, R. W. Bouman and D. G. Hill, “Blast Furnace Granular Coal Injection”, Fourth Annual Clean Coal Technology Conference , Denver, CO, September 1995.
6. D. G. Hill, T. J. Strayer and R. W. Bouman, “An Update on Blast Furnace Granular Coal Injection”, Fifth Annual Clean Coal Technology Conference, Tampa, FL, January 1997.

Production, NTHM/day Delays, Mm/day
6026 116
6Qi4 54
7296 7365 7230 7479 15 30 51 18
Coke Rate, Ibs!NTHM 716 664 674 670 673 874 Nat. Gas Rate, Ibs/NTHM 5.1 4.0 1.2 3.0 .4 4.0 Inj. Coal Rate, IbdNTHM 246 253 286 262 269 261 Total Fuel Rate, lbs/NTHM 969 Q41 941 935 942 939
Burden: Sinter, % Pellets. % Misc., % BOF Slag, IbsINTHM
32.0 34.1 31.6 21.5 26.1 34.9 66.0 65.6 68.1 78.1 71.7 64.9
0 .3 .3 3 .2 .2 0 0 25 132 46 0
Blast Conditions: DryAir,SCFM Blast Pressure. psig Permeability Oxygen in Wind,% Temp,F Moist., Grs/SCF Flame Temp. F T0pTemp.F Top Press, psig
128,369 138.529 136,421 135.794 135,604 135,622 37.1 40.0 39.1 38.9 38.2 38.2 1.06 1.13 1.19 1.21 1.25 1.24 26.0 27.0 27.9 28.4 28.5 28.6 2075 2079 2074 2055 2040 2008 17.'1 16.9 20.5 20.3 20.4 20.4 3855 3928 3968 3963 3999 3938 246 210 196 192 196 200 15.3 17.1 17.1 17.1 17.0 16.6
Coke: H20,% 4.7 4.8 4.6 4.7 4.6 5.0
Hot Metal, %: Silicon
Standard Dev. Sulfur
Standard Dev. Phos. Mn. Temp., F
.67 .56 .51 .50 .51 .4Q ,212 ,147 ,108 ,131 ,112 .103 .02Q .032 .040 .045 .03Q .035 .013 ,016 .017 .022 .015 .012 .066 .071 .073 .073 ,070 .073 .41 .44 .45 .45 .43 .46
2753 2715 2730 2735 2740 2733
Slag, %: Si02 AI203 CaO
MO Mn SUI B/A B/S Volume, Ibs/NTHM
35.62 35.66 36.11 36.04 36.11 36.16 9.81 9.89 9.74 9.61 9.45 9.90
39.92 39.92 39.60 38.83 36.95 39.38 11.21 11.13 11.27 11.86 11.95 11.31
.40 .37 .43 .47 .42 .46 1.54 1.52 1.47 1.40 1.45 1.40 1.11 1.12 1.11 1.11 1.12 1.10 1.42 1.43 1.41 1.41 1.41 1.40 428 434 458 459 449 486
TABLE 1A Bums HerborC Furnace
Summary of Operation
JanuawQ7 February 97 March97 April lQQ7 May 1997 June 1997
Production, NTHMIday 7096 7231 7493 7259 6167 7061 D8layS. k&n/day 61 31 20 24 182 57
Coke Rate, Ibs/NTHM 664 663 654 659 693 862 Nat. Gas Rate, lbs/NTHM 1 .o 13.0 1 .o 8.0 40.0 5.0 lnj. Coal Rate, Ibs/NTHM 271 261 274 259 200 285 Total Fuel Rate, Ibs/NTHM 935 937 929 926 933 952
Burden: Sinter. % P8tf8tS, % Misc., % BOF Slag, Ibs/NTHM
33.9 33.0 33.6 32.9 32.1 33.7 68.0 66.9 66.2 66.6 67.6 65.9
.2 .2 .2 .3 .4 .4 Q 20 27 17 7 0
Blast Conditions: Dry Air, SCFM Blast Pressure, psig Permeability Oxygen in Wind, % Temp. F Moist., GrsISCF Flame Temp, F Top T8mp, F Top Press, psig
137,826 135,453 135,836 138.494 138,296 136,456 38.5 39.3 38.1 36.8 38.1 39.1 1.24 1.17 1.20 1.24 1.23 1.18 27.9 28.1 26.3 27.6 27.1 27.5 2034 2099 2099 2100 2096 2103 18.2 19.4 19.7 17.8 13.7 21.5
3997 3957 4023 4011 3936 3926 211 205 205 209 205 216 15.6 17.1 17.3 17.3 18.3 17.3
cOk8: H20. % 5.1 5.4 5.3 5.2 5.1 4.9
Hot Meta&%: Silicon
Standard Dev. Sulfur
Standard Dev. Phos. Mn. Temp., F
.4Q .50 .51 .53 .58 .53 ,114 ,111 ,119 ,111 ,205 ,146 .035 .036 .035 ,030 .034 ,032 .013 ,013 .017 .Oll ,023 .OlQ .073 .058 .058 .062 ,067 .073 .48 -38 .38 .43 .45 .4Q
2736 2715 2694 2729 2723 2727
Slag, %: Si02 Al203 cao
Mao Mn Sul %/A B/S Volume. Ibs/NTHM
35.67 36.35 36.72 35.95 35.71 35.66 9.82 9.49 9.29 9.36 9.46 9.77
39.60 40.11 40.46 40.15 39.78 39.55 11.31 11.05 11.05 11.18 11.48 11.38
.45 .37 .36 .36 .40 .45 1.53 1.5Q 1.61 1.57 1.56 1.53 1.11 1.12 1.12 1.13 1.13 1.12 1.42 1.41 1.40 1.43 1.44 1.43 455 446 446 442 434 455
TABLE 16 Bums HabrC Furnace
Summary of Operation
Julv 87 Auoust 97 September 97 October 97 November 97 December 97
Production, NTHMlday 6344 6415 6854 6636 7033 6821 Delays, Mm/day QO 86 39 106 36 66
Coke Rate, Ibs/NTHM 734 719 716 714 712 718 Nat. Gas Rate, IbdNTHM 1.3 2.0 1.0 3.0 .4 7.0 Inj. Coal Rate,lbslNTHM 204 1QQ 204 199 201 193 Total Fuel Rate, Ibs/NTHM 930 920 921 915 913 918
Burden: Sinter, % Pellets, % Misc., % BOF Slag, IbsINTHM
32.3 33.3 30.6 20.5 26.9 33.8 67.6 66.5 69.1 79.2 73.0 66.0
0 .3 .3 .3 .2 .2 0 0 27 143 52 0
Blast Conditions: Dry Air, SCFM Blast Pressure, psig Permeability Oxygen in Wind,% Temp.F Moist., GrsLSCF Flame Temp. F TopT8mp.F Top Press, psig
f44,371 147.186 145,567 144,847 144.178 146,221 39.1 39.9 39.6 38.1 37.6 37.9 1.22 1.21 1.22 1.34 1.37 1.36 25.1 24.7 25.3 25.8 25.8 25.5 2061 2072 2005 2086 2004 2079 lg.6 18.8 21.3 21.2 21.3 19.7 3860 3678 3897 3916 3940 3903 266 234 211 204 217 238 17.0 17.2 17.3 17.1 17.1 16.9
‘2Ok8: H20,% 5.0 5.1 4.6 4.7 4.8 4.8
Hot Metal, O/O: Silicon
Standard Dev. Sulfur
Standard Dev. Phos. Mn. Temp., F
.62 .56 .50 .48 .50 .4Q .140 .122 ,005 ,100 .lll ,125 .032 .033 .040 .043 .045 .041 .017 .012 .014 ,015 ,017 .016 .066 .070 .073 .074 .069 .073 .41 .43 .44 .45 .41 .45
2895 2711 2716 2685 2664 2687
Slag, %: Si02 Al203 CaO Mgo Mn Sul B/A B/S Volume. Ibs/NTHM
35.50 35.67 36.21 Q.81 9.91 9.77
39.71 39.72 39.57 11.06 11.15 11.31
.3Q .37 .42 1.52 1.50 1.46 l.OQ 1.11 1.11 1.41 1.42 1.41 438 428 451
36.33 36.40 36.39 9.64 9.43 9.95
38.62 30.89 39.34 11.89 II.84 11.35
.4Q .43 .46 1.36 1.44 1.38 1.10 1.11 I.09 1.39 1.40 1.39 480 444 457
TABLE 2A Bums Harbor D Furnace
Summary of Operation
Januarv 07 February 97 March 97 April 1907 Mav lQQ7 June 1997

Production, NTHMlday 6717 6704 6876 6862 6606 6866 Delays, Mm/day 72 65 54 40 66 48
Coke Rate, Ibs/NTHM 709 702 697 705 701 698 Nat. Gas Rate. Ibs/NTHM 2.0 6.0 3.0 4.0 2.0 5.0 lnj. Coal R8t8,lbsINTHM 201 202 207 201 212 216 Total Fuel Rate, Ibs/NTHM 912 910 907 GOQ 015 921
Burden: Stnter, % Pellets, % Misc., % BOF Slag, Ibs/NTHM
32.8 31.9 32.8 32.0 32.4 32.8 37.0 67.0 67.2 67.7 67.2 66.6
.2 .2 .2 .3 .4 .4 11 20 20 16 6 1
Blast Conditions: Dry Air, SCFM Blast Pressure, psig Permeability Oxygen in Wind, % Temp. F Moist., GrslSCF Flame Temp, F Top Temp. F Top Press, psig
145,464 145,661 145,656 146,364 145,346 144,266 38.9 39.6 39.5 39.3 39.3 38.6 1.27 1.24 1.25 1.28 1.24 1.25 25.2 25.4 25.5 25.4 25.6 25.6 2086 2079 2003 2068 2090 2096 10.0 16.6 10.3 10.3 10.0 21.6
3037 3923 39.44 3846 3077 3894 236 225 220 226 216 239 17.2 17.3 17.4 17.5 16.9 16.3
cOk8: H20. % 5.2 5.5 5.3 5.2 5.1 5.0
Hot Metal, %: ‘Silicon
Standard Dev. Sulfur
Standard Dev. Phos. Mn. Temp., F
.4Q .51 ,133 .llO .040 .036 ,021 .Oll .073 .058 .46 .37
2674 2666
.48 .51 .51 .52 ,108 .060 ,110 ,117 .043 .035 ,037 .038 ,015 .ooo ,014 .022 .058 .063 .06Q .073 .36 .42 .45 .48
2672 2702 2689 2693
Slag, %: Si02 Al203 CaO
Ma0 Mn Sul B/A B/s Volume, IbslNTHM
35.04 36.67 36.80 36.25 35.60 35.61 0.65 Q.60 9.23 0.37 9.46 0.77
39.64 40.20 40.30 40.14 39.76 30.57 11.31 11.13 lO.Q8 11.27 11.43 11.36
.46 .37 .37 .37 .41 .44 1.51 1.80 1.57 1.56 1.57 1.53 1.11 1.11 1.11 1.13 1.13 1.12 1.42 1.40 1.39 1.42 1.43 1.43 446 438 441 436 440 449
TABLE 26 Bums Harbor D Furnace
Summary of Operation
July 07 Auflust Q7 September Q7 October Q7 November Q7 December 97

TABLE 3
Volatllo Matter, % Sulfur, % Aah,%
UltitW8 Analysis, % Carbon Oxygen Hydmwn N-n CfllOliM
TOW hbktUr8. %
GHV, BTU/lb (dry)
Ash Analyab,% Si02 Al203 cao MN
INJECTION COAL ANALYSIS BuRNsH4RmHlGHERAsHcmLTRlAL
V&PocahontM Oct0lmrlGG6
18.00 .70
6.30
6 Tmin Av~r~w Prior to Tdal
10.79 .62
4.72
67.10 67.04 1.23 1.04 4.20 4.27 1.21 1.21 ,170 .140
5.30 6.77
14074 15066
41.50 32.30 41.60 23.58 22.76 23.33 7.36 10.10 0.27 1.60 2.05 1.75
+4 MOsh
4Mosh
-6Mwh
-16Meah
-30 Mesh
-50 Mesh
-100 Mesh
-200 Mesh
-325 Mesh TOTAL
CfUWACE pFKmcTcoALslMJo May26 -June 23,1007
MEAN% 0
+6Mrh .3
+I6 Mash 1.0
+30 Mesh 7.4
+!50 Mesh r5.i
+lOO Mesh 27.0
+2OOMesh 34.0
+325 Mrh 13.6
.B 100.0
H~hA8hBuchanan 4 Tmln Tdal Awegr
16.75 .75
7.70
84.32 2.24 3.86 1.12 .120
8>46
14425
CUM%
0.3
2.1
0.5
24.6
51.6
85.6
go.2
100.0
HKWASHTEST LwAsHBAsE pRlsousBAsE May 28 - Jufm 23.1897 May 1 - Mav27. 1997 OotoberlQ96
Production, NTHM/day 7437 7207 6943 Delaya. Minklay 23 55 71
Cake Rate, IMTHM 674 673 661 Nat. Cia.s Rata, 2WNTHM 5.0 0 0 Inj. Coal Rato.IbuNTHM 262 269 264 TotalFwlRate,b/NTHM 940 042 926
Bunian%: slnter PbllBtS Misc. SCF Slag, IbUNTHM
34.9 27.0 35.9 64.9 72.6 63.6
.2 .2 .3 0 53 5
Blart Condttiona: DryAir.SCFM skat Pressure. p&g PwmeaMlity OxyQeninWind.% T@np. F Mobt.,Gm/SCF FlameTem~,F Top Trrp, F TopPreqpdg
135,370 135.663 137.000 36.3 38.2 36.6 1.23 1.25 1.18 26.6 26.5 27.3 2012 2046 2067 20.7 20.4 19.6 3853 4002 3641 199 195 226 16.6 17.0 16.9
CdN: H20, % 5.0 4.9 5.0
Hot Me&d, %: Silicon
Standard Dw. SunlJr
standard Dev. Phos. Mn. Temp., F
.4Q .51 .50 .OQ7 ,116 ,126 .035 .040 .040 ,012 .015 .014 .073 .069 .072 .46 .42 .43
2733 2741 2734
SkQ. %: sioz Al203 cue MQO Mn Sul S/A B/S Volume,lbaINTHM
36.21 36.06 36.54 9.91 9.43 9.63
39.40 36.66 30.03 11.32 12.03 11.62
.45 .42 .46 1.40 1.46 1.39 1.10 1.12 1.10 1.40 1.41 1.39 461 446 424
TABLE 4
BUWSHAFIEK)RCFUFWACE suMMARYoFcoALlRlALcPERAlloNs
Coke Correction Variables:
Natural Gas, Ibs/NTHM Coke Correction, Ibs coke
Injected Coal, IbslNTHM C&e Correction, Ibs coke
Burden: Pellets, %
Coke Correction, fbs coke
Sinter.% Coke Correction, lbs coke
Wind Volume, SCFM Coke Correction, Ibs wke
Added Moisture, Grs./SCFM Wind Coke Correction, lb8 coke
Iron Siliin Content, % Coke Correction, lb8 wke
Iron Sulfur Content, % Coke Correction, Ibs coke
Iron Manganese Content, % Coke Correction, Ibs coke
Coke Ash, % Coke Correction, Ibs coke
Blast Temperature, F Coke Correction, Ibs coke
TABLE 5
BUFfNSl-l4FWRCFU~CE ADJUSTED COKE RATE COMPARISCNI
s4sE 5/l IQ7 - 5127197
0
269
72.0
27.0
135,663
20.4
.51
.040
.42
7.70
2046
HIGH ASH TRIAL 5/20l97 - 6123197
5.0 +6.0
262 -7.0
64.9 +6.3
34.9 +6.3
136.370 +.3
20.7 -. 9
.49 +2.0
.035 -2.5
.46 -1.0
7.50 +4.0
2012 -5.1
TOTAL COKE CORRECTIONS: Ibs. wke USE +6.4
Repotted Furnace Coke Rate.lbs/NTHM 673 674
Corrected Furnace Coke Rate,lbs/NTHM 662
Coke Rate Difference from the BASE +OPoundsofCokdlHM

Coke Correction Variables:
Natural Gas, IbsfNTHM Coke Correction, bs wke
lnM&d .Coal. Ibs/NTHM coke Correction, Ibs coke
Burden: Pellets, %
Coke Correction, Ibs coke
Sinter,% C&e Correction, Ibs wke
Wind Volume, SCFM Coke Correction, Ibs coke
TABLE 6
BURNSHARKNCFUlW4CE ADJUSTED COKE RATE CCMPARISCN
Added Moisture, Grs.lSCFM Wind Coke Correction. Ibs wke
Iron Silicon Content, % Coke Comcfion. lbs wke
Iron Sulfur Content, % Coke Correction, Ibs wke
Iron Manganese Content, % Coke Correction, Ibs wke
Coke Ash, % Coke Correction, Ibs coke
Blast Temperature, F Coke Correction, Ibs wke
TOTAL COKE CORRECTIONS: Ibs. wke
Reported Furnace Coke Rate,lbs/NTHM
Corrected Furnace Coke Rate,lbs/NTHM
Coke Rate Difference from the BASE
BASE HIGH ASH TRIAL October 1996 5/28/97 - 6123197
0
264
83.8
35.9
137,000
19.6
.50
.040
.43
7.70
2087
BASE
681
5.0 +8.0
282 -2.0
84.9 -. 9
34.9 -. 8
135,370 +1.7
20.7 -2.8
.49 +l.O
.035 -2.5
.48 -. 8
7.50 +4.0
2012 -8.3
-5.2
874
869
+ 8 Pounds of Coko/MHM
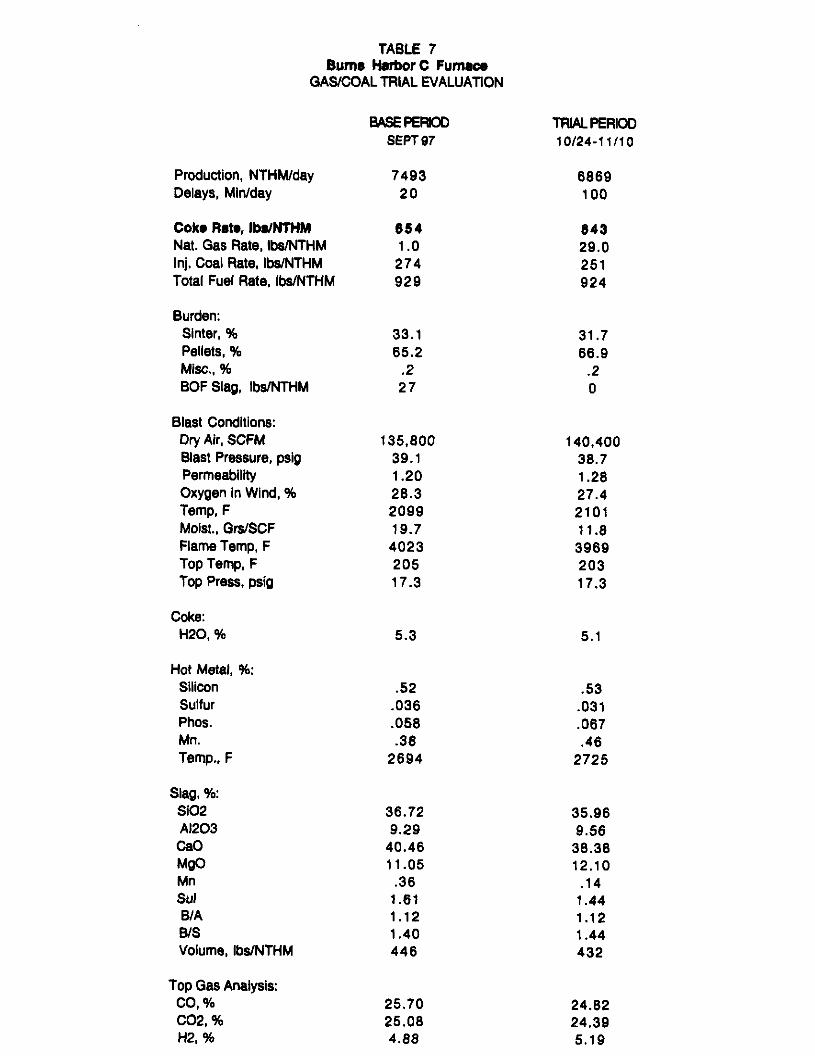
TABLE 7 Bums Narbor C Fumaoa
GAS/COAL TRIAL EVALUATfON
Production, NTHMlday 7493 6669 Delays, Mlnlday 20 100
Coks R&s, IbarNTNM 664 643 Nat. Gas Rate, IbwNTHM 1 .o 29.0 lnj. Coal Rate, lb#NTHM 274 251 Total Fuel Rate, Ibs/NTHM 929 924
Burden: Slnter, % Pellets, % Misc., % BOF Slag, Ibs/NTHM
33.1 65.2
.2 27
31.7 66.9
.2 0
Blast Condltlons: Dry Air, SCFM Blast Pressure, psi0 PermesbilHy Oxygen In Wind, % Temp, F Moist., Grs/SCF Flame Temp. F Top Temp, F Top Press, psig
135.600 140.400 39.1 30.7 1.20 1.26 26.3 27.4 2099 2101 19.7 11.8 4023 3969 205 203 17.3 17.3
coke: H20, % 5.3 5.1
Hot Metal, 96: Silicon Sulfur Phos. Mn. Temp., F
.52 .53 .036 .031 .056 ,067 .36 .46
2694 2725
Slag, %: SlO2 Al203 CaO MQO Mn Sul B/A B/S Volume, Ibs/NTHM
36.72 35.96 9.29 9.56
40.46 36.36 11.05 12.10
.36 .14 1.61 1.44 1.12 1.12 1.40 1.44 446 432
Top Gas Analysis: co, % co2, % H2, %
25.70 24.62 25.06 24.39 4.88 5.1s
B4sEPEFIK)[) lRlALPERloD SEPT 97 10124-11110

i i : i i : i : ; ; i . i : 1 : ; ; I :
ti ;
g P 0 ‘E. E $ E
z w
ii! w d b sl a : : i i i i ; i i ; i : ; .
: E s P E E 5 z 0” t E E e ‘5 5 al ii G 3 L $ z
3 r CJ r
t z <
: : ; i ; : ! ; : i : : i ; i : : ! : . i : ; . i . ; . i . ; : ; : ;
$ ii a
58 3 p”
iii 03
h i 1
; I : : i : ; . : ; i ; : i i : . : i : : : i : j ;
1 z K
E F t s 8
i r
8
1 g P
i i ; i . i i : . : i ; : I . i i i i i i : ; i ;
5 =
i g 6
F $ If!
3 C t? m
3 r
. i
i
i
i
i . i : i : I : i
i
i
;
i
: : i : :
i :
5 E E ‘i
5 E ii
c” = s c 3 8 Q 3 E s

Furnace Coke Rate - Lbs/NTHM
5 5: h ? 5 H i z : is E ii
!
: 5 i 5: g =: 0
WHJ.N/Wl -i=‘C W&I
Furnace Coke Rate - LbUNTHM
3 iii
i? : isi s
0
h b 5 h (D z 2 c
&
/
18 *
6
I
P
s
\
‘18
I
=: :
=: z 0 0 IA7
N
WlUNPql - ISo=) PeWd’Jl

Produotlon-NTHhVday
0 =: =: z Ei z z 0
P 0 z :: 2 :: 5 Q
I
-g
hup/wwt~ti hwa

I@-@ 15 El 3.L l? ‘0 0 sl +t
WOl 4w.w peon w-3 w

1 i 8; /[I :: ;+, ii! 112 J”1 ti

WHlNPql-Iso3 PePdUl

Isd+Jn-d mwa
t
t
.t

- I
I +


Ol/sP 8
2
...................
...................
...................
P .................
unod) eletj u , / ,
r: g K
.i
,L
9 a
4
---in
j.
/ dd ,..... .:.
PQ!Ul l=Q ~14lUOW PQ!Ul 1eoC) ~141uow 8 8
I I * , I I * , O8 O8 E E
-8 -8 Y Y
(WW) SS3N)13IHl


Wmgmod) aw y
I?3 1
+tbH+/ .........................
.........................
.........................
.........................
.........................
........................
1 . . . . . . . ~ . *a 1
..........................
..........................
....................... pi3! .......................... bww s
W!Ul PO=) AlUUOW
F OF
1.. j
z L -
a iij
i
3
6
I I I
-
g 0 .
. . . . . . . . . . . . . . . i . . . . . . . . . . . . . . . . . . . . 8 cu
L 1
~ AL q
. . . . . . . . . . . . . . . . . . . . . . . . . . . . . . . . . . . . . . . . . . . . . . 8 3
aa ill!! ?I
r
. . . . . . . { . . . .._.........__............
aJ
_ -E
. . . . . . . . . . . . . . . . . ;............................. -g
I ’ ’ ’ ’ 0 OE 7
3NXIlHl