Blade Vibratory Stresses in a Multi-Stage Axial-Flow...
45
,t=,t QO t~ r~ MINISTRY OF AVIATION AERONAUTICAL RESEARCH COUNCIL REPORTS AND MEMORANDA R. & M. No. 3181 (19,052, 19,901) A.R.C. Techn;cal Report Blade Vibratory Stresses in a Multi-Stage Axial-Flow Compressor By D. A. ~ KILPATRICK, A. D. S. CARTER and L., O'NEILL i LONDON: HER MAJESTY'S STATIONERY OFFICE I961 PRICE I75. od. NET
-
Upload
truonghanh -
Category
Documents
-
view
217 -
download
0
Transcript of Blade Vibratory Stresses in a Multi-Stage Axial-Flow...
,t=,t QO
t ~
r~
M I N I S T R Y OF A V I A T I O N
AERONAUTICAL RESEARCH COUNCIL
REPORTS AND MEMORANDA
R. & M. No. 3181 (19,052, 19,901)
A.R.C. Techn;cal Report
Blade Vibratory Stresses in a Multi-Stage Axial-Flow Compressor
By D. A. ~ KILPATRICK, A. D. S. CARTER and L., O 'NEILL
i
LONDON: HER MAJESTY'S STATIONERY OFFICE
I961
PRICE I75 . od . N E T
Blade Vibratory Stresses in a Multi-Stage Axial-Flow Compressor
B y D . A . K I L P A T R I C K , A . D . S . CARTER a n d L . O ' N E I L L
COMMUNICATED BY THE DIRECTOR-GENERAL OF SCIENTIFIC RESEARCH (AIR) M I N I S T R Y OF SUPPLY
Reports and Memoranda No. 3z8± *
January, z958
Summary. A detailed investigation of the stresses in the early stator blade rows of an axial-flow compressor, which had previously suffered blade failures during its initial performance tests, is described. These vibration tests show that stall cell excitation is present in the first and second blade rows and causes blade resonances over a fairly wide part-load condition. Resonances of the fundamental flexural modes of first and second row stator blades with the fourth and fifth stall cell harmonics give rise to stress peaks in the region of + 10 to + 20 tons/sq in. The inlet guide row also has a stress peak of about _+ 10 tons/sq in. attributable to excitation associated with the fifth stall cell harmonic.
Away from these resonant conditions stalling flutter (of moderate stress) occurs in the first and second stator row blades over about 30 per cent to 70 per cent design speed range, the compressor design being such that these stages are stalled up to about 80 per cent design speed.
Under the forced vibration conditions, the blade phasing, in a row, is consistent with anti-phase vibration of adjacent blades indicating the effect of mechanical coupling.
Analysis of the initial test conditions indicates agreement between the distribution failures and the number of cycles of high stress probably experienced by the blades.
1. Introduction. Blade failures have been experienced in axial-flow compressors under conditions in which no obvious excitant forces (such as from blade and spider wakes) could be held responsible. Such failures often occurred in the early compressor stages, more particularly at part-load conditions, with moderate to high pressure-ratio designs. A previous report (Ref. 1) has described a strain-gauge
investigation on a National Gas Turbine Establishment axial-flow compressor of about 5:1 design pressure ratio. This compressor had, after comparatively little running, shown blade cracks in the first three stator rows. The majority of these failures were in the second row, and all were consistent with fatigue failure in the fundamental flexural mode of vibration. I t was shown in Ref. 1 that
alternating stresses, of sufficient magnitude to cause blade failures, had been measured and that they occurred at part-load operation when the stages in question were stalled. The stress peaks and frequencies were stated to correspond to the lower (rotor speed) forcing orders.
The results of cascade investigations (Refs. 2 and 3) into self-excited forms of blade vibration
had also shown that under stalling conditions in particular, very high alternating stresses could
occur. Application of these results in a semi-theoretical study of some typical, though hypothetical,
compressor designs has previously been made and this confirms that stalling flutter could be
Part I.--N.G.T.E. Report R.201, received 18th February, 1957. Part II.-.-N.G.T.E. Report R.221, received 19th February, 1958.

experienced in such compressors at part-load conditions. Comparison has also been made in this
study of the limited compressor results of Ref. 1 and these semi-theoretical examples; this indicated
that the vibration measured could have been stalling flutter. Consequently, a more detailed
investigation of the blade vibration characteristics of this compressor was carried out over the operating
range which the previous tests had shown to be most dangerous, and is described in this report .
The investigation concentrated on the first and second stator rows, the stresses in several blades
of each, and of one blade in the inlet guide row, being recorded. A detailed survey of the chosen
part-load operating range was made and stress distributions and blade vibration frequencies
obtained. The initial blade failures are analysed in the light of the probable source of the high stress
excitations.
2. Description of Rig. The axial-flow compressor (known by the serial reference number 118) was driven for these tests by a four-stage experimental turbine (reference number 119), Fig. 1 illustrates the test installation, and it will be seen that the test compressor was fitted with a volute air intake, open direct to atmosphere. The turbine's combustion system is supplied with a i r b y an independent (plant) compressor.
2.1. Compressor Design. A summary of the salient features of the N.G.T.E. 118 Compressor is given below:
Mass flow
Stage temperature rise Number of stages Overall temperature rise
Polytropic efficiency . Adiabatic efficiency .
Pressure ratio .
Design speed
Mean gJK~A Ts/½u 2
70 lb/sec 26.3 deg C 8 210 deg C
88 per cent 84 per cent
5.3
9,000 r.p.m.
0-65
All the blades are of C4 profile on a circular-arc (C50) camber-line and are of constant-reaction
design; the stator blades were manufactured in cast H.R. Crown Max and the rotor blades in east
¥itallium. It might be of interest to note here that the blades were designed assuming a constant
axial velocity and neglecting any radial equilibrium effects. At any radius the blade section of the
rotor and stator of a stage are identical. Some details of the first two stator rows' blading follow:
Blade height Camber ~ . Stagger * . Pitch/chord ratio * Root chord Root thickness/chord ratio Air outlet angle * Height/thickness ratio Design gas bending stress .
First stator Second stator
4.3 in. 26 deg
- 38 deg 0.85 1.21 in.
11 per cent 31.9 deg 32
5.2 tons/sq in.
3-7 in. 27.8 deg
- 37- 2 deg 0-79 1- 22 in.
10-1 per cent 30-2 deg 3O 4-65 tons/sq in.
At mean diameter.

2.2. Compressor History. Four series of tests, prior to those of this report, have been performed
with the compressor. Series I, II and III comprised the initial mechanical and aerodynamic testing
of the compressor, and it was during the ensuing inspection strip that blades in the first three stator
rows were found to be cracked. These failures numbered 1 in the first row, 22 in the second, and 4 in
the third row, the location and form of the cracks being consistent with fatigue in the fundamental
flexural mode. The strain-gauge tests (Series IV) reported in Ref. 1 were done with complete
replacement of the second-row stator blades and 12 new blades in each of the first and third stator
rows. Especial care had been taken to reproduce the original profiles and to ensure sound blade material.
Upon the conclusion of the Series IV tests, a rotor modification was carried out and the com-
pressor rebuilt with the same blading in both the rotor and stator rows. About 6 or 7 blades in each of the inlet guide vane, first and second stator rows were strain-gauged, and Fig. 2 shows the compressor during rebuild.
3. Instrumentation. 3.1. Strain Gauges. All the gauges used were British Thermostat Type SE/A2, resistance 200 ~2, and were affixed using a nitro-cellulose cement. The lead-out wires,
consisting of 4/0. 006 in. diameter conductors (cotton covered and lacquered), were soldered to the
gauge leads and passed out through holes in the blade roots. Thence they were taken via a shallow
channel between blade root and casing to emerge through small holes in the casing, one hole per
stage per half-casing (Fig. 2). Care was taken to secure and protect the lead-out wires as well as possible, using small clips and cold-setting adhesive.
3.2. Amplifiers. Two different types of amplifiers were used, the first being based, in a modified
form, on the A.E.R.E. Type 1008 amplifier. Six such amplifier channels were' available, each
comprising a mainamplifier (voltage gain 60,000), power panel, and head amplifier (voltage gain 50).
Two main amplifiers are mounted on one 19 in. panel and share a common power-supply, panel.
The head amplifiers, together with their gauge selection and D.c. polarising supply units were located
near to the compressor, while the remaining amplifying and recording equipment was housed outside the test house in a mobile trailer caravan.
The second type of amplifier channel, of which two were used, is a commercially available unit
made by Southern Instruments, Ltd., and having an overall maximum voltage gain of 4 x 10⁵. The complete amplifier, D.c. polarising supply, gauge selection and calibration units were mounted
in two adjacent cases and direct connections made to the strain-gauge lead terminals at the compressor.
3.3. Recording Equipment. Two cathode-ray tube units, one 6-channel the other a 3-channel unit, were each fitted with continuous moving-film cameras; a 70 mm camera for the 6-channel unit and a 35 mm camera for the 3-channel unit. Both cameras were capable of a maximum film speed
of about 80 in./sec, but for these tests were set to run at about 40 in./sec. Five of the modified 'A.E.R.E. type' amplifiers were connected to the Y plates of the cathode-ray tubes in the 6-channel unit, while the two Southern Instruments channels were connected to the 3-channel cathode-ray tube unit. The remaining tube in each unit was connected to a common time-marking (1,000 pulses
per second) and compressor revolution marking (1 pulse per 4 revolutions) amplifier unit. Visual monitoring of all these recording cathode-ray tubes was available between actual exposures, the
necessary time-base (X) sweep being automatically removed during exposure. Initially during the
3 (80624) A*

tests the 6-channel continuous moving-film camera unit was paralleled by a 6-channel high-speed-
drum camera unit, so that high-speed as well as low-speed film records could be obtained. The drum
camera was capable of operating up to about 1,500 in./sec and was actually used in these tests at
about 600 in./sec. Due to the mainly low-frequency nature of the recorded vibration waveforms,
such high-speed, limited-length (30 in.) exposures were considered to be unrepresentative, and the use of the drum camera unit was discontinued.
In addition to the above strain-recording equipment, a single-channel tape recorder was also
used for the constant-speed tests. This was a standard commercial instrument, an E.M.I. Type
T.R.50A, and was connected to the pre-amplifier output of one of the Southern Instruments
strain-gauge channels. Thus the vibration of one blade was recorded both on film and on magnetic tape.
The various pressure, temperature and speed indicators necessary for the subsequent aerodynamic analysis of the compressor condition, were grouped in an illuminated instrument panel. This panel
was photographed by a modified Type F24 camera (negative size approximately 5 in. x 5 in.), the exposure operation being synchronised electrically with the exposure of the other recording cameras and tape recorder.
4. Description of Tests. As indicated in Section 1, the scope of these tests was purposely restricted to cover those compressor conditions which the earlier tests had shown to produce significant stresses, at least in the first two stator rows. The range of test conditions is shown in Fig. 3, along with the full compressor characteristics obtained in the compressor performance tests, from which it will be seen that most of the tests consisted of (nominally) constant-speed characteristics with two additional constant-throttle characteristics. In addition to the characteristics shown in Fig. 3 several other characteristics and isolated points were recorded in the range 6,500 to 7,250 r.p.m.
The full list of test' conditions, including gauge selections, is tabulated below. The blade numbering
convention is based on its location in the top or bottom halves of the stator casing (see, for example, Fig. 19).
Tests
1 + 5 6 + 11
12+ 14 15+ 17
18 19, 20
21 22, 23
24 25 -->- 28
Condition (r.p.m.) "~
5,000, 5,500, 6,000, 6,400, 6,700 6,500, 6,700, 6,850, 6,850, 6,900, 7,000 . 6,200, 6,700, 6,750 t 7,250, 6,400, 6,600-~ 5,500+ 7,250+ 6,000 (acceleration then deceleration) 4,000, 7,000 7,000 6,400, '6,600 ' . 4,400-)- 6,200 (acceleration, constant throttle) 4,000, 5,000, 6,000, 6,400 (surge points only)
Gauge selection number
70 mm 35 mm camera camera
1 2 1 2 1 2 1 1 1 1 1 1 1 2 1 1 1 1 1 1 I
Tape recorder
1
]Vots$ e Unless otherwise stated the r.p.m, conditions relate to a group of 3/4 points along the constant speed
characteristics. ]- Due to a camera fault, some of these aerodynamic measurements were lost:
4
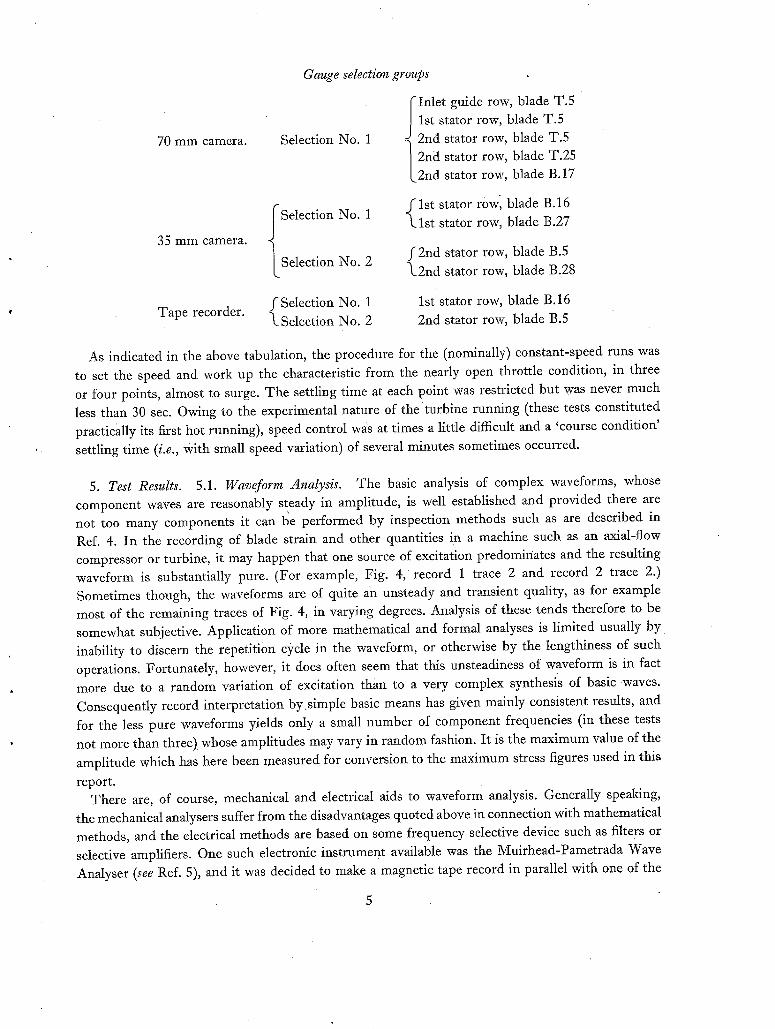
70 mm camera.
35 mm camera.
Selection No. 1
I Selection No. 1
~Selection No. 2
Gauge selection groups
I Inlet guide row, blade T.5 ]st stator row, blade T.5 2nd stator row, blade T.5 2nd stator row, blade T.25 2nd stator rou,,~T blade B.17
( l s t stator row, blade B.16 L l s t stator row, blade B.27
2nd stator row, blade B.5
2nd stator row, blade B.28
fSelection No. 1 Tape recorder. ) . Selection No. 2
1st stator row, blade B.16 2nd stator row, blade B.5
As indicated in the above tabulation, the procedure for the (nominally) constant-speed runs was to set the speed and work up the characteristic from the nearly open throttle condition, in three
or four points, almost to surge. The settling time at each point was restricted but was never much less than 30 sec. Owing to the experimental nature of the turbine running (these tests constituted practically its first hot running), speed control was at times a little difficuk and a 'course condition'
settling time (i.e., With small speed variation) of several minutes sometimes occurred.
5. Test Results. 5.1. Waveform Analysis. The basic analysis of complex waveforms, whose component waves are reasonably steady in amplitude, is well established and provided there are not too many components it can be performed by inspection methods such as are described in Ref. 4. In the recording of blade strain and other quantities in a machine such as an axial-flow compressor or turbine, it may happen that one source of excitation predominates and the resulting waveform is substantially pure. (For example, Fig. 4, record 1 trace 2 and record 2 trace 2.) Sometimes though, the waveforms are of quite an unsteady and transient quality, as for example most of the remaining traces of Fig. 4, in varying degrees. Analysis of these tends therefore to be somewhat subjective. Application of more mathematical and formal analyses is limited usually b y inability to discern the repetition cycle in the waveform, or otherwise by the lengthiness of such operations. Fortunately, however, it does often seem that this unsteadiness of waveform is in fact more due to a random variation of excitation than to a very complex synthesis of basic waves.
Consequently record interpretation by.simple basic means has given mainly consistent results, and
for the less pure waveforms yields only a small number of component frequencies (in these tests
not more than three), whose amplitudes may vary in random fashion. It is the maximum value of the amplitude which has here been measured for conversion to the maximum stress figures used in this
report. There are, of course, mechanical and electrical aids to waveform analysis. Generally speaking,
the mechanical analysers suffer from the disadvantages quoted above in connection with mathematical methods, and the electrical methods are based on some frequency selective device such as filters or
selective amplifiers. One such electronic instrument available was the Muirhead-Pametrada Wave Analyser (see Ref. 5), and it was decided to make a magnetic tape record in parallel with one of the
film record channels ~(Section 3.3), for subsequent replay and analysis using this instrument.
Comparison of the frequency analyses of tape and film is made in detail in Section 5.3, but it can be said here that they correlate exceedingly well. As might be expected the wave analyser measured more component frequencies than the visual inspection; most of them were of very low amplitude,
however. As far as amplitude correlation is concerned this is more difficult because the wave analyser gives only mean amplitudes and is normally not fully responsive to transient peak amplitudes.
5.2. Stress Characteristics. The conversion of the recorded signal waveform amplitudes into alternating stresses was done by the usual straightforward method assuming purely tensile strain
and a constant strain-gauge factor (viz., that quoted by the manufacturer). No correction was made
for gauge position, all the stresses quoted being those measured at the gauge position. The centre
of the gauge was 0.2 in. from the root platform, and a correction factor to give the maximum stress at the root (fundamental flexure) would be approximately 1.1 in this case.
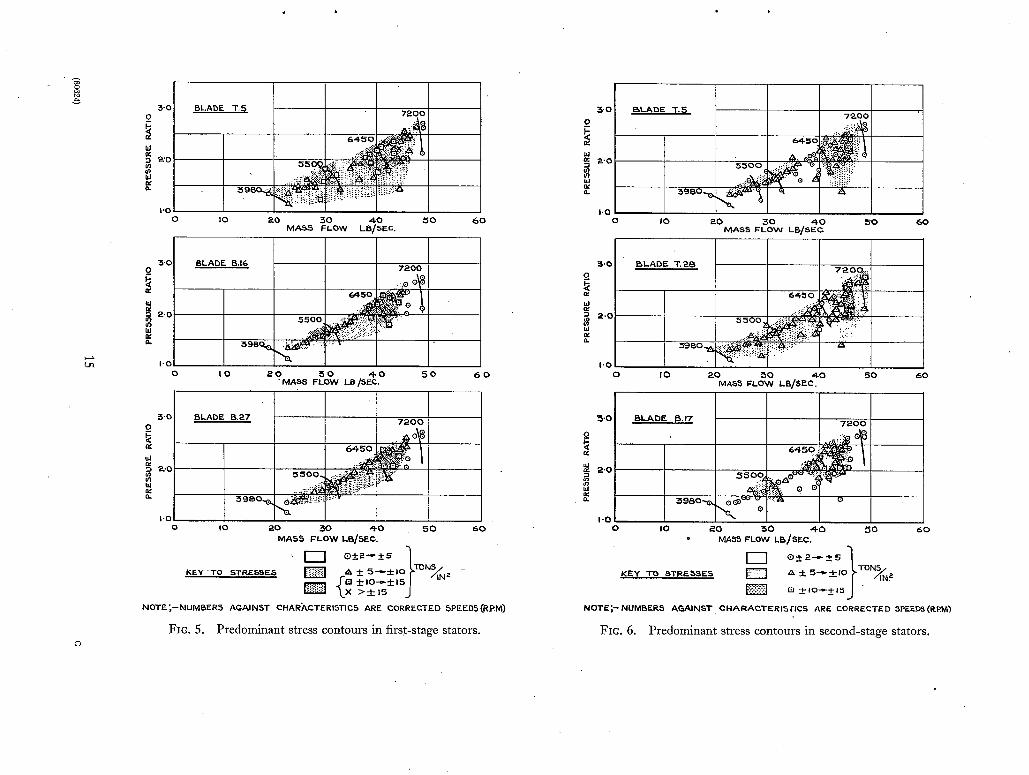
Simple plots of stress against mass flow for (nominally) constant-speed conditions are not particularly significant: in addition, some of them are complicated by a speed variation. A much
clearer view of conditions is obtained by superimposing the stress values, using distinctive symbols
for arbitrary ranges of stress level (e.g., + 2--~ + 5 tons/sq in.), onto the familiar pressure-ratio/
mass-flow compressor-characteristics diagrams. Fig. 5 shows such diagrams for the three blades
studied in the first stator row. Less points were available for the lower two diagrams on account of
the gauge selection which was carried out (see Section 4). The stress contour diagrams for the second stator row blades are shown in Figs. 6 and 7. Only one inlet guide blade was studied and its contours
are included in Fig. 8. It will be noted from these diagrams that the regions of moderate stress for the first and second stator row blades, say + 5 tons/sq in. upwards, are located roughly between
4,000 and 7,000 r.p.m, and extend to the surge line over most of the flow range between these
speeds. Comparison with the full performance curves of Fig. 3 shows that these significant stress
regions (which are more extensive and continuous for the first than for the second stator rows) occur just below the 'kink' in the surge line. Inner zones of higher stress, up to + 20 tons/sq in. in
some cases, also occur, there being two such zones for the first stator row blades but only one for the majority of the blades in the second stator row. In the case of the inlet guide blade the general stress level is much lower; a localised high-stress zone does, however, occur just below 6,500 r.p.m.
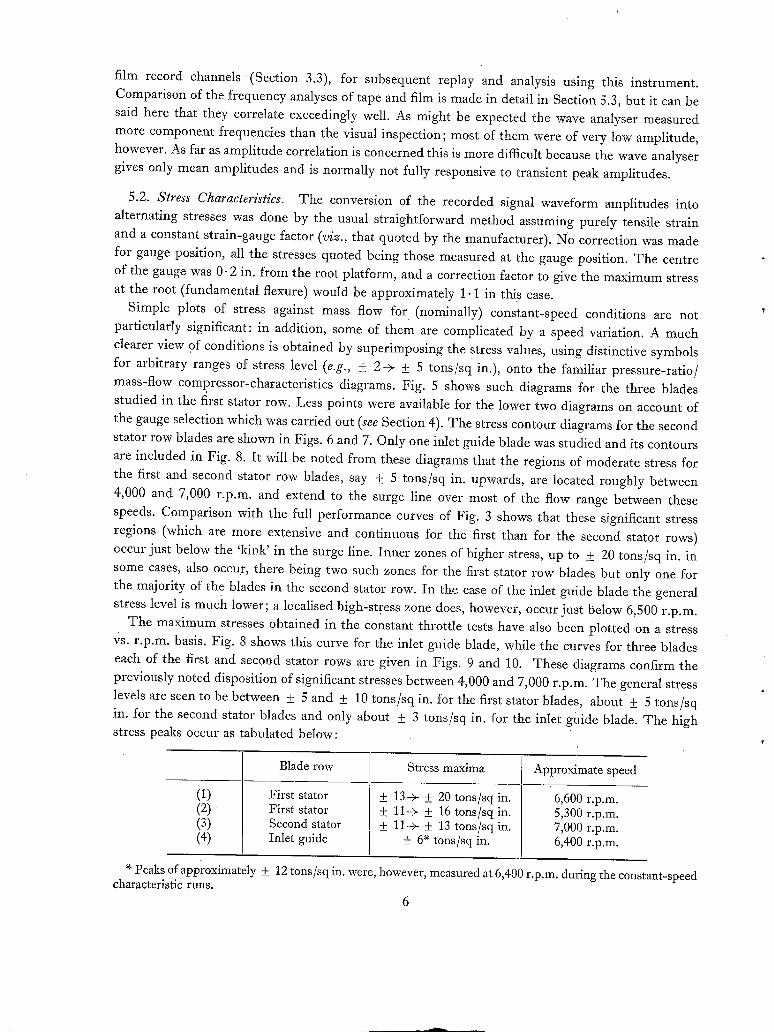
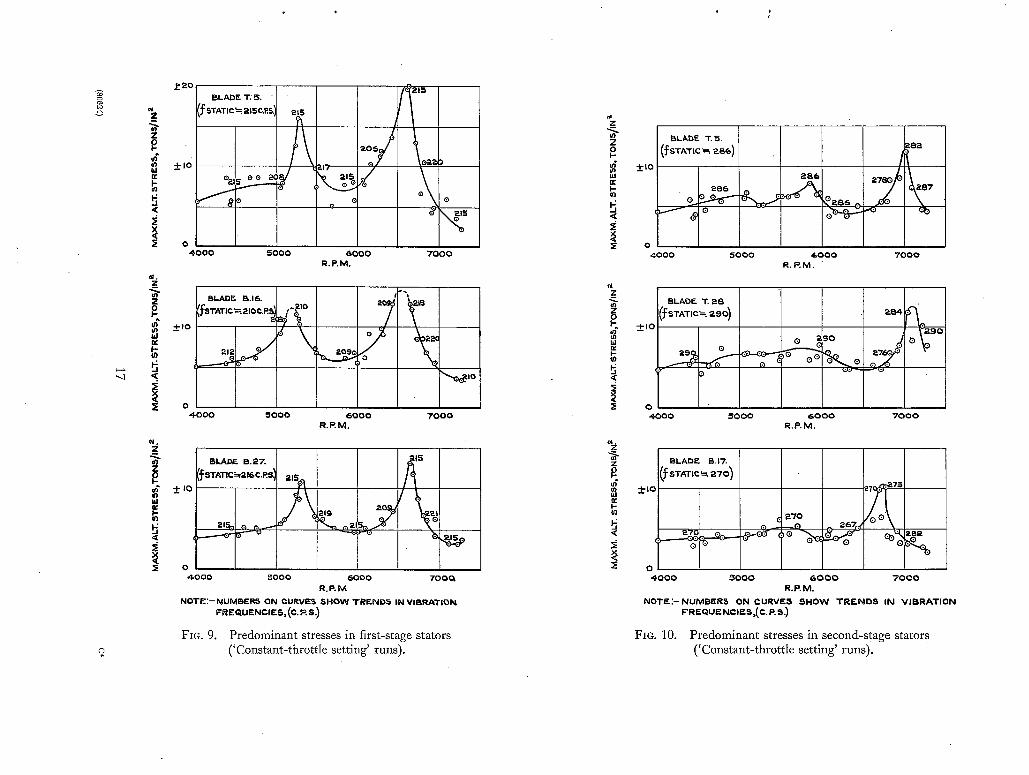
The maximum stresses obtained in the constant throttle tests have also been plotted on a stress
vs. r.p.m, basis. Fig. 8 shows this curve for the inlet guide blade, while the curves for three blades each of the first and second stator rows are given in Figs. 9 and 10. These diagrams confirm the previously noted disposition of significant stresses between 4,000 and 7,000 r.p.m. The general stress
levels are seen to be between + 5 and + 10 tons/sq in. for the first stator blades, about + 5 tons/sq in. for the second stator blades and only about + 3 tons/sq in. for the inlet guide blade. The high stress peaks occur as tabulated below:
(1) (2) (3) (4)
Blade row Stress maxima Approximate speed
First stator First stator Second stator Inlet guide
+ 13->- _+ 20 tons/sq in. _+ 11-> _+ 16 tons/sq in. +_ 11->- _+ 13 tons/sq in.
_+ 6* tons/sq in.
6,600 r.p.m. 5,300 r.p.m. 7,000 r.p.m. 6,400 r.p.m.
e Peaks of approximately + 12 tons/sq in. were, however, measured at 6,400 r.p.m, during the constant-speed characteristic runs.
6

The peaks in the groups (1), (2) and (3) above, do not occur at precisely the same r.p.m, for each blade, but are of the same frequency order. Consideration of blade frequencies and their trends is
made in Section 5.3. All the stresses described hitherto are fundamental bending-mode stresses but in addition to these
comparatively low frequencies one other higher frequency was in general detectable on each blade. This represented a much lower stress level, however, as shown in Fig. 11 where the amplitude is plotted against rotor speed. The only significant stress variation would seem to be a reduction
coincident with high stresses in the fundamental flexural mode.
5.3. Frequency Characteristics. It will be convenient to consider first the case of the high-
frequency components, whose (low) stress amplitudes have been plotted in Fig. 11. These measured
frequencies were constant for each blade throughout the test range and they are tabulated below for comparison with the fundamental torsional (T.1) and the first overtone flexural (F.2) frequencies as
subsequently measured on one blade from each row.
Blades Inlet guide First stator Second stator
Measured frequencies (c.p.s.)
T.1 (c.p.s.) .
F.2 (c.p.s.) .
1,110
1,413
1,140
1,050, 1,050, 1,080
1,335
1,092
1,480, 1,490, 1,430, 1,430, 1,480
1,553
1~493
From this it is clear that the measured higher mode vibration is in the first overtone flexural mode
in all cases. The majority of the waveform analysis as discussed in Section 5.1 was performed by the con-
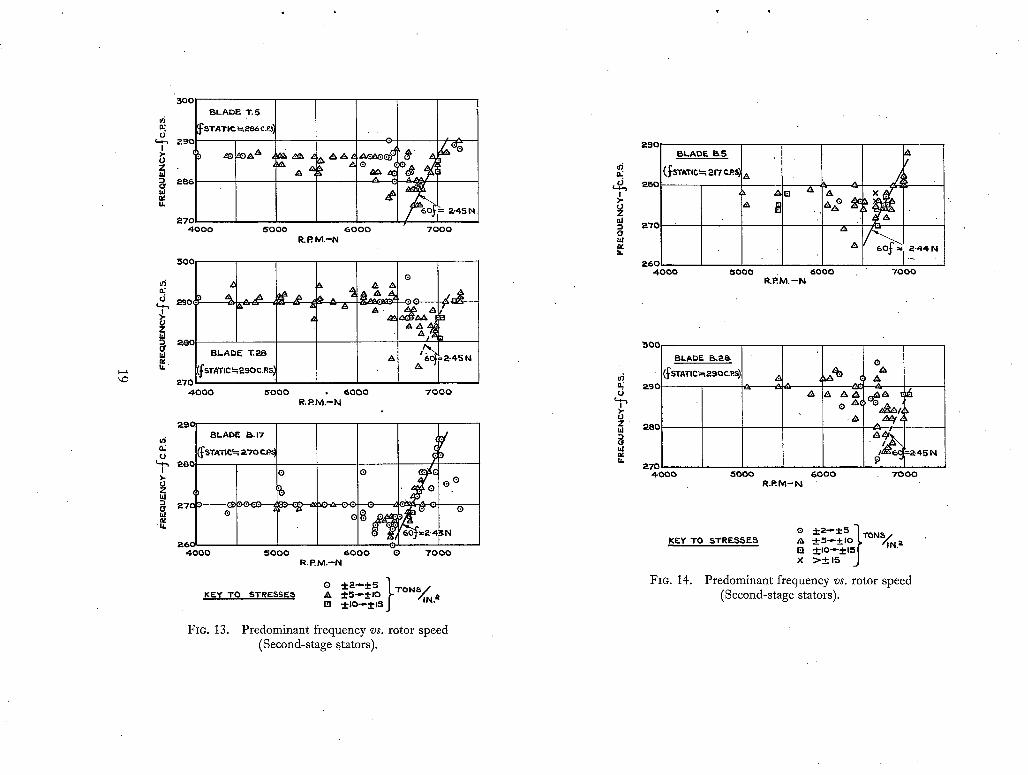
ventional visual inspection methods (e.g., Ref. 4). Excluding the higher flexural mode stresses, at the inost only two component frequencies were occasionally detectable on the inletguide and second stator row blades, one component greatly predominating. These predominant frequencies are plotted (against r.p.m.) for first stator row blades in Fig. 12, for second stator blades in Figs. 13 and 14, and for an inlet guide blade in Fig. 15. The points are plotted regardless of their position on the
pressure-ratio/mass-flow characteristics; they are thus an aggregate of all the available test blade
frequency measurements. Over most of the speed range it will be observed that the blades are vibrating at their natural
fundamental flexural frequencies (the actual 'scatter' is small and probably within experimental
and analytical limits). For part of the speed range, however, the frequency of vibration increases
approximately linearly with speed, thus indicating a forced vibration. Comparison of Figs. 9 and 12, 10 and 13 respectively shows that the extent of these forced frequency conditions coincides with that of the high stress peaks, the actual peak occurring when the blade forced frequency equals its
/foreed frequeney, o.p.s.~ is seen to be approximately natural frequency. The order of the forcing, i.e., ~ rotor speed, r.p.s. ] l" 94 for the higher stress peaks of the first stage stator blades and 2.45 for their lower stress peaks, as well as for the main stress peaks of the inlet guide and second stator row blades. It will be noted that these two orders are very nearly in the ratio of 4:5 (1.94 = 4 x 0.485 and 2.45 = 5 x 0.49). Thus we can explain every major stress peak recorded in terms of a resonance of the blade
7

fundamental flexural mode with harmonics of a forcing excitation of frequency 48 --> 49 per cent of rotor speed. The fourth harmonic, on this hypothesis, is responsible for the first stator blade major stress peaks, and the fifth harmonic for the stress peaks of the second stator and inlet guide row blades and for the minor stress peaks of the first stators. In addition a minor, in some cases barely perceptible, peak for the second stator blades in the region of 5,500 r.p.m. (Figs. 6, 7 and 10) is probably attributable to the sixth harmonic of this forcing excitation.
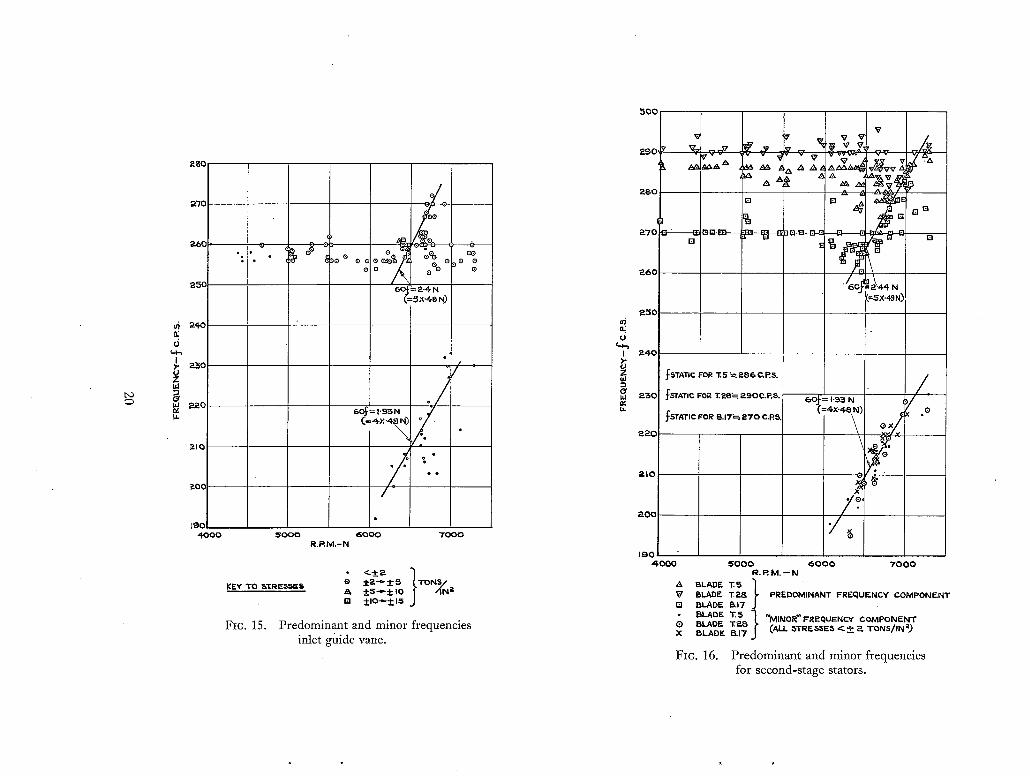
Further evidence relating to the origin of these stress peaks is to be seen in the minor component frequencies (with stresses < + 2 tons/sq in.) as detected in the inlet guide and second stat0r row blade records and plotted in Figs. 15 and 16. From these it is seen that, around the stress peak, there is present a minor forcing frequency component consistent with excitation by the fourth harmonic of a 0.48 ÷ 0.49 rotor speed order, the main forcing frequency component being the fifth harmonic.
Frequency analysis of the limited number of magnetic tape records by the electronic wave analyser (Section 5.1) is even more revealing. The results are plotted in Fig. 17 and, for the speed range covering the 6,600 r.p.m, stress peak (Fig. 9), show definite third, fourth and eighth harmonics and probable fifth and sixth harmonics of 0.48 rotor speed order for the first stator blade. The 'analysis by inspection' described above had produced only the main component, the fourth
harmonic. Sufficient tape-recorded points were not available to cover the lower speed stress peak (5,300 r.p.m.) for this blade, but the two records taken nearby indicate the presence of the fourth harmonic forcing component, the main component at that peak being the fifth harmonic. For the second stator row blade, within the speed range covering its 6,700 r.p.m, stress peak (Fig. 7), the wave analyser produced definite third and eighth harmonics and probable sixth and seventh
harmonics, in addition to the fourth and fifth (major) harmonics already obtained from the film records.
6. Discussion of Results. As shown in Section 5 the stresses measured in the first stator row (3 blades) and in the second stator row (5 blades) are characterised by two main features. These stresses consist of a generally quite extensive region of moderate stress within which occur h igher stress peaks, two peaks (per blade) for the first row but only one peak for most of the second row blades (Figs~ 5, 6 and 7). The one inlet guide row blade recorded also shows ~/high stress peak similarly located, but the general stress level is much lower and seems in the main to increase slowly with increasing speed (Fig. 8).
The stage characteristics obtained during these tests are shown in Fig. 18 for the first and second stages only: owing to the much reduced settling times employed there is considerable scatter of points. It will be noted, however, that over the speed range of the tests both these stages are stalled and this would thus support the view that the blade vibration (of moderate stress) at the blade natural frequency is in fact stalling flutter. The inlet guide vane of course is not stalled and thus the much lower general stresses (maximum + 3 tons/sq in.) are attributed mainly to random excitation effects such as buffeting.
The nature of the stress peaks on inlet guide, first stator and second stator row blades has been shown in Section 5.3 to be consistent with forced vibration, and consideration of their frequency orders as well as of minor frequency components, indicates that the forcing is due to harmonics of a basic excitation whose frequency is 48 + 49 per cent of the rotor speed. Resonation with the fourth and fifth harmonics produces the major stress peaks in the first stators, while the fifth harmonic produces the major peak in the second stator and inlet guide row blades. Such a forcing cannot be
attributed to any normal interference effects (which have integral rotor-speed orders) but is almost undoubtedly due to stall cell excitation, probably one cell rotating at 48 + 49 per cent rotor speed.
The original aerodynamic test results show that the first and second stages are stalled for a large
part of the speed range, peak pressure rises being reached at surge at about 8,500 r.p.m, for the first stage and about 7,500 r.p.m, for the second stage. These are only approximate figures on account of
the test-points scatter. Tests on cascades and on a single-stage compressor (Ref. 6) have indicated that as Va/U is reduced below the peak pressure rise point the onset of stalling flutter stress of signifi-
cant amplitude occurs at a Va/U of about 15 + 20 per cent below that for peak pressure rise. Experiments have also indicated that where stall cells are generated they too reach sizeable proportions at about the same conditions. The tests of this report show that the stresses are beginning
to drop at the upper test speed limit of 7,250 r.p.m, as shown, for example, in Figs. 9 and 10. It would thus appear probable, from these factors, that no significant 'flutter' stresses will appear much above 7,500 r.p.m. Stall cells may, however, persist, with much reduced intensity, at higher speeds
and give rise to resonances. The possibility arises in the case of this compressor by virtue of the neglect of radial equilibrium in the design. Simple radial equilibrium calculations show that the tip of the rotor would be stalled even at design speed, and there is some aerodynamic evidence to show that this is actually occurring. It is doubtful though whether any stall cells would have sufficient intensity to cause appreciable stresses in the first stator row, where the third harmonic would be in resonance from about 8,600 r.p.m. ÷ 9,600 r.p.m, or in the second stator row (fourth
harmonic in resonance from 8,500 r.p.m, to 9,375 r.p.m.). There might perhaps be a further important peak for the inlet guide row blade at about 8,000 r.p.m. (for a resonance with the fourth
harmonic of the stall cell). Upon the basis of ~in excitation rotating around the compressor annulus, one might expect that
at or near a resonance condition for the blades in the row, there would be phasing of the blades'
movement consistent with the rotating forcing. Such does not, however, appear to be the case. Fig. 19 reproduces simultaneous extracts from the two camera records of a condition where one of the
five second stator row blades recorded (B.17) is in resonance with the fifth stall cell harmonic at about 6,700 r.p.m. It will be noted that all the other recorded second row blades are vibrating at the same frequency, and that those 'farthest' from their natural frequencies have the lowest and least sustained stress amplitude. The phasing of the stresses is not, however, 'staggered' in a manner appropriate to the blades' location in the annulus, but the blade movements are in fact very nearly either in phase or in anti-phase to one another. Consideration of the (recorded) blades' location shows that just such a condition as recorded would exist if adjacent blades vibrated in anti-phase; other records (near resonance) confirm this both for the first and second stator rows. This would suggest that in these tests coupling between the blades, probably mechanical, via the roots, determines the phasing. The exact mechanism of a blade resonating with a stall cell (or its harmonic) is not at all deaf, but it is improbable that the cell presents a clearly defined forcing impulse to the blade. It seems more likely that the 'front' is more diffuse, especially if the time for the cell to pass a particular blade approaches or exceeds the time for a cycle of blade vibration, in which case any more 'precise' forcing of the same frequency (such as by root coupling from other vibrating blades) might be expected to control the phase. It could happen that the blade most close to resonance would dictate the phasing and would in fact itself be 'properly' phased with the stall cell.
As far as conditions of moderate stress, away from stress peaks, are concerned, in which the blades vibrate at their natural frequencies, the amplitude distribution was mostly random: it was sometimes
possible to discern a sustained amplitude modulation at the stall cell frequency, but not often. It is assumed that the blades are fluttering within the stall cell and that the aerodynamic damping away from the cell, if not actually negative, is very low. The shape of the stress curves of Figs. 9 and 10 supports this, the high off-resonance stresses and the breadth of the resonance peaks indicating very low damping. By comparison the stress curve for the inlet guide row blade (Fig. 8) shows the more typical characteristics of a resonant forced vibration with positive damping. Stalling conditions do not exist in the inlet guide row and this stress peak is a resonance with the forcing pressure disturbance induced by the stall cell in the adjoining stage.
The co-existence of flutter and stall cell forcing away from resonance conditions will be noted. A good example is seen in Fig. 17, where the second stator row blade is fluttering at its natural frequency, at 6,200 r.p.m., and has also components of forced vibration due to the fourth and eighth harmonics of the stall cell.
7. Assessment of Compressor Failure. The stator blade failures discovered after the initial performance tests (Section 2.1) were concentrated in the second stator row and were consistent with fatigue in the fundamental flexural mode of vibration (22 blades were cracked in the second row, 1 in the first and 4 in the third row). No rotor blade defects were detected (the rotor blade material, Vitallium, has a much higher fatigue strength than that of the stator blades).
The breakdown of compressor running times, prior to the discovery of these failures, is shown in Fig. 20c, up to 8,000 r.p.m. An additional 2 hours running was done between 8,000 and 9,000 r.p.m, No information is available on the actual blade frequencies appropriate to this original build, but as stated previously especial care was taken to make the replacement blades as nearly as possible the same as the original ones. After the tests reported here were concluded, tile natural frequencies of the first and second stator row blades were measured whilst still mounted in the casing. Their frequency distribution is plotted in Fig. 20a and their resonances with the harmonics of 0.48-order rotor speed, within the test range, in Fig. 20b. The measured stresses produced by the resonance of the sixth stall cell harmonic and the second stator row blades have been shown to be only slight in most cases, but this resonance distribution is included in the Figure for the sake of completeness. All the other 'harmonic resonances' have produced measured stresses in excess of + 10 tons/sq in., especially in the first stator row. Comparison of the distributions of running times and stall cell resonances shows that 'continuous' excitation of the high stress peak in some of the second stators occurs at the speed settings of 7,000 r.p.m, and 7,500 r.p.m. (totalling 130 minutes running) while excitation of the high stress peak in the first stator blades occurs only at the 7,000 r.p.m, condition
(57 minutes running). Thus many more cycles of high stress would have been performed by the second row than by the first row blades, on this basis. The minimum fatigue strength of cast H.R. Crown Max is often quoted as _+ 10 tons/sq in. and in any case will not much exceed + 15 tons/sq in., both figures being for 107 cycles to failure. Considering the gas bending stress conditions for the blades (Section 2.1) in addition to the alternating stresses measured it is obvious that considerably less than 107 cycles would be necessary for failure under the high stress conditions, and that the actual running times for these conditions were of the necessary order for failure. The preponderance of second row stator blade failures is, of course, accounted for by the greater number of high stress cycles which these blades would have undergone.
No vibration measurements were taken on the third stator row blades, but some sort of estimate can be made of the conditions applying. It is known that this stage is also stalled over a fair range of
10

speed, so that stall cells may well be present, or if they are not, pressure effects from the cells in the
earlier stages would probably be present. Thus blade resonances with associated significant stresses could arise. An average figure (from a batch of three blades tested) for the fundamental flexural frequency is 365 c.p.s ~. Such a blade would resonate at 7,600, 6,515 and 5,800 r.p.m, with the sixth,
seventh and eightt~ harmonics respectively of'a 0.48 rotor speed stall cell excitation. Allowing for scatter in the blade frequencies it is seen from Fig. 19c that the constant-speed condition of 6,000 and 7,500 r.p.m, might be resonance conditions for some of the third stator row blades, thus providing
an explanation of the failures actually experienced.
8. Conclusions. A detailed investigation of the stresses in the early stator stages of the N.G.T.E. No. 118 Compressor has been made, in order to ascertain the cause of the blade failures suffered during the initial compressor performance tests. The main results and conclusions can be
summarised as follows: J
(1) Moderate levels of stalling flutter stress, over a wide portion of the part-load speed range,
are found in both first and second stator row blades.
(2) Superimposed on the above are forced vibration stress peaks which are consistent with
excitation by the harmonics of one stall cell rotating at ,48 ->- 49 per cent rotor speed.
(3) These stress peaks for the first stator blades are in the + 10 + + 20 tons/sq in. maximum alternating stress range and are due to blade resonances with the fourth and fifth harmonics of the stall cell frequency, while for the second stator row blades the fifth harmonic produces
stress peaks in the + 1 0 + + 15 tons/sq in. range.
(4) The effects of the rotating stall cell extend to the inlet guide row where a 'sharply tuned' stress peak of + 12 tons/sq in. (due to the fifth stall cell harmonic) was measured.
• (5) For the forced vibration conditions, the blade phasing (in a row) is consistent with anti-phase
vibration of adjacent blades, indicating the effect of mechanical coupling.
(6) Analysis of running times on the initial performance tests indicates agreement with the distribution of blade failures and the number of cycles of high stress probably experienced
by the blades.
(7) The advantages of simultaneously recording from a number of blades in the same row, preferably with a wide scatter of natural frequencies, is illustrated. The superiority of frequency analysis by wave analyser instruments over that by 'visual inspection' is also demonstrated, especially when handling a fair number of records with complex waveforms.
Acknowledgements. The authors are indebted for the assistance rendered during these tests by
the Component Test Section and in particular by Mr. F. Burnett.
11
No. Author
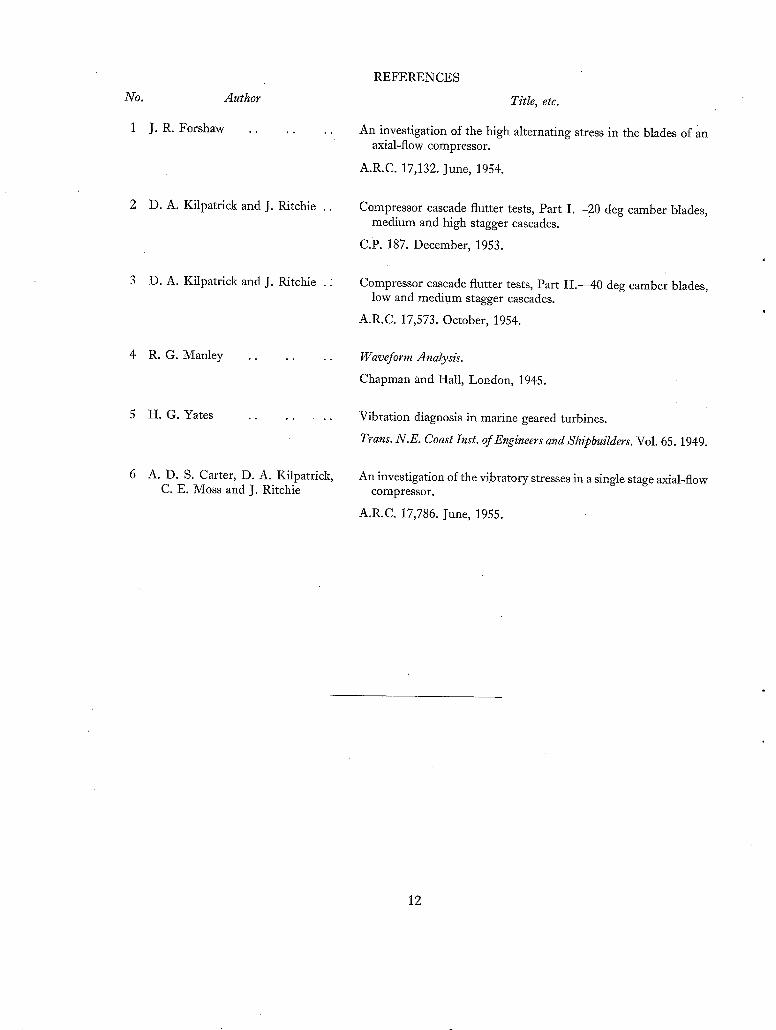
1 J .R. Forshaw ..
2 D.A. Kilpatrick and J. Ritchie ..
3 D.A. Kilpatrick and J. Ritchie . :
4 R .G. Manley . . . . . .
5 H . G . Yates . . . . . . .
A. D. S. Carter, D. A. Kilpatrick, C. E. Moss and J. Ritchie
REFERENCES
Title, etc.
An investigation of the high alternating stress in the blades of an axial-flow compressor.
A.R.C. 17,132. June, 1954.
Compressor cascade flutter tests, Part 1.--20 deg camber blades, medium and high stagger cascades.
C.P. 187. December, 1953.
Compressor cascade flutter tests, Part II.--40 deg camber blades, low and medium stagger cascades.
A.R.C. 17,573. October, 1954.
Waveform Analysis.
Chapman and Hall, London, 1945.
Vibration diagnosis in marine geared turbines.
Trans. N.E. Coast Inst. of Engineers and Shipbuilders. Vol. 65. 1949.
An investigation of the vibratory stresses in a single stage axial-flow compressor.
A.R.C. 17,786. June, 1955.
12

EXHAUST T 0 ATMOSPHERE
PLATE
C~PB~-~SF-.D AIR F'ROM PLANT C O M ~ O f ~ HOUSE
INTAKE fROM ATMO~I-IERE COMSUSTO~I
\~ 1 SYST£M
N~ ,.8 c o . p ~ s s o R ' "~.oJ,s.u~..~
I ~ I A H ~ / u~'T ~, ~ /
L ~nc vJr.w J P L A N r "#
FIG. 1. No. 118 Compressor test installation (Diagrammatic).
~I-IAUST TO ATMOSPHE'm~
$
PLAN
View, with top half stator casing removed, during assembly for vibration tests. Inlet guide vane, 1st and 2nd stator stages only are strain-gauged.
FIG. 2. N.G.T.E. No. 118 Compressor.
13 (8o624) B

"6
~ S U R I [ RATIO
"IN$1"AI.I.ATION.- AXIAL AIR INTAKE) • VIBIRATION TEST., ¢
--(NOM.qAU.Y) CONSTANT SPEED TESTS (NO. ,,s GAS- -TURBNIE
~)-,4tCONSI"ANT THK~0TTI.E ,SETTING TESTS INSTALI.A'rlON~ j VOLUTE AIR
IHTAKE~ 7~illl
~ E D S ~ 1 ~ 74 QI , ~
0 I0 2 0
Fic. 3.
30 40 50 60
MASS FLOW IB/SEC.
No. 118 Compressor operating condition.
k ~
D5 i I I
70
TRACE
I
2
3
4
5
. . . . . . . . . . . . . . . . . . . . . . . . • , . . . . . . . . . . . . . . . . . . . . . . . - " . . . . . . . .
MAXM STRESS
'roN.~N2
+ 2-2
_+J9.5
± 4 . 7
± 5.3
4-6.1
RECORD I
± 7-6 ±12 "2
RECORD 2
I
2
3
4
5
4" 3 . 2
± 8 ~ 4
-+ 6 . 0
+ 6 - 8
+ 4 . 4
RECORD 3
FIG. 4. Blade vibration records.
14
2
W 01 in 1/) ,,i
:5.0
P-'0
BLADE T.~
~ 9 e %
7200
. ~ I ~ ~
.,.,~:i:ii:! ~ r-~-~ ~" ':! ~ ii:~ :;' ~ ~'~::~ !II~
I'O 0 10 20 30 4 0 ~ 0 6 0
MASS FLOW LB/SEC.
:5,C o_
Id 2-0
hi
BLADE B.IG
I,O 0 I 0 ~,0 ~ ,0 /5 4.0E~ 6 0
~MAI~S FLOW LB
7200
6 4 5 0 . ~: "~ ¢ I
" -a
5 O
~-0 BLADE B.27 7 ~ 0 0
I-0 o ,o ao 3 0 ~ o ~ o ~ o
MASS FLOW L~/SEC.
' [ - - 1 o+~--_+s KEY "TO 5TR£.55£$ ~ .6. ± 5 - - ' r i o ~'TON~INe -
~ ± lO- -~± ,5
NOTE ;--NUMBER3 AGAINST CNAR~,CTERI~,TIC5 ARE CORRECTED .SPEEDS r..R.P.NI)
FIO. 5. P redominan t stress contours in f irst-stage stators.
2
Ig
:~.O
P-'O
P-LADE T-5 7?.00
..:¢:i:" " , i
1.0 0 I0 P-.O 3 0 4 0 5 0 6O
IV~SS FLOW LI~./SEC
3 ' 0
2"0
I ' 0 0 60
E, LADE T.P-8 7P_OQ~,
6 4 5 0 " " "'~::: ~jil[~:~"
~ ° ° z • -~i?~:~!~ " ~ : ~ ' ~ : i : :
I0 20 ~0 4Q 50 MAS~ FLOW LB/SF-,C.
~ 'O 7200
x 6 4 5 0 . : • ".
I0 ~0 ~0 40 50 ~0 MAS~, FLOW LB/SEC,
I I ~ "1" 5-'~'"1- IO t TON~IN e KEY TO ,.%T~EISSES
[] +,o÷_+,sj
NOTE; - NUMI~,ERS AGAINST. CHARAC.TERI,% CICS ARE CORRECTED :}PEF-.D5 (P.-P.M)
Fie . 6. P redominan t stress contours in second-s tage stators.
~LADE B.17
2.0
I-0 0

~-0 2
cd :3 P-'O u~ u) ~J
I 'C 0
B L A D E ¢~.5
• ~o..
IO P.O 6 0
7 2 0 0 ..... • :~:. \
~ 4 5 ~ ! .~.: ~ : . :
~;..::....:.N
~ 0 4 0 5 O
3 " 0 O
2 - 0
~d
I ' 0 O
BLADE B .2~ 7200
5500 . .-:':.:': -:-'..:-.'-:':.:-:.:-: ,~ ~'t'~/~.w ...:~'~::::::..:-.:~:~:::::- -; ~'.:~::::"
:':':~':' t?)?...~. ?::::::'::::;'~:{:i:-'.: '?:':::::.~C "~
I 0 ~ 0 5 0 4 O 5 0 6 0
I I O + 2 - - ' ÷ 5 / KEY TO STRES,~F.~ ~ " " ~ " I '5~: I : Io~TON~IL21N.
> ± 15 j
NOTE:-NUMBERS AI;IAINSTe'CHARACTERISTICS"ARE CORRECTt~D SPEED5 R,P.M.
FIG. 7. Predominant stress contours' in second-stage stators.
u,l o~
I.
÷ 1 0
0 400d 5000
R.P .M
P01NT5 RECORDED ,ON CON~T 5PEE.D
x l RUN (6-~o~ PNO
fl
tl II tl
6 0 0 0 7 0 0 0
(O.) CON,~TANT THROT~I 'LE 5ETTINC~ RLlhl5
NUMBFR5 AGIAINST
CHARACTERLSTIC5 APSE
CORRECTED SPEED5 R~.M 0 . 7P-O0
= o . oOO o , ~ 9 8 0 ~ L '
. I -O
O tO P-O '50 4O 5O 6,O MA55 FLOW L~/$EG.
] l 0 t "~--"I" 5 'TON KEY TO STRESSES ~ A - t - 5~d : l o
[ ] ±1o~+_15
(b) STRESS CONTOUR51
FIGS. 8a and 8b. Predominant stresses in in le t guide vane.
Z ~o
.¢
2
z__
2 o cn ld
,,~ <.
N. Z
=,1
I--
~.Bo
+~o
- H o
O ,4.000
_+ ~o
O 4.000
BLADE T," 5,
iJ: STATIC ~. RISC.P.5
~ O0 2(
5000 ~ 0 0 0 7 0 0 0 R.RM.
BLADE B.16. tSTATIC~--. 210 C.R~ i'~'10
5OOO GOOD 7 0 0 0 R .RM.
BLADE B.27.
~ STATIC ~2.16 ¢.RS
215r~ ~ r ~ . ~
~219 ~0..~
I
S O 0 o E~C, O o
R . P . M
O 4.000 7000,
NOTE:--NUMBER5 ON CURV~ SHOW TREND-~ IN VIBRA'rlON FREQUENCIES, (C. R S.)
Fit . 9. Predominant stresses in first-stage stators ('Constant-throttle setting' runs).
2
ill II¢ k- ID
<C
ol Z
co Z
a~ hi
<
z
P ~q
,¢
BLADE T. 5 ( f STA'r|C "~ zB6) ~s~
a s 6
, ~ - ~ - ' - ~ o ~o
O 4 0 0 0 5 0 0 0 6 0 0 0 7 0 0 0
R.R M.
BLADE "E. 2S
o
3
O 4 0 0 0 5 0 0 0 &OOO 7 0 0 0
R.P.M.
BLADE B.17.
(~STATIC ~ 270~
~ 1 0
P.70
~ o o o ~ o o o ~ o o o , o o o R . P . M .
NO' r= : -NUMBC~S ON CURVES SHOW T R ~ N O S iN VJBRAT'ON FR=QU= Nca=s,(c. P.S.)
Fit . 10. Predominant stresses in second-stage stators ('Constant-throttle setting' runs).

~z (/3 Z [D I- -I-Z u~
ld Iv p- u~
g
-<
"z
Z o p-
tn i/3 M rr I-- (D
z (D I- ÷i
(n u) bJ (M p. o3
i x
+-E
-+I
0 4000
INLET GUIDE
VANE
__ OO OO O O--__ Oo--o0 -- ,
S O O O
VIBRATION FREQUENCY IIIQ C.P.S.
o
,-o o - ° : ~ - 8-6 o go, %-oo
6 0 0 0 7 0 0 0 R.P M,
+ 5
+?_
+-I
4 0 0 0
Ist. STAGE 5TATOR
B L A D E T.5 ,
/
c/o/ 0
• - - \ w / 0 0 O/ /
ou.x~ o Go
5 0 0 0
VIBRATION FREQUEklCY I050 CRS.
DO ~ o
o\ o 0 0 U \
0 O/~ X /
0 0 0
0
6000 ~ 7 0 0 0 R.P M.
o c o
1"
+ 2
*-I
?nd STAGE STATOR'
B L A D E T 5 .
c o ¢ 0 ° o o )~o o
~" o -oo :o o o-- -o~ o
4 0 0 0 5 0 0 0 ~ 0 0 0 R.RM.
V l BRATION FREGUENE~( I,¢BO C.R~.,
0 o o oO
% % ' o ~ . ~ /
70.00
( ~ LOCATION OF" FUNDAMENTAL MODES 8 T R E S S PEAK~)
Fzo. 11. Higher mode stresses.
230
220
0
~ 2KI Or
g.
ROe 4000
23C
BLADE T.5
~C~TATIC:~ m 5 C.P.S)
d
o Ill
w u.
I
z~ ~ 4 Z t
5 0 0 0 6 0 0 0 R.P.M.-- N
I 6 " ~ = 1~33 N
I 7 0 0 0
200 4000
BLADE B.16
~:5TATIC'==. a 13 c- R 5.)
b
250
Z~
5 0 0 0 R. R M . - - N
A A 6, I-9,4- N A
6 0 0 0 7 0 0 0
ui I~LADE. B .27 f,i l" 5TATIC~ 216C...R S d
220 ¢ U Z (10~ z~i
(~ 210
®
Ld b.
B A
A 0
A A
? /o A o ~
2OO 4 0 0 0 ~50OO 6 0 0 0 7 0 0 0
R.P .M. - -N
O -I--2-,,-_5 "~ ,KEy TO, S'I'RF.~$ES & -~5--~-I-IO !
I~ ~10"*-_+15 X >-I ' . I1~
T O N S / • / I N . ~
FIG. 12. Predominant frequency vs. rotor speed (First-stage stators).
300
0 29t
I
0¢
270 4 0 0 0
500
d £90~
T
P-"/O 4 0 0 0
BLADE T.5
-~ ZO ~)A Zs
• r
~ 0 0 0 ~ 0 0 0 3 '000 R . R M . - - N
29C
U 280
).. 0 Z
27C
O
BLADE T.28, ~ //6/~ =2-4~ N
fSTATICN 290C.R$
~000 • 6000 7000 R.RM.--N
26C ~ 0 0 0 5 0 0 0
I~LADE ~.17 /
~ STATIC--~ ="70 C~..~ (
0 ® " ® ®
~--~o ~°m-~, P-~ -~ ~ - - ° ' o
,6O00 0 7 O 0 0 R . R M , - - N
KEY TO STRESSE~ o ± a - - ± s ] ±s-.-_+,o ~..TONS~,~ ,, m ± I O - ~ I , S J IN.
FIG. 13. Predominant frequency vs. rotor speed (Second-stage stators).
I >- O Z ,a
0 Ld b.
: : ' 9 0
2 1 ~ 0
~:'/O
R6C 4 0 0 0
~0~
u~ o4. ~9c o
o Z ~l~e ul
id
27
BLADE ~.S
(~STAT,C~ at7 e.~ A
5000 6 0 0 0 7 0 0 0 ~.~M.-N
BLADE ~ .2~
(~CSTAT,C'~OC.P.S
4.000 ~000 R . R M - N
,!
0 Z~
® A~ 0 J
6 0 0 0 7 0 0 0
0 ~2"":1:5 l l "ON5~" KEY TO S'I"R£SSE5 ~, --I-5~+1o ~, / IN~ "
~lO..,,.Z,z ,51 - . xD >+_. is 3
FIG. 14. P r e d o m i n a n t f r e q u e n c y v s . r o t o r s p e e d
( S e c o n d - s t a g e s t a t o r s ) .
bO
oi 02 d I
Z
D-
P. .BO
P..'/O
240
Z30
~0
21CI
: °
/o ~ ~ °
S;,oO o0 ° ;,oo o ®Oo ~ o
(=5x.~,8~0
60~= I ' ~ N ( = 4 X ' 4 ~ .
s
/ " I
e •
19G 4000 ~ o o o 6 0 o 0 7000
R.RM.-N
KEY TO ~T~E55E~ o " l , a ~ ± 5 TO
FIG. 15. Predominant and minor frequencies inlet guide vane.
P.9C
2BC
~"/0
2 6 0
25O
o
I ~ ' 4 0 g X
ul R3Q
Lk
~20
R | O
200
II~O 4 0 0 0
A V Q
® X
FIG. 16.
5 0 0 0 6 0 0 0 7 0 0 0 R.R M. - -N
BLADE T. 5 IbLADE T.R8 f PREDOMINANT FREQUENCY COMPONENT BLADE I~.t7 BLADE T. 5 '~dllgOR" FREQUENCY COMPONFNT BLADE T.';'8 BLADE P-J7 (ALL STRE.5~Eg ~-~_. 2. TONS/IN a)
Predominant and minor frequencies for second-stage stators.

================================================================================== / ............... ... .......................
. . . . . . . . -,. ,. ,- . ,. , . : v , . . . . v ~ v ~ ~ v V ~ -~
. . . . . . . . . . . . . . . . . . . . . ~ , ~" ~, v v ~ ,i ~ v ' V ' ~ % ' V V ' ~ v ,
% ^ . /. ".. ,~ ^ ~ ~ ~ ;" ~' * .^ t': A A ~ ,-'~ h t ~' ~, ~" ~. ~, . . . . . . . . . . ' . . , ".' "., ~. ~ ,~v~. -w%,"~ ~ , , ~' ,¢, 'v 'v" ',.'
bO 1"O
BLADE
B2~93)
I 000 C.• S. I PULSE EVERY4 ROTOR REVS.
~,- , (~7,~
T.2e~94~
~s(2a~ ST.STATOR
I.G.V
COMPRESSOR SPEED 6 7 6 0 RPM., FORCED VIBRATION OF
2ND STAGE STATOR AT 274 CP.S. (5TH. HARMONIC OF
48-490/~ ROTOR SPEED STALL CEll.. )
(280)ETC REPRESENT BLADE NATURAL FP~QUENClES, C.P.S.
35 BLADES
T . / ~ . _ . " ~ T . ; . IN E A C H ~ B.S
HALF- ~ B,28
- - - CASING ~ e .17
T.:,S T.5
Br7
LOCATION OF STRAIN-GAUGED ~VEFORMS FOR S~MILAR
2NO STAGE STATOR BLADES, PHASING OF EACH BLAD~
AND STALL CELL
MOVEMENTS.
FIG. 19. Blade vibration records (Stall cell forcing).
MAXM.
STRESS
rcesl ,~
_+~
± 6 - 3
+_K:).4 _+ 6-9
_+e 4-4. 6
+5
IO
IST STA~[ |NO STK-J~
~[ I I I
,, I , ,h II . . . . - - , I , 2O0 £10 ~ """ - ~ O
FR£QI.m:NC~ C.P. ~.
J I, Jl ((1) ~ FUNI)AMENTA, L. FREQUENCY (~TATI¢'~ DISTRIBUTION
io id
" S o d z
io P.ND
S T A G E
I IST 5XO '48N =-
" * " .[I,
,gl,,w II III III
5 0 0 0 6 0 0 0 R P.M, (N)
I 6 X O - 4 ~ N .
[h ,, IllttU, IJ
R . P . M ( ~
J4XO'48~I
I
7OOO
i 5 X O ' 4 6 N
.m l
II
,, I ll ilJ,ll fhl 7OOO BOOO
(~) STAU.-C,£U. HARMONICS--IM.ADF.. FRI [quLNcy R ~ E S .
sso ~rrc.IND,cA'rE T,~,~ (MIN.~) / 'd'fJ~ m Acr . [~UTmm ANO /. 0ec r ,~T iOm [~[TW[eN ~"CHARACTF.RISTIC- SP£F.D.
~-= ,oo /
z 5 o /
,,,-'51 ---,. --- '61 ~ I~ ' b -~L l '~° ' "e - -~L I ~ a - Z ~ ' " e " " * ' - I i b ' - * , ,
SQOO (,~043 7OO0 8O00 R.P.M.
(¢) D~STRISUTiON o r RUNNINq T lk l [S FOR Sr-Rtr..~ Z ~- l r T l~ ' r$ :
N.B. DIAGRAMS (1 AND b BASED ON FREQUENCIES OiSTAINIrD .44FT£R :iERIES 1ZAND'~ VI~ATiON TESI'6, I 'L" ON CGNtPI.F.TF.LY Ni[--~.ADff.ID £ND AND PARTIALLY RE-IM.AOED I=ff ~t'AGEIb.
FZGS. 20a to 20c. Stall cell excitation relationships.

,~ ,.., v v'X., ,., v,~ v, . v,., L, V V v,,, v v ,/~" v W'V'V%~'v ~/~v
~ V ~ ' ~ v V V V V v V v ~ W V ~ V V V v
b~
BLADE
B.5(280)
B28/293)
B,,(274 .28 94
S'[STATOR
I.G .V
I000 C.P.S. I PULSE EVERY 4 ROTOR REVS,
COMPRESSOR SPEED 6760 RRM,. FORCED VIBRATION OF
2ND STAGE STATOR AT 274 CRS, (5TH. HARMONIC OF
48 -49% ROTOR SPEED STALL CELL. )
80)ETC REPRESENT BLADE NATURAL FP.EQUENCIES~ C.P.S,
35 BLADES
~ - - - ~ " ~ T . 2 & IN EACH
T ' ! 2 @ B HALF - CASING
5 B.
B.17 LOCATION OF STRAIN-GAUGED
2NO STAGE STATOR BLADES.
B. 5
V L A A ~ B.28
B.17
"r.28 T.5
WAVEFORMS FOR SIMILAR
PHASING OF EACH BLADE
AND STALL CELL MOVEMENTS.
FIG, 19. Blade vibration records (Stall cell forcing).
MAXM. STRESS
T O N S / I N 2
4"11
+6"3
4-10"4
+ 6 . 9
4- 8 4-4. 6 _+5
I0 t zOU" ~J ~ ~d 52 "' IST S T A G E I ~ P - . N D 5T.~G E
FREQUENCY C.RS.
(0~ BLADE FUNDAMENTAl- FRE.qUENC¥ (",STATIC") DISTRIBUTION
IO Id 13 5
S o d z
(b)
IST 5XO!48N El'AGE ~
~o00 6OO0 700O IO R P.M. (N)
I I
P-ND 6XO.4~ N __ 5XO-48N
° t I IJ ll ,, I I ll I,I , , IH,I hi 5 0 0 0 6 0 0 0 7 0 0 0
R.P.M. (N) STALL-CELL HARMONICS--BLADE FREQUENCY RF-5ONANCES. 150
14X O'48 I~
= I =-
8 0 0 0
ETCINDICATE TIME (MINII,~ E.NT IN ACr..,ELERAT~NS AND
£ PATI(:~IS BETWEEN ARACTERISTIC" SPEED. 100 /
Z_ 5O
• '~--I 6"-',-
5 0 0 O 6 0 0 O 7 0 0 0 8 0 0 0 R.P.M.
(C) DISTRIBUTION OF" RUNNING TIME5 FOR SE.RIF-5 "Ir.,~ ~ TE~TS,"
N.B. DIAGRAM5 Q. AND b BASED ON FREQUENCIES Olt.TAINED AFTER 6ERIES"t'e'AND'E VIBRATION TESTS, I.F--ON COMPLETELY RE--BLADED ~'ND .I~t,ND PARTIALLY RE-BLADED 1ST 5TAGE~.
FIGS. 20a to 20c. Stall cell excitation relationships.

Blade Vibratory Stresses in a Multi-Stage Axial-Flow Compressor
By D. A. KILPATRICK*
Summary. A previous build of the compressor had suffered, after a very short time, blade fatigue failures in the early stator stages. A new blade design was issued involving considerably increased blade chords and thicknesses, as welI as a change to a material of higher fatigue strength. For this new compressor build it is shown that there are blade resonances with stall~cell excitation, resulting in stresses of up to 70 per cent of the fatigue strength.
The major resonances are with the second harmonic of a five-cell rotating stall regime, but other resonances are attributable to the second harmonic of a six-cell regime and to the eleventh and thirteenth harmonics of one cell Away from these resonant conditions stalling flutter also is present at much lower stress levels (up to 20 per cent of the fatigue limit). The stalling range of the first and second stages of this compressor is very wide, extending to about 80 per cent of design speed.
A feature of the results is the smallness of the reduction in the absolute alternating stresses consequent on the increase of blade stiffnesses. It is thought that differences in the damping capacity of different materials at different levels of stress is a contributory factor. Although the actual stresses are not much less than with the original build, the safety factor has been increased from 0" 5 to 1-5 approximately.
1. Introduction. Previous reports (Ref. 1 and the first paper of this R. & M.) have described
investigations into the blade vibratory stresses in the National Gas Turb ine Establishment No. 118
Compressor subsequent to the appearance of stator blade cracks during the initial compressor tests.
These reports showed that stresses high enough to cause fatigue failures occurred over a wide range
of part-load conditions, where the early compressor stages were stalled. Th e first paper of t h i s
R. & M. indicated that the blade failures were most probably caused by resonance excitations of
the blades by harmonics of a flow disturbance, such as a stall cell, rotating at about 48 to 49 per cent
rotor speed. When the initial blade failures occurred, and before the investigations described in Ref. 1 and the
first paper of this R. & M. were' made, a compressor design modification was put in hand. Th e object
of this was to reduce the blade gas bending stresses and, it was hoped, the superimposed alternating
stresses, by increasing chords and thicknesses. As a fur ther precaution the blade material was to be
changed to one of a higher fatigue limit. This Mk. IL version of the compressor was built after the
tests on the Mk. I build described above had been completed; and its first tests, forming the basis o f
this present report, were devoted to a s tudy of the blade vibratory stress levels in the first two stator
rows. In addit ion qualitative measurements were made of flow perturbations at inlet to the first s tator
stage by means of capacity-type pressure pick-ups. Levels of vibration at the compressor casing were
also recorded over the relevant part-load conditions.
2. Co~npressor Design. The main design scantlings, of the N .G .T .E . No. 118 Compressor are
described in the first paper of this R. & M. It is a~ eight-stage axial-flow compressor giving,, at it~
design speed of 9,000 r .p .m, a mass flow of about 70 tb/sec at a pressure ratio of 5 .3 /1 r Th e Mk. II
* N.G.T.E. 'Report R.221, received 19th February, 1958.
(80264)

version, as indicated in Section 1, was designed to retain the same ae}odynamic performance, using
blades of greater strength. A comparison of the blading details is tabulated below. In the Mk. I version the rotor blades were manufactured in cast Vitallium and the stators in cast H.R. Crown Max.
For the Mk. II version bar S.80 material was used for both rotor and stator blades.
Geometrical Blade Analysis
Blade height (in.) Camber (deg)* Stagger (deg)* Pitch/chord ratio* Root chord (in.) . Root thickness/chord ratio (per cent) Air outlet angle (deg)* . Height/root thickness ratio Design gas bending stress (tons/in. a )
First stator
Mk. I Mk. II
4.3 4.3 26 26
-38 -38 O. 85 0.72 1.21 1.65
11 13 31.9 31.9 32 20 5.2 1.3
Second stator
Mk. I Mk. II
3 "7 3-7 27.8 27-8
-37 .2 -37.3 0.79 0.745 1-22 1-60
10.1 11.84 30.2 30.2 30 19-5 4.65 1.15
* At mean diameter.
2.1. Test Installation. As for the test of the first paper of this R. & M., the compressor was
driven by a four-stage turbine and had a volute intake open direct to atmosphere. Fig. 1 illustrates the installation.
3. Instrumentation. 3.1. Transducers. Two of the inlet guide blades and nine each of the first
and second stator row blades were gauged wkh British Thermostat Type SE/A2 (200~2) gauges. The lead-out wires were soldered to the gauge leads and passed out through the compressor casing to an external terminal board.
Two capacity pick-ups, of the balanced pressure type described in Ref. 2, were fitted at inlet to the first stator stage, 90 deg apart. They were provided with total-head adaptors to tile nose of the pick-up, enabling the pressure variation at mean diameter to be indicated (Fig. 2). Measurement of the vibrations of the compressor casing was carried out by rigidly affixing a seismic pick-up of
R.A.E. design. The electrical output is approximately proportional to the velocity of the vibration over the frequency range of about 30 c.p.s, to 400 c.p.s.
3.2. Amplifiers. An arrangement of strain-gauge amplifiers and recording equipment sl ightly different from that described in the first paper of this R. & M. was used in these tests. Only one type of amplifier was employed, viz., one of N.G.T.E. construction, based originally on the circuit of the A.E.R.E. Type 1008 amplifier. The circuit of the amplifier, which is made up of a head amplifier (situated near to the strain-gauge) and a main amplifier, is detailed in Figs. 3 and 4. It will be noted that an extra push-pull stage is provided in the main amplifier for use with cathode-ray tubes of low sensitivity (e.g.; high brightness tubes for high writing speeds). Normally, as in this case, this stage is unnecessary. The overall gain of the amplifier as connected is about 100,000 and is flat from 60 c.p.s, to 7 kc.p.s.
2 4

Seven of these amplifiers were used, being connected to one inlet guide and to tt{ree each of the first and second stator blade gauges. The screened cables from the compressor-casing terminal board led 'off to nearby junction, gauge polarising and switching boxes. The polarising circuits were of the simple potentiometer type, fed by dry cell battery (Kalium type), and provided the signal
inputs to the adjacent head amplifiers. The main amplifiers were located, together with the remaining amplifying, display and recording equipment in a trailer caravan outside the test house.
The two capacity-type pressure pick-ups were used in an R.F. carrier frequency circuit, the varia- tions in pressure across the pick-up diaphragm producing, in turn, variations in capacity and
frequency modtllation of the 2 mc.p.s, carrier, which is subsequently discriminated and amplified.
Two channels of this equipment, as manufactured by Southern Instruments, Ltd., were installed in the trailer caravan, the associated oscillator boxes being located near the pick-ups.
The output from the seismic vibration pick-ups is of the order of 1 v/in./sec, and suitable amplification was obtained in a Mullard oscilloscope, the output to the recording cathode-ray tube unit being taken in parallel to the oscilloscope's Y deflection plates.
3.3. Recording Equipment. Two recording cathode'-ray tube units A and B, each comprising six tubes and a 70 mm continuous moving film camera, were used to record the various strains, pressures and casing vibration. The tube connections were as follows: to unit A, an inlet guide blade, three of the first stage stator blade gauges and the casing vibration pick-up; to unit B, three of the second stage stator blade gauges and the two capacity pick-ups. The sixth tube in each unit was connected to a common marker amplifier giving 500 pulses per second with one pulse every four compressor rotor revolutions superimposed. The cameras were operated at a film speed of about 40 in./sec throughout.
In addition to this photographic recording of the dynamic variables, a tape recording of one of the strain-gauge outputs (first-stage stator blade T.4) was made in parallel with the film recording. The connection to the single-track tape recorder (E.M.I. Type TR.50A) was made at the main amplifier input. Connection was also made to the tape recorder of the output from the seismic vibration pick-up for one additional test also.
The pressures and temperatures relevant to an analysis of the compressor performance were also
recorded by photographing the manometer and instrument panel with a modified aircraft camera,
Type F.24. Exposures in this camera and in the two C.R.T. recording cameras were synchronised, initiation of the exposures being made by the operation of the record switch on the tape recorder.
A time delay of about one to two seconds was incorporated to avoid the switching transients in the amplifiers due to the starting of the tape recorder motor.
4. Description of Tests. As with the previous series of tests the scope of these tests was restricted to cover the part-load conditions associated with the high stresses in the Mk. I version of the compressor. The test operating conditions are depicted in Fig. 5 and are compared with results from the subsequent aerodynamic tests.
Short characteristics were taken at 4,000, 5,000, 6,000, 7,000, 7,500 and 8,000 r.p.m. Additional constant-throttle setting, varying speed tests were made, between approximately 4,000 and 7,000 r.p.m.
No strain-gauge switching was carried out during the tests and no gauge failures were experienced. The connection of the seven strain-gauges, two capacity pick-ups and one seismic vibration pick-up is detailed in Section 3.3.
25 (80624) E*

One additional test, over a speed range of about 4,800 r.p.m, to 7,000 r.p.m., was made for the purpose of recording the seismic vibration pick-up signals on the tape recorder.
5. Test Results. The major part of the vibration information was recorded on film, being supplemented to the extent of one channel by magnetic tape recording. Analysis of the film-recorded waveforms was by 'inspection' methods and the stress amplitudes quoted are the maximum measured at each condition. Frequency determinations were made in the region of this maximum stress amplitude and represent an average over about twenty cycles of blade vibration. The large number of test points (approximately 700) precluded prolonged examination of each waveform, but it is estimated that the accuracy of the frequency determination is better than 2 per cent.
The tape recordings were analysed using the Muirhead-Pametrada wave analyser, the amplitudes measured being approximately r.m.s, values, over short intervals. The overall frequency measurement
accuracy is probably better than 1 per cent.
5.1. Blade Stresses. Examination of the stress amplitudes of the predominant vibration component
(fundamental flexural mode), as plotted'in Figs. 6 and 7, shows them to be a maximum betweer/ 4,500 r.p.m, and 6,500 r.p.m, approximately. In general two or three stress peaks occur, the maximum of which reaches nearly + 17 tons/in. 2 for one of the first-stage blades and + 11 tons/in. ~ for one of
the second-stage blades; they are superimposed on a general level of stress of about + 6 tons/in. ~ for first-stage blades and somewhat less for the second stage.
The points from the constant-throttle setting, varying speed tests, used to plot Figs. 6 and 7, are also plotted together with the constant-speed characteristic points on the overall pressure rise vs. mass flow diagram in Figs. 8 and 9. Distinctive symbols are used to define the different stress levels. It will be noted that there is little variation in stresses with respect to position on the constant-speed characteristic, although certain blades do seem to show consistent increase of stress as the surge limit is approached. Confirmation of the stress characteristics in first stator blade T.4 is given in Fig. 10a wherein the tape recorded results are plotted. Comparison with Fig. 6 indicates agreement in stress peak location, with respect to r.p.m. The stress levels are lower, as might be expected, being nearer to 'average' values than 'peak', but are similarly disposed.
The stresses measured on one of the inlet guides are shown in Fig. 11, and it wil lbe seen that the levels are all very low, only just exceeding + 2 tons/in. 2 at three conditions. The omission of one of the 'greater than + 2 tons/in. ~' points from the stress contour diagram (Fig. 11b), is due to instrument errors during one of the short constant-throttle settling runs which precluded calculation of pressure ratio and air mass flow. The scatter of points in Fig. l l a is high but it does seem possible
to define two stress peaks. The general picture of stress distribution as indicated in Figs. 6 to 10 is very much the same as
obtained in the tests with the less stiff Mk. I blading (see first paper of this R. & M.). These'earlier tests gave stress maxima of about + 20 tons/in. 2 and + 12 tons/in. ~ for the first and second stator
rows respectively. In addition to the predominant fundamental mode stresses described above, one other component
frequency was in general detected in the film record analyses, this being of very much higher frequency. These higher mode stresses are all very low, lying between + 2 and + 3 tons/in. ~ maximum for the first-stage stators and less than + 1 ton/in. ~ for the second-stage blades. The variation of these stresses, with speed, is in general rather random and not particularly significant. Two of the first-stage
stator blades do, however, show higher mode stress peaks similar to the fundamental mode stress peaks.
26
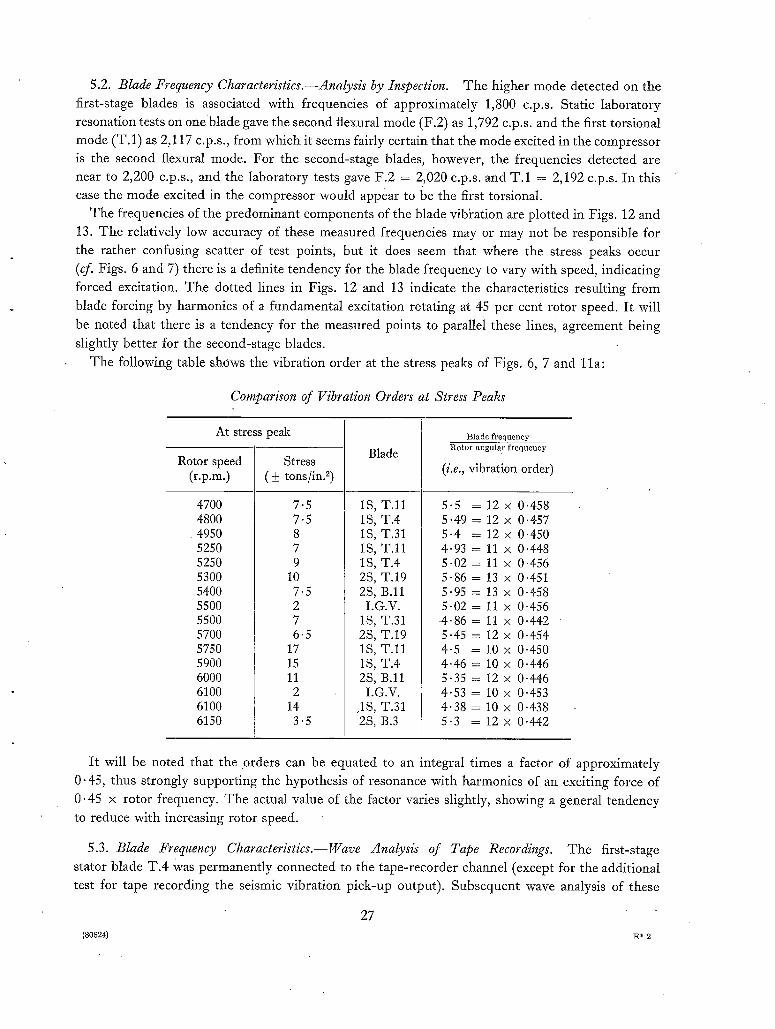
5.2. Blade Frequency Characteristics.--Analysis by Inspection. T h e higher mode detected on the
first-stage blades is associated with frequencies of approximately 1,800 c.p.s. Static laboratory
resonation tests on oneblade gave the second flexural mode (F.2) as 1,792 c.p.s, and the first torsional
mode (T. 1) as 2,117 c.p.s., f rom which it seems fairly certain that the mode excited in the compressor
is the second flexural mode. For the second-stage blades, however, the frequencies detected are
near to 2,200 c.p.s., and the laboratory tests gave F.2 = 2,020 c.p.s, and T.1 = 2,192 c.p.s. In this
case the mode excited in the compressor would appear to be the first torsional.
The frequencies of the predominant components of the blade vibkation are plotted in Figs. 12 and
13. The relatively low accuracy of these measured frequencies may or may not be responsible for
the rather confusing scatter of test points, but it does seem that where the stress peaks occur
(cf. Figs. 6 and 7) there is a definite tendency for the blade frequency to vary with speed, indicating
forced excitation. The dotted lines in Figs. 12 and 13 indicate the characteristics resulting from
blade forcing by harmonics of a fundamental excitation rotating at 45 per cent rotor speed. It will
be noted that there is a tendency for the measured points to parallel these linesl agreement being
slightly better for the second-stage blades.
The following table shows the vibration order at the stress peaks of Figs. 6, 7 and 11a:
Comparison of Vibration Orders at Stress Peaks
At stress peak
Rotor speed (r.p.m.)
4700 4800 4950 5250 5250 5300 5400 5500 5500 5700 5750 5900 6000 6100 6100 6150
Stress ( + tons/in. 2)
7.5 7.5 8 7 9
10 7-5 2 7 6-5
17 15 11 2
14 3.5
Blade
1S, T.11 1S, T.4 1S, T.31 1S, T.11 1S, T.4 2S, T.19 2S, B.11
I.G.V. 1S, T.31 2S, T.19 1S, T.11 1S, T.4 2S, B.11
I.G.V. 1S, T.31 2S, B.3
]3lade frequency :Rotor angular frequency
(i.e., vibration order)
5.5 = 12 x 0.458 5.49 = 12 x 0-457 5.4 = 12 x 0-450 4-93 = 11 x 0.448 5-02 = 11 x 0.456 5-86 = 13 x 0.451 5.95 = 13 x 0.458 5-02 = 11 x 0.456
-4-86 = 11 x 0.442 5-45 = 12 x 0.454 4-5 = 10 x 0-450 4.46 = 10 x 0.446 5.35 = 12 x 0.446 4.53 = 10 x 0.453 4.38 = 10 x 0.438 5.3 = 12 x 0-442
It will be noted that the orders can be equated to an integral times a factor of approximately
0.45, thus strongly supporting the hypothesis of resonance with harmonics of an exciting force of
0.45 x rotor frequency. The actual value of the factor varies slightly, showing a general tendency
to reduce with increasing rotor speed.
5.3. Blade Frequency Characteristics.--Wave Analysis of Tape Recordings. Th e first-stage
stator blade T .4 was permanently connected to the tape-recorder channel (except for the additional
test for tape recording the seismic vibration pick-up output). Subsequent wave analysis of these
27
(80624) E* 2

blade stresses revealed a large number of component frequencies, the major of which are shown plotted against compressor speed in Fig. 14. Tile frequency range shown does not cover the blade higher mode frequencies which were also found to be present..Of these higher frequency components,
that with the largest amplitude had a frequency of approximately 1,830 c.p.s., and was therefore identified.with the second flexural mode, F.2 (see Section 5.2). In addition, frequencies equivalent
to modes F.3 (4,350), T.1 (2,150), T.2 (4,600) and T.3 (7,200) were also detected, although of
much smaller amplitudes. Fig. 14 shows that the largest stress components have frequencies very close to tile blade
fundamental frequency (439 c.p.s.). Curves, showing an increase of component frequency with increasing compressor speed, can be drawn to pass reasonably through most of the other points. These curves are not quite straight lines but are found to be represented by equations of the form
60f = pxN,
where f is the blade component frequency, c.p.s. i
N'is the compressor speed, r.p.m.
p are integers 3, 4, 5 . . . 12 for each curve
x, instead of being constant as it would be for straight lines through the origin, has values between 0.43 and 0.46.
It will be noted that the points defining the major fundamental mode stress peak of the blade (@ Fig. 10, 5,900 r.p.m.) lie on tile curve p = 10, whilst curve p = 11 passes through the one point indicating the lower fundamental mode stress peak (5,200 r.p.rn.). Thus these stress peaks are consistent with resonance with excitation from the tenth and eleventh harmonics of a disturbance rotating at between 43 and 46 per cent rotor speed.
5.4. Alternating Pressures. As described in Section 3.1, capacity-type pressure pick-ups were installed so as to detect variations in the total-head pressure at mean diameter at inlet to the first-stage stator blades. Due to the difficulty of effecting a dynamic calibration of these pick-ups plus total-head adaptors, amplitude measurements are qualitative only.
Generally speaking, the recorded waveforms of the pressure pulsations are somewhat random, i.e., amplitude and frequency are not very steady at any given condition. Fortunately it is possible
in most cases, particularly between 5,000 and 6,000 r.p.m., where the blade stresses are also high, to detect a sufficient number of successive cycles for frequency estimation. These frequencies are plotted in Fig. 15, with indications of the associated amplitude levels. Despite the scatter of points it does seem possible to draw a famil~r of three curves, near or on which lie the majority of points, especially those of high amplitude. The curves indicate the same relationship of frequency and compressor speed (viz., 60f = pxN) as did the characteristics of the blade stress frequency components (Section 5.3). In Fig. 15 the three curves are for p = 4, 5 and 6 where x lies between 0.44 and 0" 46.
This then is direct evidence of the presence of exciting frequencies in the air flow, their values being that of the fourth, fifth and sixth harmonics of a disturbance rotating at 44 to 46 per cent rotor speed. At higher compressor speeds the lower frequencies (/) = 4) seem to predominate, and as speed is reduced these tend to give way to the higher frequencies (p = 5 then p = 6). The transitions are by no means clear, considerable overlap occurring.
28
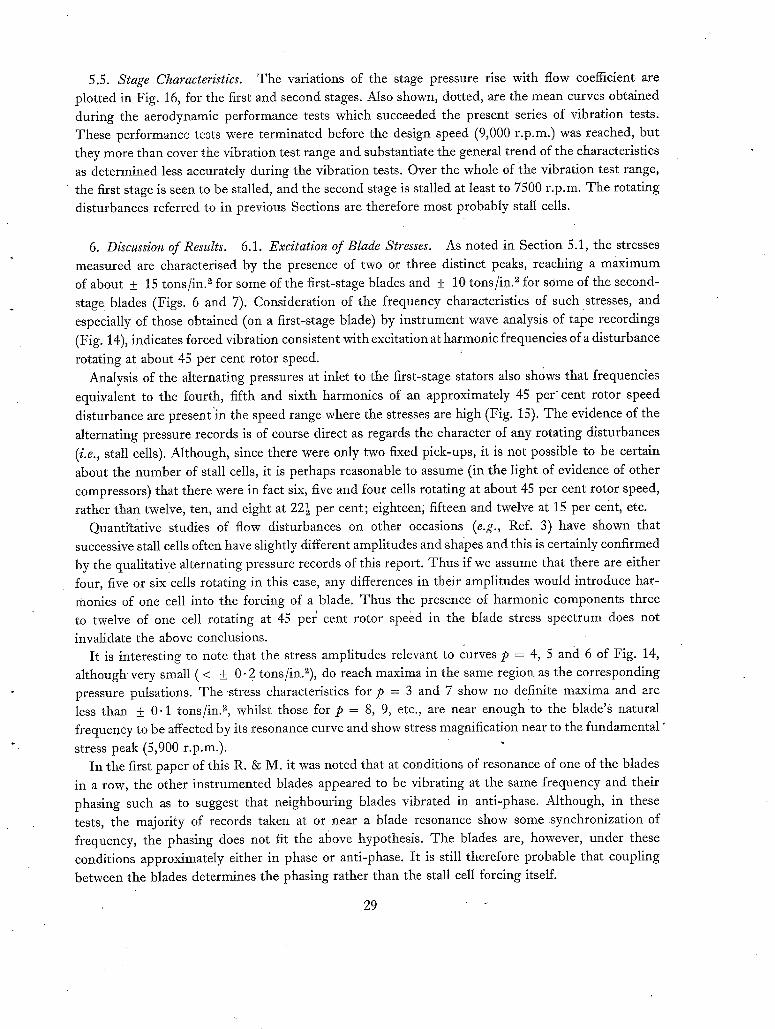
5.5. Stage Characteristics. The variations of the stage pressure rise with flow coefficient are
plotted in Fig. 16, for the first and second stages. Also shown, dotted, are the mean curves obtained during the aerodynamic performance tests which succeeded the present series of vibration tests.
These performance tests were terminated before the design speed (9,000 r.p.m.) was reached, but they more than cover the vibration test range and substantiate the general trend of the characteristics
as determined less accurately during the vibration tests. Over the whole of the vibration test range, the first stage is seen to be stalled, and the second stage is stalled at least to 7500 r.p.m. The rotating
disturbances referred to in previous Sections are therefore most probably stall cells.
6. Discussion of Results. 6.1. Excitation of Blade Stresses. As noted in Section 5.1, the stresses
measured are characterised by the presence of two or three distinct peaks, reaching a maximum
of about + 15 tons/in. 2 for some of the first-stage blades and + 10 tons/in. ~ for some of the second-
stage blades (Figs. 6 and 7). Consideration of the frequency characteristics of such stresses, and
especially of those obtained (on a first-stage blade) by instrument wave analysis of tape recordings
(Fig. 14), indicates forced vibration consistent with excitation at harmonic frequencies of a disturbance
rotating at about 45 per cent rotor speed. Analysis of the alternating pressures at inlet to the first-stage stators also shows that frequencies
equivalent to the fourth, fifth and sixth harmonics of a n approximately 45 per-cent rotor speed
disturbance are present'in the speed range where the stresses are high (Fig. 15). The evidence of the
alternating pressure records is of course direct as regards the character of any rotating disturbances
(i.e., stall cells). Although, since there were only two fixed pick-ups, it is not possible to be certain
about the number of stall cells, it is perhaps reasonable to assume (in the light of evidence of other
compressors) that there were in fact six, five and four cells rotating at about 45 per cent rotor speed,
rather than twelve, ten, and eight at 221- per cent; eighteen; fifteen and twelve at 15 per cent, etc.
Quantitative studies of flow disturbances on other occasions (e.g., Ref. 3) have shown that successive stall cells often have slightly different amplitudes and shapes and this is certainly confirmed
by the qualitative alternating pressure records of this report. Thus if we assume that there are either
four, five or six ceils rotating in this case, any differences in their amplitudes would introduce har- monics of one cell into the forcing of a blade. Thus the presence of harmonic components three
to twelve of one cell rotating at 45 pet cent rotor speed in the blade stress spectrum does not
invalidate the above conclusions. It is interesting to note that the stress amplitudes relevant to curves p = 4, 5 and 6 of Fig. 14,
although very small (< + 0.2 t°ns/in-2), do reach maxima in the same region as the corresponding pressure pulsations. The stress characteristics for p = 3 and 7 show no definite maxima and are less than + 0.1 tons/in. .~, whilst those for p = 8, 9, etc., are near enough to the blade's natural
frequency to be affected by its resonance curve and show stress magnification near to the fundamental"
stress peak (5,900 r.p.m.). In the first paper of this R. & M. it was noted that at conditions of resonance of one of the blades
in a row, the other instrumented blades appeared to be vibrating at the same frequency and their
phasing such as to suggest that neighbouring blades vibrated in anti-phase. Although, in these
tests, the majority of records taken at or near a blade resonance show some synchronization of
frequency, the phasing does not fit the at~ove hypothesis. The blades are, however, under these
conditions approximately either in phase or anti-phase. It is still therefore probable that coupling
between the blades determines the phasing rather than the stall cell forcing itself.
29
6.2. Rotational Speed of Stall Cells. Figs. 14 and 15 indicated that the relation to compressor speed of the stall cell excitation frequencies and harmonics is not linear, although nearly so. For simplicity the equations to both the stress component frequencies and the alternating pressure frequencies curves was expressed in straight-line form, 60F = pxN, the notation being defined in
Section 5.3. The relative stall cell speed x is seen to be not quite constant, and its variation
is illustrated in Fig. 17, where in Fig. 17a are plotted the values of x obtained from the curves of
Fig. 14, and Fig. 17b shows the values deduced from the alternating pressure m4asurements of Fig. 15.
The general trend of reduction of stall cell speed is evident and the agreement between the stress and pressure analyses is good. Average values of cell speed are seen to vary from 45 to 46 per cent rotor speed at 5,000 r.p.m, dropping to 43 to 44 per cent at 6,500 r.p.m. This trend is also substantiated by the evidence from the resulting blade stress peaks as presented in the Table of Section 5.2, where the blade vibration orders are expressed as harmonics bf a fundamental forcing frequency which varies between 0.46 and 0.44 times rotor frequency as the speed increases.
6.3. Stress Amplitudes. The peak stresses (at resonance with stall cell excitation) measured on the Mk. II blades of these tests are, for the three instrumented first-stage stator blades, + 15, + 17 and + 13 tons/in, a. In the tests of the first paper of this R. & M. on the same compressor with its' less stiff Mk. I blading, the stresses reached were + 20, + 14 and + 13 tons/in, a. Similarly, for the second-stage blades, resonance stresses of + 10, + 3 and + 11 tons/in, a were recorded for the Mk. II blades, compared with + 12, + 12 and + 11 tons/in, a for the Mk. I blades. The average reduction in stresses in changing from Mk. I to Mk. II blading is at first sight surprisingly little, having in mind the considerable increase in stiffness o f the Mk. II blades (the average first-stage stator natural frequency has been practically doubled, while that for the second stage has increased by 80 to 90 per cent) .
Consideration, however, of the damping capacity of blade materials offers a possible clue as to the reason for these rather small stress reductions. Determinations 4 of the damping capacity' of
engineering materials at different amplitudes of stress reversals show that, in general, the damping
capacity increases fairly uniformly with increasing stress amplitude up to about 70 per cent of the
fatigue limit, at which point (termed the Cyclic Stress Sensitivity Limit) the damping begins to increase much more rapidly. In the region below the C.S.S.L. the resonance amplification factor A r
resonance amplitude due to cyclic force 1"~ (defined as ~ c ~ a W ~ - ~ r ~ - ~ / decreases rather slowly with increasing stress, but above
the C.S.S.L., corresponding to the rapidly increasing damping capacity, the A~ decreases much more rapidly. The maximum stresses in the Mk. I blading, which was cast in H.R. Crown Max, are seen to be close to or above the fatigue limit (quoted as between + 10 and + 15 tons/in.a), at which level the resonance amplification factor A,. would be quite low. The Mk. II blading (S.80 material), however, has maximum stresses of up to only 70 per cent of the fatigue limit (quoted at + 24 tons/in.a), and would therefore be subject to a much higher A~.. Thus, on the assumption of the same stall cell loading on the Mk. I and Mk. II blading, it is evident that the Mk. II blading has a higher resonance amplification factor, which tends to offset the reduction in stress which would be expected due to the increased section modulus of the blades only.
It should be emphasized that this hypothesis is tentative only, the following factors being borne in mind:
30

(1) Complete material damping information of the type indicated above does not appear to be available for the two blade materials concerned. The information in Ref. 4 includes slightly
different materials and emphasizes the influence on damping properties of small changes
in composition and treatment, etc.
(2) The assumption of similar forcing and neglect of other damping effects (aerodynamic, root
friction, etc.) is rather too sweeping to be fully justifiable.
Nevertheless, it is thought that the effects described above must certainly play a considerable part in determining the blades' vibrational behaviour. It should be noted that the change to Mk. II blading, whilst not resulting in as large a reduction of absolute alternating stresses as had originally been hoped, does increase the factor of safety (Soderberg criterion e) from less than 0-5 to about 1.5.
7. Compressor Casing Vibrations. The output of the seismic vibration pick-up, attached about halfway along the casing in a direction of major response to vertical vibrations, was recorded on film throughout the tests. An additional varying speed test was also made with the pick-up output recorded on tape. The salient results of the subsequent wave analysis of the tape recordings are presented
in Fig. 18. The most significant result is the large increase in the first shaft order vibration velocity over the
range in which stalling effects are most prominent in the compressor (cf. Figs. 6, 7 and 16). This 1N vibration peak does not reach values normally to be considered dangerous, but its presence is not readily accountable although one m!ght expect frequency components representing reaction forces arising out of the rotation of stall cells. It is also of interest to note the detection of a band of
frequencies consistent with the first-stage stator blade frequencies with peaks conforming to the
resonances of these blades as described earlier.
8. Conclusions. A detailed examination of the stresses in the first two stator blade rows of the
N.G.T.E. No. 118 Compressor Mk. II has been made, together with some qualitative measurements
of unsteady flow conditions. This Mk. II build replaces the original Mk. I build which suffered blade
fatigue failures, and includes blades of considerably stiffer section in a material of higher fatigue limit.
The main conclusions are as follows:
(1) Stall cell excitation is again present, giving rise to moderately high resonance blade stresses.
(2) There appear to be regimes of six, five and four cells as the compressor speed increases from about 50 per cent to about 70 per cent of design speed. The relative speed of stall cell rotation varies slightly, decreasing over this compressor speed range from 46 per cent to
43 per cent of rotor speed approximately.
(3) Harmonics of one cell are present in the blade excitation. The major resonances of the first-stage blades (with stresses up to + 17 tons/in, a) are attributable to the second harmonic of a five-cell regime. Minor resonances are consistent with the second harmonic of a six-cell regime and with the eleventh harmonic Of one cell. The second-stage blade resonances are with the second harmonic of six cells and with the thirteenth harmonic of one cell.
Defined by g~s bending stress 2v aiternating stress yield stress fatigue limit stress
1 factor of safety
31
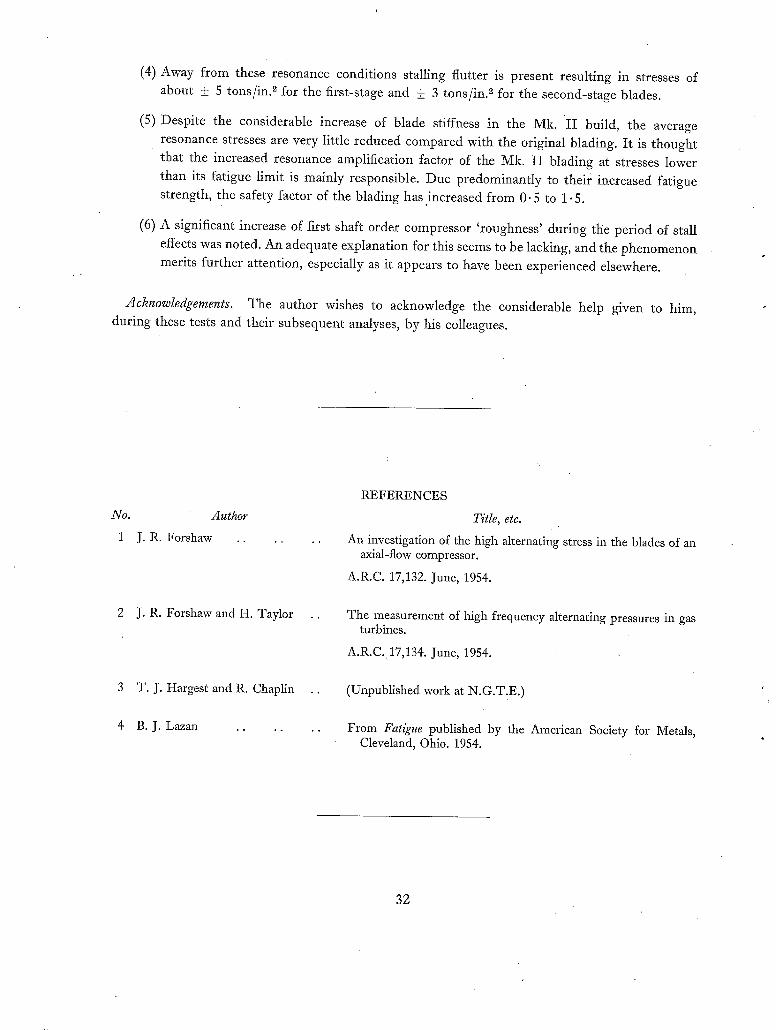
(4) Away from these resonance conditions stalling flutter is present resulting in stresses of about + 5 tons/in. ~ for the first-stage and + 3 tons/in. 2 for the second-stage blades.
(5) Despite the considerable increase of blade stiffness in the Mk. I I build, the average resonance stresses are very little reduced compared with the original blading. It is thought that the increased resonance amplification factor of the Mk. II blading at stresses lower
than its fatigue limit is mainly responsible. Due predominantly to their increased fatigue strength, the safety factor of the blading has increased from 0.5 to 1.5.
(6) A significant increase of first, shaft order compressor 'roughness' during the period of stall
effects was noted. An adequate explanation for this seems to be lacking, and the phenomenon merits further attention, especially as it appears to have been experienced elsewhere.
Acknowledgements. The author wishes to acknowledge the considerable help given to him, during these tests and their subsequent analyses, by his colleagues.
No. Author
1 J.R. Forshaw ..
2 J.R. Forshaw and H. Taylor
3 T.J . t-Iargest and R. Chaplin ..
4 B.J. Lazan . . . . . .
REFERENCES
Title, etc.
An investigation of the high alternating stress in the blades of an axial-flow compressor.
A.R.C. 17,132. June, 1954.
The measurement of high frequency alternating pressures in gas turbines.
A.R.C. 17,134. June, 1954.
(Unpublished work at N.G.T.E.)
From Fatigue published by the American Society for Metals, Cleveland, Ohio. 1954.
32
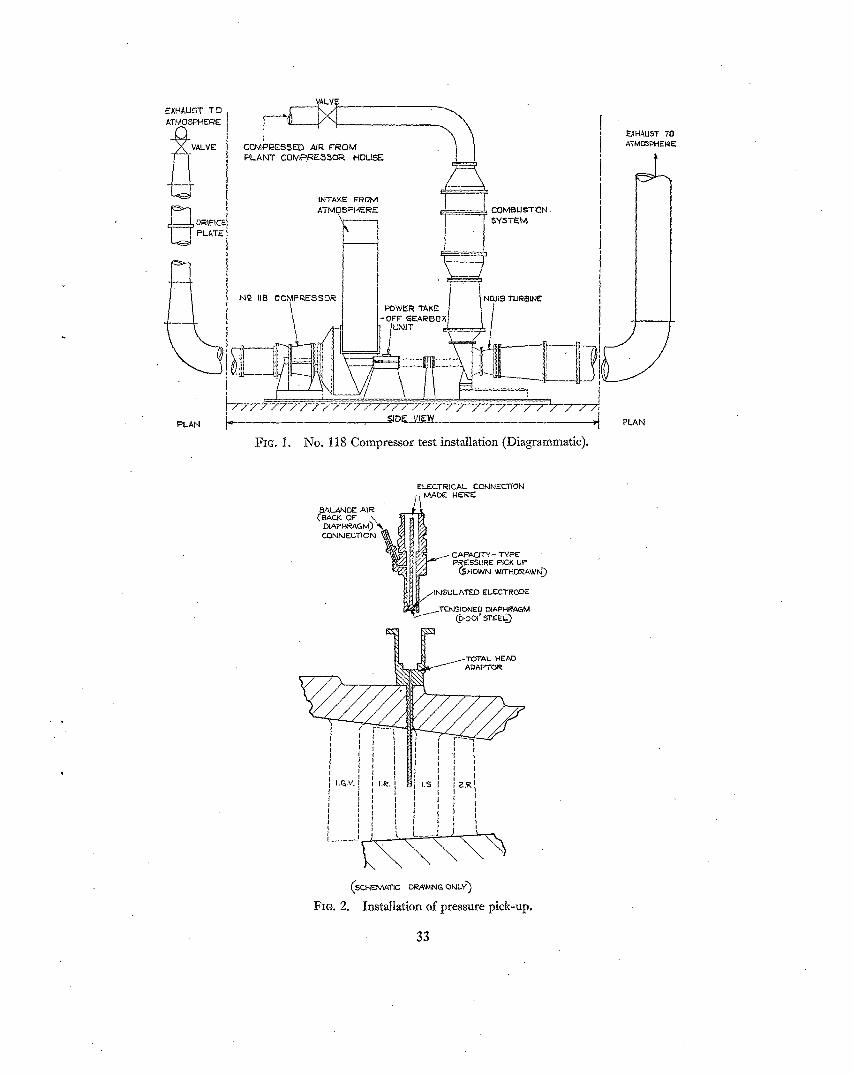
E/,HALI~T T 0 ATMOSPHERE
~ A L V E J
PLATE
;~LV
CQMP~E6SED A~R ¢"ROM PLANT COMPRE,3~OR HOUSE
INTAKE FROM ATMO SPHERE
N~ I1~ COMPRESSOR
I i i I
PgWER TAKE - OFF (~EARS£
IUMIT
COMBU ,~TII::3N, SYSTEM
N&iI~TU~8~E
FJ{HAUST TO
ATMO'~f:t-IERE
PLAN SIDE ViEW
~IG. 1. ~O, 118 Compressor test installation (Diagrammatic). PLAN
BALANCE A~ ' CBAr-.F-. OF \
I:~APHF, AGM)'~ , CONNECTION
t I I i
ELECTRICAL COMNECTION MADE NE~E
1 ~'~i / CAPACITY-- TYPE Ir//l'-- P~ESSURE PICK UP 1 ~ {'-~ NOWN WIT HD P-..A.W N;)
~ //INSULATED ELECTRODE
ITOTAL HEAD
/ AI3AFI'OR
/
d
I I
I i i, J I i
' I I
L . . . . . - . . . .
($CHEI~/1ATIG DRAWIN~ ONLY")
FIG. 2. Installation of pressure pick-up.
3 3

VALVE5 CV35~
/ a r
/ & II ?'l ~
eUa-CHA65~S IN~UL~,WF..D FR'OM CAS~
'FIG. 3. Head amplifier.
POWER' INPUT PLUG H G. 350'V. ~ IP_ mA L.q: 3~V, O-2A.)
~ 0 U T P U T [ ~ IPLUG t o / I (~o M ~ I N
c ~ l A~).
f f 2.d IF 5~ I - -
600 : ~
: £-/t4
"SALF I 20~<
OK
JACK OUTPUT (TO C.~.~)
35OV, ~OmA / r-- z °'~H?4
4Azr 0 IIALF G II---"
"il ll/l: l'°I ~ -L~ .......... ! L .....
~'TA.G E. (D~SCONNECT JAC K~C,D, CONIMF__CT JAC K.-PGt H. CONNECT C-~," E ~ D-," E)
tOOO'V
Fro. 4. Main amplifier.
3 4
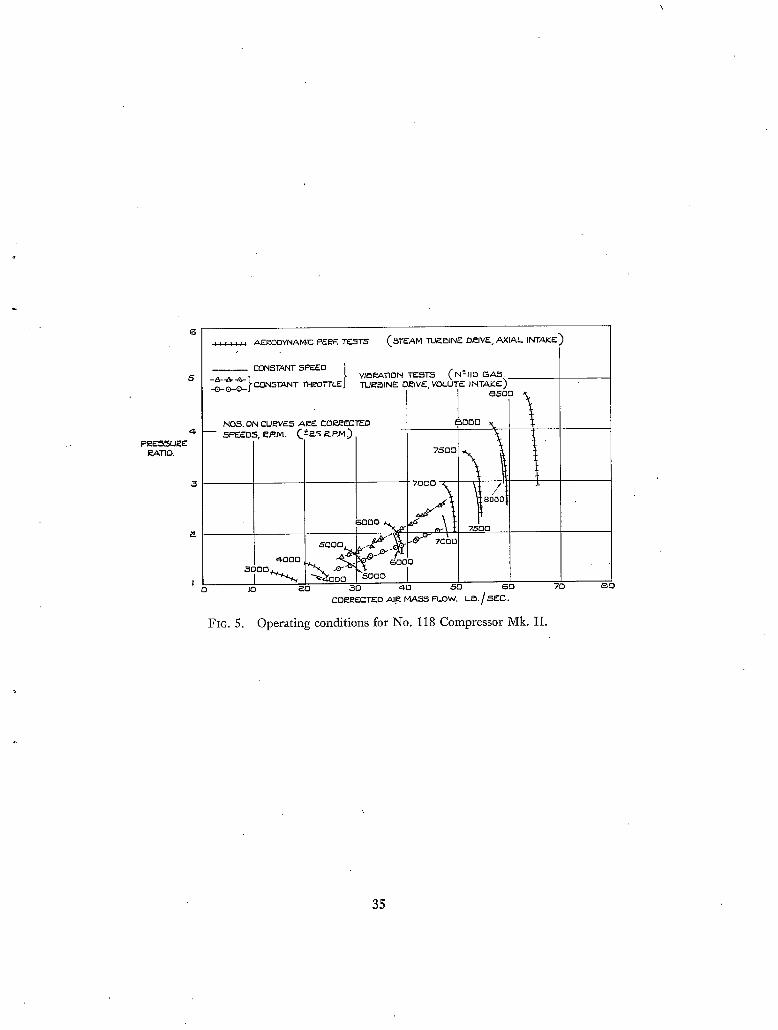
5
P~E~SU~E IP-.ATIO.
I : : : : : : AEI~0DYNAM{C PEtE TE~T.5 (.51"~AM TU~F~INE OI~IVE. AXIAL INTAKES)
CONSTANT 5NEED [
-~s--~--~- TUI~FNNE DelVE, VOLUTE INTAr.E) _~_G_Q_~r_.~NSTANT THEOTTLEJ" VII~.ATION TEST..~ (N~-115 E~AS.
8500
NO5. ON r'U~VE5 . ~ E EO~F-.E.TEO F~DO0 ~ t . - - SPEEDS' I~'P'/sl' C ; ~ '~'P'/Vl'~ 7500 .%k%. ~
7ooo ~ . (i / ' t
4ooo . ~ dooo
0 I0 ~.0 30 40 50 60
EOi~ECTED AII~ MA55 FLOW. L~ . /SEE. 7O
FIG. 5. Operating conditions for No. 118 Compressor Mk. II.
~ u
35

%
L~ Z
<
z 3 _z x <
0 ~-0o0
~-AD E "E a-. ~I-,O.- ;-
":..STATIC "=.~-.~.CP...5. ~7
G-- -" O ; O ~ " 0 - -
,5000 6 0 0 0 7000 ~.RM.
+-15
-'10
-*,5
,q.P_.,=
I~LADE.T.II. I~:1..~op_. ~TATIC -~31.C.P.5
,q.a7 /
4 0 0 0 5 0 0 0 6 0 0 o 7000 I~.P.M.
±1,5
-*10
~LADE T.31 r ~ 4 4 7 STATIC ~.-.~1-46.CP.5 ~'~'P- [ I
o o
'q, O00 5 0 0 0 . r=OOO 7 0 0 0 ~.P-M.
(NOTE :-NUblF~E~5 ON CUt~VE5 .SHOW TI~END~ IN VlP, P--.ATIOIN F~'O~UEINCIEI~, C.P.-~ .)
FIG, 6. Predominant stresses in first-stage stators (Constant-throttle setting tests).
tO z
~o +1
z_
< E -i
Z
l
±10
-+,E
0 ~O00
~LADE TI9 .TATE -- 516 .s.
517
o / ~ l 2. 5PI
~000 6 0 0 0 7000 I~.P.M.
-'15
-+to
± 5
0 ~EIO0
t~LADE B.3
"~STATIr" "=" 5 ~ ' 3
5OOO 6 0 0 0 7 0 0 0 ~.P,r,1.
+-15
-+10
+-5
t~LADE 15,11
~'-.STATIE "=" 5 3 5
o
o 4O00 5000 7 0 0 0
5 ~ 5
Q Q ~._3
\ sa~l. \ _
r:~oo I~.P.M.
( 'NOTE: -NUMBE~5 ON CUI~VF-..5 5HOW TP--EIND5 IN VIF~P--.~.TIOINI 5TI~E.5.5 FPEQUEINCIES) =.p.s.)
FIG. 7. Predominant stresses in second-stage stators (Constant-throttle setting tests).
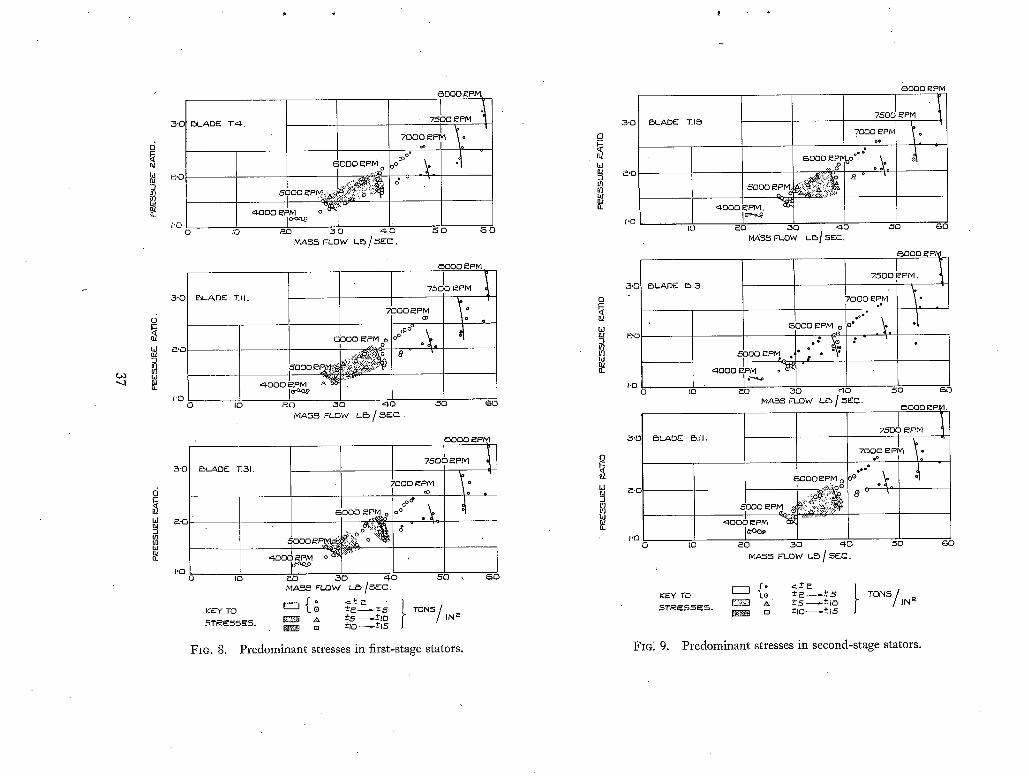
~'C
~'0
I ' 0 0 lO
3 " 0 B L A D E T I I .
~'O
( A W
I'O 0 IO
3 - 0
d
W
tO m M
I 60130 I~PM o
5°00 ~ ~.~ ~;.f~!.,.:';:.'!.:'.~
~1313 I~PM o
613Q0 l~pIv
. 75L0 e M "t • I 7000 ~PM ~ :
~o 30 40 ,50 , S u MA55 FLOW LB/~.
15000 ~PM
@ !
P ~ O 0 I~PM 0 °°~9°~
~1313o
~0 ~0 ~0 ~0 FLOW LI5 / ~ MA5~
!
P-'0
I 'D 13
~LADE ~31.
IO
~EY TO
0000 t~PI
7 5 O 0 mPM I
o:" ~n1313 I~PM o
,~001~ ~ I~PN o "*~ ;¢?J"
1 o.,~q o ~-0 3 0 4.0 5 0 ,Bu M A 5 5 FLOW LB /5~0.
& ±5 - - ~ l O IN a o -+113 - - -~15
Predominant stresses in first-stage stators.
3 ' 0
0
l.d
m
w
I '0
Ul I1/ 3
5 r
P*C
I'O
,~'0
p-n
BLADE T.k9
IO
B L A D E B . 3 .
IO
5 0 0 0 l~plv o - ¢
400D I~PM. " ~
i~O ~13 ,=1.0 NA55 FLOW L 6 1 5 ~ i
0131313 RPM r
7S013 ~PM " 1
Do a
6 0 0 0 ~PMo o°° ° .=~.o ° o .
6!-A13E Bi l l .
513 6U
.o I ~0130 I~PM o ~"
o°: .~ : 5 0 0 ° i~PM * *
~13 ~ 0 4 o MA55 FLOW L6 /
I
5F'C, I
60130 I~PM o
4000 !~pNI
E50013 I~PI'
I ..oo:.-. 1 70o0 ~ .~ I : "
5 0
~1300 I~PI
I ~PM t 750 T
7ooO~moOO : 12 @u
o O o
1,13 0 113 ~13 3 0 ~,0 513
M A 5 5 FLOW L O [ S E C . J
KEY ro I~] ~ a ~ s rarqs ~ T R ~ 5 5 ~ 5 . ~ ~ ' -+S ~ + - 113 IN e
o - * J 0 ~ ± 1 5
6 u
G O
FIO. 8. FIG: 9: Predominant stresses in second-stage stators.

Z 0 P +1
tO IG OZ I- L0
9 <
Z < Ld N
+~0
+-iO
*-5
o 4000 6 0 0 0 7000
R / I \ o /
5 0 0 0 £.P.M. -N
(0.) 5 T ~ E S 5 A M P L I T U D E C H A I ~ A C T E i ~ I S T I C
~d a2 O ~h
~o 5
(It L
4 5 0
4,~0 o
6o#'olI,o 45 N ~ 430
4@0 4OOO
/
/ 7 t /
/
/ I
I e "
/ 8oj'o Io,.o.45 N
5 0 0 0 6 0 0 0 7 0 0 0
i~. P. M , - N
KEN TO 5 T ; ~ E 5 5 E 5 ± 5 . ~ + 1 0 T O N S / I N a
13 ± 1 0 ~ +_ 15
(6) 5-[eESS reE~UKNCh" CHA~A, CTKRISTIC
CON5TANT THI~O'TTLE S E T T I N G EUNS. ' )
Fins. 10a and 10b. Predominant component from magnetic- tape analysis (First-stage stator; Blade T.4)
% Z
tQ ±~ &/ I--
<
E O '=t.000
3"O
0
W ~ , ' 0
3
W
I 'O
@ 3 0
d o o d-----~-~ ®
5000 ~=000 70O0 ~.P.M.
A ) C O N S T A N T TH~OTTLF" 5KTTIN~ ~ L I N S ,
I 700O !~.R.M.
o 6OO0 • oo
5000 o$ ~* : g ° " m o I I ~ . P . M . ~ m
G ,o a g o
'::14300 I~.IRM :o o'~
tO ~.0 ~ 0 4 0
MA5S FL.OW ~ - ~ / ~ E ~ .
KEY TO ST~E..~SE5 • ~ I- ~ l
5 T ~ F 5 5 C.~NTOLII~5 .
~00 I~.RM.
7500 ©I ~.P.M.
I m
, 5 0
T O I N S / I IN a
FIGS. l l a and l lb . Predominant stresses in inlet guide vane.

(.o
~5"0
td 112 ,:l-~:l-O d
~,~0 Ld
bJ
'~.~0 ,~tO00
: ~ O / 0 0 , 0 (DO o!ff ~,~,,, ' , ~ ,~ j , I\ / '% ,,,
I \ % o ' \ STATIC "=. ~-.-~ 9.C.R S! p=l / / P p :
~5.=~DOO (50OO ~J:?M.- N .
7000
~ O
Oz
U Z ~-DO D (3 kd
4~O
~LADE T ll / /
:STATIC --~I.C.P.N. a / I / Z, A i/
/ / ~ 0 I 0 ~ ~ _ ~ll ~ o / 0 0
a A A/ u,..~. ,{ %,9 ,o . o o
;7t'% ~ 0 0 0 5000 6 0 0 0 7000
!~.RM. -N .
~1-60 BLADE T.31
FSTATIC "=.r44,B.C.R~ I
112 4 5 0 / OO 0 o d 0
>- ~ U (D / /~ ~. 0 ,,:,l ~ -/A D -~x o / k ~ ,~ / i oO
",., . , \ '~,'30 p7-11 p-IO p=9
~00o 5oooz~ I~.I~M.-N 6 0 o o 70oo
<-+P } e -+a ~ -+5
KEY TO mT~ES~JES ~ ~-5 ~ r io TONS / IN a [:3 ~10 ~ Z I 5 X :" ~1,~
@OT~ :- D O T T ~ UN~S ae~ ricers 0~ sea c . r x o.~sN.)
FIC. 12. Predominant blade vibration frequencies. First-stage stators.
5 '40 BLADE T 1.9 /
jISTATIC "=.. SlGc.p.5 /4 / / / • {12 LJ ,se.o ~ /~l~,. '~1 ° ~ / °
o x,. / 0 (' 0 / ~ ~oo{, >. ~, / //~. , ( ~ / 1 o "e U ® ,~ / O9/ z o _ g/ o
, = i o,c i ~M I / / ~ p__ i /
==1.5 / p=l l ,:t~C
'~t.0OO ~'000 GO00 7000 ~.RM. - N
$ 5 0
ll; 5..~0 U
>- u Z
i ,5"10
, ~90 4 0 0 0
570
BLADE 15.3
/ E) ~ / I 0 /o o
! /o o o
,,• / • , , go . - / ° / / c,,,, ? / %/ • / •
o p o/1 o / 10
% ,/ ,/ /
I p=lP- i / p .11 /
a 5000 o
/ 6000 i I t~.P.M.-IN.
/ d
BLADE £5.11
~.-% TATI C ~--" 535c.p.s
7000
n' O d 5 5 0 zi / / /
t~ ® . A ~ , ~ O 0 '6 o •
5~0 0 I 0 0 ,,/ c •
D 0 0 11 ~ A i I .0 o
51D ~-00O 5 0 0 0 GOOD 7 0 0 0
~.P.M. -N .
KEY TO 5TI~E5 A ~5 ~-+I0 TONS IN a [] + - I O - - Z I 5
(NOTE :--DOTTED LINES AI~E PLOTS OF" 603 E = I o x .0"45 N ?
FIG. 13. Predominant blade vibration frequencies. Second-stage stators.
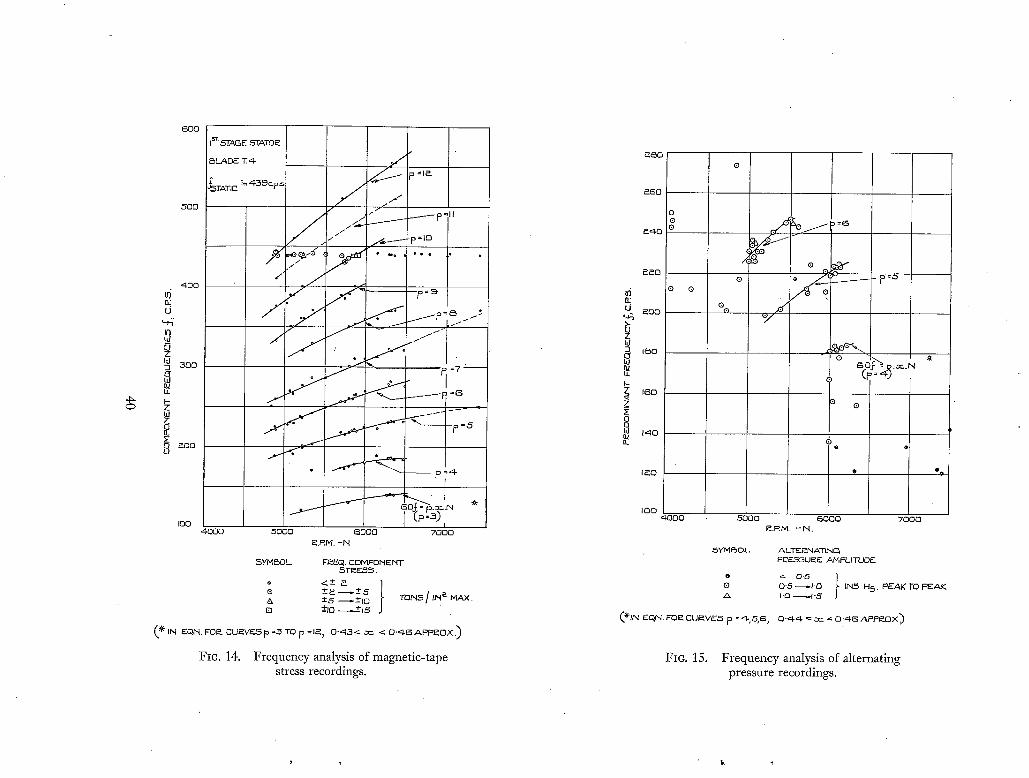
4~
lS'r',.-fiTAG E STAT0 ,P-.
i OLAD~ ~ 4-
~,STATIff. ~ 4~9c.p.~
~ - - - = =1~.
, I , / ~ / p = l l
/
/ . ~_--.p=lo
f / K
/ ,/ /
- / ~00
[Pl / ~ ~ * " " _~ , ¢ . /
~ O O ~, "
0 ~ 0 0 ,,~.~ , 'A'~"
IOO 4 0 0 0 5 0 0 0 a 0 0 0 7 0 0 0
I~.RM. - N
5Y'N ES0/,..., FI~EGI. COMPONENT
A -*5 ~ ± 1 0 MAX.
B -+10 ~ - ~ 1 5
(~q~-IN EQIN. FOP-.. E:UI~VESp =.,.~ TO p = le) O-.=I....N~ co.. < 0.'~,-6 A P P E [ O X , )
FIO. 14. Frequency analysis of magnetic-tape stress recordings.
~ 0
0; [.I
~oc
U Z
3 100
t - 160
0 Q W 1"40
O Q
O
,•Q/ ) = 6
o
0
o Q
®
100 '~-000 5OOO 6 0 0 0 7 0 0 0
~.P.M. - - N .
5YYI~50L ALTERNATING PI~E55UEE ANJFL, ITUOF_
e ~- 0"5 ]
O 0"5 ~ 1 - 0 I IN5 H 5 . PEAK TO P E A K A I '0 ~ 1 - 5
(~INEqN. FOI~CU~VESp=~t-5,6, 0-,=1.~, ~ o~ ,~ 0 . 4 6 A P P ~ 0 X .)
FIC. 15. Frequency analysis of alternating pressure recordings.

q.
4
Z LJ L; L- I, 1J O L2
LJ (0
U3 OZ
tO tO M
n
0'8
0.7
0.6
0"5
0"4
0.3 O,~
I% "r. 5TAG E-
/ /
8UE55EQUE.N-r ~,E.P~OD'Y NAM I C P EP-,FOI~ M~,NCE~, /
/ /
/ !
! /
!
8550 R.RM.
/
[~, P. M. x 4000 O 5000 Q 6000 + "7000 ~, 7500
0-3 O' 4 O. 5 O.6 0"7
0"8
0,7
0"S
0"5
~N_o 5 T A G E.
SU555QUKNT AERODYNAMIC PE~FO~MANC~ / ~TESTS. k V/
/ / I I I I
0'4
0,2 O'~
7500 ~. P. k.'l.
log R.P.M. X 4-000
5000 m 6000 + "7000 h. 7500
o E]
0"5 O" 4- 0"5 0"6 VLOW C.OE~-FICENT, X/m/u-
FIG. 16. Stage characteristics.
8350 R.R M /
0'7
41
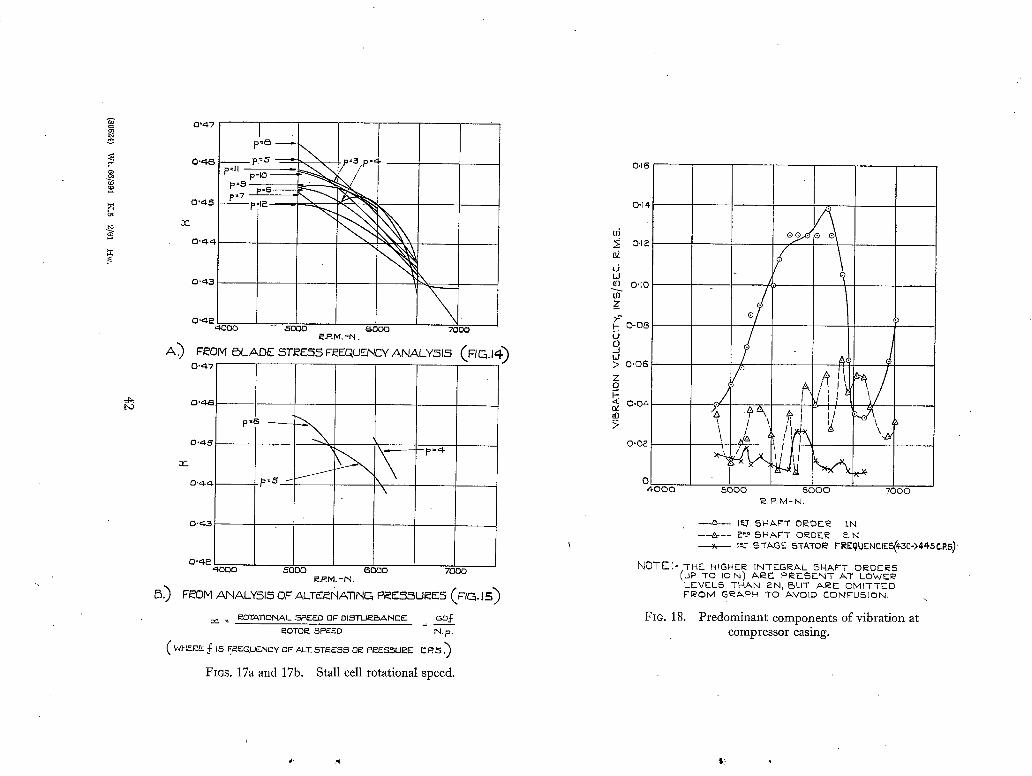
#
bP
0"47 I
p=ll
a: Pi ~a
0.¢~ 3
A)
O.~,~ ~I000
&
7000 ~DO0 ~OOO ~.RM, "N .
F~OM BLADE ~Tl~'E,...fiS F~EQUENCY ANALY~I~ (FIG.I~)
0.~14
0.45
3C
O"~-3
0"~,~ *~OOO
/
5 0 0 0 6 0 0 0 7OOO I~.RN. -IN.
15.) F~0N ANALYSIS OF ALTEP-.NATIINQ PeE~SUI~E5 (F IG. '5 )
:~ = I~OTATIONAL .-~PEED OF Dh..~TUI~ISANE:E BID[ =
EOTOI~ SPEED N.p.
( WHERE 3 (: I.~ FI~EQUENCY OF ALE. 5T;=ES~ O~ PI~ESSUi~E r' .R~ , )
Fins. 17a and 17b. Stall cell rotational speed.
0,10
0"14
0.I~ s£ LJ i.I
0 " I 0
Z
t ) 0 / tJ > 0 , 0 6
Z _q
0 . 0 4 n/ 10 >
O'Oa
o 4000
/
5000 6000 7000
Et.R M - N .
1~ 5HA~'-r OEOE~ LN
~, Is- Ir ~-f,~,GE 5TATOI~ FI~E~UENCIE,~'430->445CP.5.~.
NOTE" ',- THE. HIGFIEle INTEGP-.AL 5 R A F T O~DEI~S (UP TO IO N) AP-.E_ P I ~ E . S E N T A T LOWEI~ L E V E L $ T H A N 2N , B U T A I~E O M I T T E D V l e O M G ~ A P N TO A V O I D C O N F U S I O N .
FIG. 18. Predominant components of vibration at compressor casing.
Publications of the Aeronautical Research Council
ANNUAL TECHNICAL REPORTS OF THE AERONAUTICAL RESEARCH COUNCIL (BOUND VOLUMES)
I9¢X Aero and Hydrodynamics, Aerofoils, Airserews, Engines, Flutter, Stability and Control, Structures. 63s. (post zs. 3d.)
I942 Vol. I. Aero and Hydrodynamics, Aerofoils, Airserews, Engines. 75s. (post as. 3d.) Vol. II. Noise, Parachutes, Stability and Control, Structures, Vibration, Wind Tunnels. 47s. 6d. (post xs. 9d.)
1943 Vol. I. Aerodynamics , Aerofoils, Airscrews. 8os. (post 2s.) Vol. II. Engines, Flutter, Materials, Parachutes, Performance, Stability and Control, Structures.
9os. (post 2s. 3d.) I944 Vol. I. Aero and Hydrodynamics, Aerofoils, Aircraft, Airserews, Controls. 84s. (post 2s. 6d.)
Vol. II. Flutter and Vibration, Materials, Miscellaneous, Navigation, Parachutes, Performance, Plates and Panels, Stability, Structures, Test Equipment, Wind Tunnels. 84s. (post 2s. 6d.)
t945 Vol. I. Aero and Hydrodynamic, Aerofoils. x3os. (post 3s.) Vol. II. Aircraft, Airserews, Controls. 13os. (post 3s.) Vol. III . Flutter and Vibration, Instruments, Miseellarteous, Parachutes, Plates and Panels, Propulsion.
r3os. (post as. 9d.) Vol. IV. Stability, Structures, Wind Tunnels, Wind Tunnel Technique. 13os. (post as. 9d.)
1946 Vol. I. Accidents, Aerodynamics, Aerofoils and Hydrofoils. z68s. (post 3s. 3d.) Vol. II. Airscrews, Cabin Cooling, Chemical Hazards, Controls, Flames, Flutter, Helicopters, Instruments and
Instrumentation, Interference, Jets, Miseellane0us, Parachutes. i68s. (post 2s. 9d.)
1947 Vol. I. Aerodynamics, Aerofoils, Aircraft. 168s. (post 3s. 3d.) Vol. II. Airscrews and Rotors, Controls, Flutter, Materials, Miscellaneous, Parachutes, Propulsion, Seaplanes,
Stability, Structures, Take-off and Landing. i68s. (post 3s. 3d.)
Special Vol.
Vol.
Vol.
V o l u m e s I. Aero and Hydrodynamics, Aerofoils, Controls, Flutter, Kites, Parachutes, Performance, Propulsion,
Stability. za6s. (post 2s. 6d.) II. Aero and Hydrodynamics, Aerofoils, Airserews, Controls, Flutter, Materials, Miscellaneous, Parachutes,
Propulsion, Stability, Structures. 147s. (post 2s. 6d.) I IL Aero and Hydrodynamics, Aerofoils, Airscrews, Controls, Flutter, Kites, Miscellaneous, Parachutes.
Propulsion, Seaplanes, Stability, Structures, Test Equipment. I89s. (post 3s. 3d.)
Reviews of the Aeronautical Research Council 1939-48 3s. (post 5d.) 1949-54 5s. (post 5d.)
Index to all Reports and Memoranda published in the Annual Technical Reports 19o9-1947 R. & M. 2600 6s. (post 2d.)
Indexes to the Reports and Memoranda of the Between lXlos, a351-2449 R. & M. Between Nos. 2451-2549 R. & M. Between Nos. 2551-2649 R. & M. Between Nos. 2651-2749 R. & M. Between Nos. 2751-2849 R. & M. Between Nos. a851-2949 R. & M.
Aeronautical Research Council No. 245 ° 2s. (post 2d.) No. 2550 2s. 6d. (post 2d.) No. 2650 2s. 6d. (post 2d.) No. 2750 2s. 6d. (post zd.) No. 2850 2s. 6d. (post 2d.) No. 2950 3s. (post 2d.)
HER MAJESTY'S STATIONERY OFFICE from the addresses overleaf

R. & M. No. 3181
© Crown copyright I96I
Printed and published by HER MAJESTY'S STATIONERY OFFICE
To be purchased from York House, Kingsway, London w.c.2
423 Oxford Street, London w.I x3A Castle Street, Edinburgh 2
Io9 St. Mary Street, Cardiff 39 King Street, Manchester
5o Fairfax Street, Bristol z 2 Edmund Street, Birmingham 3
80 Chiehester Street, Belfast z
or through any bookseller
Printed in England
t
R. & M. No. 3181
S.O. Code No. z3-318I


![Chapter 18 - Combined Stresses Reading: Chapter 18 ... Notes/Pgs292-306.pdf294 18-2 Combined Axial and Bending Stresses Example 18-1 [Converted to U.S. Units] The wide-flange shape](https://static.fdocuments.in/doc/165x107/60c1e7ed7381ef3a4869e6d5/chapter-18-combined-stresses-reading-chapter-18-notespgs292-306pdf-294.jpg)