BlackRock Global Funds (BGF) - TeleTrader.com...The market instability experienced in mid-2011 is...
280
BlackRock Global Funds (BGF) Audited Annual Report and Accounts 31 August 2011 R.C.S. Luxembourg: B.6317
Transcript of BlackRock Global Funds (BGF) - TeleTrader.com...The market instability experienced in mid-2011 is...

BlackRock Global Funds (BGF)
Audited Annual Report and Accounts31 August 2011
R.C.S. Luxembourg: B.6317


Audited Annual Report and Accounts 1
Contents
Subscriptions may be made only on the basis of the current Prospectus, together with the most recent audited annual report and accounts and unaudited interim report and accounts. Copies are available from
the Investor Services Centre, the Transfer Agent, the Manager or any of the Distributors.
Chairman’s Shareholder Letter 2
Investment Managers’ Report 3
Board of Directors 6
Management and Administration 6
Statement of Net Assets 7
Three Year Summary of Net Asset Values 13
Statement of Operations and Changes in Net Assets 30
Statement of Changes in Shares Outstanding 40
Portfolio of Investments
Asia Pacific Equity Income Fund 54
Asian Dragon Fund 56
Asian Tiger Bond Fund 58
China Fund 61
Continental European Flexible Fund 63
Emerging Europe Fund 65
Emerging Markets Bond Fund 67
Emerging Markets Equity Income Fund(1) 71
Emerging Markets Fund 73
Euro Bond Fund 75
Euro Corporate Bond Fund 83
Euro Reserve Fund 89
Euro Short Duration Bond Fund 90
Euro-Markets Fund 98
European Enhanced Equity Yield Fund 99
European Equity Income Fund(1) 102
European Focus Fund 103
European Fund 104
European Growth Fund 106
European Small & MidCap Opportunities Fund 108
European Value Fund 110
Fixed Income Global Opportunities Fund 111
Flexible Multi-Asset Fund 115
Global Allocation Fund 122
Global Corporate Bond Fund 137
Global Dynamic Equity Fund 145
Global Enhanced Equity Yield Fund 156
Global Equity Fund 160
Global Equity Income Fund(1) 162
Global Government Bond Fund 164
Global High Yield Bond Fund 168
Global Inflation Linked Bond Fund 175
Global Opportunities Fund 178
Global SmallCap Fund 181
India Fund 184
Japan Fund 185
Japan Small & MidCap Opportunities Fund 186
Japan Value Fund 188
Latin American Fund 189
Local Emerging Markets Short Duration Bond Fund 191
New Energy Fund 194
Pacific Equity Fund 196
Swiss Small & MidCap Opportunities Fund 198
United Kingdom Fund 199
US Basic Value Fund 200
US Dollar Core Bond Fund 202
US Dollar High Yield Bond Fund 211
US Dollar Reserve Fund 219
US Dollar Short Duration Bond Fund 221
US Flexible Equity Fund 226
US Government Mortgage Fund 228
US Growth Fund 231
US Small & MidCap Opportunities Fund 232
World Agriculture Fund 234
World Bond Fund 236
World Energy Fund 242
World Financials Fund 244
World Gold Fund 246
World Healthscience Fund 248
World Income Fund 250
World Mining Fund 255
World Resources Equity Income Fund(1) 257
World Technology Fund 259
Notes to the Financial Statements 261
Audit Report 271
General Information 273
(1) See Notes section.

2 BlackRock Global Funds (BGF)
The information stated in this report is historical and not necessarily indicative of future performance.
BGF Chairman’s Letter September 2011
Dear Shareholder
I am writing to update you on the activities of BlackRock Global Funds (BGF) over the 12 months to the end of August 2011.
The performance of the Funds is covered in more detail in the separate Investment Manager’s report. However, you will see from the report
that capital markets generally continued to make progress during the early months of this period but followed a much more erratic path so
far in 2011. The key features driving increased market volatility have been concerns over global economic growth (especially in the United
States and China) and a generalised pressure on peripheral eurozone countries as a result of their sovereign debt crisis. The high volatility
levels over the period, and particularly over the summer of 2011, can be portrayed by the movements of the MSCI World Index (a broad
indicator of the performance of global developed equity markets). This rose by around 25% (in US dollar terms) from end-August 2010 to
end-May 2011 but then dropped sharply, by around 16% from its high, through early August 2011 before recovering over the last couple of
weeks of that month, to close the period up 12.1% overall.
Bond yields remained low in all major currencies. In mid-August 2011, the US 10-year yield touched a record low (under 2%); the German
10-year bond yield fell to an 11-month low as stock markets declined, boosting demand for the safest assets; whilst interest rates on
UK Government debt also fell to a record low as mounting concerns about the US and Europe augmented Britain’s safe-haven status.
The market instability experienced in mid-2011 is reminiscent of the traumatic events of 2007-09. Investor confidence has been hit, not
only by concerns regarding reduced economic growth but, perhaps more importantly, also by the sense of “déjà vu” related to a potential
global financial crisis. This combination of factors has translated into a widespread risk-aversion on the part of investors which was
increasingly pervasive at the period ended.
Despite this volatile market background, the assets under management (AUM) in the BGF range have increased by 16% over the period,
from $82.9bn to $96.2bn. Whilst flows of investor funds into the range were positive, the majority of the increase was attributed to market
movements. However, four of the Funds have more than doubled in size in the last twelve months, largely driven by flows. The largest
increase in US dollar terms came from the World Mining Fund, which has increased by $2.6bn (19.4%). Three other Funds have increased
in size by more than a $1bn: the Global Allocation Fund ($2.2bn), the World Gold Fund ($1.8bn), and the World Energy Fund ($1.7bn).
The positive flows into our Natural Resources Funds reflect the generally strong performance of commodity prices. Commodities have
performed well despite the turbulent economic background, indicating continued significant demand from emerging economies, together
with growing concerns regarding inflation and the stability of developed world currencies.
The largest increase in percentage terms came from another Fund in the resources sector, the World Agriculture Fund, whose AUM rose
by 937.7% from a low base to $588m. This increment reflected strong inflows from investors interested in the expanding investment
opportunities provided by the agribusiness.
The majority of BGF Funds saw an increase in AUM over the period. However, 18 Funds experienced a decrease in AUM terms. The most
significant of these was the Euro Short Duration Bond Fund, which declined from €3bn to €1.9bn. This was largely due to the very low
levels of interest rates now available in short duration euro bonds in core markets, which lead investors to look for opportunities elsewhere.
We continue to manage the BGF equity range actively to make sure that it meets the future needs of our clients. There were four Fund
launches over the period:
The Global Equity Income Fund launched on 12 November 2010
The European Equity Income Fund launched on 3 December 2010
The World Resources Equity Income Fund launched on 15 April 2011
The Emerging Markets Equity Income Fund launched on 12 August 2011.
Our decision to launch an equity income range reflects the fact that never in recent history has the search for income been so elusive.
With yields on traditional fixed income at historic lows, it is increasingly difficult to find core investments that generate meaningful yields.
With the yield of many equity markets exceeding that on 10-year government bonds, we believe these Funds offer interesting opportunities
to income-seeking investors.
Should you have any questions on any of this material, please contact us via our website: www.blackrockinternational.com
Yours faithfully,
Nicholas C.D. Hall
Chairman

Audited Annual Report and Accounts 3
The information stated in this report is historical and not necessarily indicative of future performance.
BGF Investment Managers’ Report Performance Overview1 September 2010 to 31 August 2011
Improving economic environment towards the end of 2010 was shattered by macro shocks and volatility during the first half of 2011 Despite continued macroeconomic moderation, global markets
rallied in September 2010, as the US Federal Open Market
Committee (FOMC) minutes sparked rumours of a second round
of quantitative easing (QE). Equity Market volatility remained at
normal levels, government bond yields remained at low levels but
returns were slightly negative.
Global equity markets climbed higher in October as emerging market
strength and speculation around further quantitative easing (QEII)
in the US proved supportive. Volatility rose slightly and government
bond yields sold off, pricing in a degree of disappointment over the
proposed QEII. Nevertheless, US economic data continued to make
small improvements. Manufacturing and service confidence, retail
sales and the labour market each showed signs of stabilisation. This
US stabilisation continued into November as the country’s equity
markets only fell off 20 basis points, while the rest of the world fell
50 basis points. Ireland followed Greece as the second peripheral
European country to be bailed out and received an €85 billion
rescue package. As a result, government bonds – in particular those
issued by governments within the European periphery – suffered
in a climate of sovereign uncertainty. The US dollar appreciated
against all currencies, whilst the euro sold off as sovereign concerns
undermined robust German data.
World markets continued December’s strong performance for
the first half of January. Fears surrounding peripheral Europe
and the US economy abated, and as a result developed markets
outperformed developing markets. Emerging countries suffered
from the headwinds of geopolitical risk and fears of monetary
tightening from rising inflation, dogged especially by fears of
economic overheating within China. Equity market volatility rose
somewhat, but remained well below the highs witnessed at the end
of June 2010. The dollar weakened further versus the euro and
sterling, but strengthened versus the yen.
Global equities began 2011 continuing on from December’s strong
performance, but as the year progressed, market volatility increased.
Both global equity and fixed income markets bore the brunt of the
re-emergence of the European sovereign debt crisis, the political
uncertainty brought by the Arab Spring, the human suffering and
supply chain disruption catalysed by the Japanese Earthquake as
well as the uncertainties surrounding the US debt ceiling debate.
Developed markets continued to outperform emerging countries,
which suffered from the headwinds of geopolitical risk and fears
of monetary tightening from rising inflation. Conflict across the
Middle East and North Africa (MENA) exacerbated the tightening
oil supply and led to a 13.4% increase in the oil price. Inflation in
both Europe and the UK remained stubbornly high due to global
increases in commodity prices. Despite concerns over sluggish
growth, the European Central Bank (ECB) raised the repo rate by
0.25% to 1.25%. Core inflation around the US remained around
trend as policy makers discussed the potential end of the second
wave of QE.
Many of these geopolitical themes continued to develop
throughout the second quarter of 2011. The sovereign debt crisis
in the eurozone periphery once again took centre stage in financial
news on rumours of Greek restructuring, while the turmoil and
involvement of NATO forces in Libya showed no sign of abating. In
addition, local elections in Spain and Germany and the debate in
Washington over the US debt ceiling also raised investor concerns.
Economic data released began to point to a more pronounced
slowing of economic growth, while consumer price inflation
remained staunchly above central bank targets in the eurozone
and the UK. In July, the ECB raised rates further, by 0.25% to 1.5%
and towards the end of the period, the International Energy Agency
(IEA) announced the release of 60 million barrels of oil from its
strategic petroleum reserves, softening prices during the summer
driving season.
The end of the period brought another bout of sustained market
volatility. The European Banking Authority announced the results
of the EU-wide banking stress tests on 15 July. Eight institutions
were deemed to fail the test, but many market commentators
subsequently noted that the tests may not have been stringent
enough. Credit spreads widened over July and August and market
volatility increased as investors worried about consistently weak
economic data as well as the possibility that the Greek sovereign
debt crisis could spread to Italy and Spain. At the end of August,
the US remained locked in a political stalemate regarding whether
to increase its debt ceiling, finally coming to an eleventh hour
agreement, only to be subsequently downgraded by S&P from
AAA to AA+.
Fund PerformancePerformance data stated is for the main (A) share class of the
relevant Fund, stated in the base currency of the Fund.
Equity Fund PerformanceOur BGF World Gold and BGF World Mining Funds were the top
performers, returning 25.3% and 23.0% respectively. On the back
of macro volatility and uncertainty as well as an on-going period
of negative real interest rates, and central bank buying, the gold
bullion price has repeatedly climbed to new highs. The BGF
World Gold Fund has focused on those companies well suited to
take advantage of these trends, providing leverage to the gold
price. Despite being at the forefront of the risk-on/risk-off trade,
commodities – and by extension, the BGF World Mining Fund
– have also benefited from growing demand from emerging market
growth. As a result of broadly elevated commodity prices, many
companies within the sector have enjoyed high volumes of free
cash flow on many commodity producers’ balance sheets, which
has in many instances been returned to shareholders via buybacks
and dividends.

4 BlackRock Global Funds (BGF)
The information stated in this report is historical and not necessarily indicative of future performance.
BGF Investment Managers’ ReportPerformance Overview1 September 2010 to 31 August 2011 continued
By contrast, the BGF India Fund garnered the worst performance,
falling 9.7% over the period. During the first half of 2011, macro
headwinds in the form of high oil prices, a rising current account
deficit and tight liquidity in the money markets dragged on
returns. Added to this, the spate of news on corruption scandals
significantly dampened investor sentiment towards Indian equities.
Fixed Income Fund PerformanceOver the period, our BGF Local Emerging Markets Short Duration
Bond Fund was the stand out performer within our fixed income
offering, returning 7.9% over the year. The Fund was positioned
more defensively from the fourth quarter of 2010 through to
period-end, in a move to protect the portfolio from sustained
volatility, European credit woes and reduced liquidity. The BGF
Global High Yield Bond Fund was the second-best fixed income
performer, returning 6.8% over the period. As traditional ‘save
haven’ fixed income securities such as Treasuries are yielding
record-lows in the low-rate environment, higher yielding bonds
are an attractive alternative and have historically performed well
in post-recessionary environments. The portfolio participated in
the high yield new issues throughout the period, seeking higher-
quality securities, in particular senior-secured bonds with improved
downside protection. Security selection and overweighting toward
independent energy in particular aided the Fund’s performance.
Given the sustained crisis within European sovereign debt, it may
not be surprising that the BGF Euro Bond Fund was the biggest
laggard within our fixed income funds, falling 1.2%. As the ECB
began the rate hiking cycle, the Fund’s yield curve positioning in
the second quarter of 2011 failed to offset the market’s steepening
moves. The Fund’s duration positioning also detracted. Towards the
end of the period, inflation-linked exposure detracted modestly, as
did exposure to high-quality securitised names.
Mixed Asset Fund PerformanceThe BGF Global Allocation Fund, which holds equities, cash and
fixed income, returned 10.9% during the year. The Fund reduced
its equity allocation over the period in favour of fixed income
and cash. Particularly over the period, the Fund has maintained
overweights in the Brazilian real, Singapore dollar, Russian ruble
and Swiss franc, as well as several small Asian currencies.
The BGF Flexible Multi-Asset Fund posted a 0.8% decline over the
period. The Fund was continually stunted by its equity allocation,
particularly within European equities; these assets suffered from
sharp sell-offs and volatility over the latter half of the period in
particular.
Outlook:The global economy has slowed in recent months from the robust
growth rate that we witnessed around the turn of the year, while
inflation has remained stubbornly high in many countries. In
addition, ongoing concerns about the sovereign debt crisis in
the eurozone, the political stalemate in the US surrounding the
debt ceiling and the downgrade of US long-term sovereign debt
by ratings agency Standard & Poor’s from AAA to AA+, have all
conspired to dent confidence and increase investor uncertainty.
In the US, the debt ceiling was ultimately raised, but the way
the issue was handled did little to inspire confidence in the
management of US fiscal policy. The broad macro environment
has therefore become more demanding.
Asset markets responded to the various negative events with
a rally in fixed income and a sell-off across most equity markets.
Traditional safe havens, such as the Swiss franc, gold (and other
precious metals) and highly rated government bonds, have all
experienced a surge in demand. Although investor uncertainty
has predominantly stemmed from the sovereign debt issues on
both sides of the Atlantic, as well as economic data releases that
suggested a moderation in the pace of global growth, some of
the conditions that had been supporting investor risk appetite in
the first part of the year have also started to change. In particular,
the tailwinds that loose monetary and fiscal policies have provided
in many corners of the globe have started to be withdrawn.
For example, monetary tightening by the ECB and fiscal tightening
by the British government are already taking place, while in the
US QEII has come to an end and the new agreement to raise the
debt ceiling includes plans to reduce government expenditure.
Nevertheless, the exceptionally low level of real interest rates in
many developed economies suggests that monetary conditions still
remain very supportive.
As markets remain embroiled in macro concerns, we expect
headline inflation in many developed economies to stabilise and
trend modestly lower in 2012. Austerity programmes and slowing
industrial production will likely affect growth. As yet, high oil prices
have not had a deleterious effect on global economic activity, but
overall we expect higher energy costs to have a moderate impact at
current levels, reducing global economic growth by around 0.25%.
Overall, the European fiscal crisis is a greater threat to market
confidence than S&P’s downgrade of US long-term debt.
European growth is likely to be lower in 2012 than most market
commentators previously expected. Besides the blow to business
and consumer confidence caused by the sovereign debt crisis,
slowing global economic growth may also impact the hitherto
robust demand for exports from northern Europe.
Despite the announcement by eurozone policymakers on 21 July of a
new package of measures aimed at alleviating some of the sovereign
debt issues in the periphery, fears of contagion beyond Greece still
escalated in the following weeks, prompting the ECB to announce
that it would intervene to buy Spanish and Italian bonds. That the
private sector now has more clarity about the terms of a haircut on
the Greek bailout is helpful, but the problem has not gone away and
the European banking system is still, in aggregate, undercapitalised.
A real long-term solution would likely involve some serious pain and
readjustment for the banking sector, as capital is raised. We expect
that austerity programmes and slowing year-on-year growth rates on
industrial production will affect trend growth.

Audited Annual Report and Accounts 5
The information stated in this report is historical and not necessarily indicative of future performance.
BGF Investment Managers’ ReportPerformance Overview1 September 2010 to 31 August 2011 continued
In emerging markets (EM) there has been a focus on tackling
inflation over recent months, with several EM economies
raising interest rates and enacting other monetary tightening
measures, including China, Brazil and India. As many developed
nations struggle to grow this may lay the foundations for EM
outperformance. Broadly neutral returns are expected on both
fixed income and equity assets, and we expect commodities
to continue to trend positively. Whilst equities are currently
inexpensive but volatile, bonds are, by contrast, unequivocally dear.
The global economy has slowed in recent months from the robust
growth rate that we witnessed around the turn of the year. In
addition, the sovereign debt crisis in the eurozone is negatively
impacting markets and investor sentiment beyond Europe, and
numerous downgrades of sovereign debt over the past few
months by the ratings agencies have conspired to increase
investor uncertainty. However, although economic data releases
from the eurozone suggest a recession in that region and UK
economic growth is bordering on stagnant, third-quarter GDP data
releases for the US, Japan and China were positive. And while
the rate of Chinese economic growth may be decelerating, the
absolute growth rate remains robust. The exceptionally low level
of real interest rates in many developed economies suggests that
monetary conditions still remain very supportive. Furthermore,
some of the emerging markets are now commencing or starting to
contemplate looser monetary policy. Therefore, although it is going
to feel like a growth-challenged world for the rest of this year and
probably for much of 2012, a global recession is not our central
case, even if Europe continues to struggle.
Performance as at end of August 2011; Source: Morningstar; basis: NAV price with gross dividends
reinvested, net of expenses.

6 BlackRock Global Funds (BGF)
Board of Directors Managementand Administration continued
ChairmanNicholas C.D. Hall*
85 Briarwood Road, London SW4 9PJ, UK
DirectorsEmilio Novela Berlin*
Paseo de la Castellana 40 bis – 4a Planta, 28046 Madrid, Spain
Resigned: 4 February 2011
James Charrington*
Senior Managing Director, Chairman, EMEA
BlackRock Investment Management (UK) Limited
12 Throgmorton Avenue, London EC2N 2DL, UK
[new address with effect from 1 August 2011]
Resigned: 1 June 2011
Frank P. Le Feuvre*
Managing Director
BlackRock (Channel Islands) Limited
Forum House, Grenville Street, St. Helier, Jersey JE1 0BR
Channel Islands
Francine Keiser*
35, avenue J.F. Kennedy, L-1855 Luxembourg
Grand Duchy of Luxembourg
Appointed: 1 January 2011
Geoffrey D. Radcliffe*
Managing Director and General Manager
BlackRock (Luxembourg) S.A.
6D route de Trèves, L-2633 Senningerberg
Grand Duchy of Luxembourg
Maarten F. Slendebroek*
Managing Director
Head of International Retail Business, BlackRock Investment
Management (UK) Limited
12 Throgmorton Avenue, London EC2N 2DL, UK
Appointed: 21 February 2011
[new address with effect from 1 August 2011]
Douglas A. Shaw
Managing Director
BlackRock Investment Management (UK) Limited
12 Throgmorton Avenue, London EC2N 2DL, UK
[new address with effect from 1 August 2011]
Appointed: 9 June 2011
*All Directors are non-executives
Managementand AdministrationManagement CompanyBlackRock (Luxembourg) S.A.
6D route de Trèves, L-2633 Senningerberg
Grand Duchy of Luxembourg
Investment AdvisersBlackRock Financial Management, Inc.
Park Avenue Plaza, 55 East 52nd Street, New York, NY 10055, USA
BlackRock International Limited
40 Torphichen Street, Edinburgh EH3 8JB, Scotland
BlackRock Investment Management, LLC
800 Scudders Mill Road, Plainsboro, NJ 08536, USA
BlackRock Investment Management (UK) Limited
12 Throgmorton Avenue, London EC2N 2DL, UK
[new address with effect from 1 August 2011]
BlackRock (Singapore) Limited
# 18-01 Twenty Anson
20 Anson Road
Singapore, 079912
Sub-Investment AdvisersBlackRock (Hong Kong) Limited
Suites 3210-12 Tower 6,
The Gateway Tsimshatsui, Kowloon Hong Kong, China
BlackRock Japan Co. Limited
Sapia Tower 1-7-12, Marunouchi – Chiyoda-ku Tokyo,
100-0005 Japan
BlackRock Investment Management (Australia) Limited
18/120 Collins Street, Melbourne VIC 3000, Australia
Principal Distributor BlackRock (Channel Islands) Limited
Forum House, Grenville Street, St. Helier, Jersey JE1 0BR
Channel Islands
Investor ServicesWritten Enquiries: BlackRock Investment
Management (UK) Limited,
c/o BlackRock (Luxembourg) S.A.
P.O. Box 1058, L-1010 Luxembourg
Grand Duchy of Luxembourg
All other enquiries: Telephone: + 44 207 743 3300
Fax: + 44 207 743 1143
CustodianThe Bank of New York Mellon (International) Ltd
2-4, rue Eugène Ruppert
L-2453 Luxembourg
Grand Duchy of Luxembourg
Fund AccountantThe Bank of New York Mellon (International) Ltd
2-4, rue Eugène Ruppert
L-2453 Luxembourg
Grand Duchy of Luxembourg
Transfer Agent and RegistrarJ.P. Morgan Bank Luxembourg S.A.
6C, route de Trèves, L-2633 Senningerberg
Grand Duchy of Luxembourg
AuditorPricewaterhouseCoopers S.à r.l.
400, route d’Esch, B.P. 1443 L-1014 Luxembourg
Grand Duchy of Luxembourg
Legal AdvisersLinklaters LLP
35 avenue John F. Kennedy, L-1855 Luxembourg
Grand Duchy of Luxembourg
Listing AgentJ.P. Morgan Bank Luxembourg S.A.
6C, route de Trèves, L-2633 Senningerberg
Grand Duchy of Luxembourg
Paying AgentsA list of Paying Agents is to be found on page 273.
Registered Office2-4, rue Eugene Ruppert
L-2453 Luxembourg
Grand Duchy of Luxembourg
[new address with effect from 27 May 2011]

Au
dit
ed
An
nu
al R
ep
ort
an
d A
cco
un
ts
7
The
no
tes
on
page
s 2
61
to
27
0 f
orm
an
in
tegra
l p
art
of
the
se f
inan
cia
l st
ate
me
nts
.
Stat
emen
t of
Net
Ass
ets
as
at 3
1 A
ugu
st 2
01
1
Fund
Nam
eNo
te
Blac
kRoc
k Gl
obal
Fu
nds
Com
bine
d
Asia
Pac
ific
Equi
tyIn
com
eFu
nd
Asia
Drag
onFu
nd
Asia
nTi
ger
Bond
Fund
Chin
aFu
nd
Cont
inen
tal
Euro
pean
Flex
ible
Fund
Emer
ging
Euro
peFu
nd
Emer
ging
Mar
kets
Bond
Fund
Emer
ging
Mar
kets
Equi
ty In
com
eFu
nd(1
)
Emer
ging
Mar
kets
Fund
US$
US$
US$
US$
US$
€€
US$
US$
US$
Asse
tsS
ecuri
ties
po
rtfo
lio a
t co
st85
,762
,889
,186
80
,350
,680
59
5,98
2,44
7 45
8,21
8,11
8 80
6,27
7,86
5 58
0,10
0,53
2 2,
142,
714,
113
734,
536,
726
2,90
4,66
2 1,
196,
762,
934
Un
realis
ed
ap
pre
cia
tio
n/
(dep
recia
tio
n)
8,88
0,01
7,84
1(6
,267
,996
)(4
4,29
1,48
5)1,
676,
899
(96,
997,
345)
(28,
959,
427)
(313
,678
,062
)31
,088
,765
13
7,95
7 22
,345
,130
Securi
ties
po
rtfo
lio a
t m
ark
et
valu
e2(
a)94
,642
,907
,027
74
,082
,684
55
1,69
0,96
2 45
9,89
5,01
7 70
9,28
0,52
0 55
1,14
1,10
5 1,
829,
036,
051
765,
625,
491
3,04
2,61
9 1,
219,
108,
064
Cash
at
ban
k2(
a)1,
315,
235,
050
353,
658
4,02
0,11
4 43
,981
,740
2,
913,
639
14,5
04,1
99
19,9
60,1
05
42,7
71,5
89
42,2
76
4,30
3,74
6
Inte
rest
an
d d
ivid
en
ds
receiv
ab
le2(
a)44
0,73
7,18
7 61
2,75
1 1,
039,
426
6,70
9,97
7 39
9,72
2 1,
031
2,51
6,29
1 14
,676
,468
9,
812
3,47
7,12
8
Receiv
ab
le f
or
inve
stm
en
ts s
old
2(a)
773,
141,
255
– 3,
573,
980
– 73
0,13
4 5,
895,
999
37,3
33,2
38
7,40
1,00
0 38
,029
19
,141
,877
Receiv
ab
le f
or
Fun
d s
hare
s su
bsc
rib
ed
2(a)
359,
639,
784
355,
553
3,59
9,68
1 1,
651,
800
1,91
7,71
7 98
2,60
6 7,
273,
032
6,74
3,34
2 –
2,33
4,21
5
Un
realis
ed
gain
on
:
Futu
res
co
ntr
acts
2(c)
26,2
17,0
43
– –
– –
100,
085
– 65
,063
–
–
Forw
ard
fo
reig
n e
xch
an
ge c
on
tracts
2(c)
217,
163,
788
297,
417
– 1,
155,
503
1,76
0,73
4 –
14,7
51
11,3
07,3
16
– –
Mark
et
valu
e o
f sw
ap
s2(
c)10
,635
,118
– –
200,
924
– –
– –
– –
Mark
et
valu
e o
f p
urc
hase
d o
pti
on
s/sw
ap
tio
ns
2(c)
33,2
33,5
95–
– 41
7,21
8 –
– –
363,
107
– –
Oth
er
ass
ets
2(a,
c)5,
588,
010
1,15
7 –
1,70
1 5,
843
297,
609
552
13,5
77
21
–
Tota
l ass
ets
97,8
24,4
97,8
5775
,703
,220
56
3,92
4,16
3 51
4,01
3,88
0 71
7,00
8,30
9 57
2,92
2,63
4 1,
896,
134,
020
848,
966,
953
3,13
2,75
7 1,
248,
365,
030
Liab
ilitie
sC
ash
ow
ed
to
ban
k94
,349
,063
–
1,35
9,81
2 –
– 1,
729,
877
– 95
,060
–
–
Inco
me d
istr
ibuti
on
pay
ab
le2(
a)45
,560
,969
–
4,78
8,71
0 71
0,77
9 8,
852
495,
556
115,
861
220,
489
– –
Pay
ab
le f
or
inve
stm
en
ts p
urc
hase
d2(
a)92
0,48
6,79
3 61
8,77
0 2,
063,
603
– 69
5,11
5 9,
582,
035
18,7
13,9
62
57,6
12
– –
Pay
ab
le f
or
Fun
d s
hare
s re
deem
ed
2(a)
253,
037,
446
22,0
59
291,
563
2,16
2,80
6 1,
349,
372
534,
644
3,48
5,85
9 3,
310,
306
– 1,
595,
119
Un
realis
ed
loss
on
:
Futu
res
co
ntr
acts
2(c)
26,0
43,2
10–
– –
– –
– –
– –
Forw
ard
fo
reig
n e
xch
an
ge c
on
tracts
2(c)
15,9
93,4
08
– –
– –
148,
066
– –
– –
Mark
et
valu
e o
f sw
ap
s2(
c)18
,187
,925
– –
– –
– –
1,60
6,52
0 –
–
Mark
et
valu
e o
f w
ritt
en
op
tio
ns/
swap
tio
ns
2(c)
78,8
85,3
48–
– –
– –
– –
– –
Oth
er
liab
iliti
es
177,
796,
779
182,
889
767,
303
699,
930
1,55
2,02
5 1,
068,
857
6,21
7,81
4 1,
080,
271
2,88
4 2,
401,
378
Tota
l lia
bilit
ies
1,63
0,34
0,94
182
3,71
8 9,
270,
991
3,57
3,51
5 3,
605,
364
13,5
59,0
35
28,5
33,4
96
6,37
0,25
8 2,
884
3,99
6,49
7
Tota
l net
ass
ets
96,1
94,1
56,9
16
74,8
79,5
02
554,
653,
172
510,
440,
365
713,
402,
945
559,
363,
599
1,86
7,60
0,52
4 84
2,59
6,69
5 3,
129,
873
1,24
4,36
8,53
3
(1) N
ew
Fu
nd
lau
nch
ed
, se
e N
ote
1,
for
furt
he
r d
eta
ils.

8
Bla
ckR
ock G
lob
al Fu
nd
s (B
GF
)
Stat
emen
t of
Net
Ass
ets
as
at 3
1 A
ugust
20
11
co
nti
nu
ed
Fund
Nam
eNo
te
Euro
Bond
Fund
Euro
Corp
orat
eBo
ndFu
nd
Euro
Rese
rve
Fund
Euro
Sho
rtDu
ratio
nBo
ndFu
nd
Euro
-M
arke
tsFu
nd
Euro
pean
Enha
nced
Equi
ty Y
ield
Fund
Euro
pean
Equi
ty
Inco
me
Fund
(1)
Euro
pean
Focu
sFu
ndEu
rope
anFu
nd
Euro
pean
Grow
thFu
nd
€€
€€
€€
€€
€€
Asse
tsS
ecuri
ties
po
rtfo
lio a
t co
st1,
102,
100,
108
127,
300,
178
163,
906,
384
1,87
5,82
9,85
0 2,
144,
585,
802
12,8
63,6
77
3,06
2,04
7 1,
161,
327,
183
2,32
4,25
4,45
5 21
3,70
9,62
9
Un
realis
ed
ap
pre
cia
tio
n/
(dep
recia
tio
n)
13,7
46,0
62
(1,0
03,2
82)
152,
882
686,
880
(239
,376
,294
)(2
,520
,637
)(2
41,2
89)
(67,
684,
760)
(130
,053
,659
)(3
,771
,938
)
Securi
ties
po
rtfo
lio a
t m
ark
et
valu
e2(
a)1,
115,
846,
170
126,
296,
896
164,
059,
266
1,87
6,51
6,73
0 1,
905,
209,
508
10,3
43,0
40
2,82
0,75
8 1,
093,
642,
423
2,19
4,20
0,79
6 20
9,93
7,69
1
Cash
at
ban
k2(
a)7,
399,
066
941,
328
26,3
36,4
47
20,9
74,4
57
6,04
7,87
8 87
5,50
1 9,
608
7,84
3,37
0 36
,066
,279
1,
951,
699
Inte
rest
an
d d
ivid
en
ds
receiv
ab
le2(
a)17
,561
,532
2,
676,
355
165,
701
26,9
86,9
23
69,3
90
26,8
46
3,64
2 1,
750,
175
3,99
9,86
8 44
5,36
9
Receiv
ab
le f
or
inve
stm
en
ts s
old
2(a)
32,0
52,9
99
38,0
95
– 66
7,45
3 1,
323,
619
– –
27,1
41,0
76
– 19
9,37
6
Receiv
ab
le f
or
Fun
d s
hare
s su
bsc
rib
ed
2(a)
21,6
08,5
56
11,0
20
76,9
87
2,17
2,04
2 7,
225,
976
– 19
,710
2,
323,
572
5,27
8,14
7 22
0,44
9
Un
realis
ed
gain
on
:
Futu
res
co
ntr
acts
2(c)
– –
– –
– –
– –
– –
Forw
ard
fo
reig
n e
xch
an
ge c
on
tracts
2(c)
– –
– –
– –
– –
– –
Mark
et
valu
e o
f sw
ap
s2(
c)3,
221,
093
41,0
79
– 2,
903,
535
– –
– –
– –
Mark
et
valu
e o
f p
urc
hase
d o
pti
on
s/sw
ap
tio
ns
2(c)
104,
271
11,6
37
– 18
5,21
3 –
– –
– –
–
Oth
er
ass
ets
2(a,
c)–
– –
168,
865
240,
145
11,7
58
2,33
1 48
7,44
3 62
3,90
0 12
1,18
1
Tota
l ass
ets
1,19
7,79
3,68
7 13
0,01
6,41
0 19
0,63
8,40
1 1,
930,
575,
218
1,92
0,11
6,51
6 11
,257
,145
2,
856,
049
1,13
3,18
8,05
9 2,
240,
168,
990
212,
875,
765
Liab
ilitie
sC
ash
ow
ed
to
ban
k–
1,75
5,17
9 –
– –
43
4,94
5 –
846
–
Inco
me d
istr
ibuti
on
pay
ab
le2(
a)76
6,38
1 5,
106
– 96
9,16
0 15
7,06
7 –
– –
25,4
20
–
Pay
ab
le f
or
inve
stm
en
ts p
urc
hase
d2(
a)28
,616
,936
2,
648
– 19
,800
,140
–
– –
26,6
05,6
12
– 2,
181,
106
Pay
ab
le f
or
Fun
d s
hare
s re
deem
ed
2(a)
4,19
6,70
8 89
3,46
4 18
5,55
6 3,
904,
413
1,61
5,23
4 –
– 2,
364,
322
5,89
0,09
8 24
5,94
3
Un
realis
ed
loss
on
:
Futu
res
co
ntr
acts
2(c)
2,98
6,86
2 80
,330
–
6,68
9,29
8 –
93,7
82
– –
– –
Forw
ard
fo
reig
n e
xch
an
ge c
on
tracts
2(c)
1,81
7,79
9 29
5,42
4 –
2,10
4,89
0 18
,832
25
,438
–
– 27
9,73
1 –
Mark
et
valu
e o
f sw
ap
s2(
c)–
– –
– –
– –
– –
–
Mark
et
valu
e o
f w
ritt
en
op
tio
ns/
swap
tio
ns
2(c)
482
45
– 1,
176
– 24
3,70
6 –
– –
–
Oth
er
liab
iliti
es
1,39
3,74
5 17
7,79
6 12
5,24
7 2,
372,
379
3,50
5,87
7 30
,395
11
,270
2,
087,
591
3,48
8,80
0 45
4,33
7
Tota
l lia
bilit
ies
39,7
78,9
13
3,20
9,99
2 31
0,80
3 35
,841
,456
5,
297,
010
393,
364
16,2
15
31,0
57,5
25
9,68
4,89
5 2,
881,
386
Tota
l net
ass
ets
1,15
8,01
4,77
4 12
6,80
6,41
8 19
0,32
7,59
8 1,
894,
733,
762
1,91
4,81
9,50
6 10
,863
,781
2,
839,
834
1,10
2,13
0,53
4 2,
230,
484,
095
209,
994,
379
(1) N
ew
Fu
nd
lau
nch
ed
, se
e N
ote
1,
for
furt
he
r d
eta
ils.

Au
dit
ed
An
nu
al R
ep
ort
an
d A
cco
un
ts
9
The
no
tes
on
page
s 2
61
to
27
0 f
orm
an
in
tegra
l p
art
of
the
se f
inan
cia
l st
ate
me
nts
.
Stat
emen
t of
Net
Ass
ets
as
at 3
1 A
ugust
20
11
co
nti
nu
ed
Fund
Nam
eNo
te
Euro
pean
Smal
l & M
idCa
pOp
portu
nitie
sFu
nd
Euro
pean
Valu
eFu
nd
Fixe
d In
com
eGl
obal
Oppo
rtuni
ties
Fund
Flex
ible
Mul
ti-As
set
Fund
Glob
alAl
loca
tion
Fund
Glob
alCo
rpor
ate
Bond
Fund
Glob
alDy
nam
icEq
uity
Fund
Glob
alEn
hanc
edEq
uity
Yiel
dFu
nd
Glob
alEq
uity
Fund
Glob
alEq
uity
Inco
me
Fund
(1)
Glob
alGo
vern
men
tBo
ndFu
nd
€€
US$
€US
$US
$US
$US
$US
$US
$US
$
Asse
tsS
ecuri
ties
po
rtfo
lio a
t co
st30
2,51
0,36
6 18
3,17
9,47
1 97
,481
,345
20
0,74
1,14
1 14
,560
,698
,108
53
6,67
1,26
2 1,
129,
700,
275
190,
918,
099
270,
081,
362
417,
455,
020
459,
479,
251
Un
realis
ed
ap
pre
cia
tio
n/
(dep
recia
tio
n)
(19,
875,
124)
(18,
923,
704)
(1,1
87,1
11)
(15,
163,
044)
848,
916,
761
31,1
64,3
01
41,9
02,7
30
7,64
2,91
3 (7
,025
,588
)5,
448,
557
54,9
60,1
36
Securi
ties
po
rtfo
lio a
t m
ark
et
valu
e2(
a)28
2,63
5,24
2 16
4,25
5,76
7 96
,294
,234
18
5,57
8,09
7 15
,409
,614
,869
56
7,83
5,56
3 1,
171,
603,
005
198,
561,
012
263,
055,
774
422,
903,
577
514,
439,
387
Cash
at
ban
k2(
a)13
,270
,974
46
8,75
3 19
,825
,434
36
,520
,097
64
,750
,593
66
,437
,218
12
,321
,427
52
,504
,845
21
,940
,547
3,
813,
315
9,89
3,94
5
Inte
rest
an
d d
ivid
en
ds
receiv
ab
le2(
a)58
2,57
6 36
3,61
1 1,
159,
214
672,
861
58,2
62,7
64
9,90
9,89
6 1,
971,
946
720,
204
329,
765
1,27
3,26
0 5,
972,
420
Receiv
ab
le f
or
inve
stm
en
ts s
old
2(a)
19,4
42,7
96
– 42
,215
,456
46
,800
74
2,37
7 6,
470,
605
67,9
67
169,
471
608,
525
– –
Receiv
ab
le f
or
Fun
d s
hare
s su
bsc
rib
ed
2(a)
180,
424
70,4
36
86,5
01
100,
960
25,7
87,2
92
2,23
5,18
2 1,
253,
166
682,
098
125,
795
2,81
3,95
9 1,
161,
768
Un
realis
ed
gain
on
:
Futu
res
co
ntr
acts
2(c)
– –
184,
702
– 21
,744
,758
1,
508,
259
– –
– –
–
Forw
ard
fo
reig
n e
xch
an
ge c
on
tracts
2(c)
– –
630,
573
– 66
,580
,914
30
2,58
3 35
0,93
9 42
3,51
7 –
– –
Mark
et
valu
e o
f sw
ap
s2(
c)–
– –
15,4
46
– –
– –
– –
398,
708
Mark
et
valu
e o
f p
urc
hase
d o
pti
on
s/sw
ap
tio
ns
2(c)
– –
– 1,
360,
576
25,4
18,1
85–
1,56
8,89
0 –
– –
–
Oth
er
ass
ets
2(a,
c)12
9,40
2 12
2,45
2 3,
318
32,2
19
914,
582
35,3
64
94,6
71
34,1
28
21,7
16
66,2
04
–
Tota
l ass
ets
316,
241,
414
165,
281,
019
160,
399,
432
224,
327,
056
15,6
73,8
16,3
3465
4,73
4,67
0 1,
189,
232,
011
253,
095,
275
286,
082,
122
430,
870,
315
531,
866,
228
Liab
ilitie
sC
ash
ow
ed
to
ban
k–
– –
720,
263
45,3
42,8
80
1,68
1,92
9 5,
820,
677
– –
– 1,
813,
354
Inco
me d
istr
ibuti
on
pay
ab
le2(
a)–
15,5
42
– –
644,
211
16,6
90,6
21
– –
40,5
39
– 44
,241
Pay
ab
le f
or
inve
stm
en
ts p
urc
hase
d2(
a)6,
988,
831
– 42
,125
,000
77
0,62
4 16
,768
,729
17
,542
,273
1,
606,
032
– –
– –
Pay
ab
le f
or
Fun
d s
hare
s re
deem
ed
2(a)
1,04
5,41
4 24
6,57
6 60
,323
45
4,91
9 17
,186
,494
29
,323
99
0,50
2 40
,658
3,
718,
194
513,
525
1,61
6,30
2
Un
realis
ed
loss
on
:
Futu
res
co
ntr
acts
2(c)
– –
– 46
5,94
2–
– 45
4,72
9 1,
731,
008
– –
2,67
6,56
5
Forw
ard
fo
reig
n e
xch
an
ge c
on
tracts
2(c)
– –
– 94
1,31
0 –
– –
– 26
1,33
6 24
1,23
4 4,
623,
244
Mark
et
valu
e o
f sw
ap
s2(
c)–
– 53
,541
–
4,41
4,43
9 66
7,00
0 51
8,45
2 –
– –
–
Mark
et
valu
e o
f w
ritt
en
op
tio
ns/
swap
tio
ns
2(c)
– –
9,96
6 1,
539,
615
62,5
55,7
11–
7,77
6,62
5 5,
799,
362
– –
–
Oth
er
liab
iliti
es
776,
791
334,
556
308,
289
348,
221
30,1
09,5
3140
7,44
2 2,
074,
966
463,
272
388,
180
457,
065
516,
187
Tota
l lia
bilit
ies
8,81
1,03
6 59
6,67
4 42
,557
,119
5,
240,
894
177,
021,
995
37,0
18,5
88
19,2
41,9
83
8,03
4,30
0 4,
408,
249
1,21
1,82
4 11
,289
,893
Tota
l net
ass
ets
307,
430,
378
164,
684,
345
117,
842,
313
219,
086,
162
15,4
96,7
94,3
39
617,
716,
082
1,16
9,99
0,02
8 24
5,06
0,97
5 28
1,67
3,87
3 42
9,65
8,49
1 52
0,57
6,33
5
(1) N
ew
Fu
nd
lau
nch
ed
, se
e N
ote
1,
for
furt
he
r d
eta
ils.

10
B
lackR
ock G
lob
al Fu
nd
s (B
GF
)
Stat
emen
t of
Net
Ass
ets
as
at 3
1 A
ugust
20
11
co
nti
nu
ed
Fund
Nam
eNo
te
Glob
alHi
gh Y
ield
Bond
Fund
Glob
alIn
flatio
nLi
nked
Bond
Fund
Glob
alOp
portu
nitie
sFu
nd
Glob
alSm
allC
apFu
ndIn
dia
Fund
(2)
Japa
nFu
nd
Japa
nSm
all &
Mid
Cap
Oppo
rtuni
ties
Fund
Japa
nVa
lue
Fund
Latin
Amer
ican
Fund
Loca
l Em
ergi
ngM
arke
ts S
hort
Dura
tion
Bond
Fund
New
Ener
gyFu
nd
US$
US$
US$
US$
US$
¥¥
¥US
$US
$US
$
Asse
tsS
ecuri
ties
po
rtfo
lio a
t co
st1,
131,
981,
210
303,
189,
295
102,
983,
033
292,
501,
589
755,
651,
883
5,05
8,75
7,16
1 16
,850
,031
,569
13
,324
,580
,972
5,
834,
269,
308
2,36
4,33
5,05
2 2,
748,
957,
768
Un
realis
ed
ap
pre
cia
tio
n/
(dep
recia
tio
n)
(60,
545,
436)
20,2
49,1
97
(1,4
27,5
55)
9,24
8,22
1 35
,371
,744
(4
82,9
36,7
63)
(673
,341
,069
)(1
,512
,986
,730
)83
8,61
3,11
4 6,
180,
856
(603
,425
,275
)
Securi
ties
po
rtfo
lio a
t m
ark
et
valu
e2(
a)1,
071,
435,
774
323,
438,
492
101,
555,
478
301,
749,
810
791,
023,
627
4,57
5,82
0,39
8 16
,176
,690
,500
11
,811
,594
,242
6,
672,
882,
422
2,37
0,51
5,90
8 2,
145,
532,
493
Cash
at
ban
k2(
a)19
,961
,245
80
2,99
1 4,
129,
248
26,7
06,1
21
14,6
66,1
0418
4,81
3,93
7 40
9,46
6,22
7 39
9,20
6,20
9 41
,070
,600
16
5,68
2,85
3 12
,209
,306
Inte
rest
an
d d
ivid
en
ds
receiv
ab
le2(
a)22
,443
,019
1,
275,
186
150,
937
324,
485
1,35
4,61
2 2,
596,
714
28,9
85,1
32
7,11
8,67
4 48
,953
,228
26
,485
,755
6,
168,
425
Receiv
ab
le f
or
inve
stm
en
ts s
old
2(a)
5,91
8,29
7 –
1,15
0,91
8 1,
362,
060
6,69
9,31
4 22
,032
,064
23
3,69
0,53
1 39
5,93
7,73
8 2,
271,
628
– –
Receiv
ab
le f
or
Fun
d s
hare
s su
bsc
rib
ed
2(a)
2,17
6,44
0 2,
539,
452
126,
270
241,
473
3,24
0,84
54,
614,
402
22,2
66,5
52
7,43
9,32
9 8,
226,
903
3,61
3,38
5 1,
397,
450
Un
realis
ed
gain
on
:
Futu
res
co
ntr
acts
2(c)
– 48
,192
–
– –
– –
– –
– –
Forw
ard
fo
reig
n e
xch
an
ge c
on
tracts
2(c)
10,9
63,6
71
– –
– –
603,
778
1,30
9,77
8 5,
312,
111
91,0
47
68,7
80,2
18
–
Mark
et
valu
e o
f sw
ap
s2(
c)–
109,
905
– –
– –
– –
– –
–
Mark
et
valu
e o
f p
urc
hase
d o
pti
on
s/sw
ap
tio
ns
2(c)
– –
– –
– –
– –
– 2,
624,
059
–
Oth
er
ass
ets
2(a,
c)–
24,2
70
28,1
89
9,51
8 2,
971
– 17
,715
49
,592
–
17,1
9813
4,87
6
Tota
l ass
ets
1,13
2,89
8,44
6 32
8,23
8,48
8 10
7,14
1,04
0 33
0,39
3,46
7 81
6,98
7,47
34,
790,
481,
293
16,8
72,4
26,4
35
12,6
26,6
57,8
95
6,77
3,49
5,82
8 2,
637,
719,
376
2,16
5,44
2,55
0
Liab
ilitie
sC
ash
ow
ed
to
ban
k–
11,6
20,6
65
– 55
2 84
3 4,
548
472
980
– 69
0,74
1 –
Inco
me d
istr
ibuti
on
pay
ab
le2(
a)95
7,99
8 11
,179
–
– –
– 21
,142
,780
23
,102
,489
4,
168,
515
5,86
3,68
6 11
9,76
1
Pay
ab
le f
or
inve
stm
en
ts p
urc
hase
d2(
a)2,
938,
325
– 2,
457,
488
2,84
4,71
8 45
4,01
4 85
,354
,487
17
0,01
1,41
2 57
0,01
4,23
1 –
– 78
,835
Pay
ab
le f
or
Fun
d s
hare
s re
deem
ed
2(a)
1,02
8,89
5 2,
285,
037
15,9
27
173,
535
3,98
7,01
973
2,18
7 29
,943
,322
6,
519,
416
14,9
86,7
26
3,97
0,17
7 4,
627,
099
Un
realis
ed
loss
on
:
Futu
res
co
ntr
acts
2(c)
1,22
3,74
4 –
– –
– –
– –
– –
–
Forw
ard
fo
reig
n e
xch
an
ge c
on
tracts
2(c)
– 2,
224
70,5
48
55,6
89
– –
– –
– –
–
Mark
et
valu
e o
f sw
ap
s2(
c)39
8,43
0 –
– –
– –
– –
– 9,
760,
091
–
Mark
et
valu
e o
f w
ritt
en
op
tio
ns/
swap
tio
ns
2(c)
– –
– –
– –
– –
– –
–
Oth
er
liab
iliti
es
1,62
6,22
5 30
3,21
7 22
6,41
8 60
3,22
0 2,
703,
705
14,3
53,5
47
35,0
08,8
22
17,2
24,7
86
13,4
66,3
48
4,67
4,90
94,
282,
494
Tota
l lia
bilit
ies
8,17
3,61
7 14
,222
,322
2,
770,
381
3,67
7,71
4 7,
145,
581
100,
444,
769
256,
106,
808
616,
861,
902
32,6
21,5
89
24,9
59,6
049,
108,
189
Tota
l net
ass
ets
1,12
4,72
4,82
9 31
4,01
6,16
6 10
4,37
0,65
9 32
6,71
5,75
3 80
9,84
1,89
2 4,
690,
036,
524
16,6
16,3
19,6
27
12,0
09,7
95,9
93
6,74
0,87
4,23
9 2,
612,
759,
772
2,15
6,33
4,36
1
(2) F
un
d v
alu
atio
n p
olic
y, s
ee
No
te 1
, fo
r fu
rth
er
deta
ils.

Au
dit
ed
An
nu
al R
ep
ort
an
d A
cco
un
ts
11
The
no
tes
on
page
s 2
61
to
27
0 f
orm
an
in
tegra
l p
art
of
the
se f
inan
cia
l st
ate
me
nts
.
Stat
emen
t of
Net
Ass
ets
as
at 3
1 A
ugust
20
11
co
nti
nu
ed
Fund
Nam
eNo
te
Pacif
icEq
uity
Fund
Swiss
Smal
l & M
idCa
pOp
portu
nitie
sFu
nd
Unite
dKi
ngdo
mFu
nd
USBa
sicVa
lue
Fund
US D
olla
rCo
reBo
ndFu
nd
US D
olla
rHi
gh Y
ield
Bond
Fund
US D
olla
rRe
serv
eFu
nd
US D
olla
rSh
ort D
urat
ion
Bond
Fund
USFl
exib
leEq
uity
Fund
USGo
vern
men
tM
ortg
age
Fund
USGr
owth
Fund
US$
CHF
£US
$US
$US
$US
$US
$US
$US
$US
$
Asse
tsS
ecuri
ties
po
rtfo
lio a
t co
st16
9,98
3,15
5 33
2,38
8,59
8 40
4,30
3,55
9 1,
669,
821,
138
316,
276,
706
2,24
3,75
0,05
7 36
6,39
3,01
0 18
2,71
5,22
7 1,
482,
585,
789
235,
171,
228
231,
989,
650
Un
realis
ed
ap
pre
cia
tio
n/
(dep
recia
tio
n)
(388
,249
)(2
6,87
0,84
5)(2
05,9
46)
7,56
8,00
1 4,
618,
611
(79,
446,
812)
(17,
895)
140,
605
(5,0
23,6
61)
2,45
2,61
6 14
,354
,325
Securi
ties
po
rtfo
lio a
t m
ark
et
valu
e2(
a)16
9,59
4,90
6 30
5,51
7,75
3 40
4,09
7,61
3 1,
677,
389,
139
320,
895,
317
2,16
4,30
3,24
5 36
6,37
5,11
5 18
2,85
5,83
2 1,
477,
562,
128
237,
623,
844
246,
343,
975
Cash
at
ban
k2(
a)1,
834,
061
28,2
05,7
47
7,80
0,35
6 3,
117,
948
21,4
53,1
35
39,3
16,7
90
25,6
46,3
73
1,80
6,32
4 34
9,29
5 19
,035
,703
5,
786,
241
Inte
rest
an
d d
ivid
en
ds
receiv
ab
le2(
a)21
7,27
0 2,
486
2,30
9,47
2 3,
872,
387
2,37
3,56
5 44
,303
,906
42
,278
1,
471,
877
1,78
8,58
3 1,
276,
164
257,
688
Receiv
ab
le f
or
inve
stm
en
ts s
old
2(a)
866,
027
3,00
3,32
0 97
7,78
8 –
155,
950,
226*
17
,634
,477
–
50,3
60,9
64*
2,77
8,03
4 23
0,00
6,77
3*
541,
517
Receiv
ab
le f
or
Fun
d s
hare
s su
bsc
rib
ed
2(a)
22,6
82
305,
819
456,
502
773,
801
997,
586
39,5
83,0
80
9,10
1,31
5 4,
230,
230
2,02
6,87
9 39
3,60
8 14
4,44
0
Un
realis
ed
gain
on
:
Futu
res
co
ntr
acts
2(c)
– –
– –
194,
835
– –
15,2
84
– –
–
Forw
ard
fo
reig
n e
xch
an
ge c
on
tracts
2(c)
– –
– 2,
283,
687
7,06
6 7,
012,
073
– –
2,91
8,05
2 –
–
Mark
et
valu
e o
f sw
ap
s2(
c)–
– –
– 60
8,69
7 11
9,70
1 –
– –
– –
Mark
et
valu
e o
f p
urc
hase
d o
pti
on
s/sw
ap
tio
ns
2(c)
– –
– –
409,
227
– –
– –
33,0
00
–
Oth
er
ass
ets
2(a,
c)16
8 –
33,4
32
25,2
95
186,
694
124,
883
108,
597
7,50
8 49
,041
–
149
Tota
l ass
ets
172,
535,
114
337,
035,
125
415,
675,
163
1,68
7,46
2,25
7 50
3,07
6,34
8 2,
312,
398,
155
401,
273,
678
240,
748,
019
1,48
7,47
2,01
2 48
8,36
9,09
2 25
3,07
4,01
0
Liab
ilitie
sC
ash
ow
ed
to
ban
k11
–
– –
862,
788
– –
– 40
6,29
9 –
–
Inco
me d
istr
ibuti
on
pay
ab
le2(
a)–
– 1,
227,
638
– 14
4,35
4 1,
094,
560
– 63
,396
93
8,60
4 79
,322
–
Pay
ab
le f
or
inve
stm
en
ts p
urc
hase
d2(
a)73
4,81
8 12
,381
,574
3,
188,
654
– 18
2,74
8,01
7*
11,1
13,9
25
7,00
0,00
0 66
,577
,354
* 2,
015,
159
300,
061,
600*
93
9,56
4
Pay
ab
le f
or
Fun
d s
hare
s re
deem
ed
2(a)
248,
807
142,
989
1,06
6,42
5 1,
749,
781
13,5
20,3
63
1,66
0,12
7 14
,370
,902
13
3,31
4 2,
459,
308
350,
484
507,
239
Un
realis
ed
loss
on
:
Futu
res
co
ntr
acts
2(c)
– –
– –
– 3,
080,
388
– –
– 2,
818
–
Forw
ard
fo
reig
n e
xch
an
ge c
on
tracts
2(c)
– –
– –
– –
35,2
66
36,2
06
– –
–
Mark
et
valu
e o
f sw
ap
s2(
c)–
– –
– –
– –
9,80
9 –
606,
190
–
Mark
et
valu
e o
f w
ritt
en
op
tio
ns/
swap
tio
ns
2(c)
– –
– –
137,
795
– –
24,1
69
– –
–
Oth
er
liab
iliti
es
342,
673
691,
100
658,
504
2,99
1,67
0 1,
005,
669
3,11
2,75
7 20
8,37
9 36
2,38
0 2,
246,
058
1,13
6,91
5 45
5,63
5
Tota
l lia
bilit
ies
1,32
6,30
9 13
,215
,663
6,
141,
221
4,74
1,45
1 19
8,41
8,98
6 20
,061
,757
21
,614
,547
67
,206
,628
8,
065,
428
302,
237,
329
1,90
2,43
8
Tota
l net
ass
ets
171,
208,
805
323,
819,
462
409,
533,
942
1,68
2,72
0,80
6 30
4,65
7,36
2 2,
292,
336,
398
379,
659,
131
173,
541,
391
1,47
9,40
6,58
4 18
6,13
1,76
3 25
1,17
1,57
2
* I
nclu
de
s TB
As,
se
e N
ote
2,
for
furt
he
r d
eta
ils.

12
B
lackR
ock G
lob
al Fu
nd
s (B
GF
)
Stat
emen
t of
Net
Ass
ets
as
at 3
1 A
ugust
20
11
co
nti
nu
ed
Fund
Nam
eNo
te
USSm
all &
Mid
Cap
Oppo
rtuni
ties
Fund
Wor
ldAg
ricul
ture
Fund
Wor
ldBo
ndFu
nd
Wor
ldEn
ergy
Fund
Wor
ldFi
nanc
ials
Fund
Wor
ldGo
ldFu
nd
Wor
ldHe
alth
scie
nce
Fund
Wor
ldIn
com
eFu
nd
Wor
ldM
inin
gFu
nd
Wor
ldRe
sour
ces
Equi
ty In
com
eFu
nd(1
)
Wor
ldTe
chno
logy
Fund
US$
US$
US$
US$
US$
US$
US$
US$
US$
US$
US$
Asse
tsS
ecuri
ties
po
rtfo
lio a
t co
st54
9,80
5,30
7 57
8,10
5,69
9 44
0,71
0,41
0 4,
893,
880,
458
196,
160,
643
4,81
9,82
0,82
7 50
2,39
5,99
6 28
5,49
5,38
2 11
,732
,001
,672
3,
134,
377
151,
262,
796
Un
realis
ed
ap
pre
cia
tio
n/
(dep
recia
tio
n)
(12,
925,
355)
1,62
6,02
5 33
,394
,219
43
1,18
3,71
3 (1
6,40
2,12
9)4,
417,
734,
637
(6,8
76,6
50)
20,5
58,5
15
4,19
7,81
5,37
5 (2
36,1
40)
(1,4
85,0
43)
Securi
ties
po
rtfo
lio a
t m
ark
et
valu
e2(
a)53
6,87
9,95
2 57
9,73
1,72
4 47
4,10
4,62
9 5,
325,
064,
171
179,
758,
514
9,23
7,55
5,46
4 49
5,51
9,34
6 30
6,05
3,89
7 15
,929
,817
,047
2,
898,
237
149,
777,
753
Cash
at
ban
k2(
a)42
,589
,141
1,
228,
441
32,5
32,8
42
1,69
1,74
0 7,
014,
675
833,
186
25,7
72,3
69
39,4
24,9
28
66,8
81,8
11
70,0
56
4,07
2,93
3
Inte
rest
an
d d
ivid
en
ds
receiv
ab
le2(
a)38
9,10
8 57
8,15
6 5,
135,
468
10,7
04,8
74
330,
558
9,75
4,61
9 44
9,06
7 4,
136,
945
51,9
93,3
56
6,60
7 18
8,02
5
Receiv
ab
le f
or
inve
stm
en
ts s
old
2(a)
8,71
5,96
7 –
6,26
7,14
9–
– –
7,52
4,52
4 –
– –
821,
261
Receiv
ab
le f
or
Fun
d s
hare
s su
bsc
rib
ed
2(a)
2,29
2,82
1 7,
339,
218
24,7
98
5,28
3,03
9 44
2,77
3 77
,936
,018
59
9,64
5 1,
101,
112
64,2
08,1
91
– 59
0,82
5
Un
realis
ed
gain
on
:
Futu
res
co
ntr
acts
2(c)
2,31
1,40
2 –
– –
– –
– –
– –
–
Forw
ard
fo
reig
n e
xch
an
ge c
on
tracts
2(c)
– 83
2,43
5 –
8,93
1,69
5 –
12,2
88,9
07
6,30
5,72
3 1,
624,
193
12,1
99,8
77
112
–
Mark
et
valu
e o
f sw
ap
s2(
c)–
– 27
0,04
1 –
– –
– –
– –
–
Mark
et
valu
e o
f p
urc
hase
d o
pti
on
s/sw
ap
tio
ns
2(c)
– –
– –
– –
– –
– –
–
Oth
er
ass
ets
2(a,
c)13
,628
36
,262
7,
674
127,
635
134,
877
46,9
0716
,173
1,
464
– 18
0 4,
108
Tota
l ass
ets
593,
192,
019
589,
746,
236
518,
342,
601
5,35
1,80
3,15
4 18
7,68
1,39
7 9,
338,
415,
101
536,
186,
847
352,
342,
539
16,1
25,1
00,2
82
2,97
5,19
2 15
5,45
4,90
5
Liab
ilitie
sC
ash
ow
ed
to
ban
k–
3,16
852
4,01
6 –
– 16
,975
,312
–
1,06
8,90
2 –
10
–
Inco
me d
istr
ibuti
on
pay
ab
le2(
a)–
577,
167
15,0
76
1,34
9,43
6 –
– –
708,
693
57,4
66
– –
Pay
ab
le f
or
inve
stm
en
ts p
urc
hase
d2(
a)2,
458,
491
– 40
,956
,152
–
– 16
,551
,236
2,
635,
435
– –
– 1,
532,
885
Pay
ab
le f
or
Fun
d s
hare
s re
deem
ed
2(a)
14,8
82,0
09
598,
128
17,9
53,1
81
10,3
64,9
41
265,
851
27,1
01,3
71
930,
668
2,99
8,93
0 40
,342
,881
–
37,9
32
Un
realis
ed
loss
on
:–
Futu
res
co
ntr
acts
2(c)
– –
1,85
8,31
3 –
– –
– 11
6,43
4 –
– –
Forw
ard
fo
reig
n e
xch
an
ge c
on
tracts
2(c)
– –
2,53
4,37
1 –
– –
– –
– –
–
Mark
et
valu
e o
f sw
ap
s2(
c)–
– –
– –
– –
153,
453
– –
–
Mark
et
valu
e o
f w
ritt
en
op
tio
ns/
swap
tio
ns
2(c)
– –
– –
– –
– –
– 3,
696
–
Oth
er
liab
iliti
es
1,04
5,90
5 75
1,51
7 32
9,75
910
,026
,762
39
1,66
9 16
,827
,984
863,
949
249,
663
30,7
14,3
36
5,55
7 28
6,66
8
Tota
l lia
bilit
ies
18,3
86,4
05
1,92
9,98
064
,170
,868
21,7
41,1
39
657,
520
77,4
55,9
034,
430,
052
5,29
6,07
5 71
,114
,683
9,
263
1,85
7,48
5
Tota
l net
ass
ets
574,
805,
614
587,
816,
256
454,
171,
733
5,33
0,06
2,01
5 18
7,02
3,87
7 9,
260,
959,
198
531,
756,
795
347,
046,
464
16,0
53,9
85,5
99
2,96
5,92
9 15
3,59
7,42
0
(1) N
ew
Fu
nd
lau
nch
ed
, se
e N
ote
1,
for
furt
he
r d
eta
ils.

Audited Annual Report and Accounts 13
The notes on pages 261 to 270 form an integral part of these financial statements.
Three Year Summary of Net Asset Valuesas at 31 August 2011
Currency 31 August 2011 31 August 2010 31 August 2009
Asia Pacific Equity Income FundTotal net assets USD 74,879,502 26,588,248 –Net asset value per:
A Class distributing (Q) share USD 11.27 10.26 –
A Class distributing (Q) share SGD hedged SGD 11.10 10.17 –
A Class non-distributing share USD 11.92 10.44 –
C Class distributing (Q) share USD 11.07 10.21 –
C Class distributing (Q) share SGD hedged SGD 10.90 10.12 –
E Class distributing (Q) share EUR hedged EUR 8.92 – –
Asian Dragon Fund Total net assets USD 554,653,172 605,236,043 474,614,880Net asset value per:
A Class non-distributing share USD 25.09 24.47 21.48
A Class UK reporting fund share GBP 14.86 15.39 12.83
B Class non-distributing share USD 21.59 21.27 18.85
C Class non-distributing share USD 21.04 20.78 18.47
D Class non-distributing share USD 25.77 24.95 21.73
E Class non-distributing share USD 23.96 23.48 20.71
Q Class non-distributing share USD 22.56 22.11 19.50
X Class non-distributing share USD 25.88 24.80 –
X Class UK reporting fund share GBP 14.82 15.39 –
Asian Tiger Bond Fund Total net assets USD 510,440,365 528,146,073 88,654,115Net asset value per:
A Class distributing (D) share USD 11.74 11.99* 10.49
A Class distributing (M) share USD 11.75 12.00* 10.50
A Class distributing (M) share HKD hedged HKD 10.52 10.79* –
A Class non-distributing share USD 29.83 29.35* 24.61
A Class non-distributing share SGD hedged SGD 9.94 – –
B Class distributing (D) share USD 11.90 12.15* 10.63
B Class non-distributing share USD 26.40 26.24* 22.22
C Class distributing (D) share USD 11.90 12.16* 10.63
C Class non-distributing share USD 25.81 25.72* 21.83
E Class non-distributing share USD 28.51 28.20* 23.77
Q Class distributing (D) share USD 11.77 12.02* 10.51
Q Class non-distributing share USD 27.48 27.19* 22.93
China FundTotal net assets USD 713,402,945 446,172,228 154,665,397Net asset value per:
A Class non-distributing share USD 11.20 11.50 10.23
A Class non-distributing share EUR hedged EUR 10.66 10.99 9.95
A Class non-distributing share HKD unhedged HKD 11.44 11.72 10.39
A Class non-distributing share SGD hedged SGD 10.67 11.03 9.89
A Class UK reporting fund share GBP hedged GBP 10.86 11.17 10.02
B Class non-distributing share USD 10.83 11.23 10.10
B Class non-distributing share EUR hedged EUR 10.32 10.75 9.83
B Class non-distributing share SGD hedged SGD 10.34 10.79 9.77
C Class non-distributing share USD 10.74 11.16 10.06
C Class non-distributing share SGD hedged SGD 10.26 10.74 9.74
D Class non-distributing share USD 11.37 11.58 –
E Class non-distributing share EUR hedged EUR 10.52 10.90 9.92
I Class non-distributing share USD 11.38 11.56 –
X Class non-distributing share USD 11.42 11.52 –
* Swing Adjustment included, see Note 2 (g) for further details.

14 BlackRock Global Funds (BGF)
Three Year Summary of Net Asset Valuesas at 31 August 2011 continued
Currency 31 August 2011 31 August 2010 31 August 2009
Continental European Flexible Fund Total net assets EUR 559,363,599 283,160,576 122,447,154Net asset value per:
A Class distributing (A) share EUR 10.45 – –
A Class non-distributing share EUR 10.44 10.00 8.58
A Class UK reporting fund share GBP 9.03 8.10 7.41
A Class UK reporting fund share GBP hedged GBP 9.63 – –
B Class non-distributing share EUR 9.86 9.53 8.26
C Class non-distributing share EUR 9.75 9.45 8.21
D Class non-distributing share EUR 10.66 10.13 8.63
E Class non-distributing share EUR 10.13 9.75 8.41
X Class non-distributing share EUR 10.63 10.00 –
X Class UK reporting fund share GBP 9.00 8.10 –
Emerging Europe Fund Total net assets EUR 1,867,600,524 2,247,833,875 1,599,265,741Net asset value per:
A Class distributing (A) share EUR 84.81 90.56 67.43
A Class non-distributing share EUR 84.81 90.56 67.43
A Class non-distributing share SGD hedged SGD 7.98 – –
A Class UK reporting fund share GBP 75.28 75.04 59.56
B Class non-distributing share EUR 73.78 79.57 59.85
C Class non-distributing share EUR 72.16 78.02 58.82
D Class non-distributing share EUR 89.05 94.37 69.73
E Class non-distributing share EUR 79.62 85.44 63.94
J Class non-distributing share EUR 94.59 98.99 72.28
Q Class non-distributing share EUR 71.63 77.59 58.66
X Class non-distributing share EUR 97.01 101.52 74.12
X Class UK reporting fund share GBP 75.70 75.00 –
Emerging Markets Bond Fund Total net assets USD 842,596,695 477,612,438 164,060,461Net asset value per:
A Class distributing (D) share USD 9.14* 9.01 7.95
A Class distributing (M) share USD 9.44* 9.31 8.21
A Class non-distributing share USD 13.17* 12.44 10.46
A Class non-distributing share EUR hedged EUR 13.04* 12.39 10.52
B Class distributing (D) share USD 9.14* 9.02 7.95
B Class non-distributing share USD 12.26* 11.71 9.94
C Class distributing (D) share USD 9.14* 9.01 7.95
C Class non-distributing share USD 12.07* 11.55 9.84
D Class non-distributing share USD 13.48* 12.67 10.59
E Class non-distributing share USD 12.75* 12.11 10.23
Q Class distributing (D) share USD 9.13* 9.01 7.94
X Class non-distributing share USD 13.75* 12.82 10.63
X Class non-distributing share EUR hedged EUR 13.51* 12.66 10.60
X Class non-distributing share JPY hedged JPY 1,023* – –
Emerging Markets Equity Income Fund(1)
Total net assets USD 3,129,873 – –Net asset value per:
A Class distributing (Q) share USD 10.43 – –
A Class non-distributing share USD 10.43 – –
Emerging Markets Fund Total net assets USD 1,244,368,533 1,169,730,421 813,427,714Net asset value per:
A Class non-distributing share USD 29.50 27.09 23.91
B Class non-distributing share USD 26.21 24.31 21.67
C Class non-distributing share USD 25.43 23.64 21.12
D Class non-distributing share USD 30.74 28.02 24.54
E Class non-distributing share USD 27.71 25.58 22.68
Q Class non-distributing share USD 25.12 23.36 20.87
X Class non-distributing share USD 30.45 27.47 –
(1) New Fund launched, see Note 1, for further details.
* Swing Adjustment included, see Note 2 (g) for further details.

Audited Annual Report and Accounts 15
The notes on pages 261 to 270 form an integral part of these financial statements.
Three Year Summary of Net Asset Valuesas at 31 August 2011 continued
Currency 31 August 2011 31 August 2010 31 August 2009
Euro Bond Fund Total net assets EUR 1,158,014,774 1,138,784,007 761,689,450Net asset value per:
A Class distributing (A) share EUR 20.53 21.31 –
A Class distributing (D) share EUR 15.34 15.93 15.01
A Class distributing (M) share EUR 15.34 15.93 15.01
A Class non-distributing share EUR 21.09 21.34 19.56
A Class UK reporting fund share GBP 18.23 – –
B Class distributing (D) share EUR 15.01 15.58 14.68
B Class non-distributing share EUR 18.33 18.73 17.35
C Class distributing (D) share EUR 15.02 15.59 14.69
C Class non-distributing share EUR 17.90 18.34 17.03
D Class non-distributing share EUR 21.43 21.61 19.74
E Class distributing (Q) share EUR 19.43 20.15 –
E Class non-distributing share EUR 19.81 20.15 18.56
I Class non-distributing share EUR 10.15 – –
Q Class distributing (D) share EUR 14.98 15.55 14.65
Q Class non-distributing share EUR 17.48 17.96 16.74
X Class non-distributing share EUR 21.94 21.99 19.98
Euro Corporate Bond FundTotal net assets EUR 126,806,418 99,019,756 56,625,090Net asset value per:
A Class distributing (D) share EUR 10.93 11.27 10.47
A Class distributing (M) share EUR 10.74 11.07 10.27
A Class non-distributing share EUR 12.26 12.31 11.11
B Class distributing (D) share EUR 9.44 9.72 9.04
B Class non-distributing share EUR – – 10.41
C Class non-distributing share EUR 11.08 11.26 10.29
D Class non-distributing share EUR 12.39 12.37 –
E Class distributing (Q) share EUR 11.52 11.87 –
E Class non-distributing share EUR 11.77 11.87 10.78
X Class non-distributing share EUR 12.60 12.51 11.17
Euro Reserve FundTotal net assets EUR 190,327,598 211,714,491 212,523,530Net asset value per:
A Class non-distributing share EUR 73.76 73.40 73.35
B Class non-distributing share EUR 73.75 73.39 73.34
C Class non-distributing share EUR 70.58 70.24 70.19
D Class non-distributing share EUR 74.11 73.60 73.41
E Class non-distributing share EUR 71.77 71.60 71.72
Q Class non-distributing share EUR – – 73.04
Euro Short Duration Bond Fund Total net assets EUR 1,894,733,762 3,016,844,960 753,853,262Net asset value per:
A Class distributing (D) share EUR 11.41 11.56 11.39
A Class distributing (M) share EUR 11.43 11.57 11.41
A Class non-distributing share EUR 14.15 14.08 13.65
A Class non-distributing share CHF hedged CHF 9.99 10.02 –
A Class non-distributing share USD hedged USD 10.15 10.14 –
A Class UK reporting fund share EUR 13.92 – –
A Class UK reporting fund share GBP hedged GBP 9.93 10.08 –
A Class UK reporting fund share USD hedged USD 9.99 – –
B Class distributing (D) share EUR 11.01 11.15 11.00
B Class non-distributing share EUR 12.37 12.42 12.17
C Class distributing (D) share EUR 10.76 10.90 10.75
C Class non-distributing share EUR 12.10 12.18 11.96
D Class non-distributing share EUR 14.34 14.21 13.73
D Class UK reporting fund share GBP hedged GBP 9.99 – –
E Class non-distributing share EUR 13.39 13.38 13.04
I Class non-distributing share EUR 14.24 14.11 –
X Class non-distributing share EUR 14.38 14.20 13.67

16 BlackRock Global Funds (BGF)
Three Year Summary of Net Asset Valuesas at 31 August 2011 continued
Currency 31 August 2011 31 August 2010 31 August 2009
Euro-Markets Fund Total net assets EUR 1,914,819,506 1,438,996,604 1,650,433,561Net asset value per:
A Class distributing (A) share EUR 12.84 13.38 13.15
A Class non-distributing share EUR 14.05 14.44 14.07
A Class non-distributing share CHF hedged CHF 8.75 – –
A Class UK reporting fund share GBP 12.24 – –
B Class non-distributing share EUR 12.30 12.77 12.57
C Class non-distributing share EUR 12.08 12.57 12.40
D Class non-distributing share EUR 14.66 14.95 14.46
E Class non-distributing share EUR 13.25 13.68 13.40
I Class non-distributing share EUR 14.32 14.57 –
Q Class non-distributing share EUR 12.39 12.85 12.63
X Class non-distributing share EUR 14.40 14.54 –
European Enhanced Equity Yield FundTotal net assets EUR 10,863,781 16,397,971 19,132,090Net asset value per:
A Class distributing (Q) share EUR 5.21 5.93 6.02
A Class distributing (Q) share GBP hedged GBP 5.22 5.93 6.02
A Class distributing (Q) share USD hedged USD 5.19 5.92 6.03
A Class non-distributing share EUR 7.06 7.42 6.98
A Class non-distributing share GBP hedged GBP 7.10 7.46 6.99
A Class non-distributing share USD hedged USD 7.23 7.65 7.12
B Class distributing (Q) share EUR 5.21 5.92 6.02
B Class distributing (Q) share GBP hedged GBP 5.22 5.92 6.02
B Class distributing (Q) share USD hedged USD 5.19 5.92 6.03
B Class non-distributing share EUR 6.79 7.21 6.85
B Class non-distributing share USD hedged USD 6.95 7.43 6.99
C Class distributing (Q) share EUR 5.20 5.92 6.02
C Class distributing (Q) share GBP hedged GBP 5.21 5.92 6.02
C Class distributing (Q) share USD hedged USD 5.18 5.92 6.03
C Class non-distributing share EUR 6.74 7.16 6.83
C Class non-distributing share GBP hedged GBP – – 6.83
C Class non-distributing share USD hedged USD 6.90 7.39 6.96
E Class non-distributing share EUR 6.91 7.30 6.90
European Equity Income Fund(1)
Total net assets EUR 2,839,834 – –Net asset value per:
A Class distributing (Q) share EUR 8.87 – –
A Class non-distributing share EUR 9.17 – –
D Class non-distributing share EUR 9.17 – –
E Class distributing (Q) share EUR 8.84 – –
European Focus Fund Total net assets EUR 1,102,130,534 509,097,346 123,042,352Net asset value per:
A Class non-distributing share EUR 13.29 13.14 11.84
B Class non-distributing share EUR – – 11.47
C Class non-distributing share EUR 12.54 12.56 11.46
D Class non-distributing share EUR 13.61 13.35 11.94
E Class non-distributing share EUR 13.00 12.91 11.70
I Class non-distributing share EUR 13.41 – –
X Class non-distributing share EUR 13.60 13.18 –
(1) New Fund launched, see Note 1, for further details.

Audited Annual Report and Accounts 17
The notes on pages 261 to 270 form an integral part of these financial statements.
Three Year Summary of Net Asset Valuesas at 31 August 2011 continued
Currency 31 August 2011 31 August 2010 31 August 2009
European Fund Total net assets EUR 2,230,484,095 2,722,334,628 1,672,283,430Net asset value per:
A Class distributing (A) share EUR 64.19 66.09 –
A Class non-distributing share EUR 65.17 66.45 61.66
A Class non-distributing share USD hedged USD 9.25 – –
A Class UK reporting fund share GBP 57.09 – –
B Class non-distributing share EUR 56.72 58.41 54.75
C Class non-distributing share EUR 55.54 57.34 53.88
D Class non-distributing share EUR 67.99 68.80 63.37
E Class non-distributing share EUR 61.28 62.80 58.57
I Class non-distributing share EUR 66.75 67.37 61.89
Q Class non-distributing share EUR 57.22 58.86 55.12
X Class non-distributing share EUR 67.24 67.36 –
European Growth Fund Total net assets EUR 209,994,379 177,100,093 169,627,672Net asset value per:
A Class non-distributing share EUR 18.68 17.90 14.76
B Class non-distributing share EUR 17.22 16.66 13.88
C Class non-distributing share EUR 16.94 16.43 13.72
D Class non-distributing share EUR 19.48 18.52 15.16
E Class non-distributing share EUR 18.06 17.39 14.41
European Small & MidCap Opportunities FundTotal net assets EUR 307,430,378 338,194,587 328,598,399Net asset value per:
A Class non-distributing share EUR 67.44 67.56 60.28
B Class non-distributing share EUR 58.94 59.62 53.73
C Class non-distributing share EUR 57.95 58.77 53.10
D Class non-distributing share EUR 69.36 68.95 61.06
E Class non-distributing share EUR 63.46 63.88 57.28
Q Class non-distributing share EUR 57.32 58.25 52.74
European Value Fund Total net assets EUR 164,684,345 137,179,554 243,483,446Net asset value per:
A Class distributing (A) share EUR 26.75 27.97 28.82
A Class non-distributing share EUR 31.83 32.55 33.13
A Class UK reporting fund share GBP 25.29 24.70 27.36
B Class non-distributing share EUR 26.67 27.55 28.32
C Class non-distributing share EUR 26.04 26.97 27.79
D Class non-distributing share EUR 32.75 33.24 33.58
E Class non-distributing share EUR 30.54 31.40 32.11
Q Class non-distributing share EUR 27.88 28.66 29.32
X Class UK reporting fund share GBP – 25.18 –
Fixed Income Global Opportunities FundTotal net assets USD 117,842,313 80,066,829 59,289,370Net asset value per:
A Class distributing (Q) share USD 9.30 9.57 8.70
A Class distributing (Q) share EUR hedged EUR 6.97 7.18 6.54
A Class distributing (Q) share SGD hedged SGD 13.56 14.00 12.73
A Class non-distributing share USD 11.14 11.18 9.91
A Class non-distributing share EUR hedged EUR 8.39 8.41 7.48
A Class non-distributing share PLN hedged PLN 10.99 10.75 –
A Class non-distributing share SGD hedged SGD 16.27 16.37 14.52
B Class distributing (Q) share USD 9.30 9.57 8.71
B Class distributing (Q) share EUR hedged EUR – – 6.58
B Class non-distributing share USD 10.67 10.80 9.68
B Class non-distributing share EUR hedged EUR 8.08 8.18 7.35
C Class distributing (Q) share USD 9.25 9.52 8.65
C Class non-distributing share USD 10.53 10.69 9.60
D Class non-distributing share EUR hedged EUR 8.55 8.54 7.56
E Class non-distributing share USD 10.86 10.95 9.75
E Class non-distributing share EUR hedged EUR 8.21 8.27 7.39

18 BlackRock Global Funds (BGF)
Three Year Summary of Net Asset Valuesas at 31 August 2011 continued
Currency 31 August 2011 31 August 2010 31 August 2009
Flexible Multi-Asset FundTotal net assets EUR 219,086,162 85,296,103 19,048,266Net asset value per:
A Class non-distributing share EUR 10.44 10.52 9.39
A Class non-distributing share USD hedged USD 25.04 25.45 –
B Class non-distributing share EUR – – 8.46
C Class non-distributing share EUR 9.77 9.96 9.00
C Class non-distributing share USD hedged USD 21.43 22.05 –
D Class non-distributing share EUR 10.57 10.57 –
E Class non-distributing share EUR 9.82 9.94 8.91
E Class non-distributing share USD hedged USD 23.53 24.04 –
Q Class non-distributing share EUR – – 8.16
X Class non-distributing share EUR 10.62 10.54 –
Global Allocation Fund Total net assets USD 15,496,794,339 13,254,920,256 12,507,733,870Net asset value per:
A Class distributing (A) share USD 41.35 37.50 36.02
A Class distributing (A) share EUR hedged EUR 27.73 25.25 24.56
A Class non-distributing share USD 41.81 37.69 36.04
A Class non-distributing share AUD hedged AUD 11.35 9.90 –
A Class non-distributing share CHF hedged CHF 9.91 9.00 8.71
A Class non-distributing share EUR hedged EUR 29.32 26.55 25.72
A Class non-distributing share GBP hedged GBP 22.79 20.51 19.68
A Class non-distributing share PLN hedged PLN 11.22 9.91 –
A Class non-distributing share SGD hedged SGD 10.20 9.25 8.88
B Class non-distributing share USD 36.34 33.09 31.96
B Class non-distributing share EUR hedged EUR 25.49 23.32 22.81
C Class non-distributing share USD 35.51 32.41 31.38
C Class non-distributing share EUR hedged EUR 24.92 22.85 22.41
D Class non-distributing share USD 43.02 38.49 36.53
D Class non-distributing share EUR hedged EUR 30.17 27.12 26.07
E Class non-distributing share USD 39.89 36.15 34.74
E Class non-distributing share EUR hedged EUR 29.15 26.53 25.82
E Class non-distributing share PLN hedged PLN 11.17 – –
I Class non-distributing share USD 42.18 – –
J Class non-distributing share USD 44.87 39.77 37.39
Q Class non-distributing share USD 38.01 34.44 33.10
X Class non-distributing share USD 44.58 39.51 37.14
X Class non-distributing share AUD hedged AUD 11.55 9.90 –
X Class non-distributing share EUR hedged EUR 31.08 27.77 26.40
Global Corporate Bond FundTotal net assets USD 617,716,082 613,951,713 391,004,200Net asset value per:
A Class distributing (A) share EUR hedged EUR 8.53 8.88 8.30
A Class non-distributing share USD 10.28 10.32 9.18
A Class non-distributing share EUR hedged EUR 10.22 10.24 9.14
D Class non-distributing share USD 10.42 10.39 9.20
D Class non-distributing share EUR hedged EUR 10.33 10.30 9.17
E Class non-distributing share USD 10.08 10.16 9.09
E Class non-distributing share EUR hedged EUR 10.05 10.12 9.09
X Class non-distributing share USD 10.54 10.45 –
X Class non-distributing share EUR hedged EUR 10.49 10.39 9.19
X Class UK reporting fund share GBP hedged GBP 8.42 8.76 8.14

Audited Annual Report and Accounts 19
The notes on pages 261 to 270 form an integral part of these financial statements.
Three Year Summary of Net Asset Valuesas at 31 August 2011 continued
Currency 31 August 2011 31 August 2010 31 August 2009
Global Dynamic Equity Fund Total net assets USD 1,169,990,028 818,387,890 552,816,795Net asset value per:
A Class distributing (A) share USD 11.97 10.59 9.81
A Class non-distributing share USD 11.96 10.58 10.21
A Class non-distributing share EUR hedged EUR 8.56 7.61 7.46
B Class non-distributing share USD 11.33 10.12 9.86
C Class non-distributing share USD 11.18 10.01 9.78
C Class non-distributing share EUR hedged EUR 8.16 7.35 7.30
D Class non-distributing share USD 12.26 10.76 10.30
E Class non-distributing share USD 11.64 10.35 10.03
E Class non-distributing share EUR hedged EUR 8.49 7.59 –
I Class non-distributing share USD 12.08 – –
Q Class non-distributing share USD 17.26 15.34 14.87
X Class non-distributing share USD 12.91 11.22 10.63
Global Enhanced Equity Yield FundTotal net assets USD 245,060,975 232,162,354 252,679,565Net asset value per:
A Class distributing (Q) share USD 5.94 5.99 6.37
A Class distributing (Q) share EUR hedged EUR 4.61 4.61 4.91
A Class non-distributing share USD 9.14 8.44 8.22
A Class non-distributing share EUR hedged EUR 6.36 5.90 5.85
A Class non-distributing share SGD hedged SGD 7.82 7.26 7.12
B Class distributing (Q) share USD 5.94 5.98 6.36
B Class non-distributing share USD 8.71 8.12 7.99
C Class distributing (Q) share USD 5.94 5.98 6.36
C Class non-distributing share USD 8.60 8.04 7.93
D Class non-distributing share USD 9.36 8.57 8.29
E Class non-distributing share USD – – 8.11
E Class non-distributing share EUR hedged EUR 6.22 5.80 5.79
Global Equity Fund Total net assets USD 281,673,873 271,083,503 230,217,710Net asset value per:
A Class distributing (A) share USD 6.27 5.39 5.28
A Class non-distributing share USD 6.28 5.40 5.30
A Class non-distributing share SGD hedged SGD 9.33 – –
A Class UK reporting fund share GBP 3.80 3.46 3.22
B Class non-distributing share USD 5.94 5.15 5.11
C Class non-distributing share USD 5.85 5.09 5.06
D Class non-distributing share USD 6.44 5.50 5.34
E Class non-distributing share USD 6.11 5.28 5.21
Q Class non-distributing share USD 5.97 5.18 5.12
X Class non-distributing share USD 6.44 5.44 –
Global Equity Income Fund(1)
Total net assets USD 429,658,491 – –Net asset value per:
A Class distributing (Q) share USD 10.34 – –
A Class distributing (Q) share EUR hedged EUR 9.84 – –
A Class distributing (Q) UK reporting fund share GBP 6.34 – –
A Class non-distributing share USD 10.58 – –
A Class non-distributing share EUR hedged EUR 9.84 – –
A Class non-distributing share PLN hedged PLN 10.31 – –
C Class distributing (Q) share USD 9.81 – –
C Class non-distributing share USD 9.92 – –
D Class non-distributing share USD 10.64 – –
E Class distributing (Q) share USD 10.34 – –
E Class distributing (Q) share EUR hedged EUR 9.58 – –
X Class non-distributing share USD 10.73 – –
(1) New Fund launched, see Note 1, for further details.

20 BlackRock Global Funds (BGF)
Three Year Summary of Net Asset Valuesas at 31 August 2011 continued
Currency 31 August 2011 31 August 2010 31 August 2009
Global Government Bond FundTotal net assets USD 520,576,335 670,616,686 411,686,996Net asset value per:
A Class distributing (D) share USD 17.81 18.32 17.29
A Class distributing (D) share EUR hedged EUR 17.16 17.64 16.70
A Class distributing (M) share USD 17.83 18.34 17.32
A Class distributing (M) share EUR hedged EUR 17.02 17.49 16.56
A Class non-distributing share USD 23.18 23.37 21.68
A Class non-distributing share EUR hedged EUR 21.97 22.15 20.61
B Class distributing (D) share USD 17.21 17.71 16.72
B Class distributing (D) share EUR hedged EUR 16.62 17.08 16.17
B Class non-distributing share USD 20.14 20.51 19.22
B Class non-distributing share EUR hedged EUR 19.08 19.42 18.25
C Class distributing (D) share USD 17.02 17.51 16.53
C Class distributing (D) share EUR hedged EUR 16.58 17.05 16.14
C Class distributing (M) share USD 17.84 18.32 17.30
C Class non-distributing share USD 19.69 20.11 18.89
C Class non-distributing share EUR hedged EUR 18.70 19.08 17.98
D Class non-distributing share USD 23.27 – –
D Class non-distributing share EUR hedged EUR 22.34 22.42 20.77
E Class non-distributing share USD 21.86 22.15 20.65
E Class non-distributing share EUR hedged EUR 20.64 20.90 19.55
Q Class distributing (D) share USD 17.16 17.65 16.67
Q Class distributing (D) share EUR hedged EUR 16.52 16.98 16.09
Q Class non-distributing share USD 19.24 19.69 18.56
Q Class non-distributing share EUR hedged EUR 18.23 18.64 17.62
X Class non-distributing share USD 23.59 23.56 –
Global High Yield Bond Fund Total net assets USD 1,124,724,829 605,102,465 287,394,990Net asset value per:
A Class distributing (D) share USD 7.26 7.21* 6.54
A Class distributing (D) share EUR hedged EUR 5.29 5.27* 4.82
A Class distributing (M) share USD 7.29 7.24* 6.57
A Class distributing (M) share EUR hedged EUR 5.23 5.22* 4.78
A Class non-distributing share USD 16.16 15.13* 12.79
A Class non-distributing share EUR hedged EUR 11.72 11.01* 9.39
A Class non-distributing share GBP hedged GBP 12.15 – –
B Class distributing (D) share USD 7.50 7.45* 6.76
B Class distributing (D) share EUR hedged EUR 5.45 5.43* 4.98
B Class non-distributing share USD 14.34 13.56* 11.58
B Class non-distributing share EUR hedged EUR – – 8.50
C Class distributing (D) share USD 7.44 7.39* 6.71
C Class distributing (D) share EUR hedged EUR 5.42 5.40* 4.94
C Class distributing (M) share EUR hedged EUR 5.27 5.25* 4.81
C Class non-distributing share USD 15.41 14.60* 12.51
C Class non-distributing share EUR hedged EUR 10.26 9.77* 8.44
D Class non-distributing share USD 16.38 15.24* 12.81
D Class non-distributing share EUR hedged EUR 11.84 11.06* –
D Class non-distributing share GBP hedged GBP 12.18 11.32* 9.54
E Class distributing (Q) share EUR hedged EUR 10.52 10.42* –
E Class non-distributing share USD 15.21 14.31* 12.16
E Class non-distributing share EUR hedged EUR 11.03 10.42* 8.93
I Class non-distributing share USD 16.28 – –
Q Class distributing (D) share EUR hedged EUR – 5.26* 4.80
Q Class non-distributing share USD 13.73 13.03* 11.17
Q Class non-distributing share EUR hedged EUR 9.96 9.48* 8.20
X Class non-distributing share USD 16.29 – –
X Class non-distributing share EUR hedged EUR 12.63 11.70* 9.84
* Swing Adjustment included, see Note 2 (g) for further details.

Audited Annual Report and Accounts 21
The notes on pages 261 to 270 form an integral part of these financial statements.
Three Year Summary of Net Asset Valuesas at 31 August 2011 continued
Currency 31 August 2011 31 August 2010 31 August 2009
Global Inflation Linked Bond FundTotal net assets USD 314,016,166 164,926,684 54,564,997Net asset value per:
A Class distributing (M) share USD 11.60 11.04 10.28
A Class non-distributing share USD 11.89 11.25 10.40
A Class non-distributing share EUR hedged EUR 11.71 11.08 10.29
C Class distributing (M) share USD 11.45 10.97 10.27
C Class non-distributing share USD 11.45 10.97 10.28
D Class non-distributing share USD 11.98 11.29 10.40
D Class non-distributing share EUR hedged EUR 11.80 11.12 –
E Class non-distributing share EUR hedged EUR 11.59 11.02 –
X Class non-distributing share EUR hedged EUR 12.10 11.34 10.42
Global Opportunities Fund Total net assets USD 104,370,659 109,996,580 98,449,057Net asset value per:
A Class non-distributing share USD 31.66 28.78 28.84
B Class non-distributing share USD 27.74 25.47 25.78
C Class non-distributing share USD 27.21 25.04 25.41
D Class non-distributing share USD 32.15 29.00 28.95
E Class non-distributing share USD 29.82 27.24 27.44
Q Class non-distributing share USD 27.08 24.92 25.28
Global SmallCap Fund Total net assets USD 326,715,753 311,759,295 214,952,540Net asset value per:
A Class non-distributing share USD 59.73 50.54 48.97
B Class non-distributing share USD 52.59 44.96 43.99
C Class non-distributing share USD 51.50 44.14 43.30
D Class non-distributing share USD 61.13 51.35 49.38
E Class non-distributing share USD 57.13 48.59 47.32
Q Class non-distributing share USD 54.95 46.74 45.51
X Class non-distributing share GBP hedged GBP 11.79 9.76 –
India Fund(2)
Total net assets USD 809,841,892 761,350,221 640,860,506Net asset value per:
A Class non-distributing share USD 22.71 24.84 19.31
A Class UK reporting fund share GBP 14.02 16.21 11.96
B Class non-distributing share USD 21.17 23.36 18.35
C Class non-distributing share USD 20.85 23.06 18.16
D Class non-distributing share USD 23.47 25.49 19.68
E Class non-distributing share USD 22.12 24.31 19.00
X Class non-distributing share USD 24.30 26.14 19.96
Japan Fund Total net assets JPY 4,690,036,524 3,322,991,183 4,034,320,235Net asset value per:
A Class non-distributing share JPY 1,088 1,164 1,376
A Class non-distributing share EUR hedged EUR 8.52 9.14 10.96
B Class non-distributing share JPY 950 1,026 1,225
C Class non-distributing share JPY 935 1,013 1,212
D Class non-distributing share JPY 1,146 1,216 1,426
E Class non-distributing share JPY 1,025 1,103 1,309
Q Class non-distributing share JPY 958 1,034 1,233
(2) Fund valuation policy, see Note 1, for further details.

22 BlackRock Global Funds (BGF)
Currency 31 August 2011 31 August 2010 31 August 2009
Japan Small & MidCap Opportunities FundTotal net assets JPY 16,616,319,627 12,466,459,111 18,549,389,964Net asset value per:
A Class non-distributing share JPY 2,938 2,786 3,173
A Class non-distributing share EUR hedged EUR 20.24 19.14 22.06
A Class UK reporting fund share GBP 23.44 21.36 20.99
B Class non-distributing share JPY 2,566 2,457 2,826
C Class non-distributing share JPY 2,509 2,408 2,778
D Class non-distributing share JPY 3,022 2,843 3,214
E Class non-distributing share JPY 2,759 2,629 3,009
Q Class non-distributing share JPY 2,486 2,391 2,764
X Class UK reporting fund share GBP 23.55 2,794 –
Japan Value Fund Total net assets JPY 12,009,795,993 15,352,260,972 20,262,924,153Net asset value per:
A Class non-distributing share JPY 655 685 824
A Class non-distributing share EUR hedged EUR 4.37 4.57 5.61
A Class UK reporting fund share GBP 5.21 5.26 5.45
B Class non-distributing share JPY 615 650 789
C Class non-distributing share JPY 604 640 779
D Class non-distributing share JPY 675 702 837
E Class non-distributing share JPY 637 670 809
E Class non-distributing share EUR hedged EUR 4.28 4.50 5.54
X Class non-distributing share JPY 671 690 –
X Class UK reporting fund share GBP 5.18 5.24 –
Latin American Fund Total net assets USD 6,740,874,239 6,740,241,536 4,887,550,621Net asset value per:
A Class distributing (A) share USD 85.87 84.37 67.26
A Class non-distributing share USD 86.98 84.72 67.32
A Class non-distributing share CHF hedged CHF 9.39 – –
A Class non-distributing share PLN hedged PLN 11.18 10.72 –
A Class non-distributing share SGD hedged SGD 9.01 – –
A Class UK reporting fund share GBP 51.81 53.94 40.78
B Class non-distributing share USD 74.41 73.20 58.75
C Class non-distributing share USD 73.39 72.38 58.24
D Class non-distributing share USD 90.16 87.17 68.75
E Class non-distributing share USD 83.11 81.36 64.97
J Class non-distributing share USD 96.57 92.19 71.81
Q Class non-distributing share USD 78.82 76.97 61.31
X Class non-distributing share USD 90.14 86.05 –
X Class UK reporting fund share GBP 51.98 54.24 –
Three Year Summary of Net Asset Valuesas at 31 August 2011 continued

Audited Annual Report and Accounts 23
The notes on pages 261 to 270 form an integral part of these financial statements.
Currency 31 August 2011 31 August 2010 31 August 2009
Local Emerging Markets Short Duration Bond FundTotal net assets USD 2,612,759,772 2,298,680,977 1,153,587,310Net asset value per:
A Class distributing (A) share USD 26.34 25.27 –
A Class distributing (D) share USD 6.47 6.21 6.39
A Class distributing (M) share USD 6.52 6.25 6.44
A Class distributing (M) share AUD hedged AUD 10.11 – –
A Class non-distributing share USD 27.58 25.56 25.12
A Class non-distributing share CHF hedged CHF 10.00 – –
A Class non-distributing share EUR hedged EUR 9.98 9.31 9.27
A Class non-distributing share PLN hedged PLN 10.88 9.87 –
A Class non-distributing share SGD hedged SGD 10.13 9.44 9.31
B Class distributing (D) share USD 6.48 6.21 6.39
B Class non-distributing share USD 26.35 24.67 24.48
C Class distributing (D) share USD 6.47 6.20 6.39
C Class non-distributing share USD 26.05 24.44 24.32
D Class distributing (M) share USD 26.96 25.85 –
D Class non-distributing share USD 28.11 25.92 25.34
D Class non-distributing share EUR hedged EUR 9.77 – –
E Class non-distributing share USD 26.96 25.11 24.80
E Class non-distributing share EUR hedged EUR 9.90 9.28 –
I Class non-distributing share USD 27.79 25.58 –
I Class non-distributing share EUR hedged EUR – 9.36 –
Q Class distributing (D) share USD 6.46 6.20 6.38
Q Class non-distributing share USD 26.53 24.72 24.43
X Class distributing (D) share USD – 6.21 6.39
X Class non-distributing share USD 7.52 6.89 6.69
New Energy Fund Total net assets USD 2,156,334,361 2,691,079,548 3,711,254,163Net asset value per:
A Class distributing (A) share USD 6.88 7.06 8.49
A Class non-distributing share USD 6.88 7.05 8.48
A Class UK reporting fund share GBP 4.23 4.59 5.24
B Class non-distributing share USD 6.24 6.46 7.84
C Class non-distributing share USD 6.09 6.32 7.70
D Class non-distributing share USD 7.19 7.31 8.73
D Class UK reporting fund share GBP 4.29 4.64 5.25
E Class non-distributing share USD 6.54 6.73 8.14
I Class non-distributing share USD 6.97 – 8.59
Q Class non-distributing share USD 6.04 6.27 7.64
X Class non-distributing share USD 7.48 7.51 8.85
Pacific Equity Fund Total net assets USD 171,208,805 160,010,864 195,732,153Net asset value per:
A Class non-distributing share USD 25.40 23.29 23.29
B Class non-distributing share USD 22.21 20.57 20.77
C Class non-distributing share USD 21.87 20.30 20.56
D Class non-distributing share USD 26.43 24.05 23.87
E Class non-distributing share USD 24.29 22.38 22.49
Q Class non-distributing share USD 22.95 21.18 21.32
Three Year Summary of Net Asset Valuesas at 31 August 2011 continued

24 BlackRock Global Funds (BGF)
Currency 31 August 2011 31 August 2010 31 August 2009
Swiss Small & MidCap Opportunities FundTotal net assets CHF 323,819,462 227,545,072 129,361,658Net asset value per:
A Class non-distributing share CHF 155.68 165.55 145.18
D Class non-distributing share CHF 159.31 168.13 146.35
United Kingdom Fund Total net assets GBP 409,533,942 387,307,727 246,905,379Net asset value per:
A Class non-distributing share GBP 57.49 55.18 50.21
A Class UK reporting fund share GBP 52.69 51.07 46.84
B Class non-distributing share GBP 50.10 48.57 44.64
C Class non-distributing share GBP 49.34 47.96 44.18
D Class non-distributing share GBP 59.13 56.34 50.88
E Class non-distributing share GBP 54.05 52.14 47.68
Q Class non-distributing share GBP 50.48 48.89 44.89
X Class non-distributing share GBP 59.29 55.92 –
US Basic Value Fund Total net assets USD 1,682,720,806 1,837,909,082 1,482,990,871Net asset value per:
A Class distributing (A) share USD 44.65 39.28 38.98
A Class non-distributing share USD 44.87 39.47 39.19
A Class non-distributing share EUR hedged EUR 32.20 28.41 28.70
A Class non-distributing share SGD hedged SGD 9.01 – –
A Class UK reporting fund share GBP 27.32 25.47 23.99
B Class non-distributing share USD 37.29 33.13 33.23
B Class non-distributing share EUR hedged EUR – 23.76 24.23
C Class non-distributing share USD 36.50 32.51 32.69
C Class non-distributing share EUR hedged EUR 31.18 27.85 28.48
D Class non-distributing share USD 46.64 40.72 40.14
E Class non-distributing share USD 42.79 37.83 37.75
E Class non-distributing share EUR hedged EUR 28.65 25.40 25.78
I Class non-distributing share USD – 39.59 –
Q Class non-distributing share USD 39.01 34.49 34.41
X Class non-distributing share USD 48.78 42.16 –
X Class UK reporting fund share GBP – 25.58 –
US Dollar Core Bond Fund Total net assets USD 304,657,362 376,359,743 279,822,873Net asset value per:
A Class distributing (D) share USD 16.50 16.48 15.32
A Class distributing (M) share USD 16.51 16.49 15.32
A Class non-distributing share USD 26.65 25.78 23.16
B Class distributing (D) share USD 15.58 15.57 14.47
B Class non-distributing share USD 22.85 22.33 20.26
C Class distributing (D) share USD 15.53 15.51 14.42
C Class non-distributing share USD 22.31 21.86 19.88
D Class non-distributing share USD 26.75 – –
E Class non-distributing share USD 25.31 24.61 22.21
Q Class distributing (D) share USD 15.53 15.52 14.42
Q Class non-distributing share USD 23.35 22.78 20.62
X Class non-distributing share USD 28.47 27.28 24.26
Three Year Summary of Net Asset Valuesas at 31 August 2011 continued

Audited Annual Report and Accounts 25
The notes on pages 261 to 270 form an integral part of these financial statements.
Currency 31 August 2011 31 August 2010 31 August 2009
US Dollar High Yield Bond Fund Total net assets USD 2,292,336,398 1,301,791,885 767,424,483Net asset value per:
A Class distributing (D) share USD 5.38 5.37 4.82
A Class distributing (M) share USD 5.43 5.42 4.86
A Class distributing (M) share AUD hedged AUD 9.46 – –
A Class distributing (M) share SGD hedged SGD 9.29 – –
A Class non-distributing share USD 21.71 20.36 17.01
A Class non-distributing share AUD hedged AUD 9.74 – –
A Class non-distributing share EUR hedged EUR 146.52 137.82 116.02
A Class non-distributing share SGD hedged SGD 9.56 – –
B Class distributing (D) share USD 5.43 5.42 4.86
B Class non-distributing share USD 19.31 18.29 15.43
C Class distributing (D) share USD 5.39 5.38 4.83
C Class non-distributing share USD 18.67 17.73 15.00
D Class distributing (M) share USD 9.30 – –
D Class non-distributing share USD 21.81 – –
D Class non-distributing share EUR hedged EUR 147.41 – –
E Class non-distributing share USD 20.74 19.55 16.41
Q Class distributing (D) share USD 5.37 5.36 4.81
Q Class non-distributing share USD 21.12 19.83 16.59
X Class non-distributing share USD 22.66 20.97 17.29
US Dollar Reserve Fund Total net assets USD 379,659,131 286,342,721 265,187,968Net asset value per:
A Class non-distributing share USD 150.83 150.84 150.91
A Class non-distributing share GBP hedged GBP 189.46 189.05 188.98
B Class non-distributing share USD 150.92 150.93 151.01
B Class non-distributing share GBP hedged GBP 189.14 188.74 188.66
C Class non-distributing share USD 150.13 150.14 150.22
C Class non-distributing share GBP hedged GBP 189.45 189.05 188.97
E Class non-distributing share USD 147.05 147.43 147.88
E Class non-distributing share GBP hedged GBP 184.14 184.21 184.60
Q Class non-distributing share USD – – 150.33
US Dollar Short Duration Bond Fund Total net assets USD 173,541,391 145,131,526 91,265,009Net asset value per:
A Class distributing (D) share USD 8.66 8.68 8.42
A Class distributing (M) share USD 8.66 8.67 8.42
A Class non-distributing share USD 11.95 11.69 10.98
B Class distributing (D) share USD 8.67 8.69 8.43
B Class non-distributing share USD 10.94 10.81 10.25
C Class distributing (D) share USD 8.67 8.68 8.42
C Class non-distributing share USD 10.70 10.60 10.08
D Class distributing (M) share USD 9.93 – –
E Class non-distributing share USD 11.35 11.16 10.53
X Class non-distributing share USD 12.51 12.15 11.32
Three Year Summary of Net Asset Valuesas at 31 August 2011 continued

26 BlackRock Global Funds (BGF)
Currency 31 August 2011 31 August 2010 31 August 2009
US Flexible Equity Fund Total net assets USD 1,479,406,584 1,765,803,734 2,186,372,847Net asset value per:
A Class distributing (A) share USD 15.50 – –
A Class distributing (A) share EUR hedged EUR 11.11 9.38 9.61
A Class non-distributing share USD 15.50 13.06 13.19
A Class non-distributing share EUR hedged EUR 11.07 9.35 9.60
A Class UK reporting fund share GBP 9.49 8.47 8.12
B Class non-distributing share USD 14.13 12.02 12.26
B Class non-distributing share EUR hedged EUR 10.12 8.63 8.95
C Class non-distributing share USD 13.80 11.77 12.04
C Class non-distributing share EUR hedged EUR 9.33 7.98 8.29
D Class non-distributing share USD 16.17 13.52 13.55
D Class non-distributing share EUR hedged EUR 11.54 9.67 9.85
E Class non-distributing share USD 14.89 12.60 12.79
E Class non-distributing share EUR hedged EUR 10.26 8.70 8.98
Q Class non-distributing share USD 14.21 12.08 12.31
X Class non-distributing share USD 16.83 13.93 13.83
X Class UK reporting fund share GBP 9.61 8.53 –
US Government Mortgage Fund Total net assets USD 186,131,763 202,757,455 185,439,804Net asset value per:
A Class distributing (D) share USD 10.25 9.96 9.54
A Class distributing (M) share USD 10.25 9.97 9.54
A Class non-distributing share USD 17.00 16.15 15.02
A Class non-distributing share EUR hedged EUR – – 10.19
B Class distributing (D) share USD 10.81 10.50 10.06
B Class non-distributing share USD 15.78 15.15 14.23
C Class distributing (D) share USD 10.82 10.51 10.07
C Class distributing (M) share USD 10.16 9.86 9.44
C Class non-distributing share USD 15.42 14.83 13.97
D Class distributing (M) share USD 10.27 – –
D Class non-distributing share USD 17.11 16.19 15.04
E Class non-distributing share USD 16.17 15.43 14.43
Q Class distributing (D) share USD 10.79 10.48 10.04
Q Class non-distributing share USD 15.98 15.31 14.37
US Growth Fund Total net assets USD 251,171,572 191,853,190 220,201,351Net asset value per:
A Class non-distributing share USD 9.11 7.70 7.40
B Class non-distributing share USD 8.16 6.96 6.76
C Class non-distributing share USD 7.95 6.80 6.62
D Class non-distributing share USD 9.36 7.85 7.49
E Class non-distributing share USD 8.72 7.40 7.15
Q Class non-distributing share USD 8.54 7.25 7.00
X Class non-distributing share USD 9.39 7.80 –
US Small & MidCap Opportunities FundTotal net assets USD 574,805,614 389,261,866 184,768,911Net asset value per:
A Class non-distributing share USD 115.55 99.98 93.10
B Class non-distributing share USD 100.83 88.11 82.88
C Class non-distributing share USD 98.82 86.58 81.64
D Class non-distributing share USD 118.75 101.97 94.26
E Class non-distributing share USD 108.62 94.45 88.40
Q Class non-distributing share USD 98.45 86.24 81.32
X Class non-distributing share USD 119.22 101.35 –
Three Year Summary of Net Asset Valuesas at 31 August 2011 continued

Audited Annual Report and Accounts 27
The notes on pages 261 to 270 form an integral part of these financial statements.
Currency 31 August 2011 31 August 2010 31 August 2009
World Agriculture FundTotal net assets USD 587,816,256 56,646,439 –Net asset value per:
A Class distributing (A) share EUR hedged EUR 11.95 9.96 –
A Class non-distributing share USD 12.15 10.08 –
A Class non-distributing share EUR hedged EUR 11.96 9.96 –
A Class non-distributing share HKD unhedged HKD 12.20 10.09 –
A Class non-distributing share PLN hedged PLN 9.31 – –
A Class non-distributing share SGD hedged SGD 12.01 10.04 –
A Class UK reporting fund share GBP hedged GBP 11.51 9.48 –
C Class non-distributing share USD 11.92 10.01 –
D Class non-distributing share USD 12.28 – –
D Class non-distributing share EUR hedged EUR 12.02 – –
E Class non-distributing share USD 12.06 10.05 –
X Class distributing (A) share USD 12.18 – –
X Class UK reporting fund share GBP 7.49 – –
World Bond Fund Total net assets USD 454,171,733 434,877,583 206,529,736Net asset value per:
A Class distributing (D) share USD 49.93 50.78 48.14
A Class distributing (M) share USD 49.80 50.65 48.01
A Class non-distributing share USD 61.45 61.15 56.69
A Class non-distributing share EUR hedged EUR 162.09 161.16 149.92
B Class distributing (D) share USD 50.92 51.79 49.09
C Class distributing (D) share USD 50.50 51.36 48.69
D Class non-distributing share USD 62.55 62.00 57.23
E Class non-distributing share USD 59.28 59.28 55.24
X Class non-distributing share USD 63.69 62.73 57.58
X Class non-distributing share CHF hedged CHF 11.83 11.72 10.81
World Energy Fund Total net assets USD 5,330,062,015 3,661,724,381 3,339,664,792Net asset value per:
A Class distributing (A) share USD 24.56 20.03 20.05
A Class non-distributing share USD 24.60 20.07 20.08
A Class non-distributing share CHF hedged CHF 8.41 – –
A Class non-distributing share EUR hedged EUR 7.67 6.29 6.44
A Class non-distributing share SGD hedged SGD 7.45 6.12 6.18
A Class UK reporting fund share GBP 14.99 12.96 12.30
B Class non-distributing share USD 22.13 18.24 18.43
C Class non-distributing share USD 21.61 17.85 18.08
C Class non-distributing share EUR hedged EUR 7.32 6.08 6.30
D Class non-distributing share USD 25.65 20.77 20.62
D Class non-distributing share EUR hedged EUR 7.85 6.39 6.49
D Class UK reporting fund share GBP 15.02 – –
E Class non-distributing share USD 23.36 19.15 19.25
E Class non-distributing share EUR hedged EUR 7.52 6.20 6.38
I Class non-distributing share USD 24.99 20.18 –
I Class non-distributing share EUR hedged EUR 7.84 6.37 6.45
Q Class non-distributing share USD 21.61 17.85 18.08
X Class non-distributing share USD 27.82 22.24 21.81
X Class non-distributing share EUR hedged EUR 7.91 6.36 –
X Class UK reporting fund share GBP 16.83 14.43 –
Three Year Summary of Net Asset Valuesas at 31 August 2011 continued

28 BlackRock Global Funds (BGF)
Currency 31 August 2011 31 August 2010 31 August 2009
World Financials Fund Total net assets USD 187,023,877 228,653,441 236,234,313Net asset value per:
A Class non-distributing share USD 13.83 14.35 15.46
B Class non-distributing share USD 12.50 13.10 14.26
C Class non-distributing share USD 12.30 12.92 14.10
D Class non-distributing share USD 14.25 14.67 15.70
E Class non-distributing share USD 13.22 13.78 14.93
Q Class non-distributing share USD 13.26 13.82 14.97
World Gold Fund Total net assets USD 9,260,959,198 7,497,540,443 5,605,878,168Net asset value per:
A Class distributing (A) share USD 69.37 55.36 41.52
A Class non-distributing share USD 69.36 55.36 41.51
A Class non-distributing share CHF hedged CHF 13.52 10.87 –
A Class non-distributing share EUR hedged EUR 12.46 10.02 7.64
A Class non-distributing share SGD hedged SGD 13.07 10.52 7.98
B Class non-distributing share USD 60.62 48.86 37.01
C Class non-distributing share USD 59.44 48.02 36.47
C Class non-distributing share EUR hedged EUR 11.85 9.65 7.45
D Class non-distributing share USD 72.31 57.27 42.63
D Class non-distributing share EUR hedged EUR 12.82 10.23 7.74
E Class non-distributing share USD 65.21 52.30 39.42
E Class non-distributing share EUR hedged EUR 12.21 9.87 7.56
I Class non-distributing share USD 70.52 55.71 42.01
I Class non-distributing share EUR hedged EUR 12.72 10.13 7.64
Q Class non-distributing share USD 60.27 48.58 36.80
X Class non-distributing share USD 77.34 60.49 44.47
World Healthscience Fund Total net assets USD 531,756,795 409,395,386 308,775,370Net asset value per:
A Class non-distributing share USD 16.61 13.73 13.68
B Class non-distributing share USD 15.13 12.62 12.71
C Class non-distributing share USD 14.71 12.31 12.42
D Class non-distributing share USD 17.11 14.03 13.88
E Class non-distributing share USD 15.79 13.11 13.14
Q Class non-distributing share USD 14.55 12.19 12.33
X Class non-distributing share USD 17.15 13.92 –
World Income Fund Total net assets USD 347,046,464 513,589,032 319,900,117Net asset value per:
A Class distributing (D) share USD 10.82 11.17 10.73
A Class distributing (M) share USD 10.86 11.21 10.77
A Class non-distributing share USD 13.44 13.46 12.50
B Class distributing (D) share USD 10.86 11.21 10.76
B Class non-distributing share USD 12.67 12.82 12.03
C Class distributing (D) share USD 10.86 11.21 10.77
C Class non-distributing share USD 12.49 12.67 11.92
D Class non-distributing share USD 13.63 13.58 12.56
E Class non-distributing share USD 13.00 13.09 12.23
J Class distributing (M) share USD 11.03 11.39 10.94
X Class distributing (M) share USD 10.19 10.52 10.10
X Class distributing (M) share AUD hedged AUD 10.98 10.84 10.11
X Class distributing (M) share EUR hedged EUR 9.72 10.02 –
Three Year Summary of Net Asset Valuesas at 31 August 2011 continued

Audited Annual Report and Accounts 29
The notes on pages 261 to 270 form an integral part of these financial statements.
Currency 31 August 2011 31 August 2010 31 August 2009
World Mining Fund Total net assets USD 16,053,985,599 13,440,680,594 9,878,476,861Net asset value per:
A Class distributing (A) share USD 76.05 61.87 53.43
A Class non-distributing share USD 76.09 61.87 53.43
A Class non-distributing share CHF hedged CHF 12.75 10.45 –
A Class non-distributing share EUR hedged EUR 7.47 6.14 5.46
A Class non-distributing share PLN hedged PLN 11.74 9.48 –
A Class non-distributing share SGD hedged SGD 7.75 6.36 5.56
A Class UK reporting fund share GBP 45.34 39.08 32.15
B Class non-distributing share USD 66.74 54.81 47.81
C Class non-distributing share USD 65.43 53.86 47.10
C Class non-distributing share EUR hedged EUR 7.12 5.93 5.34
D Class non-distributing share USD 79.34 64.03 54.88
D Class non-distributing share EUR hedged EUR 7.66 6.25 5.52
E Class non-distributing share USD 71.71 58.59 50.86
E Class non-distributing share EUR hedged EUR 7.33 6.06 5.41
I Class non-distributing share USD 77.18 62.13 –
I Class non-distributing share EUR hedged EUR 7.70 6.27 5.52
J Class non-distributing share USD 80.95 64.51 54.61
Q Class non-distributing share USD 66.46 54.58 47.61
X Class non-distributing share USD 85.89 68.45 57.94
X Class UK reporting fund share GBP 46.37 – –
World Resources Equity Income Fund(1)
Total net assets USD 2,965,929 – –Net asset value per:
A Class distributing (Q) share USD 9.10 – –
A Class non-distributing share USD 9.15 – –
E Class distributing (Q) share EUR hedged EUR 9.54 – –
World Technology Fund Total net assets USD 153,597,420 124,259,066 83,398,789Net asset value per:
A Class non-distributing share USD 12.07 10.43 9.84
B Class non-distributing share USD 10.85 9.46 9.02
C Class non-distributing share USD 10.63 9.31 8.89
D Class non-distributing share USD 12.29 10.54 9.87
E Class non-distributing share USD 11.58 10.05 9.53
Q Class non-distributing share USD 11.41 9.91 9.39
(1) New Fund launched, see Note 1, for further details.
Three Year Summary of Net Asset Valuesas at 31 August 2011 continued

30 BlackRock Global Funds (BGF)
Statement of Operations and Changes in Net Assetsfor the year ended 31 August 2011
Fund Name Note
BlackRock Global Funds
Combined
Asia PacificEquity
IncomeFund
AsianDragon
Fund
AsianTigerBondFund
US$ US$ US$ US$
Net assets at the beginning of the year* 84,384,841,322 26,588,248 605,236,043 528,146,073
Income
Bank interest 1,334,099 890 86 7,217
Bond interest 913,096,638 – – 34,425,904
Swap interest 5,823,916 – – –
Interest from money market deposits and repurchase agreements 796,608 – – –
Dividends 1,490,161,460 2,193,976 13,667,697 –
Securities lending 24,457,862 6,366 72,569 30
Total income 2(b) 2,435,670,583 2,201,232 13,740,352 34,433,151
ExpensesBank interest 1,160,683 946 2,204 5,276
Swap interest 22,237,352 – – 280,302
Administration fees 5 211,462,044 126,694 1,113,030 1,047,012
Custodian and depositary fees 6 28,794,539 50,762 362,921 105,536
Distribution fees 4 112,818,067 241,928 1,012,715 867,034
Tax 7 59,198,085 28,063 233,494 378,224
Management fees 4 1,382,340,803 760,170 5,210,493 6,946,042
Less Administration/Management fee subsidy 5 (5,881,727) – – –
Total expenses 1,812,129,846 1,208,563 7,934,857 9,629,426
Net investment income/(deficit) 623,540,737 992,669 5,805,495 24,803,725 Net profits/(losses) realised on:
Investments 2(a) 4,395,593,968 3,523,110 85,530,198 (6,194,316)
Futures contracts 2(c) 7,525,011 – – (1,523,727)
Options contracts 2(c) 27,708,728 – – (698,823)
Swaps transactions 2(c) 13,524,676 – – 617,158
Forward foreign exchange contracts 2(c) 669,049,295 675,654 (41,665) 1,715,883
Foreign currencies on other transactions 181,749,009 309,355 (895,028) 4,588,854
Net realised gain/(loss) for the year 5,295,150,687 4,508,119 84,593,505 (1,494,971)
Net change in unrealised appreciation/(depreciation) on:
Investments 2(a) 2,367,866,344 (5,699,416) (62,259,090) (17,883,130)
Futures contracts 2(c) 24,644,408 – – –
Options contracts 2(c) (37,772,990) – – (1,243,413)
Swaps transactions 2(c) 2,553,024 – – (171,108)
Forward foreign exchange contracts 2(c) 455,433,783 309,596 – 2,655,671
Foreign currencies on other transactions 2,245,650 8,115 24,910 (28,094)
Net change in unrealised gain/(loss) for the year 2,814,970,219 (5,381,705) (62,234,180) (16,670,074)
Increase/(Decrease) in net assets as a result of operations 8,733,661,643 119,083 28,164,820 6,638,680
Movements in share capitalNet receipts as a result of issue of shares 74,430,385,472 71,403,536 318,406,822 1,073,571,570
Net payments as a result of repurchase of shares (71,995,155,362) (21,961,651) (392,365,803) (1,084,462,669)
Increase/(Decrease) in net assets as a result of movements in share capital 2,435,230,110 49,441,885 (73,958,981) (10,891,099)
Dividends declared 14 (128,191,881) (1,269,714) (4,788,710) (13,453,289)
Foreign exchange adjustment 768,615,722
Net assets at the end of the year 96,194,156,916 74,879,502 554,653,172 510,440,365
(1) New Fund launched, see Note 1, for further details.
* The opening balance was combined using the average foreign exchange rates for the year
(see Note 2(e)). The same net assets when converted using the average exchange rates for
the year ended 31 August 2010 reflected a figure of US$ 82,894,820,152.

Audited Annual Report and Accounts 31
The notes on pages 261 to 270 form an integral part of these financial statements.
ChinaFund
ContinentalEuropean
FlexibleFund
EmergingEurope
Fund
EmergingMarkets
BondFund
EmergingMarkets
Equity IncomeFund(1)
EmergingMarkets
Fund
EuroBondFund
EuroCorporate
BondFund
EuroReserve
Fund
US$ € € US$ US$ US$ € € €
446,172,228 283,160,576 2,247,833,875 477,612,438 – 1,169,730,421 1,138,784,007 99,019,756 211,714,491
– 33,120 92,753 41,752 – 7,250 6,684 – 3,157
– – – 40,790,680 – – 39,945,980 4,199,405 1,812,086
– – – – – – – – –
– – – – – – – – 130,586
18,035,365 11,490,877 31,027,596 – 11,877 31,149,852 7,549 – –
– 613,540 636,024 – – 118,340 – – –
18,035,365 12,137,537 31,756,373 40,832,432 11,877 31,275,442 39,960,213 4,199,405 1,945,829
8,379 4,286 29,740 1,475 – 39,927 17,733 1,855 10,281
– – – 947,423 – – 1,057,771 104,072 –
1,895,310 1,256,468 5,899,539 663,195 389 3,185,420 1,629,864 138,058 146,495
424,519 218,140 3,658,790 125,622 78 677,379 196,547 37,644 42,620
1,092,748 498,836 1,403,606 1,104,169 – 1,804,833 618,405 254,159 81,365
410,952 284,489 1,183,045 238,836 78 1,133,840 584,406 48,492 19,510
11,233,606 6,801,744 40,703,753 4,495,894 2,338 18,013,717 7,219,035 787,809 841,727
– – – – – – – (43,213) (520)
15,065,514 9,063,963 52,878,473 7,576,614 2,883 24,855,116 11,323,761 1,328,876 1,141,478
2,969,851 3,073,574 (21,122,100) 33,255,818 8,994 6,420,326 28,636,452 2,870,529 804,351
31,732,227 7,403,050 326,025,232 6,043,911 (10,829) 143,204,137 6,743,181 261,742 (17,817)
– (1,014,087) – 47,541 – – 2,600,909 (357,398) –
– – – (1,930,534) – – (1,418,662) (129,717) –
– – – 7,312,699 – – (3,197,073) 187,893 –
9,974,322 399,333 397,451 20,498,157 820 915,456 5,044,794 408,585 –
2,624,219 (533,104) (3,374,479) 4,196,275 (7,091) (2,024,981) 1,932,939 220,463 1
44,330,768 6,255,192 323,048,204 36,168,049 (17,100) 142,094,612 11,706,088 591,568 (17,816)
(97,820,334) (41,833,978) (399,506,489) (1,932,470) 137,957 (52,099,509) (52,738,167) (4,125,788) 97,938
– 100,085 – (9,251) – – (1,463,029) (322,720) –
– – – (541,622) – – 335,391 28,295 –
– – – (3,573,297) – – 2,544,001 154,531 –
4,374,758 (148,066) 14,925 17,250,698 – – (1,966,883) (310,621) –
7,992 38,808 55,259 (78,240) 22 (1,324) (88,098) (19,599) –
(93,437,584) (41,843,151) (399,436,305) 11,115,818 137,979 (52,100,833) (53,376,785) (4,595,902) 97,938
(46,136,965) (32,514,385) (97,510,201) 80,539,685 129,873 96,414,105 (13,034,245) (1,133,805) 884,473
1,452,859,011 673,740,800 1,900,661,140 782,945,177 3,000,010 1,009,709,793 781,610,052 133,220,184 136,793,685
(1,139,482,631) (364,527,509) (2,183,268,429) (495,941,030) (10) (1,031,485,786) (747,648,653) (104,217,313) (159,065,051)
313,376,380 309,213,291 (282,607,289) 287,004,147 3,000,000 (21,775,993) 33,961,399 29,002,871 (22,271,366)
(8,698) (495,883) (115,861) (2,559,575) – – (1,696,387) (82,404) –
713,402,945 559,363,599 1,867,600,524 842,596,695 3,129,873 1,244,368,533 1,158,014,774 126,806,418 190,327,598
(1) New Fund launched, see Note 1, for further details.

32 BlackRock Global Funds (BGF)
Statement of Operations and Changes in Net Assets for the year ended 31 August 2011 continued
Fund Name Note
Euro ShortDuration
BondFund
Euro-Markets
Fund
EuropeanEnhanced
Equity YieldFund
EuropeanEquity
IncomeFund(1)
€ € € €
Net assets at the beginning of the year* 3,016,844,960 1,438,996,604 16,397,971 –
IncomeBank interest 24,770 2,578 2,454 55
Bond interest 62,779,091 – – –
Swap interest – – – –
Interest from money market deposits and repurchase agreements – 69,830 – –
Dividends 33,429 62,746,966 529,374 101,370
Securities lending 32 2,871,767 14,335 –
Total income 2(b) 62,837,322 65,691,141 546,163 101,425
ExpensesBank interest 25,888 33,374 887 –
Swap interest 4,087,497 – – –
Administration fees 5 1,628,071 4,946,711 37,147 4,646
Custodian and depositary fees 6 388,804 561,643 14,022 5,472
Distribution fees 4 6,164,999 772,889 39,429 –
Tax 7 1,020,094 1,021,292 7,160 1,157
Management fees 4 14,137,855 27,726,290 222,876 27,458
Less Administration/Management fee subsidy 5 (2,105,176) – (844) –
Total expenses 25,348,032 35,062,199 320,677 38,733
Net investment income/(deficit) 37,489,290 30,628,942 225,486 62,692 Net profits/(losses) realised on:
Investments 2(a) 14,064,228 4,748,693 978,030 (87,253)
Futures contracts 2(c) 25,380 – (42,507) –
Options contracts 2(c) (3,210,965) – 274,304 –
Swaps transactions 2(c) (12,780,323) – – –
Forward foreign exchange contracts 2(c) 25,420,741 98,048 (211,881) 9,698
Foreign currencies on other transactions 6,961,488 (51,796) 190,957 (19,493)
Net realised gain/(loss) for the year 30,480,549 4,794,945 1,188,903 (97,048)
Net change in unrealised appreciation/(depreciation) on:
Investments 2(a) (74,241,171) (205,323,733) (1,491,446) (241,289)
Futures contracts 2(c) 5,551,056 – (68,097) –
Options contracts 2(c) 1,014,773 – (181,945) –
Swaps transactions 2(c) 9,158,890 – – –
Forward foreign exchange contracts 2(c) (4,568,527) (18,832) (130,464) –
Foreign currencies on other transactions (181,023) (2,455) (8,954) (119)
Net change in unrealised gain/(loss) for the year (63,266,002) (205,345,020) (1,880,906) (241,408)
Increase/(Decrease) in net assets as a result of operations 4,703,837 (169,921,133) (466,517) (275,764)
Movements in share capitalNet receipts as a result of issue of shares 1,326,555,008 1,690,591,942 2,473,036 3,112,529
Net payments as a result of repurchase of shares (2,452,198,234) (1,044,690,840) (6,831,831) (10)
Increase/(Decrease) in net assets as a result of movements in share capital (1,125,643,226) 645,901,102 (4,358,795) 3,112,519
Dividends declared 14 (1,171,809) (157,067) (708,878) 3,079
Foreign exchange adjustment
Net assets at the end of the year 1,894,733,762 1,914,819,506 10,863,781 2,839,834
(1) New Fund launched, see Note 1, for further details.
* The opening balance was combined using the average foreign exchange rates for the year
(see Note 2(e)). The same net assets when converted using the average exchange rates for
the year ended 31 August 2010 reflected a figure of US$ 82,894,820,152.

Audited Annual Report and Accounts 33
The notes on pages 261 to 270 form an integral part of these financial statements.
EuropeanFocusFund
EuropeanFund
EuropeanGrowth
Fund
EuropeanSmall & MidCap
OpportunitiesFund
EuropeanValueFund
Fixed IncomeGlobal
OpportunitiesFund
FlexibleMulti-Asset
Fund
GlobalAllocation
Fund
GlobalCorporate
BondFund
€ € € € € US$ € US$ US$
509,097,346 2,722,334,628 177,100,093 338,194,587 137,179,554 80,066,829 85,296,103 13,254,920,256 613,951,713
4,983 34,308 4,879 14,638 1,176 2,415 64,492 17,978 9,748
– – – – – 4,543,223 1,245,734 170,094,082 32,476,210
– – – – – 6,308 1,881 – –
76,657 115,442 9,129 118,036 17,863 – 36,732 – –
35,525,977 65,256,634 4,511,373 8,753,259 6,662,280 22,012 1,734,764 189,407,907 –
664,563 1,428,649 157,256 211,036 248,873 – 15,287 1,960,368 11
36,272,180 66,835,033 4,682,637 9,096,969 6,930,192 4,573,958 3,098,890 361,480,335 32,485,969
1,518 29,000 14,264 5,294 68 7,028 16,878 181,041 1,425
– – – – – 208,594 12,392 132,416 1,920,569
2,611,927 5,931,640 590,634 964,749 433,053 159,619 280,816 29,957,989 385,599
256,207 432,475 131,012 305,141 58,426 26,959 82,471 3,141,491 75,860
350,067 1,098,099 245,113 178,643 436,009 357,549 389,718 46,768,827 87,349
579,926 1,160,772 132,635 199,922 86,784 59,190 128,824 10,307,959 130,372
17,066,380 29,949,048 3,350,062 5,676,563 2,312,763 1,042,478 1,743,256 218,299,137 1,056,978
– – – – – – (231,335) (6) (70,873)
20,866,025 38,601,034 4,463,720 7,330,312 3,327,103 1,861,417 2,423,020 308,788,854 3,587,279
15,406,155 28,233,999 218,917 1,766,657 3,603,089 2,712,541 675,870 52,691,481 28,898,690
19,389,304 190,893,945 22,061,056 21,184,329 993,577 2,363,172 9,093,673 359,384,369 24,305,893
– – – – – (3,143,286) (1,028,968) 37,628,737 (13,847,433)
– – – – – 58,339 387,988 45,175,947 –
– – – – – (451,446) 171,942 22,503,106 (1,388,449)
(2,393,442) 768,177 289,831 (1,007,537) 101,980 3,372,291 (1,362,494) 446,929,321 (10,844,677)
1,003,747 (844,331) (460,539) (98,218) (204,667) 789,587 563,708 92,389,548 21,039,730
17,999,609 190,817,791 21,890,348 20,078,574 890,890 2,988,657 7,825,849 1,004,011,028 19,265,064
(94,727,245) (254,235,311) (17,615,804) (19,019,306) (18,730,566) (3,034,747) (17,795,727) 802,002,452 (11,536,123)
– – – – – 296,811 (332,269) 21,968,000 944,286
– – – – – (4,506) 165,360 (25,566,818) –
– – – – – 884,910 71,147 (9,346,865) 1,419,700
– (310,556) – (90,451) – 1,557,745 (1,686,696) 185,301,273 19,886,506
95,053 388,733 8,857 (32,486) (334) 40,487 (25,720) (156,491) 655,260
(94,632,192) (254,157,134) (17,606,947) (19,142,243) (18,730,900) (259,300) (19,603,905) 974,201,551 11,369,629
(61,226,428) (35,105,344) 4,502,318 2,702,988 (14,236,921) 5,441,898 (11,102,186) 2,030,904,060 59,533,383
1,191,191,688 1,666,493,163 264,647,009 144,800,928 193,531,737 115,976,588 207,759,000 5,672,450,164 317,228,439
(536,932,072) (2,123,212,932) (236,255,041) (178,268,125) (151,774,482) (83,141,484) (62,866,755) (5,460,856,570) (356,598,710)
654,259,616 (456,719,769) 28,391,968 (33,467,197) 41,757,255 32,835,104 144,892,245 211,593,594 (39,370,271)
– (25,420) – – (15,543) (501,518) – (623,571) (16,398,743)
1,102,130,534 2,230,484,095 209,994,379 307,430,378 164,684,345 117,842,313 219,086,162 15,496,794,339 617,716,082

34 BlackRock Global Funds (BGF)
Statement of Operations and Changes in Net Assets for the year ended 31 August 2011 continued
Fund Name Note
GlobalDynamic
EquityFund
GlobalEnhanced
EquityYieldFund
GlobalEquity
Fund
GlobalEquity
IncomeFund(1)
US$ US$ US$ US$
Net assets at the beginning of the year* 818,387,890 232,162,354 271,083,503 –
IncomeBank interest 2,552 31,315 34 697
Bond interest 631,173 – – –
Swap interest – – – –
Interest from money market deposits and repurchase agreements – – – –
Dividends 19,882,819 8,276,230 5,690,775 7,948,716
Securities lending 197,865 141,374 86,787 –
Total income 2(b) 20,714,409 8,448,919 5,777,596 7,949,413
ExpensesBank interest 52,735 18,240 2,329 1,160
Swap interest 23,450 – – –
Administration fees 5 2,505,229 633,993 590,502 307,063
Custodian and depositary fees 6 341,033 68,120 117,937 69,792
Distribution fees 4 1,871,114 456,293 104,552 46,081
Tax 7 754,913 137,705 241,361 130,897
Management fees 4 14,844,412 3,705,919 3,102,992 1,268,231
Less Administration/Management fee subsidy 5 – – – –
Total expenses 20,392,886 5,020,270 4,159,673 1,823,224
Net investment income/(deficit) 321,523 3,428,649 1,617,923 6,126,189 Net profits/(losses) realised on:
Investments 2(a) 18,821,126 6,188,987 39,012,403 (433,332)
Futures contracts 2(c) 7,292,028 408,868 – –
Options contracts 2(c) 1,977,525 (3,289,826) – –
Swaps transactions 2(c) 1,322,210 – – –
Forward foreign exchange contracts 2(c) 6,900,342 2,942,952 63,136 (1,300,844)
Foreign currencies on other transactions 543,733 2,148,990 (602,036) 697,658
Net realised gain/(loss) for the year 36,856,964 8,399,971 38,473,503 (1,036,518)
Net change in unrealised appreciation/(depreciation) on:
Investments 2(a) 66,143,432 17,633,738 (2,114,926) 5,448,557
Futures contracts 2(c) 570,620 (1,430,504) – –
Options contracts 2(c) (3,756,168) (4,720,626) – –
Swaps transactions 2(c) (956,630) – – –
Forward foreign exchange contracts 2(c) 211,958 1,307,494 (172,438) (241,234)
Foreign currencies on other transactions 39,505 111,984 3,046 (579)
Net change in unrealised gain/(loss) for the year 62,252,717 12,902,086 (2,284,318) 5,206,744
Increase/(Decrease) in net assets as a result of operations 99,431,204 24,730,706 37,807,108 10,296,415
Movements in share capitalNet receipts as a result of issue of shares 792,567,009 166,307,032 228,870,207 465,763,827
Net payments as a result of repurchase of shares (540,396,075) (166,381,188) (256,046,406) (45,585,095)
Increase/(Decrease) in net assets as a result of movements in share capital 252,170,934 (74,156) (27,176,199) 420,178,732
Dividends declared 14 – (11,757,929) (40,539) (816,656)
Foreign exchange adjustment
Net assets at the end of the year 1,169,990,028 245,060,975 281,673,873 429,658,491
(1) New Fund launched, see Note 1, for further details.(2) Fund valuation policy, see Note 1, for further details.
* The opening balance was combined using the average foreign exchange rates for the year
(see Note 2(e)). The same net assets when converted using the average exchange rates for
the year ended 31 August 2010 reflected a figure of US$ 82,894,820,152.

Audited Annual Report and Accounts 35
The notes on pages 261 to 270 form an integral part of these financial statements.
GlobalGovernment
BondFund
GlobalHigh Yield
BondFund
GlobalInflation
LinkedBondFund
GlobalOpportunities
Fund
GlobalSmallCap
FundIndiaFund(2)
JapanFund
JapanSmall & MidCap
OpportunitiesFund
JapanValueFund
US$ US$ US$ US$ US$ US$ ¥ ¥ ¥
670,616,686 605,102,465 164,926,684 109,996,580 311,759,295 761,350,221 3,322,991,183 12,466,459,111 15,352,260,972
11,515 6,495 – 354 218 79 – 3,103 –
17,101,950 75,713,611 3,524,803 – – – – – –
12,127 2,172,838 – – – – – – –
– – – – – – – – –
– 1,146,366 – 2,250,214 4,924,727 13,581,850 66,969,054 258,982,587 296,065,723
4,056 – – 33,337 75,565 – 596,895 7,676,033 1,544,411
17,129,648 79,039,310 3,524,803 2,283,905 5,000,510 13,581,929 67,565,949 266,661,723 297,610,134
21,765 10,775 9,768 274 626 10,673 5,129 41,587 116,433
143,578 23,129 84,012 – – – – – –
841,411 1,412,584 262,514 328,445 801,395 3,313,505 10,303,546 35,930,234 31,938,374
89,996 140,104 27,545 65,869 196,818 1,599,575 5,243,489 8,399,988 4,568,798
636,427 1,142,293 467,583 137,435 484,085 1,258,116 11,300,778 15,061,337 20,868,035
290,128 498,069 99,198 135,054 248,507 546,577 2,163,426 7,559,178 6,364,377
4,067,151 10,429,683 1,267,526 1,966,286 4,217,738 15,001,334 60,168,931 211,970,598 169,512,829
(234,732) – – – – – – – –
5,855,724 13,656,637 2,218,146 2,633,363 5,949,169 21,729,780 89,185,299 278,962,922 233,368,846
11,273,924 65,382,673 1,306,657 (349,458) (948,659) (8,147,851) (21,619,350) (12,301,199) 64,241,288
23,736,437 13,554,132 7,002,333 13,719,843 50,822,645 22,587,243 (517,944,754) (986,027,883) (1,244,303,338)
(1,957,939) 2,090,715 (891,640) 5,771 – (6,134,535) – – –
(194,940) – (6,692) 144,157 – – – – –
(1,361,806) (2,612,474) (906,034) – – – – – –
(9,798,842) 38,097,221 2,200,591 934,017 (694,060) (205) (8,362,988) (19,402,560) (85,807,474)
4,264,183 13,091,421 951,547 (313,646) 47,789 (1,234,946) (3,934,050) (9,134,760) 14,172,663
14,687,093 64,221,015 8,350,105 14,490,142 50,176,374 15,217,557 (530,241,792) (1,014,565,203) (1,315,938,149)
15,230,637 (45,026,948) 16,169,518 (595,421) 5,099,248 (115,101,417) (83,112,720) 627,081,013 505,344,245
(2,202,628) (1,223,744) 73,797 – – – – – –
169,403 – – (16,570) – – – – –
1,189,523 785,956 566,717 – – – – – –
15,361,948 22,813,588 4,545,494 (323,213) 967,072 – 795,069 3,738,918 36,047,702
(51,238) 185,460 29,494 1,125 5,366 (12,131) (14,016) (146,672) (27,166)
29,697,645 (22,465,688) 21,385,020 (934,079) 6,071,686 (115,113,548) (82,331,667) 630,673,259 541,364,781
55,658,662 107,138,000 31,041,782 13,206,605 55,299,401 (108,043,842) (634,192,809) (396,193,143) (710,332,080)
298,294,618 1,506,353,440 260,533,698 82,122,331 247,826,799 1,497,504,687 7,457,478,267 23,795,388,908 13,670,485,586
(503,585,820) (1,083,000,903) (142,415,453) (100,954,857) (288,169,742) (1,340,969,174) (5,456,240,117) (19,228,192,469) (16,279,515,996)
(205,291,202) 423,352,537 118,118,245 (18,832,526) (40,342,943) 156,535,513 2,001,238,150 4,567,196,439 (2,609,030,410)
(407,811) (10,868,173) (70,545) – – – – (21,142,780) (23,102,489)
520,576,335 1,124,724,829 314,016,166 104,370,659 326,715,753 809,841,892 4,690,036,524 16,616,319,627 12,009,795,993
(2) Fund valuation policy, see Note 1, for further details.

36 BlackRock Global Funds (BGF)
Statement of Operations and Changes in Net Assets for the year ended 31 August 2011 continued
Fund Name Note
LatinAmerican
Fund
Local EmergingMarkets ShortDuration Bond
Fund
NewEnergy
Fund
PacificEquity
Fund
US$ US$ US$ US$
Net assets at the beginning of the year* 6,740,241,536 2,298,680,977 2,691,079,548 160,010,864
IncomeBank interest – 389,181 20,162 1,276
Bond interest 1,895,910 131,044,921 5,125 –
Swap interest – – – –
Interest from money market deposits and repurchase agreements – – – –
Dividends 233,831,830 – 38,646,866 4,424,391
Securities lending 186,653 – 4,434,773 6,530
Total income 2(b) 235,914,393 131,434,102 43,106,926 4,432,197
ExpensesBank interest 16,644 186,356 10,178 1,173
Swap interest – 6,566,957 – –
Administration fees 5 19,567,047 3,451,561 6,384,375 480,483
Custodian and depositary fees 6 2,290,408 2,043,246 458,989 88,808
Distribution fees 4 3,457,151 3,948,401 2,025,779 439,108
Tax 7 10,483,902 1,215,221 1,321,886 98,194
Management fees 4 134,032,240 19,687,361 43,975,062 2,483,748
Less Administration/Management fee subsidy 5 – – – –
Total expenses 169,847,392 37,099,103 54,176,269 3,591,514
Net investment income/(deficit) 66,067,001 94,334,999 (11,069,343) 840,683 Net profits/(losses) realised on:
Investments 2(a) 516,749,770 64,372,290 (477,315,362) 14,948,099
Futures contracts 2(c) – (4,484,373) – –
Options contracts 2(c) – (12,106,662) – –
Swaps transactions 2(c) – 9,963,505 – –
Forward foreign exchange contracts 2(c) 337,172 (38,576,889) (1,953,169) (920,887)
Foreign currencies on other transactions 2,505,942 (16,004,733) 687,854 29,589
Net realised gain/(loss) for the year 519,592,884 3,163,138 (478,580,677) 14,056,801
Net change in unrealised appreciation/(depreciation) on:
Investments 2(a) (539,375,862) 52,056,908 457,047,666 (542,263)
Futures contracts 2(c) – – – –
Options contracts 2(c) – (4,320,939) – –
Swaps transactions 2(c) – (7,772,298) – –
Forward foreign exchange contracts 2(c) 128,080 76,430,017 – 668,014
Foreign currencies on other transactions 822,997 (64,058) (8,457) 18,117
Net change in unrealised gain/(loss) for the year (538,424,785) 116,329,630 457,039,209 143,868
Increase/(Decrease) in net assets as a result of operations 47,235,100 213,827,767 (32,610,811) 15,041,352
Movements in share capitalNet receipts as a result of issue of shares 5,900,866,482 2,115,689,892 889,512,578 119,166,253
Net payments as a result of repurchase of shares (5,943,300,364) (1,992,225,070) (1,391,527,193) (123,009,664)
Increase/(Decrease) in net assets as a result of movements in share capital (42,433,882) 123,464,822 (502,014,615) (3,843,411)
Dividends declared 14 (4,168,515) (23,213,794) (119,761) –
Foreign exchange adjustment
Net assets at the end of the year 6,740,874,239 2,612,759,772 2,156,334,361 171,208,805
* The opening balance was combined using the average foreign exchange rates for the year
(see Note 2(e)). The same net assets when converted using the average exchange rates for
the year ended 31 August 2010 reflected a figure of US$ 82,894,820,152.

Audited Annual Report and Accounts 37
The notes on pages 261 to 270 form an integral part of these financial statements.
SwissSmall & MidCap
OpportunitiesFund
UnitedKingdom
Fund
USBasicValueFund
US DollarCoreBondFund
US DollarHigh Yield
BondFund
US DollarReserve
Fund
US DollarShort Duration
BondFund
USFlexible
EquityFund
USGovernment
MortgageFund
CHF £ US$ US$ US$ US$ US$ US$ US$
227,545,072 387,307,727 1,837,909,082 376,359,743 1,301,791,885 286,342,721 145,131,526 1,765,803,734 202,757,455
– 8,070 12,184 15,729 6,077 5 702 7,342 2,075
– – – 14,520,086 159,182,717 878,549 5,711,946 – 6,219,943
– – – 535 3,620,941 – – – –
– – – – – – – – –
5,009,503 12,029,557 33,813,833 – 3,258,156 – – 20,503,882 –
129,464 4,413 150,555 – 242 – – 241,338 –
5,138,967 12,042,040 33,976,572 14,536,350 166,068,133 878,554 5,712,648 20,752,562 6,222,018
357 9,111 41,247 28,088 3,495 348 1,477 17,673 714
– – – 1,159,220 64,389 – 82,644 – 189,151
1,270,984 1,023,365 4,905,491 439,637 2,899,527 218,865 126,395 3,906,573 262,435
193,143 144,258 224,830 133,358 238,998 30,005 31,398 178,525 80,883
– 69,232 1,532,055 1,293,810 598,819 122,808 623,831 1,584,840 926,512
282,235 215,241 1,022,819 155,505 1,047,560 29,210 85,324 769,734 90,344
6,771,714 5,078,596 27,747,135 2,550,041 22,447,236 1,313,187 1,206,855 20,641,129 1,504,382
– – – (118,460) (930,366) (712,967) (174,122) – (70,316)
8,518,433 6,539,803 35,473,577 5,641,199 26,369,658 1,001,456 1,983,802 27,098,474 2,984,105
(3,379,466) 5,502,237 (1,497,005) 8,895,151 139,698,475 (122,902) 3,728,846 (6,345,912) 3,237,913
(47,260,384) 27,094,944 196,402,312 8,665,579 71,178,913 20,449 1,934,650 217,456,750 5,047,046
– 256,419 – (4,283,098) 4,250,059 – (1,340,872) – (1,305,258)
– – 241,448 (243,868) – – (4,304) – (16,448)
– – – (7,461,255) 8,287,451 – (122,202) – 351,188
– (385) 13,872,816 (314,197) 22,320,784 (198,021) (804,560) 18,601,919 –
(5,273) (57,606) 2,431,933 79,102 7,029,167 43,936 (9,239) 2,526,570 2,049
(47,265,657) 27,293,372 212,948,509 (3,557,737) 113,066,374 (133,636) (346,527) 238,585,239 4,078,577
(35,919,561) (26,418,725) 28,981,390 (3,655,246) (134,908,007) (44,455) (734,108) 100,465,927 (61,606)
– 221,610 – 381,838 (3,080,388) – 68,212 – 98,373
– – – 38,510 – – (10,277) – 14,826
– – – 3,211,855 671,709 – 159,348 – (675,796)
– – 6,847,864 29,710 20,982,987 554,673 (7,540) 10,456,299 –
(18) (9,375) (45) (262) 240,761 2 7,751 52,894 12,306
(35,919,579) (26,206,490) 35,829,209 6,405 (116,092,938) 510,220 (516,614) 110,975,120 (611,897)
(86,564,702) 6,589,119 247,280,713 5,343,819 136,671,911 253,682 2,865,705 343,214,447 6,704,593
603,050,738 267,287,544 1,125,995,713 467,056,710 2,498,169,571 943,320,331 255,809,009 741,094,596 249,936,018
(420,211,646) (250,422,810) (1,528,464,702) (541,086,581) (1,634,133,321) (850,257,603) (229,558,938) (1,369,767,589) (271,892,117)
182,839,092 16,864,734 (402,468,989) (74,029,871) 864,036,250 93,062,728 26,250,071 (628,672,993) (21,956,099)
– (1,227,638) – (3,016,329) (10,163,648) – (705,911) (938,604) (1,374,186)
323,819,462 409,533,942 1,682,720,806 304,657,362 2,292,336,398 379,659,131 173,541,391 1,479,406,584 186,131,763

38 BlackRock Global Funds (BGF)
Statement of Operations and Changes in Net Assets for the year ended 31 August 2011 continued
Fund Name Note
USGrowth
Fund
USSmall & MidCap
OpportunitiesFund
WorldAgriculture
Fund
US$ US$ US$
Net assets at the beginning of the year* 191,853,190 389,261,866 56,646,439
IncomeBank interest 3 153 612
Bond interest – – –
Swap interest – – –
Interest from money market deposits and repurchase agreements – – –
Dividends 2,106,101 4,999,723 2,735,474
Securities lending 7,371 32,448 15,805
Total income 2(b) 2,113,475 5,032,324 2,751,891
ExpensesBank interest 195 5 3,799
Swap interest – – –
Administration fees 5 709,691 1,535,344 583,513
Custodian and depositary fees 6 67,816 110,808 88,671
Distribution fees 4 450,053 501,082 554,322
Tax 7 145,039 337,411 214,698
Management fees 4 3,750,686 8,710,230 3,746,449
Less Administration/Management fee subsidy 5 – – (197,830)
Total expenses 5,123,480 11,194,880 4,993,622
Net investment income/(deficit) (3,010,005) (6,162,556) (2,241,731)Net profits/(losses) realised on:
Investments 2(a) 27,274,561 54,668,308 (3,381,576)
Futures contracts 2(c) – 1,967,144 –
Options contracts 2(c) – (8,299) –
Swaps transactions 2(c) – – –
Forward foreign exchange contracts 2(c) 154 – 928,733
Foreign currencies on other transactions 52,483 (3,555) 427,534
Net realised gain/(loss) for the year 27,327,198 56,623,598 (2,025,309)
Net change in unrealised appreciation/(depreciation) on:
Investments 2(a) 8,679,631 (11,462,141) 586,882
Futures contracts 2(c) – 2,566,422 –
Options contracts 2(c) – – –
Swaps transactions 2(c) – – –
Forward foreign exchange contracts 2(c) – – 958,015
Foreign currencies on other transactions – 5 2,003
Net change in unrealised gain/(loss) for the year 8,679,631 (8,895,714) 1,546,900
Increase/(Decrease) in net assets as a result of operations 32,996,824 41,565,328 (2,720,140)
Movements in share capitalNet receipts as a result of issue of shares 363,951,490 664,062,711 675,374,882
Net payments as a result of repurchase of shares (337,629,932) (520,084,291) (140,907,758)
Increase/(Decrease) in net assets as a result of movements in share capital 26,321,558 143,978,420 534,467,124
Dividends declared 14 – – (577,167)
Foreign exchange adjustment
Net assets at the end of the year 251,171,572 574,805,614 587,816,256
(1) New Fund launched, see Note 1, for further details.
* The opening balance was combined using the average foreign exchange rates for the year
(see Note 2(e)). The same net assets when converted using the average exchange rates for
the year ended 31 August 2010 reflected a figure of US$ 82,894,820,152.

Audited Annual Report and Accounts 39
The notes on pages 261 to 270 form an integral part of these financial statements.
WorldBondFund
WorldEnergy
Fund
WorldFinancials
Fund
WorldGoldFund
WorldHealthscience
Fund
WorldIncome
Fund
WorldMining
Fund
WorldResources
Equity IncomeFund(1)
WorldTechnology
Fund
US$ US$ US$ US$ US$ US$ US$ US$ US$
434,877,583 3,661,724,381 228,653,441 7,497,540,443 409,395,386 513,589,032 13,440,680,594 – 124,259,066
43,808 6,112 1,087 105,868 2,096 5,969 156,956 – 790
13,411,820 1,998,159 – 1,205,936 – 19,080,184 26,077,220 – –
8,558 – – – – – – – –
– – – – – – – – –
– 60,634,698 5,691,823 81,833,679 11,704,085 8,831 317,377,178 31,292 1,183,997
– 2,055,959 215,782 2,077,863 75,771 – 2,385,024 – 88,375
13,464,186 64,694,928 5,908,692 85,223,346 11,781,952 19,094,984 345,996,378 31,292 1,273,162
9,189 10,252 407 45,000 1,536 958 119,760 385 3,724
79,882 – – – – 3,032,798 – – –
291,625 12,702,063 629,013 20,190,914 1,252,404 314,046 39,884,084 2,756 445,373
74,939 779,399 60,603 1,750,447 60,022 75,418 2,649,183 216 40,929
103,166 2,866,859 530,919 4,284,009 334,856 514,379 7,694,112 10 417,820
104,326 2,783,432 125,490 4,332,637 277,131 104,602 8,545,964 603 93,807
1,168,437 87,126,621 3,688,010 140,639,108 6,798,323 1,361,379 277,582,762 19,294 2,312,993
– – – – – (69,117) – – –
1,831,564 106,268,626 5,034,442 171,242,115 8,724,272 5,334,463 336,475,865 23,264 3,314,646
11,632,622 (41,573,698) 874,250 (86,018,769) 3,057,680 13,760,521 9,520,513 8,028 (2,041,484)
13,336,610 224,566,984 (3,753,076) 665,372,072 77,856,408 18,264,286 1,011,559,566 (30,496) 22,206,284
(3,178,989) – – – – (4,740,133) – – –
(113,220) – 217,983 – 1,476,002 (227,970) 2,939,680 2,479 –
(633,791) – – – – (231,207) – – –
(12,719,770) 37,757,332 (196,289) 40,570,917 (462,621) (10,879,987) 51,824,270 4,433 (80,819)
2,446,906 3,560,534 (33,329) 10,789,637 224,651 6,087,085 9,328,585 (2,328) (305,349)
(862,254) 265,884,850 (3,764,711) 716,732,626 79,094,440 8,272,074 1,075,652,101 (25,912) 21,820,116
15,849,056 495,272,988 (3,675,461) 1,285,264,836 (9,584,001) (1,860,098) 1,854,674,739 (236,140) (2,122,001)
(1,368,645) – – – – 1,829,366 – – –
98,388 – – – – 198,106 – (414) –
582,078 – – – – (969,551) – – –
(5,038,752) 16,786,141 – 25,410,587 6,305,723 6,910,732 24,572,764 112 (81,219)
(200,485) 72,860 16,583 (104,724) (24,001) 91,735 232,185 107 (6,105)
9,921,640 512,131,989 (3,658,878) 1,310,570,699 (3,302,279) 6,200,290 1,879,479,688 (236,335) (2,209,325)
20,692,008 736,443,141 (6,549,339) 1,941,284,556 78,849,841 28,232,885 2,964,652,302 (254,219) 17,569,307
204,890,037 4,498,515,413 179,180,972 6,815,755,649 466,175,277 160,279,891 12,493,157,141 3,225,884 285,549,633
(206,084,869) (3,565,271,484) (214,261,197) (6,993,621,450) (422,663,709) (345,022,194) (12,844,446,972) (5,685) (273,780,586)
(1,194,832) 933,243,929 (35,080,225) (177,865,801) 43,511,568 (184,742,303) (351,289,831) 3,220,199 11,769,047
(203,026) (1,349,436) – – – (10,033,150) (57,466) (51) –
454,171,733 5,330,062,015 187,023,877 9,260,959,198 531,756,795 347,046,464 16,053,985,599 2,965,929 153,597,420
(1) New Fund launched, see Note 1, for further details.

40 BlackRock Global Funds (BGF)
Statement of Changes in Shares Outstandingas at 31 August 2011
Shares outstanding at the beginning
of the yearSharesissued
Sharesrepurchased
Shares outstanding at the endof the year
Asia Pacific Equity Income FundA Class distributing (Q) share 440,806 2,552,858 573,439 2,420,225
A Class distributing (Q) share SGD hedged 191,380 2,427,932 541,982 2,077,330
A Class non-distributing share 714,920 449,396 280,578 883,738
C Class distributing (Q) share 1,212,608 897,861 701,388 1,409,081
C Class distributing (Q) share SGD hedged 105,965 163,644 40,452 229,157
E Class distributing (Q) share EUR hedged – 16,137 – 16,137
Asian Dragon Fund A Class non-distributing share 6,886,565 7,504,324 9,298,967 5,091,922
A Class UK reporting fund share 52,214 33,514 12,571 73,157
B Class non-distributing share 1,008,012 71,389 398,725 680,676
C Class non-distributing share 1,217,007 470,399 634,119 1,053,287
D Class non-distributing share 4,086,783 1,349,998 1,189,685 4,247,096
E Class non-distributing share 1,608,483 988,074 1,087,642 1,508,915
Q Class non-distributing share 883,053 – 165,187 717,866
X Class non-distributing share 673,509 34,886 108,818 599,577
X Class UK reporting fund share 8,978,134 707,918 966,052 8,720,000
Asian Tiger Bond Fund A Class distributing (D) share 966,065 604,500 676,302 894,263
A Class distributing (M) share 13,650,266 33,659,830 35,665,521 11,644,575
A Class distributing (M) share HKD hedged 43,788,845 87,649,128 103,670,754 27,767,219
A Class non-distributing share 6,773,579 17,221,618 15,788,398 8,206,799
A Class non-distributing share SGD hedged – 945,969 548,086 397,883
B Class distributing (D) share 472,200 119,881 200,331 391,750
B Class non-distributing share 165,192 115,000 203,794 76,398
C Class distributing (D) share 2,009,490 1,028,788 1,121,177 1,917,101
C Class non-distributing share 934,584 489,363 964,251 459,696
E Class non-distributing share 1,174,026 982,590 1,137,825 1,018,791
Q Class distributing (D) share 595,354 3,940 65,379 533,915
Q Class non-distributing share 38,532 – 6,700 31,832
China FundA Class non-distributing share 19,024,089 95,266,953 72,483,681 41,807,361
A Class non-distributing share EUR hedged 2,813,067 10,673,032 10,097,995 3,388,104
A Class non-distributing share HKD unhedged 22,179,896 23,923,635 26,932,810 19,170,721
A Class non-distributing share SGD hedged 383,629 2,475,192 801,704 2,057,117
A Class UK reporting fund share GBP hedged 31,867 68,582 17,588 82,861
B Class non-distributing share 1,805,961 208,258 846,306 1,167,913
B Class non-distributing share EUR hedged 6,206 1,642 4,171 3,677
B Class non-distributing share SGD hedged 13,000 – 3,000 10,000
C Class non-distributing share 4,040,897 2,658,289 2,065,429 4,633,757
C Class non-distributing share SGD hedged 40,173 7,371 13,517 34,027
D Class non-distributing share 1,806,531 1,364,058 1,233,019 1,937,570
E Class non-distributing share EUR hedged 2,153,196 1,699,944 1,698,034 2,155,106
I Class non-distributing share 1,732,458 210,885 937,301 1,006,042
X Class non-distributing share 1,237,958 187,670 32,511 1,393,117
Continental European Flexible Fund A Class distributing (A) share – 731,800 672,070 59,730
A Class non-distributing share 13,509,922 30,533,505 16,783,235 27,260,192
A Class UK reporting fund share 3,972,066 2,268,080 1,044,704 5,195,442
A Class UK reporting fund share GBP hedged – 785,729 82,785 702,944
B Class non-distributing share 11,418 48,408 34,193 25,633
C Class non-distributing share 657,302 1,461,150 369,170 1,749,282
D Class non-distributing share 4,545,957 10,715,850 6,312,640 8,949,167
E Class non-distributing share 1,539,642 9,102,140 2,702,376 7,939,406
X Class non-distributing share 867,764 184,461 347,270 704,955
X Class UK reporting fund share 3,381,021 545,535 2,662,195 1,264,361

Audited Annual Report and Accounts 41
The notes on pages 261 to 270 form an integral part of these financial statements.
Statement of Changes in Shares Outstandingas at 31 August 2011 continued
Shares outstanding at the beginning
of the yearSharesissued
Sharesrepurchased
Shares outstanding at the endof the year
Emerging Europe Fund A Class distributing (A) share 700 6,687 2,778 4,609
A Class non-distributing share 21,894,719 16,609,588 19,935,127 18,569,180
A Class non-distributing share SGD hedged – 608,148 170,816 437,332
A Class UK reporting fund share 41,387 24,966 16,960 49,393
B Class non-distributing share 183,322 24,458 52,431 155,349
C Class non-distributing share 303,533 318,306 199,004 422,835
D Class non-distributing share 385,500 853,458 241,750 997,208
E Class non-distributing share 1,800,099 814,270 1,011,130 1,603,239
J Class non-distributing share 88,193 48,828 37,660 99,361
Q Class non-distributing share 5,159 – – 5,159
X Class non-distributing share 100,567 71,486 71,708 100,345
X Class UK reporting fund share 148,673 88,738 141,323 96,088
Emerging Markets Bond Fund A Class distributing (D) share 1,515,501 1,184,880 1,287,456 1,412,925
A Class distributing (M) share 1,157,162 5,749,257 4,741,197 2,165,222
A Class non-distributing share 8,067,714 19,610,817 15,777,761 11,900,770
A Class non-distributing share EUR hedged 3,219,033 578,457 1,510,716 2,286,774
B Class distributing (D) share 1,225,858 218,313 391,933 1,052,238
B Class non-distributing share 267,441 63,802 158,760 172,483
C Class distributing (D) share 733,298 457,547 352,691 838,154
C Class non-distributing share 1,131,220 764,426 756,159 1,139,487
D Class non-distributing share 1,477,520 4,614,363 4,013,635 2,078,248
E Class non-distributing share 9,910,322 4,659,634 7,294,937 7,275,019
Q Class distributing (D) share 1,284,792 16,095 347,469 953,418
X Class non-distributing share 3,767,279 921,401 5,748 4,682,932
X Class non-distributing share EUR hedged 4,320,688 15,747,738 1,800,688 18,267,738
X Class non-distributing share JPY hedged – 1,512,299 – 1,512,299
Emerging Markets Equity Income Fund(1) A Class distributing (Q) share – 1,000 – 1,000
A Class non-distributing share – 299,000 – 299,000
Emerging Markets Fund A Class non-distributing share 31,177,629 21,358,355 25,787,185 26,748,799
B Class non-distributing share 721,745 99,391 258,407 562,729
C Class non-distributing share 1,869,826 1,228,908 1,022,158 2,076,576
D Class non-distributing share 3,190,997 3,220,330 1,740,341 4,670,986
E Class non-distributing share 4,878,485 4,990,320 3,906,638 5,962,167
Q Class non-distributing share 12,628 – 4,717 7,911
X Class non-distributing share 1,775,196 1,470,348 664,200 2,581,344
Euro Bond Fund A Class distributing (A) share 194,280 1,178,950 50,841 1,322,389
A Class distributing (D) share 924,945 114,406 494,118 545,233
A Class distributing (M) share 1,819,873 1,555,818 2,444,313 931,378
A Class non-distributing share 35,283,771 18,930,108 20,990,509 33,223,370
A Class UK reporting fund share – 2,100 – 2,100
B Class distributing (D) share 206,886 10,023 53,494 163,415
B Class non-distributing share 76,142 4,523 38,133 42,532
C Class distributing (D) share 98,959 25,876 49,664 75,171
C Class non-distributing share 597,077 462,293 686,290 373,080
D Class non-distributing share 10,293,444 10,694,189 6,978,898 14,008,735
E Class distributing (Q) share 44,692 334,555 203,989 175,258
E Class non-distributing share 4,621,419 3,589,803 5,069,039 3,142,183
I Class non-distributing share – 1,000,000 – 1,000,000
Q Class distributing (D) share 44,194 19 1 44,212
Q Class non-distributing share 80,723 – 21,471 59,252
X Class non-distributing share 106,252 767,848 24,396 849,704
(1) New Fund launched, see Note 1, for further details.

42 BlackRock Global Funds (BGF)
Statement of Changes in Shares Outstandingas at 31 August 2011 continued
Shares outstanding at the beginning
of the yearSharesissued
Sharesrepurchased
Shares outstanding at the endof the year
Euro Corporate Bond FundA Class distributing (D) share 78,033 134,862 27,980 184,915
A Class distributing (M) share 31,626 20,383 26,100 25,909
A Class non-distributing share 2,830,582 4,086,891 4,720,938 2,196,535
B Class distributing (D) share 1,500 – – 1,500
C Class non-distributing share 274,650 557,844 231,964 600,530
D Class non-distributing share 869,807 805,389 566,877 1,108,319
E Class distributing (Q) share 4,927 441,344 33,455 412,816
E Class non-distributing share 3,110,079 2,383,367 3,046,356 2,447,090
X Class non-distributing share 967,329 2,526,083 33,000 3,460,412
Euro Reserve FundA Class non-distributing share 2,067,134 244,858 560,240 1,751,752
B Class non-distributing share 20,507 14,404 27,753 7,158
C Class non-distributing share 36,688 177,053 145,994 67,747
D Class non-distributing share 307,644 115,149 220,972 201,821
E Class non-distributing share 464,527 1,350,408 1,245,670 569,265
Euro Short Duration Bond Fund A Class distributing (D) share 731,770 369,383 475,929 625,224
A Class distributing (M) share 342,269 550,071 197,169 695,171
A Class non-distributing share 56,927,395 29,191,215 47,800,912 38,317,698
A Class non-distributing share CHF hedged 155,222 31,607 12,715 174,114
A Class non-distributing share USD hedged 67,574 28,676 42,580 53,670
A Class UK reporting fund share – 1,647,595 100,165 1,547,430
A Class UK reporting fund share GBP hedged 3,970,486 1,021,695 2,226,325 2,765,856
A Class UK reporting fund share USD hedged – 129,402 30,782 98,620
B Class distributing (D) share 54,547 – 45,847 8,700
B Class non-distributing share 182,965 29,890 141,652 71,203
C Class distributing (D) share 133,385 74,959 171,934 36,410
C Class non-distributing share 20,213,633 5,611,529 15,785,738 10,039,424
D Class non-distributing share 39,873,169 30,402,050 36,060,652 34,214,567
D Class UK reporting fund share GBP hedged – 51,348 – 51,348
E Class non-distributing share 88,490,618 24,470,035 73,970,512 38,990,141
I Class non-distributing share 1,123,982 2,581,122 1,689,256 2,015,848
X Class non-distributing share 9,565,470 702,365 2,095,850 8,171,985
Euro-Markets Fund A Class distributing (A) share 196,853 787,598 198,905 785,546
A Class non-distributing share 75,296,608 69,904,191 45,431,331 99,769,468
A Class non-distributing share CHF hedged – 245,737 73,000 172,737
A Class UK reporting fund share – 82,277 2,315 79,962
B Class non-distributing share 172,239 547 69,088 103,698
C Class non-distributing share 284,773 314,425 187,473 411,725
D Class non-distributing share 15,224,343 15,013,873 12,666,149 17,572,067
E Class non-distributing share 4,827,535 12,435,048 5,108,182 12,154,401
I Class non-distributing share 2,500,197 2,540,138 441,225 4,599,110
Q Class non-distributing share 97,852 – 17,628 80,224
X Class non-distributing share 810,571 – 212,225 598,346

Audited Annual Report and Accounts 43
The notes on pages 261 to 270 form an integral part of these financial statements.
Statement of Changes in Shares Outstandingas at 31 August 2011 continued
Shares outstanding at the beginning
of the yearSharesissued
Sharesrepurchased
Shares outstanding at the endof the year
European Enhanced Equity Yield FundA Class distributing (Q) share 1,061,211 89,331 320,970 829,572
A Class distributing (Q) share GBP hedged 17,300 – – 17,300
A Class distributing (Q) share USD hedged 226,093 6,794 162,267 70,620
A Class non-distributing share 509,984 90,410 99,641 500,753
A Class non-distributing share GBP hedged 7,990 19,725 5,585 22,130
A Class non-distributing share USD hedged 25,115 4,052 630 28,537
B Class distributing (Q) share 154,093 – 129,523 24,570
B Class distributing (Q) share GBP hedged 36,042 – 34,000 2,042
B Class distributing (Q) share USD hedged 173,152 4,655 54,233 123,574
B Class non-distributing share 87,410 – 34,016 53,394
B Class non-distributing share USD hedged 51,005 – 26,500 24,505
C Class distributing (Q) share 136,572 – 12,891 123,681
C Class distributing (Q) share GBP hedged 10,000 – – 10,000
C Class distributing (Q) share USD hedged 60,608 – 32,500 28,108
C Class non-distributing share 93,989 6,173 46,791 53,371
C Class non-distributing share GBP hedged – 19,240 19,240 –
C Class non-distributing share USD hedged 16,806 – 14,663 2,143
E Class non-distributing share 12,258 67,367 66,131 13,494
European Equity Income Fund(1)
A Class distributing (Q) share – 790 – 790
A Class non-distributing share – 265,920 – 265,920
D Class non-distributing share – 22,620 – 22,620
E Class distributing (Q) share – 21,080 – 21,080
European Focus Fund A Class non-distributing share 27,444,351 56,961,413 29,190,518 55,215,246
C Class non-distributing share 166,505 378,477 90,212 454,770
D Class non-distributing share 8,452,402 10,007,047 5,473,465 12,985,984
E Class non-distributing share 1,517,612 5,783,067 1,085,710 6,214,969
I Class non-distributing share – 4,198,200 680,321 3,517,879
X Class non-distributing share 1,058,846 3,197,355 – 4,256,201
European Fund A Class distributing (A) share 18,364 42,049 31,174 29,239
A Class non-distributing share 26,685,790 12,518,747 20,918,622 18,285,915
A Class non-distributing share USD hedged – 2,849,435 156,555 2,692,880
A Class UK reporting fund share – 11,790 924 10,866
B Class non-distributing share 111,375 2,889 54,827 59,437
C Class non-distributing share 375,266 281,204 176,342 480,128
D Class non-distributing share 9,818,707 7,526,984 6,756,163 10,589,528
E Class non-distributing share 1,447,347 1,438,063 680,699 2,204,711
I Class non-distributing share 801,227 65,350 621 865,956
Q Class non-distributing share 62,708 – 13,988 48,720
X Class non-distributing share 1,423,020 157,351 491,999 1,088,372
European Growth Fund A Class non-distributing share 7,135,249 10,365,701 9,495,020 8,005,930
B Class non-distributing share 193,261 6,412 58,555 141,118
C Class non-distributing share 220,227 61,571 87,737 194,061
D Class non-distributing share 1,097,503 1,153,603 1,020,943 1,230,163
E Class non-distributing share 1,278,949 1,496,488 1,071,654 1,703,783
European Small & MidCap Opportunities FundA Class non-distributing share 4,600,927 1,223,915 1,629,409 4,195,433
B Class non-distributing share 25,036 629 9,197 16,468
C Class non-distributing share 25,141 5,008 14,016 16,133
D Class non-distributing share 118,342 461,218 476,054 103,506
E Class non-distributing share 159,468 202,414 193,778 168,104
Q Class non-distributing share 103,716 – 20,731 82,985
(1) New Fund launched, see Note 1, for further details.

44 BlackRock Global Funds (BGF)
Statement of Changes in Shares Outstandingas at 31 August 2011 continued
Shares outstanding at the beginning
of the yearSharesissued
Sharesrepurchased
Shares outstanding at the endof the year
European Value Fund A Class distributing (A) share 7,510 8,279 10,311 5,478
A Class non-distributing share 2,334,080 3,589,353 2,618,574 3,304,859
A Class UK reporting fund share 15,982 3,092 90 18,984
B Class non-distributing share 237,631 6,623 64,906 179,348
C Class non-distributing share 270,844 42,703 86,732 226,815
D Class non-distributing share 276,414 1,247,817 864,217 660,014
E Class non-distributing share 120,148 256,639 154,210 222,577
Q Class non-distributing share 918,013 – 211,044 706,969
X Class UK reporting fund share 242,470 763 243,233 –
Fixed Income Global Opportunities FundA Class distributing (Q) share 815,104 356,897 178,114 993,887
A Class distributing (Q) share EUR hedged 116,087 30,212 21,227 125,072
A Class distributing (Q) share SGD hedged 13,000 – – 13,000
A Class non-distributing share 1,782,783 4,445,759 3,394,473 2,834,069
A Class non-distributing share EUR hedged 1,204,665 1,279,950 818,494 1,666,121
A Class non-distributing share PLN hedged 59,567 1,386,467 511,008 935,026
A Class non-distributing share SGD hedged 116,670 – 34,673 81,997
B Class distributing (Q) share 619,678 65,569 132,350 552,897
B Class non-distributing share 222,147 52,702 49,510 225,339
B Class non-distributing share EUR hedged 78,949 18,581 8,339 89,191
C Class distributing (Q) share 1,224,740 369,286 638,604 955,422
C Class non-distributing share 304,022 128,390 84,136 348,276
D Class non-distributing share EUR hedged 102,990 1,091,957 1,049,422 145,525
E Class non-distributing share 153,070 394,310 412,916 134,464
E Class non-distributing share EUR hedged 929,028 2,806,184 1,509,445 2,225,767
Flexible Multi-Asset FundA Class non-distributing share 1,252,119 285,484 308,170 1,229,433
A Class non-distributing share USD hedged 1,392,914 440,171 838,851 994,234
C Class non-distributing share 52,664 1,259,548 200,669 1,111,543
C Class non-distributing share USD hedged 62,655 74,914 69,402 68,167
D Class non-distributing share 1,986,170 4,574,159 83,174 6,477,155
E Class non-distributing share 1,295,524 7,880,310 1,954,496 7,221,338
E Class non-distributing share USD hedged 20,571 250,906 119,741 151,736
X Class non-distributing share 796,674 4,247,133 1,718,380 3,325,427
Global Allocation Fund A Class distributing (A) share 416,709 177,797 81,351 513,155
A Class distributing (A) share EUR hedged 2,482,155 339,310 537,669 2,283,796
A Class non-distributing share 166,180,722 71,394,760 80,584,967 156,990,515
A Class non-distributing share AUD hedged 2,567,086 5,043,290 5,703,253 1,907,123
A Class non-distributing share CHF hedged 2,160,687 1,665,728 681,893 3,144,522
A Class non-distributing share EUR hedged 47,100,228 19,633,214 18,546,775 48,186,667
A Class non-distributing share GBP hedged 2,197,700 1,685,448 574,728 3,308,420
A Class non-distributing share PLN hedged 232,259 3,488,501 273,274 3,447,486
A Class non-distributing share SGD hedged 14,943,865 13,465,284 5,950,582 22,458,567
B Class non-distributing share 28,987,038 1,010,916 6,521,510 23,476,444
B Class non-distributing share EUR hedged 1,281,536 28,910 334,816 975,630
C Class non-distributing share 42,144,064 11,254,134 11,008,813 42,389,385
C Class non-distributing share EUR hedged 8,583,655 2,864,033 2,885,721 8,561,967
D Class non-distributing share 3,498,311 9,156,255 5,150,840 7,503,726
D Class non-distributing share EUR hedged 4,420,446 4,695,601 2,230,428 6,885,619
E Class non-distributing share 16,577,584 9,095,788 8,398,267 17,275,105
E Class non-distributing share EUR hedged 34,658,387 15,515,441 11,842,028 38,331,800
E Class non-distributing share PLN hedged – 56,310 7,943 48,367
I Class non-distributing share – 977,418 – 977,418
J Class non-distributing share 1,038,417 10,103 241,797 806,723
Q Class non-distributing share 8,631,563 1,618 1,120,721 7,512,460
X Class non-distributing share 1,978,615 7,796,086 2,192,984 7,581,717
X Class non-distributing share AUD hedged 617,179 7,801,565 3,359,381 5,059,363
X Class non-distributing share EUR hedged 2 – – 2

Audited Annual Report and Accounts 45
The notes on pages 261 to 270 form an integral part of these financial statements.
Statement of Changes in Shares Outstandingas at 31 August 2011 continued
Shares outstanding at the beginning
of the yearSharesissued
Sharesrepurchased
Shares outstanding at the endof the year
Global Corporate Bond FundA Class distributing (A) share EUR hedged 46,720 – 29,558 17,162
A Class non-distributing share 3,677,426 13,697,328 15,203,625 2,171,129
A Class non-distributing share EUR hedged 61,169 491,535 175,194 377,510
D Class non-distributing share 2,604,647 1,898,443 2,425,687 2,077,403
D Class non-distributing share EUR hedged 7,044,907 3,543,867 3,290,642 7,298,132
E Class non-distributing share 315,236 226,989 226,042 316,183
E Class non-distributing share EUR hedged 891,354 1,487,511 1,326,391 1,052,474
X Class non-distributing share 3,342,969 562,937 – 3,905,906
X Class non-distributing share EUR hedged 4,494,930 653,973 26,889 5,122,014
X Class UK reporting fund share GBP hedged 25,665,177 4,016,322 6,245,666 23,435,833
Global Dynamic Equity Fund A Class distributing (A) share 960 2,592,540 29,226 2,564,274
A Class non-distributing share 51,454,099 34,472,030 28,805,779 57,120,350
A Class non-distributing share EUR hedged 1,282,756 7,649,496 4,493,943 4,438,309
B Class non-distributing share 5,525,810 536,030 1,996,120 4,065,720
C Class non-distributing share 6,561,707 2,535,429 2,821,025 6,276,111
C Class non-distributing share EUR hedged 291,523 184,416 125,438 350,501
D Class non-distributing share 4,831,191 3,249,186 1,092,151 6,988,226
E Class non-distributing share 2,335,226 2,713,067 1,243,218 3,805,075
E Class non-distributing share EUR hedged 7,647 404,830 63,831 348,646
I Class non-distributing share – 10,529,775 3,118,047 7,411,728
Q Class non-distributing share 452,261 – 90,530 361,731
X Class non-distributing share 4,798,772 – 874,126 3,924,646
Global Enhanced Equity Yield FundA Class distributing (Q) share 14,958,710 13,594,492 3,601,285 24,951,917
A Class distributing (Q) share EUR hedged 1,065,267 213,890 391,159 887,998
A Class non-distributing share 6,614,364 3,500,887 5,567,077 4,548,174
A Class non-distributing share EUR hedged 1,962,706 2,713,304 3,454,371 1,221,639
A Class non-distributing share SGD hedged 61,890 – – 61,890
B Class distributing (Q) share 3,414,007 56,239 1,298,329 2,171,917
B Class non-distributing share 653,222 – 151,130 502,092
C Class distributing (Q) share 1,830,358 378,758 571,879 1,637,237
C Class non-distributing share 623,451 277,468 251,060 649,859
D Class non-distributing share 2,738,191 1,049,480 3,337,701 449,970
E Class non-distributing share EUR hedged 43,582 242,593 191,546 94,629
Global Equity Fund A Class distributing (A) share 680 39,426 21,206 18,900
A Class non-distributing share 25,801,831 19,315,527 31,429,528 13,687,830
A Class non-distributing share SGD hedged – 89,991 3,472 86,519
A Class UK reporting fund share 9,205,448 1,249,012 2,073,014 8,381,446
B Class non-distributing share 210,893 99,019 8,314 301,598
C Class non-distributing share 410,706 291,970 332,182 370,494
D Class non-distributing share 7,414,048 3,318,435 4,104,312 6,628,171
E Class non-distributing share 665,403 1,744,321 870,131 1,539,593
Q Class non-distributing share 154,458 – 43,309 111,149
X Class non-distributing share 6,341,665 7,823,994 762,341 13,403,318
Global Equity Income Fund(1)
A Class distributing (Q) share – 3,075,553 190,081 2,884,623
A Class distributing (Q) share EUR hedged – 500 – 500
A Class distributing (Q) UK reporting fund share – 2,386,637 19,081 2,367,556
A Class non-distributing share – 9,756,104 1,776,517 7,979,587
A Class non-distributing share EUR hedged – 500 – 500
A Class non-distributing share PLN hedged – 500 – 500
C Class distributing (Q) share – 981,621 20,859 960,762
C Class non-distributing share – 1,439,890 10,888 1,429,002
D Class non-distributing share – 13,750,505 272,589 13,477,916
E Class distributing (Q) share – 1,055 – 1,055
E Class distributing (Q) share EUR hedged – 500 – 500
X Class non-distributing share – 13,647,112 2,110,173 11,536,939
(1) New Fund launched, see Note 1, for further details.

46 BlackRock Global Funds (BGF)
Statement of Changes in Shares Outstandingas at 31 August 2011 continued
Shares outstanding at the beginning
of the yearSharesissued
Sharesrepurchased
Shares outstanding at the endof the year
Global Government Bond FundA Class distributing (D) share 172,638 59,087 149,118 82,607
A Class distributing (D) share EUR hedged 75,738 3,675 32,580 46,833
A Class distributing (M) share 971,816 1,582,307 1,952,300 601,823
A Class distributing (M) share EUR hedged 232,747 372,119 480,545 124,321
A Class non-distributing share 8,744,195 6,163,632 10,698,484 4,209,343
A Class non-distributing share EUR hedged 6,521,405 1,043,044 3,877,729 3,686,720
B Class distributing (D) share 372,782 43,746 222,441 194,087
B Class distributing (D) share EUR hedged 5,250 – – 5,250
B Class non-distributing share 587,144 25,147 361,253 251,038
B Class non-distributing share EUR hedged 5,829 – – 5,829
C Class distributing (D) share 286,182 264,208 286,661 263,729
C Class distributing (D) share EUR hedged 9,565 – – 9,565
C Class distributing (M) share 3,231 13,647 4,427 12,451
C Class non-distributing share 506,272 13,047 284,700 234,619
C Class non-distributing share EUR hedged 47,071 34,015 48,580 32,506
D Class non-distributing share – 1,507,205 214,777 1,292,428
D Class non-distributing share EUR hedged 5,189,595 1,313,669 1,210,849 5,292,415
E Class non-distributing share 491,879 408,463 438,835 461,507
E Class non-distributing share EUR hedged 1,318,784 2,173,985 2,065,293 1,427,476
Q Class distributing (D) share 47,969 30 17,039 30,960
Q Class distributing (D) share EUR hedged 1,000 – – 1,000
Q Class non-distributing share 238,276 – 26,279 211,997
Q Class non-distributing share EUR hedged 42,307 – 6,458 35,849
X Class non-distributing share 789,162 48,249 352,420 484,991
Global High Yield Bond Fund A Class distributing (D) share 3,183,346 1,142,021 702,997 3,622,370
A Class distributing (D) share EUR hedged 311,606 527,881 389,837 449,650
A Class distributing (M) share 6,017,369 22,464,890 17,755,680 10,726,579
A Class distributing (M) share EUR hedged 6,138,554 6,356,127 7,747,994 4,746,687
A Class non-distributing share 11,954,528 24,761,566 32,387,026 4,329,068
A Class non-distributing share EUR hedged 6,211,718 22,175,571 17,200,520 11,186,769
A Class non-distributing share GBP hedged – 2,398,411 183,509 2,214,902
B Class distributing (D) share 917,297 473,978 570,284 820,991
B Class distributing (D) share EUR hedged 118,726 – – 118,726
B Class non-distributing share 203,720 174,591 85,438 292,873
C Class distributing (D) share 538,451 1,592,115 910,771 1,219,795
C Class distributing (D) share EUR hedged 109,996 45,007 28,963 126,040
C Class distributing (M) share EUR hedged 45,752 3,760 40,462 9,050
C Class non-distributing share 190,921 981,080 436,106 735,895
C Class non-distributing share EUR hedged 63,302 2,048,369 592,802 1,518,869
D Class non-distributing share 642,453 5,330,980 1,520,168 4,453,265
D Class non-distributing share EUR hedged 2,097,543 7,827,021 3,244,150 6,680,414
D Class non-distributing share GBP hedged 1,360,097 346,417 409,311 1,297,203
E Class distributing (Q) share EUR hedged 1,978 7,961,621 404,487 7,559,112
E Class non-distributing share 484,920 1,398,677 1,011,542 872,055
E Class non-distributing share EUR hedged 1,575,353 10,798,844 4,490,972 7,883,225
I Class non-distributing share – 454,758 – 454,758
Q Class distributing (D) share EUR hedged 15 – 15 –
Q Class non-distributing share 2,037 – – 2,037
Q Class non-distributing share EUR hedged 500 – – 500
X Class non-distributing share – 1,830,487 2,320 1,828,167
X Class non-distributing share EUR hedged 7,553,363 1,178,000 2,231,486 6,499,877
Global Inflation Linked Bond FundA Class distributing (M) share 1,007,900 1,566,315 813,676 1,760,539
A Class non-distributing share 1,820,653 13,547,551 7,519,575 7,848,629
A Class non-distributing share EUR hedged 2,320,098 1,908,306 1,378,208 2,850,196
C Class distributing (M) share 761,800 1,584,547 347,145 1,999,202
C Class non-distributing share 1,973,475 744,131 985,180 1,732,426
D Class non-distributing share 290,262 769,954 16,252 1,043,964
D Class non-distributing share EUR hedged 898,541 203,003 114,137 987,407
E Class non-distributing share EUR hedged 328,169 1,595,127 444,780 1,478,516
X Class non-distributing share EUR hedged 3,464,459 – 299,658 3,164,801

Audited Annual Report and Accounts 47
The notes on pages 261 to 270 form an integral part of these financial statements.
Statement of Changes in Shares Outstandingas at 31 August 2011 continued
Shares outstanding at the beginning
of the yearSharesissued
Sharesrepurchased
Shares outstanding at the endof the year
Global Opportunities Fund A Class non-distributing share 3,308,876 2,089,887 2,685,434 2,713,329
B Class non-distributing share 50,562 7,104 16,709 40,957
C Class non-distributing share 131,752 63,981 57,978 137,755
D Class non-distributing share 11,870 43,536 11,766 43,640
E Class non-distributing share 327,917 255,273 206,417 376,773
Q Class non-distributing share 36,357 – 1,800 34,557
Global SmallCap Fund A Class non-distributing share 4,637,971 2,554,527 4,040,689 3,151,809
B Class non-distributing share 307,638 17,913 86,158 239,393
C Class non-distributing share 352,211 98,725 117,217 333,719
D Class non-distributing share 116,792 1,256,408 316,413 1,056,787
E Class non-distributing share 97,384 120,385 104,549 113,220
Q Class non-distributing share 153,696 – 31,551 122,145
X Class non-distributing share GBP hedged 2,000,000 – 393,701 1,606,299
India Fund(2) A Class non-distributing share 23,859,965 53,162,803 47,117,729 29,905,039
A Class UK reporting fund share 79,797 56,902 32,945 103,754
B Class non-distributing share 1,385,992 133,178 440,479 1,078,691
C Class non-distributing share 1,516,542 509,475 680,223 1,345,794
D Class non-distributing share 297,961 41,064 128,720 210,305
E Class non-distributing share 3,775,114 2,540,285 3,037,591 3,277,808
X Class non-distributing share 500 – – 500
Japan Fund A Class non-distributing share 2,182,324 3,488,138 3,328,734 2,341,728
A Class non-distributing share EUR hedged 3,300 142,030 69,429 75,901
B Class non-distributing share 65,929 30,655 60,109 36,475
C Class non-distributing share 87,377 1,500,067 35,717 1,551,727
D Class non-distributing share 7,986 935,429 859,356 84,059
E Class non-distributing share 422,419 132,983 175,342 380,060
Q Class non-distributing share 141,953 – 39,558 102,395
Japan Small & MidCap Opportunities FundA Class non-distributing share 3,398,102 6,600,617 5,425,214 4,573,505
A Class non-distributing share EUR hedged 20,187 313,272 228,788 104,671
A Class UK reporting fund share 14,082 680 2,438 12,324
B Class non-distributing share 147,375 5,114 43,603 108,886
C Class non-distributing share 156,281 69,556 44,800 181,037
D Class non-distributing share 20,356 486,768 463,466 43,658
E Class non-distributing share 299,415 248,054 291,285 256,184
Q Class non-distributing share 88,094 97 29,086 59,105
X Class UK reporting fund share 403,122 – – 403,122
Japan Value Fund A Class non-distributing share 11,237,241 14,074,826 17,625,262 7,686,805
A Class non-distributing share EUR hedged 1,774,650 1,248,520 1,865,842 1,157,328
A Class UK reporting fund share 5,977 52,192 9,324 48,845
B Class non-distributing share 874,956 32,359 407,028 500,287
C Class non-distributing share 1,692,523 359,678 706,506 1,345,695
D Class non-distributing share 2,701,957 918,771 466,692 3,154,036
E Class non-distributing share 539,900 500,400 486,528 553,772
E Class non-distributing share EUR hedged 239,046 1,280,858 665,157 854,747
X Class non-distributing share 1,985,737 – – 1,985,737
X Class UK reporting fund share 2,019,565 8,816 422,040 1,606,341
(2) Fund valuation policy, see Note 1, for further details.

48 BlackRock Global Funds (BGF)
Statement of Changes in Shares Outstandingas at 31 August 2011 continued
Shares outstanding at the beginning
of the yearSharesissued
Sharesrepurchased
Shares outstanding at the endof the year
Latin American Fund A Class distributing (A) share 10,494 79,596 11,557 78,533
A Class non-distributing share 68,721,513 52,541,516 54,790,975 66,472,054
A Class non-distributing share CHF hedged – 58,510 – 58,510
A Class non-distributing share PLN hedged 180,586 2,316,961 647,434 1,850,113
A Class non-distributing share SGD hedged – 857,249 158,919 698,330
A Class UK reporting fund share 526,095 539,325 718,273 347,147
B Class non-distributing share 362,411 44,436 130,350 276,497
C Class non-distributing share 1,009,902 570,564 519,728 1,060,738
D Class non-distributing share 2,131,103 2,549,983 1,695,367 2,985,719
E Class non-distributing share 4,168,919 2,410,688 2,837,076 3,742,531
J Class non-distributing share 1,294,876 153,964 586,708 862,132
Q Class non-distributing share 125,587 1 3,847 121,741
X Class non-distributing share 104,287 153,807 87,453 170,641
X Class UK reporting fund share 1,320,397 1,757,625 1,624,044 1,453,978
Local Emerging Markets Short Duration Bond FundA Class distributing (A) share 15,711 5,727,040 204,755 5,537,996
A Class distributing (D) share 42,549,310 8,068,924 34,444,069 16,174,165
A Class distributing (M) share 15,810,822 4,640,852 13,089,211 7,362,463
A Class distributing (M) share AUD hedged – 61,400 900 60,500
A Class non-distributing share 24,865,506 34,728,608 27,420,443 32,173,671
A Class non-distributing share CHF hedged – 20,507 20,000 507
A Class non-distributing share EUR hedged 3,017,582 13,043,024 8,216,318 7,844,288
A Class non-distributing share PLN hedged 96,537 1,091,021 366,587 820,971
A Class non-distributing share SGD hedged 2,822,274 763,848 2,544,492 1,041,630
B Class distributing (D) share 7,251,183 595,965 2,296,172 5,550,976
B Class non-distributing share 557,152 91,496 224,884 423,764
C Class distributing (D) share 10,092,187 1,647,713 4,162,496 7,577,404
C Class non-distributing share 2,426,899 1,027,092 1,033,181 2,420,810
D Class distributing (M) share 15,066 348,270 65,112 298,224
D Class non-distributing share 11,800,176 14,231,524 10,932,951 15,098,749
D Class non-distributing share EUR hedged – 2,059,041 1,380,412 678,629
E Class non-distributing share 5,581,567 4,460,464 3,879,368 6,162,663
E Class non-distributing share EUR hedged 1,645,813 8,179,535 1,760,622 8,064,726
I Class non-distributing share 388,048 370,800 – 758,848
I Class non-distributing share EUR hedged 2,091,209 – 2,091,209 –
Q Class distributing (D) share 13,592,154 116,303 5,251,066 8,457,391
Q Class non-distributing share 512,602 – 123,166 389,436
X Class distributing (D) share 29,055,031 897,844 29,952,875 –
X Class non-distributing share 41,452,562 11,279,013 8,499,114 44,232,461
New Energy Fund A Class distributing (A) share 69,158 124,031 18,944 174,245
A Class non-distributing share 297,493,733 92,403,335 141,421,242 248,475,826
A Class UK reporting fund share 2,512,707 740,992 1,395,979 1,857,720
B Class non-distributing share 2,489,829 61,360 863,522 1,687,667
C Class non-distributing share 5,724,951 1,047,370 2,188,655 4,583,666
D Class non-distributing share 1,744,895 3,836,424 2,920,689 2,660,630
D Class UK reporting fund share 467,290 6,440,557 1,418,006 5,489,841
E Class non-distributing share 46,057,876 6,445,451 17,390,752 35,112,575
I Class non-distributing share – 455,316 – 455,316
Q Class non-distributing share 18,151 – – 18,151
X Class non-distributing share 26,388,388 – 12,303,422 14,084,966
Pacific Equity Fund A Class non-distributing share 3,587,815 2,478,268 2,805,965 3,260,118
B Class non-distributing share 553,558 11,092 179,618 385,032
C Class non-distributing share 429,310 109,155 133,255 405,210
D Class non-distributing share 1,212,194 1,478,973 971,634 1,719,533
E Class non-distributing share 698,319 271,398 321,593 648,124
Q Class non-distributing share 546,595 1 118,661 427,935
Swiss Small & MidCap Opportunities FundA Class non-distributing share 947,254 2,671,911 2,214,480 1,404,685
D Class non-distributing share 420,694 496,407 257,157 659,944

Audited Annual Report and Accounts 49
The notes on pages 261 to 270 form an integral part of these financial statements.
Statement of Changes in Shares Outstandingas at 31 August 2011 continued
Shares outstanding at the beginning
of the yearSharesissued
Sharesrepurchased
Shares outstanding at the endof the year
United Kingdom Fund A Class non-distributing share 3,429,435 2,223,142 2,916,427 2,736,150
A Class UK reporting fund share 1,745,292 1,455,365 777,248 2,423,409
B Class non-distributing share 14,230 – 6,435 7,795
C Class non-distributing share 11,308 1,889 5,225 7,972
D Class non-distributing share 1,184,465 265,140 225,637 1,223,968
E Class non-distributing share 198,903 44,845 79,298 164,450
Q Class non-distributing share 714 – – 714
X Class non-distributing share 546,584 309,066 139,742 715,908
US Basic Value Fund A Class distributing (A) share 194,854 18,916 99,236 114,534
A Class non-distributing share 31,883,746 15,498,492 20,810,150 26,572,088
A Class non-distributing share EUR hedged 2,552,940 2,287,306 1,848,912 2,991,334
A Class non-distributing share SGD hedged – 62,239 – 62,239
A Class UK reporting fund share 743,737 74,937 691,658 127,016
B Class non-distributing share 845,288 93,770 214,424 724,634
B Class non-distributing share EUR hedged 10,400 – 10,400 –
C Class non-distributing share 838,082 536,701 479,304 895,479
C Class non-distributing share EUR hedged 27,951 66,323 31,327 62,947
D Class non-distributing share 2,456,707 3,036,432 1,895,129 3,598,010
E Class non-distributing share 710,973 753,700 409,435 1,055,238
E Class non-distributing share EUR hedged 338,918 680,289 544,308 474,899
I Class non-distributing share 767,940 – 767,940 –
Q Class non-distributing share 1,252,096 19 223,318 1,028,797
X Class non-distributing share 452,378 156,766 513,250 95,894
X Class UK reporting fund share 4,144,257 349,851 4,494,108 –
US Dollar Core Bond Fund A Class distributing (D) share 1,570,849 579,929 849,824 1,300,954
A Class distributing (M) share 3,278,964 4,691,367 6,708,255 1,262,076
A Class non-distributing share 5,319,801 11,972,323 12,496,253 4,795,871
B Class distributing (D) share 1,697,122 162,328 492,707 1,366,743
B Class non-distributing share 1,281,551 186,700 597,822 870,429
C Class distributing (D) share 1,626,033 890,816 1,365,913 1,150,936
C Class non-distributing share 1,664,720 710,819 1,015,820 1,359,719
D Class distributing (M) share – 12,300 12,300 –
D Class non-distributing share – 555,450 223,349 332,101
E Class non-distributing share 690,061 303,559 572,276 421,344
Q Class distributing (D) share 175,675 1,199 54,033 122,841
Q Class non-distributing share 261,283 – 28,269 233,014
X Class non-distributing share 619,971 311,658 289,155 642,474
US Dollar High Yield Bond Fund A Class distributing (D) share 1,599,896 2,110,504 831,244 2,879,156
A Class distributing (M) share 9,096,750 51,769,201 36,788,016 24,077,935
A Class distributing (M) share AUD hedged – 230,868 32,050 198,818
A Class distributing (M) share SGD hedged – 256 – 256
A Class non-distributing share 35,061,403 53,422,830 45,318,091 43,166,142
A Class non-distributing share AUD hedged – 87,973 31,571 56,402
A Class non-distributing share EUR hedged 1,983,541 1,166,985 1,234,054 1,916,472
A Class non-distributing share SGD hedged – 100,767 250 100,517
B Class distributing (D) share 1,981,241 456,581 424,382 2,013,440
B Class non-distributing share 267,995 62,576 122,865 207,706
C Class distributing (D) share 1,658,342 1,500,532 811,366 2,347,508
C Class non-distributing share 452,082 643,046 266,791 828,337
D Class distributing (M) share – 50,703 – 50,703
D Class non-distributing share – 15,906,778 1,337,269 14,569,509
D Class non-distributing share EUR hedged – 348,494 42,514 305,980
E Class non-distributing share 338,011 900,028 440,865 797,174
Q Class distributing (D) share 1,530,372 27,235 291,381 1,266,226
Q Class non-distributing share 24,003 – 1,400 22,603
X Class non-distributing share 6,410,773 12,283,674 3,252,781 15,441,666

50 BlackRock Global Funds (BGF)
Statement of Changes in Shares Outstandingas at 31 August 2011 continued
Shares outstanding at the beginning
of the yearSharesissued
Sharesrepurchased
Shares outstanding at the endof the year
US Dollar Reserve Fund A Class non-distributing share 1,333,190 5,773,716 5,158,773 1,948,133
A Class non-distributing share GBP hedged 42,641 24,483 18,383 48,741
B Class non-distributing share 31,041 14,350 29,728 15,663
B Class non-distributing share GBP hedged 533 – – 533
C Class non-distributing share 78,454 113,462 73,916 118,000
C Class non-distributing share GBP hedged 111 1,380 659 832
E Class non-distributing share 346,429 310,469 343,400 313,498
E Class non-distributing share GBP hedged 18,018 833 5,016 13,835
US Dollar Short Duration Bond Fund A Class distributing (D) share 2,371,590 1,122,021 1,027,793 2,465,818
A Class distributing (M) share 91,235 44,282 89,160 46,357
A Class non-distributing share 4,210,425 13,732,786 13,903,153 4,040,058
B Class distributing (D) share 528,710 135,410 129,177 534,943
B Class non-distributing share 938,709 82,964 191,385 830,288
C Class distributing (D) share 1,103,626 556,714 352,319 1,308,021
C Class non-distributing share 1,406,726 1,686,852 1,677,811 1,415,767
D Class distributing (M) share – 14,481 5,000 9,481
E Class non-distributing share 2,825,458 2,499,308 1,811,192 3,513,574
X Class non-distributing share 312,481 2,343,310 790,801 1,864,990
US Flexible Equity Fund A Class distributing (A) share – 1,646 – 1,646
A Class distributing (A) share EUR hedged 67 7,521 64 7,524
A Class non-distributing share 76,398,102 24,477,330 56,150,932 44,724,500
A Class non-distributing share EUR hedged 8,074,358 5,087,302 6,952,035 6,209,625
A Class UK reporting fund share 2,456,816 194,619 1,160,573 1,490,862
B Class non-distributing share 2,727,769 100,036 911,307 1,916,498
B Class non-distributing share EUR hedged 26,933 – 8,968 17,965
C Class non-distributing share 3,545,931 1,856,525 1,344,002 4,058,454
C Class non-distributing share EUR hedged 152,989 172,779 152,754 173,014
D Class non-distributing share 17,530,228 6,949,830 6,460,805 18,019,253
D Class non-distributing share EUR hedged 3,446,046 3,296,776 4,331,065 2,411,757
E Class non-distributing share 4,542,145 1,403,809 2,436,365 3,509,589
E Class non-distributing share EUR hedged 3,433,149 3,221,794 3,057,924 3,597,019
Q Class non-distributing share 302,357 – 113,987 188,370
X Class non-distributing share 8,317,740 1,168,185 5,886,270 3,599,655
X Class UK reporting fund share 5,295,268 836,398 1,191,898 4,939,768
US Government Mortgage Fund A Class distributing (D) share 3,364,988 939,001 2,559,185 1,744,804
A Class distributing (M) share 1,514,173 2,299,336 2,716,263 1,097,246
A Class non-distributing share 3,617,374 10,005,811 9,262,768 4,360,417
B Class distributing (D) share 2,042,451 175,251 976,237 1,241,465
B Class non-distributing share 1,032,365 178,275 478,053 732,587
C Class distributing (D) share 1,591,460 254,010 665,187 1,180,283
C Class distributing (M) share 13,984 274,473 254,798 33,659
C Class non-distributing share 2,133,351 1,583,233 1,751,919 1,964,665
D Class distributing (M) share – 60,918 52,746 8,172
D Class non-distributing share 24,571 852,374 462,099 414,846
E Class non-distributing share 234,244 203,425 299,054 138,615
Q Class distributing (D) share 571,326 4,020 114,474 460,872
Q Class non-distributing share 7,309 – 1,719 5,590
US Growth Fund A Class non-distributing share 14,699,466 26,640,966 26,659,997 14,680,435
B Class non-distributing share 1,822,378 101,423 571,930 1,351,871
C Class non-distributing share 1,707,475 1,306,662 747,458 2,266,679
D Class non-distributing share 5,854,108 2,402,993 1,501,391 6,755,710
E Class non-distributing share 655,345 2,671,340 968,320 2,358,365
Q Class non-distributing share 287,051 – 43,812 243,239
X Class non-distributing share 197,620 4,481,542 4,413,785 265,377

Audited Annual Report and Accounts 51
The notes on pages 261 to 270 form an integral part of these financial statements.
Statement of Changes in Shares Outstandingas at 31 August 2011 continued
Shares outstanding at the beginning
of the yearSharesissued
Sharesrepurchased
Shares outstanding at the endof the year
US Small & MidCap Opportunities FundA Class non-distributing share 2,831,013 3,824,165 2,744,814 3,910,364
B Class non-distributing share 55,744 8,587 18,469 45,862
C Class non-distributing share 76,858 126,356 90,796 112,418
D Class non-distributing share 423,980 618,810 927,281 115,509
E Class non-distributing share 332,712 605,192 403,444 534,460
Q Class non-distributing share 6,861 – 1,267 5,594
X Class non-distributing share 191,582 123,576 22,375 292,783
World Agriculture FundA Class distributing (A) share EUR hedged 2,693 76,547 42,702 36,538
A Class non-distributing share 3,323,463 15,631,277 5,817,897 13,136,843
A Class non-distributing share EUR hedged 197,739 2,311,312 750,326 1,758,725
A Class non-distributing share HKD unhedged 5,000 14,617,557 7,151,849 7,470,708
A Class non-distributing share PLN hedged – 615,631 81,119 534,512
A Class non-distributing share SGD hedged 127,081 2,461,794 261,046 2,327,829
A Class UK reporting fund share GBP hedged 83,183 1,169,769 899,683 353,269
C Class non-distributing share 1,765,426 3,544,970 1,415,495 3,894,901
D Class non-distributing share – 5,234,239 810,403 4,423,836
D Class non-distributing share EUR hedged – 52,270 4,229 48,041
E Class non-distributing share 77,852 2,473,530 708,566 1,842,816
X Class distributing (A) share – 16,522,483 – 16,522,483
X Class UK reporting fund share – 2,346,554 – 2,346,554
World Bond Fund A Class distributing (D) share 63,377 146,412 134,144 75,645
A Class distributing (M) share 13,314 84,666 80,343 17,637
A Class non-distributing share 1,755,622 1,636,472 1,945,802 1,446,292
A Class non-distributing share EUR hedged 116,658 28,194 29,115 115,737
B Class distributing (D) share 59,769 18,656 29,920 48,505
C Class distributing (D) share 87,702 10,028 28,416 69,314
D Class non-distributing share 256,650 62,619 256,934 62,335
E Class non-distributing share 114,912 177,816 206,245 86,483
X Class non-distributing share 1,342,632 627,798 404,816 1,565,614
X Class non-distributing share CHF hedged 16,078,228 – 1,169,343 14,908,885
World Energy Fund A Class distributing (A) share 30,596 134,557 48,975 116,178
A Class non-distributing share 140,970,531 105,289,832 107,786,724 138,473,639
A Class non-distributing share CHF hedged – 134,612 50,172 84,440
A Class non-distributing share EUR hedged 12,559,095 24,068,529 11,223,523 25,404,101
A Class non-distributing share SGD hedged 6,353,752 20,088,105 8,712,474 17,729,383
A Class UK reporting fund share 1,323,010 19,091,398 737,853 19,676,555
B Class non-distributing share 1,440,616 370,050 641,618 1,169,048
C Class non-distributing share 3,318,901 3,766,013 2,629,410 4,455,504
C Class non-distributing share EUR hedged 148,613 509,950 218,756 439,807
D Class non-distributing share 3,305,059 7,456,439 6,378,970 4,382,528
D Class non-distributing share EUR hedged 4,249,338 9,851,547 9,410,132 4,690,753
D Class UK reporting fund share – 1,268,809 267,015 1,001,794
E Class non-distributing share 7,074,981 4,509,191 5,017,116 6,567,056
E Class non-distributing share EUR hedged 3,050,165 4,507,125 3,450,173 4,107,117
I Class non-distributing share 1,046,734 3,079,975 685,302 3,441,407
I Class non-distributing share EUR hedged 1,250,000 413,223 – 1,663,223
Q Class non-distributing share 142,993 68 16,182 126,879
X Class non-distributing share 12,071,876 1,563,163 3,413,635 10,221,404
X Class non-distributing share EUR hedged 1,385,042 675,675 – 2,060,717
X Class UK reporting fund share 616,672 4,590,038 951,906 4,254,804
World Financials Fund A Class non-distributing share 12,282,704 8,274,778 10,835,954 9,721,528
B Class non-distributing share 571,938 67,720 198,636 441,022
C Class non-distributing share 1,745,469 779,969 978,473 1,546,965
D Class non-distributing share 149,825 1,212,485 777,841 584,469
E Class non-distributing share 1,026,671 697,072 627,153 1,096,590
Q Class non-distributing share 436,463 – 41,010 395,453

52 BlackRock Global Funds (BGF)
Statement of Changes in Shares Outstandingas at 31 August 2011 continued
Shares outstanding at the beginning
of the yearSharesissued
Sharesrepurchased
Shares outstanding at the endof the year
World Gold Fund A Class distributing (A) share 34,067 137,412 42,571 128,908
A Class non-distributing share 112,939,644 81,789,046 93,146,266 101,582,424
A Class non-distributing share CHF hedged 185,473 1,694,353 524,957 1,354,869
A Class non-distributing share EUR hedged 19,266,877 34,188,799 22,978,589 30,477,087
A Class non-distributing share SGD hedged 421,398 4,897,753 1,737,949 3,581,202
B Class non-distributing share 961,352 102,287 426,313 637,326
C Class non-distributing share 1,832,857 1,274,234 1,110,257 1,996,834
C Class non-distributing share EUR hedged 294,018 847,943 538,257 603,704
D Class non-distributing share 5,695,639 5,331,872 5,183,700 5,843,811
D Class non-distributing share EUR hedged 2,529,883 4,260,722 3,262,328 3,528,277
E Class non-distributing share 6,448,598 5,520,137 5,741,985 6,226,750
E Class non-distributing share EUR hedged 3,934,164 6,208,498 3,786,848 6,355,814
I Class non-distributing share 211,858 4,860,658 536,188 4,536,328
I Class non-distributing share EUR hedged 949,796 861,326 – 1,811,122
Q Class non-distributing share 7,949 – – 7,949
X Class non-distributing share 1,391,342 373,433 879,872 884,903
World Healthscience Fund A Class non-distributing share 20,112,188 21,417,035 20,146,366 21,382,857
B Class non-distributing share 431,925 17,640 101,367 348,198
C Class non-distributing share 809,081 570,686 429,651 950,116
D Class non-distributing share 4,644,226 4,043,351 3,034,140 5,653,437
E Class non-distributing share 1,718,465 1,536,209 1,142,814 2,111,860
Q Class non-distributing share 33,213 – 5,288 27,925
X Class non-distributing share 2,142,434 187,781 766,478 1,563,737
World Income Fund A Class distributing (D) share 703,476 98,129 300,697 500,908
A Class distributing (M) share 750,582 2,654,420 2,827,423 577,579
A Class non-distributing share 5,936,922 6,216,262 4,772,301 7,380,883
B Class distributing (D) share 1,197,683 69,508 497,429 769,762
B Class non-distributing share 1,511,144 54,215 827,408 737,951
C Class distributing (D) share 1,063,433 21,513 519,387 565,559
C Class non-distributing share 1,729,115 253,990 1,333,903 649,202
D Class non-distributing share 2,625,199 243,500 2,170,989 697,710
E Class non-distributing share 324,802 219,602 393,690 150,714
J Class distributing (M) share 11,147,755 1,004,100 6,557,600 5,594,255
X Class distributing (M) share 6,943,938 2,216,699 3,768,299 5,392,338
X Class distributing (M) share AUD hedged 11,062,819 2,883,033 8,135,138 5,810,714
X Class distributing (M) share EUR hedged 319,152 556,987 326,456 549,683
World Mining Fund A Class distributing (A) share 77,731 119,759 61,153 136,337
A Class non-distributing share 192,909,479 137,253,794 147,474,154 182,689,119
A Class non-distributing share CHF hedged 394,519 4,549,477 687,899 4,256,097
A Class non-distributing share EUR hedged 18,448,227 25,159,066 17,419,094 26,188,199
A Class non-distributing share PLN hedged 299,577 2,576,357 977,620 1,898,314
A Class non-distributing share SGD hedged 5,038,767 30,768,388 11,792,505 24,014,650
A Class UK reporting fund share 689,272 827,776 326,700 1,190,348
B Class non-distributing share 749,990 125,377 275,378 599,989
C Class non-distributing share 2,855,612 1,310,334 1,532,577 2,633,369
C Class non-distributing share EUR hedged 768,276 1,326,350 749,647 1,344,979
D Class non-distributing share 1,736,401 2,596,222 2,868,612 1,464,011
D Class non-distributing share EUR hedged 5,384,772 9,904,023 7,410,530 7,878,265
E Class non-distributing share 10,820,808 5,922,564 6,904,701 9,838,671
E Class non-distributing share EUR hedged 7,993,390 10,567,365 8,223,148 10,337,607
I Class non-distributing share 381,998 763,809 562,682 583,125
I Class non-distributing share EUR hedged 5,288,134 – – 5,288,134
J Class non-distributing share 75,982 32,078 27,484 80,576
Q Class non-distributing share 3,617 38 – 3,655
X Class non-distributing share 2,412,556 419,291 657,687 2,174,160
X Class UK reporting fund share 8,029 – 8,029

Audited Annual Report and Accounts 53
The notes on pages 261 to 270 form an integral part of these financial statements.
Statement of Changes in Shares Outstandingas at 31 August 2011 continued
Shares outstanding at the beginning
of the yearSharesissued
Sharesrepurchased
Shares outstanding at the endof the year
World Resources Equity Income Fund(1)
A Class distributing (Q) share – 1,005 – 1,005
A Class non-distributing share – 322,359 – 322,359
D Class non-distributing share – 609 609 –
E Class distributing (Q) share EUR hedged – 500 – 500
World Technology Fund A Class non-distributing share 4,796,145 16,982,235 16,706,066 5,072,314
B Class non-distributing share 364,535 210,574 215,747 359,362
C Class non-distributing share 604,422 836,355 371,306 1,069,471
D Class non-distributing share 2,412,228 2,777,540 1,551,985 3,637,783
E Class non-distributing share 3,337,285 1,163,844 2,237,110 2,264,019
Q Class non-distributing share 622,444 3 81,667 540,780
(1) New Fund launched, see Note 1, for further details.

54 BlackRock Global Funds (BGF)
Asia Pacific Equity Income Fund
FUNDS
Ireland 1,101,116 Institutional Cash Series Plc - Institutional
US Dollar Liquidity Fund 1,101,116 1.47
Total Funds 1,101,116 1.47
COMMON / PREFERRED STOCKS (SHARES) & WARRANTS
Australia 254,800 AMP Ltd 1,235,446 1.65
76,991 Australia & New Zealand Banking Group Ltd 1,672,046 2.23
144,400 CFS Retail Property Trust (Reit) 277,433 0.37
56,300 Commonwealth Bank of Australia 2,905,774 3.88
225,100 Commonwealth Property Office Fund (Reit) 231,299 0.31
200,590 Dexus Property Group (Reit) 184,643 0.25
79,188 GPT Group (Reit) 264,448 0.35
92,980 National Australia Bank Ltd 2,360,644 3.15
140,300 OneSteel Ltd 225,255 0.30
17,000 QBE Insurance Group Ltd 256,927 0.34
37,200 Seven West Media Ltd 145,332 0.19
130,400 SP AusNet 129,106 0.17
50,098 Spark Infrastructure Group 67,296 0.09
93,967 Stockland (Reit) 300,727 0.40
94,500 Suncorp Group Ltd 827,392 1.11
957,652 Telstra Corp Ltd 3,105,822 4.15
16,267 Westfield Group (Reit) 141,729 0.19
20,124 Westfield Retail Trust (Reit) 56,434 0.08
88,571 Westpac Banking Corp 1,952,922 2.61
16,340,675 21.82
Bermuda 168,300 Esprit Holdings Ltd 471,854 0.63
734,000 First Pacific Co Ltd/Hong Kong 700,715 0.94
1,101,000 Huabao International Holdings Ltd 847,639 1.13
260,000 Noble Group Ltd 350,240 0.47
1,724,000 Pacific Andes Resources Development Ltd 322,550 0.43
9,400 VTech Holdings Ltd 107,890 0.14
2,800,888 3.74
British Virgin Islands 2,240,500 Winsway Coking Coal Holding Ltd 669,843 0.90
Cayman Islands 2,096,000 Bosideng International Holdings Ltd 519,064 0.69
96,700 JA Solar Holdings Co Ltd ADR 358,660 0.48
911,000 Peak Sport Products Co Ltd 354,188 0.47
1,025,000 Shimao Property Holdings Ltd * 1,077,160 1.44
1,297,000 Sunac China Holdings Ltd 332,845 0.44
12,400 Trina Solar Ltd ADR 205,840 0.28
27,900 WuXi PharmaTech Cayman Inc ADR 366,606 0.49
749,000 Xingda International Holdings Ltd 446,897 0.60
3,661,260 4.89
China 3,703,600 Bank of China Ltd 'H' 1,530,215 2.04
434,720 Changsha Zoomlion Heavy Industry Science
and Technology Development Co Ltd 'H' 745,227 1.00
3,935,000 China Citic Bank Corp Ltd 'H' 2,110,539 2.82
1,700,000 China Construction Bank Corp 'H' 1,260,808 1.69
1,884,000 China Petroleum & Chemical Corp 'H' 1,859,001 2.48
1,074,728 Chongqing Changan Automobile Co Ltd 'B' 337,860 0.45
718,000 Dongfeng Motor Group Co Ltd 'H' 1,144,243 1.53
2,882,775 Industrial & Commercial Bank of China 'H' 1,893,883 2.53
491,977 Shandong Chenming Paper Holdings 'B' 271,447 0.36
11,153,223 14.90
Germany 231,600 Deutsche Bank AG (Call Wts 12/3/2018
- Rural Electrification Corp Ltd) 878,119 1.17
27,110 Deutsche Bank AG (Cert 10/10/2018
- KB Financial Group Inc) 1,120,636 1.50
89,000 Deutsche Bank AG (Cert 15/3/2017
- Sesa Goa Ltd) 452,344 0.60
2,451,099 3.27
Hong Kong 37,000 Cheung Kong Holdings Ltd 518,912 0.69
366,000 China Mobile Ltd 3,710,057 4.95
555,000 Poly Hong Kong Investments Ltd * 326,872 0.44
4,555,841 6.08
Indonesia 6,698,500 Bank Pembangunan Daerah Jawa Barat
Dan Banten Tbk PT 824,262 1.10
New Zealand 42,250 Telecom Corp of New Zealand Ltd 91,765 0.12
Singapore 874,960 Mapletree Industrial Trust (Reit) 858,514 1.15
652,000 Morgan Stanley Asia Products Ltd
(Call Wts 1/11/2011 - Peak Sport
Products Co Ltd) 253,491 0.34
56,227 Morgan Stanley Asia Products Ltd
(Call Wts 15/6/2016 - MCB Bank Ltd) 108,594 0.15
75,100 Morgan Stanley Asia Products Ltd
(Call Wts 15/6/2016 - Oil & Gas
Development Co Ltd) 108,030 0.14
753,000 Morgan Stanley Asia Products Ltd
(Call Wts 18/11/2011 - Evergrande
Real Estate Group Ltd) 465,709 0.62
877,000 Morgan Stanley Asia Products Ltd
(Call Wts 22/11/2011 - China Rongsheng
Heavy Industries Group Holdings Ltd) 354,472 0.47
37,900 Morgan Stanley Asia Products Ltd
(Call Wts 25/7/2014 - Bank of India) 254,395 0.34
160,000 SembCorp Industries Ltd 573,422 0.76
378,000 StarHub Ltd 905,235 1.21
149,088 STX OSV Holdings Ltd 177,279 0.24
4,059,141 5.42
South Korea 105,380 Han Kuk Carbon Co Ltd 523,517 0.70
41,000 Hyundai Development Co 958,851 1.28
49,100 Industrial Bank of Korea 736,373 0.98
4,990 KB Financial Group Inc 206,270 0.28
47,200 LG Display Co Ltd 924,666 1.23
12,900 LG Electronics Inc 805,305 1.08
38,400 Partron Co Ltd 370,736 0.50
3,800 Samsung Electronics Co Ltd 2,650,044 3.54
1,300 Samsung Electronics Co Ltd (Pref) 661,668 0.88
10,700 Shinhan Financial Group Co Ltd 450,326 0.60
12,600 Silicon Works Co Ltd 204,321 0.27
90,356 SNU Precision Co Ltd 1,088,320 1.45
9,580,397 12.79
Portfolio of Investments 31 August 2011
Transferable Securities Admitted to an Official Stock Exchange Listing or Dealt in on Another Regulated Market
Holding Description Value (USD) %
Transferable Securities Admitted to an Official Stock Exchange Listing or Dealt in on Another Regulated Market
Holding Description Value (USD) %

* Securities lent, see Note 11, for further details.
Audited Annual Report and Accounts 55
The notes on pages 261 to 270 form an integral part of these financial statements.
Asia Pacific Equity Income Fund continued
Switzerland 1,008,320 UBS AG (ELN 9/7/2013 - Bank
of Communications Ltd) 752,537 1.01
Taiwan 79,000 Ability Enterprise Co Ltd 81,970 0.11
804,000 AU Optronics Corp 382,468 0.51
1,974,931 E.Sun Financial Holding Co Ltd 1,153,935 1.54
668,315 Gloria Material Technology Corp 662,337 0.88
115,000 Hon Hai Precision Industry Co Ltd 290,577 0.39
429,000 ICP Electronics Inc 619,628 0.83
67,000 MediaTek Inc 673,245 0.90
13,300 Taiwan Surface Mounting Technology Co Ltd 29,801 0.04
827,356 Wistron Corp 1,029,578 1.38
4,923,539 6.58
Thailand 1,120,400 LPN Development PCL 418,701 0.56
794,800 Sri Trang Agro-Industry PCL 689,516 0.92
2,182,400 Supalai PCL 1,034,037 1.38
2,142,254 2.86
United Kingdom 86,300 BHP Billiton Plc 2,961,445 3.95
102,000 HSBC Holdings Plc 880,167 1.18
80,200 Rio Tinto Plc 4,953,291 6.62
8,794,903 11.75
United States 22,000 Citigroup Global Markets Holdings Inc
(Cert 24/10/2012 - Aban Lloyd Chiles) 179,941 0.24
Total Common / Preferred Stocks (Shares) & Warrants 72,981,568 97.47
Total Transferable Securities Admitted
to an Official Stock Exchange Listing or
Dealt in on Another Regulated Market 74,082,684 98.94
Total Portfolio 74,082,684 98.94
Other Net Assets 796,818 1.06
Total Net Assets (USD) 74,879,502 100.00
Portfolio of Investments 31 August 2011
Transferable Securities Admitted to an Official Stock Exchange Listing or Dealt in on Another Regulated Market
Holding Description Value (USD) %
Transferable Securities Admitted to an Official Stock Exchange Listing or Dealt in on Another Regulated Market
Holding Description Value (USD) %
Open Forward Foreign Exchange Transactionsas at 31 August 2011
Purchases Sales Value date Unrealised
profit/(loss)
Unrealisedprofit/(loss)
USD Equivalent
EUR Hedged Share Class EUR
EUR 153,829 USD 218,525 14/9/2011 2,489 3,595
USD 17,509 EUR 12,222 14/9/2011 (96) (139)
Net unrealised profit 2,393 3,456
SGD Hedged Share Class SGD
SGD 28,372,015 USD 23,277,480 14/9/2011 379,665 315,703
USD 2,667,891 SGD 3,234,421 14/9/2011 (26,147) (21,742)
Net unrealised profit 353,518 293,961
Total net unrealised profit 297,417
Note: The net unrealised profit attributed to these transactions is included in the Statement
of Net Assets (see Note 2c).
Sector Breakdownas at 31 August 2011
% of netassets
Financials 42.58
Materials 16.51
Information Technology 12.93
Telecommunication Services 10.43
Consumer Discretionary 6.30
Industrials 3.75
Energy 2.62
Investment Funds 1.47
Utilities 1.43
Healthcare 0.49
Consumer Staples 0.43
Other Net Assets 1.06
100.00

56 BlackRock Global Funds (BGF)
Asian Dragon Fund
FUNDS
Ireland 15,605,204 Institutional Cash Series Plc - Institutional
US Dollar Liquidity Fund 15,605,204 2.81
Total Funds 15,605,204 2.81
COMMON STOCKS (SHARES) & WARRANTS
Bermuda 1,289,000 Hongkong Land Holdings Ltd 7,476,200 1.35
10,726,000 Huabao International Holdings Ltd * 8,257,744 1.49
6,815,000 Noble Group Ltd * 9,180,324 1.65
13,705,000 Pacific Andes Resources Development Ltd 2,564,122 0.46
3,070,500 Ports Design Ltd 5,043,029 0.91
32,521,419 5.86
Cayman Islands 362,000 China Shanshui Cement Group Ltd 359,055 0.07
2,905,200 MGM China Holdings Ltd 5,621,468 1.01
2,484,000 Sands China Ltd 7,713,284 1.39
2,793,500 Shimao Property Holdings Ltd * 2,935,654 0.53
411,888 Trina Solar Ltd ADR * 6,837,341 1.23
745,731 WuXi PharmaTech Cayman Inc ADR 9,798,905 1.77
33,265,707 6.00
China 27,924,200 Bank of China Ltd 'H' 11,537,427 2.08
3,051,360 Changsha Zoomlion Heavy Industry Science
and Technology Development Co Ltd 'H' * 5,230,850 0.94
10,420,000 China Citic Bank Corp Ltd 'H' 5,588,772 1.01
6,105,000 China Minsheng Banking Corp Ltd 'H' * 5,068,300 0.91
3,203,000 China Pacific Insurance Group Co Ltd 'H' 12,514,589 2.26
10,542,000 China Petroleum & Chemical Corp 'H' 10,402,117 1.88
3,140,373 China Vanke 'B' 4,029,523 0.73
3,034,000 Dongfeng Motor Group Co Ltd 'H' 4,835,145 0.87
24,117,420 Industrial & Commercial Bank of China 'H' 15,844,304 2.86
14,784,000 Shanghai Electric Group Co Ltd 'H' 6,772,243 1.22
3,058,000 Zhuzhou CSR Times Electric Co Ltd 'H' 7,282,623 1.31
89,105,893 16.07
Germany 920,862 Deutsche Bank AG (Call Wts 24/1/2017
- Bharti Airtel Ltd) 8,091,787 1.46
222,236 Deutsche Bank AG (Cert 10/10/2018
- KB Financial Group Inc) 9,186,491 1.66
17,278,278 3.12
Hong Kong 8,435,000 CNOOC Ltd 17,208,958 3.10
1,605,000 Hutchison Whampoa Ltd 15,373,658 2.77
7,768,000 Shenzhen Investment Ltd 2,033,348 0.37
8,078,000 Shougang Fushan Resources Group Ltd 3,814,381 0.69
677,000 Television Broadcasts Ltd 4,321,695 0.78
1,421,400 Wharf Holdings Ltd 9,046,287 1.63
51,798,327 9.34
India 1,001,167 Cairn India Ltd 6,066,789 1.09
713,814 ICICI Bank Ltd 13,536,112 2.44
19,602,901 3.53
Indonesia 15,040,500 Bank Mandiri Tbk PT 12,073,997 2.18
Jersey 844,132 Glencore International Plc * 5,838,162 1.05
711,272 JP Morgan International Derivatives
(ELN 25/8/2014 - Reliance Industries) 12,087,763 2.18
17,925,925 3.23
Luxembourg 3,585,300 Samsonite International SA 6,440,594 1.16
Malaysia 4,367,900 Axiata Group Bhd 6,911,341 1.25
2,076,800 Genting Bhd 6,558,330 1.18
13,469,671 2.43
Singapore 1,070,500 DBS Group Holdings Ltd 11,794,504 2.13
4,752,000 Indofood Agri Resources Ltd * 5,571,507 1.00
2,689,000 Keppel Land Ltd 6,909,179 1.25
614,000 Morgan Stanley Asia Products Ltd
(Call Wts 22/11/2011 - MediaTek Inc) 6,169,737 1.11
2,735,000 Overseas Union Enterprise Ltd * 5,367,184 0.97
3,035,000 Sakari Resources Ltd 6,889,671 1.24
2,463,430 STX OSV Holdings Ltd 2,929,230 0.53
45,631,012 8.23
South Korea 68,889 Dongbu Insurance Co Ltd 3,344,847 0.60
375,140 Hyundai Development Co 8,773,251 1.58
48,867 KB Financial Group Inc 2,019,998 0.36
21,826 LG Chem Ltd 7,743,489 1.40
335,430 LG Display Co Ltd 6,571,202 1.19
172,090 LG Electronics Inc * 10,743,023 1.94
437,653 Partron Co Ltd 4,225,360 0.76
38,197 Samsung Electronics Co Ltd 26,637,828 4.80
334,900 Samsung Heavy Industries Co Ltd 10,908,539 1.97
298,080 Shinhan Financial Group Co Ltd 12,545,148 2.26
479,803 SNU Precision Co Ltd 5,779,133 1.04
99,291,818 17.90
Taiwan 8,803,232 Advanced Semiconductor Engineering Inc 7,889,968 1.42
991,860 Asustek Computer Inc 8,376,763 1.51
10,243,000 AU Optronics Corp 4,872,659 0.88
1 Compal Electronics Inc 1 0.00
6,658,100 Hon Hai Precision Industry Co Ltd 16,823,411 3.04
161,950 HTC Corp 4,220,487 0.76
202,000 MediaTek Inc 2,029,784 0.37
3,023,000 Nan Kang Rubber Tire Co Ltd 5,064,472 0.91
19,133,460 Taishin Financial Holding Co Ltd 8,640,216 1.56
3,181,563 Taiwan Semiconductor Manufacturing Co Ltd 7,611,316 1.37
181,800 TSRC Corp 459,365 0.08
65,988,442 11.90
Thailand 2,504,000 Kasikornbank PCL 10,652,652 1.92
1,483,300 PTT Chemical PCL 6,755,770 1.22
17,408,422 3.14
Portfolio of Investments 31 August 2011
Transferable Securities Admitted to an Official Stock Exchange Listing or Dealt in on Another Regulated Market
Holding Description Value (USD) %
Transferable Securities Admitted to an Official Stock Exchange Listing or Dealt in on Another Regulated Market
Holding Description Value (USD) %

* Securities lent, see Note 11, for further details.
Audited Annual Report and Accounts 57
The notes on pages 261 to 270 form an integral part of these financial statements.
Asian Dragon Fund continued
United Kingdom 171,527 BHP Billiton Plc 5,886,069 1.06
United States 131,580 Citigroup Global Markets Holdings Inc
(Call Wts 20/1/2015 - Shinhan
Financial Group) 5,537,744 1.00
34,498 Sohu.com Inc 2,859,539 0.51
8,397,283 1.51
Total Common Stocks (Shares)
& Warrants 536,085,758 96.66
Total Transferable Securities Admitted
to an Official Stock Exchange Listing or
Dealt in on Another Regulated Market 551,690,962 99.47
COMMON STOCKS (SHARES)
Bermuda 9,828,600 Euro-Asia Agricultural Holdings Co Ltd – 0.00
Total Unquoted Securities – 0.00
Total Portfolio 551,690,962 99.47
Other Net Assets 2,962,210 0.53
Total Net Assets (USD) 554,653,172 100.00
Portfolio of Investments 31 August 2011
Transferable Securities Admitted to an Official Stock Exchange Listing or Dealt in on Another Regulated Market
Holding Description Value (USD) %
Unquoted Securities
Holding Description Value (USD) %
Sector Breakdownas at 31 August 2011
% of netassets
Financials 34.72
Information Technology 20.00
Industrials 11.97
Consumer Discretionary 11.12
Energy 7.31
Materials 7.06
Investment Funds 2.81
Healthcare 1.77
Consumer Staples 1.46
Telecommunication Services 1.25
Other Net Assets 0.53
100.00

58 BlackRock Global Funds (BGF)
BONDS
Argentina USD 15,790,000 Argentina Bonos 7% 3/10/2015 14,677,244 2.88
Australia USD 15,000,000 PTTEP Australia International Finance
Proprietary Ltd 4.152% 19/7/2015 15,581,175 3.05
British Virgin Islands USD 260,000 CLP Power Hong Kong Financing Ltd
6.25% 8/5/2012 268,657 0.06
USD 1,350,000 CNOOC Finance 2003 Ltd 5.5%
21/5/2033 1,491,950 0.29
USD 1,000,000 PCCW-HKT Capital No 3 Ltd 5.25%
20/7/2015 1,082,226 0.21
2,842,833 0.56
Canada USD 13,240,000 Sino-Forest Corp 6.25% 21/10/2017 4,137,500 0.81
Cayman Islands USD 1,200,000 CKWH-UT2 Ltd FRN 31/5/2012 (Perpetual) 1,235,652 0.24
USD 1,600,000 Hutchison Whampoa International 03/13
Ltd 6.5% 13/2/2013 1,696,657 0.33
USD 1,500,000 Hutchison Whampoa International 03/33
Ltd 7.45% 24/11/2033 1,962,786 0.39
USD 8,900,000 Hutchison Whampoa International 09 Ltd
7.625% 9/4/2019 10,944,179 2.14
USD 7,000,000 Hutchison Whampoa International 09/16
Ltd 4.625% 11/9/2015 7,533,386 1.48
USD 17,000,000 Hutchison Whampoa International 09/19
Ltd 5.75% 11/9/2019 18,915,458 3.71
42,288,118 8.29
Czech Republic USD 2,000,000 Hyundai Motor Manufacturing Czech sro
'144A' 4.5% 15/4/2015 2,094,086 0.41
Hong Kong USD 2,000,000 Bank of China Hong Kong Ltd 5.55%
11/2/2020 2,034,614 0.40
USD 500,000 HKCG Finance Ltd 6.25% 7/8/2018 587,422 0.11
2,622,036 0.51
India USD 1,000,000 Bank of India/London 4.75% 30/9/2015 1,015,070 0.20
USD 7,000,000 ICICI Bank Ltd 5% 15/1/2016 7,067,018 1.38
USD 8,000,000 IDBI Bank Ltd/DIFC Dubai 4.75%
5/2/2016 8,106,800 1.59
USD 750,000 Reliance Industries Ltd 10.375%
24/6/2016 948,281 0.19
USD 6,000,000 Union Bank of India 4.625% 11/2/2016 6,026,490 1.18
23,163,659 4.54
Indonesia USD 4,000,000 Adaro Indonesia PT 7.625% 22/10/2019 4,360,000 0.86
USD 13,750,000 Indonesia Government International Bond
6.875% 9/3/2017 16,271,750 3.19
USD 14,000,000 Indonesia Government International Bond
6.875% 17/1/2018 16,660,000 3.26
USD 9,000,000 Indonesia Government International Bond
7.5% 15/1/2016 10,687,500 2.09
47,979,250 9.40
Kazakhstan USD 1,500,000 KazMunayGas National Co '144A'
11.75% 23/1/2015 1,807,500 0.35
Malaysia USD 6,000,000 Petronas Capital Ltd 5.25% 12/8/2019 6,722,100 1.32
USD 450,000 Petronas Capital Ltd 7% 22/5/2012 470,928 0.09
USD 5,050,000 Petronas Capital Ltd 7.875% 22/5/2022 6,789,533 1.33
USD 15,000,000 Petronas Global Sukuk Ltd 4.25%
12/8/2014 15,946,575 3.12
USD 1,250,000 Sarawak International Inc 5.5%
3/8/2015 1,371,194 0.27
31,300,330 6.13
Netherlands USD 4,000,000 Indosat Palapa Co BV 7.375% 29/7/2020 4,420,000 0.86
USD 6,000,000 Majapahit Holding BV 7.75% 17/10/2016 6,982,500 1.37
USD 3,000,000 Majapahit Holding BV 7.75% 20/1/2020 3,573,750 0.70
USD 4,750,000 Majapahit Holding BV 8% 7/8/2019 5,747,500 1.13
20,723,750 4.06
Philippines USD 11,000,000 Philippine Government International Bond
6.375% 15/1/2032 12,980,000 2.54
USD 7,015,000 Philippine Government International Bond
6.375% 23/10/2034 8,203,204 1.61
USD 15,790,000 Philippine Government International Bond
7.75% 14/1/2031 20,882,275 4.09
USD 390,000 Philippine Government International Bond
9.5% 21/10/2024 564,530 0.11
USD 330,000 Philippine Long Distance Telephone Co
8.35% 6/3/2017 393,820 0.08
USD 545,000 Philippine Long Distance Telephone Co
11.375% 15/5/2012 580,425 0.11
USD 1,000,000 Power Sector Assets & Liabilities
Management Corp 7.25% 27/5/2019 1,192,844 0.23
USD 3,000,000 Power Sector Assets & Liabilities
Management Corp 7.39% 2/12/2024 3,607,134 0.71
48,404,232 9.48
Singapore USD 11,000,000 Bumi Investment Pte Ltd 10.75%
6/10/2017 11,990,000 2.35
USD 5,000,000 DBS Bank Ltd FRN 16/5/2017 5,128,370 1.01
USD 450,000 Oversea-Chinese Banking Corp Ltd
7.75% 6/9/2011 450,243 0.09
USD 5,000,000 PSA International Pte Ltd 3.875%
11/2/2021 5,071,300 0.99
USD 600,000 Singapore Telecommunications Ltd
7.375% 1/12/2031 828,522 0.16
USD 8,200,000 STATS ChipPAC Ltd 7.5% 12/8/2015 8,640,750 1.69
USD 5,000,000 Temasek Financial I Ltd '144A' 4.3%
25/10/2019 5,443,405 1.07
USD 550,000 United Overseas Bank Ltd 4.5%
2/7/2013 575,930 0.11
38,128,520 7.47
South Korea USD 600,000 Export-Import Bank of Korea 5.25%
10/2/2014 644,141 0.13
USD 3,000,000 Export-Import Bank of Korea 5.5%
17/10/2012 3,136,050 0.61
USD 2,000,000 Export-Import Bank of Korea 8.125%
21/1/2014 2,273,564 0.45
Asian Tiger Bond Fund
Portfolio of Investments 31 August 2011
Transferable Securities Admitted to an Official Stock Exchange Listing or Dealt in on Another Regulated Market
Holding Description Value (USD) %
Transferable Securities Admitted to an Official Stock Exchange Listing or Dealt in on Another Regulated Market
Holding Description Value (USD) %

Audited Annual Report and Accounts 59
The notes on pages 261 to 270 form an integral part of these financial statements.
Asian Tiger Bond Fund continued
USD 1,000,000 GS Caltex Corp 5.5% 25/8/2014 1,082,966 0.21
USD 10,000,000 Hana Bank 4% 3/11/2016 10,128,150 1.98
USD 500,000 Hana Funding Ltd FRN 17/12/2012
(Perpetual) 520,633 0.10
USD 1,000,000 Industrial Bank of Korea 7.125%
23/4/2014 1,121,219 0.22
USD 7,000,000 Korea Development Bank 4.375%
10/8/2015 7,309,414 1.43
USD 3,000,000 Korea Development Bank 8% 23/1/2014 3,416,864 0.67
USD 1,300,000 Korea Development Bank/Republic
of Korea 5.3% 17/1/2013 1,362,311 0.27
USD 4,839,000 Korea Electric Power Corp (Step-up coupon)
5.5% 21/7/2014 5,222,454 1.02
USD 10,000,000 Korea Finance Corp 3.25% 20/9/2016 9,966,600 1.95
USD 5,000,000 Korea Hydro & Nuclear Power Co Ltd
4.75% 13/7/2021 5,033,320 0.99
USD 10,000,000 National Agricultural Cooperative
Federation 4.25% 28/1/2016 10,320,140 2.02
USD 2,000,000 National Agricultural Cooperative
Federation 5% 30/9/2014 2,132,344 0.42
USD 4,300,000 Republic of Korea 7.125% 16/4/2019 5,382,955 1.05
USD 11,215,000 Shinhan Bank 4.375% 15/9/2015 11,657,196 2.28
USD 3,500,000 Shinhan Bank '144A' 4.375% 15/9/2015 3,647,973 0.72
USD 11,700,000 Woori Bank 4.75% 20/1/2016 12,224,160 2.40
USD 1,000,000 Woori Bank 7.63% 14/4/2015 1,113,232 0.22
97,695,686 19.14
Sri Lanka USD 6,000,000 Sri Lanka Government International Bond
6.25% 4/10/2020 6,090,000 1.19
USD 3,000,000 Sri Lanka Government International Bond
7.4% 22/1/2015 3,285,000 0.65
9,375,000 1.84
Thailand USD 10,000,000 Bangkok Bank PCL/Hong Kong 3.25%
18/10/2015 10,071,980 1.97
USD 250,000 Bangkok Bank PCL/Hong Kong 9.025%
15/3/2029 296,875 0.06
USD 250,000 PTT PCL 5.75% 1/8/2014 269,876 0.05
10,638,731 2.08
United Kingdom USD 4,000,000 Vedanta Resources Plc 8.75%
15/1/2014 4,080,000 0.80
USD 3,500,000 Vedanta Resources Plc 9.5% 18/7/2018 3,596,250 0.70
7,676,250 1.50
United States USD 5,500,000 Hyundai Capital America 3.75%
6/4/2016 5,682,078 1.11
Venezuela USD 12,270,000 Venezuela Government International
Bond 9.25% 15/9/2027 8,609,552 1.69
Vietnam USD 13,000,000 Vietnam Government International Bond
6.75% 29/1/2020 13,520,000 2.65
USD 250,000 Vietnam Government International Bond
(Step-up coupon) 4% 12/3/2028 233,928 0.05
13,753,928 2.70
Total Bonds 449,181,458 88.00
Total Transferable Securities Admitted
to an Official Stock Exchange Listing or
Dealt in on Another Regulated Market 449,181,458 88.00
Unquoted Securities
BONDS
India USD 5,000,000 State Bank of India/London 4.5%
27/7/2015 5,101,000 1.00
Malaysia USD 350,000 Petronas Capital Ltd '144A' 7%
22/5/2012 366,277 0.07
USD 250,000 Tenaga Nasional Bhd 7.5% 1/11/2025 321,282 0.06
687,559 0.13
Netherlands USD 1,000,000 Tjiwi Kimia Finance BV FRN 28/4/2027 25,000 0.01
Philippines USD 3,500,000 Power Sector Assets & Liabilities
Management Corp 9.625%
15/5/2028 4,900,000 0.96
Total Bonds 10,713,559 2.10
Total Unquoted Securities 10,713,559 2.10
Total Portfolio 459,895,017 90.10
Other Net Assets 50,545,348 9.90
Total Net Assets (USD) 510,440,365 100.00
Portfolio of Investments 31 August 2011
Transferable Securities Admitted to an Official Stock Exchange Listing or Dealt in on Another Regulated Market
Holding Description Value (USD) %
Transferable Securities Admitted to an Official Stock Exchange Listing or Dealt in on Another Regulated Market
Holding Description Value (USD) %

60 BlackRock Global Funds (BGF)
Asian Tiger Bond Fund continued
Note: The total market value of USD 200,924 of these transactions is included in the Statement of Net Assets (see Note 2c).
Nominal Value Description
Unrealisedprofit/(loss)
USD
Nominal Value Description
Unrealisedprofit/(loss)
USD
Swaps as at 31 August 2011
KRW 40,300,000,000 Interest Rate Swaps (HSBC) (Fund receives Floating
KRW KORIBOR 3 Month; and pays Fixed 4.135%)
(29/4/2013) (219,094)
USD (1,500,000) Credit Default Swaps (Deutsche Bank) (Fund provides
default protection on iTraxx Japan S9 V1;
and receives Fixed 6.5%) (20/6/2013) 16,131
USD 7,350,000 Credit Default Swaps (UBS) (Fund receives default
protection on China Government International
Bond 4.75% 29/10/2013; and pays Fixed 1%)
(20/9/2015) 29,686
USD 18,730,000 Credit Default Swaps (Citibank) (Fund receives default
protection on Bundesrepublik Deutschland 6%
20/6/2016; and pays Fixed 0.25%) (20/3/2016) 118,059
(55,218)
Purchased Put Options as at 31 August 2011
Number of contracts
subjectto Put Issuer
UnrealisedlossUSD
ValueUSD
6,760,000 OTC AUD/USD Put Option
strike price AUD 1.0122
expiring on 12/10/2011 (56,526) 47,769
6,860,000 OTC AUD/USD Put Option
strike price AUD 1.025
expiring on 14/10/2011 (36,932) 67,912
Total Purchased Put Options (93,458) 115,681
Note: Purchased Put Options are included in the Statement of Net Assets (see Note 2c).
Purchased Call Options as at 31 August 2011
Number of contracts
subjectto Call Issuer
UnrealisedlossUSD
ValueUSD
6,750,000 OTC EUR/USD Call Option
strike price EUR 1.46
expiring on 8/9/2011 (57,604) 25,101
35,000,000 OTC USD/CNY Call Option
strike price USD 6.445
expiring on 27/2/2012 (455,770) 118,230
34,740,000 OTC USD/CNY Call Option
strike price USD 6.4125
expiring on 1/3/2012 (408,056) 158,206
Total Purchased Call Options (921,430) 301,537
Note: Purchased Call Options are included in the Statement of Net Assets (see Note 2c).
Open Forward Foreign Exchange Transactionsas at 31 August 2011
Purchases Sales Value date Unrealised
profit/(loss)
Unrealisedprofit/(loss)
USD Equivalent
Core Fund USD
USD 10,987,513 EUR 7,580,000 2/9/2011 40,823 40,823
CNY 455,383,760 USD 70,720,000 9/9/2011 714,284 714,284
USD 35,360,000 CNY 227,541,600 9/9/2011 (333,568) (333,568)
USD 9,608,979 EUR 6,750,000 12/9/2011 (137,827) (137,827)
KRW 6,203,520,000 USD 5,760,000 14/9/2011 55,022 55,022
USD 5,760,000 KRW 6,320,448,000 14/9/2011 (164,628) (164,628)
AUD 8,595,000 USD 8,971,126 15/9/2011 212,339 212,339
IDR 36,808,200,000 USD 4,290,000 15/9/2011 22,083 22,083
KRW 353,115,750 USD 325,000 15/9/2011 6,003 6,003
MYR 23,781,160 USD 7,960,000 15/9/2011 26,786 26,786
USD 16,095,266 AUD 15,270,000 15/9/2011 (220,209) (220,209)
USD 4,265,000 IDR 36,696,060,000 15/9/2011 (33,946) (33,946)
AUD 10,400,000 USD 10,629,205 18/10/2011 436,156 436,156
EUR 5,400,000 USD 7,675,398 26/10/2011 118,116 118,116
CNY 227,188,000 USD 35,360,000 9/11/2011 415,812 415,812
USD 17,765,000 TWD 515,241,900 9/11/2011 (103,670) (103,670)
CNY 30,792,960 USD 4,860,000 15/12/2011 (2,676) (2,676)
Net unrealised profit 1,050,900 1,050,900
HKD Hedged Share Class HKD
HKD 348,246,629 USD 44,626,435 14/9/2011 496,507 63,709
USD 7,035,000 HKD 54,855,205 14/9/2011 (35,181) (4,514)
Net unrealised profit 461,326 59,195
SGD Hedged Share Class SGD
SGD 4,035,799 USD 3,310,245 14/9/2011 55,062 45,786
USD 74,177 SGD 89,655 14/9/2011 (454) (378)
Net unrealised profit 54,608 45,408
Total net unrealised profit 1,155,503
Note: The net unrealised profit attributed to these transactions is included in the Statement
of Net Assets (see Note 2c).

Audited Annual Report and Accounts 61
The notes on pages 261 to 270 form an integral part of these financial statements.
FUNDS
Ireland 6 Institutional Cash Series Plc - Institutional
US Dollar Liquidity Fund 6 0.00
Total Funds 6 0.00
COMMON STOCKS (SHARES) & WARRANTS
Bermuda 944,200 Esprit Holdings Ltd 2,647,207 0.37
27,701,540 GOME Electrical Appliances Holding Ltd 11,871,969 1.66
19,474,000 Huabao International Holdings Ltd 14,992,663 2.10
5,849,500 Ports Design Ltd 9,607,294 1.35
3,715,000 Pou Sheng International Holdings Ltd 581,555 0.08
82,400,000 REXLot Holdings Ltd 6,238,089 0.88
45,938,777 6.44
Cayman Islands 5,611,000 China High Precision Automation Group Ltd 2,987,863 0.42
8,089,000 China Shanshui Cement Group Ltd 8,023,183 1.12
1,969,000 FU JI Food and Catering Services Holdings Ltd 2,526 0.00
93,760 Global Education & Technology Group Ltd ADR 474,426 0.07
7,731,000 Kingsoft Corp Ltd 4,017,566 0.56
6,733,000 Lee & Man Paper Manufacturing Ltd 3,075,608 0.43
314,634 Mindray Medical International Ltd ADR 8,180,484 1.15
16,792,000 PCD Stores Group Ltd 3,318,146 0.47
2,756,000 Peak Sport Products Co Ltd 1,071,505 0.15
5,182,000 Powerlong Real Estate Holdings Ltd 1,230,103 0.17
1,529,003 Shanda Games Ltd ADR 8,608,287 1.21
6,948,000 Shimao Property Holdings Ltd 7,301,567 1.02
16,021,000 Shui On Land Ltd 6,126,018 0.86
538,457 Suntech Power Holdings Co Ltd ADR 2,859,207 0.40
11,930,014 TCC International Holdings Ltd 6,199,667 0.87
594,617 Trina Solar Ltd ADR 9,870,642 1.38
8,916,000 Uni-President China Holdings Ltd 5,045,230 0.71
12,972,000 Want Want China Holdings Ltd 10,735,914 1.50
957,290 WuXi PharmaTech Cayman Inc ADR 12,578,791 1.76
101,706,733 14.25
China 97,407,900 Bank of China Ltd 'H' 40,245,972 5.64
23,448,000 Beijing Capital International Airport Co Ltd 'H' 11,192,346 1.57
1,330,400 Changsha Zoomlion Heavy Industry Science
and Technology Development Co Ltd 'H' 2,280,663 0.32
35,661,400 China Citic Bank Corp Ltd 'H' 19,127,008 2.68
13,874,000 China Coal Energy Co Ltd 'H' 18,585,513 2.61
15,317,000 China Communications Construction Co
Ltd 'H' 11,084,732 1.55
65,561,820 China Construction Bank Corp 'H' 48,624,058 6.82
4,627,000 China Life Insurance Co Ltd 'H' 11,612,901 1.63
13,373,400 China Minsheng Banking Corp Ltd 'H' 11,102,441 1.56
5,590,600 China Pacific Insurance Group Co Ltd 'H' 21,843,291 3.06
32,714,000 China Petroleum & Chemical Corp 'H' 32,279,913 4.52
7,908,000 China Shipping Development Co Ltd 'H' 5,651,897 0.79
5,809,368 China Vanke 'B' 7,454,204 1.04
19,162,000 Datang International Power Generation Co
Ltd 'H' 5,335,473 0.75
7,302,000 Dongfeng Motor Group Co Ltd 'H' 11,636,859 1.63
69,000,150 Industrial & Commercial Bank of China 'H' 45,330,693 6.35
11,994,000 PetroChina Co Ltd 'H' 15,451,481 2.17
3,903,429 Shandong Chenming Paper Holdings 'B' 2,153,709 0.30
3,219,000 Shandong Chenming Paper Holdings Ltd 'H' 1,610,861 0.23
6,353,000 Zhuzhou CSR Times Electric Co Ltd 'H' 15,129,661 2.12
14,713,000 Zijin Mining Group Co Ltd 'H' 6,834,113 0.96
344,567,789 48.30
Hong Kong 5,645,500 China Mobile Ltd 57,227,117 8.02
6,789,800 China Resources Power Holdings Co Ltd 11,465,295 1.61
2,264,000 China Taiping Insurance Holdings Co Ltd 5,072,161 0.71
12,566,000 China Unicom Hong Kong Ltd 26,604,394 3.73
21,956,000 CNOOC Ltd 44,794,295 6.28
29,922,000 Franshion Properties China Ltd 6,718,944 0.94
3,664,000 Poly Hong Kong Investments Ltd 2,157,946 0.30
25,652,000 Shenzhen Investment Ltd 6,714,656 0.94
22,010,000 Shougang Fushan Resources Group Ltd 10,392,983 1.46
171,147,791 23.99
Singapore 8,462,000 Morgan Stanley Asia Products Ltd
(Call Wts 1/11/2011 - Peak Sport
Products Co Ltd) 3,289,940 0.46
4,855,000 Morgan Stanley Asia Products Ltd
(Call Wts 18/11/2011 - Evergrande
Real Estate Group Ltd) 3,002,677 0.42
20,593,000 Morgan Stanley Asia Products Ltd
(Call Wts 22/11/2011 - China Rongsheng
Heavy Industries Group Holdings Ltd) 8,323,434 1.17
9,057,000 Morgan Stanley Asia Products Ltd
(Call Wts 28/9/2011 - Peak Sport
Products Co Ltd) 3,521,271 0.50
2,841,150 Morgan Stanley Asia Products Ltd
(Call Wts 3/9/2015 - TBEA Co Ltd) 4,655,139 0.65
7,087,000 Yanlord Land Group Ltd 5,333,204 0.75
28,125,665 3.95
Switzerland 437,000 UBS AG (ELN 12/11/2013 - China Pacific
Insurance) 1,419,690 0.20
5,067,500 UBS AG (ELN 18/6/2013 - Baoshan Iron
and Steel Co Ltd) 4,203,121 0.59
1,983,670 UBS AG (ELN 9/9/2013 - TBEA Co Ltd) 3,250,184 0.45
8,872,995 1.24
Taiwan 347,000 MediaTek Inc 3,486,806 0.49
United States 3,667,500 Citigroup Global Markets Holdings Inc
(Call Wts 20/1/2015 - Baoshan Iron
& Steel Co) 3,041,923 0.43
Total Common Stocks (Shares)
& Warrants 706,888,479 99.09
Total Transferable Securities Admitted
to an Official Stock Exchange Listing or
Dealt in on Another Regulated Market 706,888,485 99.09
Unquoted Securities
WARRANTS
Switzerland 957,700 UBS AG (ELN 1/7/2013 - China Life
Insurance) 2,392,035 0.33
Total Unquoted Securities 2,392,035 0.33
Total Portfolio 709,280,520 99.42
Other Net Assets 4,122,425 0.58
Total Net Assets (USD) 713,402,945 100.00
China Fund
Portfolio of Investments 31 August 2011
Transferable Securities Admitted to an Official Stock Exchange Listing or Dealt in on Another Regulated Market
Holding Description Value (USD) %
Transferable Securities Admitted to an Official Stock Exchange Listing or Dealt in on Another Regulated Market
Holding Description Value (USD) %

62 BlackRock Global Funds (BGF)
China Fund continued
Open Forward Foreign Exchange Transactionsas at 31 August 2011
Purchases Sales Value date Unrealised
profit/(loss)
Unrealisedprofit/(loss)
USD Equivalent
EUR Hedged Share Class EUR
EUR 69,256,830 USD 98,338,194 14/9/2011 1,152,505 1,664,508
USD 16,475,564 EUR 11,524,348 14/9/2011 (114,162) (164,879)
Net unrealised profit 1,038,343 1,499,629
GBP Hedged Share Class GBP
GBP 1,047,914 USD 1,713,653 14/9/2011 (2,426) (3,959)
USD 262,544 GBP 160,652 14/9/2011 268 437
Net unrealised loss (2,158) (3,522)
SGD Hedged Share Class SGD
SGD 25,220,274 USD 20,682,000 14/9/2011 349,120 290,304
USD 2,674,851 SGD 3,247,523 14/9/2011 (30,879) (25,677)
Net unrealised profit 318,241 264,627
Total net unrealised profit 1,760,734
Note: The net unrealised profit attributed to these transactions is included in the Statement
of Net Assets (see Note 2c).
Sector Breakdownas at 31 August 2011
% of netassets
Financials 37.54
Energy 15.58
Telecommunication Services 11.75
Materials 8.64
Consumer Discretionary 7.62
Industrials 6.35
Information Technology 4.46
Healthcare 2.91
Utilities 2.36
Consumer Staples 2.21
Other Net Assets 0.58
100.00

* Securities lent, see Note 11, for further details.
Audited Annual Report and Accounts 63
The notes on pages 261 to 270 form an integral part of these financial statements.
Continental European Flexible Fund
COMMON STOCKS (SHARES)
Belgium 296,352 KBC Groep NV 5,652,915 1.01
275,971 Telenet Group Holding NV 7,763,064 1.39
13,415,979 2.40
Denmark 385,876 Novo Nordisk A/S 'B' 28,640,682 5.12
Finland 410,065 Fortum OYJ 7,635,410 1.36
398,725 Kone OYJ 'B' 16,363,674 2.93
593,183 Nokian Renkaat OYJ * 15,161,758 2.71
38,764 Vacon Plc 1,415,661 0.25
40,576,503 7.25
France 331,029 BNP Paribas SA 11,753,185 2.10
660,630 Cie Generale de Geophysique - Veritas 11,531,297 2.06
336,208 Danone 15,981,647 2.86
12,617 Euler Hermes SA 689,140 0.12
652,253 Eutelsat Communications SA 20,056,780 3.59
588,555 Legrand SA * 16,141,121 2.89
535,328 Safran SA 14,544,862 2.60
183,502 Schneider Electric SA 17,025,315 3.04
211,990 Technip SA 14,339,004 2.56
122,062,351 21.82
Germany 230,117 Allianz SE 16,529,304 2.96
452,692 Bayer AG 20,350,769 3.64
138,793 Bilfinger Berger SE 8,113,839 1.45
223,304 Continental AG 11,428,699 2.04
333,777 Daimler AG 12,474,915 2.23
296,561 ElringKlinger AG 5,167,575 0.92
121,702 Fresenius SE & Co KGaA 8,706,561 1.56
444,691 Kabel Deutschland Holding AG 17,580,859 3.14
582,050 SAP AG 22,149,913 3.96
122,502,434 21.90
Ireland 5,534,286 Ryanair Holdings Plc 17,316,781 3.10
Netherlands 272,366 Koninklijke Vopak NV * 9,441,567 1.69
Norway 1,355,660 DnB NOR ASA 11,283,184 2.02
1,322,026 Petroleum Geo-Services ASA 11,430,725 2.04
22,713,909 4.06
Portugal 782,441 Galp Energia SGPS SA 'B' 10,836,808 1.94
1,158,343 Jeronimo Martins SGPS SA 15,093,209 2.70
25,930,017 4.64
Sweden 653,854 Atlas Copco 'A' * 10,249,254 1.83
537,328 Svenska Handelsbanken AB 'A' 10,255,244 1.83
326,463 Swedish Match AB 8,211,318 1.47
28,715,816 5.13
Switzerland 145,025 Cie Financiere Richemont SA 'A' 5,796,108 1.04
255,840 Julius Baer Group Ltd 7,305,435 1.31
827,364 Nestle SA 35,284,842 6.31
139,968 Roche Holding AG 16,814,471 3.00
63,656 Swatch Group AG 20,113,158 3.59
68,653 Syngenta AG 15,208,617 2.72
100,522,631 17.97
United Kingdom 837,828 Imperial Tobacco Group Plc 19,302,435 3.45
Total Common Stocks (Shares) 551,141,105 98.53
Total Transferable Securities Admitted
to an Official Stock Exchange Listing or
Dealt in on Another Regulated Market 551,141,105 98.53
Total Portfolio 551,141,105 98.53
Other Net Assets 8,222,494 1.47
Total Net Assets (EUR) 559,363,599 100.00
Portfolio of Investments 31 August 2011
Transferable Securities Admitted to an Official Stock Exchange Listing or Dealt in on Another Regulated Market
Holding Description Value (EUR) %
Transferable Securities Admitted to an Official Stock Exchange Listing or Dealt in on Another Regulated Market
Holding Description Value (EUR) %

64 BlackRock Global Funds (BGF)
Continental European Flexible Fund continued
Sector Breakdownas at 31 August 2011
% of netassets
Industrials 19.78
Consumer Discretionary 19.26
Consumer Staples 16.79
Healthcare 13.32
Financials 11.35
Energy 8.60
Information Technology 3.96
Materials 2.72
Telecommunication Services 1.39
Utilities 1.36
Other Net Assets 1.47
100.00
Open Forward Foreign Exchange Transactionsas at 31 August 2011
Purchases Sales Value date Unrealised
profit/(loss)
Unrealisedprofit/(loss)
EUR Equivalent
GBP Hedged Share Class GBP
EUR 1,335,707 GBP 1,168,875 14/9/2011 13,256 14,979
GBP 7,749,733 EUR 8,919,573 14/9/2011 (144,295) (163,045)
Net unrealised loss (131,039) (148,066)
Total net unrealised loss (148,066)
Note: The net unrealised loss attributed to these transactions is included in the Statement
of Net Assets (see Note 2c).
Open Futures Contractsas at 31 August 2011
Numberof contracts Contract/Description
Expirationdate
ValueEUR
160 Euro Stoxx 50 September 2011 3,673,600
Total commitment 3,673,600
Note: The net unrealised gain of EUR 100,085 attributed to this transaction is included
in the Statement of Net Assets (see Note 2c).

*Securities lent, see Note 11, for further details.
Audited Annual Report and Accounts 65
The notes on pages 261 to 270 form an integral part of these financial statements.
Emerging Europe Fund
FUNDS
Ireland 15,335,398 Institutional Cash Series Plc - Institutional
Euro Liquidity Fund 15,335,398 0.82
United Kingdom 3,474,369 Eastern European Trust Plc 10,324,563 0.55
694,873 Eastern European Trust Plc/The 54,960 0.01
425,000 Ukraine Opportunity Trust Plc/The 782,811 0.04
11,162,334 0.60
Total Funds 26,497,732 1.42
COMMON / PREFERRED STOCKS (SHARES) & WARRANTS
Bermuda 6,367,715 VimpelCom Ltd ADR 49,736,945 2.66
British Virgin Islands 1,059,029 Mail.ru Group Ltd GDR 25,666,242 1.37
Cyprus 16,097,993 AFI Development Plc 'B' 7,579,962 0.41
15,242,641 AFI Development Plc GDR 7,098,048 0.38
14,678,010 0.79
Czech Republic 2,489,183 CEZ AS 80,757,044 4.33
14,350 Komercni Banka AS 2,079,401 0.11
82,836,445 4.44
Denmark 502,955 Carlsberg A/S 'B' 26,057,149 1.39
Egypt 30,000 Orascom Telecom Holding SAE GDR 62,050 0.00
Hungary 592,383 MOL Hungarian Oil and Gas Plc * 37,460,771 2.00
4,400,765 OTP Bank Plc * 66,660,884 3.57
104,121,655 5.57
Kazakhstan 4,059,218 KazMunaiGas Exploration Production GDR 47,642,930 2.55
Luxembourg 1,316,330 Evraz Group SA GDR 21,392,634 1.15
1,695,842 Kernel Holding SA 28,340,185 1.52
3,039,152 O'Key Group S.A. GDR 16,519,940 0.88
66,252,759 3.55
Poland 20,520,550 Bank Millennium SA 23,356,892 1.25
2,107,647 Bank Pekao SA 75,374,265 4.04
92,498 PGE SA 462,844 0.02
13,281,421 Polimex-Mostostal SA 6,085,303 0.33
1,130,886 Polski Koncern Naftowy Orlen S.A. 10,635,735 0.57
3,638,079 Polskie Gornictwo Naftowe i Gazownictwo
SA 3,526,811 0.19
530,572 Powszechny Zaklad Ubezpieczen SA 45,203,497 2.42
753,397 Telekomunikacja Polska SA 3,072,215 0.16
167,717,562 8.98
Russian Federation 48,154 AK Transneft OAO (Pref) 46,187,263 2.47
2,120,211,709 Federal Grid Co Unified Energy System
JSC 15,061,584 0.81
19,297,646 Gazprom OAO ADR 164,894,391 8.83
386,203,681 IDGC Holding JSC 27,110,794 1.45
2,562,779 Lukoil OAO ADR 106,386,552 5.70
2,031,237 Mechel ADR 25,767,510 1.38
4,633,689 Mobile Telesystems OJSC ADR 52,460,331 2.81
8,743,542 Mostotrest 34,896,257 1.87
985,805 NovaTek OAO GDR 91,812,051 4.92
1,016,789 Pharmstandard OJSC GDR 14,081,445 0.75
5,105,191 Rosneft Oil Co GDR 28,015,453 1.50
68,929,974 Sberbank of Russia 139,703,403 7.48
4,538,227 Sistema JSFC GDR 57,664,519 3.09
49,672,998 Surgutneftegas OJSC (Pref) 16,808,867 0.90
7,555,700 Surgutneftegas OJSC ADR 44,654,437 2.39
533,194 Tatneft ADR 12,194,955 0.65
1,095,881 Uralkali GDR 37,805,371 2.02
10,355,388 VTB Bank OJSC GDR * 37,286,885 2.00
952,792,068 51.02
Turkey 2,055,591 Anadolu Efes Biracilik Ve Malt Sanayii AS 15,781,769 0.85
1,106,159 BIM Birlesik Magazalar AS 24,519,083 1.31
38,182,805 Dogan Sirketler Grubu Holdings * 10,156,306 0.54
35,831,653 Dogan Yayin Holding AS * 9,386,511 0.50
2,867,078 Koza Altin Isletmeleri AS * 27,153,844 1.46
6,895,139 Turkcell Iletisim Hizmetleri AS 21,174,930 1.13
26,724,853 Turkiye Garanti Bankasi AS * 67,423,861 3.61
6,504,308 Turkiye Halk Bankasi AS * 28,179,515 1.51
2 Turkiye Sinai Kalkinma Bankasi AS 1 0.00
203,775,820 10.91
United Kingdom 4,286,273 Eurasian Natural Resources Corp Plc 33,223,391 1.78
4,525,309 JKX Oil & Gas Plc 9,679,186 0.52
123,000 Ukraine Opportunity Trust Plc/The
(Wts 30/4/2012) 85,175 0.01
42,987,752 2.31
United States 2,208,832 Central European Distribution Corp * 11,501,982 0.62
Total Common / Preferred Stocks (Shares)
& Warrants 1,795,829,369 96.16
Total Transferable Securities Admitted
to an Official Stock Exchange Listing or
Dealt in on Another Regulated Market 1,822,327,101 97.58
Unquoted Securities
COMMON STOCKS (SHARES)
Russian Federation 2,014,295 Surgutneftegas OJSC ADR 6,708,950 0.36
Total Unquoted Securities 6,708,950 0.36
Total Portfolio 1,829,036,051 97.94
Other Net Assets 38,564,473 2.06
Total Net Assets (EUR) 1,867,600,524 100.00
Portfolio of Investments 31 August 2011
Transferable Securities Admitted to an Official Stock Exchange Listing or Dealt in on Another Regulated Market
Holding Description Value (EUR) %
Transferable Securities Admitted to an Official Stock Exchange Listing or Dealt in on Another Regulated Market
Holding Description Value (EUR) %

66 BlackRock Global Funds (BGF)
Emerging Europe Fund continued
Sector Breakdownas at 31 August 2011
% of netassets
Energy 33.55
Financials 26.79
Telecommunication Services 9.85
Materials 7.79
Utilities 6.61
Consumer Staples 6.57
Industrials 2.74
Investment Funds 1.42
Information Technology 1.37
Healthcare 0.75
Consumer Discretionary 0.50
Other Net Assets 2.06
100.00
Open Forward Foreign Exchange Transactionsas at 31 August 2011
Purchases Sales Value date Unrealised
profit/(loss)
Unrealisedprofit/(loss)
EUR Equivalent
Core Fund EUR
TRY 897,768 EUR 355,805 2/9/2011 6,011 6,011
TRY 1,664,415 EUR 657,176 5/9/2011 13,275 13,275
Net unrealised profit 19,286 19,286
SGD Hedged Share Class SGD
EUR 503,988 SGD 873,590 14/9/2011 1,538 886
SGD 4,295,595 EUR 2,479,266 14/9/2011 (9,414) (5,421)
Net unrealised loss (7,876) (4,535)
Total net unrealised profit 14,751
Note: The net unrealised profit attributed to these transactions is included in the Statement
of Net Assets (see Note 2c).

Audited Annual Report and Accounts 67
The notes on pages 261 to 270 form an integral part of these financial statements.
Emerging Markets Bond Fund
BONDS
Argentina USD 2,420,000 Argentina Bonos 7% 3/10/2015 2,249,457 0.27
USD 33,985,775 Argentine Republic Government
International Bond 8.28%
31/12/2033 27,805,923 3.30
USD 3,560,000 Argentine Republic Government
International Bond 'NY'
(Step-up coupon) 2.5% 31/12/2038 1,468,500 0.17
31,523,880 3.74
Brazil USD 5,790,000 Brazilian Government International
Bond 4.875% 22/1/2021 6,397,950 0.76
USD 21,830,000 Brazilian Government International
Bond 5.875% 15/1/2019 25,835,805 3.06
USD 6,360,000 Brazilian Government International
Bond 6% 17/1/2017 7,467,435 0.89
USD 1,000,000 Brazilian Government International
Bond 8.25% 20/1/2034 1,456,400 0.17
41,157,590 4.88
Colombia USD 10,790,000 Colombia Government International
Bond 4.375% 12/7/2021 11,523,369 1.37
USD 1,500,000 Colombia Government International
Bond 6.125% 18/1/2041 1,743,750 0.21
USD 4,995,000 Colombia Government International
Bond 7.375% 27/1/2017 6,131,363 0.73
USD 6,300,000 Colombia Government International
Bond 7.375% 18/3/2019 8,024,468 0.95
COP 1,121,000,000 Colombia Government International
Bond 7.75% 14/4/2021 734,264 0.09
USD 1,300,000 Colombia Government International
Bond 8.125% 21/5/2024 1,808,755 0.21
29,965,969 3.56
Croatia USD 4,690,000 Croatia Government International Bond
6.375% 24/3/2021 4,607,128 0.55
USD 650,000 Croatia Government International Bond
6.625% 14/7/2020 658,125 0.08
USD 6,630,000 Croatia Government International Bond
6.75% 5/11/2019 6,777,119 0.80
12,042,372 1.43
Dominican Republic USD 1,680,000 Dominican Republic International
Bond 7.5% 6/5/2021 1,725,452 0.20
El Salvador USD 875,000 El Salvador Government International
Bond 7.375% 1/12/2019 975,481 0.12
USD 4,660,000 El Salvador Government International
Bond 7.625% 1/2/2041 4,846,400 0.57
5,821,881 0.69
Indonesia USD 1,600,000 Indonesia (Republic of) 6.875%
17/1/2018 1,904,000 0.22
USD 4,690,000 Indonesia Government International
Bond 6.75% 10/3/2014 5,205,900 0.62
USD 16,000,000 Indonesia Government International
Bond 6.875% 9/3/2017 18,934,800 2.25
USD 3,730,000 Indonesia Government International
Bond '144A' 7.5% 15/1/2016 4,420,050 0.52
USD 1,410,000 Indonesia Government International
Bond '144A' 7.75% 17/1/2038 1,861,200 0.22
USD 4,140,000 Indonesia Government International
Bond 8.5% 12/10/2035 5,951,250 0.71
USD 1,800,000 Indonesia Government International
Bond '144A' 11.625% 4/3/2019 2,700,000 0.32
IDR 3,200,000,000 Indonesia Treasury Bond 12.5%
15/3/2013 417,767 0.05
USD 17,125,000 Republic of Indonesia 4.875%
5/5/2021 18,337,793 2.18
USD 12,530,000 Republic of Indonesia 5.875%
13/3/2020 14,487,812 1.72
74,220,572 8.81
Ireland USD 4,010,000 RZD Capital Ltd 5.739% 3/4/2017 4,221,307 0.50
USD 2,430,000 Vnesheconombank Via VEB Finance
Plc 6.902% 9/7/2020 2,624,400 0.31
6,845,707 0.81
Jordan USD 6,580,000 Jordan Government International Bond
3.875% 12/11/2015 6,239,485 0.74
Kazakhstan USD 9,960,000 KazMunayGas National Co 7%
5/5/2020 10,806,600 1.28
USD 4,000,000 KazMunayGas National Co 9.125%
2/7/2018 4,827,060 0.57
USD 1,700,000 KazMunayGas National Co 11.75%
23/1/2015 2,066,261 0.25
USD 2,710,000 KazMunayGas National Co '144A'
11.75% 23/1/2015 3,265,550 0.39
20,965,471 2.49
Lithuania USD 2,470,000 Lithuania Government International
Bond 7.375% 11/2/2020 2,877,550 0.34
Luxembourg USD 3,750,000 Gazprom OAO Via Gaz Capital SA
7.288% 16/8/2037 4,213,669 0.50
USD 4,000,000 Russian Agricultural Bank OJSC Via
RSHB Capital SA 6.299% 15/5/2017 4,244,860 0.51
USD 10,800,000 Russian Agricultural Bank OJSC Via
RSHB Capital SA 7.75% 29/5/2018 12,326,364 1.46
USD 1,560,000 Russian Agricultural Bank OJSC Via
RSHB Capital SA '144A' 9%
11/6/2014 1,739,400 0.21
USD 4,000,000 Russian Agricultural Bank OJSC Via
RSHB Capital SA 9% 11/6/2014 4,490,000 0.53
27,014,293 3.21
Malaysia USD 5,200,000 Petronas Capital Ltd 5.25%
12/8/2019 5,825,820 0.69
USD 400,000 Petronas Capital Ltd 7.875%
22/5/2022 537,785 0.07
6,363,605 0.76
Portfolio of Investments 31 August 2011
Transferable Securities Admitted to an Official Stock Exchange Listing or Dealt in on Another Regulated Market
Holding Description Value (USD) %
Transferable Securities Admitted to an Official Stock Exchange Listing or Dealt in on Another Regulated Market
Holding Description Value (USD) %

68 BlackRock Global Funds (BGF)
Emerging Markets Bond Fund continued
Portfolio of Investments 31 August 2011
Mexico USD 29,835,000 Mexico Government International Bond
5.125% 15/1/2020 * 33,430,118 3.97
USD 21,090,000 Mexico Government International Bond
5.625% 15/1/2017 24,332,587 2.89
USD 3,750,000 Mexico Government International Bond
5.75% 12/10/2110 3,731,869 0.44
USD 11,998,000 Mexico Government International Bond
5.95% 19/3/2019 14,218,530 1.69
USD 780,000 Mexico Government International Bond
6.05% 11/1/2040 889,200 0.11
USD 9,000,000 Mexico Government International Bond
6.75% 27/9/2034 11,160,000 1.32
USD 4,972,000 Mexico Government International Bond
8.3% 15/8/2031 7,122,390 0.84
USD 3,983,000 Petroleos Mexicanos '144A' 6.5%
2/6/2041 4,276,021 0.51
USD 5,700,000 Petroleos Mexicanos 8% 3/5/2019 7,167,750 0.85
106,328,465 12.62
Pakistan USD 250,000 Pakistan Government International
Bond 7.125% 31/3/2016 213,750 0.03
Panama USD 2,220,000 Panama Government International
Bond 6.7% 26/1/2036 2,758,350 0.33
USD 6,295,000 Panama Government International
Bond 8.875% 30/9/2027 9,300,863 1.10
USD 500,000 Panama Government International
Bond 9.375% 1/4/2029 771,507 0.09
12,830,720 1.52
Peru USD 2,260,000 Peruvian Government International
Bond 5.625% 18/11/2050 2,371,000 0.28
USD 5,672,000 Peruvian Government International
Bond 6.55% 14/3/2037 6,863,120 0.81
USD 4,200,000 Peruvian Government International
Bond 7.125% 30/3/2019 5,273,100 0.63
USD 6,860,000 Peruvian Government International
Bond 7.35% 21/7/2025 8,972,365 1.06
USD 1,240,000 Peruvian Government International
Bond 8.75% 21/11/2033 1,825,900 0.22
25,305,485 3.00
Philippines USD 5,980,000 Philippine Government International
Bond 6.375% 15/1/2032 7,056,400 0.84
USD 11,164,000 Philippine Government International
Bond 6.375% 23/10/2034 13,054,964 1.55
USD 3,200,000 Philippine Government International
Bond 7.5% 25/9/2024 4,087,248 0.49
USD 12,490,000 Philippine Government International
Bond 7.75% 14/1/2031 16,755,772 1.99
USD 530,000 Philippine Government International
Bond 8.375% 17/6/2019 692,975 0.08
USD 650,000 Philippine Government International
Bond 8.875% 17/3/2015 796,250 0.09
USD 6,400,000 Philippine Government International
Bond 9.375% 18/1/2017 8,250,586 0.98
USD 1,800,000 Philippine Government International
Bond 9.875% 15/1/2019 2,480,606 0.29
53,174,801 6.31
Poland USD 8,230,000 Poland Government International Bond
3.875% 16/7/2015 8,553,027 1.02
USD 5,540,000 Poland Government International Bond
5.125% 21/4/2021 5,775,450 0.69
USD 10,057,000 Poland Government International Bond
6.375% 15/7/2019 11,584,407 1.37
25,912,884 3.08
Russian Federation USD 53,997,625 Russian Foreign Bond - Eurobond
(Step-up coupon) 7.5% 31/3/2030 64,662,156 7.67
South Africa USD 1,800,000 Eskom Holdings Ltd 5.75% 26/1/2021 1,933,383 0.23
USD 10,020,000 South Africa Government International
Bond 5.5% 9/3/2020 11,460,375 1.36
USD 5,500,000 South Africa Government International
Bond 6.5% 2/6/2014 6,186,125 0.74
USD 4,240,000 South Africa Government International
Bond 6.875% 27/5/2019 5,241,700 0.62
24,821,583 2.95
Turkey USD 18,470,000 Republic of Turkey 7.5% 14/7/2017 21,748,425 2.58
USD 6,700,000 Republic of Turkey 7.5% 7/11/2019 7,999,800 0.95
USD 1,390,000 Turkey Government International Bond
6.75% 3/4/2018 1,598,792 0.19
USD 8,082,000 Turkey Government International Bond
6.875% 17/3/2036 8,971,020 1.06
USD 5,200,000 Turkey Government International Bond
7% 26/9/2016 5,965,180 0.71
USD 19,640,000 Turkey Government International Bond
7% 11/3/2019 22,866,361 2.71
USD 2,650,000 Turkey Government International Bond
7% 5/6/2020 3,093,875 0.37
USD 1,620,000 Turkey Government International Bond
7.25% 15/3/2015 1,835,136 0.22
USD 8,210,000 Turkey Government International Bond
11.875% 15/1/2030 14,056,136 1.67
88,134,725 10.46
Ukraine USD 8,800,000 Ukraine Government International Bond
6.25% 17/6/2016 8,734,572 1.04
USD 5,240,000 Ukraine Government International Bond
6.58% 21/11/2016 5,246,550 0.62
USD 850,000 Ukraine Government International Bond
'144A' 6.58% 21/11/2016 854,250 0.10
USD 5,000,000 Ukraine Government International Bond
7.75% 23/9/2020 5,187,500 0.62
20,022,872 2.38
United States USD 6,220,000 Pemex Project Funding Master Trust
6.625% 15/6/2035 6,863,621 0.81
Uruguay USD 2,000,000 Uruguay Government International
Bond 6.875% 28/9/2025 2,510,950 0.30
USD 882,805 Uruguay Government International
Bond 7.625% 21/3/2036 1,174,130 0.14
USD 1,373,891 Uruguay Government International
Bond 7.875% 15/1/2033 1,834,179 0.21
5,519,259 0.65
Transferable Securities Admitted to an Official Stock Exchange Listing or Dealt in on Another Regulated Market
Holding Description Value (USD) %
Transferable Securities Admitted to an Official Stock Exchange Listing or Dealt in on Another Regulated Market
Holding Description Value (USD) %

* Securities lent, see Note 11, for further details.
Audited Annual Report and Accounts 69
The notes on pages 261 to 270 form an integral part of these financial statements.
Emerging Markets Bond Fund continued
Portfolio of Investments 31 August 2011
Venezuela USD 10,320,000 Petroleos de Venezuela SA 5.25%
12/4/2017 6,225,540 0.74
USD 7,000 Venezuela Government International
Bond FRN 15/4/2020 197,750 0.02
USD 1,100,000 Venezuela Government International
Bond 7% 1/12/2018 750,750 0.09
USD 40,350,000 Venezuela Government International
Bond 7.65% 21/4/2025 24,594,334 2.92
USD 23,462,000 Venezuela Government International
Bond 9.25% 15/9/2027 16,629,279 1.97
USD 11,860,000 Venezuela Government International
Bond 9.25% 7/5/2028 8,039,301 0.96
56,436,954 6.70
Total Bonds 756,991,102 89.84
Total Transferable Securities Admitted
to an Official Stock Exchange Listing or
Dealt in on Another Regulated Market 756,991,102 89.84
BONDS
Iraq USD 1,350,000 Republic of Iraq 5.8% 15/1/2028 1,201,919 0.15
Venezuela USD 9,210,000 Petroleos de Venezuela SA 12.75%
17/2/2022 * 7,432,470 0.88
Total Bonds 8,634,389 1.03
Total Unquoted Securities 8,634,389 1.03
Total Portfolio 765,625,491 90.87
Other Net Assets 76,971,204 9.13
Total Net Assets (USD) 842,596,695 100.00
Transferable Securities Admitted to an Official Stock Exchange Listing or Dealt in on Another Regulated Market
Holding Description Value (USD) %
Unquoted Securities
Holding Description Value (USD) %
Note: The total market value of USD (1,606,520) of these transactions is included in the Statement of Net Assets (see Note 2c).
Nominal Value Description
Unrealisedprofit/(loss)
USD
Nominal Value Description
Unrealisedprofit/(loss)
USD
Swaps as at 31 August 2011
MXN 2,183,780,000 Interest Rate Swaps (JP Morgan) (Fund receives
Floating MXN MXIBTIIE 28 Days; and pays
Fixed 4.98%) (4/10/2011) (39,330)
ZAR 1,570,500,000 Interest Rate Swaps (Barclays) (Fund receives Fixed
6.1275%; and pays Floating ZAR JIBOR 3 Month)
(17/2/2012) 221,597
PLN 430,980,000 Interest Rate Swaps (Deutsche Bank) (Fund receives
Fixed 4.93%; and pays Floating PLN WIBOR
3 Month) (7/6/2012) 218,489
BRL 100,700,000 Interest Rate Swaps (Deutsche Bank) (Fund receives
Floating 1D BROIS + 0 bps; and pays Fixed
11.89%) (2/1/2013) (706,316)
BRL 49,711,687 Interest Rate Swaps (UBS) (Fund receives Floating
1D BROIS + 0 bps; and pays Fixed 11.8275%)
(2/1/2013) (661,021)
KRW 54,915,350,000 Interest Rate Swaps (HSBC) (Fund receives Floating
KRW KORIBOR 3 Month; and pays Fixed 4.135%)
(29/4/2013) (298,551)
USD 31,688,884 Currency Swaps (TRY/USD) (JP Morgan) (Fund
receives 3M Libor + 0bps; and pays Fixed
5.959%) (15/9/2013) 79,701
USD 16,120,000 Credit Default Swaps (UBS) (Fund receives default
protection on China Government International
Bond 4.75% 29/10/2013; and pays Fixed 1%)
(20/9/2015) 59,955
USD 14,010,000 Credit Default Swaps (Citibank) (Fund receives
default protection on Bundesrepublik Deutschland
6% 20/6/2016; and pays Fixed 0.25%)
(20/3/2016) 70,934
USD 7,740,000 Credit Default Swaps (Deutsche Bank) (Fund
receives default protection on Peru (Republic of )
6.75% 21/11/2033; and pays Fixed 1%)
(20/6/2016) 13,753
USD (10,000,000) Credit Default Swaps (Goldman Sachs) (Fund
provides default protection on Federative Republic
of Brazil 12.25 6/3/2030; and receives Fixed 1%)
(20/9/2016) (138,004)
USD (21,330,000) Credit Default Swaps (Deutsche Bank) (Fund
provides default protection on Federative Republic
of Brazil 12.25% 6/3/2030; and receives Fixed
1%) (20/9/2016) 336,622
USD (28,120,000) Credit Default Swaps (Goldman Sachs) (Fund
provides default protection on Federative Republic
of Brazil 12.25% 6/3/2030; and receives Fixed
1%) (20/9/2016) (408,070)
(1,250,241)

70 BlackRock Global Funds (BGF)
Emerging Markets Bond Fund continued
Open Futures Contractsas at 31 August 2011
Numberof contracts Contract/Description
Expirationdate
ValueUSD
67 US Long Bond (CBT) December 2011 9,176,906
63 US Treasury 10 Year Note December 2011 8,149,641
Total commitment 17,326,547
Note: The net unrealised gain of USD 65,063 attributed to these transactions is included
in the Statement of Net Assets (see Note 2c).
Purchased Call Options as at 31 August 2011
Number of contracts
subjectto Call Issuer
UnrealisedlossUSD
ValueUSD
12,050,000 OTC EUR/USD Call Option
strike price EUR 1.46
expiring on 8/9/2011 (106,349) 41,295
16,870,000 OTC USD/CNY Call Option
strike price USD 6.445
expiring on 27/2/2012 (220,035) 56,633
16,870,000 OTC USD/CNY Call Option
strike price USD 6.4125
expiring on 1/3/2012 (198,577) 76,404
Total Purchased Call Options (524,961) 174,332
Note: Purchased Call Options are included in the Statement of Net Assets (see Note 2c).
Purchased Put Options as at 31 August 2011
Number of contracts
subjectto Put Issuer
UnrealisedlossUSD
ValueUSD
12,110,000 OTC AUD/USD Put Option
strike price AUD 1.0122
expiring on 12/10/2011 (108,183) 78,653
12,060,000 OTC AUD/USD Put Option
strike price AUD 1.025
expiring on 14/10/2011 (74,195) 110,122
Total Purchased Put Options (182,378) 188,775
Note: Purchased Put Options are included in the Statement of Net Assets (see Note 2c).
Open Forward Foreign Exchange Transactionsas at 31 August 2011
Purchases Sales Value date Unrealised
profit/(loss)
Unrealisedprofit/(loss)
USD Equivalent
Core Fund USD
BRL 93,078,278 USD 57,840,000 2/9/2011 778,479 778,479
USD 57,355,000 BRL 93,099,406 2/9/2011 (1,276,786) (1,276,786)
USD 17,046,590 EUR 11,760,000 2/9/2011 63,335 63,335
MXN 272,820,692 USD 21,887,356 8/9/2011 131,208 131,208
USD 8,575,941 MXN 107,300,000 8/9/2011 (83,930) (83,930)
CNY 345,723,333 USD 53,690,000 9/9/2011 542,278 542,278
USD 26,845,000 CNY 172,747,575 9/9/2011 (253,242) (253,242)
USD 17,153,802 EUR 12,050,000 12/9/2011 (246,051) (246,051)
KRW 5,665,020,000 USD 5,260,000 14/9/2011 50,246 50,246
USD 5,260,000 KRW 5,771,798,000 14/9/2011 (150,337) (150,337)
AUD 15,115,000 USD 15,776,448 15/9/2011 373,415 373,415
EUR 10,180,000 CZK 245,913,068 15/9/2011 (26,391) (26,391)
EUR 29,700,000 USD 42,913,465 15/9/2011 (29,150) (29,150)
RUB 245,785,150 USD 8,555,000 15/9/2011 (53,108) (53,108)
TRY 8,829,548 USD 5,080,000 15/9/2011 46,932 46,932
USD 27,493,139 AUD 26,260,000 15/9/2011 (564,777) (564,777)
USD 42,754,314 EUR 29,700,000 15/9/2011 (130,000) (130,000)
USD 5,103,600 MXN 63,753,000 15/9/2011 (38,579) (38,579)
USD 15,095,000 RUB 441,423,400 15/9/2011 (174,165) (174,165)
USD 14,086,452 TRY 24,793,000 15/9/2011 (309,757) (309,757)
CHF 14,557,000 USD 18,928,056 7/10/2011 (845,143) (845,143)
HUF 6,054,522,000 USD 31,324,871 7/10/2011 703,807 703,807
MXN 268,319,000 USD 21,666,586 7/10/2011 (65,975) (65,975)
PLN 1,607,000 USD 571,837 7/10/2011 (14,383) (14,383)
TRY 6,614,000 USD 3,681,988 7/10/2011 143,534 143,534
USD 20,517,432 CHF 14,558,000 7/10/2011 2,433,277 2,433,277
USD 32,498,232 HUF 6,085,714,000 7/10/2011 304,547 304,547
USD 5,031,745 MXN 60,251,625 7/10/2011 181,280 181,280
USD 30,857,214 ZAR 213,910,848 7/10/2011 528,353 528,353
ZAR 219,363,400 USD 31,092,706 7/10/2011 9,233 9,233
AUD 18,290,000 USD 18,693,081 18/10/2011 767,059 767,059
EUR 9,762,000 USD 13,875,414 26/10/2011 213,527 213,527
CNY 172,479,125 USD 26,845,000 9/11/2011 315,681 315,681
RUB 196,314,450 USD 6,540,000 9/11/2011 197,899 197,899
USD 15,025,000 TWD 435,829,000 9/11/2011 (89,618) (89,618)
CNY 54,743,040 USD 8,640,000 15/12/2011 (4,758) (4,758)
Net unrealised profit 3,427,940 3,427,940
EUR Hedged Share Class EUR
EUR 299,978,967 USD 425,484,814 14/9/2011 5,308,553 7,666,888
USD 33,365,647 EUR 23,126,488 14/9/2011 (19,038) (27,496)
Net unrealised profit 5,289,515 7,639,392
JPY Hedged Share Class JPY
JPY 1,578,617,526 USD 20,346,995 14/9/2011 18,556,490 241,999
USD 405,057 JPY 31,211,317 14/9/2011 (154,476) (2,015)
Net unrealised profit 18,402,014 239,984
Total net unrealised profit 11,307,316
Note: The net unrealised profit attributed to these transactions is included in the Statement
of Net Assets (see Note 2c).)

(1) New Fund launched, see Note 1, for further details.
Audited Annual Report and Accounts 71
The notes on pages 261 to 270 form an integral part of these financial statements.
Emerging Markets Equity Income Fund(1)
FUNDS
Ireland 25,117 Institutional Cash Series Plc - Institutional
US Dollar Liquidity Fund 25,117 0.80
Total Funds 25,117 0.80
COMMON / PREFERRED STOCKS (SHARES) & WARRANTS
Brazil 3,200 AES Tiete SA (Unit) (Pref) 45,001 1.44
8,318 BM&F - Bovespa 48,980 1.56
2,278 CCR SA 66,667 2.13
1,915 Cia de Bebidas das Americas ADR 67,063 2.14
1,764 Cia Energetica de Minas Gerais (Pref) 32,684 1.04
6,480 Itau Unibanco Holding SA ADR 117,871 3.77
2,854 Natura Cosmeticos SA 68,588 2.19
6,931 PDG Realty SA Empreendimentos e
Participacoes 33,654 1.08
4,289 Vale SA ADR 'B' 110,529 3.53
591,037 18.88
Cayman Islands 20,000 Anta Sports Products Ltd 27,254 0.87
116,000 Bosideng International Holdings Ltd 28,727 0.92
3,500 Hengan International Group Co Ltd 29,865 0.95
20,000 Intime Department Store Group Co Ltd 31,565 1.01
117,411 3.75
Chile 336,396 Banco de Chile 47,316 1.51
11,814 E.CL SA 31,628 1.01
6,129 ENTEL Chile SA 128,913 4.12
207,857 6.64
China 156,000 Bank of China Ltd 'H' 64,454 2.06
70,000 China Petroleum & Chemical Corp 'H' 69,071 2.20
34,000 Jiangsu Expressway Co Ltd 'H' 28,401 0.91
161,926 5.17
Czech Republic 26 Komercni Banka AS 5,441 0.17
Hong Kong 14,000 China Merchants Holdings International Co Ltd 41,856 1.34
8,000 China Mobile Ltd 81,094 2.59
48,000 CNOOC Ltd 97,929 3.13
220,879 7.06
India 10,332 ITC Ltd 44,873 1.43
1,013 Oil India Ltd 28,640 0.92
2,890 Tata Motors Ltd 26,964 0.86
8,979 United Phosphorus Ltd 28,370 0.91
128,847 4.12
Indonesia 45,500 Indofood CBP Sukses Makmur TBK PT 28,261 0.91
43,500 Semen Gresik Persero Tbk PT 46,390 1.48
74,651 2.39
Kazakhstan 2,845 KazMunaiGas Exploration Production GDR 48,223 1.54
Malaysia 15,900 Malayan Banking Bhd 46,479 1.48
Mexico 2,668 America Movil SAB de CV ADR 'L' 66,006 2.11
730 Fomento Economico Mexicano SAB
de CV ADR 49,852 1.59
8,392 Grupo Modelo SAB de CV 'C' 49,285 1.58
165,143 5.28
Netherlands 821 Morgan Stanley BV (Wts 13/11/2013
- Qatar Electricity & Water Co) 29,695 0.95
3,081 Morgan Stanley BV (Wts 17/12/2013
- Commerical Bank of Qatar QSC) 68,623 2.19
98,318 3.14
Panama 741 Copa Holdings SA 'A' 50,573 1.62
Philippines 868 Philippine Long Distance Telephone Co ADR 49,736 1.59
Poland 34,281 Polskie Gornictwo Naftowe i Gazownictwo
SA 47,993 1.53
407 Powszechny Zaklad Ubezpieczen SA 50,077 1.60
98,070 3.13
Russian Federation 2,000 Mobile Telesystems OJSC ADR 32,700 1.05
10,498 Sberbank of Russia 30,727 0.98
63,427 2.03
Singapore 28,000 Sakari Resources Ltd 63,562 2.03
South Africa 10,060 African Bank Investments Ltd 49,940 1.60
5,446 Foschini Group Ltd/The 73,350 2.34
459 Kumba Iron Ore Ltd 31,464 1.00
12,728 Life Healthcare Group Holdings Ltd 31,819 1.02
3,340 MTN Group Ltd 67,897 2.17
254,470 8.13
South Korea 1,080 Hyundai Marine & Fire Insurance Co Ltd 34,115 1.09
2,430 Kangwon Land Inc 63,549 2.03
880 Woongjin Coway Co Ltd 32,994 1.05
130,658 4.17
Taiwan 3,000 HTC Corp 78,181 2.50
49,980 Mega Financial Holding Co Ltd 44,192 1.41
22,000 Quanta Computer Inc 44,517 1.42
5,883 Taiwan Semiconductor Manufacturing Co
Ltd ADR 70,655 2.26
237,545 7.59
Portfolio of Investments 31 August 2011
Transferable Securities Admitted to an Official Stock Exchange Listing or Dealt in on Another Regulated Market
Holding Description Value (USD) %
Transferable Securities Admitted to an Official Stock Exchange Listing or Dealt in on Another Regulated Market
Holding Description Value (USD) %

72 BlackRock Global Funds (BGF)
Emerging Markets Equity Income Fund(1) continued
Portfolio of Investments 31 August 2011
Thailand 7,900 Advanced Info Service PCL 29,918 0.96
Turkey 1,014 BIM Birlesik Magazalar AS 32,459 1.04
2,315 Koza Altin Isletmeleri AS 31,664 1.01
64,123 2.05
United Kingdom 1,854 HSBC Bank Plc (ELN 13/8/2014 - Abdullah AL) 45,479 1.45
7,551 HSBC Bank Plc (ELN 3/9/2012 - Saudi
Arab Co) 28,489 0.91
73,968 2.36
United States 1,028 Southern Copper Corp 35,240 1.13
Total Common / Preferred Stocks (Shares)
& Warrants 3,017,502 96.41
Total Transferable Securities Admitted
to an Official Stock Exchange Listing or
Dealt in on Another Regulated Market 3,042,619 97.21
Total Portfolio 3,042,619 97.21
Other Net Assets 87,254 2.79
Total Net Assets (USD) 3,129,873 100.00
Transferable Securities Admitted to an Official Stock Exchange Listing or Dealt in on Another Regulated Market
Holding Description Value (USD) %
Transferable Securities Admitted to an Official Stock Exchange Listing or Dealt in on Another Regulated Market
Holding Description Value (USD) %
Sector Breakdownas at 31 August 2011
% of netassets
Financials 22.73
Telecommunication Services 14.59
Consumer Staples 11.83
Energy 11.35
Consumer Discretionary 10.16
Materials 9.06
Information Technology 6.18
Industrials 6.00
Utilities 3.49
Healthcare 1.02
Investment Funds 0.80
Other Net Assets 2.79
100.00

Audited Annual Report and Accounts 73
The notes on pages 261 to 270 form an integral part of these financial statements.
Emerging Markets Fund
Portfolio of Investments 31 August 2011
FUNDS
Ireland 34,410,044 Institutional Cash Series Plc - Institutional
US Dollar Liquidity Fund 34,410,044 2.77
United Kingdom 17,230,121 Blackrock Frontiers Investment Trust 21,766,827 1.74
Total Funds 56,176,871 4.51
COMMON STOCKS (SHARES) & WARRANTS
Brazil 784,373 CCR SA 22,955,223 1.84
598,741 Cia de Bebidas das Americas ADR 20,967,910 1.69
256,868 Cia Energetica de Minas Gerais ADR 4,852,236 0.39
2,761,049 Itau Unibanco Holding SA ADR 50,223,481 4.04
452,355 Petroleo Brasileiro SA ADR 11,973,837 0.96
2,207,688 Vale SA ADR 'B' 56,892,120 4.57
167,864,807 13.49
Cayman Islands 19,983,000 Evergrande Real Estate Group Ltd * 12,358,908 0.99
2,010,000 Hengan International Group Co Ltd 17,151,025 1.38
6,837,600 Sands China Ltd 21,232,025 1.71
50,741,958 4.08
Chile 5,385,000 E.CL SA 14,416,534 1.16
663,257 ENTEL Chile SA 13,950,501 1.12
28,367,035 2.28
China 16,448,000 Air China Ltd 'H' 16,609,639 1.34
59,705,900 Bank of China Ltd 'H' 24,668,656 1.98
3,994,500 China Shenhua Energy Co Ltd 'H' 18,502,993 1.49
14,042,000 CSR Corp Ltd 'H' 8,144,038 0.65
67,925,326 5.46
Germany 611,578 Deutsche Bank AG (Cert 26/5/2017 - Qatar
Commercial Bank) 13,621,602 1.10
Hong Kong 1,512,000 China Merchants Holdings
International Co Ltd 4,520,434 0.36
2,984,000 China Mobile Ltd 30,248,112 2.43
219,260 China Mobile Ltd ADR 11,180,067 0.90
17,797,000 CNOOC Ltd 36,309,167 2.92
82,257,780 6.61
Hungary 11,180 MOL Hungarian Oil and Gas Plc 1,021,009 0.08
554,306 OTP Bank Plc 12,125,679 0.98
13,146,688 1.06
India 298,600 Infosys Ltd ADR 15,448,071 1.24
Malaysia 6,469,900 Axiata Group Bhd 10,237,342 0.82
3,936,200 Gamuda Bhd 3,932,250 0.32
6,858,200 Malayan Banking Bhd 20,048,150 1.61
8,740,100 Petronas Chemicals Group Bhd 18,224,451 1.46
4,302,000 Sime Darby Bhd 12,676,721 1.02
65,118,914 5.23
Mexico 1,503,896 America Movil SAB de CV ADR 'L' 37,206,387 2.99
207,360 Fomento Economico Mexicano
SAB de CV ADR 14,160,614 1.14
6,570,467 Genomma Lab Internacional
SAB de CV 'B' 13,661,940 1.10
65,028,941 5.23
Netherlands 590,205 JP Morgan Structured Products B.V.
(ELN 8/9/2014 - Larsen & Toubro) 20,621,289 1.66
Panama 291,403 Copa Holdings SA 'A' 19,888,255 1.60
Poland 166,716 Bank Pekao SA 8,610,257 0.69
Russian Federation 3,513,336 Gazprom OAO ADR 43,354,566 3.49
11,914,254 Sberbank of Russia 34,872,200 2.80
78,226,766 6.29
Singapore 5,311,387 Morgan Stanley Asia Products Ltd
(Call Wts 3/7/2014 - ITC) 23,067,911 1.85
7,147,000 Sakari Resources Ltd * 16,224,211 1.30
39,292,122 3.15
South Africa 4,195,373 African Bank Investments Ltd 20,826,568 1.67
243,867 Anglo American Platinum Ltd 20,278,482 1.63
1,200,796 Foschini Group Ltd/The 16,173,153 1.30
1,615,490 MTN Group Ltd 32,840,428 2.64
90,118,631 7.24
South Korea 268,926 Celltrion Inc * 11,721,478 0.94
456,690 CrucialTec Co Ltd 7,405,668 0.60
61,251 Green Cross Corp/South Korea 9,875,026 0.79
41,024 Hyundai Mobis 12,958,792 1.04
13,818 Hyundai Motor Co 2,629,286 0.21
654,880 Kangwon Land Inc 17,126,261 1.38
32,927 LG Chem Ltd 11,681,932 0.94
78,533 Samsung Electronics Co Ltd 54,767,352 4.40
128,165,795 10.30
Switzerland 1,054,864 UBS AG (ELN 18/12/2012 - Glenmark
Pharmaceuticals Ltd) 7,469,949 0.60
Transferable Securities Admitted to an Official Stock Exchange Listing or Dealt in on Another Regulated Market
Holding Description Value (USD) %
Transferable Securities Admitted to an Official Stock Exchange Listing or Dealt in on Another Regulated Market
Holding Description Value (USD) %

* Securities lent, see Note 11, for further details.
74 BlackRock Global Funds (BGF)
Emerging Markets Fund continued
Portfolio of Investments 31 August 2011
Taiwan 18,390,000 Chinatrust Financial Holding Co Ltd 15,024,148 1.21
3,671,000 Chunghwa Telecom Co Ltd 12,641,821 1.02
910,000 HTC Corp 23,714,991 1.90
19,675,800 Mega Financial Holding Co Ltd 17,397,207 1.40
6,718,000 Quanta Computer Inc 13,593,706 1.09
10,088,000 Taiwan Semiconductor Manufacturing Co Ltd 24,133,722 1.94
1,640,726 Taiwan Semiconductor Manufacturing Co Ltd
ADR 19,705,119 1.58
126,210,714 10.14
Thailand 607,300 Banpu PCL 12,806,593 1.03
3,516,300 Kasikornbank PCL 14,959,233 1.20
27,765,826 2.23
Turkey 981,648 Koza Altin Isletmeleri AS* 13,426,457 1.08
United Kingdom 466,435 HSBC Bank Plc (ELN 13/8/2014
- Abdullah AL) 11,441,832 0.92
United States 2,870,051 Citigroup Global Markets Holdings Inc
(Call Wts 24/10/2012 - United
Phosphorus Ltd) 9,068,239 0.73
2,174,154 Citigroup Global Markets Holdings Inc
(Lepo Wts 24/10/2012 - Yes Bank) 13,103,939 1.05
22,172,178 1.78
Total Common / Preferred Stocks (Shares)
& Warrants 1,162,931,193 93.46
Total Transferable Securities Admitted
to an Official Stock Exchange Listing or
Dealt in on Another Regulated Market 1,219,108,064 97.97
Total Portfolio 1,219,108,064 97.97
Other Net Assets 25,260,469 2.03
Total Net Assets (USD) 1,244,368,533 100.00
Transferable Securities Admitted to an Official Stock Exchange Listing or Dealt in on Another Regulated Market
Holding Description Value (USD) %
Transferable Securities Admitted to an Official Stock Exchange Listing or Dealt in on Another Regulated Market
Holding Description Value (USD) %
Sector Breakdownas at 31 August 2011
% of netassets
Financials 26.48
Information Technology 12.75
Telecommunication Services 11.92
Energy 11.27
Materials 9.68
Industrials 7.13
Consumer Discretionary 5.64
Investment Funds 4.51
Consumer Staples 4.21
Healthcare 2.83
Utilities 1.55
Other Net Assets 2.03
100.00

Audited Annual Report and Accounts 75
The notes on pages 261 to 270 form an integral part of these financial statements.
Euro Bond Fund
Portfolio of Investments 31 August 2011
FUNDS
Ireland 39,541,374 Institutional Cash Series Plc - Institutional
Euro Liquidity Fund 39,541,374 3.41
Luxembourg 50,000 Blackrock Strategic Funds - European
Credit Strategies Fund 5,167,500 0.45
Total Funds 44,708,874 3.86
BONDS
Australia EUR 700,000 Australia & New Zealand Banking Group
Ltd 2.625% 16/11/2012* 706,822 0.06
EUR 1,000,000 BHP Billiton Finance Ltd 4.75% 4/4/2012 1,018,310 0.09
EUR 2,800,000 National Australia Bank Ltd 4% 13/7/2020 2,790,886 0.24
EUR 400,000 Telstra Corp Ltd 6% 8/4/2013 426,180 0.04
EUR 1,200,000 Westpac Banking Corp 6.5% 24/6/2013 1,297,110 0.11
6,239,308 0.54
Austria EUR 4,895,000 Austria Government Bond 3.2% 20/2/2017 5,168,851 0.45
EUR 6,125,000 Austria Government Bond 3.65%
20/4/2022 6,532,557 0.56
EUR 2,000,000 UniCredit Bank Austria AG 3% 9/5/2014 2,050,670 0.18
13,752,078 1.19
Belgium EUR 21,050,000 Belgium Government Bond 3.5%
28/6/2017 21,061,051 1.82
EUR 10,155,000 Belgium Government Bond 3.75%
28/9/2020 10,048,931 0.87
EUR 530,000 Ontex IV SA 7.5% 15/4/2018 470,818 0.04
31,580,800 2.73
Canada USD 380,000 Nova Chemicals Corp 6.5% 15/1/2012 264,445 0.02
EUR 3,000,000 Royal Bank of Canada 4.5% 5/11/2012 3,102,285 0.27
3,366,730 0.29
Cayman Islands EUR 900,000 Hutchison Whampoa Finance 09 Ltd 4.75%
14/11/2016 944,563 0.08
EUR 700,000 Thames Water Utilities Cayman Finance
Ltd 6.125% 4/2/2013 739,519 0.07
1,684,082 0.15
Finland EUR 14,000,000 Finland Government Bond 4% 4/7/2025 15,470,980 1.34
EUR 2,315,000 Nordea Bank Finland Plc 2.25%
16/11/2015 2,308,495 0.20
EUR 2,000,000 Nordea Bank Finland Plc 2.5% 2/6/2014 2,033,950 0.17
EUR 2,245,000 Sampo Housing Loan Bank Plc 2.625%
2/12/2015 2,271,670 0.20
22,085,095 1.91
France EUR 2,500,000 Aeroports de Paris 4% 8/7/2021 2,608,337 0.23
EUR 2,200,000 Alstom SA 3.625% 5/10/2018 2,096,523 0.18
EUR 1,900,000 Arkema SA 4% 25/10/2017 1,898,708 0.16
EUR 3,000,000 AXA SA 4.5% 23/1/2015 3,076,245 0.27
EUR 650,000 Banque PSA Finance 3.25% 26/11/2012 650,890 0.06
EUR 3,100,000 BNP Paribas Home Loan Covered Bonds
SFH 3.875% 12/7/2021 3,187,187 0.28
EUR 2,000,000 BNP Paribas Public Sector SCF 3.125%
9/6/2016 2,050,200 0.18
EUR 500,000 BNP Paribas SA 4.875% 17/10/2011
(Perpetual) 356,875 0.03
EUR 550,000 Bouygues SA 6.125% 3/7/2015 615,194 0.05
EUR 1,000,000 BPCE SA FRN 30/7/2014 (Perpetual) 721,670 0.06
EUR 1,000,000 Caisse d'Amortissement de la Dette
Sociale 4% 25/10/2014 1,069,220 0.09
EUR 3,195,000 Caisse d'Amortissement de la Dette
Sociale 4.125% 25/4/2023 3,451,079 0.30
EUR 1,200,000 CNP Assurances FRN 14/9/2040 1,022,700 0.09
EUR 2,200,000 Credit Agricole Home Loan SFH 2.625%
28/1/2014 2,227,159 0.19
EUR 6,000,000 Credit Mutuel - CIC Home Loan SFH
3.375% 18/7/2016 6,169,620 0.53
EUR 1,700,000 Credit Mutuel Arkea Covered Bonds 4.5%
13/4/2021 1,830,543 0.16
EUR 785,000 Crown European Holdings SA 7.125%
15/8/2018 751,637 0.07
EUR 4,045,000 Dexia Credit Local SA 2.625% 21/1/2014 4,087,311 0.35
EUR 2,330,000 Dexia Municipal Agency SA 3.5%
16/9/2016 2,334,893 0.20
EUR 2,950,000 EDF SA 4.5% 12/11/2040 2,755,551 0.24
EUR 350,000 EDF SA 4.625% 11/9/2024 368,407 0.03
EUR 12,335,000 France Government Bond OAT 2.5%
25/10/2020 12,088,485 1.04
EUR 6,630,000 France Government Bond OAT 3.5%
25/4/2020 7,054,983 0.61
EUR 2,985,000 France Government Bond OAT 3.75%
25/10/2019 3,240,292 0.28
EUR 15,390,000 France Government Bond OAT 3.75%
25/4/2021 16,620,431 1.44
EUR 5,055,000 France Government Bond OAT 4%
25/10/2014 5,471,583 0.47
EUR 14,720,000 France Government Bond OAT 4%
25/4/2060 15,461,005 1.34
EUR 1,285,000 France Government Bond OAT 4.25%
25/10/2018 1,442,425 0.12
EUR 2,100,000 France Government Bond OAT 4.25%
25/10/2023 2,344,293 0.20
EUR 2,000,000 France Government Bond OAT 4.75%
25/4/2035 2,345,320 0.20
EUR 2,305,000 France Government Bond OAT 5.5%
25/4/2029 2,893,893 0.25
EUR 3,100,000 France Government Bond OAT 5.75%
25/10/2032 4,070,052 0.35
EUR 2,000,000 France Government Bond OAT 8.5%
25/10/2019 2,874,050 0.25
EUR 2,500,000 France Telecom SA 4.125% 23/1/2019 2,579,075 0.22
USD 2,100,000 France Telecom SA 4.375% 8/7/2014 1,557,583 0.13
EUR 3,500,000 GCE Covered Bonds 2.75% 14/1/2015 3,544,292 0.31
EUR 1,020,000 GDF Suez 2.75% 18/10/2017 1,007,235 0.09
EUR 3,750,000 HSBC Covered Bonds France 3.375%
20/1/2017 3,871,763 0.33
EUR 1,000,000 LVMH Moet Hennessy Louis Vuitton SA
4.375% 12/5/2014 1,057,735 0.09
EUR 2,000,000 RCI Banque SA 8.125% 15/5/2012 2,070,320 0.18
EUR 3,000,000 Societe Financement de l'Economie
Francaise 3.25% 16/1/2014 3,122,850 0.27
EUR 750,000 Unibail-Rodamco SE 4% 29/10/2011 752,715 0.07
138,800,329 11.99
Transferable Securities Admitted to an Official Stock Exchange Listing or Dealt in on Another Regulated Market
Holding Description Value (EUR) %
Transferable Securities Admitted to an Official Stock Exchange Listing or Dealt in on Another Regulated Market
Holding Description Value (EUR) %

76 BlackRock Global Funds (BGF)
Germany EUR 450,000 Bayerische Landesbank FRN 7/2/2019 351,119 0.03
EUR 14,100,000 Bundesobligation 1.75% 9/10/2015 14,447,213 1.25
EUR 13,260,000 Bundesobligation 2.25% 10/4/2015 13,840,258 1.19
EUR 4,515,000 Bundesobligation 4% 11/10/2013 4,827,190 0.42
EUR 5,865,000 Bundesrepublik Deutschland 2.25%
4/9/2020 5,954,559 0.51
EUR 3,750,000 Bundesrepublik Deutschland 2.5%
4/1/2021 3,875,569 0.33
EUR 11,465,000 Bundesrepublik Deutschland 3%
4/7/2020 12,361,276 1.07
EUR 6,385,000 Bundesrepublik Deutschland 4.75%
4/7/2028 ‡ 7,926,562 0.68
EUR 8,905,000 Bundesrepublik Deutschland 4.75%
4/7/2034 11,325,023 0.98
EUR 7,138,000 Bundesrepublik Deutschland 4.75%
4/7/2040 9,432,510 0.81
EUR 9,936,000 Bundesrepublik Deutschland 5.5%
4/1/2031 13,469,440 1.16
EUR 11,215,000 Bundesrepublik Deutschland 5.625%
4/1/2028 15,170,418 1.31
EUR 1,550,000 Bundesrepublik Deutschland 6.25%
4/1/2024 2,162,824 0.19
EUR 417,000 Bundesrepublik Deutschland 6.5%
4/7/2027 610,369 0.05
EUR 2,030,000 Bundesrepublik Deutschland
Bundesobligation Inflation
Linked Bond 2.25% 15/4/2013 2,312,425 0.20
EUR 5,800,000 Commerzbank AG 3.875% 22/3/2017 5,743,537 0.50
EUR 1,000,000 Commerzbank AG 7.75% 16/3/2021 890,990 0.08
EUR 765,000 Daimler AG 4.625% 2/9/2014 812,197 0.07
EUR 3,010,000 Deutsche Bank AG 3.375% 6/4/2018 3,152,764 0.27
EUR 89,729 Driver One GmbH FRN 21/2/2014 89,702 0.01
EUR 3,918,481 Driver One GmbH FRN 21/4/2017 3,916,735 0.34
EUR 5,000,000 Erste Abwicklungsanstalt 3.125%
29/3/2016 5,172,375 0.45
EUR 3,100,000 Eurohypo AG 2.75% 26/5/2014 3,157,071 0.27
EUR 2,500,000 FMS Wertmanagement 1.875% 24/8/2015 2,500,875 0.22
EUR 11,400,000 FMS Wertmanagement 2.25% 14/7/2014 11,616,315 1.00
EUR 5,000,000 FMS Wertmanagement 2.75% 3/6/2016 5,139,875 0.44
EUR 9,500,000 FMS Wertmanagement 3.375% 17/6/2021 9,807,325 0.85
EUR 1,375,000 Free State of Bavaria 2.375% 8/9/2020 1,333,406 0.11
EUR 2,650,000 Gemeinsame Deutsche Bundeslaender 3%
17/5/2016 2,754,118 0.24
EUR 1,500,000 HSE Netz AG 6.125% 23/4/2041 1,568,812 0.14
EUR 10,000,000 Kreditanstalt fuer Wiederaufbau 2.625%
16/8/2019 10,025,550 0.87
EUR 5,447,000 Kreditanstalt fuer Wiederaufbau 3.125%
8/4/2016 5,734,901 0.50
EUR 6,000,000 Kreditanstalt fuer Wiederaufbau 3.125%
15/6/2018 6,262,200 0.54
EUR 10,770,000 Kreditanstalt fuer Wiederaufbau 3.375%
18/1/2021 11,313,346 0.98
EUR 725,000 Kreditanstalt fuer Wiederaufbau 3.875%
21/1/2019 790,018 0.07
EUR 3,220,000 Kreditanstalt fuer Wiederaufbau 4.125%
4/7/2017 3,552,948 0.31
EUR 635,000 Merck Financial Services GmbH 2.125%
26/3/2012 636,607 0.05
EUR 3,625,000 NRW.BANK 3.375% 18/3/2014 3,779,425 0.33
EUR 1,090,000 UPC Germany GmbH 8.125% 1/12/2017 1,101,380 0.09
EUR 500,000 Volkswagen Leasing GmbH 2.75%
13/7/2015 500,180 0.04
219,419,407 18.95
Greece EUR 9,635,000 Hellenic Republic Government Bond 3.6%
20/7/2016 4,797,218 0.41
EUR 1,424,000 Hellenic Republic Government Bond 5.25%
18/5/2012 1,020,296 0.09
5,817,514 0.50
Guernsey EUR 960,000 ABB International Finance Ltd 6.5%
30/11/2011 970,920 0.08
Hungary EUR 1,430,000 Hungary Government International Bond
6% 11/1/2019 1,412,125 0.12
India USD 1,365,000 Bank of India 6.25% 16/2/2021 972,889 0.08
International EUR 800,000 European Investment Bank 2.875%
15/7/2016 827,240 0.07
EUR 2,000,000 European Investment Bank 3.125%
15/4/2014 2,085,130 0.18
EUR 2,000,000 European Investment Bank 3.125%
15/10/2015 2,097,050 0.18
EUR 3,225,000 European Investment Bank 3.5%
15/4/2016 3,426,079 0.30
EUR 1,000,000 European Investment Bank 3.625%
15/10/2013 1,047,600 0.09
9,483,099 0.82
Ireland EUR 1,080,000 Ardagh Packaging Finance Plc 7.375%
15/10/2017 1,004,405 0.09
EUR 500,000 Caterpillar International Finance Ltd 2.75%
6/6/2014 509,930 0.05
EUR 6,200,000 EBS Ltd 4% 25/2/2015 4,517,909 0.39
EUR 950,000 GE Capital European Funding 3.75%
4/4/2016 953,211 0.08
EUR 1,050,000 GE Capital European Funding 5.375%
23/1/2020 1,116,066 0.10
USD 3,600,000 Governor & Co of the Bank of Ireland/The
'144A' 2.75% 2/3/2012 2,349,152 0.20
EUR 1,500,000 Governor & Co of the Bank of Ireland/The
4% 28/1/2015 1,148,940 0.10
EUR 1,800,000 Ireland Government Bond 4.5% 18/4/2020 1,405,215 0.12
EUR 4,135,000 Ireland Government Bond 4.6% 18/4/2016 3,659,640 0.32
EUR 5,540,000 Ireland Government Bond 5% 18/10/2020 4,372,860 0.38
EUR 1,800,000 Ireland Government Bond 5.9%
18/10/2019 1,542,681 0.13
EUR 835,000 Smurfit Kappa Acquisitions 7.25%
15/11/2017 796,206 0.07
EUR 250,000 Smurfit Kappa Acquisitions 7.75%
15/11/2019 238,933 0.02
EUR 4,467,090 Talisman Finance Plc '7A' FRN 22/4/2017 3,517,833 0.30
EUR 1,431,270 Talisman Finance Plc '7H' FRN 22/4/2017 143,127 0.01
27,276,108 2.36
Italy EUR 1,160,915 Asset-Backed European Securitisation
Transaction Srl FRN 21/9/2020 1,162,149 0.10
EUR 950,000 Assicurazioni Generali SpA 5.125%
16/9/2024 908,737 0.08
Portfolio of Investments 31 August 2011
Euro Bond Fund continued
Transferable Securities Admitted to an Official Stock Exchange Listing or Dealt in on Another Regulated Market
Holding Description Value (EUR) %
Transferable Securities Admitted to an Official Stock Exchange Listing or Dealt in on Another Regulated Market
Holding Description Value (EUR) %

Audited Annual Report and Accounts 77
The notes on pages 261 to 270 form an integral part of these financial statements.
EUR 4,000,000 Cassa Depositi e Prestiti SpA 3.75%
31/1/2012 4,015,200 0.35
GBP 2,000,000 Intesa Sanpaolo SpA FRN 12/11/2017 2,134,768 0.18
EUR 900,000 Intesa Sanpaolo SpA FRN 1/6/2016
(Perpetual) 756,000 0.06
EUR 2,000,000 Intesa Sanpaolo SpA 3.25% 1/2/2013 1,965,090 0.17
EUR 2,000,000 Intesa Sanpaolo SpA 4% 8/11/2018 1,812,520 0.16
EUR 3,182,000 Intesa Sanpaolo SpA 4.375% 16/8/2016 3,192,755 0.27
EUR 4,715,000 Italy Buoni Poliennali Del Tesoro 2.1%
15/9/2016 4,595,798 0.40
EUR 7,000,000 Italy Buoni Poliennali Del Tesoro 2.1%
15/9/2021 6,205,147 0.54
EUR 18,825,000 Italy Buoni Poliennali Del Tesoro 2.25%
1/11/2013 18,292,347 1.58
EUR 15,185,000 Italy Buoni Poliennali Del Tesoro 3%
1/4/2014 14,896,485 1.29
EUR 2,025,000 Italy Buoni Poliennali Del Tesoro 3%
15/4/2015 1,955,421 0.17
EUR 495,000 Italy Buoni Poliennali Del Tesoro 3.75%
15/12/2013 496,059 0.04
EUR 22,593,000 Italy Buoni Poliennali Del Tesoro 3.75%
15/4/2016 22,124,082 1.91
EUR 6,375,000 Italy Buoni Poliennali Del Tesoro 4.25%
1/2/2015 6,429,697 0.55
EUR 1,000,000 Italy Buoni Poliennali Del Tesoro 4.5%
1/2/2018 998,220 0.09
EUR 28,390,000 Italy Buoni Poliennali Del Tesoro 5%
1/3/2022 27,877,844 2.41
EUR 36,394,000 Italy Buoni Poliennali Del Tesoro 5%
1/9/2040 31,050,997 2.68
150,869,316 13.03
Jersey EUR 400,000 HSBC Capital Funding LP/Jersey Channel
Islands FRN 30/6/2012 (Perpetual) 405,072 0.03
Luxembourg EUR 4,470,000 Clariant Finance Luxembourg SA 4.375%
5/4/2013 4,516,980 0.39
EUR 140,000 Fiat Finance & Trade SA 9% 30/7/2012 144,479 0.01
EUR 2,500,000 ITW Finance Europe SA 5.25% 1/10/2014 2,745,437 0.24
EUR 3,940,000 Luxembourg Government Bond 3.375%
18/5/2020 4,196,947 0.36
11,603,843 1.00
Netherlands EUR 5,900,000 ABN Amro Bank NV 3.5% 12/1/2018 6,052,397 0.52
EUR 2,500,000 ABN Amro Bank NV 3.625% 6/10/2017 2,433,600 0.21
EUR 1,500,000 Achmea Hypotheekbank NV 4.25%
26/2/2014 1,567,770 0.14
EUR 900,000 Alliander Nv 4% 20/4/2012 913,410 0.08
EUR 800,000 Allianz Finance II BV FRN 17/2/2017
(Perpetual) 634,800 0.05
EUR 1,000,000 Allianz Finance II BV FRN 31/5/2022 989,030 0.09
EUR 5,800,000 Allianz Finance II BV FRN 8/7/2041 4,929,855 0.43
EUR 1,000,000 Bank Nederlandse Gemeenten 4%
15/7/2014 1,064,615 0.09
EUR 558,000 BMW Finance NV 3.625% 29/1/2018 570,602 0.05
EUR 2,600,000 Bumper 2 SA '2011-4 A' FRN 20/5/2026 2,598,497 0.22
EUR 1,600,000 Cooperatieve Centrale Raiffeisen-
Boerenleenbank BA/Netherlands
3.875% 20/4/2016 1,669,552 0.14
EUR 1,125,000 Cooperatieve Centrale Raiffeisen-
Boerenleenbank BA/Netherlands
4.125% 14/1/2020 1,172,109 0.10
EUR 500,000 Daimler International Finance BV 5.875%
8/9/2011 500,183 0.04
EUR 150,000 Deutsche Bahn Finance BV 4.375%
23/9/2021 166,288 0.01
EUR 2,000,000 Deutsche Telekom International Finance
BV 4.25% 13/7/2022 1,997,710 0.17
EUR 370,000 Enbw International Finance BV 6.125%
7/7/2039 410,620 0.04
EUR 2,723,000 Fortis Bank Nederland NV 3.375%
19/5/2014 2,856,727 0.25
EUR 500,000 Generali Finance BV FRN 16/6/2016
(Perpetual) 369,062 0.03
EUR 1,639,977 Globaldrive BV '2008-2 A' 4% 20/10/2016 1,657,123 0.14
EUR 1,050,000 Heineken NV 4.625% 10/10/2016 1,114,533 0.10
EUR 900,000 Heineken NV 5% 4/11/2013 950,418 0.08
USD 4,500,000 ING Bank NV FRN 23/5/2016 2,866,730 0.25
EUR 600,000 ING Bank NV FRN 29/5/2023 592,497 0.05
EUR 1,000,000 ING Bank NV 2.25% 23/9/2013 997,510 0.09
EUR 6,240,000 ING Bank NV 3.25% 3/3/2016 6,418,714 0.55
EUR 2,200,000 ING Bank NV 3.625% 31/8/2021 2,200,110 0.19
EUR 838,000 Koninklijke KPN NV 5% 13/11/2012 866,207 0.07
EUR 500,000 Koninklijke KPN NV 5.625% 30/9/2024 540,705 0.05
EUR 1,000,000 Lanxess Finance BV 4.125% 23/5/2018 992,350 0.09
EUR 2,940,000 LeasePlan Corp NV 3.25% 22/5/2014 3,073,270 0.27
USD 5,640,000 MDC-GMTN B.V. 3.75% 20/4/2016 4,076,261 0.35
EUR 2,500,000 Nederlandse Waterschapsbank NV 2.375%
4/6/2015 2,541,125 0.22
EUR 1,000,000 Nederlandse Waterschapsbank NV 4%
12/3/2013 1,039,360 0.09
EUR 3,425,000 Netherlands Government Bond 2.75%
15/1/2015 3,590,890 0.31
EUR 22,000,000 Netherlands Government Bond 3.25%
15/7/2015 23,514,480 2.03
EUR 9,710,000 Netherlands Government Bond 3.75%
15/7/2014 10,439,027 0.90
EUR 34,500,000 Netherlands Government Bond 4%
15/7/2018 38,567,723 3.33
EUR 1,500,000 Netherlands Government Bond 4%
15/1/2037 1,715,168 0.15
EUR 1,580,000 New World Resources NV 7.875%
1/5/2018 1,518,348 0.13
EUR 451,000 RWE Finance BV 5% 10/2/2015 487,012 0.04
EUR 367,000 RWE Finance BV 6.5% 10/8/2021 449,124 0.04
EUR 500,000 Schlumberger Finance BV 4.5% 25/3/2014 530,260 0.05
EUR 750,000 Siemens Financieringsmaatschappij NV
FRN 14/9/2066 765,270 0.07
EUR 225,000 Siemens Financieringsmaatschappij NV
5.25% 12/12/2011 227,247 0.02
USD 1,100,000 Siemens Financieringsmaatschappij NV
'144A' 5.75% 17/10/2016 897,082 0.08
EUR 1,407,450 Storm BV '2010-1 A1' FRN 22/3/2052 1,399,748 0.12
EUR 2,700,000 Urenco Finance NV 5.375% 22/5/2015 2,939,166 0.25
EUR 1,000,000 Volkswagen International Finance NV
5.625% 9/2/2012 1,016,085 0.09
148,880,370 12.86
Norway EUR 7,270,000 DnB NOR Bank ASA 4.375% 24/2/2021 7,364,583 0.64
EUR 1,605,000 DnB NOR Boligkreditt 2.625% 11/1/2016 1,624,677 0.14
EUR 2,100,000 Sparebanken Vest Boligkreditt AS 3.125%
8/2/2016 2,161,341 0.19
EUR 550,000 Statkraft AS 5.5% 2/4/2015 607,921 0.05
EUR 1,885,000 Terra Boligkreditt AS 2.125% 31/8/2015 1,869,307 0.16
13,627,829 1.18
Portfolio of Investments 31 August 2011
Euro Bond Fund continued
Transferable Securities Admitted to an Official Stock Exchange Listing or Dealt in on Another Regulated Market
Holding Description Value (EUR) %
Transferable Securities Admitted to an Official Stock Exchange Listing or Dealt in on Another Regulated Market
Holding Description Value (EUR) %

78 BlackRock Global Funds (BGF)
Poland PLN 67,000,000 Poland Government Bond 5.25%
25/10/2020 15,807,941 1.37
EUR 2,068,000 Poland Government International Bond
5.875% 3/2/2014 2,228,250 0.19
EUR 1,965,000 Republic of Poland 5.625% 20/6/2018 2,130,119 0.18
20,166,310 1.74
Portugal EUR 1,500,000 Portugal Obrigacoes do Tesouro OT 3.35%
15/10/2015 1,140,098 0.10
EUR 2,500,000 Portugal Obrigacoes do Tesouro OT 5%
15/6/2012 2,366,750 0.20
EUR 2,700,000 Portugal Obrigacoes do Tesouro OT 6.4%
15/2/2016 2,225,272 0.19
5,732,120 0.49
Slovenia EUR 7,190,000 Slovenia Government Bond 5.125%
30/3/2026 6,977,176 0.60
Spain EUR 800,000 Ayt Cedulas Cajas Global 4% 21/3/2017 699,112 0.06
EUR 800,000 Ayt Cedulas Cajas Global 4.25% 29/7/2014 766,960 0.07
EUR 1,900,000 Banco Bilbao Vizcaya Argentaria SA 3.75%
4/10/2013 1,902,062 0.16
EUR 1,850,000 Banco Bilbao Vizcaya Argentaria SA
4.125% 13/1/2014 1,859,657 0.16
EUR 6,950,000 Banco Bilbao Vizcaya Argentaria SA 4.25%
30/3/2015 6,961,537 0.60
EUR 2,200,000 Banco Espanol de Credito SA 3.625%
7/9/2015 2,132,020 0.18
EUR 4,600,000 Banco Santander SA 3.125% 28/1/2015 * 4,459,907 0.38
EUR 1,100,000 Banco Santander SA 3.875% 27/5/2014 1,098,977 0.09
EUR 2,300,000 Banco Santander SA 4.375% 16/3/2015 2,318,400 0.20
EUR 1,900,000 Banco Santander SA 4.625% 20/1/2016 1,918,468 0.17
EUR 1,000,000 Bankia SAU 4.25% 25/5/2018 890,495 0.08
EUR 4,200,000 CaixaBank 5% 22/2/2016 4,210,311 0.36
EUR 3,100,000 Caja de Ahorros de Asturias 3.5%
8/10/2013 3,041,565 0.26
EUR 1,700,000 Caja de Ahorros y Monte de Piedad de
Gipuzkoa y San Sebastian 5.125%
8/4/2015 1,714,816 0.15
EUR 3,400,000 Cedulas TDA 6 Fondo de Titulizacion de
Activos 4.25% 10/4/2031 2,048,262 0.18
EUR 4,000,000 FADE - Fondo de Amortizacion del Deficit
Electrico 5% 17/6/2015 4,061,960 0.35
EUR 2,400,000 Fund for Ordered Bank Restructuring 5.5%
12/7/2016 2,447,880 0.21
EUR 900,000 Iberdrola Finanzas SAU 3.5% 22/6/2015 878,904 0.08
EUR 600,000 Iberdrola Finanzas SAU 3.875% 10/2/2014 601,521 0.05
EUR 4,600,000 Instituto de Credito Oficial 5% 5/7/2016 4,606,831 0.40
EUR 2,555,000 Instituto de Credito Oficial 5.125%
25/1/2016 2,589,135 0.22
EUR 800,000 Santander International Debt SA
Unipersonal 3.5% 10/3/2015 758,544 0.07
EUR 1,500,000 Spain Government Bond 3.25% 30/4/2016 1,438,492 0.12
EUR 1,855,000 Spain Government Bond 3.4% 30/4/2014 1,840,846 0.16
EUR 9,725,000 Spain Government Bond 4.2% 31/1/2037 7,612,438 0.66
EUR 3,500,000 Spain Government Bond 4.3% 31/10/2019 3,392,375 0.29
EUR 5,650,000 Spain Government Bond 4.7% 30/7/2041 4,712,411 0.41
EUR 5,575,000 Spain Government Bond 4.85%
31/10/2020 5,551,947 0.48
EUR 1,100,000 Spain Government Bond 5.5% 30/7/2017 1,159,461 0.10
EUR 6,411,000 Spain Government Bond 5.5% 30/4/2021 6,633,558 0.57
EUR 2,445,000 Spain Government Bond 5.75%
30/7/2032 2,413,154 0.21
EUR 5,750,000 Spain Government Bond 5.9% 30/7/2026 5,867,041 0.51
EUR 2,300,000 Telefonica Emisiones SAU 4.75%
7/2/2017 2,296,642 0.20
94,885,689 8.19
Sweden EUR 3,700,000 Lansforsakringar Hypotek AB 2.625%
16/6/2014 3,768,728 0.33
EUR 4,295,000 Lansforsakringar Hypotek AB 2.875%
23/3/2015 4,388,631 0.38
EUR 4,000,000 Nordea Bank AB 4% 29/6/2020 4,058,240 0.35
EUR 3,500,000 Svensk Exportkredit AB 3.625%
27/5/2014 3,678,902 0.32
EUR 2,000,000 Svenska Handelsbanken AB 3%
20/8/2012 2,022,100 0.17
17,916,601 1.55
Switzerland EUR 850,000 Credit Suisse AG/London 3.875%
25/1/2017 847,654 0.07
EUR 3,750,000 Credit Suisse AG/London 4.75% 5/8/2019 3,851,606 0.33
EUR 500,000 UBS AG/London 4.625% 6/7/2012 510,693 0.05
EUR 1,000,000 UBS AG/London 5.625% 19/5/2014 1,071,470 0.09
6,281,423 0.54
United Kingdom EUR 1,100,000 Abbey National Treasury Services Plc/
London 3.375% 8/6/2015 1,113,024 0.10
GBP 1,600,000 Abbey National Treasury Services Plc/
London 5.125% 14/4/2021 1,929,838 0.17
EUR 575,000 Anglian Water Services Financing Plc
4.625% 7/10/2013 605,116 0.05
EUR 300,000 Aviva Plc FRN 22/5/2038 289,500 0.02
EUR 759,000 Barclays Bank Plc 4.125% 15/3/2016 761,953 0.07
EUR 2,100,000 Barclays Bank Plc 6.625% 30/3/2022 1,830,066 0.16
EUR 3,900,000 BAT International Finance Plc 5.875%
12/3/2015 4,333,816 0.37
EUR 1,750,000 BG Energy Capital Plc 3.625% 16/7/2019 1,798,720 0.15
GBP 1,200,000 Coventry Building Society 4.625%
19/4/2018 1,411,539 0.12
GBP 900,000 Eastern Power Networks Plc 6.25%
12/11/2036 1,116,947 0.10
USD 4,361,217 Eurosail Plc '2007-3A A2B' '144A' FRN
13/6/2045 2,310,231 0.20
GBP 5,000,000 Fosse Master Issuer Plc '2011-1X A6' FRN
18/10/2054 5,636,241 0.49
EUR 1,000,000 GlaxoSmithKline Capital Plc 3.875%
6/7/2015 1,056,725 0.09
EUR 2,500,000 GlaxoSmithKline Capital Plc 5.125%
13/12/2012 2,602,525 0.22
EUR 1,495,453 Gosforth Funding Plc '2011-1 A1B' FRN
24/4/2047 1,495,350 0.13
EUR 1,000,000 HSBC Bank Plc 3.125% 15/11/2017 983,905 0.08
EUR 2,500,000 HSBC Holdings Plc 6% 10/6/2019 2,582,550 0.22
EUR 2,350,000 Legal & General Group Plc FRN 8/6/2025 2,066,566 0.18
EUR 500,000 Lloyds TSB Bank Plc FRN 5/3/2018 460,193 0.04
EUR 1,000,000 Lloyds TSB Bank Plc 4% 29/9/2020 999,820 0.09
EUR 500,000 Lloyds TSB Bank Plc 6.5% 24/3/2020 415,500 0.04
EUR 2,600,000 Nationwide Building Society 4.625%
8/2/2021 2,766,036 0.24
GBP 1,300,000 Old Mutual Plc 7.125% 19/10/2016 1,610,968 0.14
EUR 1,623,338 Paragon Mortgages Plc FRN 15/4/2044 1,214,135 0.10
Portfolio of Investments 31 August 2011
Euro Bond Fund continued
Transferable Securities Admitted to an Official Stock Exchange Listing or Dealt in on Another Regulated Market
Holding Description Value (EUR) %
Transferable Securities Admitted to an Official Stock Exchange Listing or Dealt in on Another Regulated Market
Holding Description Value (EUR) %

* Securities lent, see Note 11, for further details.‡ Securities given in guarantee, see Note 12, for further details.
Audited Annual Report and Accounts 79
The notes on pages 261 to 270 form an integral part of these financial statements.
EUR 5,450,000 Permanent Master Issuer Plc '2009-1 A3'
FRN 15/7/2042 5,475,975 0.47
GBP 200,000 Priory Group No 3 Plc 7% 15/2/2018 208,542 0.02
EUR 445,903 Reds EHP Trust '2008-1E A2E' FRN
14/4/2014 439,094 0.04
EUR 1,081,000 Royal Bank of Scotland Plc/The 3.625%
17/5/2013 1,074,173 0.09
EUR 860,000 Royal Bank of Scotland Plc/The 4%
15/3/2016 890,599 0.08
EUR 1,240,000 Royal Bank of Scotland Plc/The 4.75%
18/5/2016 1,186,872 0.10
EUR 1,000,000 Tesco Plc 5.625% 12/9/2012 1,037,265 0.09
GBP 4,747,304 Titan Europe Plc/Ireland '2006-4FSX A1'
FRN 3/9/2014 5,016,875 0.43
GBP 2,521,486 Turbo Finance '2011-1 A' FRN 20/1/2019 2,852,396 0.25
GBP 2,910,000 United Kingdom Gilt 4% 22/1/2060 3,398,585 0.29
GBP 2,250,000 Virgin Media Secured Finance Plc 5.5%
15/1/2021 2,508,526 0.22
GBP 754,000 Virgin Media Secured Finance Plc 7%
15/1/2018 891,053 0.08
EUR 300,000 Vodafone Group Plc 4.65% 20/1/2022 322,704 0.03
EUR 1,500,000 Vodafone Group Plc 6.25% 15/1/2016 1,723,290 0.15
EUR 1,500,000 Vodafone Group Plc 6.875% 4/12/2013 1,661,603 0.14
GBP 1,000,000 Western Power Distribution West Midlands
Plc 5.75% 16/4/2032 1,170,804 0.10
71,249,620 6.15
United States EUR 1,350,000 Ahold Finance USA LLC 5.875%
14/3/2012 1,375,866 0.12
EUR 950,000 American International Group Inc FRN
15/3/2067 678,856 0.06
EUR 3,130,000 BA Covered Bond Issuer 4.25% 5/4/2017 3,229,393 0.28
USD 1,400,000 BAE Systems Holdings Inc '144A' 4.95%
1/6/2014 1,048,235 0.09
EUR 50,000 Bank of America Corp 4.625% 7/8/2017 47,008 0.00
USD 2,400,000 Bank of America Corp 6.5% 1/8/2016 1,781,967 0.15
EUR 650,000 Cargill Inc 6.25% 24/7/2015 739,453 0.06
EUR 1,650,000 Cellco Partnership / Verizon Wireless
Capital LLC 7.625% 19/12/2011 1,678,693 0.15
EUR 300,000 Citigroup Inc 3.95% 10/10/2013 299,800 0.03
USD 875,000 Enterprise Products Operating LLC 4.6%
1/8/2012 626,006 0.05
EUR 150,000 Goldman Sachs Group Inc/The 3.75%
4/2/2013 149,325 0.01
EUR 1,000,000 Goldman Sachs Group Inc/The 4.375%
16/3/2017 959,510 0.08
EUR 100,000 Goldman Sachs Group Inc/The 5.375%
15/2/2013 101,619 0.01
USD 3,360,000 International Paper Co 7.5% 15/8/2021 2,757,830 0.24
USD 936,866 JP Morgan Mortgage Trust '2007-S1 2A22'
5.75% 25/3/2037 564,477 0.05
USD 533,849 JP Morgan Mortgage Trust '2006-S3 1A12'
6.5% 25/8/2036 343,485 0.03
EUR 2,000,000 JPMorgan Chase & Co 3.875% 23/9/2020 1,908,640 0.17
USD 2,000,000 Kraft Foods Inc 6.125% 23/8/2018 1,648,653 0.14
EUR 3,000,000 Metropolitan Life Global Funding I 4.625%
16/5/2017 3,166,095 0.27
EUR 1,400,000 Morgan Stanley 3.75% 1/3/2013 1,389,934 0.12
USD 1,000,000 Novartis Capital Corp 1.9% 24/4/2013 708,852 0.06
EUR 1,400,000 Pfizer Inc 3.625% 3/6/2013 1,444,065 0.13
EUR 1,500,000 Philip Morris International Inc 5.875%
4/9/2015 1,698,405 0.15
EUR 1,500,000 SLM Student Loan Trust 2003-10 FRN
15/12/2027 1,373,420 0.12
USD 6,050,000 Time Warner Cable Inc 3.5% 1/2/2015 4,408,942 0.38
USD 2,000,000 Verizon Communications Inc 8.75%
1/11/2018 1,878,525 0.16
USD 197,852 Wells Fargo Mortgage Backed Securities
Trust '2007-10 1A21' 6% 25/7/2037 134,781 0.01
EUR 2,950,000 WM Covered Bond Program 4%
27/9/2016 3,072,632 0.27
39,214,467 3.39
Total Bonds 1,070,670,320 92.46
Total Transferable Securities Admitted
to an Official Stock Exchange Listing or
Dealt in on Another Regulated Market 1,115,379,194 96.32
Unquoted Securities
BONDS
Bahrain USD 3,800,000 Golden Belt 1 Sukuk Co BSC (Defaulted)
FRN 15/5/2012 466,976 0.04
Iceland USD 2,500,000 Glitnir Banki HF (Defaulted) 6.375%
25/9/2012 – 0.00
Total Bonds 466,976 0.04
Total Unquoted Securities 466,976 0.04
Total Portfolio 1,115,846,170 96.36
Other Net Assets 42,168,604 3.64
Total Net Assets (EUR) 1,158,014,774 100.00
Portfolio of Investments 31 August 2011
Euro Bond Fund continued
Transferable Securities Admitted to an Official Stock Exchange Listing or Dealt in on Another Regulated Market
Holding Description Value (EUR) %
Transferable Securities Admitted to an Official Stock Exchange Listing or Dealt in on Another Regulated Market
Holding Description Value (EUR) %

80 BlackRock Global Funds (BGF)
Euro Bond Fund continued
Nominal Value Description
Unrealisedprofit/(loss)
EUR
Nominal Value Description
Unrealisedprofit/(loss)
EUR
Swaps as at 31 August 2011
MYR 54,245,000 Interest Rate Swaps (Citibank) (Fund receives Fixed
3.495%; and pays Floating MYR KLIB3M 3 Month)
(22/3/2013) 47,507
HUF 5,417,660,000 Interest Rate Swaps (Barclays) (Fund receives Floating
HUF BUBOR 6 Month; and pays Fixed 6.39%)
(19/5/2013) (158,024)
PLN 77,305,000 Interest Rate Swaps (Barclays) (Fund receives Fixed
5.18%; and pays Floating PLN WIBOR 6 Month)
(19/5/2013) 190,681
EUR (500,000) Credit Default Swaps (Deutsche Bank) (Fund provides
default protection on iTraxx Europe Series 9;
and receives Fixed 1.65%) (20/6/2013) (7,807)
EUR 500,000 Credit Default Swaps (Barclays) (Fund receives default
protection on iTraxx Europe Sub Financials S9; and
pays Fixed 1.65%) (20/6/2013) 1,834
CNY 410,000,000 Interest Rate Swaps (Morgan Stanley) (Fund receives
Fixed 3.83%; and pays Floating CNY CNRR 28 Days)
(30/6/2013) (311,676)
CNY 246,990,000 Interest Rate Swaps (HSBC) (Fund receives Fixed 3.86%;
and pays Floating CNY CNRR 28 Days) (15/7/2013) (174,442)
ZAR 124,340,000 Interest Rate Swaps (Deutsche Bank) (Fund receives
Floating ZAR JIBOR 3 Month; and pays Fixed 8.02%)
(6/2/2014) (541,442)
ZAR 186,510,000 Interest Rate Swaps (Barclays) (Fund receives
Floating ZAR JIBAR 3 Month; and pays Fixed 7.95%)
(7/2/2014) (788,092)
EUR 2,750,000 Credit Default Swaps (Goldman Sachs) (Fund receives
default protection on Banco Bilbao Vizcaya Argentaria
SA 4% 22/4/2013; and pays Fixed 1%) (20/6/2014) 106,604
EUR (2,750,000) Credit Default Swaps (Deutsche Bank) (Fund provides
default protection on BBVA Senior Finance SA
Unipersonal 4.875% 23/1/2014; and receives Fixed
1%) (20/6/2015) (61,372)
USD (10,000,000) Credit Default Swaps (Barclays) (Fund provides default
protection on Republic of Italy 6.875% 27/9/2023;
and receives Fixed 1%) (20/6/2015) (194,802)
EUR 4,000,000 Credit Default Swaps (Morgan Stanley) (Fund receives
default protection on Akzo Nobel Sweden Finance AB
7.75% 31/1/2014; and pays Fixed 1%) (20/6/2015) 66,711
USD 902,000 Credit Default Swaps (Citibank) (Fund receives default
protection on Hellenic Republic Government Bond
5.9% 22/10/2022; and pays Fixed 1%) (20/3/2016) 129,182
USD 1,800,000 Credit Default Swaps (Goldman Sachs) (Fund receives
default protection on Hellenic Republic Government
Bond 5.9% 22/10/2022; and pays Fixed 1%)
(20/3/2016) 284,046
USD 1,806,000 Credit Default Swaps (Morgan Stanley) (Fund receives
default protection on Hellenic Republic Government
Bond 5.9% 22/10/2022; and pays Fixed 1%)
(20/3/2016) 285,611
USD 1,806,000 Credit Default Swaps (Deutsche Bank) (Fund receives
default protection on Hellenic Republic Government
Bond 5.9% 22/10/2022; and pays Fixed 1%)
(20/3/2016) 278,117
USD 2,107,000 Credit Default Swaps (Barclays) (Fund receives default
protection on Hellenic Republic Government Bond
5.9% 22/10/2022; and pays Fixed 1%) (20/3/2016) 301,781
USD 2,100,000 Credit Default Swaps (Goldman Sachs) (Fund receives
default protection on Hellenic Republic Government
Bond 5.9% 22/10/2022; and pays Fixed 1%)
(20/3/2016) 304,119
MYR 22,840,000 Interest Rate Swaps (Citibank) (Fund receives Floating
MYR KLIB3M 3 Month; and pays Fixed 4.06%)
(22/3/2016) (138,439)
USD 847,000 Credit Default Swaps (Barclays) (Fund receives
default protection on Greece (Republic of) 5.9%
22/10/2022; and pays Fixed 1%) (20/6/2016) 101,718
EUR 3,000,000 Credit Default Swaps (Credit Suisse) (Fund receives
default protection on iTraxx Europe Sub Financials
S15 V1; and pays Fixed 1%) (20/6/2016) 197,530
EUR 4,750,000 Credit Default Swaps (Goldman Sachs) (Fund receives
default protection on Koninklijke DSM NV 4%
10/11/2015; and pays Fixed 1%) (20/6/2016) 62,498
EUR 1,000,000 Credit Default Swaps (Deutsche Bank) (Fund receives
default protection on iTraxx Europe Sub Financials
S15 V1; and pays Fixed 1%) (20/6/2016) 35,499
USD 2,121,000 Credit Default Swaps (Citibank) (Fund receives
default protection on Greece (Republic of) 5.9%
22/10/2022; and pays Fixed 1%) (20/6/2016) 249,913
EUR 1,500,000 Credit Default Swaps (Barclays) (Fund receives default
protection on iTraxx Europe Sub Financials S15 V1;
and pays Fixed 1%) (20/6/2016) 25,243
CNY 105,000,000 Interest Rate Swaps (HSBC) (Fund receives Floating
CNY CNRR 28 Days; and pays Fixed 4.05%)
(15/7/2016) (39,708)
USD (14,330,000) Credit Default Swaps (Morgan Stanley) (Fund provides
default protection on French (Republic of) 4.25%
25/4/2019; and receives Fixed 0.25%) 20/9/2016) (25,225)
EUR 3,800,000 Credit Default Swaps (Credit Suisse) (Fund receives
default protection on Koninklijke KPN NV 8.375%
1/10/2030; and pays Fixed 1%) (20/9/2016) 73,568
EUR (2,250,000) Credit Default Swaps (Credit Suisse) (Fund provides
default protection on Lloyds TSB Bank Plc 6.375%
17/6/2016; and receives Fixed 1%) (20/9/2016) (71,932)
EUR 800,000 Credit Default Swaps (Deutsche Bank) (Fund receives
default protection on Banco Santander SA 9/8/2013;
and pays Fixed 1%) (20/9/2016) 1,930
EUR 1,900,000 Credit Default Swaps (Deutsche Bank) (Fund receives
default protection on Royal Bank of Scotland Plc
6/12/2010; and pays Fixed 1%) (20/9/2016) 69,689
EUR (1,900,000) Credit Default Swaps (Deutsche Bank) (Fund provides
default protection on Lloyds TSB Bank Plc 3.375%
20/4/2015; and receives Fixed 1%) (20/9/2016) (60,742)
EUR (2,800,000) Credit Default Swaps (Goldman Sachs) (Fund provides
default protection on Tesco Plc 6% 14/12/2029; and
receives Fixed 1%) (20/9/2016) (7,969)
EUR (1,700,000) Credit Default Swaps (Morgan Stanley) (Fund provides
default protection on Banca Monte Dei Paschidi
Siena SPA 5.6% 9/9/2020; and receives Fixed 3%)
(20/9/2016) (62,031)
EUR 2,250,000 Credit Default Swaps (Credit Suisse) Fund receives
default protection on Royal Bank of Scotland Plc
4.25% 11/5/2016; and pays Fixed 1%) (20/9/2016) 82,527
EUR (3,000,000) Credit Default Swaps (Goldman Sachs) (Fund provides
default protection on Anheuser Busch Inbev
NV 8.825% 30/1/2017; and receives Fixed 1%)
(20/9/2016) (43,967)
EUR 2,750,000 Credit Default Swaps (Citibank) (Fund receives
default protection on Koninklijke KPN NV 8.375%
1/10/2030; and pays Fixed 1%) (20/9/2016) 53,240
EUR (3,000,000) Credit Default Swaps (Credit Suisse) (Fund provides
default protection on Telefonica SA 4.375%
2/2/2016; and receives Fixed 1%) (20/9/2016) (141,797)
EUR (2,500,000) Credit Default Swaps (Credit Suisse) (Fund provides
default protection on Vodafone Group Plc 5%
4/8/2018; and receives Fixed 1%) (20/9/2016) (15,021)
EUR 3,000,000 Credit Default Swaps (Credit Suisse) (Fund receives
default protection on Gas Natural Capital Markets SA
4.5% 27/1/2020; and pays Fixed 1%) (20/9/2016) 82,897
EUR (2,000,000) Credit Default Swaps (Citibank) (Fund provides default
protection on Glencore International AG 5.25%
11/10/2013; and receives Fixed 1%) (20/9/2016) 24,989
EUR (2,000,000) Credit Default Swaps (JP Morgan) (Fund provides default
protection on Anheuser Busch Inbev NV 8.625%
30/1/2017; and receives Fixed 1%) (20/9/2016) (32,219)

Audited Annual Report and Accounts 81
The notes on pages 261 to 270 form an integral part of these financial statements.
Euro Bond Fund continued
Note: The total market value of EUR 3,221,093 of these transactions is included in the Statement of Net Assets (see Note 2c).
Nominal Value Description
Unrealisedprofit/(loss)
EUR
Nominal Value Description
Unrealisedprofit/(loss)
EUR
Swaps as at 31 August 2011
EUR 2,500,000 Credit Default Swaps (Goldman Sachs) (Fund receives
default protection on Bertelsmann AG 4.75%
26/9/2016; and pays Fixed 1%) (20/9/2016) 57,767
ZAR 56,595,000 Interest Rate Swaps (Deutsche Bank) (Fund receives
Fixed 8.7%; and pays Floating ZAR JIBOR 3 Month)
(6/2/2017) 490,082
ZAR 84,970,000 Interest Rate Swaps (Barclays) (Fund receives Fixed
8.64%; and pays Floating ZAR JIBAR 3 Month)
(7/2/2017) 714,024
CZK 70,000,000 Interest Rate Swaps (Barclays) (Fund receives Floating
CZK Interbank 6 Month; and pays Fixed 4.16%)
(18/5/2017) (345,980)
CZK 77,900,000 Interest Rate Swaps (Deutsche Bank) (Fund receives
Fixed 3.98%; and pays Floating CZK Interbank 6
Month) (16/9/2018) 393,769
EUR (1,500,000) Credit Default Swaps (Barclays) (Fund provides default
protection on iTraxx Europe Sub Financials S15 V1;
and receives Fixed 1%) (20/6/2021) (38,880)
GBP 21,665,000 Interest Rate Swaps (Citibank) (Fund receives Fixed
4.405%; and pays Floating GBP LIBOR 6 Month)
(29/7/2021) 399,777
SEK 214,190,000 Interest Rate Swaps (Citibank) (Fund receives Floating
SEK STIBOR 3 Month; and pays Fixed 3.505%)
(2/8/2021) (305,978)
HUF 794,250,000 Interest Rate Swaps (Deutsche Bank) (Fund receives
Floating HUF BUBOR 6 Month; and pays Fixed 6.58%)
(19/8/2021) (19,321)
HUF 865,120,000 Interest Rate Swaps (Deutsche Bank) (Fund receives
Floating HUF BUBOR 6 Month; and pays Fixed 7.23%)
(29/8/2021) (191,044)
HUF 495,840,000 Interest Rate Swaps (Deutsche Bank) (Fund receives
Floating HUF BUBOR 6 Month; and pays Fixed 6.67%)
(29/8/2021) (25,612)
HUF 980,000,000 Interest Rate Swaps (Citibank) (Fund receives
Floating HUF BUBOR 6 Month; and pays Fixed 7%)
(29/8/2021) (148,320)
EUR 3,100,000 Interest Rate Swaps (Morgan Stanley) (Fund receives
Fixed 3.74%; and pays Floating EUR EURIBOR 6
Month) (23/6/2041) 353,893
EUR 6,175,000 Interest Rate Swaps (Morgan Stanley) (Fund receives
Fixed 3.763%; and pays Floating EUR EURIBOR 6
Month) (11/7/2041) 733,669
EUR 2,405,000 Interest Rate Swaps (Morgan Stanley) (Fund receives
Floating EUR EURIBOR 6 Month; and pays Fixed
3.651%) (23/6/2049) (305,467)
EUR 8,790,000 Interest Rate Swaps (Deutsche Bank) (Fund receives
Floating EUR EURIBOR 6 Month; and pays Fixed
2.7725%) (8/11/2049) 846,028
EUR 4,860,000 Interest Rate Swaps (Morgan Stanley) (Fund receives
Floating EUR EURIBOR 6 Month; and pays Fixed
3.715%) (11/7/2061) (696,464)
2,092,670

82 BlackRock Global Funds (BGF)
Euro Bond Fund continued
Open Forward Foreign Exchange Transactionsas at 31 August 2011
Purchases Sales
Unrealisedprofit/(loss)
EURValue date
Core Fund
CHF 8,980,140 USD 11,612,000 6/9/2011 (323,187)
USD 11,612,000 CHF 9,160,068 6/9/2011 168,549
EUR 5,028,000 USD 7,267,672 8/9/2011 (4,859)
USD 41,909,666 EUR 29,194,000 8/9/2011 (171,579)
USD 5,734,142 TRY 10,025,000 8/9/2011 (65,300)
CLP 1,421,578,800 USD 2,979,000 29/9/2011 52,146
MXN 67,163,521 ZAR 38,967,000 29/9/2011 (83,535)
USD 3,189,467 ZAR 22,347,000 29/9/2011 12,039
EUR 4,169,431 CZK 100,550,000 4/10/2011 (1,969)
EUR 33,000,573 GBP 28,793,000 4/10/2011 466,393
EUR 4,224,996 HUF 1,144,712,000 4/10/2011 29,075
EUR 15,838,248 PLN 65,800,000 4/10/2011 21,974
EUR 36,439,317 USD 51,738,000 4/10/2011 599,129
HUF 2,214,455,954 EUR 8,180,000 4/10/2011 (62,951)
CZK 98,736,439 HUF 1,094,839,000 13/10/2011 86,434
AUD 2,956,000 MXN 38,720,733 18/10/2011 21,424
CAD 16,940,408 AUD 16,591,000 18/10/2011 (182,731)
MXN 73,296,329 AUD 5,736,000 18/10/2011 (144,084)
MXN 67,025,440 CAD 5,420,000 18/10/2011 (119,700)
CNY 74,452,571 USD 11,582,000 19/10/2011 89,047
MYR 69,418,877 USD 23,238,000 19/10/2011 80,287
USD 30,442,136 CNY 195,916,759 19/10/2011 (258,633)
USD 11,582,000 MYR 35,110,833 19/10/2011 (159,336)
EUR 4,141,000 RUB 174,460,330 20/10/2011 (18,774)
NOK 97,793,856 EUR 12,423,000 20/10/2011 197,540
RUB 163,634,000 USD 5,787,867 20/10/2011 (108,434)
USD 8,731,001 HUF 1,683,599,000 20/10/2011 (114,610)
CHF 2,128,071 EUR 1,885,000 25/10/2011 (52,152)
CHF 12,589,000 SEK 113,883,871 25/10/2011 (1,577,600)
SEK 101,800,245 CHF 12,713,000 25/10/2011 152,964
SEK 15,483,982 EUR 1,660,000 25/10/2011 28,681
JPY 1,129,478,000 USD 14,555,129 27/10/2011 125,808
KRW 25,384,859,332 JPY 1,883,568,994 27/10/2011 (564,271)
KRW 9,064,130,500 USD 8,413,000 27/10/2011 49,459
USD 13,898,000 KRW 14,981,349,100 27/10/2011 (86,699)
USD 8,413,000 SGD 10,144,898 27/10/2011 (17,268)
EUR 1,620,000 CHF 1,757,959 8/11/2011 105,095
HKD 45,389,000 USD 5,832,263 10/11/2011 (2,737)
USD 5,883,000 HKD 45,628,724 10/11/2011 16,566
Net unrealised loss (1,817,799)
Note: The net unrealised loss attributed to these transactions is included in the Statement
of Net Assets (see Note 2c).
Open Futures Contractsas at 31 August 2011
Numberof contracts Contract/Description
Expirationdate
ValueEUR
393 Euro Bund September 2011 52,992,120
(50) 30 Year Euro-BUXL September 2011 (5,812,000)
(499) Euro BOBL September 2011 (60,897,960)
(1,055) Euro Schatz September 2011 (115,438,100)
750 90 Day Sterling £ Future December 2011 104,879,437
(132) Long Gilt December 2011 (18,949,101)
(231) US Treasury 5 Year Note (CBT) December 2011 (19,618,255)
(317) Banker's Acceptance March 2012 (55,786,673)
(750) 90 Day Sterling £ Future September 2012 (104,932,401)
Total commitment (223,562,933)
Note: The net unrealised loss of EUR 2,986,862 attributed to these transactions is included
in the Statement of Net Assets (see Note 2c).
Purchased Call Options as at 31 August 2011
Number of contracts
subjectto Call Issuer
UnrealisedlossEUR
ValueEUR
68,860,000 OTC EUR/USD Call Option
strike price EUR 1.5
expiring on 27/9/2011 (60,046) 88,003
361,842,000 OTC HKD/USD Call Option
strike price HKD 7.7
expiring on 10/11/2011 (154,554) 16,268
Total Purchased Call Options (214,600) 104,271
Note: Purchased Call Options are included in the Statement of Net Assets (see Note 2c).
Written Call Options as at 31 August 2011
Number of contracts
subjectto Call Issuer
UnrealisedprofitEUR
ValueEUR
(361,842,000) OTC HKD/USD Call Option
strike price HKD 7.3
expiring on 10/11/2011 83,254 (482)
Total Written Call Options 83,254 (482)
Note: Written Call Options are included in the Statement of Net Assets (see Note 2c).

Audited Annual Report and Accounts 83
The notes on pages 261 to 270 form an integral part of these financial statements.
Euro Corporate Bond Fund
FUNDS
Ireland 5,202,462 Institutional Cash Series Plc - Institutional
Euro Liquidity Fund 5,202,462 4.11
Total Funds 5,202,462 4.11
BONDS
Australia EUR 250,000 BHP Billiton Finance Ltd 4.75% 4/4/2012 254,578 0.20
EUR 300,000 National Australia Bank Ltd 4% 13/7/2020 299,023 0.24
EUR 300,000 Optus Finance Pty Ltd 3.5% 15/9/2020 296,664 0.23
EUR 250,000 Telstra Corp Ltd 3.875% 24/7/2015 263,343 0.21
EUR 200,000 Telstra Corp Ltd 4.75% 21/3/2017 218,150 0.17
EUR 400,000 Telstra Corp Ltd 6% 8/4/2013 426,180 0.34
EUR 200,000 Westpac Banking Corp 4.25% 22/9/2016 208,168 0.16
EUR 450,000 Westpac Banking Corp 6.5% 24/6/2013 486,416 0.38
2,452,522 1.93
Austria EUR 200,000 BAWAG PSK Bank fuer Arbeit und Wirtschaft
und Oesterreichische Postsparkasse
4.35% 28/5/2013 205,125 0.16
Belgium EUR 305,000 Anheuser-Busch InBev NV 4% 26/4/2018 318,620 0.25
EUR 400,000 Anheuser-Busch InBev NV 4% 2/6/2021 409,146 0.32
EUR 350,000 Anheuser-Busch InBev NV 6.57%
27/2/2014 386,018 0.31
1,113,784 0.88
Bermuda EUR 100,000 Fidelity International Ltd 6.25%
21/3/2012 101,617 0.08
Cayman Islands EUR 400,000 Hutchison Whampoa Finance 09 Ltd 4.75%
14/11/2016 419,806 0.33
EUR 175,000 Thames Water Utilities Cayman Finance Ltd
3.25% 9/11/2016 176,996 0.14
EUR 300,000 Thames Water Utilities Cayman Finance Ltd
6.125% 4/2/2013 316,936 0.25
913,738 0.72
Denmark EUR 150,000 Danske Bank A/S 4.75% 4/6/2014 156,955 0.12
EUR 500,000 DONG Energy A/S 4.875% 16/12/2021 540,810 0.43
EUR 1,600,000 TDC A/S 3.5% 23/2/2015 1,636,008 1.29
2,333,773 1.84
Finland EUR 750,000 Fortum OYJ 4% 24/5/2021 772,800 0.61
EUR 82,000 Fortum OYJ 5% 19/11/2013 87,324 0.07
860,124 0.68
France EUR 800,000 Aeroports de Paris 4% 8/7/2021 834,668 0.66
EUR 1,000,000 Air Liquide SA 2.908% 12/10/2018 1,004,495 0.79
EUR 1,600,000 Alstom SA 3.625% 5/10/2018 1,524,744 1.20
EUR 1,500,000 Arkema SA 4% 25/10/2017 1,498,980 1.18
EUR 200,000 Autoroutes du Sud de la France 4.125%
13/4/2020 202,522 0.16
EUR 100,000 Autoroutes du Sud de la France 5.625%
4/7/2022 110,390 0.09
EUR 200,000 AXA SA FRN 6/7/2016 (Perpetual) 148,813 0.12
EUR 600,000 Banque Federative du Credit Mutuel 3%
29/10/2015 590,502 0.47
EUR 215,000 Banque PSA Finance 3.25% 26/11/2012 215,295 0.17
EUR 250,000 Banque PSA Finance 3.875% 18/1/2013 251,120 0.20
EUR 150,000 BNP Paribas SA 3.25% 27/3/2012 150,949 0.12
EUR 1,000,000 BNP Paribas SA 3.75% 25/11/2020 978,410 0.77
EUR 75,000 BNP Paribas SA 4.875% 17/10/2011
(Perpetual) 53,531 0.04
EUR 50,000 BNP Paribas SA 5% 16/12/2013 52,915 0.04
EUR 500,000 BNP Paribas SA FRN 13/4/2017 (Perpetual) 390,077 0.31
EUR 500,000 Bouygues SA 3.641% 29/10/2019 493,025 0.39
EUR 400,000 CNP Assurances FRN 22/12/2016
(Perpetual) 266,750 0.21
EUR 1,000,000 CNP Assurances FRN 14/9/2040 852,250 0.67
EUR 650,000 EDF SA 4.5% 12/11/2040 607,155 0.48
EUR 150,000 EDF SA 4.625% 11/9/2024 157,888 0.12
EUR 400,000 EDF SA 4.625% 26/4/2030 385,586 0.30
EUR 400,000 EDF SA 5% 5/2/2018 440,204 0.35
EUR 600,000 Eutelsat SA 4.125% 27/3/2017 615,324 0.49
EUR 200,000 France Telecom SA 3.625% 14/10/2015 208,474 0.16
EUR 600,000 France Telecom SA 4.125% 23/1/2019 618,978 0.49
EUR 250,000 France Telecom SA 4.375% 21/2/2012 252,940 0.20
EUR 1,000,000 France Telecom SA 4.75% 21/2/2017 1,079,925 0.85
EUR 600,000 France Telecom SA 8.125% 28/1/2033 806,703 0.64
EUR 1,220,000 GDF Suez 2.75% 18/10/2017 1,204,732 0.95
EUR 190,000 GDF Suez 6.25% 24/1/2014 208,812 0.16
EUR 150,000 HSBC France 4.875% 15/1/2014 159,045 0.13
EUR 150,000 Legrand SA 4.25% 24/2/2017 157,916 0.12
EUR 400,000 Legrand SA 4.375% 21/3/2018 421,964 0.33
EUR 100,000 Pernod-Ricard SA 4.625% 6/12/2013 102,756 0.08
EUR 600,000 Pernod-Ricard SA 5% 15/3/2017 595,839 0.47
EUR 100,000 Pernod-Ricard SA 7% 15/1/2015 107,460 0.09
EUR 1,000,000 RCI Banque SA '144A' 4% 11/7/2013 1,004,790 0.79
EUR 150,000 Sanofi 4.5% 18/5/2016 163,337 0.13
EUR 500,000 Societe Generale SA FRN 19/12/2017
(Perpetual) 403,282 0.32
EUR 500,000 Societe Generale SA 3% 31/3/2015 482,922 0.38
EUR 1,000,000 Societe Generale SA 3.125% 21/9/2017 917,470 0.72
EUR 400,000 Total Infrastructures Gaz France SA
4.339% 7/7/2021 414,970 0.33
EUR 200,000 TPSA Eurofinance France SA 6%
22/5/2014 218,515 0.17
EUR 135,000 Unibail-Rodamco SE 4% 29/10/2011 135,489 0.11
EUR 800,000 Veolia Environnement SA 5.125%
24/5/2022 841,460 0.66
EUR 175,000 Veolia Environnement SA 6.75%
24/4/2019 205,964 0.16
22,539,336 17.77
Germany EUR 550,000 Bayerische Landesbank FRN 7/2/2019 429,146 0.34
EUR 450,000 Bundesobligation 2.25% 11/4/2014 467,811 0.37
EUR 3,300,000 Bundesobligation 2.75% 8/4/2016 3,517,866 2.78
EUR 200,000 Bundesrepublik Deutschland 2.5%
4/1/2021 206,697 0.16
EUR 85,000 Bundesrepublik Deutschland 3% 4/7/2020 91,645 0.07
EUR 600,000 Bundesrepublik Deutschland 3.25%
4/1/2020 659,583 0.52
EUR 50,000 Bundesrepublik Deutschland 3.5% 4/7/2019 55,846 0.04
EUR 300,000 Bundesrepublik Deutschland 4% 4/7/2016 337,548 0.27
EUR 200,000 Bundesrepublik Deutschland 4% 4/1/2018 228,757 0.18
EUR 500,000 Commerzbank AG 3.875% 22/3/2017 495,133 0.39
EUR 500,000 Commerzbank AG 4% 16/9/2020 471,558 0.37
EUR 1,000,000 Commerzbank AG 7.75% 16/3/2021 890,990 0.70
EUR 205,000 Daimler AG 4.625% 2/9/2014 217,647 0.17
Portfolio of Investments 31 August 2011
Transferable Securities Admitted to an Official Stock Exchange Listing or Dealt in on Another Regulated Market
Holding Description Value (EUR) %
Transferable Securities Admitted to an Official Stock Exchange Listing or Dealt in on Another Regulated Market
Holding Description Value (EUR) %

84 BlackRock Global Funds (BGF)
Euro Corporate Bond Fund continued
EUR 1,100,000 FMS Wertmanagement 2.75% 3/6/2016 1,130,772 0.89
EUR 500,000 FMS Wertmanagement 3% 3/8/2018 511,835 0.40
EUR 700,000 Henkel AG & Co KGaA FRN 25/11/2104 697,750 0.55
EUR 700,000 HSE Netz AG 6.125% 23/4/2041 732,112 0.58
EUR 2,500,000 Kreditanstalt fuer Wiederaufbau 3.125%
4/7/2016 2,632,362 2.08
EUR 1,050,000 Kreditanstalt fuer Wiederaufbau 3.875%
21/1/2019 1,144,164 0.90
EUR 300,000 Landesbank Schleswig-Holstein
Girozentrale 4.25% 11/3/2013 309,648 0.24
EUR 500,000 Rhoen Klinikum AG 3.875% 11/3/2016 504,890 0.40
EUR 250,000 Volkswagen Financial Services AG 6.875%
15/1/2014 275,861 0.22
EUR 200,000 Volkswagen Leasing GmbH FRN 3/6/2013 199,541 0.16
EUR 300,000 Volkswagen Leasing GmbH 2.75%
13/7/2015 300,108 0.24
EUR 700,000 Volkswagen Leasing GmbH 3.375%
3/6/2016 710,416 0.56
17,219,686 13.58
Greece EUR 500,000 Hellenic Republic Government Bond
5.25% 18/5/2012 358,250 0.28
Guernsey EUR 500,000 ABB International Finance Ltd 4.625%
6/6/2013 522,015 0.41
India USD 230,000 Bank of India 6.25% 16/2/2021 163,930 0.13
Ireland EUR 200,000 Caterpillar International Finance Ltd 2.75%
6/6/2014 203,972 0.16
EUR 1,120,000 GE Capital European Funding 3.75%
4/4/2016 1,123,785 0.89
EUR 200,000 GE Capital European Funding 5.375%
23/1/2020 212,584 0.17
EUR 300,000 Governor & Co of the Bank of Ireland/The
4% 28/1/2015 229,788 0.18
EUR 48,518 Talisman Finance Plc '7H' FRN 22/4/2017 4,852 0.00
1,774,981 1.40
Italy EUR 180,000 Assicurazioni Generali SpA 5.125%
16/9/2024 172,182 0.13
GBP 500,000 Intesa Sanpaolo SpA FRN 12/11/2017 533,692 0.42
EUR 800,000 Intesa Sanpaolo SpA FRN 1/6/2016
(Perpetual) 672,000 0.53
EUR 500,000 Intesa Sanpaolo SpA 3.25% 1/2/2013 491,273 0.39
EUR 400,000 Intesa Sanpaolo SpA 4% 8/11/2018 362,504 0.29
EUR 700,000 Mediobanca SpA 4.625% 11/10/2016 689,479 0.54
EUR 200,000 Telecom Italia SpA 5.25% 17/3/2055 139,875 0.11
GBP 100,000 UniCredit SpA 5% 1/2/2016 87,982 0.07
EUR 100,000 UniCredit SpA 5.25% 14/1/2014 100,285 0.08
EUR 300,000 UniCredit SpA 6.125% 19/4/2021 262,923 0.21
3,512,195 2.77
Japan EUR 200,000 Tokyo Electric Power Co Inc/The 4.5%
24/3/2014 172,500 0.14
Luxembourg EUR 700,000 Fiat Finance & Trade SA 5.625% 15/11/2011 702,579 0.55
EUR 300,000 Finmeccanica Finance SA 5.25%
21/1/2022 262,815 0.21
USD 150,000 Holcim US Finance Sarl & Cie SCS '144A'
6% 30/12/2019 113,814 0.09
EUR 600,000 ITW Finance Europe SA 5.25% 1/10/2014 658,905 0.52
EUR 240,000 John Deere Bank SA 3.25% 22/6/2016 247,387 0.19
1,985,500 1.56
Netherlands EUR 700,000 ABN Amro Bank NV 3.625% 6/10/2017 681,408 0.54
EUR 400,000 ABN Amro Bank NV 4.25% 11/4/2016 407,410 0.32
EUR 600,000 Alliander NV FRN 11/11/2015 (Perpetual) 598,350 0.47
EUR 500,000 Alliander NV 5.5% 20/4/2016 566,605 0.45
EUR 500,000 Allianz Finance II BV FRN 17/2/2017
(Perpetual) 396,750 0.31
EUR 500,000 Allianz Finance II BV FRN 31/5/2022 494,515 0.39
EUR 2,000,000 Allianz Finance II BV FRN 8/7/2041 1,699,950 1.34
EUR 500,000 Barclays SLCSM Funding BV FRN
2/12/2014 467,490 0.37
EUR 900,000 BASF Finance Europe NV 5.125% 9/6/2015 987,372 0.78
EUR 400,000 BMW Finance NV 3.625% 29/1/2018 409,034 0.32
EUR 120,000 BMW Finance NV 6.125% 2/4/2012 122,887 0.10
EUR 500,000 British American Tobacco Holdings The
Netherlands BV 4.375% 15/9/2014 531,932 0.42
EUR 500,000 Cooperatieve Centrale Raiffeisen-
Boerenleenbank BA/Netherlands
3.875% 20/4/2016 521,735 0.41
EUR 1,300,000 Cooperatieve Centrale Raiffeisen-
Boerenleenbank BA/Netherlands
4.125% 14/1/2020 1,354,437 1.07
EUR 1,300,000 Deutsche Telekom International Finance
BV 4.25% 13/7/2022 1,298,512 1.02
EUR 900,000 Deutsche Telekom International Finance
BV 6% 20/1/2017 1,019,902 0.80
EUR 350,000 Deutsche Telekom International Finance
BV 8.125% 29/5/2012 365,897 0.29
EUR 265,000 Enbw International Finance BV 6.125%
7/7/2039 294,093 0.23
EUR 250,000 Eureko BV FRN 24/6/2015 (Perpetual) 188,839 0.15
EUR 500,000 Eureko BV 6% 1/11/2012 (Perpetual) 360,000 0.28
EUR 400,000 Generali Finance BV FRN 16/6/2016
(Perpetual) 295,250 0.23
EUR 820,000 Heineken NV 4.625% 10/10/2016 870,397 0.69
EUR 1,300,000 ING Verzekeringen NV 4% 18/9/2013 1,329,003 1.05
EUR 100,000 KBC Internationale Financieringsmaatschappij
NV 3.875% 31/3/2015 97,482 0.08
EUR 323,000 Koninklijke KPN NV 5% 13/11/2012 333,872 0.26
EUR 1,000,000 Lanxess Finance BV 4.125% 23/5/2018 992,350 0.78
EUR 350,000 Linde Finance BV 4.75% 24/4/2017 383,485 0.30
USD 535,000 MDC-GMTN B.V. 3.75% 20/4/2016 386,667 0.31
EUR 500,000 Nederlandse Waterschapsbank NV 4.375%
22/1/2018 552,585 0.44
EUR 300,000 PACCAR Financial Europe BV 3%
19/5/2014 307,193 0.24
EUR 1,000,000 PostNL NV 5.375% 14/11/2017 1,052,315 0.83
EUR 300,000 Repsol International Finance BV 4.625%
8/10/2014 312,716 0.25
EUR 200,000 RWE Finance BV 2.5% 16/9/2011 200,070 0.16
EUR 500,000 RWE Finance BV 5% 10/2/2015 539,925 0.43
EUR 400,000 Schlumberger Finance BV 2.75%
1/12/2015 409,076 0.32
EUR 100,000 Schlumberger Finance BV 4.5% 25/3/2014 106,052 0.08
EUR 122,000 Shell International Finance BV 4.375%
14/5/2018 132,375 0.11
EUR 300,000 Shell International Finance BV 4.5%
9/2/2016 324,891 0.26
EUR 200,000 Syngenta Finance NV 4.125% 22/4/2015 212,776 0.17
EUR 550,000 Urenco Finance NV 5.375% 22/5/2015 598,719 0.47
Portfolio of Investments 31 August 2011
Transferable Securities Admitted to an Official Stock Exchange Listing or Dealt in on Another Regulated Market
Holding Description Value (EUR) %
Transferable Securities Admitted to an Official Stock Exchange Listing or Dealt in on Another Regulated Market
Holding Description Value (EUR) %

Audited Annual Report and Accounts 85
The notes on pages 261 to 270 form an integral part of these financial statements.
Euro Corporate Bond Fund continued
EUR 100,000 Volkswagen International Finance NV
5.375% 15/11/2013 106,700 0.08
EUR 400,000 Volkswagen International Finance NV
5.625% 9/2/2012 406,434 0.32
EUR 150,000 Wuerth Finance International BV 3.75%
25/5/2018 154,294 0.12
22,871,745 18.04
Norway EUR 2,000,000 DnB NOR Bank ASA 4.375% 24/2/2021 2,026,020 1.60
EUR 300,000 DnB NOR Bank ASA 5.875% 20/6/2013 319,577 0.25
EUR 550,000 Statkraft AS 5.5% 2/4/2015 607,921 0.48
EUR 350,000 Statkraft AS 6.625% 2/4/2019 427,885 0.33
EUR 70,000 Statoil ASA 4.375% 11/3/2015 75,424 0.06
EUR 250,000 Statoil ASA 5.625% 11/3/2021 301,337 0.24
3,758,164 2.96
Poland PLN 2,800,000 Poland Government Bond 5.25%
25/10/2020 660,630 0.52
EUR 800,000 Poland Government International Bond
4% 23/3/2021 754,520 0.60
1,415,150 1.12
Portugal EUR 100,000 Caixa Geral de Depositos SA 3.875%
6/12/2016 71,125 0.06
Spain EUR 800,000 Cedulas TDA 6 Fondo de Titulizacion de
Activos 4.25% 10/4/2031 481,944 0.38
EUR 250,000 Iberdrola Finanzas SAU 3.5% 13/10/2016 238,628 0.19
EUR 200,000 Iberdrola Finanzas SAU 3.875% 10/2/2014 200,507 0.16
GBP 200,000 Instituto de Credito Oficial 4% 8/12/2014 222,739 0.18
EUR 600,000 Telefonica Emisiones SAU 4.75% 7/2/2017 599,124 0.47
EUR 100,000 Telefonica Emisiones SAU 5.431%
3/2/2014 103,243 0.08
EUR 100,000 Telefonica Emisiones SAU 5.496%
1/4/2016 103,706 0.08
EUR 250,000 Telefonica Emisiones SAU 5.58%
12/6/2013 259,179 0.20
2,209,070 1.74
Sweden EUR 200,000 Nordea Bank AB 4% 29/6/2020 202,912 0.16
EUR 200,000 Nordea Bank AB 4% 29/3/2021 186,169 0.15
EUR 800,000 Nordea Bank AB 4.5% 12/5/2014* 845,552 0.66
EUR 275,000 Skandinaviska Enskilda Banken AB 4.375%
29/5/2012 279,840 0.22
EUR 550,000 Svenska Handelsbanken AB 3%
20/8/2012 556,078 0.44
EUR 500,000 Vattenfall AB 4.25% 19/5/2014 528,657 0.42
2,599,208 2.05
Switzerland EUR 150,000 Credit Suisse AG/London 3.875%
25/1/2017 149,586 0.12
EUR 1,500,000 Credit Suisse AG/London 4.75%
5/8/2019 1,540,643 1.22
EUR 200,000 Credit Suisse AG/London 5.125%
30/3/2012 203,649 0.16
EUR 400,000 UBS AG/London 4.625% 6/7/2012 408,554 0.32
EUR 450,000 UBS AG/London 5.625% 19/5/2014 482,161 0.38
2,784,593 2.20
United Kingdom EUR 100,000 3i Group Plc 5.625% 17/3/2017 101,227 0.08
EUR 200,000 Abbey National Treasury Services Plc/
London 4.125% 3/3/2014* 201,063 0.16
EUR 300,000 Anglian Water Services Financing Plc
4.625% 7/10/2013 315,713 0.25
EUR 1,300,000 Anglo American Capital Plc 4.375%
2/12/2016 1,329,308 1.05
EUR 250,000 Aviva Plc FRN 22/5/2038 241,250 0.19
EUR 500,000 Barclays Bank Plc 4.875% 13/8/2019 503,245 0.40
EUR 700,000 Barclays Bank Plc 6% 23/1/2018 651,651 0.51
EUR 450,000 Barclays Bank Plc 6% 14/1/2021 389,887 0.31
EUR 200,000 Barclays Bank Plc 6.625% 30/3/2022 174,292 0.14
EUR 500,000 BAT International Finance Plc 5.875%
12/3/2015 555,617 0.44
EUR 325,000 BG Energy Capital Plc 3.375% 15/7/2013 333,910 0.26
EUR 300,000 Brambles Finance Plc 4.625% 20/4/2018 316,158 0.25
EUR 560,000 GlaxoSmithKline Capital Plc 3.875%
6/7/2015 591,766 0.47
EUR 100,000 GlaxoSmithKline Capital Plc 5.625%
13/12/2017 115,216 0.09
EUR 250,000 HSBC Holdings Plc 4.5% 30/4/2014 264,550 0.21
EUR 500,000 HSBC Holdings Plc 6% 10/6/2019 516,510 0.41
EUR 600,000 Imperial Tobacco Finance Plc 4.375%
22/11/2013 624,327 0.49
EUR 150,000 Legal & General Group Plc FRN 8/6/2025 131,909 0.10
EUR 100,000 Lloyds TSB Bank Plc 3.25% 26/11/2012 100,144 0.08
EUR 270,000 Lloyds TSB Bank Plc 4.5% 15/9/2014 272,400 0.22
EUR 435,000 Lloyds TSB Bank Plc 5.375% 3/9/2019 423,881 0.33
EUR 200,000 Lloyds TSB Bank Plc 6.5% 24/3/2020 166,200 0.13
EUR 315,000 Motability Operations Group Plc 3.75%
29/11/2017 320,776 0.25
EUR 350,000 National Grid Electricity Transmission Plc
6.625% 28/1/2014 386,279 0.30
EUR 500,000 Nationwide Building Society 6.75%
22/7/2020 443,188 0.35
EUR 500,000 Paragon Mortgages Plc FRN 15/11/2038 344,893 0.27
EUR 17,836 Reds EHP Trust '2008-1E A2E' FRN
14/4/2014 17,564 0.01
EUR 550,000 Royal Bank of Scotland Plc/The 5.375%
30/9/2019 515,526 0.41
EUR 800,000 Scottish & Southern Energy Plc 6.125%
29/7/2013 860,672 0.68
EUR 110,000 Severn Trent Utilities Finance Plc 5.25%
11/3/2016 121,433 0.10
EUR 100,000 Smiths Group Plc 4.125% 5/5/2017 101,305 0.08
EUR 650,000 Tesco Plc 5.625% 12/9/2012 674,222 0.53
GBP 494,511 Titan Europe Plc/Ireland '2006-4FSX A1'
FRN 3/9/2014 522,591 0.41
EUR 250,000 United Utilities Water Plc 4.25% 24/1/2020 264,581 0.21
GBP 600,000 Virgin Media Secured Finance Plc 5.5%
15/1/2021 668,940 0.53
EUR 700,000 Vodafone Group Plc 3.625% 29/11/2012 715,082 0.56
EUR 291,000 Vodafone Group Plc 4.65% 20/1/2022 313,023 0.25
EUR 600,000 Vodafone Group Plc 6.875% 4/12/2013 664,641 0.52
GBP 300,000 Western Power Distribution West Midlands
Plc 5.75% 16/4/2032 351,241 0.28
15,606,181 12.31
United States EUR 700,000 Ahold Finance USA LLC 5.875% 14/3/2012 713,412 0.56
EUR 200,000 Air Products & Chemicals Inc 4.25%
10/4/2012 203,010 0.16
GBP 650,000 American Express Credit Corp 5.375%
1/10/2014 780,786 0.62
Portfolio of Investments 31 August 2011
Transferable Securities Admitted to an Official Stock Exchange Listing or Dealt in on Another Regulated Market
Holding Description Value (EUR) %
Transferable Securities Admitted to an Official Stock Exchange Listing or Dealt in on Another Regulated Market
Holding Description Value (EUR) %

* Securities lent, see Note 11, for further details.
86 BlackRock Global Funds (BGF)
Euro Corporate Bond Fund continued
EUR 500,000 Bank of America Corp FRN 6/5/2019 406,590 0.32
EUR 2,000,000 Bank of America Corp 4.75% 3/4/2017 1,904,580 1.50
EUR 50,000 Bristol-Myers Squibb Co 4.375%
15/11/2016 54,426 0.04
EUR 350,000 Bristol-Myers Squibb Co 4.625%
15/11/2021 388,458 0.31
EUR 300,000 Cellco Partnership / Verizon Wireless
Capital LLC 7.625% 19/12/2011 305,217 0.24
EUR 1,500,000 Citigroup Inc 5% 2/8/2019 1,470,772 1.16
EUR 500,000 Deutsche Bank Capital Funding Trust XI
9.5% 31/3/2015 (Perpetual)* 512,343 0.40
EUR 350,000 Goldman Sachs Group Inc/The 4.375%
16/3/2017 335,829 0.26
EUR 100,000 JPMorgan Chase & Co FRN 12/11/2019 95,360 0.08
EUR 1,500,000 JPMorgan Chase & Co 3.875% 23/9/2020 1,431,480 1.13
EUR 400,000 Kraft Foods Inc 5.75% 20/3/2012 408,220 0.32
EUR 100,000 Merck & Co Inc 5.375% 1/10/2014 109,876 0.09
EUR 800,000 Metropolitan Life Global Funding I 4.625%
16/5/2017 844,292 0.67
EUR 300,000 Millipore Corp 5.875% 30/6/2016 335,760 0.26
EUR 150,000 Parker Hannifin Corp 4.125% 11/11/2015 158,694 0.13
EUR 700,000 Pfizer Inc 4.75% 3/6/2016 766,829 0.60
EUR 200,000 Pfizer Inc 5.75% 3/6/2021 237,558 0.19
EUR 100,000 Philip Morris International Inc 5.75%
24/3/2016 113,850 0.09
EUR 1,000,000 SES Global Americas Holdings GP 4.875%
9/7/2014 1,067,350 0.84
EUR 250,000 SLM Student Loan Trust 2003-7 FRN
15/12/2033 228,380 0.18
EUR 250,000 WM Covered Bond Program 3.875%
27/9/2011 250,340 0.20
EUR 100,000 Zurich Finance USA Inc 4.5% 17/9/2014 104,797 0.08
13,228,209 10.43
Total Bonds 120,772,521 95.24
Total Transferable Securities Admitted
to an Official Stock Exchange Listing or
Dealt in on Another Regulated Market 125,974,983 99.35
BONDS
Bahrain USD 100,000 Golden Belt 1 Sukuk Co BSC
(Defaulted) FRN 15/5/2012 12,289 0.01
Iceland EUR 100,000 Kaupthing Bank Hf (Defaulted) 0%
30/6/2014 (Zero Coupon) 448 0.00
United Kingdom EUR 350,000 Lehman Brothers UK Capital Funding III
LP (Defaulted) 3.875% 22/11/2011 – 0.00
United States USD 100,000 Metropolitan Life Global Funding I 2.875%
17/9/2012 70,323 0.05
EUR 250,000 US Bank NA/Cincinnati OH FRN
28/2/2017 238,853 0.19
309,176 0.24
Total Bonds 321,913 0.25
Total Unquoted Securities 321,913 0.25
Total Portfolio 126,296,896 99.60
Other Net Assets 509,522 0.40
Total Net Assets (EUR) 126,806,418 100.00
Portfolio of Investments 31 August 2011
Transferable Securities Admitted to an Official Stock Exchange Listing or Dealt in on Another Regulated Market
Holding Description Value (EUR) %
Unquoted Securities
Holding Description Value (EUR) %
Nominal Value Description
Unrealisedprofit/(loss)
EUR
Nominal Value Description
Unrealisedprofit/(loss)
EUR
Swaps as at 31 August 2011
MYR 6,994,000 Interest Rate Swaps (Citibank) (Fund receives Fixed
3.575%; and pays Floating KLIBOR 3 Month)
(26/1/2013) 7,410
MYR 4,360,000 Interest Rate Swaps (Citibank) (Fund receives Fixed
3.495%; and pays Floating MYR KLIB3M 3 Month)
(22/3/2013) 3,818
HUF 470,525,000 Interest Rate Swaps (Barclays) (Fund receives Floating
HUF BUBOR 6 Month; and pays Fixed 6.39%)
(19/5/2013) (13,724)
PLN 6,690,000 Interest Rate Swaps (Barclays) (Fund receives Fixed
5.18%; and pays Floating PLN WIBOR 6 Month)
(19/5/2013) 16,501
CNY 45,500,000 Interest Rate Swaps (Morgan Stanley) (Fund receives
Fixed 3.83%; and pays Floating CNY CNRR 28 Days)
(30/6/2013) (34,588)
EUR 100,000 Credit Default Swaps (Barclays) (Fund receives default
protection on Svenska Cellulosa AktiebolAGet SCA
4.5% 15/7/2015; and pays Fixed 3.25%) (20/12/2013) (5,596)
ZAR 10,830,000 Interest Rate Swaps (Deutsche Bank) (Fund receives
Floating ZAR JIBOR 3 Month; and pays Fixed 8.02%)
(6/2/2014) (47,159)
ZAR 16,245,000 Interest Rate Swaps (Barclays) (Fund receives Floating
ZAR JIBAR 3 Month; and pays Fixed 7.95%) (7/2/2014) (68,643)
EUR 250,000 Credit Default Swaps (Goldman Sachs) (Fund receives
default protection on Banco Bilbao Vizcaya Argentaria
SA 4% 22/4/2013; and pays Fixed 1%) (20/6/2014) 9,692
EUR (250,000) Credit Default Swaps (Deutsche Bank) (Fund provides
default protection on BBVA Senior Finance SA
Unipersonal 4.875% 23/1/2014; and receives Fixed
1%) (20/6/2015) (5,579)
EUR 500,000 Credit Default Swaps (Morgan Stanley) (Fund receives
default protection on Akzo Nobel Sweden Finance AB
7.75% 31/1/2014; and pays Fixed 1%) (20/6/2015) 8,338
EUR 1,000,000 Credit Default Swaps (Barclays) (Fund receives default
protection on iTraxx Europe Sub Financials S14 V1;
and pays Fixed 1%) (20/12/2015) 73,428

Audited Annual Report and Accounts 87
The notes on pages 261 to 270 form an integral part of these financial statements.
Euro Corporate Bond Fund continued
Note: The total market value of EUR 41,079 of these transactions is included in the Statement of Net Assets (see Note 2c).
Nominal Value Description
Unrealisedprofit/(loss)
EUR
Nominal Value Description
Unrealisedprofit/(loss)
EUR
Swaps as at 31 August 2011
MYR 3,147,000 Interest Rate Swaps (Citibank) (Fund receives Floating
KLIBOR 3 Month; and pays Fixed 4.2%) (26/1/2016) (23,380)
MYR 1,835,000 Interest Rate Swaps (Citibank) (Fund receives Floating
MYR KLIB3M 3 Month; and pays Fixed 4.06%)
(22/3/2016) (11,122)
EUR 500,000 Credit Default Swaps (Morgan Stanley) (Fund receives
default protection on iTraxx Europe Sub Financials
S15 V1; and pays Fixed 1%) (20/6/2016) 30,083
EUR 2,000,000 Credit Default Swaps (Barclays) (Fund receives default
protection on iTraxx Europe Sub Financials S15 V1;
and pays Fixed 1%) (20/6/2016) 33,658
EUR 1,000,000 Credit Default Swaps (Goldman Sachs) (Fund receives
default protection on Koninklijke DSM NV 4%
10/11/2015; and pays Fixed 1%) (20/6/2016) 13,158
EUR 100,000 Credit Default Swaps (Credit Suisse) (Fund receives
default protection on iTraxx Europe Sub Financials
S15 V1; and pays Fixed 1%) (20/6/2016) 6,584
EUR 500,000 Credit Default Swaps (Credit Suisse) (Fund receives
default protection on Gas Natural Capital Markets SA
4.5% 27/1/2020; and pays Fixed 1%) (20/9/2016) 13,816
EUR (250,000) Credit Default Swaps (Credit Suisse) (Fund provides
default protection on Lloyds TSB Bank Plc 6.375%
17/6/2016; and receives Fixed 1%) (20/9/2016) (7,992)
EUR 250,000 Credit Default Swaps (Credit Suisse) Fund receives
default protection on Royal Bank of Scotland Plc
4.25% 11/5/2016; and pays Fixed 1%) (20/9/2016) 9,169
EUR 200,000 Credit Default Swaps (Deutsche Bank) (Fund receives
default protection on Royal Bank of Scotland Plc
6/12/2010; and pays Fixed 1%) (20/9/2016) 7,336
EUR (200,000) Credit Default Swaps (Deutsche Bank) (Fund provides
default protection on Lloyds TSB Bank Plc 3.375%
20/4/2015; and receives Fixed 1%) (20/9/2016) (6,394)
EUR 1,000,000 Credit Default Swaps (Credit Suisse) (Fund receives
default protection on POSTNL NV 3.875% 1/6/2015;
and pays Fixed 1%) (20/9/2016) 14,029
EUR (500,000) Credit Default Swaps (Goldman Sachs) (Fund provides
default protection on Tesco Plc 6% 14/12/2029; and
receives Fixed 1%) (20/9/2016) (1,423)
EUR (200,000) Credit Default Swaps (Goldman Sachs) (Fund provides
default protection on Anheuser Busch Inbev
NV 8.825% 30/1/2017; and receives Fixed 1%)
(20/9/2016) (2,931)
EUR 500,000 Credit Default Swaps (Credit Suisse) (Fund receives
default protection on Koninklijke KPN NV 8.375%
1/10/2030; and pays Fixed 1%) (20/9/2016) 9,680
EUR 500,000 Credit Default Swaps (Citibank) (Fund receives
default protection on Koninklijke KPN NV 8.375%
1/10/2030; and pays Fixed 1%) (20/9/2016) 9,680
EUR (600,000) Credit Default Swaps (Citibank) (Fund provides default
protection on Glencore International AG 5.25%
11/10/2013; and receives Fixed 1%) (20/9/2016) 7,497
EUR (500,000) Credit Default Swaps (Credit Suisse) (Fund provides
default protection on Vodafone Group Plc 5%
4/8/2018; and receives Fixed 1%) (20/9/2016) (3,004)
EUR 400,000 Credit Default Swaps (Goldman Sachs) (Fund receives
default protection on Bertelsmann AG 4.75%
26/9/2016; and pays Fixed 1%) (20/9/2016) 9,243
EUR (400,000) Credit Default Swaps (JP Morgan) (Fund provides
default protection on Anheuser Busch Inbev
NV 8.625% 30/1/2017; and receives Fixed 1%)
(20/9/2016) (6,444)
EUR (500,000) Credit Default Swaps (Credit Suisse) (Fund provides
default protection on Telefonica SA 4.375%
2/2/2016; and receives Fixed 1%) (20/9/2016) (23,633)
ZAR 5,185,000 Interest Rate Swaps (Deutsche Bank) (Fund receives
Fixed 8.7%; and pays Floating ZAR JIBOR 3 Month)
(6/2/2017) 44,899
ZAR 7,360,000 Interest Rate Swaps (Barclays) (Fund receives Fixed
8.64%; and pays Floating ZAR JIBAR 3 Month)
(7/2/2017) 61,848
EUR 900,000 Interest Rate Swaps (Deutsche Bank) (Fund receives
Fixed 3.332%; and pays Floating EUR EURIBOR
6 Month) (16/6/2021) 41,093
EUR 450,000 Interest Rate Swaps (Deutsche Bank) (Fund receives
Floating EUR EURIBOR 6 Month; and pays Fixed
3.661%) (16/6/2041) (44,377)
EUR (2,000,000) Credit Default Swaps (Barclays) (Fund provides default
protection on iTraxx Europe Sub Financials S15 V1;
and receives Fixed 1%) (20/6/2021) (51,840)
GBP 1,420,000 Interest Rate Swaps (Citibank) (Fund receives Fixed
4.405%; and pays Floating GBP LIBOR 6 Month)
(29/7/2021) 26,203
SEK 14,195,000 Interest Rate Swaps (Citibank) (Fund receives Floating
SEK STIBOR 3 Month; and pays Fixed 3.505%)
(2/8/2021) (20,278)
HUF 100,460,000 Interest Rate Swaps (Deutsche Bank) (Fund receives
Floating HUF BUBOR 6 Month; and pays Fixed
6.58%) (19/8/2021) (2,444)
HUF 80,000,000 Interest Rate Swaps (Citibank) (Fund receives Floating
HUF BUBOR 6 Month; and pays Fixed 7%)
(29/8/2021) (12,108)
HUF 86,355,000 Interest Rate Swaps (Deutsche Bank) (Fund receives
Floating HUF BUBOR 6 Month; and pays Fixed
7.23%) (29/8/2021) (19,070)
HUF 46,665,000 Interest Rate Swaps (Deutsche Bank) (Fund receives
Floating HUF BUBOR 6 Month; and pays Fixed
6.67%) (29/8/2021) (2,410)
EUR 320,000 Interest Rate Swaps (Morgan Stanley) (Fund receives
Fixed 3.74%; and pays Floating EUR EURIBOR
6 Month) (23/6/2041) 36,531
EUR 685,000 Interest Rate Swaps (Morgan Stanley) (Fund receives
Fixed 3.763%; and pays Floating EUR EURIBOR
6 Month) (11/7/2041) 81,387
EUR 250,000 Interest Rate Swaps (Morgan Stanley) (Fund receives
Floating EUR EURIBOR 6 Month; and pays Fixed
3.651%) (23/6/2049) (31,753)
EUR 300,000 Interest Rate Swaps (Deutsche Bank) (Fund receives
Floating EUR EURIBOR 6 Month; and pays Fixed
2.7725%) (8/11/2060) 28,875
EUR 540,000 Interest Rate Swaps (Morgan Stanley) (Fund receives
Floating EUR EURIBOR 6 Month; and pays Fixed
3.715%) (11/7/2061) (77,385)
80,679

88 BlackRock Global Funds (BGF)
Euro Corporate Bond Fund continued
Open Forward Foreign Exchange Transactionsas at 31 August 2011
Purchases Sales
Unrealisedprofit/(loss)
EURValue date
Core Fund
CHF 1,170,852 USD 1,514,000 6/9/2011 (42,138)
USD 1,514,000 CHF 1,194,311 6/9/2011 21,976
EUR 636,000 USD 919,300 8/9/2011 (615)
USD 4,724,995 EUR 3,291,000 8/9/2011 (18,944)
USD 717,268 TRY 1,254,000 8/9/2011 (8,168)
CLP 174,700,650 USD 368,000 29/9/2011 5,089
MXN 8,598,044 ZAR 4,982,000 29/9/2011 (10,063)
USD 278,310 ZAR 1,934,000 29/9/2011 2,621
EUR 361,047 CZK 8,707,000 4/10/2011 (170)
EUR 4,001,146 GBP 3,491,000 4/10/2011 56,548
EUR 789,450 HUF 213,892,000 4/10/2011 5,433
EUR 647,491 PLN 2,690,000 4/10/2011 898
EUR 833,192 USD 1,183,000 4/10/2011 13,699
HUF 279,920,222 EUR 1,034,000 4/10/2011 (7,958)
CZK 8,562,926 HUF 94,950,000 13/10/2011 7,496
AUD 339,000 MXN 4,440,571 18/10/2011 2,457
CAD 1,990,253 AUD 1,948,000 18/10/2011 (20,582)
MXN 10,491,668 AUD 821,000 18/10/2011 (20,584)
MXN 7,568,186 CAD 612,000 18/10/2011 (13,516)
CNY 9,783,873 USD 1,522,000 19/10/2011 11,702
MYR 8,855,568 USD 2,972,000 19/10/2011 4,980
USD 3,878,045 CNY 24,952,264 19/10/2011 (32,325)
USD 1,522,000 MYR 4,613,943 19/10/2011 (20,938)
EUR 534,000 RUB 22,497,420 20/10/2011 (2,421)
NOK 12,610,944 EUR 1,602,000 20/10/2011 25,474
RUB 20,294,100 USD 720,395 20/10/2011 (15,233)
USD 965,470 HUF 185,412,000 20/10/2011 (9,892)
CHF 1,340,000 SEK 12,122,042 25/10/2011 (167,923)
SEK 10,793,018 CHF 1,372,000 25/10/2011 (4,581)
JPY 124,019,000 USD 1,598,183 27/10/2011 13,814
KRW 2,901,609,948 JPY 215,179,637 27/10/2011 (63,403)
KRW 1,421,039,000 USD 1,324,000 27/10/2011 4,260
USD 1,826,000 KRW 1,968,336,700 27/10/2011 (11,391)
USD 1,064,000 SGD 1,283,036 27/10/2011 (2,185)
HKD 4,584,000 USD 589,021 10/11/2011 (277)
USD 510,000 HKD 3,955,575 10/11/2011 1,436
Net unrealised loss (295,424)
Note: The net unrealised loss attributed to these transactions is included in the Statement
of Net Assets (see Note 2c).
Open Futures Contractsas at 31 August 2011
Numberof contracts Contract/Description
Expirationdate
ValueEUR
76 Euro Schatz September 2011 8,315,920
(1) Euro BOBL September 2011 (122,040)
(9) 30 Year Euro-BUXL September 2011 (1,046,160)
(38) Euro Bund September 2011 (5,123,920)
69 90 Day Sterling £ Future December 2011 9,648,908
(3) US Treasury 10 Year Note December 2011 (268,723)
(11) US Treasury 5 Year Note (CBT) December 2011 (934,203)
(18) Long Gilt December 2011 (2,583,968)
(29) Banker's Acceptance March 2012 (5,103,513)
(69) 90 Day Sterling £ Future September 2012 (9,653,781)
Total commitment (6,871,480)
Note: The net unrealised loss of EUR 80,330 attributed to these transactions is included
in the Statement of Net Assets (see Note 2c).
Purchased Call Options as at 31 August 2011
Number of contracts
subjectto Call Issuer
UnrealisedlossEUR
ValueEUR
7,914,000 OTC EUR/USD Call Option
strike price EUR 1.5
expiring on 27/9/2011 (6,901) 10,114
33,876,000 OTC HKD/USD Call Option
strike price HKD 7.7
expiring on 10/11/2011 (14,469) 1,523
Total Purchased Call Options (21,370) 11,637
Note: Purchased Call Options are included in the Statement of Net Assets (see Note 2c).
Written Call Options as at 31 August 2011
Number of contracts
subjectto Call Issuer
UnrealisedprofitEUR
ValueEUR
(33,876,000) OTC HKD/USD Call Option
strike price HKD 7.3
expiring on 10/11/2011 7,794 (45)
Total Written Call Options 7,794 (45)
Note: Written Call Options are included in the Statement of Net Assets (see Note 2c).

Audited Annual Report and Accounts 89
The notes on pages 261 to 270 form an integral part of these financial statements.
Euro Reserve Fund
FUNDS
Ireland 18,141,479 Institutional Cash Series Plc - Institutional
Euro Liquidity Fund 18,141,479 9.53
Total Funds 18,141,479 9.53
COMMERCIAL PAPER
Germany EUR 6,700,000 FMS Wertmanagement 0% 6/7/2012 6,591,354 3.46
EUR 8,000,000 NRW BANK 0% 19/9/2011 7,995,435 4.20
14,586,789 7.66
Ireland EUR 8,000,000 Regency Assets Ltd 0% 8/9/2011 7,998,420 4.20
Jersey EUR 3,000,000 Solitaire Funding LLC 0% 9/9/2011 2,999,315 1.58
EUR 5,000,000 Solitaire Funding LLC 0% 22/11/2011 4,983,755 2.62
7,983,070 4.20
Sweden EUR 8,000,000 Nordea Bank AB 0% 18/11/2011 7,975,551 4.19
United Kingdom EUR 5,000,000 Cancara Asset Securitisation 0%
22/9/2011 4,996,572 2.62
EUR 3,000,000 Royal Bank Of Scotland Plc 0% 8/9/2011 2,999,408 1.58
7,995,980 4.20
United States EUR 8,000,000 Mont Blanc Capital Corp 0% 17/10/2011 7,986,604 4.20
EUR 6,000,000 Sheffield Receivables Corporation 0%
9/9/2011 5,998,631 3.15
13,985,235 7.35
Total Commercial Paper 60,525,045 31.80
CERTIFICATES OF DEPOSIT
Finland EUR 3,000,000 Pohjola Bank Plc 0% 8/11/2011 3,000,000 1.58
Netherlands EUR 8,000,000 ING Bank NV 0% 10/10/2011 7,989,031 4.20
United Kingdom EUR 8,000,000 Bank of Tokyo 1.38% 13/9/2011 7,997,268 4.20
EUR 5,000,000 Barclays Bank Plc 0% 7/9/2011 4,999,208 2.62
EUR 6,000,000 BNP Paribas SA 1.48% 26/9/2011 5,995,049 3.15
EUR 5,000,000 Lloyds TSB Bank Plc 0% 10/11/2011 4,986,993 2.62
EUR 8,000,000 Mizuho Bank Ltd 0% 8/9/2011 7,998,504 4.20
EUR 5,000,000 Royal Bank of Scotland 1.49% 12/9/2011 5,000,687 2.63
EUR 5,000,000 Svenska Handelsbanken AB 1.44%
4/11/2011 5,000,897 2.63
41,978,606 22.05
Total Certificates of Deposit 52,967,637 27.83
BONDS
Australia EUR 2,100,000 Commonwealth Bank of Australia FRN
2/11/2011 2,100,882 1.10
EUR 650,000 Westpac Banking Corp 4.25% 25/1/2012 656,854 0.35
2,757,736 1.45
Canada EUR 4,400,000 Royal Bank of Canada FRN 23/3/2012 4,402,420 2.31
France EUR 4,000,000 BNP Paribas FRN 14/10/2011 3,999,800 2.10
Netherlands EUR 4,000,000 Cooperatieve Centrale Raiffeisen-
Boerenleenbank BA/Netherlands
FRN 30/8/2012 4,002,180 2.10
EUR 5,000,000 Cooperatieve Centrale Raiffeisen-
Boerenleenbank BA/Netherlands
FRN 18/1/2012 5,000,250 2.63
9,002,430 4.73
United Kingdom EUR 9,000,000 HSBC Bank Plc FRN 5/5/2012 8,998,425 4.73
United States EUR 1,265,000 Bear Stearns Cos LLC/The FRN
27/7/2012 1,264,234 0.67
EUR 2,000,000 Wells Fargo Bank NA FRN 19/9/2011 2,000,060 1.05
3,264,294 1.72
Total Bonds 32,425,105 17.04
Total Transferable Securities Admitted
to an Official Stock Exchange Listing or
Dealt in on Another Regulated Market 164,059,266 86.20
Total Portfolio 164,059,266 86.20
Other Net Assets 26,268,332 13.80
Total Net Assets (EUR) 190,327,598 100.00
Portfolio of Investments 31 August 2011
Transferable Securities Admitted to an Official Stock Exchange Listing or Dealt in on Another Regulated Market
Holding Description Value (EUR) %
Transferable Securities Admitted to an Official Stock Exchange Listing or Dealt in on Another Regulated Market
Holding Description Value (EUR) %

90 BlackRock Global Funds (BGF)
Euro Short Duration Bond Fund
FUNDS
Ireland 30,568,772 Institutional Cash Series Plc - Institutional
Euro Liquidity Fund 30,568,772 1.61
Luxembourg 100,000 Blackrock Strategic Funds - European
Credit Strategies Fund 10,335,000 0.55
Total Funds 40,903,772 2.16
BONDS
Australia EUR 1,500,000 BHP Billiton Finance Ltd 4.75% 4/4/2012 1,527,465 0.08
AUD 2,000,000 Holcim Finance Australia Pty Ltd 8.5%
7/8/2012 1,518,861 0.08
EUR 3,750,000 ING Bank Australia Ltd FRN 23/11/2011 3,749,325 0.20
EUR 1,665,000 Westpac Banking Corp 4.875% 17/7/2012 1,706,792 0.09
EUR 200,000 Westpac Banking Corp 6.5% 24/6/2013 216,185 0.01
8,718,628 0.46
Austria EUR 22,600,000 Austria Government Bond '144A' 3.8%
20/10/2013 23,912,495 1.26
EUR 5,000,000 Oesterreichische Kontrollbank AG 3.625%
10/12/2013 5,236,850 0.28
EUR 7,735,000 Oesterreichische Volksbanken AG 2.25%
14/9/2012 7,802,604 0.41
EUR 6,000,000 UniCredit Bank Austria AG 3% 9/5/2014 6,152,010 0.33
43,103,959 2.28
Belgium EUR 1,005,000 Belgium Government Bond 3.5%
28/6/2017 1,005,528 0.05
EUR 44,015,000 Belgium Government Bond 4.25%
28/9/2013 45,801,349 2.42
EUR 870,000 Ontex IV SA 7.5% 15/4/2018 772,851 0.04
47,579,728 2.51
Bermuda EUR 450,000 Fidelity International Ltd 6.25%
21/3/2012 457,277 0.02
Canada USD 230,000 Nova Chemicals Corp 6.5% 15/1/2012 160,059 0.01
EUR 500,000 Royal Bank of Canada 3.875%
31/10/2011 502,118 0.02
EUR 500,000 Royal Bank of Canada 4.5% 5/11/2012 517,047 0.03
1,179,224 0.06
Cayman Islands EUR 1,350,000 Hutchison Whampoa Finance 09 Ltd
4.75% 14/11/2016 1,416,845 0.07
USD 3,000,000 Hutchison Whampoa International 09/16
Ltd 4.625% 11/9/2015 2,235,629 0.12
EUR 900,000 Thames Water Utilities Cayman Finance
Ltd 6.125% 4/2/2013 950,810 0.05
4,603,284 0.24
Denmark EUR 5,805,000 FIH Erhvervsbank A/S 2.125% 21/3/2013 5,865,488 0.31
EUR 3,000,000 TDC A/S 6.5% 19/4/2012 3,081,180 0.16
8,946,668 0.47
Finland EUR 11,905,000 Finland Government Bond 3.375%
15/4/2020 12,713,111 0.67
EUR 10,000,000 Finland Government Bond 4% 4/7/2025 11,050,700 0.58
GBP 19,250,000 Finland Government International Bond
FRN 25/3/2015 21,749,270 1.15
EUR 6,500,000 Nordea Bank Finland Plc 2.5% 2/6/2014 6,610,338 0.35
EUR 4,400,000 OP Mortgage Bank 3.125% 19/11/2014 4,556,046 0.24
56,679,465 2.99
France EUR 7,100,000 Alstom SA 3.625% 5/10/2018 * 6,766,051 0.36
EUR 2,500,000 AUTO ABS Srl '2006-1 B' FRN 25/7/2017 2,442,166 0.13
EUR 3,000,000 AXA SA 4.5% 23/1/2015 3,076,245 0.16
EUR 300,000 AXA SA 6% 18/6/2013 317,078 0.02
EUR 5,000,000 Banque PSA Finance 3.625% 14/10/2011 5,007,975 0.26
EUR 1,000,000 Banque PSA Finance 3.875% 18/1/2013 1,004,480 0.05
EUR 2,200,000 Banques Populaires Covered Bond 4.25%
29/1/2013 2,274,888 0.12
USD 5,000,000 BNP Paribas / BNP Paribas US Medium-
Term Note Program LLC 2.125%
21/12/2012 3,413,643 0.18
EUR 8,000,000 BNP Paribas Home Loan Covered Bonds
SFH 2.25% 1/10/2012 8,039,600 0.42
EUR 6,500,000 BNP Paribas SA FRN 13/5/2014 6,345,463 0.34
EUR 2,000,000 BNP Paribas SA 3.25% 27/3/2012 2,012,650 0.11
EUR 500,000 BNP Paribas SA 5% 16/12/2013 529,148 0.03
EUR 3,500,000 Credit Agricole Home Loan SFH 2.625%
28/1/2014 3,543,207 0.19
EUR 9,000,000 Credit Mutuel - CIC Home Loan SFH
1.875% 14/6/2013 9,007,875 0.48
EUR 1,900,000 Crown European Holdings SA 7.125%
15/8/2018 1,819,250 0.10
EUR 15,580,000 Dexia Credit Local SA 2.625% 21/1/2014 15,742,967 0.83
EUR 2,000,000 France Government Bond OAT 3.75%
25/4/2021 2,159,900 0.11
EUR 23,820,000 France Government Bond OAT 4%
25/4/2060 25,019,099 1.32
EUR 50,000 French Treasury Note BTAN 3.75%
12/1/2013 51,907 0.00
EUR 5,000,000 GCE Covered Bonds 2.75% 14/1/2015 5,063,275 0.27
EUR 2,650,000 GDF Suez 4.375% 16/1/2012 2,679,415 0.14
EUR 142,000 GDF Suez 6.25% 24/1/2014 156,059 0.01
EUR 9,000,000 HSBC Covered Bonds France 3.375%
20/1/2017 9,292,230 0.49
EUR 500,000 HSBC France 4.875% 15/1/2014 530,150 0.03
EUR 2,750,000 LVMH Moet Hennessy Louis Vuitton SA
4.375% 12/5/2014 2,908,771 0.15
EUR 5,000,000 RCI Banque SA 8.125% 15/5/2012 5,175,800 0.27
EUR 1,000,000 Sanofi 3.5% 17/5/2013 1,029,890 0.05
EUR 3,000,000 Societe Financement de l'Economie
Francaise 3% 7/4/2014 3,111,480 0.16
EUR 4,000,000 Societe Financement de l'Economie
Francaise 3.25% 16/1/2014 4,163,800 0.22
EUR 1,000,000 Societe Generale SCF 4.75% 6/6/2013 1,051,985 0.06
EUR 700,000 Unibail-Rodamco SE 4.625% 23/9/2016 751,097 0.04
EUR 156,000 Veolia Environnement SA 5.25%
24/4/2014 166,625 0.01
134,654,169 7.11
Germany EUR 29,775,000 Bundesobligation 2.25% 11/4/2014 30,953,495 1.63
EUR 34,740,000 Bundesobligation 2.5% 10/10/2014 36,437,918 1.92
EUR 130,000,000 Bundesobligation 3.5% 12/4/2013 135,874,050 7.17
EUR 51,150,000 Bundesobligation 4% 11/10/2013 54,686,767 2.89
Portfolio of Investments 31 August 2011
Transferable Securities Admitted to an Official Stock Exchange Listing or Dealt in on Another Regulated Market
Holding Description Value (EUR) %
Transferable Securities Admitted to an Official Stock Exchange Listing or Dealt in on Another Regulated Market
Holding Description Value (EUR) %

Audited Annual Report and Accounts 91
The notes on pages 261 to 270 form an integral part of these financial statements.
Euro Short Duration Bond Fund continued
EUR 5,930,000 Bundesrepublik Deutschland 2.25%
4/9/2020 6,020,551 0.32
EUR 16,760,000 Bundesrepublik Deutschland 3%
4/7/2020 18,070,213 0.95
EUR 15,010,000 Bundesrepublik Deutschland 3.25%
4/1/2020 16,500,568 0.87
EUR 1,050,000 Bundesrepublik Deutschland 3.5%
4/7/2019 1,172,761 0.06
EUR 850,000 Bundesrepublik Deutschland 4% 4/1/2018 972,217 0.05
EUR 895,000 Bundesrepublik Deutschland 4.25%
4/7/2017 1,031,241 0.06
EUR 41,076,000 Bundesrepublik Deutschland 4.75%
4/7/2040 54,279,880 2.87
EUR 50,200,000 Bundesrepublik Deutschland
Bundesobligation Inflation
Linked Bond 2.25% 15/4/2013 57,184,101 3.02
EUR 5,000,000 Commerzbank AG 2.75% 13/1/2012 5,027,000 0.27
EUR 4,000,000 Daimler AG 4.625% 2/9/2014 4,246,780 0.22
USD 5,000,000 Deutsche Bank AG/London 2.375%
11/1/2013 3,470,150 0.18
EUR 9,300,000 Eurohypo AG 1.875% 1/10/2013 9,295,676 0.49
GBP 16,400,000 FMS Wertmanagement FRN 11/4/2012 18,539,625 0.98
EUR 4,700,000 FMS Wertmanagement 1.875%
24/8/2015 4,701,645 0.25
EUR 40,800,000 FMS Wertmanagement 2.25% 14/7/2014 41,574,180 2.19
EUR 9,500,000 FMS Wertmanagement 3.375%
17/6/2021 9,807,325 0.52
EUR 10,000,000 Gemeinsame Deutsche Bundeslaender 3%
17/5/2016 10,392,900 0.55
EUR 10,000,000 IKB Deutsche Industriebank AG 2.125%
10/9/2012 10,084,300 0.53
EUR 13,000,000 Kreditanstalt fuer Wiederaufbau 2.625%
16/8/2019 13,033,215 0.69
EUR 6,894,000 Kreditanstalt fuer Wiederaufbau 3.125%
8/4/2016 7,258,382 0.38
EUR 20,000,000 Landesbank Baden-Wuerttemberg FRN
30/12/2015 19,788,300 1.04
EUR 1,480,000 Merck Financial Services GmbH 2.125%
26/3/2012 1,483,744 0.08
EUR 3,110,000 State of Hessen 3.125% 13/5/2014 3,236,795 0.17
EUR 1,880,000 UPC Germany GmbH 8.125% 1/12/2017 1,899,627 0.10
EUR 3,425,000 Volkswagen Financial Services AG 6.875%
15/1/2014 3,779,299 0.20
580,802,705 30.65
Greece EUR 5,330,000 Hellenic Republic Government Bond
FRN 20/2/2013 2,984,800 0.16
EUR 19,140,000 Hellenic Republic Government Bond
3.6% 20/7/2016 9,529,710 0.50
EUR 2,552,000 Hellenic Republic Government Bond
5.25% 18/5/2012 1,828,508 0.10
14,343,018 0.76
Hungary EUR 2,730,000 Hungary Government International Bond
6% 11/1/2019 2,695,875 0.14
Ireland EUR 2,620,000 Ardagh Packaging Finance Plc 7.375%
15/10/2017 2,436,613 0.13
EUR 1,540,265 Cars Alliance Funding Plc '2007-1 A' FRN
8/10/2023 1,523,323 0.08
EUR 2,000,000 Caterpillar International Finance Ltd
2.375% 17/6/2013 2,029,290 0.11
EUR 800,000 Caterpillar International Finance Ltd 2.75%
6/6/2014 815,888 0.04
EUR 13,225,000 EBS Ltd 4% 25/2/2015 9,636,991 0.51
EUR 12,000,000 Ireland Government Bond 4% 15/1/2014 10,996,320 0.58
EUR 3,000,000 Ireland Government Bond 4.5%
18/4/2020 2,342,025 0.12
EUR 3,370,000 Ireland Government Bond 5% 18/10/2020 2,660,025 0.14
EUR 3,000,000 Ireland Government Bond 5.9%
18/10/2019 2,571,135 0.14
EUR 1,520,000 Smurfit Kappa Acquisitions 7.25%
15/11/2017 1,449,381 0.08
EUR 450,000 Smurfit Kappa Acquisitions 7.75%
15/11/2019 430,079 0.02
EUR 13,572,359 Talisman Finance Plc '7A' FRN
22/4/2017 10,688,232 0.56
EUR 436,659 Talisman Finance Plc '7H' FRN
22/4/2017 43,666 0.00
47,622,968 2.51
Italy EUR 1,500,000 ENI SpA 5.875% 20/1/2014 1,607,273 0.09
GBP 250,000 Intesa Sanpaolo SpA FRN 18/3/2024 256,357 0.01
EUR 7,000,000 Intesa Sanpaolo SpA 2.625% 4/12/2012 6,898,605 0.36
EUR 1,226,000 Intesa Sanpaolo SpA 4.375% 16/8/2016 1,230,144 0.07
EUR 7,930,000 Italy Buoni Poliennali Del Tesoro 2.1%
15/9/2016 7,729,517 0.41
EUR 13,125,000 Italy Buoni Poliennali Del Tesoro 2.1%
15/9/2021 11,634,651 0.61
EUR 69,545,000 Italy Buoni Poliennali Del Tesoro 2.25%
1/11/2013 67,577,224 3.57
EUR 17,300,000 Italy Buoni Poliennali Del Tesoro 3%
1/4/2014 16,971,300 0.90
EUR 20,830,000 Italy Buoni Poliennali Del Tesoro 3.75%
15/12/2013 20,874,576 1.10
EUR 6,209,000 Italy Buoni Poliennali Del Tesoro 3.75%
15/4/2016 6,080,132 0.32
EUR 7,000,000 Italy Buoni Poliennali Del Tesoro 4.25%
15/4/2013 7,089,005 0.37
EUR 50,000 Italy Buoni Poliennali Del Tesoro 4.25%
1/2/2015 50,429 0.00
EUR 2,825,000 Italy Buoni Poliennali Del Tesoro 4.5%
1/2/2018 2,819,971 0.15
EUR 4,352,000 Italy Buoni Poliennali Del Tesoro 5%
1/9/2040 3,713,083 0.20
EUR 3,000,000 Italy Certificati di Credito del Tesoro FRN
1/3/2012 3,002,250 0.16
EUR 3,000,000 Italy Certificati di Credito del Tesoro FRN
1/7/2013 2,920,800 0.15
EUR 4,500,000 UniCredit SpA 4.875% 12/2/2013 4,490,708 0.24
GBP 200,000 UniCredit SpA 5% 1/2/2016 175,965 0.01
165,121,990 8.72
Jersey EUR 200,000 BAA Funding Ltd 3.975% 15/2/2012 201,581 0.01
Luxembourg EUR 10,000,000 Bumper 2 SA '2011-2 A' FRN 23/2/2023 9,999,990 0.53
EUR 530,000 Clariant Finance Luxembourg SA 4.375%
5/4/2013 535,570 0.03
EUR 2,790,000 Fiat Finance & Trade SA 5.625%
15/11/2011 2,800,281 0.15
EUR 3,400,000 ITW Finance Europe SA 5.25%
1/10/2014 3,733,795 0.19
17,069,636 0.90
Portfolio of Investments 31 August 2011
Transferable Securities Admitted to an Official Stock Exchange Listing or Dealt in on Another Regulated Market
Holding Description Value (EUR) %
Transferable Securities Admitted to an Official Stock Exchange Listing or Dealt in on Another Regulated Market
Holding Description Value (EUR) %

92 BlackRock Global Funds (BGF)
Euro Short Duration Bond Fund continued
Netherlands EUR 2,500,000 ABN Amro Bank NV 3.75% 15/7/2014 2,621,575 0.14
EUR 3,300,000 Alliander Nv 4% 20/4/2012 3,349,170 0.18
EUR 600,000 Allianz Finance II BV FRN 17/2/2017
(Perpetual) 476,100 0.02
EUR 6,000,000 Allianz Finance II BV FRN 31/5/2022 5,934,180 0.31
EUR 3,700,000 Allianz Finance II BV FRN 8/7/2041 3,144,908 0.17
EUR 5,500,000 Bank Nederlandse Gemeenten 2.875%
15/1/2015 5,687,687 0.30
EUR 10,100,000 Bumper 2 SA '2011-4 A' FRN 20/5/2026 10,094,162 0.53
EUR 13,700,000 Cooperatieve Centrale Raiffeisen-
Boerenleenbank BA/Netherlands
FRN 11/5/2012 13,718,077 0.72
EUR 4,700,000 Cooperatieve Centrale Raiffeisen-
Boerenleenbank BA/Netherlands
FRN 30/8/2012 4,702,562 0.25
EUR 500,000 Daimler International Finance BV 5.875%
8/9/2011 500,182 0.03
EUR 250,000 Deutsche Telekom International Finance
BV 8.125% 29/5/2012 261,355 0.01
EUR 13,081,751 E-MAC NL BV 'DE09-1 A1' FRN
25/11/2053 13,052,252 0.69
EUR 275,000 Enbw International Finance BV 6.125%
7/7/2039 305,191 0.02
EUR 1,588,000 Fortis Bank Nederland NV 3.375%
19/5/2014 1,665,987 0.09
EUR 5,294,308 Globaldrive BV '2008-2 A' 4% 20/10/2016 5,349,663 0.28
EUR 1,000,000 Heineken NV 5% 4/11/2013 1,056,020 0.06
USD 5,000,000 ING Bank NV FRN 23/5/2016 3,185,255 0.17
EUR 12,000,000 ING Bank NV 2.25% 23/9/2013 11,970,120 0.63
EUR 17,700,000 ING Bank NV 3.25% 3/3/2016 18,206,928 0.96
EUR 1,250,000 ING Bank NV 3.375% 3/3/2014 1,307,494 0.07
EUR 1,500,000 ING Bank NV 5.5% 4/1/2012 1,505,873 0.08
EUR 100,000 ING Verzekeringen NV 3.5% 28/11/2012 100,802 0.01
EUR 5,250,000 ING Verzekeringen NV 4% 18/9/2013 5,367,127 0.28
EUR 1,524,000 Koninklijke KPN NV 5% 13/11/2012 1,575,298 0.08
EUR 1,720,000 LeasePlan Corp NV 3.25% 22/5/2014 1,797,968 0.09
USD 10,220,000 MDC-GMTN B.V. 3.75% 20/4/2016 7,386,416 0.39
EUR 1,000,000 Nederlandse Gasunie NV 6% 30/10/2013 1,094,550 0.06
EUR 5,665,000 Nederlandse Waterschapsbank NV 2.375%
4/6/2015 5,758,189 0.30
EUR 1,450,000 Nederlandse Waterschapsbank NV 4.25%
21/11/2013 1,536,790 0.08
EUR 6,010,000 Netherlands Government Bond 4%
15/7/2018 6,718,609 0.35
EUR 2,783,000 New World Resources NV 7.875%
1/5/2018 2,674,407 0.14
EUR 2,000,000 Rodamco Europe Finance BV 3.75%
12/12/2012 2,039,880 0.11
EUR 500,000 RWE Finance BV 5.75% 20/11/2013 539,060 0.03
EUR 875,000 Schlumberger Finance BV 4.5% 25/3/2014 927,955 0.05
EUR 1,085,000 Shell International Finance BV 3.375%
9/2/2012 1,093,165 0.06
EUR 7,550,000 Siemens Financieringsmaatschappij NV
4.125% 20/2/2013 7,799,188 0.41
EUR 100,000 Siemens Financieringsmaatschappij NV
5.25% 12/12/2011 100,998 0.01
EUR 12,215,000 SNS Bank NV 2.875% 30/1/2012 12,297,146 0.65
EUR 700,000 Urenco Finance NV 5.375% 22/5/2015 762,006 0.04
EUR 2,500,000 Volkswagen International Finance NV
5.625% 9/2/2012 2,540,212 0.13
170,204,507 8.98
Norway EUR 2,000,000 DnB NOR Bank ASA 5.875% 20/6/2013 2,130,510 0.11
EUR 3,650,000 DnB NOR Boligkreditt 2.625% 11/1/2016 3,694,749 0.20
USD 6,935,000 Eksportfinans ASA 3% 17/11/2014 5,093,153 0.27
EUR 700,000 Statkraft AS 5.5% 2/4/2015 773,717 0.04
EUR 3,200,000 Statoil ASA 4.375% 11/3/2015 3,447,936 0.18
15,140,065 0.80
Poland PLN 113,000,000 Poland Government Bond 5.25%
25/10/2020 26,661,155 1.41
EUR 1,203,000 Poland Government International Bond
5.875% 3/2/2014 1,296,220 0.07
27,957,375 1.48
Portugal EUR 3,500,000 Portugal Obrigacoes do Tesouro OT
3.35% 15/10/2015 2,660,228 0.14
EUR 2,500,000 Portugal Obrigacoes do Tesouro OT
5% 15/6/2012 2,366,750 0.13
EUR 1,190,000 Portugal Obrigacoes do Tesouro OT
6.4% 15/2/2016 980,768 0.05
6,007,746 0.32
Spain EUR 1,000,000 Ayt Cedulas Cajas Global 4.25%
29/7/2014 958,700 0.05
EUR 10,200,000 Banco Bilbao Vizcaya Argentaria SA
4.25% 30/3/2015 10,216,932 0.54
EUR 9,000,000 Banco Espanol de Credito SA 4.625%
30/3/2015 9,063,720 0.48
EUR 9,400,000 Banco Financiero y de Ahorros SA
3.875% 30/11/2013 9,313,050 0.49
EUR 6,200,000 Banco Financiero y de Ahorros SA
5.25% 7/4/2016 6,219,344 0.33
EUR 1,500,000 Banco Santander SA 3.125% 28/1/2015 1,454,318 0.08
EUR 1,200,000 Banco Santander SA 4.375% 16/3/2015 1,209,600 0.06
EUR 2,400,000 Banco Santander SA 4.625% 20/1/2016 2,423,328 0.13
EUR 8,100,000 Caja de Ahorros de Asturias 3.5%
8/10/2013 7,947,315 0.42
EUR 3,000,000 Caja de Ahorros y Monte de Piedad de
Gipuzkoa y San Sebastian 5.125%
8/4/2015 * 3,026,145 0.16
EUR 6,400,000 Cedulas TDA 6 Fondo de Titulizacion de
Activos 4.25% 10/4/2031 3,855,552 0.20
EUR 4,000,000 Fund for Ordered Bank Restructuring
5.5% 12/7/2016 4,079,800 0.21
EUR 29,100,000 Instituto de Credito Oficial 2.875%
15/11/2013 28,420,806 1.50
EUR 10,000,000 Instituto de Credito Oficial 3.75%
28/7/2015 9,702,250 0.51
EUR 1,878,000 Instituto de Credito Oficial 4.375%
31/3/2014 1,882,488 0.10
GBP 5,002,000 Instituto de Credito Oficial 4.5%
7/3/2013 5,673,126 0.30
EUR 1,600,000 Santander International Debt SA
Unipersonal 3.5% 10/3/2015 1,517,088 0.08
EUR 4,200,000 Spain Government Bond 3.25%
30/4/2016 4,027,779 0.21
EUR 2,800,000 Spain Government Bond 3.4%
30/4/2014 2,778,636 0.15
EUR 3,500,000 Spain Government Bond 3.9%
31/10/2012 3,527,912 0.19
EUR 7,800,000 Spain Government Bond 4.2%
31/1/2037 6,105,606 0.32
EUR 18,240,000 Spain Government Bond 4.85%
31/10/2020 18,164,578 0.96
EUR 15,000,000 Spain Government Bond 5% 30/7/2012 15,277,875 0.81
EUR 3,650,000 Telefonica Emisiones SAU 5.58%
12/6/2013 3,784,010 0.20
160,629,958 8.48
Portfolio of Investments 31 August 2011
Transferable Securities Admitted to an Official Stock Exchange Listing or Dealt in on Another Regulated Market
Holding Description Value (EUR) %
Transferable Securities Admitted to an Official Stock Exchange Listing or Dealt in on Another Regulated Market
Holding Description Value (EUR) %

Audited Annual Report and Accounts 93
The notes on pages 261 to 270 form an integral part of these financial statements.
Euro Short Duration Bond Fund continued
Sweden EUR 5,469,000 Lansforsakringar Hypotek AB 2.875%
23/3/2015 5,588,224 0.30
EUR 1,500,000 Nordea Bank AB 4.5% 12/5/2014 1,585,410 0.08
EUR 1,750,000 Skandinaviska Enskilda Banken AB
4.375% 29/5/2012 1,780,800 0.09
USD 8,000,000 Svensk Exportkredit AB 3.25%
16/9/2014 5,932,175 0.31
EUR 2,065,000 Svensk Exportkredit AB 3.625%
27/5/2014 2,170,552 0.11
EUR 5,000,000 Svenska Handelsbanken AB FRN
19/10/2017 4,850,000 0.26
EUR 5,000,000 Svenska Handelsbanken AB 3%
20/8/2012 5,055,250 0.27
SEK 120,170,000 Swedish Covered Bond Corp 4%
11/4/2012 13,268,593 0.70
EUR 350,000 Vattenfall Treasury AB 5.75%
5/12/2013 378,886 0.02
40,609,890 2.14
Switzerland EUR 3,000,000 Credit Suisse AG/London 4.75%
5/8/2019 3,081,285 0.17
EUR 5,000,000 Credit Suisse AG/London 5.125%
30/3/2012 5,091,225 0.27
EUR 5,000,000 Credit Suisse AG/London 6.125%
5/8/2013 5,347,000 0.28
EUR 4,500,000 UBS AG/London 4.625% 6/7/2012 4,596,232 0.24
EUR 1,250,000 UBS AG/London 4.875% 21/1/2013 1,290,094 0.07
19,405,836 1.03
United Kingdom EUR 6,500,000 Abbey National Treasury Services Plc/
London 2.875% 14/6/2013 6,571,630 0.35
GBP 3,100,000 Abbey National Treasury Services Plc/
London 5.125% 14/4/2021 3,739,060 0.20
EUR 3,050,000 Anglian Water Services Financing Plc
4.625% 7/10/2013 3,209,744 0.17
EUR 9,785,000 Arkle Master Issuer Plc '2006-1X 5A1'
FRN 17/2/2052 9,689,645 0.51
EUR 1,500,000 Aviva Plc FRN 29/9/2015 (Perpetual) 1,243,125 0.07
EUR 4,000,000 Aviva Plc FRN 14/11/2021 3,960,040 0.21
EUR 9,490,000 Barclays Bank Plc 2.125% 8/9/2015 9,467,793 0.50
GBP 1,060,282 BL Superstores Finance Plc FRN
4/10/2015 1,138,112 0.06
GBP 4,260,629 Broadgate Financing Plc FRN 5/1/2022 4,091,773 0.22
GBP 2,470,000 Coventry Building Society 4.625%
19/4/2018 2,905,418 0.15
EUR 500,000 Diageo Finance Plc 6.625% 5/12/2014 566,990 0.03
GBP 1,076,074 Eurosail Plc '2007-1X A2C' FRN
13/3/2045 1,201,570 0.06
EUR 1,550,000 FCE Bank Plc 9.375% 17/1/2014 1,619,750 0.09
GBP 9,200,000 Fosse Master Issuer Plc '2011-1X A6'
FRN 18/10/2054 10,370,683 0.55
EUR 6,150,000 GlaxoSmithKline Capital Plc 5.125%
13/12/2012 6,402,211 0.34
EUR 3,743,109 Gosforth Funding Plc '2011-1 A1B' FRN
24/4/2047 3,742,852 0.20
EUR 2,500,000 HSBC Bank Plc FRN 8/4/2013 2,500,100 0.13
EUR 900,000 HSBC Bank Plc 3.75% 30/11/2016 926,460 0.05
USD 6,000,000 HSBC Holdings Plc FRN 6/10/2016 4,102,747 0.22
EUR 3,000,000 Imperial Tobacco Finance Plc 5%
25/6/2012 3,068,340 0.16
EUR 200,000 Imperial Tobacco Finance Plc 7.25%
15/9/2014 224,957 0.01
EUR 800,000 Lloyds TSB Bank Plc 3.25% 26/11/2012 801,156 0.04
EUR 150,000 Lloyds TSB Bank Plc 6.25% 15/4/2014 158,545 0.01
GBP 1,070,000 London Power Networks Plc 5.375%
11/11/2016 1,326,882 0.07
GBP 7,422,881 Mall Funding Plc/The FRN 22/4/2017 7,170,983 0.38
EUR 750,000 National Grid Electricity Transmission Plc
6.625% 28/1/2014 827,741 0.04
GBP 1,125,000 Old Mutual Plc 7.125% 19/10/2016 1,394,107 0.07
GBP 4,104,680 Premiertel Plc Series B 6.175%
8/5/2032 4,044,206 0.21
GBP 300,000 Priory Group No 3 Plc 7% 15/2/2018 312,813 0.02
GBP 8,671,000 Residential Mortgage Securities FRN
16/12/2050 9,716,682 0.51
EUR 3,285,000 Royal Bank of Scotland Plc/The 3.625%
17/5/2013 3,264,255 0.17
EUR 1,620,000 Royal Bank of Scotland Plc/The 4%
15/3/2016 1,677,640 0.09
EUR 1,000,000 Standard Chartered Bank FRN
28/3/2018 949,740 0.05
EUR 8,777,000 Tesco Plc 5.625% 12/9/2012 9,104,075 0.48
GBP 12,857,281 Titan Europe Plc/Ireland '2006-4FSX A1'
FRN 3/9/2014 13,587,371 0.72
GBP 8,977,033 Turbo Finance '2011-1 A' FRN
20/1/2019 10,155,144 0.54
GBP 4,677,931 Unique Pub Finance Co Plc/The FRN
30/9/2013 4,651,323 0.25
GBP 4,208,000 Unique Pub Finance Co Plc/The 5.659%
30/6/2027 3,251,389 0.17
GBP 3,800,000 Unique Pub Finance Co Plc/The 6.542%
30/3/2021 3,292,627 0.17
GBP 3,692,000 Unique Pub Finance Co Plc/The Series
M 7.395% 28/3/2024 2,732,434 0.14
GBP 4,870,000 United Kingdom Gilt 4% 22/1/2060 5,687,666 0.30
GBP 1,220,000 United Kingdom Gilt Inflation Linked
2.5% 26/7/2016 4,639,585 0.24
GBP 1,702,000 Virgin Media Secured Finance Plc 7%
15/1/2018 2,011,369 0.11
EUR 2,500,000 Vodafone Group Plc 3.625%
29/11/2012 2,553,862 0.13
GBP 2,550,000 Vodafone Group Plc 5.375% 5/12/2017 3,221,509 0.17
EUR 225,000 Vodafone Group Plc 6.875%
4/12/2013 249,240 0.01
177,525,344 9.37
United States EUR 5,803,000 Ahold Finance USA LLC 5.875%
14/3/2012 5,914,185 0.31
GBP 2,650,000 American Express Credit Corp 5.375%
1/10/2014 3,183,206 0.17
EUR 500,000 American International Group Inc 4%
20/9/2011 499,713 0.03
EUR 2,500,000 Bank of America Corp FRN 28/3/2018 2,017,163 0.11
EUR 2,500,000 Cellco Partnership / Verizon Wireless
Capital LLC 7.625% 19/12/2011 2,543,475 0.13
USD 1,000,000 Commercial Mortgage Pass Through
Certificates '2003-LB1A A2' 4.084%
10/6/2038 711,864 0.04
USD 583,524 Countrywide Alternative Loan Trust
'2005-54CB 3A4' 5.5% 25/11/2035 324,337 0.02
USD 677,204 Countrywide Alternative Loan Trust
'2005-54CB 2A4' 5.5% 25/11/2035 391,706 0.02
USD 225,003 Countrywide Home Loan Mortgage Pass
Through Trust '2007-10 A22' 6%
25/7/2037 121,837 0.01
Portfolio of Investments 31 August 2011
Transferable Securities Admitted to an Official Stock Exchange Listing or Dealt in on Another Regulated Market
Holding Description Value (EUR) %
Transferable Securities Admitted to an Official Stock Exchange Listing or Dealt in on Another Regulated Market
Holding Description Value (EUR) %

* Securities lent, see Note 11, for further details.
94 BlackRock Global Funds (BGF)
Euro Short Duration Bond Fund continued
Portfolio of Investments 31 August 2011
USD 1,552,131 GE Capital Commercial Mortgage Corp
'2007-C1 A2' 5.417% 10/12/2049 1,083,688 0.06
EUR 2,000,000 Goldman Sachs Group Inc/The 4.375%
16/3/2017 1,919,020 0.10
EUR 100,000 Goldman Sachs Group Inc/The 5.375%
15/2/2013 101,620 0.01
USD 229,621 GSAA Home Equity Trust FRN 25/3/2047 76,996 0.00
USD 508,094 GSR Mortgage Loan Trust '2007-4F 3A1'
6% 25/7/2037 312,167 0.02
USD 379,997 Indymac IMJA Mortgage Loan Trust
'2007-A1 A4' 6% 25/8/2037 223,967 0.01
EUR 1,800,000 International Business Machines Corp
6.625% 30/1/2014 1,996,461 0.11
USD 162,933 JP Morgan Mortgage Trust '2007-S1 2A22'
5.75% 25/3/2037 98,170 0.01
USD 118,633 JP Morgan Mortgage Trust '2006-S3 1A12'
6.5% 25/8/2036 76,330 0.00
EUR 4,800,000 JPMorgan Chase & Co 4.375%
30/1/2014 4,955,616 0.26
EUR 1,000,000 JPMorgan Chase & Co 5.25% 8/5/2013 1,041,205 0.05
USD 2,000,000 Kraft Foods Inc 2.625% 8/5/2013 1,415,751 0.07
GBP 2,900,000 Kraft Foods Inc 5.375% 11/12/2014 3,558,020 0.19
EUR 1,500,000 Kraft Foods Inc 5.75% 20/3/2012 1,530,825 0.08
EUR 14,953,000 MBNA Credit Card Master Note Trust
'2002-A2 A' 5.6% 17/7/2014 15,159,501 0.80
EUR 300,000 Morgan Stanley FRN 20/7/2012 294,537 0.02
EUR 3,350,000 New York Life Global Funding FRN
20/12/2013 3,287,142 0.17
USD 2,000,000 Novartis Capital Corp 1.9% 24/4/2013 1,417,704 0.07
EUR 950,000 Pfizer Inc 3.625% 3/6/2013 979,901 0.05
USD 2,329,000 Prudential Financial Inc 2.75%
14/1/2013 1,633,670 0.09
USD 6,000,000 Prudential Financial Inc 3.625%
17/9/2012 4,250,843 0.22
GBP 4,200,000 SLM Student Loan Trust Series B FRN
26/4/2038 3,494,807 0.18
EUR 7,280,000 Swiss Re Treasury US Corp 6%
18/5/2012 7,449,733 0.39
USD 1,000,000 TIAA Seasoned Commercial Mortgage
Trust '2007-C4 A3' FRN 15/8/2039 752,801 0.04
USD 11,300,000 Time Warner Cable Inc 3.5% 1/2/2015 8,234,883 0.43
USD 450,000 Time Warner Cable Inc 8.25%
14/2/2014 359,700 0.02
USD 1,325,000 United States Treasury Note/Bond
2.625% 31/7/2014 978,778 0.05
USD 38,049 Wells Fargo Mortgage Backed Securities
Trust '2007-10 1A21' 6% 25/7/2037 25,919 0.00
EUR 100,000 WM Covered Bond Program 4%
27/9/2016 104,157 0.01
EUR 500,000 Zurich Finance USA Inc 4.875%
14/4/2012 507,700 0.03
83,029,098 4.38
Total Bonds 1,834,289,994 96.81
Total Transferable Securities Admitted
to an Official Stock Exchange Listing or
Dealt in on Another Regulated Market 1,875,193,766 98.97
Unquoted Securities
BONDS
Bahrain USD 465,000 Golden Belt 1 Sukuk Co BSC (Defaulted)
FRN 15/5/2012 57,143 0.00
United States USD 1,800,000 Metropolitan Life Global Funding I
2.875% 17/9/2012 1,265,821 0.07
Total Bonds 1,322,964 0.07
Total Unquoted Securities 1,322,964 0.07
Total Portfolio 1,876,516,730 99.04
Other Net Assets 18,217,032 0.96
Total Net Assets (EUR) 1,894,733,762 100.00
Transferable Securities Admitted to an Official Stock Exchange Listing or Dealt in on Another Regulated Market
Holding Description Value (EUR) %
Transferable Securities Admitted to an Official Stock Exchange Listing or Dealt in on Another Regulated Market
Holding Description Value (EUR) %

Audited Annual Report and Accounts 95
The notes on pages 261 to 270 form an integral part of these financial statements.
Euro Short Duration Bond Fund continued
Nominal Value Description
Unrealisedprofit/(loss)
EUR
Nominal Value Description
Unrealisedprofit/(loss)
EUR
Swaps as at 31 August 2011
EUR 400,000,000 Interest Rate Swaps (Morgan Stanley) (Fund receives
Fixed 1.484%; and pays Floating EUR EURIBOR
6 Month) (31/3/2012) (629,724)
MYR 153,652,000 Interest Rate Swaps (Citibank) (Fund receives Fixed
3.575%; and pays Floating KLIBOR 3 Month)
(26/1/2013) 162,802
MYR 104,365,000 Interest Rate Swaps (Citibank) (Fund receives Fixed
3.495%; and pays Floating MYR KLIB3M 3 Month)
(22/3/2013) 91,401
HUF 10,676,635,000 Interest Rate Swaps (Barclays) (Fund receives Floating
HUF BUBOR 6 Month; and pays Fixed 6.39%)
(19/5/2013) (311,420)
PLN 152,365,000 Interest Rate Swaps (Barclays) (Fund receives Fixed
5.18%; and pays Floating PLN WIBOR 6 Month)
(19/5/2013) 375,824
CNY 707,000,000 Interest Rate Swaps (Morgan Stanley) (Fund receives
Fixed 3.83%; and pays Floating CNY CNRR 28 Days)
(30/6/2013) (537,450)
CNY 433,010,000 Interest Rate Swaps (HSBC) (Fund receives Fixed
3.86%; and pays Floating CNY CNRR 28 Days)
(15/7/2013) (305,823)
ZAR 247,875,000 Interest Rate Swaps (Deutsche Bank) (Fund receives
Floating ZAR JIBOR 3 Month; and pays
Fixed 8.02%) (6/2/2014) (1,079,379)
ZAR 371,812,500 Interest Rate Swaps (Barclays) (Fund receives
Floating ZAR JIBAR 3 Month; and pays
Fixed 7.95%) (7/2/2014) (1,571,082)
EUR 5,400,000 Credit Default Swaps (Goldman Sachs) (Fund
receives default protection on Banco Bilbao
Vizcaya Argentaria SA 4% 22/4/2013; and pays
Fixed 1%) (20/6/2014) 209,332
EUR 166,700,000 Interest Rate Swaps (Morgan Stanley) (Fund receives
Floating EUR EURIBOR 6 Month; and pays Fixed
2.443%) (31/3/2015) (3,667,756)
EUR (5,400,000) Credit Default Swaps (Deutsche Bank) (Fund provides
default protection on BBVA Senior Finance SA
Unipersonal 4.875% 23/1/2014; and receives
Fixed 1%) (20/6/2015) (120,512)
EUR 12,500,000 Credit Default Swaps (Morgan Stanley) (Fund receives
default protection on Akzo Nobel Sweden Finance
AB 7.75% 31/1/2014; and pays Fixed 1%)
(20/6/2015) 208,469
EUR 2,600,000 Credit Default Swaps (Barclays) (Fund receives default
protection on iTraxx Europe Sub Financials S14 V1;
and pays Fixed 1%) (20/12/2015) 190,913
MYR 69,144,000 Interest Rate Swaps (Citibank) (Fund receives Floating
KLIBOR 3 Month; and pays Fixed 4.2%)
(26/1/2016) (513,700)
USD 3,618,000 Credit Default Swaps (Goldman Sachs) (Fund receives
default protection on Hellenic Republic Government
Bond 5.9% 22/10/2022; and pays Fixed 1%)
(20/3/2016) 570,931
USD 3,612,000 Credit Default Swaps (Morgan Stanley) (Fund receives
default protection on Hellenic Republic Government
Bond 5.9% 22/10/2022; and pays Fixed 1%)
(20/3/2016) 571,221
USD 1,807,000 Credit Default Swaps (Citibank) (Fund receives default
protection on Hellenic Republic Government Bond
5.9% 22/10/2022; and pays Fixed 1%)
(20/3/2016) 258,794
USD 4,221,000 Credit Default Swaps (Goldman Sachs) (Fund receives
default protection on Hellenic Republic Government
Bond 5.9% 22/10/2022; and pays Fixed 1%)
(20/3/2016) 611,279
USD 4,214,000 Credit Default Swaps (Barclays) (Fund receives default
protection on Hellenic Republic Government Bond
5.9% 22/10/2022; and pays Fixed 1%)
(20/3/2016) 603,563
USD 3,612,000 Credit Default Swaps (Deutsche Bank) (Fund receives
default protection on Hellenic Republic Government
Bond 5.9% 22/10/2022; and pays Fixed 1%)
(20/3/2016) 556,235
MYR 43,945,000 Interest Rate Swaps (Citibank) (Fund receives Floating
MYR KLIB3M 3 Month; and pays Fixed 4.06%)
(22/3/2016) (266,361)
EUR 12,000,000 Credit Default Swaps (Goldman Sachs) (Fund receives
default protection on Koninklijke DSM NV 4%
10/11/2015; and pays Fixed 1%) (20/6/2016) 157,889
USD 4,081,000 Credit Default Swaps (Citibank) (Fund receives
default protection on Greece (Republic of) 5.9%
22/10/2022; and pays Fixed 1%) (20/6/2016) 480,855
USD 1,631,000 Credit Default Swaps (Barclays) (Fund receives
default protection on Greece (Republic of) 5.9%
22/10/2022; and pays Fixed 1%) (20/6/2016) 195,870
EUR 3,000,000 Credit Default Swaps (Barclays) (Fund receives default
protection on iTraxx Europe Sub Financials S15 V1;
and pays Fixed 1%) (20/6/2016) 50,487
EUR 3,500,000 Credit Default Swaps (Credit Suisse) (Fund receives
default protection on iTraxx Europe Sub Financials
S15 V1; and pays Fixed 1%) (20/6/2016) 230,451
CNY 185,000,000 Interest Rate Swaps (HSBC) (Fund receives Floating
CNY CNRR 28 Days; and pays Fixed 4.05%)
(15/7/2016) (69,962)
GBP (3,433,612) Inflation Swap (Goldman Sachs) (Fund pays floating
GBP Libor 6 Month + 65bps; and receives UKRPI
+ 0bps) (26/7/2016) (611,915)
EUR 5,000,000 Credit Default Swaps (Credit Suisse) (Fund receives
default protection on Koninklijke KPN NV 8.375%
1/10/2030; and pays Fixed 1%) (20/9/2016) 96,800
EUR (3,100,000) Credit Default Swaps (Credit Suisse) (Fund provides
default protection on Vodafone Group Plc 5%
4/8/2018; and receives Fixed 1%) (20/9/2016) (18,626)
EUR (2,500,000) Credit Default Swaps (Goldman Sachs) (Fund provides
default protection on Tesco Plc 6% 14/12/2029; and
receives Fixed 1%) (20/9/2016) (7,115)
USD (7,500,000) Credit Default Swaps (Deutsche Bank) (Fund provides
default protection on French (Republic of) 4.25%
25/4/2019; and receives Fixed 0.25%) 20/9/2016) 16,284
USD (24,665,000) Credit Default Swaps (Morgan Stanley) (Fund provides
default protection on French (Republic of) 4.25%
25/4/2019; and receives Fixed 0.25%) 20/9/2016) (43,418)
EUR (5,000,000) Credit Default Swaps (JP Morgan) (Fund provides
default protection on Anheuser Busch Inbev
NV 8.625% 30/1/2017; and receives Fixed 1%)
(20/9/2016) (80,548)
USD (7,500,000) Credit Default Swaps (Deutsche Bank) (Fund provides
default protection on French (Republic of) 4.25%
25/4/2019; and receives Fixed 0.25%)
20/9/2016) 27,024
EUR 4,000,000 Credit Default Swaps (Goldman Sachs) (Fund receives
default protection on Bertelsmann AG 4.75%
26/9/2016; and pays Fixed 1%) (20/9/2016) 92,427
EUR (4,250,000) Credit Default Swaps (Credit Suisse) (Fund provides
default protection on Lloyds TSB Bank Plc 6.375%
17/6/2016; and receives Fixed 1%) (20/9/2016) (135,871)
EUR (3,600,000) Credit Default Swaps (Deutsche Bank) (Fund provides
default protection on Lloyds TSB Bank Plc 3.375%
20/4/2015; and receives Fixed 1%) (20/9/2016) (115,091)
EUR 1,600,000 Credit Default Swaps (Deutsche Bank) (Fund receives
default protection on Banco Santander SA
9/8/2013; and pays Fixed 1%) (20/9/2016) 3,860
EUR 4,250,000 Credit Default Swaps (Credit Suisse) Fund receives
default protection on Royal Bank of Scotland Plc
4.25% 11/5/2016; and pays Fixed 1%)
(20/9/2016) 155,884

96 BlackRock Global Funds (BGF)
Euro Short Duration Bond Fund continued
Note: The total market value of EUR 2,903,535 of these transactions is included in the Statement of Net Assets (see Note 2c).
Nominal Value Description
Unrealisedprofit/(loss)
EUR
Nominal Value Description
Unrealisedprofit/(loss)
EUR
Swaps as at 31 August 2011
EUR (5,000,000) Credit Default Swaps (Goldman Sachs) (Fund provides
default protection on Anheuser Busch Inbev
NV 8.825% 30/1/2017; and receives Fixed 1%)
(20/9/2016) (73,278)
EUR 6,750,000 Credit Default Swaps (Citibank) (Fund receives
default protection on Koninklijke KPN NV 8.375%
1/10/2030; and pays Fixed 1%) (20/9/2016) 130,680
EUR 3,600,000 Credit Default Swaps (Deutsche Bank) (Fund receives
default protection on Royal Bank of Scotland Plc
6/12/2010; and pays Fixed 1%) (20/9/2016) 132,043
ZAR 113,860,000 Interest Rate Swaps (Deutsche Bank) (Fund receives
Fixed 8.7%; and pays Floating ZAR JIBOR 3 Month)
(6/2/2017) 985,966
ZAR 170,910,000 Interest Rate Swaps (Barclays) (Fund receives Fixed
8.64%; and pays Floating ZAR JIBAR 3 Month)
(7/2/2017) 1,436,199
EUR (3,000,000) Credit Default Swaps (Barclays) (Fund provides default
protection on iTraxx Europe Sub Financials S15 V1;
and receives Fixed 1%) (20/6/2021) (77,760)
GBP 36,875,000 Interest Rate Swaps (Citibank) (Fund receives Fixed
4.405%; and pays Floating GBP LIBOR 6 Month)
(29/7/2021) 680,441
SEK 371,255,000 Interest Rate Swaps (Citibank) (Fund receives Floating
SEK STIBOR 3 Month; and pays Fixed 3.505%)
(2/8/2021) (530,350)
HUF 1,356,440,000 Interest Rate Swaps (Deutsche Bank) (Fund receives
Floating HUF BUBOR 6 Month; and pays Fixed
6.58%) (19/8/2021) (32,997)
HUF 1,983,000,000 Interest Rate Swaps (Citibank) (Fund receives
Floating HUF BUBOR 6 Month; and pays Fixed 7%)
(29/8/2021) (300,120)
HUF 1,009,180,000 Interest Rate Swaps (Deutsche Bank) (Fund receives
Floating HUF BUBOR 6 Month; and pays Fixed
6.67%) (29/8/2021) (52,129)
HUF 1,941,275,000 Interest Rate Swaps (Deutsche Bank) (Fund receives
Floating HUF BUBOR 6 Month; and pays Fixed
7.23%) (29/8/2021) (428,689)
EUR 6,905,000 Interest Rate Swaps (Morgan Stanley) (Fund receives
Floating EUR EURIBOR 6 Month; and pays Fixed
2.856%) (15/10/2040) 413,669
EUR 3,100,000 Interest Rate Swaps (Morgan Stanley) (Fund receives
Floating EUR Euribor 6 Month; and pays Fixed
4.032%) (25/4/2041) (529,530)
EUR 5,485,000 Interest Rate Swaps (Morgan Stanley) (Fund receives
Fixed 3.74%; and pays Floating EUR EURIBOR
6 Month) (23/6/2041) 626,163
EUR 10,625,000 Interest Rate Swaps (Morgan Stanley) (Fund receives
Fixed 3.763%; and pays Floating EUR EURIBOR
6 Month) (11/7/2041) 1,262,385
EUR 4,250,000 Interest Rate Swaps (Morgan Stanley) (Fund receives
Floating EUR EURIBOR 6 Month; and pays Fixed
3.651%) (23/6/2049) (539,807)
EUR 21,550,000 Interest Rate Swaps (Deutsche Bank) (Fund receives
Floating EUR EURIBOR 6 Month; and pays Fixed
2.7725%) (8/11/2060) 2,074,165
EUR 8,360,000 Interest Rate Swaps (Morgan Stanley) (Fund receives
Floating EUR EURIBOR 6 Month; and pays Fixed
3.715%) (11/7/2061) (1,198,033)
(188,140)

Audited Annual Report and Accounts 97
The notes on pages 261 to 270 form an integral part of these financial statements.
Euro Short Duration Bond Fund continued
Open Futures Contractsas at 31 August 2011
Numberof contracts Contract/Description
Expirationdate
ValueEUR
10 Euro Bund September 2011 1,348,400
(237) 30 Year Euro-BUXL September 2011 (27,548,880)
(1,035) Euro BOBL September 2011 (126,311,400)
1,315 90 Day Sterling £ Future December 2011 183,888,612
(279) Long Gilt December 2011 (40,051,509)
(374) US Treasury 5 Year Note (CBT) December 2011 (31,762,890)
(616) Banker's Acceptance March 2012 (108,405,649)
(1,315) 90 Day Sterling £ Future September 2012 (183,981,475)
Total commitment (332,824,791)
Note: The net unrealised loss of EUR 6,689,298 attributed to these transactions is included
in the Statement of Net Assets (see Note 2c).
Purchased Call Options as at 31 August 2011
Number of contracts
subjectto Call Issuer
UnrealisedlossEUR
ValueEUR
113,870,000 OTC EUR/USD Call Option
strike price EUR 1.5
expiring on 27/9/2011 (99,295) 145,526
882,755,000 OTC HKD/USD Call Option
strike price HKD 7.7
expiring on 10/11/2011 (377,053) 39,687
Total Purchased Call Options (476,348) 185,213
Note: Purchased Call Options are included in the Statement of Net Assets (see Note 2c).
Written Call Options as at 31 August 2011
Number of contracts
subjectto Call Issuer
UnrealisedprofitEUR
ValueEUR
(882,755,000) OTC HKD/USD Call Option
strike price HKD 7.3
expiring on 10/11/2011 203,108 (1,176)
Total Written Call Options 203,108 (1,176)
Note: Written Call Options are included in the Statement of Net Assets (see Note 2c).
Open Forward Foreign Exchange Transactionsas at 31 August 2011
Purchases Sales Value date Unrealised
profit/(loss)
Unrealisedprofit/(loss)
EUR Equivalent
Core Fund EUR
CHF 15,494,841 USD 20,036,000 6/9/2011 (557,645) (557,645)
USD 20,036,000 CHF 15,805,298 6/9/2011 290,824 290,824
EUR 8,594,000 USD 12,422,111 8/9/2011 (8,305) (8,305)
USD 66,569,577 EUR 46,376,000 8/9/2011 (276,605) (276,605)
USD 10,914,603 TRY 19,082,000 8/9/2011 (124,294) (124,294)
CLP 2,902,807,600 USD 6,083,000 29/9/2011 106,481 106,481
MXN 115,512,225 ZAR 67,018,000 29/9/2011 (143,670) (143,670)
USD 6,908,157 ZAR 48,402,000 29/9/2011 26,075 26,075
EUR 8,281,888 CZK 199,726,000 4/10/2011 (3,910) (3,910)
EUR 170,146,705 GBP 148,453,000 4/10/2011 2,404,662 2,404,662
EUR 6,182,016 HUF 1,674,943,000 4/10/2011 42,542 42,542
EUR 26,612,107 PLN 110,560,000 4/10/2011 36,922 36,922
EUR 13,497,219 SEK 121,834,000 4/10/2011 198,081 198,081
EUR 66,603,279 USD 94,566,000 4/10/2011 1,095,079 1,095,079
HUF 3,785,690,983 EUR 13,984,000 4/10/2011 (107,617) (107,617)
USD 2,500,000 EUR 1,739,736 4/10/2011 (7,924) (7,924)
CZK 194,710,827 HUF 2,159,051,000 13/10/2011 170,451 170,451
AUD 4,888,000 MXN 64,028,059 18/10/2011 35,426 35,426
CAD 32,756,571 AUD 32,083,000 18/10/2011 (354,851) (354,851)
MXN 125,176,227 AUD 9,796,000 18/10/2011 (246,068) (246,068)
MXN 117,381,053 CAD 9,492,000 18/10/2011 (209,630) (209,630)
CNY 148,819,472 USD 23,154,000 19/10/2011 175,687 175,687
MYR 125,457,638 USD 41,997,000 19/10/2011 145,099 145,099
USD 53,845,441 CNY 346,530,960 19/10/2011 (457,173) (457,173)
USD 20,009,000 MYR 60,657,284 19/10/2011 (275,269) (275,269)
EUR 7,072,000 RUB 297,943,360 20/10/2011 (32,062) (32,062)
NOK 167,012,352 EUR 21,216,000 20/10/2011 337,359 337,359
RUB 297,811,488 USD 10,533,834 20/10/2011 (197,348) (197,348)
USD 16,208,163 HUF 3,125,420,000 20/10/2011 (212,761) (212,761)
CHF 3,635,219 EUR 3,220,000 25/10/2011 (89,087) (89,087)
CHF 22,438,000 SEK 202,980,879 25/10/2011 (2,811,836) (2,811,836)
SEK 180,873,363 CHF 22,607,000 25/10/2011 255,239 255,239
SEK 26,257,476 EUR 2,815,000 25/10/2011 48,636 48,636
JPY 1,974,043,000 USD 25,438,698 27/10/2011 219,880 219,880
KRW 45,295,273,758 JPY 3,360,931,495 27/10/2011 (1,006,852) (1,006,852)
KRW 15,481,100,000 USD 14,369,000 27/10/2011 84,473 84,473
USD 24,010,000 KRW 25,881,579,500 27/10/2011 (149,781) (149,781)
USD 14,369,000 SGD 17,326,997 27/10/2011 (29,490) (29,490)
EUR 2,800,000 CHF 3,038,448 8/11/2011 181,646 181,646
HKD 87,796,000 USD 11,281,353 10/11/2011 (5,295) (5,295)
USD 16,857,000 HKD 130,812,869 10/11/2011 41,287 41,287
Net unrealised loss (1,411,624) (1,411,624)
CHF Hedged Share Class CHF
CHF 1,747,841 EUR 1,527,149 14/9/2011 (28,498) (24,489)
EUR 2,006 CHF 2,368 14/9/2011 (34) (29)
Net unrealised loss (28,532) (24,518)
GBP Hedged Share Class GBP
EUR 253,693 GBP 223,459 14/9/2011 1,065 1,203
GBP 28,816,160 EUR 33,210,499 14/9/2011 (575,898) (650,732)
Net unrealised loss (574,833) (649,529)
USD Hedged Share Class USD
EUR 16,780 USD 23,923 14/9/2011 306 212
USD 1,574,731 EUR 1,110,018 14/9/2011 (28,062) (19,431)
Net unrealised loss (27,756) (19,219)
Total net unrealised loss (2,104,890)
Note: The net unrealised loss attributed to these transactions is included in the Statement
of Net Assets (see Note 2c).

* Securities lent, see Note 11, for further details.
98 BlackRock Global Funds (BGF)
Euro-Markets Fund
Portfolio of Investments 31 August 2011
COMMON STOCKS (SHARES)
Belgium 1,575,244 Anheuser-Busch InBev NV 60,568,132 3.16
2,520,322 KBC Groep NV * 48,075,142 2.51
108,643,274 5.67
Finland 1,369,188 Kone OYJ 'B' 56,191,475 2.94
2,150,016 Konecranes OYJ * 40,291,300 2.10
511,270 Sampo OYJ 'A' 10,179,386 0.53
106,662,161 5.57
France 1,555,069 BNP Paribas SA 55,212,725 2.88
1,521,215 Danone 72,310,955 3.78
1,164,610 Eutelsat Communications SA 35,811,757 1.87
2,348,774 Legrand SA 64,415,127 3.36
1,429,267 Publicis Groupe SA * 46,701,299 2.44
1,664,969 Safran SA 45,237,208 2.36
1,226,439 Sanofi-Aventis SA 62,094,607 3.24
539,840 Schneider Electric SA 50,086,355 2.62
431,870,033 22.55
Germany 937,981 Allianz SE 67,375,175 3.52
2,053,408 Bayer AG 92,310,957 4.82
671,364 Bilfinger Berger SE 39,247,939 2.05
786,696 Continental AG 40,263,101 2.11
1,778,308 Daimler AG 66,464,262 3.47
2,494,219 GEA Group AG 50,582,761 2.64
1,633,182 Kabel Deutschland Holding AG 64,567,850 3.37
705,259 Linde AG 75,286,398 3.93
819,499 Rheinmetall AG 37,918,219 1.98
845,218 Rhoen Klinikum AG 14,406,741 0.75
2,254,064 SAP AG 85,778,406 4.48
1,461,580 Symrise AG 27,667,709 1.45
661,869,518 34.57
Greece 2,017,714 Coca Cola Hellenic Bottling Co SA 28,247,996 1.48
Ireland 16,320,857 Ryanair Holdings Plc 51,067,962 2.67
Italy 3,401,085 Atlantia SpA 37,990,119 1.98
16,913,195 Enel SpA 57,132,773 2.98
51,250,871 Intesa Sanpaolo SpA 58,015,986 3.03
383,329 Tod's SpA 30,532,155 1.60
183,671,033 9.59
Netherlands 1,085,119 Fugro NV 45,781,170 2.39
9,677,018 ING Groep NV 58,120,170 3.03
7,993,557 Koninklijke KPN NV 78,816,472 4.12
2,221,473 USG People NV * 15,656,942 0.82
198,374,754 10.36
Portugal 3,102,488 Galp Energia SGPS SA 'B' 42,969,459 2.24
Spain 4,808,075 Mediaset Espana Comunicacion SA * 24,314,435 1.27
3,374,257 Repsol YPF SA 67,518,883 3.53
91,833,318 4.80
Total Common Stocks (Shares) 1,905,209,508 99.50
Total Transferable Securities Admitted
to an Official Stock Exchange Listing or
Dealt in on Another Regulated Market 1,905,209,508 99.50
Total Portfolio 1,905,209,508 99.50
Other Net Assets 9,609,998 0.50
Total Net Assets (EUR) 1,914,819,506 100.00
Transferable Securities Admitted to an Official Stock Exchange Listing or Dealt in on Another Regulated Market
Holding Description Value (EUR) %
Transferable Securities Admitted to an Official Stock Exchange Listing or Dealt in on Another Regulated Market
Holding Description Value (EUR) %
Sector Breakdownas at 31 August 2011
% of netassets
Industrials 25.52
Consumer Discretionary 16.13
Financials 15.50
Healthcare 8.81
Consumer Staples 8.42
Energy 8.16
Materials 5.38
Information Technology 4.48
Telecommunication Services 4.12
Utilities 2.98
Other Net Assets 0.50
100.00
Open Forward Foreign Exchange Transactionsas at 31 August 2011
Purchases Sales Value date Unrealised
profit/(loss)
Unrealisedprofit/(loss)
EUR Equivalent
CHF Hedged Share Class CHF
CHF 1,645,976 EUR 1,436,720 14/9/2011 (25,178) (21,636)
EUR 152,438 CHF 174,049 14/9/2011 3,263 2,804
Net unrealised loss (21,915) (18,832)
Total net unrealised loss (18,832)
Note: The net unrealised loss attributed to these transactions is included in the Statement
of Net Assets (see Note 2c).

Audited Annual Report and Accounts 99
The notes on pages 261 to 270 form an integral part of these financial statements.
European Enhanced Equity Yield Fund
Portfolio of Investments 31 August 2011
COMMON / PREFERRED STOCKS (SHARES)
Austria 29 OMV AG 795 0.00
13,324 Telekom Austria AG 102,995 0.95
39 Voestalpine AG 1,024 0.01
104,814 0.96
Belgium 213 Anheuser-Busch InBev NV 8,190 0.07
307 Anheuser-Busch InBev NV (Strip) – 0.00
4,337 Belgacom SA * 99,773 0.92
900 Dexia SA 1,464 0.01
624 UCB SA 19,204 0.18
128,631 1.18
Bermuda 5,551 Seadrill Ltd 124,998 1.15
Denmark 84 Carlsberg A/S 'B' 4,352 0.04
45 Novo Nordisk A/S 'B' 3,340 0.03
43 Vestas Wind Systems A/S 628 0.01
8,320 0.08
Finland 173 Kesko OYJ 'B' 4,644 0.04
28,404 Nokia OYJ 128,670 1.19
8,026 Orion OYJ 'B' 125,687 1.16
5,030 Sampo OYJ 'A' 100,147 0.92
359,148 3.31
France 1,643 Accor SA 40,952 0.38
1 Air France-KLM 7 0.00
21 AXA SA 233 0.00
1,294 BNP Paribas SA 45,943 0.42
3,014 Bouygues SA 80,248 0.74
47 Cie de Saint-Gobain 1,641 0.01
1 Cie Generale de Geophysique - Veritas 17 0.00
8,840 Credit Agricole SA 59,210 0.54
38 Edenred 726 0.01
12,420 France Telecom SA 165,869 1.53
2,414 GDF Suez 52,625 0.48
607 Gecina SA (Reit) 47,285 0.44
18 Groupe Eurotunnel SA 115 0.00
21 ICADE (Reit) 1,469 0.01
2,024 Klepierre (Reit) 48,718 0.45
3,209 Lafarge SA 92,387 0.85
6 LVMH Moet Hennessy Louis Vuitton SA 707 0.01
3,147 Metropole Television SA 46,686 0.43
2,042 Neopost SA 103,203 0.95
18,951 PagesJaunes Groupe * 86,246 0.79
18 PPR 2,075 0.02
2,735 Sanofi-Aventis SA 138,473 1.27
32 Schneider Electric SA 2,969 0.03
15 Societe Generale SA 341 0.00
2,726 Societe Television Francaise 30,000 0.28
8,025 Total SA 272,529 2.51
19 Unibail-Rodamco SE (Reit) 2,850 0.03
7 Vallourec SA 438 0.00
3,094 Veolia Environnement SA 35,658 0.33
9,239 Vivendi SA 154,892 1.43
1,514,512 13.94
Germany 14 Adidas AG 675 0.01
1,917 Allianz SE 137,698 1.27
519 Axel Springer AG 15,606 0.14
2,189 BASF SE 108,914 1.00
18 Bayer AG 809 0.01
29 Daimler AG 1,084 0.01
23 Deutsche Bank AG 649 0.01
39 Deutsche Lufthansa AG 456 0.00
11,546 Deutsche Post AG 122,503 1.13
42 Deutsche Postbank AG 945 0.01
19,898 Deutsche Telekom AG 193,608 1.78
6,969 E.ON AG 105,162 0.97
16 K+S AG 791 0.01
18 Merck KGaA 1,118 0.01
3,481 RWE AG 89,827 0.83
2,679 RWE AG (Pref) 62,662 0.58
3 SAP AG 114 0.00
1,461 Siemens AG 104,856 0.96
1,990 ThyssenKrupp AG 46,904 0.43
894 Volkswagen AG (Pfd Non-Vtg) (Pref) 103,615 0.95
1,097,996 10.11
Greece 14,389 Hellenic Petroleum SA 80,578 0.74
8,673 OPAP SA 73,634 0.68
42 Piraeus Bank SA 27 0.00
5,204 Public Power Corp SA 30,964 0.28
185,203 1.70
Ireland 2,723 CRH Plc 33,996 0.31
Italy 33,773 A2A SpA 32,338 0.30
67 Assicurazioni Generali SpA 831 0.01
62 Banca Popolare di Milano Scarl 93 0.00
503 Enel SpA 1,699 0.02
13,297 ENI SpA 184,695 1.70
62 Fiat Industrial SpA 416 0.01
3,618 Fiat SpA 15,536 0.14
63,053 Intesa Sanpaolo SpA 60,058 0.55
1 Mediobanca SpA 6 0.00
56 Parmalat SpA 91 0.00
47 Saipem SpA 1,450 0.01
18,656 Terna Rete Elettrica Nazionale SpA 46,677 0.43
57 UniCredit SpA 53 0.00
7,695 Unione di Banche Italiane SCPA 19,545 0.18
363,488 3.35
Luxembourg 22 APERAM 280 0.00
449 ArcelorMittal 6,886 0.07
29 Tenaris SA 332 0.00
7,498 0.07
Netherlands 42 Akzo Nobel NV 1,498 0.01
2,759 Corio NV (Reit) 112,153 1.03
376 Fugro NV 15,863 0.15
81 ING Groep NV 486 0.00
2,349 Koninklijke Boskalis Westminster NV 55,566 0.51
744 Koninklijke DSM NV 26,137 0.24
1,958 Koninklijke KPN NV 19,306 0.18
Transferable Securities Admitted to an Official Stock Exchange Listing or Dealt in on Another Regulated Market
Holding Description Value (EUR) %
Transferable Securities Admitted to an Official Stock Exchange Listing or Dealt in on Another Regulated Market
Holding Description Value (EUR) %

* Securities lent, see Note 11, for further details.‡ Securities given in guarantee, see Note 12, for further details.
100 BlackRock Global Funds (BGF)
European Enhanced Equity Yield Fund continued
Portfolio of Investments 31 August 2011
1,177 Koninklijke Philips Electronics NV 17,243 0.16
63 Randstad Holding NV 1,508 0.01
7,517 Reed Elsevier NV 61,406 0.57
1,708 Unilever NV 40,027 0.37
351,193 3.23
Norway 36 Norsk Hydro ASA 153 0.00
20,208 Orkla ASA 116,231 1.07
8,283 Statoil ASA 137,665 1.27
254,049 2.34
Portugal 25,672 Brisa Auto-Estradas de Portugal SA 69,828 0.64
7,078 Cimpor Cimentos de Portugal SGPS SA 38,150 0.35
16 Jeronimo Martins SGPS SA 208 0.00
2,480 Portugal Telecom SGPS SA 14,533 0.14
122,719 1.13
Spain 2,342 ACS Actividades de Construccion y Servicios SA 66,864 0.62
17,703 Banco Bilbao Vizcaya Argentaria SA 109,847 1.01
21,721 Banco de Sabadell SA 59,060 0.54
33,736 Banco Santander SA 211,896 1.95
7,719 Ferrovial SA 67,086 0.62
5,811 Fomento de Construcciones y Contratas SA 105,266 0.97
181 Indra Sistemas SA 'A' 2,255 0.02
53 International Consolidated Airlines Group SA 105 0.00
1 Sacyr Vallehermoso SA 5 0.00
8,617 Telefonica SA 124,688 1.15
747,072 6.88
Sweden 4,510 Boliden AB 43,605 0.40
5,204 Hennes & Mauritz AB 'B' 112,405 1.04
31 Kinnevik Investment AB 'B' 462 0.00
12,021 Nordea Bank AB 76,805 0.71
596 Ratos AB 'B' 6,254 0.06
59 Sandvik AB 550 0.01
44 SSAB AB 'A' 309 0.00
61 SSAB AB 'B' 381 0.00
7,304 Svenska Cellulosa AB 'B' 68,583 0.63
309,354 2.85
Switzerland 17 ABB Ltd 253 0.00
37 Adecco SA 1,201 0.01
650 Baloise Holding AG 40,104 0.37
6,462 Credit Suisse Group AG 127,937 1.18
1,541 Holcim Ltd 66,673 0.61
27 Kuehne & Nagel International AG 2,573 0.02
8,264 Nestle SA 352,437 3.25
2,669 Nobel Biocare Holding AG 23,531 0.22
5,173 Novartis AG 208,568 1.92
1,536 Roche Holding AG 184,521 1.70
23 Swiss Re AG 845 0.01
1 Syngenta AG 221 0.00
925 Zurich Financial Services AG 143,472 1.32
1,152,336 10.61
United Kingdom 72 Anglo American Plc 2,088 0.02
57 Antofagasta Plc 866 0.01
2,762 AstraZeneca Plc 90,986 0.84
30,217 Aviva Plc 115,674 1.06
29,318 BAE Systems Plc 90,932 0.84
30 Barclays Plc 57 0.00
533 BG Group Plc 7,980 0.07
4,358 BHP Billiton Plc ‡ 103,554 0.95
22,116 BP Plc 100,568 0.93
9,159 British American Tobacco Plc 281,486 2.59
10 BT Group Plc 20 0.00
160,507 Cable & Wireless Communications Plc 64,200 0.59
41,425 Cable & Wireless Worldwide Plc 16,317 0.15
14,397 Capital Shopping Centres Group Plc (Reit) 54,267 0.50
56 Carnival Plc 1,266 0.01
21 Centrica Plc 71 0.00
9,138 Diageo Plc 127,101 1.17
1,090 Drax Group Plc 6,435 0.06
30,529 Firstgroup Plc 125,043 1.15
21,560 GlaxoSmithKline Plc 320,221 2.95
49,521 Home Retail Group Plc 70,446 0.65
34,174 HSBC Holdings Plc 206,079 1.90
372 ICAP Plc 1,999 0.02
6,715 Imperial Tobacco Group Plc 154,705 1.42
57,834 Legal & General Group Plc 68,810 0.63
30 Lloyds Banking Group Plc 11 0.00
40,850 Man Group Plc 103,852 0.96
4,809 National Grid Plc 33,689 0.31
54 Prudential Plc 373 0.00
606 Reckitt Benckiser Group Plc 22,342 0.21
57 Reed Elsevier Plc 323 0.00
8,952 Rexam Plc 35,888 0.33
2,180 Rio Tinto Plc 93,231 0.86
9,495 Royal Dutch Shell Plc 'A' 220,576 2.03
6,374 Royal Dutch Shell Plc 'B' 148,613 1.37
48,719 RSA Insurance Group Plc 63,250 0.58
56 Sage Group Plc/The 160 0.00
5,277 Scottish & Southern Energy Plc 77,155 0.71
15,778 Segro Plc (Reit) 45,942 0.42
24 Severn Trent Plc 397 0.00
2,975 Standard Chartered Plc 46,707 0.43
14,609 Standard Life Plc 33,575 0.31
30,679 Tesco Plc 130,025 1.20
57,156 Thomas Cook Group Plc 28,067 0.26
5,851 Unilever Plc 135,791 1.25
8,703 United Utilities Group Plc 59,099 0.54
64,214 Vodafone Group Plc 118,265 1.09
5,630 Xstrata Plc 69,211 0.64
3,477,713 32.01
Total Common / Preferred Stocks (Shares) 10,343,040 95.21
Total Transferable Securities Admitted
to an Official Stock Exchange Listing or
Dealt in on Another Regulated Market 10,343,040 95.21
Total Portfolio 10,343,040 95.21
Other Net Assets 520,741 4.79
Total Net Assets (EUR) 10,863,781 100.00
Transferable Securities Admitted to an Official Stock Exchange Listing or Dealt in on Another Regulated Market
Holding Description Value (EUR) %
Transferable Securities Admitted to an Official Stock Exchange Listing or Dealt in on Another Regulated Market
Holding Description Value (EUR) %

Audited Annual Report and Accounts 101
The notes on pages 261 to 270 form an integral part of these financial statements.
European Enhanced Equity Yield Fund continued
Written Call Options as at 31 August 2011
Number of contracts
subjectto Call Issuer
UnrealisedlossEUR
ValueEUR
(2) FTSE 100 Call Option
strike price GBP 5,275
expiring on 16/9/2011 (1,451) (3,977)
(2) SMI Call Option
strike price CHF 5,400
expiring on 16/9/2011 (1,465) (3,264)
(13) SMI Call Option
strike price CHF 5,300
expiring on 16/9/2011 (18,037) (30,184)
(15) ESTX 50 Call Option
strike price EUR 2,325
expiring on 16/9/2011 (821) (6,578)
(30) FTSE 100 Call Option
strike price GBP 5,150
expiring on 16/9/2011 (54,512) (92,963)
(120) ESTX 50 Call Option
strike price EUR 2,250
expiring on 16/9/2011 (41,756) (106,740)
Total Written Call Options (118,042) (243,706)
Note: Written Call Options are included in the Statement of Net Assets (see Note 2c).
Open Futures Contractsas at 31 August 2011
Numberof contracts Contract/Description
Expirationdate
ValueEUR
8 Euro Stoxx 50 September 2011 183,680
7 FTSE 100 Index September 2011 425,164
4 Swiss Market Index September 2011 189,322
Total commitment 798,166
Note: The net unrealised loss of EUR 93,782 attributed to these transactions is included
in the Statement of Net Assets (see Note 2c).
Sector Breakdownas at 31 August 2011
% of netassets
Financials 19.84
Energy 11.93
Consumer Staples 11.61
Healthcare 10.29
Telecommunication Services 9.91
Industrials 9.53
Materials 7.73
Consumer Discretionary 6.37
Utilities 5.84
Information Technology 2.16
Other Net Assets 4.79
100.00
Open Forward Foreign Exchange Transactionsas at 31 August 2011
Purchases Sales Value date Unrealised
profit/(loss)
Unrealisedprofit/(loss)
EUR Equivalent
GBP Hedged Share Class GBP
EUR 48,423 GBP 42,407 14/9/2011 448 506
GBP 345,988 EUR 398,354 14/9/2011 (6,564) (7,417)
Net unrealised loss (6,116) (6,911)
USD Hedged Share Class USD
EUR 146,581 USD 209,792 14/9/2011 1,862 1,289
USD 1,722,975 EUR 1,213,070 14/9/2011 (28,618) (19,816)
Net unrealised loss (26,756) (18,527)
Total net unrealised loss (25,438)
Note: The net unrealised loss attributed to these transactions is included in the Statement
of Net Assets (see Note 2c).
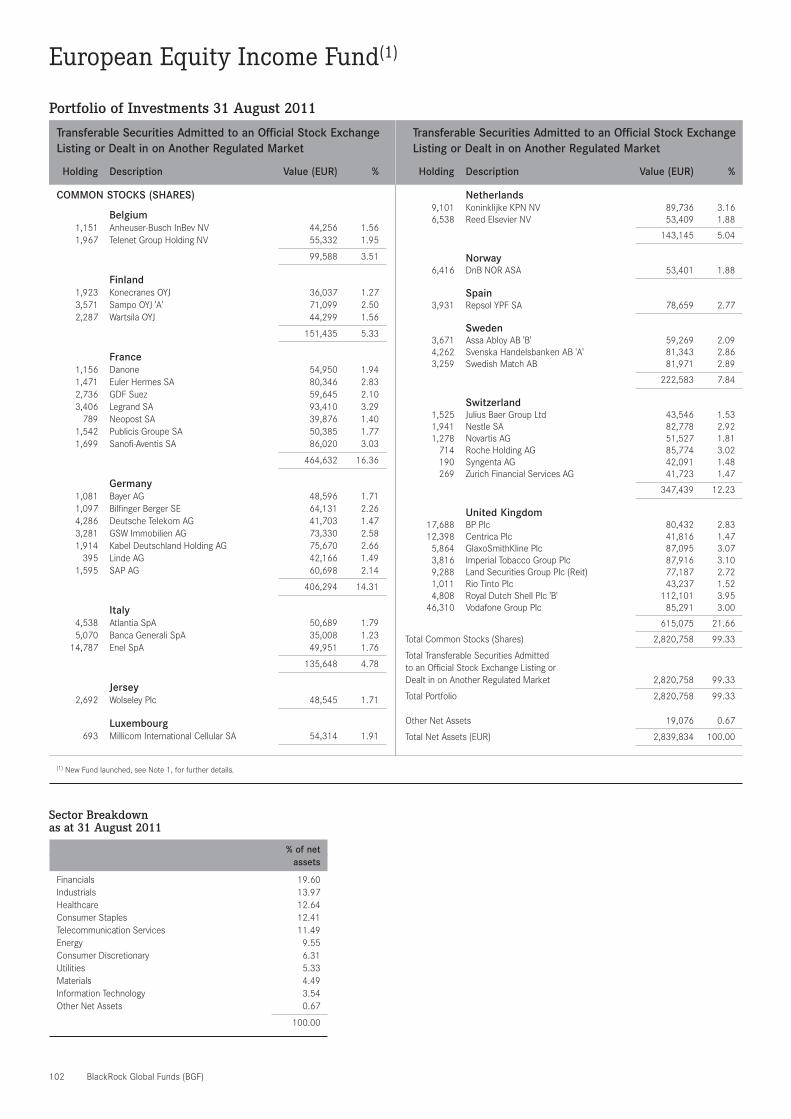
(1) New Fund launched, see Note 1, for further details.
102 BlackRock Global Funds (BGF)
European Equity Income Fund(1)
Portfolio of Investments 31 August 2011
COMMON STOCKS (SHARES)
Belgium 1,151 Anheuser-Busch InBev NV 44,256 1.56
1,967 Telenet Group Holding NV 55,332 1.95
99,588 3.51
Finland 1,923 Konecranes OYJ 36,037 1.27
3,571 Sampo OYJ 'A' 71,099 2.50
2,287 Wartsila OYJ 44,299 1.56
151,435 5.33
France 1,156 Danone 54,950 1.94
1,471 Euler Hermes SA 80,346 2.83
2,736 GDF Suez 59,645 2.10
3,406 Legrand SA 93,410 3.29
789 Neopost SA 39,876 1.40
1,542 Publicis Groupe SA 50,385 1.77
1,699 Sanofi-Aventis SA 86,020 3.03
464,632 16.36
Germany 1,081 Bayer AG 48,596 1.71
1,097 Bilfinger Berger SE 64,131 2.26
4,286 Deutsche Telekom AG 41,703 1.47
3,281 GSW Immobilien AG 73,330 2.58
1,914 Kabel Deutschland Holding AG 75,670 2.66
395 Linde AG 42,166 1.49
1,595 SAP AG 60,698 2.14
406,294 14.31
Italy 4,538 Atlantia SpA 50,689 1.79
5,070 Banca Generali SpA 35,008 1.23
14,787 Enel SpA 49,951 1.76
135,648 4.78
Jersey 2,692 Wolseley Plc 48,545 1.71
Luxembourg 693 Millicom International Cellular SA 54,314 1.91
Netherlands 9,101 Koninklijke KPN NV 89,736 3.16
6,538 Reed Elsevier NV 53,409 1.88
143,145 5.04
Norway 6,416 DnB NOR ASA 53,401 1.88
Spain 3,931 Repsol YPF SA 78,659 2.77
Sweden 3,671 Assa Abloy AB 'B' 59,269 2.09
4,262 Svenska Handelsbanken AB 'A' 81,343 2.86
3,259 Swedish Match AB 81,971 2.89
222,583 7.84
Switzerland 1,525 Julius Baer Group Ltd 43,546 1.53
1,941 Nestle SA 82,778 2.92
1,278 Novartis AG 51,527 1.81
714 Roche Holding AG 85,774 3.02
190 Syngenta AG 42,091 1.48
269 Zurich Financial Services AG 41,723 1.47
347,439 12.23
United Kingdom 17,688 BP Plc 80,432 2.83
12,398 Centrica Plc 41,816 1.47
5,864 GlaxoSmithKline Plc 87,095 3.07
3,816 Imperial Tobacco Group Plc 87,916 3.10
9,288 Land Securities Group Plc (Reit) 77,187 2.72
1,011 Rio Tinto Plc 43,237 1.52
4,808 Royal Dutch Shell Plc 'B' 112,101 3.95
46,310 Vodafone Group Plc 85,291 3.00
615,075 21.66
Total Common Stocks (Shares) 2,820,758 99.33
Total Transferable Securities Admitted
to an Official Stock Exchange Listing or
Dealt in on Another Regulated Market 2,820,758 99.33
Total Portfolio 2,820,758 99.33
Other Net Assets 19,076 0.67
Total Net Assets (EUR) 2,839,834 100.00
Transferable Securities Admitted to an Official Stock Exchange Listing or Dealt in on Another Regulated Market
Holding Description Value (EUR) %
Transferable Securities Admitted to an Official Stock Exchange Listing or Dealt in on Another Regulated Market
Holding Description Value (EUR) %
Sector Breakdownas at 31 August 2011
% of netassets
Financials 19.60
Industrials 13.97
Healthcare 12.64
Consumer Staples 12.41
Telecommunication Services 11.49
Energy 9.55
Consumer Discretionary 6.31
Utilities 5.33
Materials 4.49
Information Technology 3.54
Other Net Assets 0.67
100.00

Audited Annual Report and Accounts 103
The notes on pages 261 to 270 form an integral part of these financial statements.
European Focus Fund
Portfolio of Investments 31 August 2011
COMMON STOCKS (SHARES)
Belgium 1,348,948 KBC Groep NV 25,731,183 2.34
Denmark 468,190 Novo Nordisk A/S 'B' 34,750,233 3.15
France 368,905 BNP Paribas SA 13,097,972 1.19
1,169,121 Cie Generale de Geophysique - Veritas 20,407,007 1.85
891,885 Danone 42,395,753 3.85
732,524 Eutelsat Communications SA 22,525,113 2.04
876,707 Legrand SA 24,043,690 2.18
958,160 Safran SA 26,033,207 2.36
303,555 Schneider Electric SA 28,163,833 2.56
228,472 Technip SA 15,453,846 1.40
192,120,421 17.43
Germany 825,439 Bayer AG 37,107,610 3.37
806,627 Daimler AG 30,147,684 2.73
126,285 Fresenius SE & Co KGaA 9,034,429 0.82
836,004 Kabel Deutschland Holding AG 33,051,418 3.00
41,732 Linde AG 4,454,891 0.40
1,114,826 SAP AG 42,424,704 3.85
156,220,736 14.17
Ireland 12,520,375 Ryanair Holdings Plc 39,176,253 3.55
Luxembourg 9,414,917 AZ Electronic Materials SA 24,371,463 2.21
Norway 3,061,341 DnB NOR ASA 25,479,600 2.31
Portugal 1,931,591 Galp Energia SGPS SA 'B' 26,752,535 2.43
2,087,151 Jeronimo Martins SGPS SA 27,195,578 2.47
53,948,113 4.90
Sweden 1,294,626 Svenska Handelsbanken AB 'A' 24,708,755 2.24
Switzerland 970,591 Julius Baer Group Ltd 27,714,936 2.52
82,687 Swatch Group AG 26,126,315 2.37
53,841,251 4.89
United Kingdom 8,166,287 Capital & Counties Properties Plc 15,243,149 1.38
4,782,337 Centrica Plc 16,129,634 1.46
3,982,307 GlaxoSmithKline Plc 59,147,356 5.37
2,125,784 Imperial Tobacco Group Plc 48,975,217 4.44
3,372,331 International Power Plc 12,833,416 1.17
46,647,851 Lloyds Banking Group Plc 17,535,754 1.59
1,065,991 Rio Tinto Plc 45,588,933 4.14
2,902,367 Royal Dutch Shell Plc 'B' 67,670,099 6.14
1,109,652 Spirax-Sarco Engineering Plc 23,044,767 2.09
1,884,720 Tullow Oil Plc 22,722,247 2.06
35,814,386 Vodafone Group Plc 65,960,680 5.99
10,740,082 WM Morrison Supermarkets Plc 35,095,052 3.18
429,946,304 39.01
United States 1,876,301 Virgin Media Inc 33,348,111 3.03
Total Common Stocks (Shares) 1,093,642,423 99.23
Total Transferable Securities Admitted
to an Official Stock Exchange Listing or
Dealt in on Another Regulated Market 1,093,642,423 99.23
Total Portfolio 1,093,642,423 99.23
Other Net Assets 8,488,111 0.77
Total Net Assets (EUR) 1,102,130,534 100.00
Transferable Securities Admitted to an Official Stock Exchange Listing or Dealt in on Another Regulated Market
Holding Description Value (EUR) %
Transferable Securities Admitted to an Official Stock Exchange Listing or Dealt in on Another Regulated Market
Holding Description Value (EUR) %
Sector Breakdownas at 31 August 2011
% of netassets
Consumer Staples 13.94
Energy 13.88
Financials 13.57
Consumer Discretionary 13.17
Industrials 12.74
Healthcare 12.71
Materials 6.75
Telecommunication Services 5.99
Information Technology 3.85
Utilities 2.63
Other Net Assets 0.77
100.00

* Securities lent, see Note 11, for further details.
104 BlackRock Global Funds (BGF)
European Fund
Portfolio of Investments 31 August 2011
COMMON STOCKS (SHARES)
Belgium 1,923,171 KBC Groep NV * 36,684,487 1.64
Denmark 1,560,227 Christian Hansen Holding A/S * 24,563,840 1.10
652,075 Novo Nordisk A/S 'B' 48,398,637 2.17
72,962,477 3.27
Finland 975,464 Kone OYJ 'B' 40,033,042 1.79
France 709,929 BNP Paribas SA 25,206,029 1.13
2,115,237 Cie Generale de Geophysique - Veritas 36,921,462 1.65
204,299 Cie Generale d'Optique Essilor International
SA 10,854,406 0.49
1,609,671 Danone 76,515,711 3.43
1,251,128 Eutelsat Communications SA 38,472,186 1.72
1,972,625 Legrand SA 54,099,241 2.43
284,628 L'Oreal SA 21,816,736 0.98
459,210 Schneider Electric SA 42,605,504 1.91
467,554 Technip SA 31,625,352 1.42
338,116,627 15.16
Germany 1,370,820 Bayer AG 61,625,213 2.76
188,125 Continental AG 9,628,238 0.43
1,206,230 Daimler AG 45,082,846 2.02
1,430,128 Deutsche Bank AG 40,365,363 1.81
2,882,466 Deutsche Telekom AG 28,046,394 1.26
152,126 Fresenius SE & Co KGaA 10,883,094 0.49
1,614,901 Kabel Deutschland Holding AG 63,845,111 2.86
536,081 Linde AG 57,226,647 2.56
1,727,075 SAP AG 65,723,839 2.95
382,426,745 17.14
Greece 1,416,527 Coca Cola Hellenic Bottling Co SA 19,831,378 0.89
Ireland 14,947,191 Ryanair Holdings Plc 46,769,761 2.10
Italy 8,401,088 Intesa Sanpaolo SpA 9,510,032 0.43
1,034,063 Saipem SpA 31,900,843 1.43
41,410,875 1.86
Luxembourg 11,147,976 AZ Electronic Materials SA 28,857,661 1.29
Netherlands 6,883,724 ING Groep NV 41,343,647 1.85
2,522,630 Koninklijke KPN NV 24,873,132 1.12
896,020 Koninklijke Vopak NV * 31,060,533 1.39
3,644,963 TNT Express NV 24,220,779 1.09
121,498,091 5.45
Spain 2,476,677 Amadeus IT Holding SA 'A' 34,376,277 1.54
Sweden 3,288,466 Swedbank AB 'A' 31,399,198 1.41
Switzerland 1,269,982 Julius Baer Group Ltd 36,263,957 1.63
584,365 Roche Holding AG 70,200,249 3.15
100,509 Swatch Group AG 31,757,467 1.42
205,733 Syngenta AG 45,575,785 2.04
183,797,458 8.24
United Kingdom 10,174,322 BP Plc 46,265,517 2.07
13,882,566 Centrica Plc 46,822,445 2.10
5,817,854 GlaxoSmithKline Plc 86,409,883 3.87
3,433,245 Imperial Tobacco Group Plc 79,097,368 3.55
6,921,329 International Power Plc 26,339,140 1.18
1,923,451 Johnson Matthey Plc 37,163,554 1.67
3,807,171 Land Securities Group Plc (Reit) 31,639,169 1.42
43,678,929 Lloyds Banking Group Plc 16,419,684 0.74
4,702,976 Prudential Plc 32,521,022 1.46
1,786,747 Rio Tinto Plc 76,413,300 3.42
3,780,444 Royal Dutch Shell Plc 'B' 88,142,891 3.95
3,445,452 Tullow Oil Plc 41,538,483 1.86
2,082,542 Unilever Plc 48,331,939 2.17
41,150,208 Vodafone Group Plc 75,787,861 3.40
14,547,997 WM Morrison Supermarkets Plc 47,538,065 2.13
2,896,404 Xstrata Plc 35,606,398 1.60
816,036,719 36.59
Total Common Stocks (Shares)
& Warrants 2,194,200,796 98.37
Total Transferable Securities Admitted
to an Official Stock Exchange Listing or
Dealt in on Another Regulated Market 2,194,200,796 98.37
Total Portfolio 2,194,200,796 98.37
Other Net Assets 36,283,299 1.63
Total Net Assets (EUR) 2,230,484,095 100.00
Transferable Securities Admitted to an Official Stock Exchange Listing or Dealt in on Another Regulated Market
Holding Description Value (EUR) %
Transferable Securities Admitted to an Official Stock Exchange Listing or Dealt in on Another Regulated Market
Holding Description Value (EUR) %

Audited Annual Report and Accounts 105
The notes on pages 261 to 270 form an integral part of these financial statements.
European Fund continued
Open Forward Foreign Exchange Transactionsas at 31 August 2011
Purchases Sales Value date Unrealised
profit/(loss)
Unrealisedprofit/(loss)
EUR Equivalent
USD Hedged Share Class USD
EUR 2,761,114 USD 3,959,704 14/9/2011 27,164 18,809
USD 28,250,369 EUR 19,863,448 14/9/2011 (431,152) (298,540)
Net unrealised loss (403,988) (279,731)
Total net unrealised loss (279,731)
Note: The net unrealised loss attributed to these transactions is included in the Statement
of Net Assets (see Note 2c).
Sector Breakdownas at 31 August 2011
% of netassets
Materials 13.68
Financials 13.52
Consumer Staples 13.15
Healthcare 12.93
Energy 12.38
Industrials 10.71
Consumer Discretionary 8.45
Telecommunication Services 5.78
Information Technology 4.49
Utilities 3.28
Other Net Assets 1.63
100.00

* Securities lent, see Note 11, for further details.
106 BlackRock Global Funds (BGF)
European Growth Fund
COMMON / PREFERRED STOCKS (SHARES)
Belgium 123,805 Anheuser-Busch InBev NV 4,760,302 2.26
25,603 EVS Broadcast Equipment SA* 1,170,057 0.56
5,930,359 2.82
Denmark 137,050 Christian Hansen Holding A/S 2,157,682 1.03
100,924 Novo Nordisk A/S 'B' 7,490,832 3.57
9,648,514 4.60
Finland 106,795 Kone OYJ 'B' 4,382,867 2.09
50,496 Nokian Renkaat OYJ* 1,290,678 0.61
5,673,545 2.70
France 148,237 Cie Generale de Geophysique - Veritas 2,587,477 1.23
149,084 Eutelsat Communications SA 4,584,333 2.18
163,387 Legrand SA 4,480,888 2.13
34,204 Remy Cointreau SA 2,107,650 1.00
141,745 Safran SA 3,851,212 1.84
63,293 Schneider Electric SA 5,872,325 2.80
30,990 Technip SA* 2,096,164 1.00
25,580,049 12.18
Germany 80,441 Bayer AG 3,616,225 1.72
33,375 Continental AG 1,708,132 0.81
73,190 Fresenius Medical Care AG & Co KGaA 3,439,564 1.64
572,191 Infineon Technologies AG 3,391,376 1.62
131,861 Kabel Deutschland Holding AG 5,213,125 2.48
35,128 Linde AG 3,749,914 1.79
96,952 NORMA Group 1,221,595 0.58
119,391 ProSiebenSat.1 Media AG (Pref) 1,662,281 0.79
190,546 SAP AG 7,251,228 3.45
31,253,440 14.88
Ireland 1,176,874 Ryanair Holdings Plc 3,682,439 1.75
Italy 900,184 Piaggio & C SpA* 2,414,293 1.15
214,565 Salvatore Ferragamo Italia SpA 2,606,965 1.24
5,021,258 2.39
Jersey 394,507 Experian Plc 3,152,770 1.50
Luxembourg 1,607,078 AZ Electronic Materials SA 4,160,084 1.98
Norway 255,452 DnB NOR ASA 2,126,132 1.01
240,562 Petroleum Geo-Services ASA 2,079,988 0.99
4,206,120 2.00
Sweden 200,526 Atlas Copco 'A' 3,143,273 1.50
174,548 Swedish Match AB 4,390,296 2.09
7,533,569 3.59
Switzerland 145,700 Cie Financiere Richemont SA 'A' 5,823,086 2.77
255,743 Nestle SA 10,906,749 5.20
21,708 Roche Holding AG 2,607,800 1.24
16,390 Swatch Group AG 5,178,689 2.47
20,681 Syngenta AG 4,581,437 2.18
71,077 Temenos Group AG 1,074,952 0.51
30,172,713 14.37
United Kingdom 251,109 Antofagasta Plc* 3,816,142 1.82
165,261 Aveva Group Plc 2,927,901 1.39
482,720 BG Group Plc 7,226,886 3.44
149,652 British American Tobacco Plc 4,599,297 2.19
1,064,062 Capital & Counties Properties Plc 1,986,173 0.95
230,646 Diageo Plc 3,208,071 1.53
559,511 Fenner Plc 2,316,982 1.10
655,730 HSBC Holdings Plc 3,954,233 1.88
293,288 Imperial Tobacco Group Plc 6,756,963 3.22
206,330 Rio Tinto Plc 8,824,056 4.20
198,785 Rotork Plc 3,856,505 1.84
196,571 Spirax-Sarco Engineering Plc 4,082,300 1.94
427,398 Standard Chartered Plc 6,710,132 3.20
347,571 Tullow Oil Plc 4,190,328 2.00
158,375 Victrex Plc 2,320,954 1.11
149,810 Weir Group Plc/The 3,244,912 1.54
70,021,835 33.35
United States 219,486 Virgin Media Inc 3,900,996 1.86
Total Common / Preferred Stocks (Shares) 209,937,691 99.97
Total Transferable Securities Admitted
to an Official Stock Exchange Listing or
Dealt in on Another Regulated Market 209,937,691 99.97
Total Portfolio 209,937,691 99.97
Other Net Assets 56,688 0.03
Total Net Assets (EUR) 209,994,379 100.00
Portfolio of Investments 31 August 2011
Transferable Securities Admitted to an Official Stock Exchange Listing or Dealt in on Another Regulated Market
Holding Description Value (EUR) %
Transferable Securities Admitted to an Official Stock Exchange Listing or Dealt in on Another Regulated Market
Holding Description Value (EUR) %

Audited Annual Report and Accounts 107
The notes on pages 261 to 270 form an integral part of these financial statements.
European Growth Fund continued
Sector Breakdownas at 31 August 2011
% of netassets
Industrials 20.61
Consumer Staples 17.49
Consumer Discretionary 16.36
Materials 14.11
Energy 8.66
Healthcare 8.17
Information Technology 7.53
Financials 7.04
Other Net Assets 0.03
100.00

108 BlackRock Global Funds (BGF)
European Small & MidCap Opportunities Fund
Portfolio of Investments 31 August 2011
COMMON / PREFERRED STOCKS (SHARES)
Austria 524,612 CA Immobilien Anlagen AG 4,993,782 1.63
155,684 Telekom Austria AG 1,203,437 0.39
47,857 Vienna Insurance Group AG Wiener
Versicherung Gruppe 1,543,627 0.50
7,740,846 2.52
Belgium 101,410 Belgacom SA 2,332,937 0.76
40,469 Colruyt SA 1,468,215 0.48
59,950 D'ieteren SA/NV 2,284,095 0.74
20,098 Mobistar SA 911,545 0.29
4,012 Telenet Group Holding NV 112,858 0.04
7,109,650 2.31
British Virgin Islands 974,240 Gem Diamonds Ltd 2,296,256 0.75
Canada 1,171,525 Ithaca Energy Inc 1,704,272 0.55
Cayman Islands 3,278,483 Orchid Developments Ltd 426,001 0.14
Denmark 48,731 Novo Nordisk A/S 'B' 3,616,937 1.17
26,960 William Demant Holding A/S 1,559,218 0.51
5,176,155 1.68
France 131,776 Alstom SA * 4,248,458 1.38
72,497 Atos 2,515,646 0.82
79,443 Bouygues SA 2,115,170 0.69
38,185 Christian Dior SA 3,818,500 1.24
68,574 Etablissements Maurel et Prom 991,923 0.32
90,391 Safran SA 2,455,924 0.80
206,352 Suez Environnement Co 2,404,001 0.78
67,602 Valeo SA 2,478,289 0.81
59,332 Zodiac Aerospace 3,332,678 1.08
24,360,589 7.92
Germany 37,457 Adidas AG 1,805,240 0.59
68,070 Aixtron SE NA * 1,078,910 0.35
62,992 Axel Springer AG 1,894,169 0.62
74,021 Bayerische Motoren Werke AG 4,145,176 1.35
47,671 Beiersdorf AG 1,951,412 0.63
66,035 Daimler AG 2,468,058 0.80
136,364 Deutsche Boerse AG 5,505,015 1.79
287,767 Deutsche Telekom AG 2,799,973 0.91
94,431 Fresenius SE & Co KGaA 6,755,594 2.20
42,500 K+S AG 2,102,475 0.68
35,709 Merck KGaA 2,217,172 0.72
90,228 MTU Aero Engines Holding AG 4,276,807 1.39
6,205 Puma SE 1,504,092 0.49
13,687 Volkswagen AG (Pfd Non-Vtg) (Pref) 1,586,323 0.52
5,775 Wacker Chemie AG 577,385 0.19
65,942 Wincor Nixdorf AG 2,580,970 0.84
43,248,771 14.07
Ireland 50,886 DCC Plc 969,887 0.32
1,665,711 Ryanair Holdings Plc 5,212,010 1.69
6,181,897 2.01
Italy 153,824 Azimut Holding SpA 754,353 0.25
61,910 Banca Generali SpA 427,488 0.14
1,181,841 0.39
Jersey 191,009 Experian Plc 1,526,481 0.50
Luxembourg 99,419 Subsea 7 SA 1,607,355 0.52
Netherlands 219,004 European Aeronautic Defence and Space
Co NV 4,813,708 1.57
7,462 Exact Holding NV 141,778 0.05
82,679 Imtech NV 1,669,289 0.54
68,452 Koninklijke DSM NV 2,404,719 0.78
97,316 Koninklijke KPN NV 959,536 0.31
128,639 Nutreco Holding NV 6,046,033 1.97
115,563 Unit 4 NV 2,098,046 0.68
18,133,109 5.90
Norway 109,512 TGS Nopec Geophysical Co ASA 1,879,598 0.61
Portugal 317,058 Galp Energia SGPS SA 'B' 4,391,253 1.43
200,561 Portugal Telecom SGPS SA 1,175,288 0.38
5,566,541 1.81
Spain 122,473 Bolsas y Mercados Espanoles SA * 2,371,077 0.77
371,809 Repsol YPF SA 7,439,898 2.42
9,810,975 3.19
Sweden 180,228 Kinnevik Investment AB 'B' 2,685,223 0.87
Switzerland 52,670 Actelion Ltd 1,550,593 0.50
2,885 Banque Cantonale Vaudoise 1,157,737 0.38
60,970 Cie Financiere Richemont SA 'A' 2,436,743 0.79
4,290 Kuoni Reisen Holding AG 'B' 1,021,138 0.33
219,533 Logitech International SA * 1,822,318 0.59
118,564 Novartis AG 4,780,333 1.56
1,494 Sika AG 2,362,195 0.77
24,696 Sonova Holding AG 1,463,215 0.48
2,865 Swisscom AG 892,442 0.29
24,307 Syngenta AG 5,384,701 1.75
20,332 Valora Holding AG 4,159,937 1.35
27,031,352 8.79
United Kingdom 1,786,905 3i Group Plc 4,278,312 1.39
90,473 Babcock International Group Plc 637,887 0.21
195,578 Bellway Plc 1,314,852 0.43
268,002 BG Group Plc 4,012,305 1.30
87,387 BHP Billiton Plc 2,076,472 0.68
126,314 BowLeven Plc 184,825 0.06
495,477 British Land Co Plc (Reit) 3,023,133 0.98
476,063 British Sky Broadcasting Group Plc 3,550,164 1.15
394,762 Cairn Energy Plc 1,493,793 0.49
345,978 Compass Group Plc 2,152,018 0.70
212,767 Drax Group Plc 1,256,118 0.41
1,237,961 Faroe Petroleum Plc 2,238,035 0.73
475,250 Hammerson Plc (Reit) 2,182,844 0.71
Transferable Securities Admitted to an Official Stock Exchange Listing or Dealt in on Another Regulated Market
Holding Description Value (EUR) %
Transferable Securities Admitted to an Official Stock Exchange Listing or Dealt in on Another Regulated Market
Holding Description Value (EUR) %

* Securities lent, see Note 11, for further details.
Audited Annual Report and Accounts 109
The notes on pages 261 to 270 form an integral part of these financial statements.
European Small & MidCap Opportunities Fund continued
Portfolio of Investments 31 August 2011
596,794 Hamworthy Plc 3,519,938 1.14
1,377,441 Hornby Plc 2,124,446 0.69
887,290 IG Group Holdings Plc 4,484,402 1.46
600,797 Inmarsat Plc 3,185,120 1.04
1,164,846 International Power Plc 4,432,825 1.44
683,968 J Sainsbury Plc 2,313,809 0.75
113,952 Johnson Matthey Plc 2,201,700 0.72
1,225,366 K3 Business Technology Group Plc 2,512,942 0.82
708,963 Kingfisher Plc 1,898,506 0.62
391,475 Land Securities Group Plc (Reit) 3,253,319 1.06
1,518,195 Man Group Plc 3,859,669 1.26
1,003,508 Meggitt Plc 3,888,019 1.26
482,131 National Express Group Plc 1,361,899 0.44
104,880 Nautical Petroleum Plc 300,407 0.10
1,057,226 Northern Petroleum Plc 872,029 0.28
452,274 Pennon Group Plc 3,324,214 1.08
266,350 Persimmon Plc 1,345,241 0.44
133,460 Petropavlovsk Plc 1,319,469 0.43
417,519 Prudential Plc 2,887,139 0.94
48,593 Rio Tinto Plc 2,078,163 0.68
1,805,994 RSA Insurance Group Plc 2,344,641 0.76
835,810 Sage Group Plc/The 2,382,675 0.77
219,689 Scottish & Southern Energy Plc 3,212,052 1.04
177,831 Severn Trent Plc 2,943,643 0.96
392,181 Smith & Nephew Plc 2,773,964 0.90
292,314 Standard Chartered Plc 4,589,318 1.49
1,356,163 Standard Life Plc 3,116,756 1.01
65,156 Tullow Oil Plc 785,523 0.26
503,644 United Utilities Group Plc 3,420,095 1.11
267,529 Valiant Petroleum Plc 1,496,291 0.49
1,998,498 Vodafone Group Plc 3,680,708 1.20
78,539 William Hill Plc 201,443 0.07
706,646 WM Morrison Supermarkets Plc 2,309,086 0.75
174,739 Xstrata Plc 2,148,121 0.70
114,968,330 37.40
Total Common / Preferred Stocks (Shares) 282,635,242 91.93
Total Transferable Securities Admitted
to an Official Stock Exchange Listing or
Dealt in on Another Regulated Market 282,635,242 91.93
Unquoted Securities
COMMON STOCKS (SHARES)
United States 132,000 Capital Development Corp (Defaulted) – 0.00
Total Unquoted Securities – 0.00
Total Portfolio 282,635,242 91.93
Other Net Assets 24,795,136 8.07
Total Net Assets (EUR) 307,430,378 100.00
Transferable Securities Admitted to an Official Stock Exchange Listing or Dealt in on Another Regulated Market
Holding Description Value (EUR) %
Transferable Securities Admitted to an Official Stock Exchange Listing or Dealt in on Another Regulated Market
Holding Description Value (EUR) %
Sector Breakdownas at 31 August 2011
% of netassets
Financials 17.53
Consumer Discretionary 13.73
Industrials 13.01
Energy 9.56
Materials 8.13
Healthcare 8.04
Utilities 6.82
Telecommunication Services 5.61
Information Technology 4.92
Consumer Staples 4.58
Other Net Assets 8.07
100.00

* Securities lent, see Note 11, for further details.
110 BlackRock Global Funds (BGF)
European Value Fund
Portfolio of Investments 31 August 2011
COMMON STOCKS (SHARES)
Belgium 163,236 KBC Groep NV 3,113,727 1.89
France 170,130 BNP Paribas SA 6,040,466 3.67
105,133 Cie de Saint-Gobain 3,670,193 2.23
80,633 Eiffage SA 2,700,399 1.64
147,147 GDF Suez 3,207,805 1.95
127,427 Legrand SA 3,494,685 2.12
159,986 Sanofi-Aventis SA 8,100,091 4.92
31,090 Schneider Electric SA 2,884,530 1.75
30,098,169 18.28
Germany 76,613 BASF SE 3,811,880 2.32
108,012 Bayer AG 4,855,679 2.95
47,625 Bilfinger Berger SE 2,784,158 1.69
65,371 Continental AG 3,345,688 2.03
173,105 GEA Group AG 3,510,569 2.13
128,206 GSW Immobilien AG 2,865,404 1.74
76,162 HeidelbergCement AG 2,263,535 1.37
31,999 Merck KGaA 1,986,818 1.21
153,065 NORMA Group 1,928,619 1.17
27,352,350 16.61
Ireland 859,586 Ryanair Holdings Plc 2,690,504 1.63
Italy 1,426,773 Enel SpA 4,819,639 2.93
2,888,882 Intesa Sanpaolo SpA 3,270,215 1.98
8,089,854 4.91
Jersey 194,099 Wolseley Plc 3,500,227 2.13
Netherlands 415,731 ING Groep NV 2,496,880 1.52
60,350 Koninklijke DSM NV * 2,120,096 1.29
474,984 Koninklijke KPN NV 4,683,342 2.84
9,300,318 5.65
Norway 330,056 DnB NOR ASA 2,747,062 1.67
Spain 230,431 Repsol YPF SA 4,610,924 2.80
Sweden 229,339 Assa Abloy AB 'B' 3,702,718 2.25
148,775 Svenska Handelsbanken AB 'A' 2,839,465 1.72
836,311 TeliaSonera AB 4,166,817 2.53
10,709,000 6.50
Switzerland 186,276 Novartis AG 7,510,385 4.56
27,187 Zurich Financial Services AG 4,216,827 2.56
11,727,212 7.12
United Kingdom 1,366,125 3i Group Plc 3,270,856 1.99
1,757,437 BP Plc 7,991,563 4.85
76,004 British American Tobacco Plc 2,335,852 1.42
441,701 GlaxoSmithKline Plc 6,560,380 3.98
179,374 Imperial Tobacco Group Plc 4,132,537 2.51
6,869,030 Lloyds Banking Group Plc 2,582,190 1.57
445,037 Royal Dutch Shell Plc 'B' 10,376,254 6.30
5,073,180 Vodafone Group Plc 9,343,463 5.67
1,139,443 WM Morrison Supermarkets Plc 3,723,325 2.26
50,316,420 30.55
Total Common Stocks (Shares) 164,255,767 99.74
Total Transferable Securities Admitted
to an Official Stock Exchange Listing or
Dealt in on Another Regulated Market 164,255,767 99.74
Total Portfolio 164,255,767 99.74
Other Net Assets 428,578 0.26
Total Net Assets (EUR) 164,684,345 100.00
Transferable Securities Admitted to an Official Stock Exchange Listing or Dealt in on Another Regulated Market
Holding Description Value (EUR) %
Transferable Securities Admitted to an Official Stock Exchange Listing or Dealt in on Another Regulated Market
Holding Description Value (EUR) %
Sector Breakdownas at 31 August 2011
% of netassets
Financials 20.31
Industrials 18.74
Healthcare 17.62
Energy 13.95
Telecommunication Services 11.04
Consumer Staples 6.19
Materials 4.98
Utilities 4.88
Consumer Discretionary 2.03
Other Net Assets 0.26
100.00

Audited Annual Report and Accounts 111
The notes on pages 261 to 270 form an integral part of these financial statements.
Fixed Income Global Opportunities Fund
Portfolio of Investments 31 August 2011
BONDS
Canada USD 440,000 Fairfax Financial Holdings Ltd '144A' 5.8%
15/5/2021 431,915 0.37
USD 825,000 Nova Chemicals Corp 6.5% 15/1/2012 829,125 0.70
USD 1,000,000 Nova Chemicals Corp 8.375% 1/11/2016 1,078,750 0.91
2,339,790 1.98
Cayman Islands GBP 217,571 Punch Taverns Finance B Ltd 4.767%
30/6/2033 286,243 0.24
GBP 160,000 Punch Taverns Finance B Ltd 5.943%
30/12/2024 204,409 0.18
490,652 0.42
France USD 750,000 Dexia Credit Local SA '144A' 2.375%
23/9/2011 750,621 0.64
Greece EUR 270,000 Hellenic Republic Government Bond
2.3% 25/7/2030 163,011 0.14
Ireland USD 375,000 XL Group Plc FRN 15/4/2017 (Perpetual) 333,750 0.28
Netherlands EUR 62,949 Globaldrive BV '2008-2 A' 4% 20/10/2016 91,858 0.08
United Kingdom USD 299,275 Arran Residential Mortgages Funding Plc
'2010-1A A1C' '144A' FRN 16/5/2047 298,981 0.25
GBP 363,000 Centre Parcs Mortgage Finance Plc
'2007-1 A2' FRN 10/10/2018 577,549 0.49
GBP 346,000 Enterprise Inns Plc 6.5% 6/12/2018 433,322 0.37
GBP 390,000 Enterprise Inns Plc 6.875% 15/2/2021 464,967 0.39
EUR 200,000 FCE Bank Plc 7.125% 15/1/2013 290,643 0.25
EUR 1,083,531 Gosforth Funding Plc '2011-1 A1B' FRN
24/4/2047 1,564,680 1.33
GBP 444,799 Preferred Residential Securities
'2005-1X A2C' FRN 15/6/2043 633,878 0.54
GBP 825,000 Residential Mortgage Securities FRN
16/12/2050 1,335,108 1.13
EUR 448,980 RMAC PLC '2005-NS2X A2C' FRN
12/9/2037 573,166 0.49
GBP 905,000 Spirit Issuer Plc FRN 28/12/2011 1,121,624 0.95
GBP 355,000 Spirit Issuer Plc FRN 28/12/2018 518,448 0.44
GBP 475,000 Spirit Issuer Plc FRN 28/12/2028 612,485 0.52
GBP 662,644 Titan Europe Plc/Ireland '2006-4FSX A1'
FRN 3/9/2014 1,011,301 0.86
GBP 488,030 Turbo Finance '2011-1 A' FRN 20/1/2019 797,284 0.68
GBP 194,000 Unique Pub Finance Co Plc/The 5.659%
30/6/2027 216,475 0.18
GBP 300,000 Unique Pub Finance Co Plc/The 6.542%
30/3/2021 375,400 0.32
GBP 442,000 Unique Pub Finance Co Plc/The Series M
7.395% 28/3/2024 472,415 0.40
GBP 203,000 Virgin Media Secured Finance Plc 7%
15/1/2018 346,451 0.29
GBP 161,000 Wellington Pub Co Plc 7.335% 15/1/2029 216,741 0.18
11,860,918 10.06
United States USD 481,449 321 Henderson Receivables I LLC '2010-3A A'
'144A' 3.82% 15/12/2048 482,416 0.41
USD 465,950 321 Henderson Receivables I LLC '2010-2A A'
'144A' 4.07% 15/1/2048 484,377 0.41
USD 1,370,000 AES Corp/The 7.75% 15/10/2015 1,435,075 1.22
USD 1,550,000 Ally Financial Inc 4.5% 11/2/2014 1,480,250 1.26
USD 80,000 Ally Financial Inc 8% 15/3/2020 79,400 0.07
USD 140,000 Ally Financial Inc 8.3% 12/2/2015 143,850 0.12
USD 198,680 American Airlines 2011-1 Class B
Pass Through Trust Series B '144A'
7% 31/1/2018 170,865 0.14
USD 625,000 American Airlines Inc 10.5% 15/10/2012 644,531 0.55
USD 225,000 Amsouth Bank/Birmingham AL 4.85%
1/4/2013 212,625 0.18
USD 100,000 Amsouth Bank/Birmingham AL 5.2%
1/4/2015 94,000 0.08
USD 175,000 Anadarko Petroleum Corp 6.375%
15/9/2017 200,255 0.17
USD 1,210,000 ARAMARK Corp 8.5% 1/2/2015 1,243,275 1.06
USD 465,000 Arch Coal Inc 7.25% 1/10/2020 462,675 0.39
USD 46,000 Arch Western Finance LLC 6.75% 1/7/2013 46,287 0.04
USD 680,000 Arran Residential Mortgages Funding Plc
'2006-2A A3B' '144A' FRN 20/9/2056 679,504 0.58
USD 500,000 Aviation Capital Group Corp '144A' 7.125%
15/10/2020 504,272 0.43
USD 500,000 Avis Budget Car Rental LLC / Avis Budget
Finance Inc 8.25% 15/1/2019 482,500 0.41
USD 275,000 Ball Corp 7.125% 1/9/2016 297,000 0.25
USD 225,000 Ball Corp 7.375% 1/9/2019 243,000 0.21
USD 619,324 Banc of America Merrill Lynch Commercial
Mortgage Inc '2005-3 A2' 4.501%
10/7/2043 618,713 0.53
USD 360,696 Banc of America Merrill Lynch Commercial
Mortgage Inc '2002-2 A3' 5.118%
11/7/2043 363,778 0.31
USD 1,283,241 BCAP LLC Trust '2010-RR11 4A1' '144A'
FRN 27/3/2047 1,132,460 0.96
USD 741,508 Bear Stearns Adjustable Rate Mortgage
Trust '2004-5 2A' FRN 25/7/2034 664,861 0.56
USD 160,000 Beazer Homes USA Inc 9.125% 15/6/2018 110,800 0.09
USD 404,160 BNC Mortgage Loan Trust '2007-3 A2' FRN
25/7/2037 349,129 0.30
USD 785,000 Brocade Communications Systems Inc
6.625% 15/1/2018 794,812 0.67
GBP 50,000 Capital One Multi-Asset Execution Trust
FRN 17/6/2014 85,760 0.07
USD 181,351 Carrington Mortgage Loan Trust
'2006-NC5 A1' FRN 25/1/2037 178,679 0.15
USD 600,000 CCH II LLC / CCH II Capital Corp 13.5%
30/11/2016 694,500 0.59
USD 150,000 Cengage Learning Acquisitions Inc '144A'
10.5% 15/1/2015 116,250 0.10
USD 57,000 CF Industries Inc 6.875% 1/5/2018 64,125 0.05
USD 210,000 Charter Communications Operating LLC /
Charter Communications Operating Capital
'144A' 8% 30/4/2012 216,300 0.18
USD 500,000 Charter Communications Operating LLC /
Charter Communications Operating Capital
'144A' 10.875% 15/9/2014 542,500 0.46
USD 725,000 Chesapeake Energy Corp 6.125% 15/2/2021 733,156 0.62
USD 224,000 Chesapeake Energy Corp 6.625% 15/8/2020 234,080 0.20
Transferable Securities Admitted to an Official Stock Exchange Listing or Dealt in on Another Regulated Market
Holding Description Value (USD) %
Transferable Securities Admitted to an Official Stock Exchange Listing or Dealt in on Another Regulated Market
Holding Description Value (USD) %

112 BlackRock Global Funds (BGF)
Fixed Income Global Opportunities Fund continued
Portfolio of Investments 31 August 2011
USD 380,000 Chesapeake Energy Corp 7.625% 15/7/2013 408,500 0.35
USD 290,000 Chesapeake Energy Corp 9.5% 15/2/2015 327,700 0.28
USD 1,000,000 CIT Group Inc '144A' 5.25% 1/4/2014 970,000 0.82
USD 342,781 Citicorp Mortgage Securities Inc '2006-2 1A7'
5.75% 25/4/2036 341,344 0.29
USD 18,000 Clear Channel Worldwide Holdings Inc
Series B 9.25% 15/12/2017 19,170 0.02
USD 545,000 Commercial Mortgage Loan Trust
'2008-LS1 A4B' FRN 9/10/2017 583,170 0.49
USD 249,605 Conseco Financial Corp '1995-5 M1' FRN
15/9/2026 258,298 0.22
USD 93,000 Consol Energy Inc 8% 1/4/2017 99,045 0.08
USD 232,000 Consol Energy Inc 8.25% 1/4/2020 248,240 0.21
USD 309,593 Continental Airlines 2007-1 Class C Pass
Through Trust 7.339% 19/4/2014 301,853 0.26
USD 440,000 Continental Airlines 2010-1 Class B Pass
Through Trust Series B 6% 12/1/2019 405,075 0.34
USD 895,000 Continental Resources Inc/OK 8.25%
1/10/2019 966,600 0.82
USD 1,285,000 Countrywide Asset-Backed Certificates
'2007-BC2 2A2' FRN 25/6/2037 1,106,758 0.94
USD 620,166 Countrywide Asset-Backed Certificates
'2007-12 2A1' FRN 25/8/2047 572,521 0.49
USD 684,000 Countrywide Asset-Backed Certificates
'2007-7 2A2' FRN 25/10/2047 539,812 0.46
USD 250,000 Credit Acceptance Auto Loan Trust '2010-1 A'
'144A' 2.06% 16/4/2018 251,018 0.21
USD 155,000 Credit Acceptance Corp '144A' 9.125%
1/2/2017 157,713 0.13
USD 275,000 Credit Suisse Mortgage Capital Certificates
'2006-C5 AM' 5.343% 15/12/2039 241,971 0.21
USD 200,000 Cricket Communications Inc 7.75%
15/5/2016 202,000 0.17
USD 320,000 Crown Americas LLC / Crown Americas
Capital Corp III '144A' 6.25% 1/2/2021 320,800 0.27
USD 645,000 Crown Castle Towers LLC '144A' 6.113%
15/1/2020 731,866 0.62
USD 1,210,000 DBUBS Mortgage Trust '2011-LC2A A2'
'144A' 3.386% 10/7/2044 1,211,416 1.03
USD 335,000 Delphi Corp '144A' 5.875% 15/5/2019 321,600 0.27
USD 440,000 Denver Public Schools 7.017% 15/12/2037 521,655 0.44
USD 465,000 Developers Diversified Realty Corp 7.875%
1/9/2020 519,744 0.44
USD 1,100,000 DISH DBS Corp '144A' 7.75% 31/5/2015 1,155,000 0.98
USD 180,000 DJO Finance LLC 10.875% 15/11/2014 186,975 0.16
USD 1,530,000 Dollar General Corp 11.875% 15/7/2017 1,702,125 1.44
USD 340,000 Domtar Corp 7.125% 15/8/2015 374,000 0.32
USD 340,000 Domtar Corp 10.75% 1/6/2017 425,850 0.36
USD 170,000 Energy Future Holdings Corp 10%
15/1/2020 171,877 0.15
USD 175,000 Extended Stay America Trust '2010-ESHA C'
'144A' 4.86% 5/11/2027 169,248 0.14
USD 2,759,843 Fannie Mae REMICS '126 UI' '2010-126 UI'
5.5% 25/10/2040 438,356 0.37
USD 1,235,000 Federal National Mortgage Association 0%
9/10/2019 (Zero Coupon) 925,358 0.79
USD 851,000 First Data Corp '144A' 7.375% 15/6/2019 787,175 0.67
USD 518,000 Ford Motor Credit Co LLC 12% 15/5/2015 622,329 0.53
USD 846,000 Forest Oil Corp 8.5% 15/2/2014 909,450 0.77
USD 150,000 Forethought Financial Group Inc '144A'
8.625% 15/4/2021 155,431 0.13
USD 520,000 Genworth Financial Inc 7.7% 15/6/2020 465,106 0.39
USD 60,000 Georgia-Pacific LLC '144A' 7.125% 15/1/2017 63,402 0.05
USD 755,000 Georgia-Pacific LLC '144A' 8.25% 1/5/2016 861,994 0.73
USD 455,309 GMAC Commercial Mortgage Securities Inc
'1997-C2 F' FRN 15/4/2029 477,820 0.41
USD 260,331 GMAC Mortgage Corp Loan Trust
'2005-AR5 4A1' FRN 19/9/2035 240,314 0.20
USD 300,000 Greenwich Capital Commercial Funding Corp
'2006-GG7 AM' FRN 10/7/2038 281,247 0.24
USD 700,000 GS Mortgage Securities Corp II '2006-GG6 AM'
FRN 10/4/2038 647,834 0.55
USD 802,361 Harborview Mortgage Loan Trust '2005-8 1A2A'
FRN 19/9/2035 500,900 0.43
USD 210,000 Host Hotels & Resorts LP 6.375%
15/3/2015 215,250 0.18
USD 235,000 Icahn Enterprises LP / Icahn Enterprises
Finance Corp 7.75% 15/1/2016 235,000 0.20
USD 153,000 Interpublic Group of Cos Inc/The 6.25%
15/11/2014 166,388 0.14
USD 653,000 Jabil Circuit Inc 7.75% 15/7/2016 715,035 0.61
USD 565,000 Jarden Corp 8% 1/5/2016 605,256 0.51
USD 320,000 JP Morgan Chase Commercial Mortgage
Securities Corp '2007-LD11 ASB' FRN
15/6/2049 339,124 0.29
USD 322,986 JP Morgan Chase Commercial Mortgage
Securities Corp '2004-CB8 A1A' '144A'
4.158% 12/1/2039 332,624 0.28
USD 1,190,000 JPMorgan Chase & Co FRN 30/4/2018
(Perpetual) 1,247,109 1.06
USD 490,198 LB-UBS Commercial Mortgage Trust
'2004-C4 A3' FRN 15/6/2029 498,349 0.42
USD 760,000 LB-UBS Commercial Mortgage Trust
'2007-C1 A4' 5.424% 15/2/2040 810,194 0.69
USD 1,000,000 LB-UBS Commercial Mortgage Trust
'2007-C6 A4' FRN 15/7/2040 1,065,729 0.90
USD 600,000 Level 3 Financing Inc 8.75% 15/2/2017 576,000 0.49
USD 492,000 Life Technologies Corp 5% 15/1/2021 510,552 0.43
USD 460,000 Lyondell Chemical Co 11% 1/5/2018 512,900 0.44
USD 251,995 MASTR Alternative Loans Trust '2005-2 2A1'
6% 25/1/2035 247,236 0.21
USD 230,000 Merrill Lynch/Countrywide Commercial
Mortgage Trust '2006-4 AM' FRN
12/12/2049 200,335 0.17
USD 155,000 MGM Resorts International 10.375%
15/5/2014 170,500 0.14
USD 515,000 MGM Resorts International 13% 15/11/2013 593,537 0.50
USD 265,000 Morgan Stanley Capital I '2007-IQ15 A4'
FRN 11/6/2049 282,206 0.24
USD 340,000 Nalco Co 8.25% 15/5/2017 377,400 0.32
USD 605,283 National RMBS Trust '2004-1 A1' FRN
20/3/2034 604,154 0.51
USD 825,000 New Jersey State Turnpike Authority 7.414%
1/1/2040 1,072,079 0.91
USD 800,000 New York City Industrial Development
Agency 8% 1/8/2012 821,488 0.70
USD 840,000 NRG Energy Inc 7.375% 15/1/2017 867,300 0.74
USD 141,000 Omnicare Inc 6.875% 15/12/2015 144,525 0.12
USD 149,000 Omnicare Inc 7.75% 1/6/2020 151,608 0.13
USD 209,342 Opteum Mortgage Acceptance Corp
'2005-4 1A1B' FRN 25/11/2035 180,931 0.15
USD 93,724 Option One Mortgage Loan Trust '2007-5 2A1'
FRN 25/5/2037 92,049 0.08
USD 610,000 Petrohawk Energy Corp 7.25% 15/8/2018 715,225 0.61
USD 145,000 Plains Exploration & Production Co 7.75%
15/6/2015 150,075 0.13
USD 550,000 ProLogis LP 6.25% 15/3/2017 604,996 0.51
USD 332,000 Qwest Communications International Inc
7.125% 1/4/2018 348,600 0.30
USD 838,000 Qwest Communications International Inc
8% 1/10/2015 891,423 0.76
USD 480,000 Qwest Corp 8.375% 1/5/2016 549,600 0.47
Transferable Securities Admitted to an Official Stock Exchange Listing or Dealt in on Another Regulated Market
Holding Description Value (USD) %
Transferable Securities Admitted to an Official Stock Exchange Listing or Dealt in on Another Regulated Market
Holding Description Value (USD) %

Audited Annual Report and Accounts 113
The notes on pages 261 to 270 form an integral part of these financial statements.
Fixed Income Global Opportunities Fund continued
Portfolio of Investments 31 August 2011
USD 825,000 Regions Financial Corp 4.875% 26/4/2013 800,561 0.68
USD 275,000 Regions Financial Corp 7.75% 10/11/2014 275,688 0.23
USD 850,000 Reliance Holdings USA Inc '144A' 4.5%
19/10/2020 815,997 0.69
USD 175,000 Reynolds Group Issuer Inc / Reynolds
Group Issuer LLC / Reynolds Group
Issuer Lu '144A' 7.125% 15/4/2019 167,125 0.14
USD 374,000 Reynolds Group Issuer Inc / Reynolds
Group Issuer LLC / Reynolds Group
Issuer Lu '144A' 8.5% 15/10/2016 382,415 0.32
USD 245,000 Rock-Tenn Co 9.25% 15/3/2016 258,475 0.22
USD 1,000,000 Rouse Co LP / TRC Co-Issuer Inc '144A'
6.75% 1/5/2013 1,023,750 0.87
USD 594,570 Santander Consumer Acquired Receivables
Trust '2011-S1A D' '144A' 3.15%
15/8/2016 596,613 0.51
USD 183,957 Santander Drive Auto Receivables Trust
'2011-S2A B' '144A' 2.06% 15/6/2017 183,612 0.16
USD 185,607 Santander Drive Auto Receivables Trust
'2011-S2A C' '144A' 2.86% 15/6/2017 185,317 0.16
USD 525,000 Santander Drive Auto Receivables Trust
'2010-B C' '144A' 3.02% 17/10/2016 532,548 0.45
USD 358,930 Santander Drive Auto Receivables Trust
'2011-S1A D' '144A' 3.1% 15/5/2017 357,458 0.30
USD 266,125 Santander Drive Auto Receivables Trust
'2011-S2A D' '144A' 3.35% 15/6/2017 265,327 0.23
USD 220,000 Santander Drive Auto Receivables Trust
'2010-2 C' 3.89% 17/7/2017 225,569 0.19
USD 340,000 Sequa Corp '144A' 11.75% 1/12/2015 357,000 0.30
USD 33,000 Sheraton Holding Corp 7.375% 15/11/2015 36,465 0.03
USD 1,000,000 SLM Corp FRN 31/1/2014 978,540 0.83
USD 185,000 SLM Corp 5.4% 25/10/2011 185,007 0.16
USD 150,000 SLM Corp 6.25% 25/1/2016 150,753 0.13
USD 460,914 SLM Student Loan Trust '2003-B A2' FRN
15/3/2022 448,313 0.38
USD 398,079 SLM Student Loan Trust '2004-B A2' FRN
15/6/2021 386,836 0.33
USD 481,068 Soundview Home Equity Loan Trust
'2006-EQ1 A2' FRN 25/10/2036 468,912 0.40
USD 422,000 Starwood Hotels & Resorts Worldwide Inc
7.875% 15/10/2014 466,310 0.40
USD 620,000 State of Illinois 4.421% 1/1/2015 651,325 0.55
USD 25,000 Steel Dynamics Inc 7.375% 1/11/2012 25,688 0.02
USD 212,391 SteelRiver Transmission Co LLC '144A'
4.71% 30/6/2017 220,307 0.19
USD 109,272 Structured Asset Securities Corp
'2007-BC1 A2' FRN 25/2/2037 105,097 0.09
USD 65,000 Tenet Healthcare Corp 8.875% 1/7/2019 69,225 0.06
USD 960,000 Tenet Healthcare Corp 9% 1/5/2015 1,027,200 0.87
USD 178,288 Thornburg Mortgage Securities Trust
'2007-2 A2A' FRN 25/6/2037 172,796 0.15
USD 327,690 Thornburg Mortgage Securities Trust
'2006-6 A1' FRN 25/11/2046 322,835 0.27
USD 279,455 UAL 2007-1 Pass Through Trust 6.636%
2/7/2022 280,153 0.24
USD 510,000 United States Treasury Note/Bond 1.5%
30/6/2016 524,782 0.45
USD 450,000 United States Treasury Note/Bond 2.125%
15/8/2021 447,680 0.38
USD 250,000 Ventas Realty LP / Ventas Capital Corp
4.75% 1/6/2021 242,358 0.21
USD 315,000 Wachovia Bank Commercial Mortgage Trust
'2007-C33 A4' FRN 15/2/2051 334,549 0.28
USD 134,998 Wells Fargo Mortgage Backed Securities Trust
'2005-AR1 1A1' FRN 25/2/2035 121,146 0.10
USD 735,000 Windstream Corp 8.125% 1/8/2013 782,775 0.66
71,247,004 60.46
Total Bonds 87,277,604 74.06
Total Transferable Securities Admitted
to an Official Stock Exchange Listing or
Dealt in on Another Regulated Market 87,277,604 74.06
Unquoted Securities
BONDS
United States USD 2,202,233 Banc of America Funding Corp '2006-A 3A2'
FRN 20/2/2036 1,184,914 1.00
USD 1,352,499 Bear Stearns Adjustable Rate Mortgage Trust
'2007-4 12A1' FRN 25/5/2037 977,509 0.83
USD 1,002,691 Chase Mortgage Finance Corp '2005-A2 3A4'
FRN 25/1/2036 870,544 0.74
USD 186,337 Countrywide Alternative Loan Trust
'2006-6CB 1A10' 5.5% 25/5/2036 146,698 0.12
USD 1,497,038 Countrywide Home Loan Mortgage Pass
Through Trust '2006-OA5 2A1' FRN
25/4/2046 813,563 0.69
USD 381,451 Countrywide Home Loan Mortgage Pass
Through Trust '2007-16 A1' 6.5%
25/10/2037 338,249 0.29
USD 677,558 Credit Suisse Mortgage Capital Certificates
'2010-20R 9A1' '144A' FRN 27/1/2036 626,741 0.53
USD 740,775 Credit Suisse Mortgage Capital Certificates
'2011-4R 5A1' '144A' FRN 27/5/2036 721,524 0.61
USD 709,507 Credit Suisse Mortgage Capital Certificates
'2011-2R 2A1' '144A' FRN 27/7/2036 691,728 0.59
USD 907,856 Credit-Based Asset Servicing and Securitization
LLC '2006-CB6 A23' FRN 25/7/2036 410,750 0.35
USD 1,045,832 First Horizon Alternative Mortgage Securities
'2005-AA10 2A1' FRN 25/12/2035 493,368 0.42
USD 654,123 Homebanc Mortgage Trust '2006-2 A1'
FRN 25/12/2036 431,647 0.37
USD 241,777 JP Morgan Mortgage Trust '2006-A1 2A2'
FRN 25/2/2036 208,695 0.18
USD 104,773 JP Morgan Mortgage Trust '2007-S1 1A2'
5.5% 25/3/2022 101,674 0.08
USD 464,831 Lehman XS Trust '2006-12N A2A2' FRN
25/8/2046 412,314 0.35
USD 636,709 Prime Mortgage Trust '2006-DR1 2A1'
'144A' 5.5% 25/5/2035 550,995 0.47
USD 36,848 Residential Asset Mortgage Products Inc
'2007-RS2 A1' FRN 25/5/2037 35,716 0.03
9,016,629 7.65
Total Bonds 9,016,629 7.65
Total Unquoted Securities 9,016,629 7.65
Total Portfolio 96,294,234 81.71
Other Net Assets 21,548,079 18.29
Total Net Assets (USD) 117,842,313 100.00
Transferable Securities Admitted to an Official Stock Exchange Listing or Dealt in on Another Regulated Market
Holding Description Value (USD) %
Transferable Securities Admitted to an Official Stock Exchange Listing or Dealt in on Another Regulated Market
Holding Description Value (USD) %

114 BlackRock Global Funds (BGF)
Fixed Income Global Opportunities Fund continued
Note: The total market value of USD (53,541) of these transactions is included in the Statement of Net Assets (see Note 2c).
Nominal Value Description
Unrealisedprofit/(loss)
USD
Nominal Value Description
Unrealisedprofit/(loss)
USD
Swaps as at 31 August 2011
USD (900,000) Credit Default Swaps (Deutsche Bank) (Fund provides
default protection on Aviva Plc; and receives Fixed
1%) (25/5/2012) 7,181
USD 11,700,000 Interest Rate Swaps (JP Morgan) (Fund receives Fixed
0.955%; and pays Floating USD LIBOR 3 Month)
(8/2/2013) 82,104
USD 11,900,000 Interest Rate Swaps (Deutsche Bank) (Fund receives
Fixed 1.245%; and pays Floating USD LIBOR
3 Month) (8/12/2013) 167,508
USD 600,000 Credit Default Swaps (Credit Suisse) (Fund receives
default protection on Wells Fargo & Co 0.50438%
28/10/2015; and pays Fixed 1%) (20/12/2015) (4,139)
USD 1,400,000 Credit Default Swaps (Morgan Stanley) (Fund receives
default protection on CDX.NA.HY.16-V1; and pays
Fixed 1%) (20/6/2016) 13,808
USD 4,000,000 Interest Rate Swaps (JP Morgan) (Fund receives Fixed
3.0575%; and pays Floating USD LIBOR 3 Month)
(13/6/2021) 262,865
USD 3,610,000 Inflation Swap (Deutsche Bank) (Fund receives Fixed
2.75%; and pays USCPIU + 0bps) (2/8/2021) 130,805
USD 5,400,000 Interest Rate Swaps (Deutsche Bank) (Fund receives
Fixed 2.68%; and pays Floating USD LIBOR 3 Month)
(9/8/2021) 162,949
GBP 1,680,000 Interest Rate Swaps (Deutsche Bank) (Fund receives
Fixed 3.81375%; and pays Floating GBP LIBOR
6 Month) (20/9/2040) 83,923
EUR 1,790,000 Interest Rate Swaps (Deutsche Bank) (Fund receives
Floating EUR EURIBOR 6 Month; and pays Fixed
3.071%) (22/9/2040) 47,039
USD 2,100,000 Interest Rate Swaps (JP Morgan) (Fund receives Floating
USD LIBOR 3 Month; and pays Fixed 3.6975%)
(3/11/2040) (208,723)
USD 200,000 Interest Rate Swaps (Deutsche Bank) (Fund receives
Floating USD LIBOR 3 Month; and pays Fixed
4.3525%) (15/4/2041) (45,832)
USD 400,000 Interest Rate Swaps (Citibank) (Fund receives Floating
USD LIBOR 3 Month; and pays Fixed 4.07375%)
(23/5/2041) (69,712)
USD 1,100,000 Interest Rate Swaps (Deutsche Bank) (Fund receives
Floating USD LIBOR 3 Month; and pays Fixed
4.055%) (5/7/2041) (187,805)
USD 2,100,000 Interest Rate Swaps (Deutsche Bank) (Fund receives
Floating USD LIBOR 3 Month; and pays Fixed
3.914%) (22/7/2041) (300,028)
USD 6,600,000 Interest Rate Swaps (JP Morgan) (Fund receives Floating
USD LIBOR 3 Month; and pays Fixed 3.36978%)
(15/8/2041) (228,811)
USD 3,200,000 Interest Rate Swaps (Deutsche Bank) (Fund receives
Fixed 3.257%; and pays Floating USD LIBOR
3 Month) (30/8/2041) 40,156
(46,712)
Open Futures Contractsas at 31 August 2011
Numberof contracts Contract/Description
Expirationdate
ValueUSD
109 US Long Bond (CBT) December 2011 15,747,094
8 US Long Bond (CBT) December 2011 1,095,750
(48) US Treasury 2 Year Note (CBT) December 2011 (10,584,000)
(50) 30 Day Interbank December 2011 (12,674,809)
(138) US Treasury 10 Year Note December 2011 (17,851,594)
(147) US Treasury 5 Year Note (CBT) December 2011 (18,029,320)
Total commitment (42,296,879)
Note: The net unrealised profit of USD 184,702 attributed to these transactions is included
in the Statement of Net Assets (see Note 2c).
Swaptions as at 31 August 2011
Nominal
Value Description
UnrealisedlossUSD
ValueUSD
USD 1,400,000 Fund purchases a put option (expiring
21/12/2011) to enter into an Interest Rate
Swap (Morgan Stanley Capital Services
Inc). If exercised Fund receives 1.2% Fixed
semi-annually from 23/6/2012; and pays
Floating US$ Libor 3-month-BBA quarterly
from 23/3/20 (4,506) (9,966)
(4,506) (9,966)
Note: Swaptions are included in the Statement of Net Assets (see Note 2c).
Open Forward Foreign Exchange Transactionsas at 31 August 2011
Purchases Sales Value date Unrealised
profit/(loss)
Unrealisedprofit/(loss)
USD Equivalent
Core Fund USD
GBP 962,000 USD 1,579,250 7/10/2011 (10,141) (10,141)
USD 513,816 AUD 493,000 7/10/2011 (11,411) (11,411)
USD 12,458,074 GBP 7,795,500 7/10/2011 (257,088) (257,088)
EUR 197,000 USD 283,036 26/10/2011 1,283 1,283
USD 4,145,168 EUR 2,891,500 26/10/2011 (27,970) (27,970)
Net unrealised loss (305,327) (305,327)
EUR Hedged Share Class EUR
EUR 36,668,000 USD 52,012,205 14/9/2011 646,836 934,194
USD 2,097,435 EUR 1,471,536 14/9/2011 (18,952) (27,371)
Net unrealised profit 627,884 906,823
PLN Hedged Share Class PLN
PLN 10,967,745 USD 3,800,773 14/9/2011 38,938 13,560
USD 224,683 PLN 657,228 14/9/2011 (11,172) (3,891)
Net unrealised profit 27,766 9,669
SGD Hedged Share Class SGD
SGD 1,533,379 USD 1,255,508 14/9/2011 23,566 19,596
USD 15,460 SGD 18,818 14/9/2011 (226) (188)
Net unrealised profit 23,340 19,408
Total net unrealised profit 630,573
Note: The net unrealised profit attributed to these transactions is included in the Statement
of Net Assets (see Note 2c).

Audited Annual Report and Accounts 115
The notes on pages 261 to 270 form an integral part of these financial statements.
Flexible Multi-Asset Fund
Portfolio of Investments 31 August 2011
FUNDS
Guernsey 80,663 BH Macro - EUR 1,552,763 0.71
Hong Kong 933,000 iShares FTSE A50 China Index - ETF 981,504 0.45
Ireland 3,318,901 Institutional Cash Series Plc - Institutional
Euro Liquidity Fund 3,318,901 1.51
30,000 Source Physical Markets Gold P-ETC - ETF 3,743,367 1.71
7,062,268 3.22
Jersey 40,000 ETFS Physical PM Basket - ETF 4,243,037 1.94
Russian Federation 50,000 Market Vectors Russia ETF 1,166,080 0.53
United Kingdom 100,949 BlackRock World Mining Investment Trust Plc 809,215 0.37
United States 20,641 China Fund Inc 398,769 0.18
50,000 iShares Dow Jones International Select
Dividend Index Fund - ETF 1,132,843 0.52
30,000 iShares iBoxx $ High Yield Corporate Bond
Fund - ETF 1,825,359 0.83
50,000 Market Vectors Agribusiness - ETF 1,833,253 0.84
60,000 Market Vectors Brazil Small-Cap - ETF 2,145,892 0.98
65,000 Market Vectors Coal - ETF 1,905,233 0.87
60,000 Market Vectors Indonesia Index - ETF 1,332,406 0.61
70,000 Morgan Stanley China A Share Fund Inc 1,209,843 0.55
325,000 Morgan Stanley Emerging Markets Domestic
Debt Fund Inc 3,929,289 1.79
80,000 SPDR S&P BRIC 40 - ETF 1,374,922 0.63
17,087,809 7.80
Total Funds 32,902,676 15.02
COMMON STOCKS (SHARES)
Brazil 252,400 OGX Petroleo e Gas Participacoes SA 1,272,389 0.58
Canada 114,939 Rogers Communications Inc 'B' * 3,093,905 1.41
33,082 Teck Resources Ltd 'B' 1,029,612 0.47
4,123,517 1.88
Cayman Islands 40,670 Focus Media Holding Ltd ADR 889,068 0.41
463,200 Sands China Ltd 995,962 0.45
1,885,030 0.86
China 778,660 Changsha Zoomlion Heavy Industry Science
and Technology Development Co Ltd 'H' * 924,300 0.42
France 92,327 Sanofi-Aventis SA 4,674,516 2.14
18,013 Schneider Electric SA 1,671,246 0.76
6,345,762 2.90
Germany 33,351 Daimler AG 1,246,494 0.57
Isle of Man 1,298,000 Genting Singapore Plc 1,244,378 0.57
Japan 27,800 Nidec Corp 1,674,460 0.77
191,600 Nissan Motor Co Ltd 1,205,959 0.55
33,100 Nitto Denko Corp 885,654 0.40
3,766,073 1.72
Netherlands 204,022 ING Groep NV 1,225,356 0.56
South Africa 63,338 MTN Group Ltd 891,570 0.41
Spain 159,600 Telefonica SA 2,309,412 1.05
Switzerland 58,100 Foster Wheeler AG 1,009,400 0.46
36,670 Julius Baer Group Ltd 1,047,101 0.48
116,481 Novartis AG 4,696,349 2.14
4,874 Swatch Group AG 1,540,020 0.70
126,009 UBS AG 1,260,381 0.58
9,553,251 4.36
United Kingdom 148,022 Imperial Tobacco Group Plc 3,410,229 1.56
2,895,073 Lloyds Banking Group Plc 1,088,309 0.50
662,932 Man Group Plc 1,685,356 0.77
88,219 Reckitt Benckiser Group Plc 3,252,514 1.48
21,093 Rio Tinto Plc 902,078 0.41
86,828 Tullow Oil Plc 1,046,801 0.48
11,385,287 5.20
United States 437,533 Activision Blizzard Inc 3,596,234 1.64
6,702 Apple Inc 1,808,697 0.83
80,802 Arch Coal Inc 1,149,795 0.52
27,974 Chevron Corp 1,925,816 0.88
70,692 Citigroup Inc 1,532,638 0.70
174,082 Comcast Corp 'A' 2,626,621 1.20
40,892 Cytec Industries Inc 1,298,267 0.59
58,884 DIRECTV 'A' 1,818,930 0.83
42,981 Dover Corp 1,745,545 0.80
78,955 EMC Corp/Massachusetts 1,231,216 0.56
14,351 Goldman Sachs Group Inc 1,148,653 0.52
33,243 Halliburton Co 1,025,267 0.47
54,094 Johnson & Johnson 2,473,300 1.13
105,654 NII Holdings Inc 2,794,337 1.28
51,502 SPX Corp 2,070,202 0.94
25,673 United Technologies Corp 1,335,422 0.61
29,582 Veeco Instruments Inc 759,955 0.35
44,717 Vertex Pharmaceuticals Inc 1,430,234 0.65
31,771,129 14.50
Total Common Stocks (Shares) 77,943,948 35.58
Transferable Securities Admitted to an Official Stock Exchange Listing or Dealt in on Another Regulated Market
Holding Description Value (EUR) %
Transferable Securities Admitted to an Official Stock Exchange Listing or Dealt in on Another Regulated Market
Holding Description Value (EUR) %

116 BlackRock Global Funds (BGF)
Flexible Multi-Asset Fund continued
Portfolio of Investments 31 August 2011
BONDS
Australia AUD 100,000 Australia Government Bond 3% 20/9/2025 88,761 0.04
AUD 1,659,000 Australia Government Bond 4.5%
15/4/2020 1,242,933 0.57
AUD 690,000 Australia Government Bond 5.25%
15/3/2019 545,386 0.25
AUD 1,450,000 Australia Government Bond 5.75%
15/5/2021 1,190,689 0.54
AUD 235,000 New South Wales Treasury Corp 2.75%
20/11/2025 197,575 0.09
AUD 225,000 Queensland Treasury Corp 6% 14/9/2017 179,181 0.08
3,444,525 1.57
Belgium EUR 180,000 Belgium Government Bond 2.75%
28/3/2016 177,368 0.08
Canada CAD 483,000 Canadian Government Bond 3.25%
1/6/2021 369,195 0.17
CAD 799,000 Canadian Government Bond 3.5% 1/6/2020 624,978 0.28
CAD 53,000 Canadian Government Bond 3.75%
1/6/2019 42,132 0.02
CAD 55,000 Canadian Government Bond 4.25%
1/6/2018 44,811 0.02
CAD 24,000 Canadian Government Bond 5% 1/6/2037 22,901 0.01
CAD 15,000 Canadian Government Bond 5.75%
1/6/2033 15,397 0.01
1,119,414 0.51
Cayman Islands EUR 100,000 UPCB Finance II Ltd 6.375% 1/7/2020 88,833 0.04
Denmark EUR 125,000 Kommunekredit 4.375% 2/10/2012 129,033 0.06
DKK 7,125,000 Nykredit Realkredit A/S 4% 1/10/2041 932,146 0.42
EUR 15,000 TDC A/S 6.5% 19/4/2012 15,406 0.01
1,076,585 0.49
France USD 125,000 BNP Paribas / BNP Paribas US Medium-Term
Note Program LLC 4.8% 24/6/2015 84,184 0.04
EUR 250,000 CNP Assurances FRN 14/9/2040 213,063 0.10
EUR 700,000 France Government Bond OAT 3.25%
25/10/2021 722,351 0.33
EUR 435,000 France Government Bond OAT 3.75%
25/4/2021 469,778 0.22
EUR 55,000 France Government Bond OAT 4.25%
25/10/2018 61,738 0.03
EUR 790,000 France Government Bond OAT 4.5%
25/4/2041 904,455 0.41
EUR 20,000 France Government Bond OAT 6%
25/10/2025 26,193 0.01
USD 100,000 Societe Financement de l'Economie
Francaise 3.375% 5/5/2014 73,817 0.03
2,555,579 1.17
Germany EUR 411,000 Bundesobligation 2% 26/2/2016 425,019 0.19
EUR 174,000 Bundesobligation 2.25% 10/4/2015 181,614 0.08
EUR 1,089,000 Bundesrepublik Deutschland 2.5%
4/1/2021 1,125,465 0.51
EUR 30,000 Bundesrepublik Deutschland 3% 4/7/2020 32,345 0.02
EUR 30,000 Bundesrepublik Deutschland 3.25%
4/7/2015 32,451 0.02
EUR 150,000 Bundesrepublik Deutschland 3.25%
4/7/2021 164,348 0.08
EUR 190,000 Bundesrepublik Deutschland 3.25%
4/7/2042 197,739 0.09
EUR 1,400,000 Bundesrepublik Deutschland 4.75%
4/7/2040 1,850,030 0.84
EUR 325,000 Deutsche Bundesrepublik Inflation Linked
Bond 1.5% 15/4/2016 387,484 0.18
EUR 44,000 Dexia Kommunalbank Deutschland AG
1.625% 21/10/2013 43,606 0.02
EUR 200,000 Duesseldorfer Hypothekenbank AG 1.875%
13/12/2013 201,608 0.09
GBP 300,000 FMS Wertmanagement FRN 11/4/2012 339,140 0.16
EUR 150,000 Kabel BW Erste Beteiligungs GmbH / Kabel
Baden-Wurttemberg GmbH & Co KG 7.5%
15/3/2019 147,750 0.07
EUR 220,000 Kabel Deutschland Vertrieb und Service
GmbH & Co KG 6.5% 29/6/2018 214,489 0.10
EUR 225,000 Kreditanstalt fuer Wiederaufbau 2.625%
16/8/2019 225,575 0.10
EUR 65,000 Kreditanstalt fuer Wiederaufbau 4.125%
4/7/2017 71,721 0.03
AUD 35,000 Kreditanstalt fuer Wiederaufbau 5.5%
8/8/2013 26,478 0.01
5,666,862 2.59
International EUR 140,000 European Financial Stability Facility 2.75%
18/7/2016 143,640 0.07
EUR 290,000 European Investment Bank 2.125%
15/1/2014 295,061 0.14
AUD 120,000 European Investment Bank 6% 6/8/2020 91,668 0.04
AUD 285,000 European Investment Bank 6.5%
7/8/2019 224,479 0.10
AUD 70,000 Nordic Investment Bank 6% 20/8/2014 53,957 0.02
808,805 0.37
Ireland EUR 100,000 Ardagh Packaging Finance Plc 7.375%
15/10/2017 93,000 0.04
EUR 100,000 Ireland Government Bond 4% 15/1/2014 91,636 0.04
EUR 175,000 Ireland Government Bond 5% 18/10/2020 138,132 0.07
322,768 0.15
Italy EUR 200,000 Intesa Sanpaolo SpA 4% 8/11/2018 181,252 0.08
EUR 1,700,000 Italy Buoni Poliennali Del Tesoro 2%
15/12/2012 1,676,506 0.77
EUR 700,000 Italy Buoni Poliennali Del Tesoro 3%
1/11/2015 669,333 0.31
EUR 210,000 Italy Buoni Poliennali Del Tesoro 3.5%
1/6/2014 208,407 0.10
EUR 600,000 Italy Buoni Poliennali Del Tesoro 3.75%
1/3/2021 549,429 0.25
EUR 520,000 Italy Buoni Poliennali Del Tesoro 4%
1/9/2020 491,691 0.22
EUR 30,000 Italy Buoni Poliennali Del Tesoro 4.25%
15/10/2012 30,367 0.01
EUR 200,000 Italy Buoni Poliennali Del Tesoro 4.25%
1/3/2020 193,432 0.09
EUR 120,000 Italy Buoni Poliennali Del Tesoro 4.5%
1/2/2020 118,354 0.05
Transferable Securities Admitted to an Official Stock Exchange Listing or Dealt in on Another Regulated Market
Holding Description Value (EUR) %
Transferable Securities Admitted to an Official Stock Exchange Listing or Dealt in on Another Regulated Market
Holding Description Value (EUR) %

Audited Annual Report and Accounts 117
The notes on pages 261 to 270 form an integral part of these financial statements.
Flexible Multi-Asset Fund continued
Portfolio of Investments 31 August 2011
EUR 175,000 Italy Buoni Poliennali Del Tesoro 5%
1/8/2039 149,749 0.07
EUR 750,000 Italy Buoni Poliennali Del Tesoro 5%
1/9/2040 639,892 0.29
GBP 150,000 UniCredit SpA 5% 1/2/2016 131,974 0.06
5,040,386 2.30
Japan JPY 120,000,000 Japan Finance Organization for
Municipalities 2% 9/5/2016 1,164,069 0.53
JPY 120,000,000 Japan Government Five Year Bond 0.5%
20/12/2014 1,093,822 0.50
JPY 60,000,000 Japan Government Five Year Bond 0.9%
20/12/2012 547,320 0.25
JPY 107,000,000 Japan Government Ten Year Bond 1%
20/9/2020 972,769 0.44
JPY 378,000,000 Japan Government Ten Year Bond 1.1%
20/6/2020 3,476,670 1.59
JPY 117,000,000 Japan Government Ten Year Bond 1.4%
20/9/2019 1,110,381 0.51
JPY 25,000,000 Japan Government Ten Year Bond 1.9%
20/6/2017 244,632 0.11
JPY 574,400,000 Japan Government Twenty Year Bond 2.1%
20/12/2027 5,507,847 2.51
JPY 40,000,000 Japan Government Twenty Year Bond 2.2%
20/6/2026 392,479 0.18
JPY 20,000,000 Japanese Government CPI Linked Bond
1.2% 10/6/2017 185,284 0.08
JPY 29,100,000 Japanese Government CPI Linked Bond
1.2% 10/12/2017 266,334 0.12
JPY 11,000,000 Japanese Government CPI Linked Bond
1.3% 10/9/2017 101,948 0.05
EUR 200,000 Tokyo Electric Power Co Inc/The 4.5%
24/3/2014 172,500 0.08
15,236,055 6.95
Jersey USD 100,000 Old Mutual Capital Funding LP 8%
22/12/2011 (Perpetual) 68,033 0.03
Luxembourg EUR 300,000 Bumper 2 SA '2011-2 A' FRN
23/2/2023 300,000 0.14
Netherland Antilles GBP 1,370,000 SGA Societe Generale Acceptance NV
0% 7/2/2017 (Zero Coupon) 1,296,419 0.59
Netherlands EUR 200,000 Brenntag Finance BV 5.5% 19/7/2018 196,039 0.09
EUR 50,000 ELM BV for Swiss Life Insurance & Pension
Group FRN 12/4/2017 (Perpetual) 35,938 0.01
EUR 18,222 Globaldrive BV '2008-2 A' 4% 20/10/2016 18,412 0.01
EUR 85,300 Storm BV '2010-1 A1' FRN 22/3/2052 84,833 0.04
EUR 115,000 Ziggo Finance BV 6.125% 15/11/2017 112,468 0.05
447,690 0.20
Norway USD 35,000 Eksportfinans ASA 3% 17/11/2014 25,704 0.01
Poland PLN 1,550,000 Poland Government Bond 5% 25/4/2016 374,079 0.17
USD 380,000 Poland Government International Bond
5.125% 21/4/2021 274,313 0.13
648,392 0.30
Portugal EUR 130,000 Portugal Obrigacoes do Tesouro OT 4.2%
15/10/2016 98,023 0.05
EUR 305,000 Portugal Obrigacoes do Tesouro OT 4.95%
25/10/2023 184,777 0.08
EUR 585,000 Portugal Obrigacoes do Tesouro OT 5.45%
23/9/2013 524,564 0.24
EUR 160,000 Portugal Obrigacoes do Tesouro OT 6.4%
15/2/2016 131,868 0.06
939,232 0.43
Qatar USD 150,000 Qatari Diar Finance QSC 5% 21/7/2020 112,696 0.05
Spain EUR 50,000 Banco Financiero y de Ahorros SA 3.875%
30/11/2013 49,538 0.03
EUR 300,000 Spain Government Bond 3.15% 31/1/2016 289,056 0.13
EUR 500,000 Spain Government Bond 4.2% 31/1/2037 391,385 0.18
EUR 75,000 Spain Government Bond 4.8% 31/1/2024 71,277 0.03
EUR 686,000 Spain Government Bond 4.85%
31/10/2020 683,163 0.31
1,484,419 0.68
Sweden EUR 50,000 Svensk Exportkredit AB 3.625% 27/5/2014 52,556 0.03
USD 100,000 Svenska Handelsbanken AB 2.875%
14/9/2012 70,628 0.03
123,184 0.06
Switzerland GBP 1,750,000 Credit Suisse AG/London 0% 24/4/2014
(Zero Coupon) 1,911,085 0.87
USD 150,000 UBS AG/Stamford CT 2.25% 12/8/2013 104,771 0.05
2,015,856 0.92
United Kingdom EUR 80,000 Arkle Master Issuer Plc '2006-1X 5A1' FRN
17/2/2052 79,220 0.04
EUR 421,529 Arran Residential Mortgages Funding Plc
'2006-2X A2C' FRN 20/9/2056 421,053 0.19
EUR 30,000 Aviva Plc FRN 28/11/2014 (Perpetual) 23,937 0.01
GBP 50,000 Aviva Plc FRN 27/7/2020 (Perpetual) 42,822 0.02
GBP 40,000 Barclays Bank Plc FRN 15/12/2017
(Perpetual) 30,730 0.01
EUR 100,000 Barclays Bank Plc FRN 15/3/2020
(Perpetual) 57,000 0.03
USD 2,000 Blackrock Latin American Investment Trust
PLC 3.5% 15/9/2015 1,695,428 0.77
GBP 120,000 BUPA Finance Plc FRN 16/9/2020
(Perpetual) 113,385 0.05
USD 2,250,000 Credit Suisse International 0% 21/12/2015
(Zero Coupon) 1,765,531 0.81
GBP 205,000 Fosse Master Issuer Plc '2011-1X A3' FRN
18/10/2054 231,230 0.11
EUR 131,141 Headingley RMBS '2011-1 A1B' FRN
11/3/2051 130,797 0.06
EUR 310,000 Mound Financing Plc FRN 8/2/2042 307,505 0.14
EUR 370,000 Permanent Master Issuer Plc '2007-1 3A'
FRN 15/10/2033 368,631 0.17
GBP 3,556,000 Societe Generale Acceptance 0%
28/4/2016 (Zero Coupon) 3,932,744 1.79
GBP 108,451 Turbo Finance '2011-1 A' FRN 20/1/2019 122,684 0.06
GBP 80,000 United Kingdom Gilt 4.25% 7/6/2032 98,088 0.04
GBP 780,000 United Kingdom Gilt 4.25% 7/9/2039 943,605 0.43
Transferable Securities Admitted to an Official Stock Exchange Listing or Dealt in on Another Regulated Market
Holding Description Value (EUR) %
Transferable Securities Admitted to an Official Stock Exchange Listing or Dealt in on Another Regulated Market
Holding Description Value (EUR) %

* Securities lent, see Note 11, for further details.
118 BlackRock Global Funds (BGF)
Portfolio of Investments 31 August 2011
GBP 700,000 United Kingdom Gilt 4.25% 7/12/2040 843,946 0.39
GBP 10,000 United Kingdom Gilt 4.25% 7/12/2049 12,173 0.01
GBP 75,000 United Kingdom Gilt 4.5% 7/12/2042 94,558 0.04
GBP 255,000 United Kingdom Gilt 4.75% 7/12/2038 333,997 0.15
GBP 125,000 Virgin Media Secured Finance Plc 5.5%
15/1/2021 139,363 0.06
11,788,427 5.38
United States USD 200,000 Ally Financial Inc 4.5% 11/2/2014 132,257 0.06
USD 180,000 Alpha Natural Resources Inc 6% 1/6/2019 121,524 0.06
USD 1,085,000 Arran Residential Mortgages Funding Plc
'2006-2A A3B' '144A' FRN 20/9/2056 750,756 0.34
USD 30,000 Boeing Co/The 1.875% 20/11/2012 21,067 0.01
GBP 50,000 Capital One Multi-Asset Execution Trust
FRN 17/6/2014 59,384 0.03
USD 41,000 CF Industries Inc 6.875% 1/5/2018 31,939 0.01
USD 2,029 Citigroup Mortgage Loan Trust Inc '2005-2 1A4'
FRN 25/5/2035 1,255 0.00
USD 50,000 Comcast Cable Holdings LLC 9.8% 1/2/2012 35,878 0.02
USD 200,000 Consol Energy Inc 8.25% 1/4/2020 148,184 0.07
USD 33,130 Countrywide Asset-Backed Certificate
'2007-2 2A1' FRN 25/8/2037 22,370 0.01
USD 150,000 DISH DBS Corp 6.625% 1/10/2014 106,983 0.05
USD 75,000 Domtar Corp 10.75% 1/6/2017 65,047 0.03
USD 75,000 Federal Home Loan Banks 2% 14/9/2012 52,884 0.02
USD 113,237 GE Capital Commercial Mortgage Corp
'2005-C1 A2' 4.353% 10/6/2048 78,361 0.04
USD 50,733 Greenwich Capital Commercial Funding
Corp 4.305% 10/8/2042 35,135 0.02
USD 41,907 GS Mortgage Loan Trust FRN 25/1/2035 28,772 0.01
USD 13,177 Home Equity Asset Trust '2007-2 2A1' FRN
25/7/2037 8,808 0.00
USD 80,000 Jabil Circuit Inc 7.75% 15/7/2016 60,658 0.03
GBP 100,000 MetLife Inc 5.25% 29/6/2020 117,868 0.05
USD 38,854 Morgan Stanley Home Equity Loan Trust
'2007-2 A1' FRN 25/4/2037 23,402 0.01
USD 75,000 New Jersey State Turnpike Authority 7.414%
1/1/2040 67,487 0.03
USD 45,000 Omnicare Inc 6.875% 15/12/2015 31,939 0.01
USD 80,000 SLM Corp 5.4% 25/10/2011 55,398 0.03
USD 78,708 SLM Student Loan Trust FRN 25/3/2025 54,270 0.02
USD 115,000 Southwestern Energy Co 7.5% 1/2/2018 91,651 0.04
USD 125,000 State of California 5.95% 1/4/2016 97,960 0.04
USD 12,950,000 United States Treasury Bill 0% 6/10/2011
(Zero Coupon) 8,967,091 4.09
USD 4,575,000 United States Treasury Note/Bond 0.375%
30/6/2013 3,178,463 1.45
USD 750,000 United States Treasury Note/Bond 0.5%
30/11/2012 521,668 0.24
USD 90,000 United States Treasury Note/Bond 1.25%
31/8/2015 63,914 0.03
USD 830,000 United States Treasury Note/Bond 1.25%
31/10/2015 588,392 0.27
USD 140,000 United States Treasury Note/Bond 1.5%
15/7/2012 98,120 0.05
USD 155,000 United States Treasury Note/Bond 1.5%
31/12/2013 110,482 0.05
USD 78,000 United States Treasury Note/Bond 1.5%
31/7/2016 55,540 0.03
USD 338,000 United States Treasury Note/Bond 1.75%
31/7/2015 244,579 0.11
USD 450,000 United States Treasury Note/Bond 2.125%
30/11/2014 328,849 0.15
USD 95,000 United States Treasury Note/Bond 2.375%
31/10/2014 69,900 0.03
USD 215,000 United States Treasury Note/Bond 2.625%
30/6/2014 158,646 0.07
USD 25,000 United States Treasury Note/Bond 2.625%
31/7/2014 18,468 0.01
USD 2,350,000 United States Treasury Note/Bond 3.75%
15/8/2041 1,688,526 0.77
USD 82,000 United States Treasury Note/Bond 3.875%
15/5/2018 65,799 0.03
USD 30,000 United States Treasury Note/Bond 4.25%
30/9/2012 21,696 0.01
USD 5,000 United States Treasury Note/Bond 4.25%
15/11/2014 3,888 0.00
USD 1,500,000 United States Treasury Note/Bond 4.375%
15/5/2040 1,198,650 0.55
USD 165,000 United States Treasury Note/Bond 6.875%
15/8/2025 169,533 0.08
19,853,441 9.06
Total Bonds 74,640,673 34.07
Total Transferable Securities Admitted
to an Official Stock Exchange Listing or
Dealt in on Another Regulated Market 185,487,297 84.67
Unquoted Securities
BONDS
United Kingdom GBP 100,000 Boparan Finance Plc 9.875% 30/4/2018 90,799 0.04
United States USD 1 Commercial Mortgage Asset Trust (Defaulted)
'1999-C1 A3' 6.64% 17/1/2032 1 0.00
Total Bonds 90,800 0.04
Total Unquoted Securities 90,800 0.04
Total Portfolio 185,578,097 84.71
Other Net Assets 33,508,065 15.29
Total Net Assets (EUR) 219,086,162 100.00
Flexible Multi-Asset Fund continued
Transferable Securities Admitted to an Official Stock Exchange Listing or Dealt in on Another Regulated Market
Holding Description Value (EUR) %
Transferable Securities Admitted to an Official Stock Exchange Listing or Dealt in on Another Regulated Market
Holding Description Value (EUR) %

Audited Annual Report and Accounts 119
The notes on pages 261 to 270 form an integral part of these financial statements.
Flexible Multi-Asset Fund continued
Note: The total market value of EUR 15,446 of these transactions is included in the Statement of Net Assets (see Note 2c).
Nominal Value Description
Unrealisedprofit/(loss)
EUR
Nominal Value Description
Unrealisedprofit/(loss)
EUR
Swaps as at 31 August 2011
USD 1,573,000 Total Return Swap (Credit Suisse) (Fund receives Credit
Suisse Commodities Benchmark-China + 0bps, and
pays Fixed 0%) (30/11/2011) 210,233
EUR (100,000) Credit Default Swaps (Barclays) (Fund receives default
protection on Imperial Tobacco Group Plc 6.25%
4/12/2018; and pays Fixed 0.71%) (20/9/2012) 130
EUR 50,000 Credit Default Swaps (Citibank) (Fund receives default
protection on STMicroelectronics NV 0% 5/7/2013;
and pays Fixed 0.255%) (20/9/2012) 377
EUR 600,000 Interest Rate Swaps (Citibank) (Fund receives Fixed
3.15%; and pays Floating EUR EURIBOR 6 Month)
(5/5/2013) 15,816
EUR 400,000 Interest Rate Swaps (Citibank) (Fund receives Fixed
3.15%; and pays Floating EUR EURIBOR 6 Month)
(5/5/2013) 10,544
USD 5,778 Total Return Swaps (Morgan Stanley) (Fund receives
MSCI Daily TR Net Emerging Markets Taiwan + 0bps
and pays 6M Libor + 10bps) (11/5/2014) (102,898)
USD 1,688 Total Return Swaps (Morgan Stanley) (Fund receives
Morgan Stanley TW Fundamental Custom + 0bps
and pays 6M Libor + 40bps) (11/5/2014) (83,200)
EUR 400,000 Credit Default Swaps (Credit Suisse) (Fund receives
default protection on Xstrata Plc 5.25% 13/6/2017;
and pays Fixed 1%) (20/9/2016) 8,919
EUR 290,000 Credit Default Swaps (Deutsche Bank) (Fund receives
default protection on Koninklijke KPN NV 8.375%
1/10/2030; and pays Fixed 1%) (20/9/2016) 5,478
EUR (400,000) Credit Default Swaps (Deutsche Bank) (Fund provides
default protection on Vodafone Group Plc 5%
4/8/2016; and receives Fixed 1%) (20/9/2016) (2,598)
EUR (290,000) Credit Default Swaps (Credit Suisse) (Fund provides
default protection on Glencore International
AG 5.25% 11/1/2013; and receives Fixed 1%)
(20/9/2016) (10,967)
EUR (475,000) Credit Default Swaps (Deutsche Bank) (Fund provides
default protection on Alstom SA 4% 23/9/2014; and
receives Fixed 1%) (20/9/2016) (12,719)
USD 600,000 Interest Rate Swaps (Deutsche Bank) (Fund receives
Floating USD LIBOR 3 Month; and pays Fixed 3.29%)
(19/8/2041) (7,820)
(31,295)
Open Futures Contractsas at 31 August 2011
Numberof contracts Contract/Description
Expirationdate
ValueEUR
276 OMXS30 Index September 2011 2,891,768
113 DJ Stoxx 600 Basic Resources September 2011 2,689,965
100 DJ Stoxx 600 Personal & Household Goods September 2011 1,932,500
100 DJ Stoxx 600 Health Care September 2011 1,950,000
75 DJ Stoxx 600 Auto September 2011 1,055,250
35 Mdax Index September 2011 1,607,900
10 Australian 10 Year Bond September 2011 5,674,425
(3) Euro BOBL September 2011 (366,120)
(8) Australian 3 Year Bond September 2011 (1,603,291)
(20) FTSE 100 Index September 2011 (1,214,755)
(21) Euro Schatz September 2011 (2,297,820)
(100) Mini Russell 2000® Index September 2011 (5,073,557)
(101) NASDAQ 100 E-mini September 2011 (3,156,962)
(110) DJ Stoxx 600 Chemical September 2011 (2,732,950)
(125) E-mini S&P500 September 2011 (5,304,791)
(300) Euro Stoxx 50 September 2011 (6,888,000)
(329) DJ Stoxx Europe 600 Insurance September 2011 (2,171,400)
94 US Treasury 10 Year Note December 2011 8,420,001
12 Canadian 10 Year Bond December 2011 1,111,208
8 US Long Bond (CBT) December 2011 758,749
5 US Long Bond (CBT) December 2011 500,185
(2) Long Gilt December 2011 (287,108)
(5) US Treasury 5 Year Note (CBT) December 2011 (424,638)
(8) US Treasury 2 Year Note (CBT) December 2011 (1,221,476)
230 SX5E Dividend December 2012 2,518,500
41 FTSE Dividend December 2012 88,390
100 SX5E Dividend December 2013 966,000
66 FTSE Dividend December 2013 135,052
100 SX5E Dividend December 2014 864,000
Total commitment 421,025
Note: The net unrealised loss of EUR (465,942) attributed to these transactions is included
in the Statement of Net Assets (see Note 2c).
Sector Breakdownas at 31 August 2011
% of netassets
Government National 23.63
Investment Funds 15.02
Financials 10.58
Healthcare 6.06
Consumer Discretionary 5.28
Industrials 4.76
Telecommunication Services 4.51
Information Technology 3.38
Energy 3.10
Consumer Staples 3.04
Materials 2.00
US Government 1.77
Mortgage Securities 1.16
Asset Backed Securities 0.25
Industrial 0.08
Utilities 0.08
Consumer, Non-cyclical 0.01
Other Net Assets 15.29
100.00

120 BlackRock Global Funds (BGF)
Flexible Multi-Asset Fund continued
Purchased Call Options as at 31 August 2011
Number of contracts
subjectto Call Issuer
Unrealisedprofit/(loss)
EUR ValueEUR
17,140,000 OTC EUR/USD Call Option
strike price EUR 1.5
expiring on 27/9/2011 (14,946) 21,905
44,650,000 OTC HKD/USD Call Option
strike price HKD 7.7
expiring on 10/11/2011 (19,071) 2,007
6,953,000 OTC HKD/USD Call Option
strike price HKD 7.7
expiring on 10/11/2011 (1,236) 313
43 NIKKEI Call Option
strike price JPY 11,500
expiring on 9/12/2011 (105,544) 1,941
147 FTSE 100 Call Option
strike price GBP 6,800
expiring on 16/12/2011 (56,813) 2,491
1,300 Market Vectors Gold Miners ETF
Call Option
strike price USD 60
expiring on 17/12/2011 144,516 555,862
Total Purchased Call Options (53,094) 584,519
Note: Purchased Call Options are included in the Statement of Net Assets (see Note 2c).
Purchased Put Options as at 31 August 2011
Number of contracts
subjectto Put Issuer
Unrealisedprofit/(loss)
EUR ValueEUR
67 S&P 500 Put Option
strike price USD 1,325
expiring on 17/9/2011 233,124 464,172
5,190,000 OTC CHF/SEK Put Option
strike price CHF 7.34
expiring on 7/10/2011 (53,229) 12,456
78 FTSE 100 Put Option
strike price GBP 5,500
expiring on 16/12/2011 (26,740) 299,429
Total Purchased Put Options 153,155 776,057
Note: Purchased Put Options are included in the Statement of Net Assets (see Note 2c).
Written Call Options as at 31 August 2011
Number of contracts
subjectto Call Issuer
Unrealisedprofit/(loss)
EUR ValueEUR
(6,953,000) OTC HKD/USD Call Option
strike price HKD 7.3
expiring on 10/11/2011 419 (9)
(44,650,000) OTC HKD/USD Call Option
strike price HKD 7.3
expiring on 10/11/2011 10,273 (60)
(1,300) Market Vectors Gold Miners ETF
Call Option
strike price USD 66
expiring on 17/12/2011 (86,889) (294,809)
Total Written Call Options (76,197) (294,878)
Note: Written Call Options are included in the Statement of Net Assets (see Note 2c).
Written Put Options as at 31 August 2011
Number of contracts
subjectto Put Issuer
Unrealisedprofit/(loss)
EUR ValueEUR
(134) S&P 500 Put Option
strike price USD 1,250
expiring on 17/9/2011 (105,628) (368,368)
(1,825) Ishares Put Option
strike price USD 35
expiring on 17/9/2011 134,029 (22,747)
(131) ESTX 50 Put Option
strike price EUR 2,000
expiring on 21/10/2011 36,025 (36,680)
(43) NIKKEI Put Option
strike price JPY 9,000
expiring on 9/12/2011 (40,709) (178,620)
(147) FTSE 100 Put Option
strike price GBP 4,400
expiring on 16/12/2011 (21,008) (106,716)
(156) FTSE 100 Put Option
strike price GBP 5,200
expiring on 16/12/2011 41,863 (376,325)
(1,950) Market Vectors Gold Miners ETF
Put Option
strike price USD 50
expiring on 17/12/2011 96,646 (155,281)
Total Written Put Options 141,218 (1,244,737)
Note: Written Put Options are included in the Statement of Net Assets (see Note 2c).

Audited Annual Report and Accounts 121
The notes on pages 261 to 270 form an integral part of these financial statements.
Flexible Multi-Asset Fund continued
Open Forward Foreign Exchange Transactionsas at 31 August 2011
Purchases Sales Value date Unrealised
profit/(loss)
Unrealisedprofit/(loss)
EUR Equivalent
Core Fund EUR
AUD 2,028,000 EUR 1,500,000 2/9/2011 3,075 3,075
AUD 2,154,302 USD 2,240,000 2/9/2011 45,604 45,604
CAD 2,446,586 EUR 1,750,000 2/9/2011 (9,141) (9,141)
CHF 2,114,712 SEK 18,800,000 2/9/2011 (237,857) (237,857)
CZK 25,479,340 SEK 9,620,000 2/9/2011 4,829 4,829
EUR 1,500,000 AUD 2,000,888 2/9/2011 17,020 17,020
EUR 1,724,099 CAD 2,446,586 2/9/2011 (16,760) (16,760)
EUR 10,160,000 GBP 8,865,108 2/9/2011 143,315 143,315
EUR 10,186,721 USD 14,362,251 2/9/2011 241,628 241,628
GBP 8,930,792 EUR 10,160,000 2/9/2011 (69,097) (69,097)
GBP 4,059,499 USD 6,700,000 2/9/2011 (52,566) (52,566)
JPY 353,536,770 USD 4,470,000 2/9/2011 97,321 97,321
NOK 16,605,000 USD 3,000,000 2/9/2011 70,348 70,348
SEK 18,800,000 CHF 2,611,332 2/9/2011 (188,891) (188,891)
SEK 9,620,000 CZK 25,337,156 2/9/2011 1,066 1,066
THB 38,243,750 USD 1,250,000 2/9/2011 18,051 18,051
USD 2,240,000 AUD 2,073,402 2/9/2011 14,356 14,356
USD 14,710,333 EUR 10,186,721 2/9/2011 (600) (600)
USD 6,700,000 GBP 4,123,191 2/9/2011 (19,400) (19,400)
USD 4,620,610 JPY 353,536,770 2/9/2011 6,968 6,968
USD 3,079,277 NOK 16,605,000 2/9/2011 (15,453) (15,453)
USD 1,280,126 THB 38,243,750 2/9/2011 2,810 2,810
USD 3,100,000 ZAR 20,731,250 2/9/2011 100,585 100,585
ZAR 20,731,250 USD 2,842,545 2/9/2011 77,688 77,688
CHF 2,356,397 USD 3,047,000 6/9/2011 (84,805) (84,805)
USD 3,047,000 CHF 2,403,611 6/9/2011 44,228 44,228
EUR 19,306,991 USD 27,504,000 7/9/2011 260,727 260,727
EUR 1,190,000 USD 1,720,074 8/9/2011 (1,150) (1,150)
USD 11,618,311 EUR 8,094,502 8/9/2011 (48,828) (48,828)
USD 1,474,575 TRY 2,578,000 8/9/2011 (16,792) (16,792)
JPY 102,274,000 EUR 895,275 22/9/2011 28,673 28,673
USD 3,128,717 GBP 1,917,000 22/9/2011 956 956
CLP 318,769,600 USD 668,000 29/9/2011 11,693 11,693
JPY 204,331,000 USD 2,520,271 29/9/2011 100,450 100,450
MXN 17,739,291 ZAR 10,292,000 29/9/2011 (22,063) (22,063)
USD 508,671 ZAR 3,564,000 29/9/2011 1,920 1,920
EUR 3,864,517 AUD 5,301,000 7/10/2011 (47,783) (47,783)
EUR 1,072,676 CAD 1,510,500 7/10/2011 (1,664) (1,664)
EUR 877,746 DKK 6,544,000 7/10/2011 (560) (560)
EUR 3,653,846 GBP 3,257,500 7/10/2011 (26,906) (26,906)
EUR 14,321,658 JPY 1,657,964,000 7/10/2011 (661,031) (661,031)
EUR 378,953 PLN 1,572,000 7/10/2011 1,189 1,189
EUR 305,983 ZAR 3,014,500 7/10/2011 9,900 9,900
GBP 24,000 EUR 26,618 7/10/2011 500 500
ZAR 3,261,000 EUR 312,910 7/10/2011 7,384 7,384
CZK 24,432,069 HUF 270,915,000 13/10/2011 21,388 21,388
AUD 735,000 MXN 9,627,787 18/10/2011 5,327 5,327
CAD 4,275,035 AUD 4,187,000 18/10/2011 (46,217) (46,217)
MXN 17,365,710 AUD 1,359,000 18/10/2011 (34,137) (34,137)
MXN 17,992,995 CAD 1,455,000 18/10/2011 (32,133) (32,133)
CNY 19,156,334 USD 2,980,000 19/10/2011 22,911 22,911
EUR 1,128,344 CZK 27,412,000 19/10/2011 (9,179) (9,179)
EUR 171,260 GBP 151,000 19/10/2011 642 642
EUR 1,564,887 HUF 427,415,480 19/10/2011 (35) (35)
EUR 3,200,692 USD 4,625,000 19/10/2011 (3,662) (3,662)
JPY 294,666,000 EUR 2,614,605 19/10/2011 48,869 48,869
MYR 17,308,416 USD 5,794,000 19/10/2011 20,018 20,018
USD 7,545,382 CNY 48,559,786 19/10/2011 (64,094) (64,094)
USD 2,980,000 MYR 9,033,870 19/10/2011 (40,997) (40,997)
NOK 23,190,912 EUR 2,946,000 20/10/2011 46,845 46,845
USD 1,200,316 HUF 231,457,000 20/10/2011 (15,756) (15,756)
CHF 49,000 EUR 42,498 25/10/2011 (295) (295)
CHF 2,820,000 SEK 25,510,566 25/10/2011 (353,391) (353,391)
Open Forward Foreign Exchange Transactionsas at 31 August 2011
Purchases Sales Value date Unrealised
profit/(loss)
Unrealisedprofit/(loss)
EUR Equivalent
Core Fund EUR
SEK 22,820,100 CHF 2,900,000 25/10/2011 (8,933) (8,933)
EUR 180,605 USD 259,000 26/10/2011 1,148 1,148
USD 290,000 EUR 202,756 26/10/2011 (1,819) (1,819)
HUF 525,005,778 EUR 1,936,000 27/10/2011 (14,918) (14,918)
JPY 5,738,000 USD 73,943 27/10/2011 639 639
KRW 6,654,858,517 JPY 493,793,761 27/10/2011 (147,929) (147,929)
KRW 2,147,250,000 USD 1,993,000 27/10/2011 11,717 11,717
USD 3,576,000 KRW 3,854,749,200 27/10/2011 (22,308) (22,308)
USD 1,993,000 SGD 2,403,279 27/10/2011 (4,090) (4,090)
HKD 18,933,000 USD 2,434,927 10/11/2011 (2,618) (2,618)
USD 1,456,000 HKD 11,292,780 10/11/2011 4,100 4,100
USD 6,821,043 CHF 5,450,000 30/11/2011 28,522 28,522
AUD 2,900,000 USD 2,994,482 2/12/2011 51,980 51,980
CAD 2,485,411 EUR 1,750,000 2/12/2011 16,749 16,749
CZK 25,730,614 SEK 9,620,000 2/12/2011 20,972 20,972
EUR 5,660,000 GBP 4,910,876 2/12/2011 111,081 111,081
JPY 341,543,760 USD 4,470,000 2/12/2011 (8,306) (8,306)
SEK 9,620,000 CZK 25,354,280 2/12/2011 (5,344) (5,344)
THB 37,506,250 USD 1,250,000 2/12/2011 (5,803) (5,803)
USD 6,700,000 GBP 4,063,463 2/12/2011 52,955 52,955
Net unrealised loss (565,164) (565,164)
USD Hedged Share Class USD
EUR 3,623,195 USD 5,165,541 14/9/2011 66,116 45,780
USD 34,818,521 EUR 24,535,644 14/9/2011 (609,345) (421,926)
Net unrealised loss (543,229) (376,146)
Total net unrealised loss (941,310)
Note: The net unrealised loss attributed to these transactions is included in the Statement
of Net Assets (see Note 2c).

122 BlackRock Global Funds (BGF)
Global Allocation Fund
Portfolio of Investments 31 August 2011
FUNDS
Cayman Islands 1,898,136 Dragon Capital - Vietnam Enterprise
Investments Ltd 3,397,663 0.02
4,617,210 Vinaland Ltd 3,474,451 0.02
6,872,114 0.04
United States 458,100 Consumer Staples Select Sector SPDR
Fund - ETF 14,187,357 0.09
1,157,808 Energy Select Sector SPDR Fund - ETF 80,247,672 0.52
409,160 ETFS Gold Trust - ETF 73,804,281 0.48
139,640 ETFS Physical Palladium Shares - ETF 10,822,100 0.07
117,927 ETFS Platinum Trust - ETF 21,557,056 0.14
458,700 Health Care Select Sector SPDR Fund - ETF * 15,412,320 0.10
252,892 iShares Dow Jones US Telecommunications
Sector Index Fund - ETF 5,695,128 0.04
3,609,372 iShares Gold Trust - ETF 63,994,166 0.41
267,447 iShares Silver Trust - ETF * 10,746,020 0.07
1,114,990 SPDR Gold Shares - ETF 197,096,782 1.27
55,289 Utilities Select Sector SPDR Fund - ETF 1,869,321 0.01
7,800 Vanguard Telecommunication Services - ETF 514,176 0.00
495,946,379 3.20
Total Funds 502,818,493 3.24
COMMON / PREFERRED STOCKS (SHARES) & WARRANTS
Argentina 60,300 Banco Macro SA ADR 'B' 1,654,029 0.01
162,100 Cresud SACIF y A ADR 2,313,167 0.01
188,600 IRSA Inversiones y Representaciones SA ADR 2,140,610 0.01
195,300 Pampa Energia SA ADR 2,427,579 0.02
61,000 Telecom Argentina SA ADR 1,418,250 0.01
9,953,635 0.06
Australia 4,480,800 Asciano Ltd 7,505,785 0.05
1,697,702 BHP Billiton Ltd 72,213,021 0.47
492,504 CSL Ltd 14,823,517 0.10
1,330,149 Newcrest Mining Ltd 57,304,981 0.37
252,100 Orica Ltd 6,333,038 0.04
537,248 Rio Tinto Ltd * 41,702,184 0.27
2,478,233 Telstra Corp Ltd 8,037,314 0.05
5,365,000 TFS Corporation Ltd (Wts 15/7/2018) – 0.00
178,900 Woodside Petroleum Ltd 6,736,470 0.04
214,656,310 1.39
Austria 278,609 Telekom Austria AG 3,110,200 0.02
Belgium 1,234,900 RHJ International 8,578,088 0.06
Bermuda 303,442 Arch Capital Group Ltd 10,241,168 0.07
51,632 Axis Capital Holdings Ltd 1,492,681 0.01
30,826 Bunge Ltd (Pref) 2,916,910 0.02
1,461,600 Cheung Kong Infrastructure Holdings Ltd 8,852,030 0.06
4,582,000 China Resources Gas Group Ltd 7,043,431 0.05
1,726,200 Cosan Ltd 'A' 20,075,706 0.13
263,576 Endurance Specialty Holdings Ltd 9,475,557 0.06
1,233,800 Freescale Semiconductor Holdings I Ltd 14,447,798 0.09
1,929,555 Katanga Mining Ltd 2,835,372 0.02
513,600 Marvell Technology Group Ltd † 6,902,784 0.04
2,515,232 Noble Group Ltd 3,388,209 0.02
58,368 PartnerRe Ltd 3,324,641 0.02
123,926 Platinum Underwriters Holdings Ltd 3,887,559 0.03
124,580 RenaissanceRe Holdings Ltd 8,106,421 0.05
186,713 Validus Holdings Ltd 4,809,727 0.03
875,800 VimpelCom Ltd ADR 9,879,024 0.06
117,679,018 0.76
Brazil 705,830 All America Latina Logistica SA 4,031,750 0.03
687,764 Cia Brasileira de Distribuicao Grupo Pao de
Acucar (Pref) 27,742,448 0.18
432,740 Cia Energetica de Minas Gerais ADR 8,174,459 0.05
1,365,700 Cyrela Brazil Realty SA Empreendimentos
e Participacoes 13,004,489 0.08
3,448,400 Hypermarcas SA 28,840,442 0.19
613,300 Itau Unibanco Holding SA (Pref) 11,139,211 0.07
1,602,200 MRV Engenharia e Participacoes 13,248,529 0.09
666,800 OGX Petroleo e Gas Participacoes SA 4,854,445 0.03
3,638,714 Petroleo Brasileiro SA ADR 96,316,760 0.62
1,061,600 Qualicorp SA 9,460,271 0.06
1,101,500 SLC Agricola SA 11,168,545 0.07
1,399,037 Telecomunicacoes de Sao Paulo SA ADR 44,111,637 0.28
316,100 Usinas Siderurgicas de Minas Gerais SA 'A'
(Pref) 2,404,793 0.02
1,030,800 Vale SA 'A' (Pref) 26,356,434 0.17
300,854,213 1.94
Canada 857,330 Alamos Gold Inc 16,597,616 0.11
1,291,648 Barrick Gold Corp 65,060,310 0.42
38,300 BCE Inc * 1,544,256 0.01
430,700 Brookfield Asset Management Inc 'A' 12,697,036 0.08
507,500 Canadian Natural Resources Ltd 19,239,325 0.12
427,674 Canadian Pacific Railway Ltd * 25,259,949 0.16
120,790 Cenovus Energy Inc 4,337,451 0.03
1,530,170 Daylight Energy Ltd (Unit) * 12,201,640 0.08
150,500 Detour Gold Corp 5,465,373 0.04
1,961,130 Eldorado Gold Corp 38,531,070 0.25
1,600,362 Goldcorp Inc 'A' (Unit) 82,898,752 0.54
1,675,961 IAMGOLD Corp 34,736,571 0.23
2,873,890 Kinross Gold Corp 49,610,966 0.32
360,036 Kinross Gold Corp (Wts 3/9/2013) 469,858 0.00
35,900 Magna International Inc 'A' * 1,387,535 0.01
794,700 Osisko Mining Corp 11,767,494 0.08
168,070 Potash Corp of Saskatchewan Inc 10,010,249 0.06
370,423 Rogers Communications Inc 'B' * 14,390,737 0.09
710,200 Silver Wheaton Corp * 28,244,654 0.18
721,590 Sino-Forest Corp 3,566,583 0.02
300,360 Suncor Energy Inc 9,694,532 0.06
507,600 Talisman Energy Inc 8,517,744 0.06
33,930 Teck Resources Ltd 'B' 1,524,475 0.01
115,610 TELUS Corp (Unit) * 6,362,866 0.04
169,400 Valeant Pharmaceuticals International Inc † 7,711,088 0.05
350,100 Viterra Inc 3,759,458 0.02
475,587,588 3.07
Cayman Islands 35,927,360 Chaoda Modern Agriculture Holdings Ltd * 11,663,213 0.08
1,829,100 Haitian International Holdings Ltd 1,699,215 0.01
84,000 Mindray Medical International Ltd ADR * 2,184,000 0.01
4,200,600 Mongolian Mining Corp 4,640,736 0.03
39,385,600 Tianjin Port Development Holdings Ltd 6,620,353 0.04
39,980,300 Yuanda China Holdings Ltd 6,002,114 0.04
4,600,200 Zhongsheng Group Holdings Ltd * 7,779,729 0.05
40,589,360 0.26
Transferable Securities Admitted to an Official Stock Exchange Listing or Dealt in on Another Regulated Market
Holding Description Value (USD) %
Transferable Securities Admitted to an Official Stock Exchange Listing or Dealt in on Another Regulated Market
Holding Description Value (USD) %

Audited Annual Report and Accounts 123
The notes on pages 261 to 270 form an integral part of these financial statements.
Global Allocation Fund continued
Portfolio of Investments 31 August 2011
Chile 3,192,200 E.CL SA 8,546,046 0.05
136,200 Sociedad Quimica y Minera de Chile SA
ADR 'B' 8,635,080 0.06
17,181,126 0.11
China 9,411,700 China BlueChemical Ltd 'H' 7,402,883 0.05
151,451 China Life Insurance Co Ltd ADR * 5,749,080 0.04
1,991,768 China Shenhua Energy Co Ltd 'H' 9,226,103 0.06
10,081,300 China Telecom Corp Ltd 'H' 6,584,256 0.04
3,046,300 CSR Corp Ltd 'H' * 1,766,784 0.01
3,013,500 Dongfang Electric Corp Ltd 'H' * 10,246,828 0.07
2,788,000 Dongfeng Motor Group Co Ltd 'H' 4,443,106 0.03
12,262,200 Guangshen Railway Co Ltd 'H' 4,468,473 0.03
6,651,224 Guangzhou Automobile Group Co Ltd 'H' 7,194,515 0.05
11,624,200 Huaneng Power International Inc 'H' 5,697,690 0.04
5,697,700 Jiangsu Expressway Co Ltd 'H' 4,759,408 0.03
624,454 Ping An Insurance Group Co of China Ltd 'H' 4,995,849 0.03
18,456,900 Shanghai Electric Group Co Ltd 'H' 8,454,722 0.05
3,804,100 Shanghai Pharmaceuticals Holding Co Ltd 'H' * 7,907,502 0.05
5,109,000 Sinopharm Group Co Ltd 'H' * 12,298,187 0.08
6,192,900 Xiamen International Port Co Ltd 'H' 945,613 0.00
102,140,999 0.66
Cyprus 674,798 AFI Development Plc 'B' 458,863 0.00
Czech Republic 258,500 CEZ AS 12,111,495 0.08
Egypt 3,318,825 Telecom Egypt 8,312,015 0.05
Finland 665,163 Fortum OYJ 17,886,335 0.12
France 80,000 Atos 4,008,973 0.03
165,330 BNP Paribas SA 8,477,246 0.05
385,305 Cie Generale d'Optique Essilor
International SA 29,563,651 0.19
502,098 France Telecom SA * 9,683,804 0.06
1,130,600 GDF Suez 35,594,188 0.23
125,680 LVMH Moet Hennessy Louis Vuitton SA 21,380,855 0.14
305,737 Sanofi-Aventis SA 22,354,736 0.14
44,486 Sanofi-Aventis SA ADR 1,626,853 0.01
46,680 Technip SA 4,559,824 0.03
660,857 Total SA 32,410,728 0.21
497,500 Total SA ADR 24,392,425 0.16
764,030 Vivendi SA 18,498,120 0.12
212,551,403 1.37
Germany 75,946 Allianz SE 7,878,153 0.05
620,740 BASF SE 44,602,590 0.29
247,585 Bayer AG 16,074,476 0.10
86,411 Bayerische Motoren Werke AG 6,988,286 0.04
35,130 Beiersdorf AG 2,076,761 0.01
310,320 Daimler AG 16,749,605 0.11
191,920 Deutsche Bank AG 7,822,900 0.05
589,200 Deutsche Telekom AG 8,274,064 0.06
380,024 Fresenius Medical Care AG & Co KGaA 25,791,482 0.17
856,520 Infineon Technologies AG 7,331,385 0.05
257,180 Kabel Deutschland Holding AG 14,683,600 0.09
138,070 Lanxess AG 8,671,662 0.06
40,640 Muenchener Rueckversicherungs AG 5,305,615 0.03
239,080 Siemens AG 24,779,915 0.16
32,421 SMA Solar Technology AG * 3,380,471 0.02
195,352 Volkswagen AG (Pfd Non-Vtg) (Pref) 32,697,527 0.21
233,108,492 1.50
Guernsey 64,140 Amdocs Ltd 1,795,279 0.01
Hong Kong 1,900,300 AIA Group Ltd 6,668,864 0.04
6,094,207 Beijing Enterprises Holdings Ltd 29,402,037 0.19
775,000 Cheung Kong Holdings Ltd 10,869,116 0.07
3,793,300 China Mobile Ltd 38,451,798 0.25
4,757,000 China Resources Power Holdings Co Ltd 8,032,697 0.05
4,039,200 China Unicom Hong Kong Ltd 8,551,684 0.06
1,305,877 Hutchison Whampoa Ltd 12,508,477 0.08
7,912,865 Link REIT (Reit) 27,566,140 0.18
26,018,226 Tianjin Development Holdings Ltd 13,287,189 0.09
2,003,560 Wharf Holdings Ltd 12,751,357 0.08
168,089,359 1.09
India 1,108,100 Adani Enterprises Ltd 12,740,140 0.08
4,981,991 Adani Power Ltd 9,904,478 0.06
570,130 Bharat Heavy Electricals Ltd 21,893,360 0.14
40,302 Container Corp Of India 817,811 0.01
1,752,535 Housing Development Finance Corp 25,218,613 0.16
222,900 Larsen & Toubro Ltd 7,787,945 0.05
870,670 Reliance Industries Ltd 14,796,661 0.10
311,090 State Bank of India Ltd 13,333,970 0.09
106,492,978 0.69
Indonesia 43,842,335 Bumi Resources 12,973,384 0.08
5,010,600 Telekomunikasi Indonesia 'B' 4,257,219 0.03
17,230,603 0.11
Ireland 38,437 Accenture Plc 'A' 2,077,136 0.01
208,440 Covidien Plc 10,966,028 0.07
734,000 Seagate Technology Plc † 8,595,140 0.06
1,986,614 XL Group Plc 'A' 41,202,374 0.27
62,840,678 0.41
Israel 41,700 Check Point Software Technologies 2,285,577 0.01
815,765 Teva Pharmaceutical Industries Ltd ADR † 33,740,040 0.22
36,025,617 0.23
Italy 316,611 Assicurazioni Generali SpA 5,669,716 0.04
1,609,310 ENI SpA 32,281,638 0.21
3,265,726 Intesa Sanpaolo SpA 5,338,752 0.03
4,213,550 Telecom Italia SpA 5,126,627 0.03
48,416,733 0.31
Transferable Securities Admitted to an Official Stock Exchange Listing or Dealt in on Another Regulated Market
Holding Description Value (USD) %
Transferable Securities Admitted to an Official Stock Exchange Listing or Dealt in on Another Regulated Market
Holding Description Value (USD) %

124 BlackRock Global Funds (BGF)
Global Allocation Fund continued
Portfolio of Investments 31 August 2011
Japan 284,630 Aisin Seiki Co Ltd 9,439,411 0.06
1,478,200 Asahi Kasei Corp 9,754,423 0.06
205,260 Astellas Pharma Inc * 7,703,942 0.05
522,060 Bank of Kyoto Ltd 4,677,298 0.03
464,500 Bridgestone Corp 10,267,703 0.07
582,783 Canon Inc 27,322,701 0.18
595,960 Daihatsu Motor Co Ltd 9,878,262 0.06
616,350 Daiwa House Industry Co Ltd 7,587,824 0.05
381,470 Denso Corp * 12,073,913 0.08
605,388 East Japan Railway Co 36,119,586 0.23
69,970 Fanuc Ltd 11,515,667 0.07
3,323,510 Fuji Heavy Industries Ltd 20,631,072 0.13
592,260 Futaba Industrial Co Ltd 4,039,540 0.03
477,200 Hitachi Chemical Co Ltd 8,220,933 0.05
1,343,200 Hitachi Ltd * 7,234,501 0.05
745,876 Honda Motor Co Ltd 24,064,907 0.16
814,591 Hoya Corp 17,815,193 0.12
4,620 Inpex Corp 31,028,949 0.20
844,890 JGC Corp 23,766,661 0.15
244,200 JSR Corp 4,375,727 0.03
4,349 KDDI Corp 32,328,245 0.21
617,560 Kinden Corp 5,242,978 0.03
1,144,560 Kirin Holdings Co Ltd 15,135,417 0.10
364,100 Komatsu Ltd 9,615,316 0.06
2,782,231 Kubota Corp 22,713,569 0.15
801,920 Kuraray Co Ltd 11,430,601 0.07
1,045,350 Kyowa Hakko Kirin Co Ltd 10,851,572 0.07
1,984,500 Marubeni Corp 12,448,415 0.08
1,945,450 Mitsubishi Corp 46,352,854 0.30
420,800 Mitsubishi Tanabe Pharma Corp 7,057,235 0.05
3,014,100 Mitsubishi UFJ Financial Group Inc 13,521,783 0.09
2,304,841 Mitsui & Co Ltd 39,135,404 0.25
363,900 Mitsui Fudosan Co Ltd 6,083,982 0.04
1,071,700 Mitsui OSK Lines Ltd 4,500,357 0.03
1,001,952 Mitsui Sumitomo Insurance Group Holdings
Inc 23,284,798 0.15
230,640 Murata Manufacturing Co Ltd 14,016,462 0.09
553,800 NGK Insulators Ltd 8,587,222 0.06
360 Nippon Building Fund Inc (Reit) 3,859,155 0.03
730,620 Nippon Electric Glass Co Ltd 7,355,746 0.05
516,990 Nippon Telegraph & Telephone Corp 23,968,431 0.15
2,805,280 Nksj Holdings Inc 16,426,325 0.11
32,134 NTT DoCoMo Inc * 58,082,578 0.37
3,800 NTT Urban Development Corp 2,879,238 0.02
2,110,030 Okumura Corp 7,980,029 0.05
132,426 Rinnai Corp 10,241,081 0.07
163,650 Rohm Co Ltd 8,387,382 0.05
1,768,230 Sekisui House Ltd 15,819,062 0.10
91,156 Seven & I Holdings Co Ltd 2,398,967 0.02
641,694 Shin-Etsu Chemical Co Ltd 32,218,593 0.21
482,290 Shionogi & Co Ltd 7,729,973 0.05
386,400 Sony Financial Holdings Inc 6,062,065 0.04
6,952,380 Sumitomo Chemical Co Ltd 28,922,914 0.19
633,300 Sumitomo Electric Industries Ltd 8,382,883 0.05
341,180 Sumitomo Mitsui Financial Group Inc * 10,033,396 0.06
1,639,448 Suzuki Motor Corp 33,438,921 0.22
180,440 TDK Corp 7,859,540 0.05
159,000 Terumo Corp 8,325,312 0.05
2,060,100 Toda Corp 7,495,668 0.05
352,622 Toho Co Ltd/Tokyo 6,037,984 0.04
1,556,398 Tokio Marine Holdings Inc 42,076,328 0.27
4,208,780 Tokyo Gas Co Ltd 19,265,541 0.12
839,723 Toyota Industries Corp 23,610,363 0.15
408,800 Toyota Motor Corp 14,575,627 0.09
4,194,500 Ube Industries Ltd 13,128,324 0.08
289,900 West Japan Railway Co 12,003,553 0.08
23,900 Yahoo Japan Corp 7,689,267 0.05
127,600 Yamada Denki Co Ltd 9,302,086 0.06
1,025,380,755 6.62
Jersey 1,098,821 Glencore International Plc * 7,599,636 0.05
255,827 Randgold Resources Ltd ADR 27,130,453 0.17
969,900 Vallares Plc 15,493,990 0.10
50,224,079 0.32
Kazakhstan 1,104,800 KazMunaiGas Exploration Production GDR 18,726,360 0.12
Luxembourg 42,700 Millicom International Cellular SA 4,833,069 0.03
38,730 Tenaris SA ADR 1,281,188 0.01
6,114,257 0.04
Malaysia 18,419,523 Axiata Group Bhd 29,145,267 0.19
369,500 British American Tobacco Malaysia Bhd 5,408,114 0.03
1,692,466 IOI Corp 2,558,846 0.02
9,107,617 PLUS Expressways Bhd 13,281,333 0.09
14,022,344 Telekom Malaysia Bhd 19,508,163 0.13
23,243,656 YTL Power International Bhd 14,649,067 0.09
84,550,790 0.55
Mexico 757,090 America Movil SAB de CV ADR 'L' 18,730,407 0.12
89,300 Fomento Economico Mexicano SAB
de CV ADR 6,098,297 0.04
24,828,704 0.16
Netherlands 199,900 ASML Holding NV 7,107,460 0.04
48,500 CNH Global NV 1,641,725 0.01
512,260 ING Groep NV 4,443,134 0.03
730,326 Koninklijke Philips Electronics NV 15,451,406 0.10
47,800 LyondellBasell Industries NV 'A' 1,670,132 0.01
325,360 Unilever NV 11,011,405 0.07
121,500 Unilever NV (NY Shares) 4,111,560 0.03
45,436,822 0.29
Netherlands Antilles 685,357 Schlumberger Ltd 53,807,378 0.35
Norway 731,110 DnB NOR ASA 8,787,741 0.06
715,260 Statoil ASA 17,167,736 0.11
312,860 Telenor ASA 5,253,584 0.03
31,209,061 0.20
Panama 825,967 McDermott International Inc 11,926,963 0.08
Philippines 114,000 Philippine Long Distance Telephone Co ADR 6,532,200 0.04
Poland 22,800 Powszechny Zaklad Ubezpieczen SA * 2,805,280 0.02
Portugal 1,200,899 Zon Multimedia Servicos de Telecomunicacoes
e Multimedia SGPS SA 4,462,311 0.03
Transferable Securities Admitted to an Official Stock Exchange Listing or Dealt in on Another Regulated Market
Holding Description Value (USD) %
Transferable Securities Admitted to an Official Stock Exchange Listing or Dealt in on Another Regulated Market
Holding Description Value (USD) %

Audited Annual Report and Accounts 125
The notes on pages 261 to 270 form an integral part of these financial statements.
Global Allocation Fund continued
Portfolio of Investments 31 August 2011
Russian Federation 56,876,025 Federal Hydrogenerating Co JSC 2,484,174 0.02
6,252,728 Federal Hydrogenerating Co JSC ADR 27,568,278 0.18
15,511,117 Kuzbassrazrezugol 5,033,357 0.03
1,948,000 LSR Group GDR 9,915,320 0.06
1,141,400 Magnitogorsk Iron & Steel Works GDR 9,125,493 0.06
398,456 MMC Norilsk Nickel OJSC ADR 10,021,168 0.06
1,115,515 Novorossiysk Commercial Sea Port PJSC GDR 8,031,708 0.05
2,121,100 Rosneft Oil Co GDR 16,809,718 0.11
12,436,000 Sberbank of Russia 36,399,314 0.24
26,800 Uralkali GDR 1,335,176 0.01
126,723,706 0.82
Singapore 5,945,350 CapitaLand Ltd 12,952,568 0.08
651,620 DBS Group Holdings Ltd 7,179,388 0.05
3,018,800 Fraser and Neave Ltd 14,810,288 0.10
3,867,300 Global Logistic Properties Ltd 5,370,337 0.03
2,574,367 Keppel Corp Ltd 19,908,134 0.13
3,436,240 MobileOne Ltd 7,171,902 0.05
2,751,000 Oversea-Chinese Banking Corp Ltd * 20,015,931 0.13
2,651,500 Raffles Medical Group Ltd 4,828,508 0.03
1,558,960 SembCorp Marine Ltd 5,276,021 0.03
1,490,930 Singapore Press Holdings Ltd 4,711,053 0.03
7,983,581 Singapore Telecommunications Ltd 20,645,969 0.13
362,390 United Overseas Bank Ltd 5,589,813 0.04
128,459,912 0.83
South Africa 71,600 AngloGold Ashanti Ltd ADR 3,191,928 0.02
949,200 Harmony Gold Mining Co Ltd ADR 12,681,312 0.08
2,739,300 Life Healthcare Group Holdings Ltd 6,847,986 0.04
48,700 Sasol Ltd 2,335,649 0.02
25,056,875 0.16
South Korea 90,600 Cheil Industries Inc 8,220,537 0.05
81,500 Hyundai Motor Co 15,507,803 0.10
52,300 KT Corp 1,801,589 0.01
673,030 KT Corp ADR 11,542,465 0.07
218,469 KT&G Corp 14,088,828 0.09
129,200 LG Corp 7,593,232 0.05
153,800 LG Display Co Ltd 3,013,001 0.02
16,700 Mando Corp 2,903,735 0.02
21,940 POSCO 8,318,629 0.05
97,210 POSCO ADR 9,238,838 0.06
44,500 Samsung Electronics Co Ltd 31,033,415 0.20
114,100 Samsung Fine Chemicals Co Ltd 5,529,334 0.04
61,470 SK Telecom Co Ltd 8,930,824 0.06
127,722,230 0.82
Spain 1,081,497 Banco Santander SA 9,809,971 0.06
390,640 Repsol YPF SA 11,288,531 0.07
1,253,468 Telefonica SA 26,193,612 0.17
209,841 Telefonica SA ADR 4,396,169 0.03
51,688,283 0.33
Switzerland 593,774 ACE Ltd 38,173,730 0.25
144,900 Cie Financiere Richemont SA 'A' 8,363,260 0.05
59,536 Garmin Ltd * 2,022,438 0.01
795,428 Nestle SA 48,989,843 0.32
41,630 Noble Corp 1,412,506 0.01
428,980 Novartis AG 24,977,901 0.16
114,148 Roche Holding AG 19,803,246 0.13
34,830 Swisscom AG 15,668,318 0.10
115,567 TE Connectivity Ltd 3,636,894 0.02
312,480 Transocean Ltd 17,433,259 0.11
114,612 Tyco International Ltd 4,810,266 0.03
708,250 UBS AG 10,230,585 0.07
437,475 UBS AG (Pref) 9,118,073 0.06
586,783 Weatherford International Ltd 10,075,064 0.06
46,641 Zurich Financial Services AG 10,447,345 0.07
225,162,728 1.45
Taiwan 456,824 Asustek Computer Inc 3,858,111 0.03
550,500 Catcher Technology Co Ltd 4,317,164 0.03
2,855,250 Cheng Shin Rubber Industry Co Ltd 6,623,979 0.04
3,153,259 Chunghwa Telecom Co Ltd 10,858,877 0.07
617,367 Chunghwa Telecom Co Ltd ADR 21,539,935 0.14
4,262,245 Delta Electronics Inc 12,488,696 0.08
5,193,600 Far Eastone Telecommunications 8,307,039 0.05
1,570,000 Formosa Chemicals & Fibre Corp 4,767,990 0.03
2,178,400 Hon Hai Precision Industry Co Ltd 5,504,291 0.04
882,962 HTC Corp 23,010,369 0.15
498,759 MediaTek Inc 5,011,746 0.03
1,900,000 Nan Ya Plastics Corp 4,525,759 0.03
5,251,292 Taiwan Semiconductor Manufacturing Co Ltd 12,562,770 0.08
4,320,000 Yulon Motor Co Ltd 9,739,155 0.06
133,115,881 0.86
Thailand 3,467,143 Hana Microelectronics PCL 2,591,392 0.02
4,123,959 PTT Chemical PCL 18,782,795 0.12
1,057,094 PTT PCL 11,604,401 0.08
3,654,692 Siam Commercial Bank PCL 14,511,456 0.09
47,490,044 0.31
Turkey 286,100 BIM Birlesik Magazalar AS 9,158,368 0.06
353,540 Tupras Turkiye Petrol Rafinerileri AS 6,687,434 0.04
1,904,300 Turk Telekomunikasyon AS 8,689,384 0.06
861,713 Turkcell Iletisim Hizmetleri AS * 3,821,688 0.02
2,568,950 Turkiye Garanti Bankasi AS 9,359,821 0.06
37,716,695 0.24
United Kingdom 483,900 Amlin Plc 2,422,939 0.02
438,800 Anglo American Plc 18,372,865 0.12
1,085,400 Antofagasta Plc 23,821,315 0.15
31,200 AstraZeneca Plc ADR 1,482,936 0.01
2,621,600 BG Group Plc 56,680,794 0.37
2,837,190 BP Plc 18,631,764 0.12
583,500 BP Plc ADR 23,071,590 0.15
223,222 British American Tobacco Plc 9,907,396 0.06
263,400 British Sky Broadcasting Group Plc 2,836,699 0.02
6,892,500 BT Group Plc 19,423,287 0.13
449,532 Diageo Plc ADR 36,101,915 0.23
37,292 Ensco Plc ADR 1,808,289 0.01
50,600 GlaxoSmithKline Plc ADR 2,169,728 0.01
10,709,226 Guinness Peat Group Plc 6,227,093 0.04
3,948,400 HSBC Holdings Plc 34,320,688 0.22
393,200 HSBC Holdings Plc (Pref) 10,486,644 0.07
4,275,703 International Power Plc 23,498,126 0.15
13,296,316 Lloyds Banking Group Plc 7,218,347 0.05
3,232,200 National Grid Plc 32,699,683 0.21
179,949 Petropavlovsk Plc 2,569,278 0.02
263,000 Rio Tinto Plc 16,243,337 0.10
281,478 Royal Dutch Shell Plc ADR 'A' 18,892,803 0.12
Transferable Securities Admitted to an Official Stock Exchange Listing or Dealt in on Another Regulated Market
Holding Description Value (USD) %
Transferable Securities Admitted to an Official Stock Exchange Listing or Dealt in on Another Regulated Market
Holding Description Value (USD) %

126 BlackRock Global Funds (BGF)
Global Allocation Fund continued
Portfolio of Investments 31 August 2011
1,309,700 Scottish & Southern Energy Plc 27,654,113 0.18
375,162 Standard Chartered Plc 8,506,110 0.05
215,112 Unilever Plc 7,209,725 0.05
134,300 Unilever Plc ADR 4,519,195 0.03
9,614,905 Vodafone Group Plc 25,573,268 0.17
644,598 Vodafone Group Plc ADR 17,191,429 0.11
459,541,356 2.97
United States 251,858 3M Co 20,881,547 0.13
643,384 Abbott Laboratories 33,436,666 0.22
2,349,371 Activision Blizzard Inc † 27,887,034 0.18
251,300 Adobe Systems Inc 6,455,897 0.04
1,685,296 AES Corp/The † 18,234,903 0.12
800,693 Aetna Inc 32,828,413 0.21
68,400 Aflac Inc 2,593,728 0.02
454,429 Agilent Technologies Inc 17,081,986 0.11
32,700 Albemarle Corp 1,703,670 0.01
1,968,800 Alcoa Inc 25,318,768 0.16
85,300 Allergan Inc/United States 6,977,540 0.04
118,866 Alliance Resource Partners LP (unit) 8,804,999 0.06
162,585 Allstate Corp/The 4,275,985 0.03
51,400 Altera Corp 1,892,548 0.01
621,265 Altria Group Inc 16,923,259 0.11
1,279,400 American Eagle Outfitters Inc † 14,009,430 0.09
287,583 American Electric Power Co Inc 11,109,331 0.07
368,234 American Tower Corp 'A' 19,840,448 0.13
311,865 American Water Works Co Inc 9,218,729 0.06
32,500 Ameriprise Financial Inc 1,492,725 0.01
366,146 AmerisourceBergen Corp 'A' 14,609,225 0.09
307,272 Amgen Inc 17,033,623 0.11
339,192 Anadarko Petroleum Corp 25,402,089 0.16
48,700 Analog Devices Inc 1,625,606 0.01
293,340 Apache Corp 30,703,898 0.20
476,876 Apple Inc 185,857,652 1.20
45,600 Arrow Electronics Inc 1,461,936 0.01
3,114,675 AT&T Inc 92,941,902 0.60
47,000 Autodesk Inc 1,335,740 0.01
22,900 Autoliv Inc 1,293,621 0.01
154,900 Baker Hughes Inc 9,467,488 0.06
53,200 Ball Corp 1,922,116 0.01
4,211,347 Bank of America Corp 34,701,499 0.22
1,552,711 Bank of New York Mellon Corp/The 32,637,985 0.21
33,700 Baxter International Inc 1,897,984 0.01
23,900 Becton Dickinson and Co 1,950,718 0.01
28,530 Biogen Idec Inc 2,685,244 0.02
46,370 BMC Software Inc 1,896,069 0.01
499,214 Boeing Co/The 33,332,519 0.22
123,300 BorgWarner Inc 8,984,871 0.06
3,459,681 Bristol-Myers Squibb Co 102,371,961 0.66
243,774 Broadcom Corp 'A' 8,758,800 0.06
1,228,637 CA Inc 25,936,527 0.17
924,000 Calpine Corp † 13,527,360 0.09
38,545 Capital One Financial Corp 1,781,164 0.01
46,734 Cardinal Health Inc 2,005,823 0.01
144,394 Celgene Corp 8,675,192 0.06
577,521 CenturyTel Inc 20,802,306 0.13
133,897 Cephalon Inc † 10,801,471 0.07
1,068,626 Chevron Corp 106,242,797 0.69
266,148 Chubb Corp 16,482,546 0.11
300,329 CIGNA Corp 14,415,792 0.09
20,800 Cimarex Energy Co 1,462,864 0.01
3,620,339 Cisco Systems Inc † 57,400,475 0.37
398,905 Citigroup Capital XIII (Pref) 10,331,639 0.07
2,016,886 Citigroup Inc 63,148,701 0.41
489,263 CMS Energy Corp 9,574,877 0.06
43,000 CNA Financial Corp 1,043,610 0.01
34,800 Coach Inc 1,971,420 0.01
187,230 Coca-Cola Co 13,164,141 0.08
70,800 Coca-Cola Enterprises Inc 1,951,248 0.01
72,639 Cognizant Technology Solutions Corp 'A' 4,619,840 0.03
308,117 Colgate-Palmolive Co † 27,977,024 0.18
1,893,574 Comcast Corp 'A' 41,260,977 0.27
301,560 Complete Production Services Inc 9,022,675 0.06
63,279 Computer Sciences Corp 1,962,915 0.01
184,600 ConAgra Foods Inc 4,539,314 0.03
672,955 ConocoPhillips 46,077,229 0.30
1,493,714 Consol Energy Inc 68,994,650 0.45
187,700 Consolidated Edison Inc 10,582,526 0.07
222,178 Constellation Brands Inc 'A' 4,392,459 0.03
41,700 Constellation Energy Group Inc 1,601,697 0.01
3,847,591 Corning Inc † 58,021,672 0.37
54,700 Coventry Health Care Inc 1,850,501 0.01
205,702 Crown Holdings Inc 7,353,846 0.05
674,738 CVS Caremark Corp 24,310,810 0.16
190,022 DaVita Inc 14,215,546 0.09
1,258,863 Dell Inc † 18,820,002 0.12
390,575 Devon Energy Corp 26,520,042 0.17
204,616 DISH Network Corp 'A' 4,853,492 0.03
212,400 Dominion Resources Inc/VA 10,384,236 0.07
714,753 Dow Chemical Co/The 20,749,280 0.13
129,556 Dr Pepper Snapple Group Inc 4,982,724 0.03
22,995 Eastman Chemical Co 1,936,179 0.01
34,410 Eaton Corp 1,510,599 0.01
362,084 eBay Inc 11,311,504 0.07
47,300 Edison International 1,757,195 0.01
493,080 EI du Pont de Nemours & Co 23,993,273 0.15
3,636,326 El Paso Corp † 70,144,729 0.45
674,044 Electronic Arts Inc 15,300,799 0.10
302,993 Eli Lilly & Co 11,362,237 0.07
1,081,934 EMC Corp/Massachusetts † 24,365,154 0.16
168,174 Entergy Corp 10,914,493 0.07
147,200 EOG Resources Inc † 13,808,832 0.09
450,358 Exelon Corp 19,410,430 0.13
48,399 Expedia Inc 1,471,814 0.01
2,356,889 Exxon Mobil Corp 176,059,608 1.14
1,088,050 Fidelity National Financial Inc 'A' 18,551,252 0.12
37,292 Fidelity National Information Services Inc 1,054,991 0.01
31,600 Fluor Corp 1,950,668 0.01
520,396 FMC Corp 39,586,524 0.26
1,886,200 Ford Motor Co 21,049,992 0.14
1,375,415 Ford Motor Co (Call Wts 1/1/2013) 4,318,803 0.03
92,251 Forest Laboratories Inc 3,186,350 0.02
529,384 Freeport-McMoRan Copper & Gold Inc 25,479,252 0.16
5,240,144 General Electric Co 86,147,967 0.56
573,042 General Mills Inc 21,706,831 0.14
881,400 General Motors Co 21,532,602 0.14
436,850 General Motors Co Series B (Pref) 17,736,110 0.11
442,629 Gilead Sciences Inc 17,700,734 0.11
1,519,775 Global Industries Ltd 6,641,417 0.04
859,000 GMAC Capital Trust I (Pref) 17,301,549 0.11
320,830 Goldman Sachs Group Inc 37,084,740 0.24
135,816 Google Inc 'A' 74,012,929 0.48
720,212 Halliburton Co 32,078,242 0.21
32,726 Harris Corp 1,337,184 0.01
669,900 HCA Holdings Inc 13,277,418 0.09
198,450 Health Care REIT Inc (Pref) 9,847,089 0.06
379,936 Healthsouth Corp 8,092,637 0.05
32,400 Helmerich & Payne Inc 1,872,396 0.01
344,361 Hess Corp 20,492,923 0.13
1,213,833 Hewlett-Packard Co 31,850,978 0.21
132,947 HJ Heinz Co 6,990,353 0.05
919,832 Hologic Inc 15,480,773 0.10
256,652 Humana Inc 20,149,749 0.13
Transferable Securities Admitted to an Official Stock Exchange Listing or Dealt in on Another Regulated Market
Holding Description Value (USD) %
Transferable Securities Admitted to an Official Stock Exchange Listing or Dealt in on Another Regulated Market
Holding Description Value (USD) %

Audited Annual Report and Accounts 127
The notes on pages 261 to 270 form an integral part of these financial statements.
Global Allocation Fund continued
Portfolio of Investments 31 August 2011
38,354 Huntington Ingalls Industries Inc 1,184,755 0.01
1,797,214 Intel Corp † 36,528,375 0.24
700,077 International Business Machines Corp 120,427,246 0.78
586,034 International Game Technology 9,171,432 0.06
244,069 International Paper Co 6,667,965 0.04
40,328 Intuit Inc 1,988,574 0.01
111,200 ITC Holdings Corp 8,504,576 0.05
1,480,971 Johnson & Johnson 97,788,515 0.63
311,300 Johnson Controls Inc 10,083,007 0.07
1,932,720 JPMorgan Chase & Co 73,018,162 0.47
491,361 KBR Inc 15,158,487 0.10
34,300 Kinetic Concepts Inc 2,323,825 0.01
42,000 KLA-Tencor Corp 1,565,340 0.01
1,014,446 Kraft Foods Inc 'A' † 35,475,177 0.23
85,600 Kroger Co/The 1,998,760 0.01
35,500 Lam Research Corp 1,341,545 0.01
54,600 Lear Corp 2,616,978 0.02
54,400 Leucadia National Corp 1,626,560 0.01
117,320 Lexmark International Inc 'A' 3,742,508 0.02
49,900 Liberty Global Inc 'A' 1,987,517 0.01
340,519 Life Technologies Corp 14,347,768 0.09
64,500 Lincoln National Corp 1,360,950 0.01
90,347 Lorillard Inc 10,098,988 0.07
65,868 Ltd Brands Inc 2,519,451 0.02
17,978 Lubrizol Corp 2,422,715 0.02
55,000 Macy's Inc 1,462,450 0.01
674,915 Marathon Oil Corp 18,236,203 0.12
507,257 Marathon Petroleum Corp 18,631,550 0.12
40,300 Mastercard Inc 'A' † 13,468,663 0.09
486,476 Mattel Inc 13,271,065 0.09
208,878 McDonald's Corp 18,976,566 0.12
50,875 McGraw-Hill Cos Inc/The 2,171,345 0.01
240,365 McKesson Corp 19,221,989 0.12
447,690 Mead Johnson Nutrition Co † 31,777,036 0.21
65,237 MeadWestvaco Corp 1,806,413 0.01
338,807 Medco Health Solutions Inc 18,949,476 0.12
804,238 Medtronic Inc 28,164,415 0.18
1,727,141 Merck & Co Inc 57,168,367 0.37
138,063 MetLife Inc 4,662,388 0.03
348,200 MetroPCS Communications Inc 3,955,552 0.03
55,876 Mettler-Toledo International Inc 8,772,532 0.06
5,183,282 Microsoft Corp ‡ 137,134,092 0.88
39,199 Molson Coors Brewing Co 'B' 1,717,700 0.01
971,543 Morgan Stanley 16,768,832 0.11
482,000 Motorola Mobility Holdings Inc † 18,234,060 0.12
212,064 Motorola Solutions Inc 9,006,358 0.06
25,800 Murphy Oil Corp 1,392,426 0.01
819,505 Mylan Inc/PA 16,939,086 0.11
576,557 National Oilwell Varco Inc 38,986,784 0.25
1,044,688 Newmont Mining Corp 65,616,853 0.42
596,163 NextEra Energy Inc 33,730,903 0.22
35,850 NII Holdings Inc 1,369,291 0.01
170,400 Northern Trust Corp 6,618,336 0.04
230,326 Northrop Grumman Corp 12,716,298 0.08
433,555 NRG Energy Inc † 9,989,107 0.06
674,137 Occidental Petroleum Corp 59,438,659 0.38
46,500 Oceaneering International Inc 2,001,360 0.01
139,750 Omnicare Capital Trust II Series B (Pref) 6,327,880 0.04
3,233,547 Oracle Corp † 91,671,057 0.59
388,900 PACCAR Inc 15,147,655 0.10
98,615 Pall Corp 5,136,855 0.03
21,074 Parker Hannifin Corp 1,560,108 0.01
366,561 PerkinElmer Inc 8,474,890 0.05
170,600 Perrigo Co 16,317,890 0.11
4,101,517 Pfizer Inc 78,256,944 0.50
330,067 PG&E Corp 13,932,128 0.09
439,390 Philip Morris International Inc 30,889,117 0.20
728,226 Polycom Inc † 17,754,150 0.11
21,696 PPG Industries Inc 1,677,318 0.01
626,268 PPL Corp 17,911,265 0.12
423,150 PPL Corp (Pref) 23,596,148 0.15
87,916 Praxair Inc 8,736,213 0.06
122,587 Precision Castparts Corp 20,599,519 0.13
148,699 Principal Financial Group Inc 3,797,772 0.02
599,025 Procter & Gamble Co 38,175,863 0.25
348,534 Progressive Corp/The 6,625,631 0.04
1,639,100 Pulte Group Inc 8,047,981 0.05
672,187 QEP Resources Inc 23,761,810 0.15
1,290,913 QUALCOMM Inc 67,056,476 0.43
1,697,199 Quicksilver Resources Inc 16,310,082 0.11
17,161 Ralph Lauren Corp 'A' 2,368,561 0.02
342,550 Raytheon Co 14,822,138 0.10
31,800 Reinsurance Group of America Inc 'A' 1,695,258 0.01
19,525 Ross Stores Inc 1,498,739 0.01
35,089 Ryder System Inc 1,664,622 0.01
313,735 SanDisk Corp † 11,749,376 0.08
1,494,295 Sara Lee Corp † 27,330,656 0.18
100,000 Sempra Energy 5,233,000 0.03
88,328 Simon Property Group Inc (Reit) 10,325,543 0.07
282,657 SM Energy Co † 21,693,925 0.14
726,198 Southern Co † 29,941,144 0.19
762,000 Spirit Aerosystems Holdings Inc 'A' 12,862,560 0.08
2,556,504 St Joe Co/The 47,269,759 0.30
536,912 State Street Corp 19,157,020 0.12
171,700 SunTrust Banks Inc 3,425,415 0.02
970,399 Symantec Corp † 16,691,833 0.11
56,121 Teradata Corp 2,926,149 0.02
574,505 Texas Instruments Inc 15,172,677 0.10
312,489 Thermo Fisher Scientific Inc 17,315,015 0.11
95,560 Time Warner Cable Inc 6,337,539 0.04
191,112 Time Warner Inc 6,067,806 0.04
44,700 Torchmark Corp 1,711,116 0.01
579,324 Travelers Cos Inc/The 29,226,896 0.19
34,600 TRW Automotive Holdings Corp 1,488,838 0.01
630,669 Union Pacific Corp 59,453,167 0.38
363,305 United Technologies Corp † 27,291,472 0.18
439,302 UnitedHealth Group Inc 21,257,824 0.14
42,639 Unum Group 1,014,382 0.01
50,900 Urban Outfitters Inc 1,335,107 0.01
1,289,248 US Bancorp 30,168,403 0.19
709,317 Valero Energy Corp 16,115,682 0.10
400,500 Vanguard Health Systems Inc 5,246,550 0.03
56,554 VeriSign Inc 1,774,099 0.01
1,409,896 Verizon Communications Inc 51,573,996 0.33
266,625 Viacom Inc 'B' 12,907,316 0.08
219,300 Visa Inc 'A' 19,408,050 0.13
45,900 Walgreen Co 1,645,056 0.01
919,790 Wal-Mart Stores Inc 48,905,234 0.32
481,300 Walt Disney Co/The 16,489,338 0.11
201,867 Waters Corp 16,389,582 0.11
563,016 WellPoint Inc 36,489,067 0.24
1,758,963 Wells Fargo & Co 45,609,911 0.29
965 Wells Fargo & Co (Pref) 998,987 0.01
314,754 Western Digital Corp † 9,363,931 0.06
88,900 Western Union Co/The 1,477,518 0.01
483,400 Whiting Petroleum Corp † 23,000,172 0.15
54,499 Williams Cos Inc/The 1,497,633 0.01
154,100 Wisconsin Energy Corp 4,863,396 0.03
42,600 Wyndham Worldwide Corp 1,378,536 0.01
1,737,514 Xerox Corp 14,386,616 0.09
5,103,599,554 32.93
Total Common / Preferred Stocks (Shares)
& Warrants 10,047,932,611 64.84
Transferable Securities Admitted to an Official Stock Exchange Listing or Dealt in on Another Regulated Market
Holding Description Value (USD) %
Transferable Securities Admitted to an Official Stock Exchange Listing or Dealt in on Another Regulated Market
Holding Description Value (USD) %

128 BlackRock Global Funds (BGF)
Global Allocation Fund continued
Portfolio of Investments 31 August 2011
BONDS
Argentina USD 2,093,000 Empresa Distribuidora Y Comercializadora
Norte 9.75% 25/10/2022 1,894,165 0.01
Australia AUD 49,042,000 Australia Government Bond 4.75%
15/11/2012 53,079,538 0.34
AUD 45,500,000 Australia Government Bond 5.5%
15/12/2013 50,552,578 0.33
AUD 49,042,000 Australia Government Bond 5.75%
15/4/2012 53,109,983 0.34
AUD 70,033,000 Australia Government Bond 5.75%
15/5/2021 83,051,357 0.53
USD 14,500,000 TFS Corp Ltd 11% 15/7/2018 14,895,850 0.10
254,689,306 1.64
Brazil BRL 32,048 Brazil Notas do Tesouro Nacional Serie B
6% 15/5/2015 42,642,135 0.27
BRL 192,359 Brazil Notas do Tesouro Nacional Serie F
10% 1/1/2017 113,954,961 0.74
BRL 166,591 Brazil Notas do Tesouro Nacional Serie F
10% 1/1/2021 96,201,435 0.62
USD 6,772,000 Hypermarcas SA 6.5% 20/4/2021 6,602,700 0.04
USD 23,980,000 OGX Petroleo e Gas Participacoes SA
8.5% 1/6/2018 24,129,875 0.16
283,531,106 1.83
British Virgin Islands USD 3,300,000 Hongkong Land CB 2005 Ltd 2.75%
21/12/2012 4,945,875 0.03
Canada CAD 39,773,000 Canadian Government Bond 3.5%
1/6/2020 45,156,447 0.29
CAD 6,803,000 Daylight Energy Ltd 6.25% 31/12/2014 7,095,505 0.05
USD 25,200,000 PetroBakken Energy Ltd 3.125%
8/2/2016 23,562,000 0.15
USD 18,108,000 Sino-Forest Corp '144A' 5% 1/8/2013 5,704,020 0.04
USD 10,816,000 Viterra Inc 5.95% 1/8/2020 11,450,272 0.07
92,968,244 0.60
Cayman Islands USD 15,900,000 China Milk Products Group Ltd 0%
5/1/2012 (Zero Coupon) 3,975,000 0.03
USD 4,250,000 Cosan Finance Ltd '144A' 7% 1/2/2017 4,526,250 0.03
USD 4,828,000 Hutchison Whampoa International
03/33 Ltd 6.25% 24/1/2014 5,319,997 0.03
USD 12,759,000 Hutchison Whampoa International 09/16
Ltd 4.625% 11/9/2015 13,731,210 0.09
USD 10,360,000 Hutchison Whampoa International 09/16
Ltd '144A' 4.625% 11/9/2015 11,149,411 0.07
USD 12,541,000 Odebrecht Drilling Norbe VIII/IX Ltd
6.35% 30/6/2021 13,249,567 0.08
USD 14,600,000 Pyrus Ltd 7.5% 20/12/2015 14,873,750 0.10
JPY 2,597,000,000 Zeus Cayman 0% 19/8/2013
(Zero Coupon) 33,783,350 0.22
JPY 802,000,000 Zeus Cayman II 0% 18/8/2016
(Zero Coupon) 10,328,312 0.07
110,936,847 0.72
Chile USD 15,946,000 Inversiones Alsacia SA 8% 18/8/2018 15,084,916 0.10
China HKD 140,120,000 China Petroleum & Chemical Corp 0%
24/4/2014 (Zero Coupon) 20,136,803 0.13
Czech Republic USD 3,696,000 Hyundai Motor Manufacturing Czech
sro 4.5% 15/4/2015 3,869,871 0.02
Germany EUR 95,501,000 Bundesrepublik Deutschland 3.5%
4/7/2019 154,042,889 0.99
EUR 118,700,000 Bundesrepublik Deutschland 4.25%
4/7/2017 197,515,702 1.28
351,558,591 2.27
Guernsey USD 9,520,000 Credit Suisse Group Guernsey I Ltd
FRN 24/2/2041 9,258,438 0.06
Hong Kong HKD 60,300,000 Hong Kong Government Bond 1.67%
24/3/2014 8,015,576 0.05
HKD 320,550,000 Hong Kong Government Bond 2.03%
18/3/2013 42,318,960 0.27
HKD 96,450,000 Hong Kong Government Bond 4.13%
22/2/2013 13,102,114 0.09
HKD 385,000,000 Hong Kong Treasury Bill 0% 12/10/2011
(Zero Coupon) 49,395,166 0.32
112,831,816 0.73
Hungary EUR 600,000 Magyar Nemzeti Vagyonkezel Zrt 4.4%
25/9/2014 775,511 0.00
India USD 7,325,000 Suzlon Energy Ltd 0% 12/6/2012
(Zero Coupon) 9,327,911 0.06
USD 13,250,000 Suzlon Energy Ltd 0% 11/10/2012
(Zero Coupon) 15,767,500 0.10
USD 12,500,000 Suzlon Energy Ltd 0% 25/7/2014
(Zero Coupon) 11,453,125 0.07
USD 9,600,000 Tata Steel Ltd 1% 5/9/2012 11,484,000 0.08
48,032,536 0.31
International EUR 3,734,000 European Investment Bank 3.625%
15/10/2011 5,407,976 0.04
EUR 7,240,000 European Investment Bank 4.375%
15/4/2013 10,989,910 0.07
16,397,886 0.11
Ireland EUR 2,900,000 Bank of Ireland Mortgage Bank 3.25%
22/6/2015 3,141,224 0.02
EUR 2,941,000 Bank of Ireland Mortgage Bank 4.625%
16/9/2014 3,459,986 0.02
USD 2,313,000 Ono Finance II PLC 10.875% 15/7/2019 2,047,005 0.02
8,648,215 0.06
Japan JPY 113,000,000 Mie Bank Ltd 1% 31/10/2011 1,472,528 0.01
JPY 73,000,000 Nagoya Railroad Co Ltd 0% 30/3/2012
(Zero Coupon) 950,580 0.01
2,423,108 0.02
Transferable Securities Admitted to an Official Stock Exchange Listing or Dealt in on Another Regulated Market
Holding Description Value (USD) %
Transferable Securities Admitted to an Official Stock Exchange Listing or Dealt in on Another Regulated Market
Holding Description Value (USD) %

Audited Annual Report and Accounts 129
The notes on pages 261 to 270 form an integral part of these financial statements.
Global Allocation Fund continued
Portfolio of Investments 31 August 2011
Jersey USD 6,200,000 Aldar Funding Ltd 5.767% 10/11/2011 6,201,550 0.04
USD 72,400,000 Dana Gas Sukuk Ltd 7.5% 31/10/2012 67,603,500 0.44
73,805,050 0.48
Luxembourg EUR 2,950,000 Capsugel FinanceCo SCA 9.875%
1/8/2019 4,020,616 0.03
USD 1,550,000 Evraz Group SA 8.25% 10/11/2015 1,639,505 0.01
USD 7,192,000 Evraz Group SA 9.5% 24/4/2018 8,010,413 0.05
JPY 700,000,000 Gazprom OAO Via Gaz Capital SA 2.89%
15/11/2012 8,976,061 0.06
USD 4,100,000 Subsea 7 SA 2.25% 11/10/2013 4,817,500 0.03
USD 14,816,000 TNK-BP Finance SA 6.625% 20/3/2017 16,009,429 0.10
USD 7,242,000 TNK-BP Finance SA 7.5% 18/7/2016 8,134,432 0.05
51,607,956 0.33
Malaysia USD 12,925,000 IOI Capital Bhd 0% 18/12/2011
(Zero Coupon) 14,656,950 0.10
MYR 196,751,000 Malaysia Government Bond 2.509%
27/8/2012 65,726,383 0.42
MYR 52,173,000 Malaysia Government Bond 3.461%
31/7/2013 17,598,499 0.11
MYR 26,000,000 Malaysia Government Bond 3.833%
28/9/2011 8,722,700 0.06
106,704,532 0.69
Mexico USD 14,326,000 BBVA Bancomer SA/Texas 6.5%
10/3/2021 14,328,794 0.09
USD 2,752,000 BBVA Bancomer SA/Texas 7.25%
22/4/2020 2,889,600 0.02
MXN 24,634,506 Mexico Cetes 0% 8/9/2011
(Zero Coupon) 19,872,304 0.13
MXN 36,352,409 Mexico Cetes 0% 22/9/2011
(Zero Coupon) 29,286,222 0.19
MXN 36,999,960 Mexico Cetes 0% 9/2/2012
(Zero Coupon) 29,313,135 0.19
USD 15,253,000 Petroleos Mexicanos 6% 5/3/2020 17,045,227 0.11
112,735,282 0.73
Netherlands EUR 7,475,000 Netherlands Government Bond 3.75%
15/7/2014 11,605,547 0.07
New Zealand NZD 6,250,000 New Zealand Government Bond 4.5%
15/2/2016 8,833,411 0.06
Poland PLN 51,360,000 Poland Government Bond 3%
24/8/2016 22,123,799 0.14
Singapore USD 6,890,000 Bumi Investment Pte Ltd 10.75%
6/10/2017 7,510,100 0.05
SGD 20,000,000 CapitaLand Ltd 2.1% 15/11/2016 16,420,610 0.11
SGD 48,500,000 CapitaLand Ltd 2.95% 20/6/2022 38,211,854 0.25
SGD 51,250,000 CapitaLand Ltd 3.125% 5/3/2018 43,825,274 0.28
SGD 9,200,000 Keppel Land Ltd 2.5% 23/6/2013 7,630,937 0.05
USD 21,200,000 Olam International Ltd 6% 15/10/2016 26,685,500 0.17
SGD 36,119,000 Singapore Treasury Bill 0% 20/10/2011
(Zero Coupon) 30,027,221 0.19
USD 12,400,000 Wilmar International Ltd 0% 18/12/2012
(Zero Coupon) 15,677,010 0.10
SGD 14,750,000 Yanlord Land Group Ltd 5.85%
13/7/2014 12,142,395 0.08
USD 11,615,000 Yanlord Land Group Ltd 9.5% 4/5/2017 10,337,350 0.07
SGD 25,250,000 Ying Li International Real Estate Ltd 4%
3/3/2015 18,896,486 0.12
227,364,737 1.47
South Korea USD 22,700,000 Export-Import Bank of Korea 4.125%
9/9/2015 23,746,515 0.16
USD 4,850,000 Hana Bank 4.5% 30/10/2015 5,073,507 0.03
USD 3,423,000 Hyundai Capital Services Inc 4.375%
27/7/2016 3,571,495 0.02
USD 15,989,000 Korea Development Bank 4.375%
10/8/2015 16,695,746 0.11
USD 12,872,000 Korea Electric Power Corp 0% 1/4/2096
(Zero Coupon) 9,376,454 0.06
USD 15,022,000 Korea Electric Power Corp 5.125%
23/4/2034 15,949,346 0.10
74,413,063 0.48
Sweden TRY 9,250,000 Svensk Exportkredit AB 10.5%
30/9/2015 5,972,763 0.04
Switzerland USD 31,695,000 UBS AG/Stamford CT 4.875%
4/8/2020 31,861,082 0.21
Trinidad and Tobago USD 4,100,000 Petroleum Co of Trinidad & Tobago Ltd
9.75% 14/8/2019 4,952,800 0.03
Turkey TRY 12,887,000 Turkey Government Bond 4% 1/4/2020 8,480,426 0.05
TRY 7,755,000 Turkey Government Bond 10% 9/1/2013 4,629,019 0.03
TRY 59,389,000 Turkey Government Bond 10.5%
15/1/2020 38,117,170 0.25
51,226,615 0.33
Ukraine USD 3,200,000 Ukraine Government International Bond
6.875% 23/9/2015 3,278,400 0.02
USD 7,305,000 Ukraine Government International Bond
7.75% 23/9/2020 7,578,938 0.05
10,857,338 0.07
United Kingdom USD 2,000,000 Anglo American Plc 4% 7/5/2014 3,206,300 0.02
USD 5,853,000 BP Capital Markets Plc 3.125%
1/10/2015 6,136,455 0.04
USD 16,200,000 Essar Energy Investment Ltd 4.25%
1/2/2016 11,623,500 0.07
EUR 20,461,000 LBG Capital No.2 Plc 15% 21/12/2019 34,535,209 0.22
USD 5,100,000 Petropavlovsk 2010 Ltd 4% 18/2/2015 5,080,875 0.03
GBP 48,055,000 United Kingdom Gilt 4% 7/9/2016 87,761,449 0.57
GBP 101,479,940 United Kingdom Gilt 4.75% 7/3/2020 194,919,174 1.26
343,262,962 2.21
Transferable Securities Admitted to an Official Stock Exchange Listing or Dealt in on Another Regulated Market
Holding Description Value (USD) %
Transferable Securities Admitted to an Official Stock Exchange Listing or Dealt in on Another Regulated Market
Holding Description Value (USD) %

130 BlackRock Global Funds (BGF)
Global Allocation Fund continued
Portfolio of Investments 31 August 2011
United States USD 23,885,000 Advanced Micro Devices Inc 6%
1/5/2015 24,034,281 0.15
USD 5,602,000 Advanced Micro Devices Inc 8.125%
15/12/2017 5,756,055 0.04
USD 2,709,000 Alberto-Culver Co 5.15% 1/6/2020 3,119,942 0.02
USD 25,798,000 Ally Financial Inc 4.5% 11/2/2014 24,637,090 0.16
USD 11,160,000 Amylin Pharmaceuticals Inc 3%
15/6/2014 10,169,550 0.07
USD 3,219,000 Building Materials Corp of America
6.875% 15/8/2018 3,122,430 0.02
USD 2,084,000 Calpine Corp 7.5% 15/2/2021 2,073,580 0.01
USD 5,205,000 Calpine Corp 7.875% 31/7/2020 5,270,063 0.03
USD 4,040,000 CF Industries Inc 7.125% 1/5/2020 4,615,700 0.03
USD 17,706,000 Chesapeake Energy Corp 2.5%
15/5/2037 18,480,637 0.12
USD 14,938,000 Chrysler Group LLC/CG Co-Issuer Inc
8% 15/6/2019 12,547,920 0.08
USD 10,956,000 Chrysler Group LLC/CG Co-Issuer Inc
8.25% 15/6/2021 9,148,260 0.06
USD 20,385,000 Consol Energy Inc 8% 1/4/2017 21,710,025 0.14
USD 1,210,000 Crown Cork & Seal Co Inc 7.5%
15/12/2096 913,550 0.01
USD 4,705,000 DaVita Inc 6.375% 1/11/2018 4,593,256 0.03
USD 4,582,000 DaVita Inc 6.625% 1/11/2020 4,478,905 0.03
USD 2,091,000 DJO Finance LLC / DJO Finance Corp
9.75% 15/10/2017 1,918,493 0.01
USD 1,565,000 EH Holding Corp '144A' 6.5% 15/6/2019 1,553,263 0.01
USD 2,878,000 EH Holding Corp '144A' 7.625%
15/6/2021 2,842,025 0.02
USD 13,332,000 Electronic Arts Inc '144A' 0.75%
15/7/2016 13,381,995 0.09
USD 5,818,000 Ford Motor Credit Co LLC 5.75%
1/2/2021 5,775,075 0.04
USD 4,268,000 Ford Motor Credit Co LLC 6.625%
15/8/2017 4,458,090 0.03
USD 6,017,000 Ford Motor Credit Co LLC 7% 15/4/2015 6,396,456 0.04
USD 3,766,000 Ford Motor Credit Co LLC 8%
15/12/2016 4,149,081 0.03
USD 33,371,000 Forest City Enterprises Inc '144A' 4.25%
15/8/2018 29,575,049 0.19
USD 16,944,000 Gilead Sciences Inc Series B 0.625%
1/5/2013 19,760,940 0.13
USD 4,288,000 Gilead Sciences Inc 1.625% 1/5/2016 4,968,720 0.03
USD 1,914,000 Hertz Corp/The 7.5% 15/10/2018 1,885,290 0.01
USD 28,760,000 Hologic Inc (Step-up coupon) 2%
15/12/2037 30,773,200 0.20
USD 2,820,000 HSBC Finance Corp 6.676% 15/1/2021 2,729,238 0.02
USD 11,388,000 Intel Corp 2.95% 15/12/2035 11,473,410 0.07
USD 11,944,000 Intelsat Jackson Holding SA 7.5%
1/4/2021 11,287,080 0.07
USD 3,901,000 Kraft Foods Inc 4.125% 9/2/2016 4,212,212 0.03
USD 2,419,000 Lam Research Corp '144A' 1.25%
15/5/2018 2,267,812 0.01
USD 760,000 Linn Energy LLC/Linn Energy Finance
Corp '144A' 7.75% 1/2/2021 763,800 0.00
USD 8,877,000 Linn Energy LLC/Linn Energy Finance
Corp 7.75% 1/2/2021 9,409,620 0.06
USD 4,640,000 McMoRan Exploration Co 5.25%
6/10/2011 4,686,400 0.03
USD 1,325,000 McMoRan Exploration Co '144A' 5.25%
6/10/2011 1,338,250 0.01
USD 9,888,000 Morgan Stanley 3.8% 29/4/2016 9,678,374 0.06
USD 13,687,000 Mylan Inc/PA 3.75% 15/9/2015 22,942,834 0.15
USD 2,527,000 NRG Energy Inc 8.25% 1/9/2020 2,489,095 0.02
USD 14,030,000 Omnicare Inc 3.75% 15/12/2025 17,660,263 0.11
USD 5,000,000 Paka Capital Ltd 0% 12/3/2013
(Zero Coupon) 4,950,000 0.03
USD 10,748,000 Pemex Project Funding Master Trust
6.625% 15/6/2035 11,860,160 0.08
USD 1,523,000 Phibro Animal Health Corp 9.25%
1/7/2018 1,523,000 0.01
USD 8,144,000 Reliance Holdings USA Inc 4.5%
19/10/2020 7,818,212 0.05
USD 5,620,000 SBA Communications Corp 1.875%
1/5/2013 6,097,700 0.04
USD 3,388,000 SBA Communications Corp 4%
1/10/2014 4,594,975 0.03
USD 9,202,000 SM Energy Co 3.5% 1/4/2027 13,331,398 0.09
USD 4,193,000 SonoSite Inc 3.75% 15/7/2014 4,496,992 0.03
USD 8,623,000 SunGard Data Systems Inc 7.375%
15/11/2018 8,234,965 0.05
USD 12,664,000 Texas Industries Inc 9.25% 15/8/2020 11,397,600 0.07
USD 2,992,000 Thermo Fisher Scientific Inc 3.2%
1/5/2015 3,182,970 0.02
USD 39,610,000 United States Treasury Bill 0% 13/10/2011
(Zero Coupon) 39,609,564 0.25
USD 46,760,000 United States Treasury Bill 0% 20/10/2011
(Zero Coupon) 46,759,322 0.30
USD 21,420,000 United States Treasury Bill 0% 27/10/2011
(Zero Coupon) 21,419,679 0.14
USD 58,320,000 United States Treasury Bill 0% 10/11/2011
(Zero Coupon) 58,318,775 0.38
USD 187,000,000 United States Treasury Bill 0% 2/2/2012
(Zero Coupon) 186,987,565 1.21
USD 27,606,000 United States Treasury Inflation Indexed
Bonds 2.375% 15/1/2027 39,086,373 0.25
USD 57,657,900 United States Treasury Note/Bond
0.625% 31/7/2012 57,932,676 0.37
USD 159,121,000 United States Treasury Note/Bond
2.25% 31/1/2015 168,829,866 1.09
USD 155,255,900 United States Treasury Note/Bond
2.25% 31/3/2016 165,493,086 1.07
USD 118,550,000 United States Treasury Note/Bond
2.375% 28/2/2015 126,440,984 0.82
USD 138,861,000 United States Treasury Note/Bond
2.5% 31/3/2015 148,806,378 0.96
USD 71,729,200 United States Treasury Note/Bond
2.625% 31/12/2014 ‡ 76,940,775 0.50
USD 216,841,900 United States Treasury Note/Bond
2.625% 15/8/2020 228,141,397 1.47
USD 264,361,500 United States Treasury Note/Bond
3.5% 15/5/2020 298,408,369 1.93
USD 3,777,000 Valeant Pharmaceuticals International
6.75% 1/10/2017 3,531,495 0.02
2,127,241,585 13.73
Vietnam USD 8,001,000 Vietnam Government International
Bond 6.75% 29/1/2020 8,321,040 0.05
Total Bonds 4,610,872,796 29.76
Total Transferable Securities Admitted
to an Official Stock Exchange Listing or
Dealt in on Another Regulated Market 15,161,623,900 97.84
Transferable Securities Admitted to an Official Stock Exchange Listing or Dealt in on Another Regulated Market
Holding Description Value (USD) %
Transferable Securities Admitted to an Official Stock Exchange Listing or Dealt in on Another Regulated Market
Holding Description Value (USD) %

* Securities lent, see Note 11, for further details.† Securities pledged, see Note 12, for further details.‡ Securities given in guarantee, see Note 12, for further details.
Audited Annual Report and Accounts 131
The notes on pages 261 to 270 form an integral part of these financial statements.
Global Allocation Fund continued
Portfolio of Investments 31 August 2011
COMMON / PREFERRED STOCKS (SHARES)
Jersey 6,847,461 Polyus Gold International Ltd 24,513,910 0.16
Russian Federation 397,098 Rushydro Jsc Rub Shares
(C/a Specific Line) 19,270 0.00
1,000 Uralkali 44,100 0.00
63,370 0.00
United States 30,818 Chesapeake Energy Corp (Pref) 40,795,327 0.26
834,193 Comverse Technology Inc 5,722,564 0.04
609 Marco Polo – 0.00
4,980 NCB Warrant Holding – 0.00
63,000 SandRidge Energy Inc (Pref) 7,662,375 0.05
54,180,266 0.35
Total Common / Preferred Stocks (Shares) 78,757,546 0.51
BONDS
Bermuda SGD 38,000,000 Celestial Nutrifoods Ltd (Defaulted)
0% 12/6/2011 (Zero Coupon) 6,477,607 0.04
Cayman Islands CNY 103,700,000 FU JI Food and Catering Services
Holdings Ltd (Defaulted) 0%
18/10/2010 (Zero Coupon) 2,438,782 0.01
China IDR 70,062,940,000 Credit Suisse/Nassau 10.25%
17/7/2022 9,955,620 0.06
India USD 19,051,000 REI Agro Ltd 5.5% 13/11/2014 19,516,416 0.13
Malaysia MYR 150,000,000 Bank Negara Malaysia Monetary Notes
0% 15/9/2011 (Zero Coupon) 50,215,761 0.32
MYR 73,243,000 Johor Corp 1% 31/7/2012 31,919,578 0.21
82,135,339 0.53
South Korea USD 16,042,000 Korea Development Bank 4%
9/9/2016 16,609,085 0.11
United States USD 33,612,714 Banc of America Large Loan Inc FRN
15/11/2015 30,028,574 0.20
USD 3,700,000 Latitude Communications Inc 0%
15/12/2017 (Zero Coupon) 2,072,000 0.01
USD 3,950,000 William Commercial Group (Defaulted)
0% 29/8/2011 (Zero Coupon) – 0.00
32,100,574 0.21
Total Bonds 169,233,423 1.09
Total Unquoted Securities 247,990,969 1.60
Total Portfolio 15,409,614,869 99.44
Other Net Assets 87,179,470 0.56
Total Net Assets (USD) 15,496,794,339 100.00
Unquoted Securities
Holding Description Value (USD) %
Unquoted Securities
Holding Description Value (USD) %
Note: The total market value of USD 4,414,439 of these transactions is included in the Statement of Net Assets (see Note 2c).
Nominal Value Description
Unrealisedprofit/(loss)
USD
Nominal Value Description
Unrealisedprofit/(loss)
USD
Swaps as at 31 August 2011
USD 152,747 Total Return Swap (BNP Paribas) (Fund receives MSCI
AC World ex US TR Net + 0bps, and pays 3M Libor
+ 8bps) (16/9/2011) (1,973,180)
USD 38 Total Return Swap (Credit Suisse) (Fund receives
MOSPRIME Overnight Rate + 0bps; and pays
NOINDEX + 0bps) (15/9/2011) (843,220)
USD 48,784 Total Return Swap (BNP Paribas) (Fund receives MSCI
Daily TR Net Emerging Markets + 0bps, and pays
3M Libor + 38bps) (11/1/2012) (2,337,339)
USD 988,000 Interest Rate Swaps (Morgan Stanley) (Fund
receives Floating USD LIBOR 3 Month; and
pays Fixed 0.65%) (25/7/2013) (3,193)
USD 495,000 Interest Rate Swaps (Morgan Stanley) (Fund
receives Floating USD LIBOR 3 Month; and
pays Fixed 0.65%) (25/7/2013) 618
USD 3,071,000 Interest Rate Swaps (Morgan Stanley) (Fund
receives Floating USD LIBOR 3 Month; and
pays Fixed 1.838%) (25/7/2016) (2,957)
USD 5,334,000 Interest Rate Swaps (Morgan Stanley) (Fund
receives Floating USD LIBOR 3 Month; and
pays Fixed 1.838%) (25/7/2016) (160,338)
IDR (85,071,205,000) Currency Swaps (IDR/USD) (Credit Suisse)
(Fund receives Fixed 8.25%; and pays
6M Libor + 0bps) (3/6/2018) 996,743
(4,322,866)

132 BlackRock Global Funds (BGF)
Global Allocation Fund continued
Open Futures Contractsas at 31 August 2011
Numberof contracts Contract/Description
Expirationdate
ValueUSD
373 TOPIX Index September 2011 37,650,232
72 H-Shares Index September 2011 4,984,672
60 E-mini MSCI EAFE September 2011 4,574,700
(527) S&P 500 September 2011 (161,393,750)
(1,930) Euro Stoxx 50 September 2011 (63,994,523)
(2,201) Mini Russell 2000® Index September 2011 (161,267,270)
Total commitment (339,445,939)
Note: The net unrealised gain of USD 21,744,758 attributed to these transactions is included
in the Statement of Net Assets (see Note 2c).
Sector Breakdownas at 31 August 2011
% of netassets
Government National 13.59
Financials 12.22
Energy 11.79
Information Technology 9.75
Materials 8.06
US Government 7.70
Healthcare 7.19
Industrials 6.30
Telecommunication Services 5.23
Consumer Discretionary 4.31
Consumer Staples 3.96
Utilities 3.69
Investment Funds 3.24
Consumer, Non-cyclical 1.26
Consumer, Cyclical 0.54
Diversified 0.32
Mortgage Securities 0.20
Communications 0.09
Other Net Assets 0.56
100.00
Written Call Options as at 31 August 2011
Number of contracts
subjectto Call Issuer
Unrealisedprofit/(loss)
USD ValueUSD
(1,507) Motorola Call Option
strike price USD 27
expiring on 17/9/2011 (1,488,953) (1,635,095)
(1,353,081) HK Call Option
strike price HKD 17.2368
expiring on 28/9/2011 37,343 (68,087)
(39,924,000) OTC EUR/USD Call Option
strike price EUR 1.47
expiring on 30/9/2011 22,498 (329,218)
(306) Mastercard Inc Call Option
strike price USD 285
expiring on 22/10/2011 (1,206,580) (1,660,050)
(1,964) SanDisk Call Option
strike price USD 46
expiring on 22/10/2011 942,671 (92,308)
(1,353,081) HK Call Option
strike price HKD 17.556
expiring on 28/10/2011 1,829 (98,053)
Written Call Options as at 31 August 2011
Number of contracts
subjectto Call Issuer
Unrealisedprofit/(loss)
USD ValueUSD
(1,625) NIKKEI Call Option
strike price USD 10,996.49
expiring on 18/11/2011 158,978 (9,204)
(1,727) NIKKEI Call Option
strike price USD 11,019.32
expiring on 18/11/2011 167,508 (4,588)
(951) SM Energy Call Option
strike price USD 90
expiring on 19/11/2011 37,557 (216,353)
(1,829) Mead Call Option
strike price USD 75
expiring on 19/11/2011 76,535 (374,945)
(33,800) PCG Call Option
strike price USD 43
expiring on 20/1/2012 (13,274) (53,259)
(50,900) URBN Call Option
strike price USD 34
expiring on 20/1/2012 115,122 (31,276)
(469,623) Kraft Call Option
strike price USD 34
expiring on 20/1/2012 (470,911) (941,277)
(494) Southern Co. Call Option
strike price USD 42
expiring on 21/1/2012 (17,472) (67,925)
(673) NRG Energy Call Option
strike price USD 24
expiring on 21/1/2012 (25,591) (97,585)
(677) Cephalon Call Option
strike price USD 65
expiring on 21/1/2012 (755,208) (1,093,355)
(823) EOG Call Option
strike price USD 100
expiring on 21/1/2012 110,672 (483,513)
(835) AES Call Option
strike price USD 11
expiring on 21/1/2012 (29,597) (75,150)
(861) Valeant Pharmaceuticals International
Call Option
strike price USD 50
expiring on 21/1/2012 229,864 (331,485)
(922) Calpine Call Option
strike price USD 15
expiring on 21/1/2012 (56,264) (119,860)
(1,036) Colgate-Palmolive Call Option
strike price USD 92.5
expiring on 21/1/2012 (98,967) (409,220)
(1,068) El Paso Call Option
strike price USD 19
expiring on 21/1/2012 (78,646) (222,144)
(1,543) Whiting Call Option
strike price USD 55
expiring on 21/1/2012 422,760 (501,475)
(1,764) Polycom Call Option
strike price USD 32.5
expiring on 21/1/2012 363,472 (105,840)
(1,873) United Technology Call Option
strike price USD 80
expiring on 21/1/2012 414,619 (546,916)
(2,186) West Digital Call Option
strike price USD 40
expiring on 21/1/2012 648,369 (121,323)
(2,489) Seagate Technology Call Option
strike price USD 17.5
expiring on 21/1/2012 337,196 (33,602)

Audited Annual Report and Accounts 133
The notes on pages 261 to 270 form an integral part of these financial statements.
Global Allocation Fund continued
Written Call Options as at 31 August 2011
Number of contracts
subjectto Call Issuer
Unrealisedprofit/(loss)
USD ValueUSD
(3,631) Intel Corp Call Option
strike price USD 24
expiring on 21/1/2012 229,793 (98,037)
(4,444) Cisco Systems Call Option
strike price USD 17.5
expiring on 21/1/2012 557,642 (251,086)
(4,696) Kraft Call Option
strike price USD 35
expiring on 21/1/2012 (237,131) (697,356)
(4,904) Marvell Technology Group Call Option
strike price USD 17.5
expiring on 21/1/2012 730,608 (142,216)
(5,421) Syamant Call Option
strike price USD 17.5
expiring on 21/1/2012 100,055 (775,203)
(14,942) Sarah Lee Call Option
strike price USD 19
expiring on 21/1/2012 66,874 (1,382,135)
(1,275) AES Call Option
strike price USD 12
expiring on 18/2/2012 (10,600) (73,312)
(12,794) American Call Option
strike price USD 15
expiring on 18/2/2012 1,123,126 (255,880)
(35,130) BEI Call Option
strike price EUR 48
expiring on 16/3/2012 61,940 (41,737)
(621) NRG Energy Call Option
strike price USD 24
expiring on 17/3/2012 (31,376) (114,885)
(325,360) UNA Call Option
strike price EUR 26
expiring on 15/6/2012 36,668 (284,675)
(519,907) MXEUG Call Option
strike price USD 113.846
expiring on 12/7/2012 543,546 (28,352)
(1,918) Teva Pharmaceutical Industries Call Option
strike price USD 47.5
expiring on 19/1/2013 137,080 (566,769)
(2,422) EMC Corp/Massachusetts Call Option
strike price USD 25
expiring on 19/1/2013 2,356 (595,812)
(2,496) Dell Call Option
strike price USD 15
expiring on 19/1/2013 (77,418) (651,456)
(3,090) Corning Call Option
strike price USD 15
expiring on 19/1/2013 (23,260) (826,575)
(3,711) Activis Call Option
strike price USD 12.5
expiring on 19/1/2013 (65,035) (513,974)
(5,070) Cisco Systems Call Option
strike price USD 20
expiring on 19/1/2013 63,250 (494,325)
(5,742) Oracle Call Option
strike price USD 30
expiring on 19/1/2013 (423,384) (2,167,605)
(15,047) Corning Call Option
strike price USD 17.5
expiring on 19/1/2013 (37,893) (2,505,325)
Total Written Call Options 2,592,371 (22,189,821)
Note: Written Call Options are included in the Statement of Net Assets (see Note 2c).
Spread Options as at 31 August 2011
Number of contracts
subjectto Call/Put Issuer
ValueUSD
13,538,846 MSCI Europ ex UK Call/Put Option
- USD 96.02/USD 89.97
expiring on 16/9/2011 (813,685)
21,870,444 MSCI Europ ex UK Call/Put Option
- USD 96.02/USD 96.02
expiring on 16/9/2011 (2,567,590)
1,206,800 S&P 500 Index Link Call/Put Option
- USD 1,403.95/USD 1,130.08, 1,263.03
expiring on 10/10/2011 594,853
36,396,800 IShares Russell 2000 Index Link Call/Put Option
- USD 87.28/USD 65.72, 78.04
expiring on 12/10/2011 1,801,642
664,369 MSCI EM Call/Put Option
- USD 1,128.89/USD 1,128.89
expiring on 14/12/2011 (758,745)
5,416,900 TAIEX Index Link Call/Put Option
- USD 301.94/USD 252.72
expiring on 19/12/2011 (885,812)
7,810,000 TAIEX Index Link Call/Put Option
- TWD 9,000/TWD 8,400
expiring on 21/12/2011 (2,286,714)
4,114,277 S&P 500 Index Call/Put Option
- USD 1,379.67/USD 1,131.30
expiring on 16/3/2012 (2,013,340)
5,283,300 TAIEX Index Link Call/Put Option
- USD 290.81/USD 234.41
expiring on 19/12/2012 (1,101,622)
Total Spread Options (8,031,013)
Note: Spread Options are included in the Statement of Net Assets. The unrealised profit/(loss)
is equal to the market value (see Note 2c).
Swaptions as at 31 August 2011
Nominal
Value Description
UnrealisedprofitUSD
ValueUSD
JPY 6,012,082,000 Fund purchases a put option (expiring
30/4/2013) to enter into an Interest
Rate Swap (Morgan Stanley International).
If exercised Fund receives 3.15% Fixed
semi-annually from 2/11/2013; and
pays Floating JPY 6-month Japanese
Yen LIBOR Rate BBA semi-annual 284,340 (258,187)
284,340 (258,187)
Note: Swaptions are included in the Statement of Net Assets (see Note 2c).

134 BlackRock Global Funds (BGF)
Global Allocation Fund continued
Written Put Options as at 31 August 2011
Number of contracts
subjectto Put Issuer
Unrealisedprofit/(loss)
USD ValueUSD
(389) KBR Inc Put Option
strike price USD 36
expiring on 17/9/2011 (97,481) (215,895)
(570) S&P 500 Put Option
strike price USD 1,050
expiring on 17/9/2011 1,071,848 (105,450)
(1,298) S&P 500 Put Option
strike price USD 1,000
expiring on 17/9/2011 2,485,212 (100,595)
(2,903) Urban Put Option
strike price USD 27
expiring on 17/9/2011 21,954 (435,450)
(389) S&P 500 Put Option
strike price USD 1,050
expiring on 30/9/2011 818,837 (219,785)
(600) S&P 500 Put Option
strike price USD 1,000
expiring on 30/9/2011 1,241,156 (216,000)
(2,560) SPDR Gold Trust Put Option
strike price USD 120
expiring on 30/9/2011 476,113 (20,480)
(160,897,000) OTC USD/EUR Put Option
strike price USD 1.51
expiring on 30/9/2011 1,323,378 (152,852)
(306) Mastercard Inc Put Option
strike price USD 220
expiring on 22/10/2011 152,567 (37,791)
(6,236) Wells Fargo Put Option
strike price USD 24
expiring on 22/10/2011 68,442 (617,364)
(472) KOSPI Put Option
strike price USD 208
expiring on 8/12/2011 241,185 (151,253)
(17,399) SPX Put Option
strike price USD 988.5652
expiring on 8/12/2011 949,753 (338,250)
(133,725) BEI Put Option
strike price EUR 38
expiring on 16/12/2011 252,969 (180,563)
(275,100) TT Put Option
strike price USD 857.1429
expiring on 4/1/2012 (615,281) (1,400,259)
(76,414) BEI Put Option
strike price EUR 38
expiring on 20/1/2012 134,709 (128,365)
(676) Timewarner Put Option
strike price USD 60
expiring on 21/1/2012 (27,129) (194,350)
(1,673) SPDR Gold Trust Put Option
strike price USD 105
expiring on 21/1/2012 421,995 (17,566)
(13,102) SPX Put Option
strike price USD 915.92
expiring on 10/2/2012 74,313 (293,198)
(372) IBOV Put Option
strike price USD 47,680.2
expiring on 15/2/2012 157,192 (532,566)
(7,985) SPX Put Option
strike price USD 1,025
expiring on 24/2/2012 (28,580) (318,435)
(8,200) SPX Put Option
strike price USD 950
expiring on 24/2/2012 39,149 (231,451)
(140,600) SLE Put Option
strike price USD 15
expiring on 16/3/2012 59,810 (81,325)
Written Put Options as at 31 August 2011
Number of contracts
subjectto Put Issuer
Unrealisedprofit/(loss)
USD ValueUSD
(384,034) AEO Put Option
strike price USD 11.75
expiring on 16/3/2012 (403,787) (789,434)
(960,541) AEO Put Option
strike price USD 12
expiring on 16/3/2012 (1,242,181) (2,128,495)
(3,811) Urban Put Option
strike price USD 20
expiring on 17/3/2012 26,735 (438,265)
(167,988) MXEUG Put Option
strike price USD 98.1152
expiring on 15/6/2012 (1,698,761) (3,029,783)
(360,000) MXEUG Put Option
strike price USD 99.84
expiring on 15/6/2012 (4,050,000) (6,822,000)
(519,907) MXEUG Put Option
strike price USD 92.966
expiring on 12/7/2012 (4,253,308) (7,164,787)
(52,519) TWSE Put Option
strike price USD 7,608.62
expiring on 19/9/2012 (900,587) (1,887,724)
(79,087) TWSE Put Option
strike price USD 7,758.1976
expiring on 19/9/2012 (1,255,902) (2,904,258)
(53,473) TWSE Put Option
strike price USD 7,557.8236
expiring on 20/3/2013 (744,404) (2,118,635)
(53,550) TWSE Put Option
strike price USD 7,574.49
expiring on 19/6/2013 (694,512) (2,348,136)
(26,775) TWSE Put Option
strike price USD 6,957.96
expiring on 18/9/2013 (302,670) (1,032,021)
(27,201) TWSE Put Option
strike price USD 7,176.382
expiring on 18/9/2013 (327,996) (1,171,227)
(54,318) TWSE Put Option
strike price USD 7,180.59
expiring on 18/12/2013 (745,227) (2,541,882)
Total Written Put Options (7,370,489) (40,365,890)
Note: Written Put Options are included in the Statement of Net Assets (see Note 2c).

Audited Annual Report and Accounts 135
The notes on pages 261 to 270 form an integral part of these financial statements.
Global Allocation Fund continued
Purchased Call Options as at 31 August 2011
Number of contracts
subjectto Call Issuer
Unrealisedprofit/(loss)
USD ValueUSD
160,897,000 OTC USD/EUR Call Option
strike price USD 1.337
expiring on 30/9/2011 (1,229,575) 218,498
6,236 Wells Fargo Call Option
strike price USD 28
expiring on 22/10/2011 (280,760) 417,812
2,391 SPDR Gold Trust Call Option
strike price USD 160
expiring on 22/10/2011 3,736,625 4,429,327
3,956 SPDR Gold Trust Call Option
strike price USD 205
expiring on 17/12/2011 57,550 1,236,250
3,956 SPDR Gold Trust Call Option
strike price USD 195
expiring on 17/12/2011 166,221 1,859,320
43,237 SPX Call Option
strike price USD 1,373.88
expiring on 10/2/2012 208,917 576,431
15,490 SPX Call Option
strike price USD 1,355
expiring on 24/2/2012 19,859 309,698
8,200 SPX Call Option
strike price USD 1,282
expiring on 24/2/2012 108,758 379,358
360,000 MXEUG Call Option
strike price USD 104.71
expiring on 15/6/2012 (2,595,600) 176,400
167,988 MXEUG Call Option
strike price USD 102.9
expiring on 15/6/2012 (1,180,104) 150,918
519,907 MXEUG Call Option
strike price USD 99.429
expiring on 12/7/2012 (2,948,644) 534,733
79,087 TWSE Call Option
strike price USD 9,047.4608
expiring on 19/9/2012 (1,096,820) 551,536
52,519 TWSE Call Option
strike price USD 9,041.74
expiring on 19/9/2012 (688,057) 299,080
53,473 TWSE Call Option
strike price USD 8,818.9307
expiring on 20/3/2013 (657,242) 716,989
53,550 TWSE Call Option
strike price USD 8,807.55
expiring on 19/6/2013 (889,055) 764,569
44,882 TWSE Call Option
strike price USD 8,646.243
expiring on 18/9/2013 (444,753) 398,484
26,775 TWSE Call Option
strike price USD 8,807.55
expiring on 18/9/2013 (410,190) 319,161
89,624 TWSE Call Option
strike price USD 8,646.11
expiring on 18/12/2013 (854,205) 942,443
Total Purchased Call Options (8,977,075) 14,281,007
Note: Purchased Call Options are included in the Statement of Net Assets (see Note 2c).
Purchased Put Options as at 31 August 2011
Number of contracts
subjectto Put Issuer
UnrealisedlossUSD
ValueUSD
2,752 S&P 500 Put Option
strike price USD 1,250
expiring on 17/9/2011 (678) 10,925,440
39,924,000 OTC EUR/USD Put Option
strike price EUR 1.3
expiring on 30/9/2011 (370,396) 30,731
2,560 SPDR Gold Trust Put Option
strike price USD 132
expiring on 30/9/2011 (1,378,597) 11,520
1,667 S&P 500 Put Option
strike price USD 1,215
expiring on 30/9/2011 (1,778,007) 5,576,115
943 KOSPI 200 Put Option
strike price USD 230.7075
expiring on 8/12/2011 (640,312) 647,955
2,391 SPDR Gold Trust Put Option
strike price USD 165
expiring on 17/12/2011 (597,254) 1,201,478
1,642 SPDR Gold Trust Put Option
strike price USD 125
expiring on 21/1/2012 (1,411,709) 58,291
372 IBOV Put Option
strike price USD 52,978
expiring on 15/2/2012 (355,424) 974,848
Total Purchased Put Options (6,532,377) 19,426,378
Note: Purchased Put Options are included in the Statement of Net Assets (see Note 2c).

136 BlackRock Global Funds (BGF)
Global Allocation Fund continued
Open Forward Foreign Exchange Transactionsas at 31 August 2011
Purchases Sales Value date Unrealised
profit/(loss)
Unrealisedprofit/(loss)
USD Equivalent
Core Fund USD
EUR 58,505,170 USD 84,446,600 1/9/2011 43,896 43,896
USD 29,970,377 EUR 20,945,270 1/9/2011 (277,825) (277,825)
EUR 44,005,137 USD 63,435,732 2/9/2011 114,478 114,478
ZAR 74,784,871 USD 10,488,320 2/9/2011 170,457 170,457
USD 11,161,921 ZAR 74,784,871 2/9/2011 503,143 503,143
KRW 29,841,092,500 USD 28,035,523 6/9/2011 (63,944) (63,944)
CHF 29,122,196 USD 37,704,102 8/9/2011 (1,558,441) (1,558,441)
USD 20,143,016 MXN 246,345,060 8/9/2011 261,223 261,223
JPY 6,489,190,560 USD 84,419,306 9/9/2011 212,224 212,224
SGD 38,504,640 USD 30,400,000 12/9/2011 1,618,901 1,618,901
CHF 65,410,325 USD 88,655,902 15/9/2011 (7,454,909) (7,454,909)
USD 49,573,666 MYR 150,000,000 15/9/2011 (803,100) (803,100)
USD 27,427,430 CHF 21,140,377 15/9/2011 1,183,567 1,183,567
CHF 64,401,819 EUR 62,338,080 16/9/2011 (10,058,623) (10,058,623)
USD 3,362,228 CNY 21,577,100 19/9/2011 (25,004) (25,004)
USD 6,409,367 MYR 19,412,050 19/9/2011 (113,726) (113,726)
CHF 49,288,808 EUR 43,388,035 22/9/2011 (1,443,853) (1,443,853)
USD 29,782,487 MXN 363,524,090 22/9/2011 479,331 479,331
CAD 39,939,435 USD 40,628,149 23/9/2011 391,588 391,588
NOK 352,130,560 USD 65,153,352 23/9/2011 540,177 540,177
USD 8,753,110 MYR 26,498,290 28/9/2011 (162,407) (162,407)
SGD 14,644,338 USD 12,200,000 29/9/2011 (21,588) (21,588)
TWD 552,186,500 USD 19,300,000 29/9/2011 (215,228) (215,228)
EUR 58,449,202 USD 84,120,572 30/9/2011 259,137 259,137
EUR 37,559,900 USD 54,210,200 7/10/2011 8,633 8,633
USD 1,467,512 AUD 1,409,958 17/10/2011 (32,829) (32,829)
USD 1,219,150 AUD 1,164,700 15/11/2011 (16,014) (16,014)
SGD 7,600,380 USD 6,111,202 16/11/2011 212,001 212,001
USD 29,684,271 MXN 369,999,600 9/2/2012 193,923 193,923
CNY 267,927,550 USD 41,800,000 12/3/2012 610,552 610,552
CNY 285,188,722 USD 44,620,790 11/4/2012 576,068 576,068
USD 51,537,684 AUD 50,451,958 16/4/2012 (1,121,565) (1,121,565)
USD 1,197,545 AUD 1,164,700 15/5/2012 (14,688) (14,688)
AUD 49,042,000 USD 47,867,444 15/11/2012 2,659,843 2,659,843
USD 98,735,656 AUD 99,248,087 15/11/2012 (3,518,262) (3,518,262)
Net unrealised loss (16,862,864) (16,862,864)
AUD Hedged Share Class AUD
AUD 87,304,248 USD 88,977,703 14/9/2011 4,039,422 4,323,474
USD 8,226,802 AUD 7,968,826 14/9/2011 (270,231) (289,234)
Net unrealised profit 3,769,191 4,034,240
CHF Hedged Share Class CHF
CHF 30,841,505 USD 37,718,562 14/9/2011 457,014 567,156
USD 18,625 CHF 15,233 14/9/2011 (230) (285)
Net unrealised profit 456,784 566,871
EUR Hedged Share Class EUR
EUR 3,278,184,511 USD 4,653,251,194 14/9/2011 55,565,495 80,250,570
USD 382,707,075 EUR 267,785,222 14/9/2011 (2,740,623) (3,958,150)
Net unrealised profit 52,824,872 76,292,420
GBP Hedged Share Class GBP
GBP 80,248,199 USD 131,212,774 14/9/2011 (175,343) (286,134)
USD 9,154,569 GBP 5,605,064 14/9/2011 5,998 9,788
Net unrealised loss (169,345) (276,346)
Open Forward Foreign Exchange Transactionsas at 31 August 2011
Purchases Sales Value date Unrealised
profit/(loss)
Unrealisedprofit/(loss)
USD Equivalent
PLN Hedged Share Class PLN
PLN 41,807,130 USD 14,498,481 14/9/2011 117,959 41,079
USD 1,011,673 PLN 2,949,561 14/9/2011 (40,580) (14,132)
Net unrealised profit 77,379 26,947
SGD Hedged Share Class SGD
SGD 248,053,382 USD 203,311,389 14/9/2011 3,561,124 2,961,187
USD 17,643,353 SGD 21,411,296 14/9/2011 (194,269) (161,541)
Net unrealised profit 3,366,855 2,799,646
Total net unrealised profit 66,580,914
Note: The net unrealised profit attributed to these transactions is included in the Statement
of Net Assets (see Note 2c).

Audited Annual Report and Accounts 137
The notes on pages 261 to 270 form an integral part of these financial statements.
Global Corporate Bond Fund
BONDS
Australia USD 3,200,000 Asciano Finance Ltd '144A' 4.625%
23/9/2020 3,176,275 0.52
EUR 667,000 Commonwealth Bank of Australia 4.25%
10/11/2016 1,011,370 0.16
AUD 525,000 Commonwealth Bank of Australia 5.75%
17/12/2013 578,312 0.09
AUD 1,400,000 Holcim Finance Australia Pty Ltd 8.5%
7/8/2012 1,535,429 0.25
EUR 1,250,000 National Australia Bank Ltd 4%
13/7/2020 1,799,317 0.29
USD 950,000 Rio Tinto Finance USA Ltd 9% 1/5/2019 1,295,307 0.21
USD 1,500,000 Westpac Banking Corp 3% 4/8/2015 1,533,136 0.25
USD 850,000 Westpac Banking Corp 4.2% 27/2/2015 904,212 0.15
11,833,358 1.92
Austria EUR 1,600,000 Raiffeisen Bank International AG 6.625%
18/5/2021 2,168,577 0.35
Belgium GBP 1,200,000 Anheuser-Busch InBev NV 6.5%
23/6/2017 2,293,133 0.37
Bermuda GBP 1,000,000 Holcim GB Finance Ltd 8.75% 24/4/2017 2,005,439 0.32
USD 1,590,000 Ingersoll-Rand Global Holding Co Ltd
9.5% 15/4/2014 1,892,683 0.31
3,898,122 0.63
British Virgin Islands USD 800,000 CLP Power Hong Kong Financing Ltd
4.75% 12/7/2021 838,476 0.13
USD 2,200,000 CNOOC Finance 2011 Ltd '144A' 5.75%
26/1/2041 2,526,069 0.41
3,364,545 0.54
Canada USD 700,000 Barrick Gold Corp 6.95% 1/4/2019 864,196 0.14
USD 800,000 Canadian Natural Resources Ltd 5.7%
15/5/2017 931,724 0.15
USD 1,050,000 Canadian Natural Resources Ltd 6.75%
1/2/2039 1,257,305 0.20
USD 1,312,000 Canadian Pacific Railway Co 4.45%
15/3/2023 1,383,305 0.22
USD 900,000 Canadian Pacific Railway Co 7.25%
15/5/2019 1,139,891 0.18
USD 1,350,000 Cenovus Energy Inc 6.75% 15/11/2039 1,608,672 0.26
USD 1,040,000 Fairfax Financial Holdings Ltd '144A' 5.8%
15/5/2021 1,020,890 0.17
USD 1,210,000 Husky Energy Inc 5.9% 15/6/2014 1,347,601 0.22
USD 710,000 Nexen Inc 6.4% 15/5/2037 725,642 0.12
10,279,226 1.66
Cayman Islands USD 1,400,000 China Resources Land Ltd 4.625%
19/5/2016 1,369,134 0.22
EUR 600,000 Hutchison Whampoa Finance 09 Ltd 4.75%
14/11/2016 909,397 0.15
USD 3,000,000 Petrobras International Finance Co - Pifco
3.875% 27/1/2016 3,081,246 0.50
GBP 850,000 Thames Water Utilities Cayman Finance Ltd
5.5% 11/2/2041 1,441,914 0.23
USD 1,950,000 Transocean Inc 6% 15/3/2018 2,160,329 0.35
EUR 781,000 UPCB Finance II Ltd 6.375% 1/7/2020 1,001,939 0.16
9,963,959 1.61
Chile USD 2,085,000 Inversiones CMPC SA '144A' 4.75%
19/1/2018 2,141,247 0.35
Denmark USD 380,000 Danske Bank A/S FRN 16/6/2014
(Perpetual) 311,600 0.05
DKK 46,400,000 Nykredit Realkredit A/S 4% 1/10/2041 8,766,593 1.42
EUR 270,000 TDC A/S 6.5% 19/4/2012 400,473 0.06
9,478,666 1.53
France EUR 1,100,000 AXA SA FRN 5/10/2017 (Perpetual) 1,170,331 0.19
USD 2,000,000 BNP Paribas Home Loan Covered Bonds
SFH '144A' 2.2% 2/11/2015 1,979,874 0.32
EUR 950,000 BNP Paribas SA FRN 11/9/2013
(Perpetual) * 1,328,648 0.22
USD 2,050,000 BNP Paribas SA FRN 27/4/2017 1,985,046 0.32
USD 26,000 BPCE SA 6.75% 27/1/2012 (Perpetual) 20,708 0.00
EUR 2,800,000 CNP Assurances FRN 22/12/2016
(Perpetual) 2,696,597 0.44
USD 450,000 Credit Agricole SA '144A' FRN 31/5/2017
(Perpetual) 310,500 0.05
GBP 600,000 Credit Agricole SA FRN 30/1/2020
(Perpetual) 782,261 0.13
EUR 295,000 Crown European Holdings SA 7.125%
15/8/2018 407,920 0.07
USD 470,000 France Telecom SA 8.5% 1/3/2031 633,426 0.10
EUR 1,000,000 Lafarge SA 7.625% 24/11/2016 1,511,979 0.24
EUR 50,000 Lafarge SA 8.875% 27/5/2014 77,263 0.01
EUR 1,100,000 Natixis FRN 6/7/2017 1,509,141 0.24
EUR 1,000,000 Pernod-Ricard SA 5% 15/3/2017 1,434,139 0.23
EUR 865,000 RCI Banque SA 8.125% 15/5/2012 1,293,115 0.21
EUR 250,000 SCOR SE FRN 28/7/2016 (Perpetual) 277,397 0.05
USD 100,000 Societe Generale SA '144A' FRN 5/4/2017
(Perpetual) 71,359 0.01
EUR 1,100,000 Societe Generale SA FRN 19/12/2017
(Perpetual) 1,281,285 0.21
USD 2,000,000 Societe Generale SA '144A' 2.2%
14/9/2013 1,897,334 0.31
USD 600,000 Societe Generale SA '144A' 5.75%
20/4/2016 559,970 0.09
EUR 200,000 Unibail-Rodamco SE 4% 29/10/2011 289,876 0.05
EUR 850,000 Unibail-Rodamco SE 4.625% 23/9/2016 1,317,135 0.21
USD 550,000 Veolia Environnement SA 5.25% 3/6/2013 582,264 0.09
EUR 600,000 Veolia Environnement SA 5.25%
24/4/2014 925,509 0.15
24,343,077 3.94
Germany EUR 2,000,000 Bayerische Landesbank FRN 7/2/2019 2,253,646 0.36
EUR 2,000,000 Commerzbank AG 4% 16/9/2020 2,724,007 0.44
GBP 300,000 Commerzbank AG 6.625% 30/8/2019 449,936 0.07
USD 3,000,000 Deutsche Bank AG/London 3.25%
11/1/2016 3,014,960 0.49
EUR 252,000 Deutsche Boerse AG FRN 13/6/2038 371,737 0.06
EUR 185,000 HSH Nordbank AG FRN 14/2/2017 154,968 0.03
EUR 700,000 Rhoen Klinikum AG 3.875% 11/3/2016 1,020,795 0.17
EUR 635,000 UPC Germany GmbH 8.125% 1/12/2017 926,612 0.15
10,916,661 1.77
Portfolio of Investments 31 August 2011
Transferable Securities Admitted to an Official Stock Exchange Listing or Dealt in on Another Regulated Market
Holding Description Value (USD) %
Transferable Securities Admitted to an Official Stock Exchange Listing or Dealt in on Another Regulated Market
Holding Description Value (USD) %

138 BlackRock Global Funds (BGF)
Global Corporate Bond Fund continued
Greece EUR 500,000 Hellenic Republic Government Bond
5.25% 18/5/2012 517,368 0.08
Guernsey USD 1,309,000 Credit Suisse Group Guernsey I Ltd FRN
24/2/2041 1,273,035 0.21
India USD 800,000 Bank of Baroda/London 5% 24/8/2016 818,884 0.13
USD 1,350,000 Bank of India 6.25% 16/2/2021 1,389,562 0.22
USD 650,000 Canara Bank/London 5.125% 9/9/2016 663,614 0.11
USD 500,000 ICICI Bank Ltd FRN 31/10/2016 (Perpetual) 468,465 0.08
USD 1,010,000 ICICI Bank Ltd/Dubai 4.75% 25/11/2016 999,788 0.16
USD 840,000 Rural Electrification Corp Ltd 4.25%
25/1/2016 853,020 0.14
5,193,333 0.84
Ireland EUR 1,000,000 Ardagh Packaging Finance Plc 7.375%
15/10/2017 1,343,071 0.22
EUR 100,000 GE Capital European Funding 5.75%
23/9/2011 144,707 0.02
USD 2,065,000 Iberdrola Finance Ireland Ltd '144A' 3.8%
11/9/2014 2,075,997 0.34
EUR 2,220,000 Ireland Government Bond 5% 18/10/2020 2,530,594 0.41
EUR 1,150,000 Smurfit Kappa Acquisitions 7.25%
15/11/2017 1,583,618 0.26
EUR 97,035 Talisman Finance Plc '7H' FRN 22/4/2017 14,013 0.00
USD 1,100,000 XL Group Plc FRN 15/4/2017 (Perpetual) 979,000 0.16
8,671,000 1.41
Italy EUR 1,000,000 Enel SpA 3.5% 26/2/2016 1,421,777 0.23
GBP 1,250,000 Intesa Sanpaolo SpA FRN 12/11/2017 1,926,834 0.31
EUR 750,000 Intesa Sanpaolo SpA 6.625% 8/5/2018 1,011,007 0.16
EUR 700,000 Mediobanca SpA 4.625% 11/10/2016 995,714 0.16
GBP 800,000 Telecom Italia SpA 5.875% 19/5/2023 1,162,875 0.19
EUR 1,400,000 UniCredit SpA 6.125% 19/4/2021 1,771,940 0.29
8,290,147 1.34
Japan JPY 30,000,000 Development Bank of Japan 2.3%
19/3/2026 425,750 0.07
USD 750,000 Sumitomo Mitsui Banking Corp 2.9%
22/7/2016 761,772 0.13
EUR 1,500,000 Tokyo Electric Power Co Inc/The 4.5%
24/3/2014 1,868,375 0.30
3,055,897 0.50
Jersey GBP 1,880,000 Gatwick Funding Ltd 6.5% 2/3/2041 3,117,463 0.50
USD 750,000 HSBC Capital Funding LP/Jersey Channel
Islands FRN 27/6/2013 (Perpetual) 708,750 0.12
USD 650,000 Old Mutual Capital Funding LP 8%
22/12/2011 (Perpetual) 638,625 0.10
4,464,838 0.72
Luxembourg USD 950,000 ArcelorMittal 5.375% 1/6/2013 986,563 0.16
USD 650,000 ArcelorMittal 6.125% 1/6/2018 663,345 0.11
USD 1,125,000 Covidien International Finance SA 6%
15/10/2017 1,355,886 0.22
EUR 1,250,000 Enel Finance International NV 4%
14/9/2016 1,803,631 0.29
EUR 1,500,000 Fiat Finance & Trade SA 9% 30/7/2012 2,235,529 0.36
EUR 1,100,000 ITW Finance Europe SA 5.25% 1/10/2014 1,744,528 0.28
EUR 700,000 Michelin Luxembourg SCS 8.625%
24/4/2014 1,157,222 0.19
EUR 1,000,000 Sunrise Communications International SA
7% 31/12/2017 1,410,051 0.23
USD 2,050,000 Telecom Italia Capital SA 7.2% 18/7/2036 1,912,129 0.31
EUR 115,000 Telecom Italia Finance SA 7.75%
24/1/2033 168,143 0.03
USD 1,550,000 Unicredit Luxembourg Finance SA '144A'
FRN 13/1/2017 1,500,986 0.24
USD 1,500,000 Unicredit Luxembourg Finance SA FRN
13/1/2017 1,361,250 0.22
USD 540,000 Unicredit Luxembourg Finance SA FRN
13/1/2017 481,543 0.08
16,780,806 2.72
Mexico USD 1,210,000 America Movil SAB de CV 5% 16/10/2019 1,325,663 0.21
USD 1,800,000 America Movil SAB de CV 6.125%
30/3/2040 2,034,315 0.33
USD 250,000 America Movil SAB de CV 6.375%
1/3/2035 288,154 0.05
USD 2,100,000 Petroleos Mexicanos 4.875% 15/3/2015 2,273,250 0.37
5,921,382 0.96
Netherlands EUR 1,031,000 Allianz Finance II BV FRN 17/2/2017
(Perpetual) 1,181,461 0.19
EUR 2,000,000 Allianz Finance II BV FRN 8/7/2041 2,454,990 0.40
EUR 1,400,000 BMW Finance NV 4% 17/9/2014 2,118,752 0.34
EUR 1,350,000 Brenntag Finance BV 5.5% 19/7/2018 1,910,996 0.31
EUR 1,000,000 Celesio Finance B.V. 4.5% 26/4/2017 * 1,349,107 0.22
EUR 800,000 Coca-Cola HBC Finance BV 7.875%
15/1/2014 1,285,286 0.21
EUR 1,500,000 Cooperatieve Centrale Raiffeisen-
Boerenleenbank BA/Netherlands
4.125% 14/7/2025 2,191,273 0.35
GBP 260,000 Cooperatieve Centrale Raiffeisen-
Boerenleenbank BA/Netherlands
5.25% 23/5/2041 428,407 0.07
USD 3,000,000 Deutsche Telekom International Finance
BV '144A' 3.125% 11/4/2016 3,073,702 0.50
USD 1,230,000 Deutsche Telekom International Finance
BV 5.75% 23/3/2016 1,400,843 0.23
USD 800,000 E.ON International Finance BV '144A' 5.8%
30/4/2018 935,711 0.15
EUR 2,680,000 Eureko BV FRN 24/6/2015 (Perpetual) 2,923,476 0.47
EUR 491,993 Globaldrive BV '2008-2 A' 4% 20/10/2016 717,942 0.12
EUR 650,000 Heineken NV 7.125% 7/4/2014 1,043,431 0.17
GBP 300,000 Heineken NV 7.25% 10/3/2015 555,777 0.09
USD 2,000,000 ING Bank NV '144A' 3% 1/9/2015 2,038,888 0.33
GBP 1,000,000 ING Bank NV 5.375% 15/4/2021 1,667,319 0.27
EUR 1,250,000 ING Groep NV 5.625% 3/9/2013 1,900,327 0.31
EUR 500,000 Lanxess Finance BV 7.75% 9/4/2014 811,579 0.13
USD 2,110,000 MDC-GMTN B.V. 3.75% 20/4/2016 2,202,313 0.36
USD 1,750,000 MDC-GMTN B.V. 5.75% 6/5/2014 1,918,954 0.31
EUR 990,000 OI European Group BV 6.75% 15/9/2020 1,308,781 0.21
EUR 1,600,000 PostNL NV 5.375% 14/11/2017 2,431,528 0.39
EUR 600,000 RWE Finance BV 5% 10/2/2015 935,682 0.15
EUR 1,793,545 Storm BV '2010-3 A1' FRN 22/9/2011 2,581,443 0.42
EUR 800,000 Swiss Reinsurance Co via ELM BV FRN
25/5/2016 (Perpetual) 971,379 0.16
EUR 2,100,000 TenneT Holding BV 3.875% 21/2/2018 3,176,308 0.51
EUR 1,000,000 Trafigura Beheer BV 6.375% 8/4/2015 1,328,766 0.21
EUR 1,050,000 Ziggo Finance BV 6.125% 15/11/2017 1,482,972 0.24
48,327,393 7.82
Portfolio of Investments 31 August 2011
Transferable Securities Admitted to an Official Stock Exchange Listing or Dealt in on Another Regulated Market
Holding Description Value (USD) %
Transferable Securities Admitted to an Official Stock Exchange Listing or Dealt in on Another Regulated Market
Holding Description Value (USD) %

Audited Annual Report and Accounts 139
The notes on pages 261 to 270 form an integral part of these financial statements.
Global Corporate Bond Fund continued
New Zealand USD 2,250,000 ANZ National Int'l Ltd/London '144A'
3.125% 10/8/2015 2,300,112 0.37
Norway EUR 1,050,000 DnB NOR Bank ASA 4.375% 24/2/2021 1,536,090 0.25
Poland USD 4,420,000 Poland Government International Bond
5.125% 21/4/2021 4,607,850 0.75
Qatar USD 1,485,000 Qatari Diar Finance QSC 5% 21/7/2020 1,611,225 0.26
Russian Federation USD 1,513,750 Russian Foreign Bond - Eurobond
(Step-up coupon) 7.5% 31/3/2030 1,812,716 0.29
South Korea USD 955,000 Lotte Shopping Co Ltd 3.875% 7/4/2016 969,406 0.16
USD 715,000 POSCO '144A' 5.25% 14/4/2021 728,680 0.12
USD 1,029,000 Woori Bank 5.875% 13/4/2021 1,064,292 0.17
USD 1,200,000 Woori Bank 7% 2/2/2015 1,354,844 0.22
4,117,222 0.67
Spain EUR 1,000,000 Banco Santander SA 3.625% 6/4/2017 1,371,037 0.22
EUR 2,000,000 BBVA Senior Finance SAU 2.75%
10/9/2012 2,856,075 0.47
EUR 1,250,000 Santander International Debt SA
Unipersonal 3.5% 12/8/2014 1,740,783 0.28
EUR 1,100,000 Santander Issuances S.A Unipersonal FRN
24/10/2017 1,434,153 0.23
GBP 1,000,000 Santander Issuances S.A Unipersonal FRN
31/1/2018 1,543,051 0.25
USD 1,150,000 Telefonica Emisiones SAU 3.992%
16/2/2016 1,126,354 0.18
USD 2,050,000 Telefonica Emisiones SAU 5.134%
27/4/2020 1,951,068 0.32
USD 1,300,000 Telefonica Emisiones SAU 5.877%
15/7/2019 1,306,020 0.21
13,328,541 2.16
Sweden GBP 1,150,000 Nordea Bank AB 3.875% 15/12/2015 1,951,592 0.32
GBP 350,000 Svenska Handelsbanken AB FRN
18/1/2012 (Perpetual) 568,182 0.09
GBP 1,300,000 Svenska Handelsbanken AB FRN
4/9/2013 (Perpetual) 2,106,613 0.34
4,626,387 0.75
Switzerland USD 4,500,000 Credit Suisse/New York NY 4.375%
5/8/2020 ‡ 4,393,737 0.71
USD 600,000 Tyco International Ltd / Tyco International
Finance SA 7% 15/12/2019 754,721 0.12
EUR 650,000 UBS AG/London 5.625% 19/5/2014 1,005,789 0.16
GBP 1,000,000 UBS AG/London 6.375% 20/7/2016 1,805,233 0.29
USD 1,000,000 UBS AG/Stamford CT 2.25% 12/8/2013 1,008,705 0.16
USD 2,300,000 UBS AG/Stamford CT 4.875% 4/8/2020 2,312,052 0.38
USD 1,600,000 UBS AG/Stamford CT 5.875%
20/12/2017 1,709,806 0.28
12,990,043 2.10
United Kingdom EUR 180,000 Anglian Water Services Financing Plc
4.625% 7/10/2013 273,563 0.04
EUR 700,000 Aviva Plc FRN 29/9/2015 (Perpetual) 837,790 0.14
USD 1,650,000 Barclays Bank Plc 5.2% 10/7/2014 1,725,875 0.28
EUR 750,000 Barclays Bank Plc 6.625% 30/3/2022 943,892 0.15
GBP 275,000 BL Superstores Finance Plc 5.27%
4/7/2025 473,634 0.08
GBP 110,682 City Greenwich Lewisham Rail Link Plc
9.375% 11/10/2020 190,537 0.03
GBP 1,950,000 Enterprise Inns Plc 6.5% 6/12/2018 2,442,134 0.40
GBP 900,000 Eversholt Funding Plc 6.697%
22/2/2035 1,573,149 0.25
EUR 1,050,000 FCE Bank Plc 9.375% 17/1/2014 1,584,598 0.26
GBP 750,000 Firstgroup Plc 6.875% 15/4/2013 1,293,961 0.21
GBP 400,000 Firstgroup Plc 8.125% 19/9/2018 792,519 0.13
USD 383,000 HBOS Plc FRN 6/9/2017 300,559 0.05
USD 134,000 HBOS Plc 6.75% 21/5/2018 122,467 0.02
GBP 1,000,000 HSBC Bank Plc FRN 29/9/2020 1,624,511 0.26
USD 1,300,000 HSBC Holdings Plc FRN 6/10/2016 1,283,750 0.21
GBP 500,000 HSBC Holdings Plc 6% 29/3/2040 747,915 0.12
USD 375,000 HSBC Holdings Plc 6.8% 1/6/2038 377,433 0.06
GBP 650,000 John Lewis Plc 8.375% 8/4/2019 1,308,318 0.21
USD 180,000 LBG Capital No.1 Plc 7.875% 1/11/2020 136,890 0.02
GBP 1,100,000 Legal & General Group Plc FRN
23/7/2041 2,240,542 0.36
USD 600,000 Lloyds Banking Group Plc 5.92%
1/10/2015 (Perpetual) 333,000 0.05
EUR 1,800,000 Lloyds TSB Bank Plc 3.75% 7/9/2015 2,494,706 0.40
EUR 214,000 Lloyds TSB Bank Plc 6.25% 15/4/2014 326,654 0.05
EUR 500,000 Lloyds TSB Bank Plc 6.375% 17/6/2016 752,971 0.12
GBP 1,050,000 Lloyds TSB Bank Plc 6.5% 17/9/2040 1,506,853 0.24
GBP 1,000,000 London Power Networks Plc 5.375%
11/11/2016 1,790,862 0.29
GBP 1,550,000 Marks & Spencer Plc 5.625% 24/3/2014 2,696,722 0.44
USD 2,850,000 Nationwide Building Society 6.25%
25/2/2020 3,025,845 0.49
GBP 1,375,000 Next Plc 5.375% 26/10/2021 2,304,291 0.37
USD 1,230,000 Northern Rock Asset Management Plc
'144A' 5.625% 22/6/2017 1,332,004 0.22
EUR 650,000 Old Mutual Plc FRN 18/1/2017 922,273 0.15
GBP 750,000 Permanent Master Issuer Plc '2009-1 A2'
FRN 15/7/2042 1,229,643 0.20
EUR 50,000 Rexam Plc 4.375% 15/3/2013 74,141 0.01
GBP 850,000 Rolls-Royce Plc 6.75% 30/4/2019 1,671,418 0.27
USD 1,000,000 Royal Bank of Scotland Plc/The 3.4%
23/8/2013 1,000,331 0.16
GBP 1,150,000 Royal Bank of Scotland Plc/The 6.375%
29/4/2014 1,942,032 0.31
GBP 900,000 Royal Bank of Scotland Plc/The 7.5%
29/4/2024 1,512,488 0.25
USD 150,000 SABMiller Plc '144A' 5.5% 15/8/2013 162,062 0.03
USD 1,300,000 Smiths Group Plc '144A' 7.2% 15/5/2019 1,555,453 0.25
GBP 1,394,000 Spirit Issuer Plc 5.86% 28/12/2014 1,956,207 0.32
GBP 130,000 Standard Chartered Bank FRN 11/5/2016
(Perpetual) 221,520 0.04
GBP 1,244,183 Tesco Property Finance 4 Plc 5.801%
13/10/2040 2,086,798 0.34
GBP 975,000 United Kingdom Gilt 4.25% 7/9/2039 1,703,389 0.28
GBP 550,000 United Kingdom Gilt 4.25% 7/12/2040 957,619 0.16
GBP 1,165,000 Virgin Media Secured Finance Plc 5.5%
15/1/2021 1,875,753 0.30
GBP 1,206,000 Virgin Media Secured Finance Plc 7%
15/1/2018 2,058,227 0.33
Portfolio of Investments 31 August 2011
Transferable Securities Admitted to an Official Stock Exchange Listing or Dealt in on Another Regulated Market
Holding Description Value (USD) %
Transferable Securities Admitted to an Official Stock Exchange Listing or Dealt in on Another Regulated Market
Holding Description Value (USD) %

140 BlackRock Global Funds (BGF)
Global Corporate Bond Fund continued
GBP 1,450,000 Wales & West Utilities Finance Plc FRN
17/12/2036 2,640,161 0.43
GBP 1,812,000 Western Power Distribution East Midlands
Plc 5.25% 17/1/2023 3,104,222 0.50
GBP 1,188,000 Western Power Distribution West Midlands
Plc 5.75% 16/4/2032 2,008,695 0.33
65,520,377 10.61
United States USD 1,000,000 ABN Amro North American Holding
Preferred Capital Repackage Trust I
'144A' FRN 8/11/2012 (Perpetual) 780,000 0.13
USD 3,050,000 Aetna Inc 3.95% 1/9/2020 3,114,565 0.50
USD 725,000 Agilent Technologies Inc 4.45% 14/9/2012 748,812 0.12
USD 600,000 Alabama Power Co 5.2% 1/6/2041 677,409 0.11
USD 1,250,000 Alpha Natural Resources Inc 6% 1/6/2019 1,218,750 0.20
USD 836,000 Altria Group Inc 9.25% 6/8/2019 1,104,746 0.18
USD 897,000 Altria Group Inc 10.2% 6/2/2039 1,289,195 0.21
USD 2,750,000 American Express Credit Corp 2.75%
15/9/2015 2,806,376 0.45
GBP 2,650,000 American Express Credit Corp 5.375%
1/10/2014 4,597,040 0.74
USD 800,000 American International Group Inc FRN
15/5/2058 788,600 0.13
USD 795,000 American Tower Corp 4.625% 1/4/2015 859,418 0.14
USD 3,015,000 Ameriprise Financial Inc 5.3% 15/3/2020 3,341,651 0.54
USD 1,350,000 Anadarko Petroleum Corp 6.375%
15/9/2017 1,544,824 0.25
USD 1,445,000 Anadarko Petroleum Corp 6.45%
15/9/2036 1,493,177 0.24
USD 480,000 Appalachian Power Co 5.8% 1/10/2035 514,718 0.08
USD 1,360,000 Associated Banc-Corp 5.125% 28/3/2016 1,422,520 0.23
USD 2,800,000 AT&T Inc 5.8% 15/2/2019 3,299,271 0.53
USD 1,000,000 AT&T Inc 6.5% 1/9/2037 1,147,168 0.19
USD 1,300,000 AvalonBay Communities Inc 5.7%
15/3/2017 1,492,364 0.24
USD 1,320,000 BAE Systems Holdings Inc '144A' 4.95%
1/6/2014 1,427,309 0.23
USD 1,270,000 Ball Corp 5.75% 15/5/2021 1,260,475 0.20
USD 585,000 Ball Corp 6.75% 15/9/2020 617,175 0.10
EUR 2,250,000 Bank of America Corp FRN 28/3/2018 2,621,785 0.42
USD 1,500,000 Bank of America Corp 3.7% 1/9/2015 1,461,566 0.24
USD 1,030,000 Bank of America Corp 4.5% 1/4/2015 1,028,076 0.17
EUR 700,000 Bank of America Corp 4.625% 7/8/2017 950,425 0.15
USD 500,000 Bank of America NA 5.3% 15/3/2017 485,853 0.08
USD 2,350,000 Barrick North America Finance LLC '144A'
4.4% 30/5/2021 2,473,299 0.40
USD 1,805,000 BB&T Corp 3.2% 15/3/2016 1,834,595 0.30
USD 3,456,000 Best Buy Co Inc 5.5% 15/3/2021 3,343,573 0.54
USD 1,550,000 Boeing Co/The 5.875% 15/2/2040 1,857,283 0.30
USD 1,115,000 BorgWarner Inc 4.625% 15/9/2020 1,189,038 0.19
USD 2,400,000 Boston Properties LP 5.625% 15/11/2020 2,656,620 0.43
USD 800,000 Bristol-Myers Squibb Co 5.45% 1/5/2018 952,036 0.15
USD 500,000 Bunge Ltd Finance Corp 8.5% 15/6/2019 640,651 0.10
USD 620,000 Burlington Northern Santa Fe LLC 3.6%
1/9/2020 624,674 0.10
USD 1,325,000 Burlington Northern Santa Fe LLC 5.75%
1/5/2040 1,465,418 0.24
USD 1,000,000 Capital One Bank USA NA 8.8%
15/7/2019 1,215,424 0.20
USD 1,330,000 Capital One Capital V 10.25% 15/8/2039 1,379,875 0.22
USD 1,350,000 Capital One Capital VI 8.875% 15/5/2040 1,376,762 0.22
USD 790,000 Capital One Financial Corp 7.375%
23/5/2014 888,967 0.14
USD 1,100,000 Caterpillar Inc 5.2% 27/5/2041 1,190,116 0.19
USD 2,030,000 Chesapeake Energy Corp 6.125%
15/2/2021 2,052,838 0.33
USD 1,015,000 Chesapeake Energy Corp 6.625%
15/8/2020 1,060,675 0.17
USD 2,650,000 Chevron Phillips Chemical Co LLC/LP
'144A' 4.75% 1/2/2021 2,772,230 0.45
USD 1,300,000 Citigroup Inc 3.953% 15/6/2016 1,325,340 0.21
USD 500,000 Citigroup Inc 4.7% 29/5/2015 512,615 0.08
USD 2,650,000 Citigroup Inc 4.75% 19/5/2015 2,764,660 0.45
USD 5,500,000 Citigroup Inc 6.01% 15/1/2015 5,886,941 0.95
USD 1,000,000 Citigroup Inc 8.125% 15/7/2039 1,199,530 0.19
USD 2,480,000 Cliffs Natural Resources Inc 6.25%
1/10/2040 2,416,299 0.39
USD 600,000 Comcast Corp 6.95% 15/8/2037 704,039 0.11
USD 1,350,000 Consol Energy Inc 8.25% 1/4/2020 1,444,500 0.23
USD 130,000 COX Communications Inc 5.45%
15/12/2014 145,061 0.02
USD 1,600,000 COX Communications Inc '144A' 6.25%
1/6/2018 1,922,810 0.31
USD 1,000,000 Crown Castle Towers LLC '144A' 6.113%
15/1/2020 1,134,675 0.18
USD 655,000 CSX Corp 4.25% 1/6/2021 689,618 0.11
USD 650,000 CVS Caremark Corp 6.6% 15/3/2019 788,134 0.13
USD 100,000 Danaher Corp 5.4% 1/3/2019 118,203 0.02
USD 1,504,065 Dbubs Mortgage Trust '2011-LC1A A1'
3.742% 10/11/2046 1,536,194 0.25
USD 630,000 Deutsche Bank Financial LLC 5.375%
2/3/2015 650,629 0.11
USD 1,050,000 Devon Energy Corp 5.6% 15/7/2041 1,135,112 0.18
USD 550,000 Devon Energy Corp 7.95% 15/4/2032 751,438 0.12
USD 920,000 Diamond Offshore Drilling Inc 5.875%
1/5/2019 1,080,471 0.18
USD 3,400,000 DIRECTV Holdings LLC / DIRECTV
Financing Co Inc 6% 15/8/2040 3,595,614 0.58
USD 965,000 DISH DBS Corp 6.625% 1/10/2014 993,950 0.16
USD 665,000 Domtar Corp 10.75% 1/6/2017 832,913 0.14
USD 700,000 Duke Energy Ohio Inc 5.45% 1/4/2019 834,767 0.14
USD 1,200,000 Enterprise Products Operating LLC 6.125%
15/10/2039 1,249,216 0.20
USD 1,000,000 Enterprise Products Operating LLC 6.3%
15/9/2017 1,168,555 0.19
USD 610,000 EOG Resources Inc 5.625% 1/6/2019 715,253 0.12
USD 6,100,000 Fannie Mae Pool '4 9/11' 4% TBA 6,343,047 1.03
USD 5,700,000 Fannie Mae Pool '4.5 9/11' 4.5% TBA 6,030,422 0.98
USD 1,500,000 General Electric Capital Corp 4.375%
16/9/2020 ‡ 1,521,629 0.25
USD 2,500,000 General Electric Capital Corp 5.3%
11/2/2021 ‡ 2,640,268 0.43
USD 370,000 General Electric Capital Corp 6%
2/2/2046 357,746 0.06
USD 500,000 General Electric Capital Corp 6.75%
15/3/2032 563,953 0.09
USD 1,900,000 General Electric Capital Corp 6.875%
10/1/2039 ‡ 2,185,139 0.35
USD 700,000 General Mills Inc 5.65% 15/2/2019 828,098 0.13
USD 665,000 Georgia-Pacific LLC 5.4% 1/11/2020 679,333 0.11
EUR 2,000,000 Goldman Sachs Group Inc/The 3.75%
4/2/2013 2,875,311 0.47
EUR 800,000 Goldman Sachs Group Inc/The 4.375%
16/3/2017 1,108,544 0.18
EUR 1,100,000 Goldman Sachs Group Inc/The 4.75%
12/10/2021 * 1,360,118 0.22
Portfolio of Investments 31 August 2011
Transferable Securities Admitted to an Official Stock Exchange Listing or Dealt in on Another Regulated Market
Holding Description Value (USD) %
Transferable Securities Admitted to an Official Stock Exchange Listing or Dealt in on Another Regulated Market
Holding Description Value (USD) %

Audited Annual Report and Accounts 141
The notes on pages 261 to 270 form an integral part of these financial statements.
Global Corporate Bond Fund continued
EUR 1,250,000 Goldman Sachs Group Inc/The 5.125%
16/10/2014 1,837,064 0.30
USD 2,600,000 Goldman Sachs Group Inc/The 5.25%
27/7/2021 2,575,828 0.42
USD 2,700,000 Goldman Sachs Group Inc/The 6%
15/6/2020 2,821,189 0.46
GBP 1,500,000 Goldman Sachs Group Inc/The 6.125%
14/5/2017 2,396,721 0.39
USD 2,350,000 Great Plains Energy Inc 2.75% 15/8/2013 2,404,836 0.39
USD 170,000 Halliburton Co 6.15% 15/9/2019 208,645 0.03
USD 1,565,000 Hasbro Inc 6.35% 15/3/2040 1,727,354 0.28
USD 660,000 Hospira Inc 6.4% 15/5/2015 761,689 0.12
USD 2,025,000 HSBC Bank USA NA 4.875% 24/8/2020 1,963,897 0.32
USD 250,000 HSBC Bank USA NA/New York NY 5.875%
1/11/2034 242,560 0.04
USD 500,000 HSBC Finance Corp '144A' 6.676%
15/1/2021 483,907 0.08
USD 1,690,000 International Paper Co 9.375% 15/5/2019 2,163,706 0.35
USD 950,000 ITT Corp 4.9% 1/5/2014 1,044,440 0.17
USD 795,000 Jabil Circuit Inc 7.75% 15/7/2016 870,525 0.14
EUR 2,000,000 JPMorgan Chase & Co FRN 12/11/2019 2,754,277 0.45
USD 1,210,000 JPMorgan Chase & Co 3.15% 5/7/2016 1,228,682 0.20
USD 1,000,000 JPMorgan Chase & Co 6.3% 23/4/2019 1,143,613 0.19
USD 1,220,000 Juniper Networks Inc 5.95% 15/3/2041 1,287,474 0.21
USD 220,000 Kinder Morgan Energy Partners LP 6.85%
15/2/2020 260,230 0.04
USD 1,450,000 Kinder Morgan Energy Partners LP 7.3%
15/8/2033 1,684,926 0.27
USD 1,000,000 Liberty Mutual Group Inc '144A' FRN
15/6/2058 1,240,000 0.20
USD 123,000 Life Technologies Corp 4.4% 1/3/2015 129,487 0.02
USD 2,927,000 Life Technologies Corp 6% 1/3/2020 3,233,854 0.52
USD 835,000 Lincoln National Corp 6.25% 15/2/2020 894,235 0.14
USD 1,400,000 Lincoln National Corp 8.75% 1/7/2019 1,700,940 0.28
USD 1,700,000 Lowe's Cos Inc 5.8% 15/4/2040 1,873,596 0.30
USD 1,565,000 Magellan Midstream Partners LP 4.25%
1/2/2021 1,613,801 0.26
USD 160,000 Marsh & McLennan Cos Inc 5.75%
15/9/2015 180,205 0.03
USD 2,330,000 MassMutual Global Funding II '144A'
2.875% 21/4/2014 2,422,785 0.39
USD 800,000 MetLife Capital Trust X '144A' 9.25%
8/4/2038 932,000 0.15
USD 2,000,000 MetLife Inc 6.75% 1/6/2016 2,333,662 0.38
USD 120,000 MetLife Inc 7.717% 15/2/2019 145,979 0.02
EUR 1,700,000 Metropolitan Life Global Funding I 4.625%
16/5/2017 2,590,987 0.42
GBP 1,850,000 Metropolitan Life Global Funding I 5.25%
9/1/2014 3,222,872 0.52
USD 450,000 Morgan Stanley 4.75% 1/4/2014 455,404 0.07
GBP 600,000 Morgan Stanley 5.375% 14/11/2013 1,004,097 0.16
USD 600,000 Morgan Stanley 5.55% 27/4/2017 614,370 0.10
USD 400,000 National Capital Trust II '144A' FRN
23/3/2015 (Perpetual) 375,962 0.06
USD 710,000 Newell Rubbermaid Inc 4.7% 15/8/2020 736,165 0.12
USD 855,000 NewPage Corp 11.375% 31/12/2014 * 743,850 0.12
USD 220,000 News America Inc 6.4% 15/12/2035 236,873 0.04
USD 2,000,000 News America Inc 6.9% 15/8/2039 2,267,333 0.37
USD 1,400,000 Niagara Mohawk Power Corp '144A'
3.553% 1/10/2014 1,481,755 0.24
USD 450,000 Norfolk Southern Corp 5.9% 15/6/2019 543,061 0.09
USD 1,500,000 Northwestern Mutual Life Insurance '144A'
6.063% 30/3/2040 1,675,513 0.27
USD 1,065,000 Omnicom Group Inc 4.45% 15/8/2020 1,099,001 0.18
USD 2,600,000 ONEOK Partners LP 6.125% 1/2/2041 2,773,586 0.45
USD 260,000 Pacific Gas & Electric Co 6.05% 1/3/2034 303,777 0.05
USD 600,000 Pacific Life Insurance Co '144A' 9.25%
15/6/2039 827,071 0.13
USD 1,650,000 Pennsylvania Electric Co 6.15% 1/10/2038 1,885,191 0.31
USD 2,400,000 Progress Energy Inc 5.625% 15/1/2016 2,766,983 0.45
USD 600,000 Prudential Financial Inc 3.875% 14/1/2015 621,429 0.10
USD 1,500,000 Prudential Financial Inc 7.375% 15/6/2019 1,791,192 0.29
USD 1,409,000 Qwest Communications International Inc
7.125% 1/4/2018 1,479,450 0.24
USD 396,000 Qwest Communications International Inc
Series B 7.5% 15/2/2014 401,940 0.07
USD 1,850,000 Rockies Express Pipeline LLC '144A' 3.9%
15/4/2015 1,906,266 0.31
USD 1,585,000 San Diego Gas & Electric Co 4.5%
15/8/2040 1,646,262 0.27
USD 290,000 San Diego Gas & Electric Co 5.35%
15/5/2040 339,053 0.06
USD 1,275,000 Sempra Energy 6.5% 1/6/2016 1,520,413 0.25
EUR 150,000 SLM Corp 3.125% 17/9/2012 215,150 0.04
USD 600,000 SLM Corp 6.25% 25/1/2016 603,011 0.10
USD 69,342 SLM Student Loan Trust '2008-5 A2' FRN
25/10/2016 70,012 0.01
USD 95,000 SLM Student Loan Trust '2008-5 A3' FRN
25/1/2018 97,004 0.02
USD 400,000 Southeast Supply Header LLC '144A'
4.85% 15/8/2014 429,998 0.07
USD 1,240,000 Southern California Edison Co 4.5%
1/9/2040 1,277,510 0.21
USD 1,845,000 Southern California Edison Co 5.5%
15/3/2040 2,184,407 0.35
USD 1,460,000 State of California 5.5% 1/3/2016 1,628,104 0.26
USD 955,000 State of California 6.2% 1/10/2019 1,085,396 0.18
EUR 780,000 Swiss Re Treasury US Corp 6% 18/5/2012 1,152,703 0.19
USD 920,000 TECO Finance Inc 5.15% 15/3/2020 1,031,053 0.17
USD 2,275,000 Teva Pharmaceutical Finance Co LLC
6.15% 1/2/2036 2,664,214 0.43
USD 745,000 Thermo Fisher Scientific Inc 3.6%
15/8/2021 756,755 0.12
USD 2,150,000 Time Warner Cable Inc 5% 1/2/2020 2,302,001 0.37
USD 820,000 Time Warner Cable Inc 7.5% 1/4/2014 937,720 0.15
USD 875,000 Time Warner Inc 6.2% 15/3/2040 947,215 0.15
USD 2,350,000 Trans-Allegheny Interstate Line Co '144A'
4% 15/1/2015 2,490,052 0.40
USD 900,000 Travelers Cos Inc/The 5.9% 2/6/2019 1,038,088 0.17
USD 1,550,000 UnitedHealth Group Inc 5.95% 15/2/2041 1,742,964 0.28
USD 590,000 Valero Energy Corp 4.5% 1/2/2015 638,917 0.10
USD 1,850,000 Valero Energy Corp 6.625% 15/6/2037 1,968,638 0.32
USD 330,000 Verizon Communications Inc 5.85%
15/9/2035 368,174 0.06
USD 500,000 Virginia Electric and Power Co 8.875%
15/11/2038 795,139 0.13
USD 380,000 Wachovia Bank NA 5.6% 15/3/2016 418,621 0.07
USD 300,000 Wal-Mart Stores Inc 7.55% 15/2/2030 ‡ 415,451 0.07
USD 281,000 Waste Management Inc 6.125%
30/11/2039 318,499 0.05
USD 100,000 Waste Management Inc 7.375% 11/3/2019 127,634 0.02
USD 750,000 WEA Finance LLC / WT Finance Aust Pty
Ltd '144A' 5.75% 2/9/2015 821,979 0.13
USD 2,000,000 WEA Finance LLC / WT Finance Aust Pty
Ltd 5.75% 2/9/2015 2,191,944 0.36
USD 2,850,000 WellPoint Inc 4.35% 15/8/2020 3,023,160 0.49
USD 1,700,000 Wells Fargo & Co 3.676% 15/6/2016 1,781,376 0.29
USD 660,000 Westpac Capital Trust III '144A' FRN
30/9/2013 (Perpetual) 643,082 0.10
USD 1,190,000 Yum! Brands Inc 3.875% 1/11/2020 1,203,097 0.20
Portfolio of Investments 31 August 2011
Transferable Securities Admitted to an Official Stock Exchange Listing or Dealt in on Another Regulated Market
Holding Description Value (USD) %
Transferable Securities Admitted to an Official Stock Exchange Listing or Dealt in on Another Regulated Market
Holding Description Value (USD) %

* Securities lent, see Note 11, for further details.‡ Securities given in guarantee, see Note 12, for further details.
142 BlackRock Global Funds (BGF)
Global Corporate Bond Fund continued
USD 1,000,000 ZFS Finance USA Trust II '144A' FRN
15/12/2065 990,000 0.16
EUR 500,000 Zurich Finance USA Inc 6.5%
14/10/2015 814,824 0.13
254,203,342 41.15
Total Bonds 559,829,675 90.63
Total Transferable Securities Admitted
to an Official Stock Exchange Listing or
Dealt in on Another Regulated Market 559,829,675 90.63
Unquoted Securities
BONDS
Canada CAD 1,350,000 Shaw Communications Inc 5.65%
1/10/2019 1,467,454 0.24
France USD 2,000,000 EDF SA '144A' 6.5% 26/1/2019 2,387,877 0.39
Ireland GBP 205,000 Lambay Capital Securities Plc (Defaulted)
6.25% 16/6/2015 (Perpetual) 6,690 0.00
Malaysia USD 745,000 Hong Leong Bank Bhd 3.75% 17/3/2016 767,238 0.12
United Kingdom EUR 600,000 Lehman Brothers UK Capital Funding III
LP (Defaulted) 3.875% 22/11/2011 – 0.00
United States USD 450,000 BAE Systems Holdings Inc 5.2%
15/8/2015 495,866 0.08
USD 1,150,000 Health Care Service Corp 4.7%
15/1/2021 1,263,960 0.21
EUR 270,000 Lehman Brothers Holdings Inc 4.75%
16/1/2014 83,833 0.01
EUR 1,100,000 Reynolds Group Issuer Inc 8.75%
15/10/2016 1,532,970 0.25
3,376,629 0.55
Total Bonds 8,005,888 1.30
Total Unquoted Securities 8,005,888 1.30
Total Portfolio 567,835,563 91.93
Other Net Assets 49,880,519 8.07
Total Net Assets (USD) 617,716,082 100.00
Portfolio of Investments 31 August 2011
Transferable Securities Admitted to an Official Stock Exchange Listing or Dealt in on Another Regulated Market
Holding Description Value (USD) %
Unquoted Securities
Holding Description Value (USD) %

Audited Annual Report and Accounts 143
The notes on pages 261 to 270 form an integral part of these financial statements.
Global Corporate Bond Fund continued
Note: The total market value of USD (667,000) of these transactions is included in the Statement of Net Assets (see Note 2c).
Nominal Value Description
Unrealisedprofit/(loss)
USD
Nominal Value Description
Unrealisedprofit/(loss)
USD
Swaps as at 31 August 2011
EUR 100,000 Credit Default Swaps (Barclays) (Fund receives default
protection on Svenska Cellulosa AktiebolAGet SCA
4.5% 15/7/2015; and pays Fixed 3.25%)
(20/12/2013) (8,082)
EUR 3,000,000 Credit Default Swaps (Credit Suisse) (Fund receives
default protection on iTraxx Europe Crossover
Series 14; and pays Fixed 5%) (20/12/2015) 261,340
EUR 850,000 Credit Default Swaps (Credit Suisse) (Fund receives
default protection on iTraxx Europe Crossover
Series 14; and pays Fixed 5%) (20/12/2015) 82,194
EUR 3,000,000 Credit Default Swaps (Credit Suisse) (Fund receives
default protection on iTraxx Europe Crossover
Series 14; and pays Fixed 5%) (20/12/2015) 280,544
EUR 3,000,000 Credit Default Swaps (Credit Suisse) (Fund receives
default protection on iTraxx Europe Crossover 14;
and pays Fixed 5%) (20/12/2015) 276,681
EUR 3,750,000 Credit Default Swaps (Credit Suisse) (Fund receives
default protection on Banco Espirito Santo SA
1.838% 19/1/2015; and pays Fixed 5%)
(20/6/2016) 538,291
USD (4,450,000) Credit Default Swaps (Credit Suisse) (Fund provides
default protection on Portugual (Republic of) 5.45%
23/9/2013; and receives Fixed 1%) (20/6/2016) (483,356)
EUR 3,600,000 Credit Default Swaps (Goldman Sachs) (Fund receives
default protection on Koninklijke DSM NV 4%
10/11/2015; and pays Fixed 1%) (20/6/2016) 66,522
EUR 3,175,000 Credit Default Swaps (Deutsche Bank) (Fund receives
default protection on Gas Natural Capital Markets
SA 4.5% 27/1/2020; and pays Fixed 1%)
(20/9/2016) 121,797
EUR (3,175,000) Credit Default Swaps (Deutsche Bank) (Fund provides
default protection on Telefonica SA 4.375%
2/2/2015; and receives Fixed 1%) (20/9/2016) (215,957)
EUR (1,800,000) Credit Default Swaps (Credit Suisse) (Fund provides
default protection on Lloyds TSB Bank Plc 6.375%
17/6/2016; and receives Fixed 1%) (20/9/2016) (86,091)
EUR (3,800,000) Credit Default Swaps (Deutsche Bank) (Fund provides
default protection on Vodafone Group Plc 5%
4/8/2016; and receives Fixed 1%) (20/9/2016) (35,309)
EUR 2,605,000 Credit Default Swaps (Morgan Stanley) (Fund receives
default protection on Iberdrola SA 3.5% 22/6/2015;
and pays Fixed 1%) (20/9/2016) 146,324
EUR (2,605,000) Credit Default Swaps (Morgan Stanley) (Fund provides
default protection on Telefonica SA 4.375%
2/2/2016; and receives Fixed 1%) (20/9/2016) (177,186)
EUR 2,150,000 Credit Default Swaps (Deutsche Bank) (Fund receives
default protection on British Telecom Plc 5.75%
7/12/2028; and pays Fixed 1%) (20/9/2016) 12,803
EUR 4,240,000 Credit Default Swaps (Deutsche Bank) (Fund receives
default protection on Diageo plc 5.5% 30/9/2018;
and pays Fixed 1%) (20/9/2016) (18,582)
EUR 1,600,000 Credit Default Swaps (Credit Suisse) (Fund receives
default protection on POSTNL NV 3.875%
1/6/2015; and pays Fixed 1%) (20/9/2016) 33,551
EUR (4,240,000) Credit Default Swaps (Deutsche Bank) (Fund provides
default protection on Heineken NV 5% 4/11/2013;
and receives Fixed 1%) (20/9/2016) (74,797)
EUR 2,674,000 Credit Default Swaps (Credit Suisse) (Fund receives
default protection on Xstrata Plc 5.25% 13/6/2017;
and pays Fixed 1%) (20/9/2016) 88,478
EUR (850,000) Credit Default Swaps (Deutsche Bank) (Fund provides
default protection on Glencore International AG
5.25% 11/10/2013; and receives Fixed 1%)
(20/9/2016) (44,142)
EUR (4,170,000) Credit Default Swaps (Deutsche Bank) (Fund provides
default protection on Swiss Reinsurance 4%
29/5/2015; and receives Fixed 1%) (20/9/2016) (56,238)
EUR 1,575,000 Credit Default Swaps (Deutsche Bank) (Fund receives
default protection on Royal Bank of Scotland Plc
6/12/2010; and pays Fixed 1%) (20/9/2016) 86,000
EUR (1,575,000) Credit Default Swaps (Deutsche Bank) (Fund provides
default protection on Lloyds TSB Bank Plc 3.375%
20/4/2015; and receives Fixed 1%) (20/9/2016) (75,330)
EUR (6,710,000) Credit Default Swaps (Royal Bank of Scotland) (Fund
provides default protection on Credit Suisse Group
AG 3.125% 14/9/2012; and receives Fixed 1%)
(20/9/2016) (267,234)
EUR (1,950,000) Credit Default Swaps (Credit Suisse) (Fund provides
default protection on Glencore International
AG 5.25% 11/1/2013; and receives Fixed 1%)
(20/9/2016) (110,297)
EUR 1,541,000 Credit Default Swaps (Deutsche Bank) (Fund receives
default protection on Electrolux AB 7/4/2016; and
pays Fixed 1%) (20/9/2016) 7,841
EUR 1,800,000 Credit Default Swaps (Credit Suisse) Fund receives
default protection on Royal Bank of Scotland Plc
4.25% 11/5/2016; and pays Fixed 1%) (20/9/2016) 98,286
EUR 2,150,000 Credit Default Swaps (Barclays) (Fund receives default
protection on British Telecom Plc 5.75% 7/12/2028;
and pays Fixed 1%) (20/9/2016) 1,211
EUR 3,800,000 Credit Default Swaps (Citibank) (Fund receives
default protection on Koninklijke KPN NV 8.375%
1/10/2030; and pays Fixed 1%) (20/9/2016) 105,993
EUR 4,170,000 Credit Default Swaps (Deutsche Bank) (Fund receives
default protection on Munich Re Finance BV; and
pays Fixed 1%) (20/9/2016) 16,303
EUR 1,525,000 Credit Default Swaps (Goldman Sachs) (Fund receives
default protection on Xstrata Plc 5.25% 13/6/2017;
and pays Fixed 1%) (20/9/2016) 50,459
EUR (3,165,000) Credit Default Swaps (Deutsche Bank) (Fund provides
default protection on Alstom SA 4% 23/9/2014;
and receives Fixed 1%) (20/9/2016) (123,816)
EUR 6,710,000 Credit Default Swaps (Goldman Sachs) (Fund receives
default protection on Standard Chartered Bank;
and pays Fixed 1%) (20/9/2016) 158,300
USD (1,450,000) Credit Default Swaps (Deutsche Bank) (Fund provides
default protection on Metlife Inc 5% 15/6/2015;
and receives Fixed 1%) (20/3/2018) (38,543)
USD 3,600,000 Interest Rate Swaps (Deutsche Bank) (Fund receives
Floating USD LIBOR 3 Month; and pays Fixed 3.29%)
(19/8/2041) (67,762)
550,196

144 BlackRock Global Funds (BGF)
Global Corporate Bond Fund continued
Open Futures Contractsas at 31 August 2011
Numberof contracts Contract/Description
Expirationdate
ValueUSD
282 Australian 10 Year Bond September 2011 231,091,836
81 Euro Schatz September 2011 12,799,569
46 Euro Bund September 2011 8,957,570
13 30 Year Euro-BUXL September 2011 2,182,290
(11) Japanese 10 Year Bond (TSE) September 2011 (20,424,881)
(45) Euro BOBL September 2011 (7,931,007)
(78) Australian 3 Year Bond September 2011 (22,575,146)
146 Canadian 10 Year Bond December 2011 19,524,524
31 US Long Bond (CBT) December 2011 4,478,531
11 US Treasury 2 Year Note (CBT) December 2011 2,425,500
(34) US Long Bond (CBT) December 2011 (4,656,937)
(94) Long Gilt December 2011 (19,487,501)
(107) Banker's Acceptance December 2011 (27,182,723)
(217) 90 Day Bank Bill December 2011 (53,763,840)
(251) US Treasury 5 Year Note (CBT) December 2011 (30,784,758)
(517) US Treasury 10 Year Note December 2011 (66,878,797)
(63) Banker's Acceptance June 2012 (16,012,873)
Total commitment 11,761,357
Note: The net unrealised gain of USD 1,508,259 attributed to these transactions is included
in the Statement of Net Assets (see Note 2c).
Open Forward Foreign Exchange Transactionsas at 31 August 2011
Purchases Sales Value date Unrealised
profit/(loss)
Unrealisedprofit/(loss)
USD Equivalent
Core Fund USD
USD 8,406,097 DKK 43,824,000 1/9/2011 (88,369) (88,369)
EUR 5,470,000 GBP 4,880,919 8/9/2011 (64,960) (64,960)
GBP 4,854,734 EUR 5,470,000 8/9/2011 22,236 22,236
JPY 458,405,000 USD 5,811,864 9/9/2011 166,619 166,619
USD 6,130,598 JPY 491,910,000 9/9/2011 (284,855) (284,855)
AUD 2,445,000 USD 2,560,130 7/10/2011 44,697 44,697
GBP 388,000 USD 630,494 7/10/2011 2,369 2,369
USD 4,260,293 AUD 4,073,500 7/10/2011 (79,488) (79,488)
USD 1,837,997 CAD 1,787,500 7/10/2011 2,757 2,757
USD 84,315,579 GBP 52,739,500 7/10/2011 (1,707,293) (1,707,293)
USD 717,828 JPY 55,215,000 7/10/2011 (2,445) (2,445)
USD 5,756,562 ZAR 39,906,100 7/10/2011 98,567 98,567
ZAR 39,906,100 USD 5,454,239 7/10/2011 203,757 203,757
SEK 80,687,235 EUR 8,765,000 14/10/2011 56,119 56,119
USD 130,499,705 EUR 91,036,500 26/10/2011 (888,110) (888,110)
USD 3,142,520 EUR 2,170,000 14/11/2011 11,374 11,374
AUD 6,055,000 USD 6,347,323 18/11/2011 71,785 71,785
USD 5,790,972 AUD 5,590,000 18/11/2011 (135,174) (135,174)
USD 8,444,998 DKK 43,360,000 1/12/2011 48,262 48,262
CNY 52,474,480 USD 8,230,000 13/2/2012 67,034 67,034
Net unrealised loss (2,455,118) (2,455,118)
EUR Hedged Share Class EUR
EUR 147,214,879 USD 208,923,922 14/9/2011 2,524,172 3,645,540
USD 5,834,352 EUR 4,074,169 14/9/2011 (33,576) (48,492)
Net unrealised profit 2,490,596 3,597,048
GBP Hedged Share Class GBP
GBP 212,046,457 USD 346,786,166 14/9/2011 (507,329) (827,886)
USD 8,957,031 GBP 5,497,008 14/9/2011 (7,023) (11,461)
Net unrealised loss (514,352) (839,347)
Total net unrealised profit 302,583
Note: The net unrealised gain attributed to these transactions is included in the Statement
of Net Assets (see Note 2c).

Audited Annual Report and Accounts 145
The notes on pages 261 to 270 form an integral part of these financial statements.
Global Dynamic Equity Fund
FUNDS
Cayman Islands 84,954 Dragon Capital - Vietnam Enterprise
Investments Ltd 152,067 0.01
513,140 Vinaland Ltd 386,138 0.04
538,205 0.05
United States 48,180 Consumer Staples Select Sector SPDR
Fund - ETF 1,492,135 0.13
121,894 Energy Select Sector SPDR Fund - ETF 8,448,473 0.72
44,500 ETFS Gold Trust - ETF 8,026,910 0.69
15,100 ETFS Physical Palladium Shares - ETF 1,170,250 0.10
12,900 ETFS Platinum Trust - ETF 2,358,120 0.20
48,229 Health Care Select Sector SPDR Fund - ETF 1,620,494 0.14
27,748 iShares Dow Jones US Telecommunications
Sector Index Fund - ETF 624,885 0.05
396,309 iShares Gold Trust - ETF 7,026,559 0.60
27,425 iShares Silver Trust - ETF 1,101,936 0.09
114,732 SPDR Gold Shares - ETF 20,281,176 1.73
6,000 Utilities Select Sector SPDR Fund - ETF 202,860 0.02
800 Vanguard Telecommunication Services - ETF 52,736 0.01
52,406,534 4.48
Total Funds 52,944,739 4.53
COMMON / PREFERRED STOCKS (SHARES) & WARRANTS
Argentina 6,600 Banco Macro SA ADR 'B' 181,038 0.02
17,800 Cresud SACIF y A ADR 254,006 0.02
19,900 IRSA Inversiones y Representaciones SA ADR 225,865 0.02
21,400 Pampa Energia SA ADR 266,002 0.02
7,000 Telecom Argentina SA ADR 162,750 0.01
1,089,661 0.09
Australia 471,500 Asciano Ltd 789,809 0.07
178,616 BHP Billiton Ltd 7,597,565 0.65
51,768 CSL Ltd 1,558,127 0.13
136,844 Newcrest Mining Ltd 5,895,462 0.50
25,800 Orica Ltd 648,126 0.06
56,575 Rio Tinto Ltd 4,391,456 0.38
260,867 Telstra Corp Ltd 846,034 0.07
18,800 Woodside Petroleum Ltd 707,913 0.06
22,434,492 1.92
Austria 29,280 Telekom Austria AG 326,862 0.03
Belgium 136,252 RHJ International 946,459 0.08
Bermuda 32,018 Arch Capital Group Ltd 1,080,607 0.09
5,639 Axis Capital Holdings Ltd 163,023 0.01
1,493 Bunge Ltd (Pref) 141,275 0.01
153,900 Cheung Kong Infrastructure Holdings Ltd 932,080 0.08
512,000 China Resources Gas Group Ltd 787,044 0.07
160,800 Cosan Ltd 'A' 1,870,104 0.16
27,778 Endurance Specialty Holdings Ltd 998,619 0.09
129,800 Freescale Semiconductor Holdings I Ltd 1,519,958 0.13
211,863 Katanga Mining Ltd 311,321 0.03
58,400 Marvell Technology Group Ltd † 784,896 0.07
264,715 Noble Group Ltd 356,591 0.03
6,155 PartnerRe Ltd 350,589 0.03
13,116 Platinum Underwriters Holdings Ltd 411,449 0.03
13,179 RenaissanceRe Holdings Ltd 857,558 0.07
19,599 Validus Holdings Ltd 504,870 0.04
92,200 VimpelCom Ltd ADR 1,040,016 0.09
12,110,000 1.03
Brazil 74,250 All America Latina Logistica SA 424,121 0.04
72,328 Cia Brasileira de Distribuicao Grupo Pao de
Acucar (Pref) 2,917,506 0.25
44,743 Cia Energetica de Minas Gerais ADR 845,195 0.07
143,700 Cyrela Brazil Realty SA Empreendimentos e
Participacoes 1,368,342 0.12
362,900 Hypermarcas SA 3,035,088 0.26
64,500 Itau Unibanco Holding SA (Pref) 1,171,497 0.10
168,600 MRV Engenharia e Participacoes 1,394,147 0.12
70,200 OGX Petroleo e Gas Participacoes SA 511,071 0.04
382,905 Petroleo Brasileiro SA ADR 10,135,495 0.87
111,800 Qualicorp SA 996,287 0.08
115,900 SLC Agricola SA 1,175,156 0.10
147,233 Telecomunicacoes de Sao Paulo SA ADR 4,642,257 0.40
34,700 Usinas Siderurgicas de Minas Gerais SA 'A'
(Pref) 263,987 0.02
108,400 Vale SA 'A' (Pref) 2,771,670 0.24
31,651,819 2.71
Canada 90,250 Alamos Gold Inc 1,747,209 0.15
132,900 Barrick Gold Corp 6,694,173 0.57
4,500 BCE Inc * 181,440 0.02
45,200 Brookfield Asset Management Inc 'A' 1,332,496 0.11
53,400 Canadian Natural Resources Ltd 2,024,394 0.17
45,067 Canadian Pacific Railway Ltd 2,661,818 0.23
12,630 Cenovus Energy Inc 453,535 0.04
161,010 Daylight Energy Ltd (Unit) * 1,283,900 0.11
15,200 Detour Gold Corp 551,985 0.05
206,366 Eldorado Gold Corp 4,054,552 0.35
164,547 Goldcorp Inc 'A' (Unit) 8,523,535 0.73
176,371 IAMGOLD Corp 3,655,528 0.31
302,515 Kinross Gold Corp 5,222,211 0.45
20,048 Kinross Gold Corp (Wts 3/9/2013) 26,163 0.00
3,900 Magna International Inc 'A' * 150,735 0.01
80,300 Osisko Mining Corp 1,189,040 0.10
17,590 Potash Corp of Saskatchewan Inc 1,047,660 0.09
35,200 Rogers Communications Inc 'B' * 1,367,196 0.12
74,800 Silver Wheaton Corp 2,974,796 0.25
75,900 Sino-Forest Corp 375,149 0.03
31,645 Suncor Energy Inc 1,021,386 0.09
53,420 Talisman Energy Inc 896,410 0.08
3,770 Teck Resources Ltd 'B' 169,386 0.01
12,120 TELUS Corp (Unit) * 667,052 0.06
17,800 Valeant Pharmaceuticals International Inc † 810,256 0.07
36,800 Viterra Inc 395,167 0.03
49,477,172 4.23
Cayman Islands 4,018,128 Chaoda Modern Agriculture Holdings Ltd * 1,304,418 0.11
191,800 Haitian International Holdings Ltd 178,180 0.02
8,900 Mindray Medical International Ltd ADR * 231,400 0.02
442,000 Mongolian Mining Corp 488,312 0.04
4,144,700 Tianjin Port Development Holdings Ltd 696,686 0.06
4,207,300 Yuanda China Holdings Ltd 631,629 0.05
484,100 Zhongsheng Group Holdings Ltd 818,696 0.07
4,349,321 0.37
Portfolio of Investments 31 August 2011
Transferable Securities Admitted to an Official Stock Exchange Listing or Dealt in on Another Regulated Market
Holding Description Value (USD) %
Transferable Securities Admitted to an Official Stock Exchange Listing or Dealt in on Another Regulated Market
Holding Description Value (USD) %

146 BlackRock Global Funds (BGF)
Global Dynamic Equity Fund continued
Chile 336,000 E.CL SA 899,528 0.07
14,300 Sociedad Quimica y Minera de Chile SA
ADR 'B' 906,620 0.08
1,806,148 0.15
China 990,400 China BlueChemical Ltd 'H' 779,011 0.07
15,981 China Life Insurance Co Ltd ADR 606,639 0.05
209,635 China Shenhua Energy Co Ltd 'H' 971,054 0.08
1,060,800 China Telecom Corp Ltd 'H' 692,825 0.06
334,500 CSR Corp Ltd 'H' 194,002 0.02
319,200 Dongfang Electric Corp Ltd 'H' 1,085,378 0.09
293,400 Dongfeng Motor Group Co Ltd 'H' 467,578 0.04
1,290,300 Guangshen Railway Co Ltd 'H' 470,199 0.04
699,901 Guangzhou Automobile Group Co Ltd 'H' 757,071 0.07
1,214,800 Huaneng Power International Inc 'H' 595,443 0.05
604,900 Jiangsu Expressway Co Ltd 'H' 505,285 0.04
69,317 Ping An Insurance Group Co of China Ltd 'H' 554,560 0.05
1,890,000 Shanghai Electric Group Co Ltd 'H' 865,770 0.07
400,300 Shanghai Pharmaceuticals Holding Co Ltd 'H' 832,095 0.07
537,700 Sinopharm Group Co Ltd 'H' 1,294,331 0.11
672,800 Xiamen International Port Co Ltd 'H' 102,732 0.01
10,773,973 0.92
Cyprus 39,400 AFI Development Plc 'B' 26,792 0.00
Czech Republic 26,500 CEZ AS 1,241,604 0.11
Egypt 345,042 Telecom Egypt 864,160 0.07
Finland 69,957 Fortum OYJ 1,881,155 0.16
France 8,500 Atos 425,953 0.04
17,420 BNP Paribas SA 893,205 0.08
40,556 Cie Generale d'Optique Essilor International SA 3,111,778 0.26
52,808 France Telecom SA * 1,018,491 0.09
114,600 GDF Suez 3,607,902 0.31
13,260 LVMH Moet Hennessy Louis Vuitton SA 2,255,809 0.19
32,160 Sanofi-Aventis SA 2,351,460 0.20
5,087 Sanofi-Aventis SA ADR 186,032 0.01
5,020 Technip SA 490,367 0.04
67,230 Total SA 3,297,193 0.28
52,400 Total SA ADR 2,569,172 0.22
80,310 Vivendi SA 1,944,405 0.17
22,151,767 1.89
Germany 7,945 Allianz SE 824,163 0.07
62,710 BASF SE 4,505,958 0.39
25,959 Bayer AG 1,685,387 0.15
9,010 Bayerische Motoren Werke AG 728,663 0.06
3,620 Beiersdorf AG 214,002 0.02
32,720 Daimler AG 1,766,071 0.15
20,250 Deutsche Bank AG 825,415 0.07
62,100 Deutsche Telekom AG 871,983 0.07
90,150 Infineon Technologies AG 771,639 0.07
27,020 Kabel Deutschland Holding AG 1,542,697 0.13
14,590 Lanxess AG 916,344 0.08
4,310 Muenchener Rueckversicherungs AG 562,677 0.05
25,190 Siemens AG 2,610,867 0.22
3,300 SMA Solar Technology AG * 344,084 0.03
20,606 Volkswagen AG (Pfd Non-Vtg) (Pref) 3,448,981 0.29
21,618,931 1.85
Guernsey 7,082 Amdocs Ltd 198,225 0.02
Hong Kong 200,000 AIA Group Ltd 701,875 0.06
641,270 Beijing Enterprises Holdings Ltd 3,093,863 0.26
81,300 Cheung Kong Holdings Ltd 1,140,205 0.10
399,200 China Mobile Ltd 4,046,597 0.35
482,000 China Resources Power Holdings Co Ltd 813,908 0.07
452,400 China Unicom Hong Kong Ltd 957,809 0.08
144,276 Hutchison Whampoa Ltd 1,381,963 0.12
832,680 Link REIT (Reit) 2,900,817 0.25
2,737,952 Tianjin Development Holdings Ltd 1,398,239 0.12
210,910 Wharf Holdings Ltd 1,342,305 0.11
17,777,581 1.52
India 116,600 Adani Enterprises Ltd 1,340,583 0.11
524,272 Adani Power Ltd 1,042,282 0.09
59,940 Bharat Heavy Electricals Ltd 2,301,735 0.20
4,380 Container Corp Of India 88,879 0.01
184,500 Housing Development Finance Corp 2,654,917 0.23
23,436 Larsen & Toubro Ltd 818,835 0.07
91,630 Reliance Industries Ltd 1,557,212 0.13
32,740 State Bank of India Ltd 1,403,305 0.12
11,207,748 0.96
Indonesia 4,613,669 Bumi Resources 1,365,231 0.11
527,200 Telekomunikasi Indonesia 'B' 447,931 0.04
1,813,162 0.15
Ireland 4,010 Accenture Plc 'A' 216,700 0.02
22,004 Covidien Plc 1,157,631 0.10
77,700 Seagate Technology Plc † 909,867 0.08
198,126 XL Group Plc 'A' 4,109,133 0.35
6,393,331 0.55
Israel 4,600 Check Point Software Technologies 252,126 0.02
84,940 Teva Pharmaceutical Industries Ltd ADR † 3,513,118 0.30
3,765,244 0.32
Italy 33,270 Assicurazioni Generali SpA 595,783 0.05
163,740 ENI SpA 3,284,510 0.28
343,615 Intesa Sanpaolo SpA 561,736 0.05
443,380 Telecom Italia SpA 539,461 0.05
4,981,490 0.43
Japan 29,910 Aisin Seiki Co Ltd 991,929 0.08
153,400 Asahi Kasei Corp 1,012,264 0.09
21,720 Astellas Pharma Inc * 815,208 0.07
54,940 Bank of Kyoto Ltd 492,224 0.04
49,200 Bridgestone Corp 1,087,559 0.09
61,539 Canon Inc 2,885,142 0.25
62,680 Daihatsu Motor Co Ltd 1,038,945 0.09
Portfolio of Investments 31 August 2011
Transferable Securities Admitted to an Official Stock Exchange Listing or Dealt in on Another Regulated Market
Holding Description Value (USD) %
Transferable Securities Admitted to an Official Stock Exchange Listing or Dealt in on Another Regulated Market
Holding Description Value (USD) %

Audited Annual Report and Accounts 147
The notes on pages 261 to 270 form an integral part of these financial statements.
Global Dynamic Equity Fund continued
65,050 Daiwa House Industry Co Ltd 800,824 0.07
40,370 Denso Corp 1,277,751 0.11
63,708 East Japan Railway Co 3,801,044 0.32
7,360 Fanuc Ltd 1,211,309 0.10
342,190 Fuji Heavy Industries Ltd 2,124,184 0.18
62,380 Futaba Industrial Co Ltd 425,466 0.04
50,400 Hitachi Chemical Co Ltd 868,263 0.07
141,800 Hitachi Ltd 763,738 0.07
77,752 Honda Motor Co Ltd 2,508,587 0.21
85,770 Hoya Corp 1,875,799 0.16
588 Inpex Corp 3,949,139 0.34
88,933 JGC Corp 2,501,675 0.21
26,100 JSR Corp 467,676 0.04
457 KDDI Corp 3,397,105 0.29
65,230 Kinden Corp 553,791 0.05
120,480 Kirin Holdings Co Ltd 1,593,202 0.14
38,500 Komatsu Ltd 1,016,725 0.09
292,846 Kubota Corp 2,390,735 0.20
84,700 Kuraray Co Ltd 1,207,317 0.10
110,060 Kyowa Hakko Kirin Co Ltd 1,142,511 0.10
206,100 Marubeni Corp 1,292,829 0.11
204,650 Mitsubishi Corp 4,876,050 0.42
45,100 Mitsubishi Tanabe Pharma Corp 756,372 0.06
318,590 Mitsubishi UFJ Financial Group Inc 1,429,251 0.12
242,482 Mitsui & Co Ltd 4,117,261 0.35
38,500 Mitsui Fudosan Co Ltd 643,675 0.06
113,150 Mitsui OSK Lines Ltd 475,147 0.04
105,960 Mitsui Sumitomo Insurance Group Holdings Inc 2,462,450 0.21
24,390 Murata Manufacturing Co Ltd 1,482,230 0.13
58,500 NGK Insulators Ltd 907,101 0.08
33 Nippon Building Fund Inc (Reit) 353,756 0.03
76,180 Nippon Electric Glass Co Ltd 766,966 0.07
54,470 Nippon Telegraph & Telephone Corp 2,525,311 0.22
296,480 Nksj Holdings Inc 1,736,039 0.15
3,382 NTT DoCoMo Inc * 6,113,004 0.52
350 NTT Urban Development Corp 265,193 0.02
221,810 Okumura Corp 838,874 0.07
14,000 Rinnai Corp 1,082,681 0.09
17,210 Rohm Co Ltd 882,046 0.08
186,750 Sekisui House Ltd 1,670,716 0.14
9,826 Seven & I Holdings Co Ltd 258,592 0.02
67,473 Shin-Etsu Chemical Co Ltd 3,387,729 0.29
50,990 Shionogi & Co Ltd 817,250 0.07
40,900 Sony Financial Holdings Inc 641,663 0.05
731,670 Sumitomo Chemical Co Ltd 3,043,854 0.26
66,900 Sumitomo Electric Industries Ltd 885,544 0.08
36,080 Sumitomo Mitsui Financial Group Inc * 1,061,038 0.09
171,911 Suzuki Motor Corp 3,506,374 0.30
18,940 TDK Corp 824,982 0.07
16,800 Terumo Corp 879,656 0.08
216,800 Toda Corp 788,826 0.07
37,100 Toho Co Ltd/Tokyo 635,267 0.05
163,881 Tokio Marine Holdings Inc 4,430,429 0.38
442,547 Tokyo Gas Co Ltd 2,025,743 0.17
88,374 Toyota Industries Corp 2,484,798 0.21
43,130 Toyota Motor Corp 1,537,786 0.13
439,700 Ube Industries Ltd 1,376,213 0.12
30,300 West Japan Railway Co 1,254,597 0.11
2,500 Yahoo Japan Corp 804,317 0.07
13,300 Yamada Denki Co Ltd 969,575 0.08
108,491,297 9.27
Jersey 115,600 Glencore International Plc 799,510 0.07
27,000 Randgold Resources Ltd ADR 2,863,350 0.24
102,000 Vallares Plc 1,629,433 0.14
5,292,293 0.45
Kazakhstan 116,200 KazMunaiGas Exploration Production GDR 1,969,590 0.17
Luxembourg 4,400 Millicom International Cellular SA 498,021 0.04
4,315 Tenaris SA ADR 142,740 0.01
640,761 0.05
Malaysia 508,600 Axiata Group Bhd 804,759 0.07
38,700 British American Tobacco Malaysia Bhd 566,425 0.05
178,140 IOI Corp 269,331 0.02
958,436 PLUS Expressways Bhd 1,397,655 0.12
509,500 Telekom Malaysia Bhd 708,827 0.06
2,446,009 YTL Power International Bhd 1,541,571 0.13
5,288,568 0.45
Mexico 79,716 America Movil SAB de CV ADR 'L' 1,972,174 0.17
9,500 Fomento Economico Mexicano SAB
de CV ADR 648,755 0.05
2,620,929 0.22
Netherlands 21,000 ASML Holding NV 746,657 0.06
5,300 CNH Global NV 179,405 0.01
53,910 ING Groep NV 467,593 0.04
76,906 Koninklijke Philips Electronics NV 1,627,089 0.14
5,200 LyondellBasell Industries NV 'A' 181,688 0.02
34,230 Unilever NV 1,158,472 0.10
12,800 Unilever NV (NY Shares) 433,152 0.04
4,794,056 0.41
Netherlands Antilles 70,447 Schlumberger Ltd 5,530,794 0.47
Norway 76,910 DnB NOR ASA 924,437 0.08
76,120 Statoil ASA 1,827,039 0.15
32,900 Telenor ASA 552,461 0.05
3,303,937 0.28
Panama 86,926 McDermott International Inc 1,255,211 0.11
Philippines 12,000 Philippine Long Distance Telephone Co ADR 687,600 0.06
Poland 2,400 Powszechny Zaklad Ubezpieczen SA 295,293 0.03
Portugal 126,400 Zon Multimedia Servicos de Telecomunicacoes
e Multimedia SGPS SA 469,678 0.04
Portfolio of Investments 31 August 2011
Transferable Securities Admitted to an Official Stock Exchange Listing or Dealt in on Another Regulated Market
Holding Description Value (USD) %
Transferable Securities Admitted to an Official Stock Exchange Listing or Dealt in on Another Regulated Market
Holding Description Value (USD) %

148 BlackRock Global Funds (BGF)
Global Dynamic Equity Fund continued
Russian Federation 5,972,177 Federal Hydrogenerating Co JSC 260,846 0.02
657,328 Federal Hydrogenerating Co JSC ADR 2,898,159 0.25
1,610,646 Kuzbassrazrezugol 522,655 0.05
210,000 LSR Group GDR 1,068,900 0.09
120,100 Magnitogorsk Iron & Steel Works GDR 960,199 0.08
41,941 MMC Norilsk Nickel OJSC ADR 1,054,816 0.09
117,328 Novorossiysk Commercial Sea Port PJSC GDR 844,762 0.07
223,200 Rosneft Oil Co GDR 1,768,860 0.15
1,308,700 Sberbank of Russia 3,830,475 0.33
2,900 Uralkali GDR 144,478 0.01
13,354,150 1.14
Singapore 631,350 CapitaLand Ltd 1,375,462 0.12
68,710 DBS Group Holdings Ltd 757,030 0.07
317,600 Fraser and Neave Ltd 1,558,151 0.13
407,000 Global Logistic Properties Ltd 565,182 0.05
270,930 Keppel Corp Ltd 2,095,160 0.18
361,510 MobileOne Ltd 754,521 0.06
289,000 Oversea-Chinese Banking Corp Ltd 2,102,728 0.18
279,000 Raffles Medical Group Ltd 508,072 0.04
164,000 SembCorp Marine Ltd 555,029 0.05
160,200 Singapore Press Holdings Ltd 506,201 0.04
847,575 Singapore Telecommunications Ltd 2,191,874 0.19
38,100 United Overseas Bank Ltd 587,687 0.05
13,557,097 1.16
South Africa 7,500 AngloGold Ashanti Ltd ADR 334,350 0.03
98,000 Harmony Gold Mining Co Ltd ADR 1,309,280 0.11
288,300 Life Healthcare Group Holdings Ltd 720,722 0.06
5,300 Sasol Ltd 254,188 0.02
2,618,540 0.22
South Korea 9,600 Cheil Industries Inc 871,050 0.07
8,400 Hyundai Motor Co 1,598,350 0.13
5,700 KT Corp 196,349 0.02
68,980 KT Corp ADR 1,183,007 0.10
23,077 KT&G Corp 1,488,211 0.13
13,600 LG Corp 799,288 0.07
16,100 LG Display Co Ltd 315,405 0.03
1,800 Mando Corp 312,977 0.03
2,400 POSCO 909,969 0.08
10,210 POSCO ADR 970,358 0.08
4,600 Samsung Electronics Co Ltd 3,207,949 0.27
12,000 Samsung Fine Chemicals Co Ltd 581,525 0.05
6,320 SK Telecom Co Ltd 918,217 0.08
13,352,655 1.14
Spain 112,934 Banco Santander SA 1,024,394 0.09
45,480 Repsol YPF SA 1,314,260 0.11
131,873 Telefonica SA 2,755,739 0.24
22,100 Telefonica SA ADR 462,995 0.04
5,557,388 0.48
Switzerland 62,456 ACE Ltd 4,015,296 0.34
15,400 Cie Financiere Richemont SA 'A' 888,849 0.08
6,600 Garmin Ltd 224,202 0.02
83,674 Nestle SA 5,153,422 0.44
4,700 Noble Corp 159,471 0.02
43,971 Novartis AG 2,560,267 0.22
12,040 Roche Holding AG 2,088,789 0.18
3,650 Swisscom AG 1,641,957 0.14
12,188 TE Connectivity Ltd 383,556 0.03
32,158 Transocean Ltd 1,794,095 0.15
12,125 Tyco International Ltd 508,886 0.04
74,470 UBS AG 1,075,710 0.09
47,350 UBS AG (Pref) 986,893 0.09
61,710 Weatherford International Ltd 1,059,561 0.09
4,967 Zurich Financial Services AG 1,112,583 0.10
23,653,537 2.03
Taiwan 49,201 Asustek Computer Inc 415,528 0.04
56,300 Catcher Technology Co Ltd 441,519 0.04
307,500 Cheng Shin Rubber Industry Co Ltd 713,378 0.06
332,156 Chunghwa Telecom Co Ltd 1,143,846 0.10
64,920 Chunghwa Telecom Co Ltd ADR 2,265,059 0.19
449,344 Delta Electronics Inc 1,316,612 0.11
547,000 Far Eastone Telecommunications 874,913 0.07
166,000 Formosa Chemicals & Fibre Corp 504,131 0.04
234,929 Hon Hai Precision Industry Co Ltd 593,609 0.05
89,525 HTC Corp 2,333,060 0.20
53,071 MediaTek Inc 533,280 0.05
200,000 Nan Ya Plastics Corp 476,396 0.04
536,288 Taiwan Semiconductor Manufacturing Co Ltd 1,282,972 0.11
455,000 Yulon Motor Co Ltd 1,025,767 0.09
13,920,070 1.19
Thailand 364,900 Hana Microelectronics PCL 272,731 0.02
434,015 PTT Chemical PCL 1,976,745 0.17
111,226 PTT PCL 1,221,000 0.11
384,605 Siam Commercial Bank PCL 1,527,127 0.13
4,997,603 0.43
Turkey 30,200 BIM Birlesik Magazalar AS 966,734 0.08
37,142 Tupras Turkiye Petrol Rafinerileri AS 702,564 0.06
200,411 Turk Telekomunikasyon AS 914,482 0.08
90,634 Turkcell Iletisim Hizmetleri AS 401,961 0.04
270,412 Turkiye Garanti Bankasi AS 985,231 0.08
3,970,972 0.34
United Kingdom 50,900 Amlin Plc 254,862 0.02
46,100 Anglo American Plc 1,930,239 0.16
114,300 Antofagasta Plc 2,508,546 0.21
3,700 AstraZeneca Plc ADR 175,861 0.01
269,300 BG Group Plc 5,822,451 0.50
298,623 BP Plc 1,961,051 0.17
61,400 BP Plc ADR 2,427,756 0.21
23,468 British American Tobacco Plc 1,041,594 0.09
27,700 British Sky Broadcasting Group Plc 298,317 0.03
729,400 BT Group Plc 2,055,473 0.18
47,315 Diageo Plc ADR 3,799,868 0.32
4,137 Ensco Plc ADR 200,603 0.02
5,300 GlaxoSmithKline Plc ADR 227,264 0.02
1,126,951 Guinness Peat Group Plc 655,288 0.06
417,935 HSBC Holdings Plc 3,632,663 0.31
29,500 HSBC Holdings Plc (Pref) 786,765 0.07
439,100 International Power Plc 2,413,177 0.21
1,399,204 Lloyds Banking Group Plc 759,604 0.06
335,600 National Grid Plc 3,395,215 0.29
Portfolio of Investments 31 August 2011
Transferable Securities Admitted to an Official Stock Exchange Listing or Dealt in on Another Regulated Market
Holding Description Value (USD) %
Transferable Securities Admitted to an Official Stock Exchange Listing or Dealt in on Another Regulated Market
Holding Description Value (USD) %

Audited Annual Report and Accounts 149
The notes on pages 261 to 270 form an integral part of these financial statements.
Global Dynamic Equity Fund continued
18,922 Petropavlovsk Plc 270,165 0.02
27,300 Rio Tinto Plc 1,686,095 0.14
29,614 Royal Dutch Shell Plc ADR 'A' 1,987,692 0.17
131,400 Scottish & Southern Energy Plc 2,774,491 0.24
39,487 Standard Chartered Plc 895,295 0.08
22,722 Unilever Plc 761,554 0.07
14,200 Unilever Plc ADR 477,830 0.04
1,011,811 Vodafone Group Plc 2,691,167 0.23
67,817 Vodafone Group Plc ADR 1,808,679 0.15
47,699,565 4.08
United States 26,472 3M Co 2,194,794 0.19
67,666 Abbott Laboratories 3,516,602 0.30
237,800 Activision Blizzard Inc † 2,822,686 0.24
26,500 Adobe Systems Inc 680,785 0.06
172,727 AES Corp/The † 1,868,906 0.16
82,082 Aetna Inc 3,365,362 0.29
4,600 Aflac Inc 174,432 0.01
47,800 Agilent Technologies Inc 1,796,802 0.15
3,600 Albemarle Corp 187,560 0.02
209,000 Alcoa Inc 2,687,740 0.23
9,000 Allergan Inc/United States 736,200 0.06
12,512 Alliance Resource Partners LP (Unit) 926,826 0.08
17,133 Allstate Corp/The 450,598 0.04
5,600 Altera Corp 206,192 0.02
65,323 Altria Group Inc 1,779,399 0.15
137,300 American Eagle Outfitters Inc † 1,503,435 0.13
30,297 American Electric Power Co Inc 1,170,373 0.10
38,772 American Tower Corp 'A' 2,089,035 0.18
32,776 American Water Works Co Inc 968,859 0.08
3,600 Ameriprise Financial Inc 165,348 0.01
38,549 AmerisourceBergen Corp 'A' 1,538,105 0.13
32,341 Amgen Inc 1,792,823 0.15
35,699 Anadarko Petroleum Corp 2,673,498 0.23
5,300 Analog Devices Inc 176,914 0.02
30,954 Apache Corp 3,239,955 0.28
50,200 Apple Inc 19,564,948 1.67
5,000 Arrow Electronics Inc 160,300 0.01
327,799 AT&T Inc 9,781,522 0.84
5,200 Autodesk Inc 147,784 0.01
2,700 Autoliv Inc 152,523 0.01
15,600 Baker Hughes Inc 953,472 0.08
5,900 Ball Corp 213,167 0.02
446,301 Bank of America Corp 3,677,520 0.31
159,772 Bank of New York Mellon Corp/The 3,358,407 0.29
3,600 Baxter International Inc 202,752 0.02
2,500 Becton Dickinson and Co 204,050 0.02
3,100 Biogen Idec Inc 291,772 0.03
5,012 BMC Software Inc 204,941 0.02
52,515 Boeing Co/The 3,506,427 0.30
12,900 BorgWarner Inc 940,023 0.08
364,162 Bristol-Myers Squibb Co 10,775,554 0.92
25,633 Broadcom Corp 'A' 920,994 0.08
129,277 CA Inc 2,729,037 0.23
94,100 Calpine Corp † 1,377,624 0.12
3,900 Capital One Financial Corp 180,219 0.02
5,187 Cardinal Health Inc 222,626 0.02
15,225 Celgene Corp 914,718 0.08
60,687 CenturyTel Inc 2,185,946 0.19
16,200 Cephalon Inc † 1,306,854 0.11
112,500 Chevron Corp 11,184,750 0.96
27,927 Chubb Corp 1,729,519 0.15
31,603 CIGNA Corp 1,516,944 0.13
2,200 Cimarex Energy Co 154,726 0.01
384,040 Cisco Systems Inc † 6,088,954 0.52
207,558 Citigroup Inc 6,498,641 0.56
51,581 CMS Energy Corp 1,009,440 0.09
4,600 CNA Financial Corp 111,642 0.01
3,600 Coach Inc 203,940 0.02
19,720 Coca-Cola Co 1,386,513 0.12
7,800 Coca-Cola Enterprises Inc 214,968 0.02
7,588 Cognizant Technology Solutions Corp 'A' 482,597 0.04
33,202 Colgate-Palmolive Co † 3,014,742 0.26
199,227 Comcast Corp 'A' 4,341,156 0.37
31,753 Complete Production Services Inc 950,050 0.08
6,931 Computer Sciences Corp 215,000 0.02
19,482 ConAgra Foods Inc 479,062 0.04
70,887 ConocoPhillips 4,853,633 0.41
155,523 Consol Energy Inc 7,183,607 0.61
20,200 Consolidated Edison Inc 1,138,876 0.10
23,293 Constellation Brands Inc 'A' 460,503 0.04
4,300 Constellation Energy Group Inc 165,163 0.01
390,283 Corning Inc † 5,885,468 0.50
6,000 Coventry Health Care Inc 202,980 0.02
21,709 Crown Holdings Inc 776,097 0.07
71,016 CVS Caremark Corp 2,558,706 0.22
20,030 DaVita Inc 1,498,444 0.13
145,493 Dell Inc † 2,175,120 0.19
41,091 Devon Energy Corp 2,790,079 0.24
21,634 DISH Network Corp 'A' 513,158 0.04
22,000 Dominion Resources Inc/VA 1,075,580 0.09
75,171 Dow Chemical Co/The 2,182,214 0.19
13,559 Dr Pepper Snapple Group Inc 521,479 0.04
2,500 Eastman Chemical Co 210,500 0.02
3,800 Eaton Corp 166,820 0.01
38,141 eBay Inc 1,191,525 0.10
5,200 Edison International 193,180 0.02
51,913 EI du Pont de Nemours & Co 2,526,087 0.22
372,190 El Paso Corp † 7,179,545 0.61
70,891 Electronic Arts Inc 1,609,226 0.14
31,984 Eli Lilly & Co 1,199,400 0.10
111,950 EMC Corp/Massachusetts † 2,521,114 0.22
17,728 Entergy Corp 1,150,547 0.10
16,100 EOG Resources Inc † 1,510,341 0.13
47,402 Exelon Corp 2,043,026 0.17
5,637 Expedia Inc 171,421 0.01
248,045 Exxon Mobil Corp ‡ 18,528,962 1.58
114,465 Fidelity National Financial Inc 'A' 1,951,628 0.17
4,065 Fidelity National Information Services Inc 114,999 0.01
3,300 Fluor Corp 203,709 0.02
54,660 FMC Corp 4,157,986 0.36
198,500 Ford Motor Co 2,215,260 0.19
114,033 Ford Motor Co (Call Wts 1/1/2013) 358,064 0.03
9,647 Forest Laboratories Inc 333,207 0.03
53,628 Freeport-McMoRan Copper & Gold Inc 2,581,116 0.22
551,434 General Electric Co 9,065,575 0.77
60,291 General Mills Inc 2,283,823 0.20
92,700 General Motors Co 2,264,661 0.19
46,635 Gilead Sciences Inc 1,864,934 0.16
171,216 Global Industries Ltd 748,214 0.06
32,985 Goldman Sachs Group Inc 3,812,736 0.33
14,246 Google Inc 'A' 7,763,358 0.66
75,677 Halliburton Co 3,370,654 0.29
3,817 Harris Corp 155,963 0.01
70,500 HCA Holdings Inc 1,397,310 0.12
39,932 Healthsouth Corp 850,552 0.07
3,500 Helmerich & Payne Inc 202,265 0.02
35,404 Hess Corp 2,106,892 0.18
127,834 Hewlett-Packard Co 3,354,364 0.29
13,971 HJ Heinz Co 734,595 0.06
96,850 Hologic Inc 1,629,985 0.14
Portfolio of Investments 31 August 2011
Transferable Securities Admitted to an Official Stock Exchange Listing or Dealt in on Another Regulated Market
Holding Description Value (USD) %
Transferable Securities Admitted to an Official Stock Exchange Listing or Dealt in on Another Regulated Market
Holding Description Value (USD) %

150 BlackRock Global Funds (BGF)
Global Dynamic Equity Fund continued
Portfolio of Investments 31 August 2011
27,002 Humana Inc 2,119,927 0.18
4,477 Huntington Ingalls Industries Inc 138,295 0.01
192,118 Intel Corp † 3,904,798 0.33
73,658 International Business Machines Corp 12,670,649 1.08
61,619 International Game Technology 964,337 0.08
25,716 International Paper Co 702,561 0.06
4,319 Intuit Inc 212,970 0.02
11,300 ITC Holdings Corp 864,224 0.07
155,865 Johnson & Johnson 10,291,766 0.88
31,900 Johnson Controls Inc 1,033,241 0.09
198,905 JPMorgan Chase & Co 7,514,631 0.64
51,724 KBR Inc 1,595,685 0.14
3,600 Kinetic Concepts Inc 243,900 0.02
4,600 KLA-Tencor Corp 171,442 0.01
108,777 Kraft Foods Inc 'A' † 3,803,932 0.33
9,400 Kroger Co/The 219,490 0.02
4,100 Lam Research Corp 154,939 0.01
5,800 Lear Corp 277,994 0.02
6,000 Leucadia National Corp 179,400 0.02
12,397 Lexmark International Inc 'A' 395,464 0.03
5,500 Liberty Global Inc 'A' 219,065 0.02
34,457 Life Technologies Corp 1,451,846 0.12
7,100 Lincoln National Corp 149,810 0.01
9,561 Lorillard Inc 1,068,729 0.09
6,888 Ltd Brands Inc 263,466 0.02
1,900 Lubrizol Corp 256,044 0.02
5,800 Macy's Inc 154,222 0.01
70,947 Marathon Oil Corp 1,916,988 0.16
51,923 Marathon Petroleum Corp 1,907,132 0.16
4,100 Mastercard Inc 'A' † 1,370,261 0.12
51,083 Mattel Inc 1,393,544 0.12
22,018 McDonald's Corp 2,000,335 0.17
5,600 McGraw-Hill Cos Inc/The 239,008 0.02
25,265 McKesson Corp 2,020,442 0.17
48,225 Mead Johnson Nutrition Co † 3,423,010 0.29
6,850 MeadWestvaco Corp 189,677 0.02
35,687 Medco Health Solutions Inc 1,995,974 0.17
84,700 Medtronic Inc 2,966,194 0.25
177,138 Merck & Co Inc 5,863,268 0.50
14,578 MetLife Inc 492,299 0.04
36,700 MetroPCS Communications Inc 416,912 0.04
5,976 Mettler-Toledo International Inc 938,232 0.08
545,429 Microsoft Corp 14,430,415 1.23
4,316 Molson Coors Brewing Co 'B' 189,127 0.02
99,965 Morgan Stanley 1,725,396 0.15
49,900 Motorola Mobility Holdings Inc † 1,887,717 0.16
22,359 Motorola Solutions Inc 949,587 0.08
3,000 Murphy Oil Corp 161,910 0.01
86,208 Mylan Inc/PA 1,781,911 0.15
60,622 National Oilwell Varco Inc 4,099,260 0.35
107,472 Newmont Mining Corp 6,750,316 0.58
61,670 NextEra Energy Inc 3,489,289 0.30
3,950 NII Holdings Inc 150,870 0.01
17,500 Northern Trust Corp 679,700 0.06
24,266 Northrop Grumman Corp 1,339,726 0.11
44,450 NRG Energy Inc † 1,024,128 0.09
70,892 Occidental Petroleum Corp 6,250,548 0.53
5,000 Oceaneering International Inc 215,200 0.02
330,735 Oracle Corp † 9,376,337 0.80
40,900 PACCAR Inc 1,593,055 0.14
10,360 Pall Corp 539,652 0.05
2,400 Parker Hannifin Corp 177,672 0.02
37,055 PerkinElmer Inc 856,712 0.07
17,900 Perrigo Co 1,712,135 0.15
431,634 Pfizer Inc 8,235,577 0.70
33,820 PG&E Corp 1,427,542 0.12
46,312 Philip Morris International Inc 3,255,734 0.28
78,348 Polycom Inc † 1,910,124 0.16
2,200 PPG Industries Inc 170,082 0.01
68,687 PPL Corp 1,964,448 0.17
17,150 PPL Corp (Pref) 976,864 0.08
9,208 Praxair Inc 914,999 0.08
12,881 Precision Castparts Corp 2,164,523 0.19
15,616 Principal Financial Group Inc 398,833 0.03
61,238 Procter & Gamble Co 3,902,698 0.33
36,729 Progressive Corp/The 698,218 0.06
172,500 Pulte Group Inc 846,975 0.07
68,400 QEP Resources Inc 2,417,940 0.21
135,833 QUALCOMM Inc 7,055,845 0.60
178,600 Quicksilver Resources Inc 1,716,346 0.15
1,800 Ralph Lauren Corp 'A' 248,436 0.02
36,054 Raytheon Co 1,560,057 0.13
3,500 Reinsurance Group of America Inc 'A' 186,585 0.02
2,300 Ross Stores Inc 176,548 0.02
3,800 Ryder System Inc 180,272 0.02
33,065 SanDisk Corp † 1,238,284 0.11
160,284 Sara Lee Corp † 2,931,594 0.25
10,600 Sempra Energy 554,698 0.05
9,300 Simon Property Group Inc (Reit) 1,087,170 0.09
30,917 SM Energy Co † 2,372,880 0.20
77,750 Southern Co † 3,205,633 0.27
80,190 Spirit Aerosystems Holdings Inc 'A' 1,353,607 0.12
279,308 St Joe Co/The 5,164,405 0.44
55,662 State Street Corp 1,986,020 0.17
18,100 SunTrust Banks Inc 361,095 0.03
102,946 Symantec Corp † 1,770,774 0.15
5,937 Teradata Corp 309,555 0.03
60,467 Texas Instruments Inc 1,596,933 0.14
32,840 Thermo Fisher Scientific Inc 1,819,664 0.16
10,085 Time Warner Cable Inc 668,837 0.06
20,196 Time Warner Inc 641,223 0.05
4,900 Torchmark Corp 187,572 0.02
60,917 Travelers Cos Inc/The 3,073,263 0.26
3,800 TRW Automotive Holdings Corp 163,514 0.01
66,334 Union Pacific Corp 6,253,306 0.53
38,238 United Technologies Corp † 2,872,439 0.25
46,274 UnitedHealth Group Inc 2,239,199 0.19
4,609 Unum Group 109,648 0.01
5,600 Urban Outfitters Inc 146,888 0.01
135,672 US Bancorp 3,174,725 0.27
74,730 Valero Energy Corp 1,697,866 0.15
42,100 Vanguard Health Systems Inc 551,510 0.05
6,216 VeriSign Inc 194,996 0.02
148,330 Verizon Communications Inc 5,425,911 0.46
27,340 Viacom Inc 'B' 1,323,529 0.11
22,200 Visa Inc 'A' 1,964,700 0.17
4,900 Walgreen Co 175,616 0.02
96,699 Wal-Mart Stores Inc 5,141,486 0.44
50,600 Walt Disney Co/The 1,733,556 0.15
21,290 Waters Corp 1,728,535 0.15
59,259 WellPoint Inc 3,840,576 0.33
185,052 Wells Fargo & Co 4,798,398 0.41
33,415 Western Digital Corp † 994,096 0.09
9,800 Western Union Co/The 162,876 0.01
50,400 Whiting Petroleum Corp † 2,398,032 0.21
6,100 Williams Cos Inc/The 167,628 0.01
16,114 Wisconsin Energy Corp 508,558 0.04
4,600 Wyndham Worldwide Corp 148,856 0.01
182,853 Xerox Corp 1,514,023 0.13
527,672,790 45.10
Total Common / Preferred Stocks (Shares)
& Warrants 1,039,881,471 88.88
Transferable Securities Admitted to an Official Stock Exchange Listing or Dealt in on Another Regulated Market
Holding Description Value (USD) %
Transferable Securities Admitted to an Official Stock Exchange Listing or Dealt in on Another Regulated Market
Holding Description Value (USD) %

* Securities lent, see Note 11, for further details.† Securities pledged, see Note 12, for further details.‡ Securities given in guarantee, see Note 12, for further details.
Audited Annual Report and Accounts 151
The notes on pages 261 to 270 form an integral part of these financial statements.
Global Dynamic Equity Fund continued
Portfolio of Investments 31 August 2011
BONDS
Canada USD 1,293,000 Sino-Forest Corp '144A' 5% 1/8/2013 407,295 0.04
Cayman Islands USD 600,000 China Milk Products Group Ltd 0%
5/1/2012 (Zero Coupon) 150,000 0.01
Malaysia USD 950,000 IOI Capital Bhd 0% 18/12/2011
(Zero Coupon) 1,077,300 0.09
Singapore USD 1,500,000 Olam International Ltd 6% 15/10/2016 1,888,125 0.16
USD 900,000 Wilmar International Ltd 0% 18/12/2012
(Zero Coupon) 1,137,848 0.10
SGD 1,000,000 Yanlord Land Group Ltd 5.85%
13/7/2014 823,213 0.07
3,849,186 0.33
United Kingdom EUR 1,427,000 LBG Capital No.2 Plc 15% 21/12/2019 2,408,570 0.21
USD 300,000 Petropavlovsk 2010 Ltd 4% 18/2/2015 298,875 0.02
2,707,445 0.23
United States USD 6,045,000 United States Treasury Bill 0% 20/10/2011
(Zero Coupon) 6,044,912 0.52
USD 36,205,000 United States Treasury Bill 0% 27/10/2011
(Zero Coupon) 36,204,457 3.09
USD 9,075,000 United States Treasury Bill 0% 15/12/2011
(Zero Coupon) 9,074,719 0.78
USD 5,400,000 United States Treasury Bill 0% 12/1/2012
(Zero Coupon) 5,399,749 0.46
USD 2,325,000 United States Treasury Bill 0% 2/2/2012
(Zero Coupon) 2,324,845 0.20
USD 2,380,000 United States Treasury Bill 0% 9/2/2012
(Zero Coupon) 2,379,781 0.20
USD 4,385,400 United States Treasury Note/Bond
0.625% 31/7/2012 4,406,299 0.38
65,834,762 5.63
Total Bonds 74,025,988 6.33
Total Transferable Securities Admitted
to an Official Stock Exchange Listing or
Dealt in on Another Regulated Market 1,166,852,198 99.74
COMMON STOCKS (SHARES)
Jersey 771,728 Polyus Gold International Ltd 2,762,786 0.23
Russian Federation 20,028 Rushydro Jsc Rub Shares
(C/a Specific Line) 972 0.00
200 Uralkali 8,820 0.00
9,792 0.00
United States 87,733 Comverse Technology Inc 601,849 0.05
Total Common Stocks (Shares) 3,374,427 0.28
BONDS
Cayman Islands CNY 5,600,000 FU JI Food and Catering Services Holdings
Ltd (Defaulted) 0% 18/10/2010
(Zero Coupon) 131,699 0.01
India USD 1,215,000 REI Agro Ltd 5.5% 13/11/2014 1,244,681 0.11
Total Bonds 1,376,380 0.12
Total Unquoted Securities 4,750,807 0.40
Total Portfolio 1,171,603,005 100.14
Other Net Liabilities (1,612,978) (0.14)
Total Net Assets (USD) 1,169,990,028 100.00
Transferable Securities Admitted to an Official Stock Exchange Listing or Dealt in on Another Regulated Market
Holding Description Value (USD) %
Unquoted Securities
Holding Description Value (USD) %

152 BlackRock Global Funds (BGF)
Global Dynamic Equity Fund continued
Note: The total market value of USD (518,452) of these transactions is included in the Statement of Net Assets (see Note 2c).
Nominal Value Description
UnrealisedlossUSD
Nominal Value Description
UnrealisedlossUSD
Swaps as at 31 August 2011
USD 19,093 Total Return Swap (BNP Paribas) (Fund receives
MSCI AC World ex US TR Net + 0bps,
and pays 3M Libor + 8bps) (16/9/2011) (246,647)
USD 5,673 Total Return Swap (BNP Paribas) (Fund receives
MSCI Daily TR Net Emerging Markets + 0bps,
and pays 3M Libor + 38bps) (11/1/2012) (271,805)
(518,452)
Open Futures Contractsas at 31 August 2011
Numberof contracts Contract/Description
Expirationdate
ValueUSD
40 TOPIX Index September 2011 4,037,558
32 S&P 500 September 2011 9,800,000
Total commitment 13,837,558
Note: The net unrealised loss of USD 454,729 attributed to these transactions is included
in the Statement of Net Assets (see Note 2c).
Sector Breakdownas at 31 August 2011
% of netassets
Energy 13.85
Information Technology 12.98
Financials 11.10
Materials 10.70
Healthcare 9.83
Industrials 8.07
Telecommunication Services 6.89
Consumer Staples 6.05
Consumer Discretionary 5.76
US Government 5.63
Utilities 4.64
Investment Funds 4.53
Diversified 0.11
Other Net Liabilities (0.14)
100.00
Purchased Call Options as at 31 August 2011
Number of contracts
subjectto Call Issuer
Unrealisedprofit/(loss)
USD ValueUSD
694 Wells Fargo Call Option
strike price USD 28
expiring on 22/10/2011 (31,246) 46,498
252 SPDR Gold Trust Call Option
strike price USD 160
expiring on 22/10/2011 393,823 466,830
419 SPDR Gold Trust Call Option
strike price USD 195
expiring on 17/12/2011 17,605 196,930
419 SPDR Gold Trust Call Option
strike price USD 205
expiring on 17/12/2011 6,095 130,938
41,000 MXEUG Call Option
strike price USD 104.71
expiring on 15/6/2012 (295,610) 20,090
19,106 MXEUG Call Option
strike price USD 102.9
expiring on 15/6/2012 (134,217) 17,164
54,805 MXEUG Call Option
strike price USD 99.429
expiring on 12/7/2012 (310,826) 56,368
8,867 TWSE Call Option
strike price USD 9,047.4608
expiring on 19/9/2012 (122,972) 61,837
5,883 TWSE Call Option
strike price USD 9,041.74
expiring on 19/9/2012 (77,074) 33,502
5,916 TWSE Call Option
strike price USD 8,818.9307
expiring on 20/3/2013 (72,714) 79,324
5,940 TWSE Call Option
strike price USD 8,807.55
expiring on 19/6/2013 (98,618) 84,809
4,666 TWSE Call Option
strike price USD 8,646.243
expiring on 18/9/2013 (46,237) 41,427
2,970 TWSE Call Option
strike price USD 8,807.55
expiring on 18/9/2013 (45,500) 35,403
9,319 TWSE Call Option
strike price USD 8,646.11
expiring on 18/12/2013 (88,819) 97,994
Total Purchased Call Options (906,310) 1,369,114
Note: Purchased Call Options are included in the Statement of Net Assets (see Note 2c).

Audited Annual Report and Accounts 153
The notes on pages 261 to 270 form an integral part of these financial statements.
Global Dynamic Equity Fund continued
Written Call Options as at 31 August 2011
Number of contracts
subjectto Call Issuer
Unrealisedprofit/(loss)
USD ValueUSD
(3,300) PCG Call Option
strike price USD 43
expiring on 20/1/2012 (1,296) (5,200)
(5,600) URBN Call Option
strike price USD 34
expiring on 20/1/2012 12,666 (3,441)
(52,589) Kraft Call Option
strike price USD 34
expiring on 20/1/2012 (52,733) (105,405)
(18) Southern Co. Call Option
strike price USD 42
expiring on 21/1/2012 (637) (2,475)
(57) AES Call Option
strike price USD 11
expiring on 21/1/2012 (2,020) (5,130)
(58) NRG Energy Call Option
strike price USD 24
expiring on 21/1/2012 (2,205) (8,410)
(71) El Paso Call Option
strike price USD 19
expiring on 21/1/2012 (4,333) (14,768)
(77) Cephalon Call Option
strike price USD 65
expiring on 21/1/2012 (85,895) (124,355)
(83) EOG Call Option
strike price USD 100
expiring on 21/1/2012 11,161 (48,763)
(85) Calpine Call Option
strike price USD 15
expiring on 21/1/2012 (5,187) (11,050)
(98) Valeant Pharmaceuticals International
Call Option
strike price USD 50
expiring on 21/1/2012 26,163 (37,730)
(111) Colgate-Palmolive Call Option
strike price USD 92.5
expiring on 21/1/2012 (10,604) (43,845)
(162) Whiting Call Option
strike price USD 55
expiring on 21/1/2012 44,386 (52,650)
(188) United Technology Call Option
strike price USD 80
expiring on 21/1/2012 41,555 (54,896)
(190) Polycom Call Option
strike price USD 32.5
expiring on 21/1/2012 39,150 (11,400)
(231) West Digital Call Option
strike price USD 40
expiring on 21/1/2012 68,515 (12,821)
(263) Seagate Technology Call Option
strike price USD 17.5
expiring on 21/1/2012 35,630 (3,551)
(386) Intel Corp Call Option
strike price USD 24
expiring on 21/1/2012 24,429 (10,422)
(470) Cisco Systems Call Option
strike price USD 17.5
expiring on 21/1/2012 58,976 (26,555)
(504) Kraft Call Option
strike price USD 35
expiring on 21/1/2012 (25,450) (74,844)
Spread Options as at 31 August 2011
Number of contracts
subjectto Call/Put Issuer
ValueUSD
885,250 MSCI Europe ex UK Call/Put Option
- USD 96.02/USD 89.97
expiring on 16/9/2011 (53,204)
1,254,769 MSCI Europe ex UK Call/Put Option
- USD 96.02/USD 96.02
expiring on 16/9/2011 (147,310)
221,456 MSCI EM Call/Put Option
- USD 1,128.89/USD 1,128.89
expiring on 14/12/2011 (252,914)
178,700 MSCI EAFE Call/Put Option
- USD 1,621.56/USD 1,621.56
expiring on 16/12/2011 (231,399)
588,400 TAIEX Index Link Call/Put Option
- USD 301.94/USD 252.72
expiring on 19/12/2011 (96,219)
816,000 TAIEX Index Link Call/Put Option
- TWD 9,000/TWD 8,400
expiring on 21/12/2011 (238,919)
446,034 S&P 500 Index Call/Put Option
- USD 1,379.67/USD 1,131.30
expiring on 16/3/2012 (218,269)
578,000 TAIEX Index Link Call/Put Option
- USD 290.81/USD 234.41
expiring on 19/12/2012 (120,519)
Total Spread Options (1,358,753)
Note: Spread Options are included in the Statement of Net Assets. The unrealised profit/(loss)
is equal to the market value (see Note 2c).
Written Call Options as at 31 August 2011
Number of contracts
subjectto Call Issuer
Unrealisedprofit/(loss)
USD ValueUSD
(155) Motorola Call Option
strike price USD 27
expiring on 17/9/2011 (153,144) (168,175)
(153,190) HK Call Option
strike price HKD 17.2368
expiring on 28/9/2011 4,228 (7,709)
(34) Mastercard Inc Call Option
strike price USD 285
expiring on 22/10/2011 (134,064) (184,450)
(204) SanDisk Call Option
strike price USD 46
expiring on 22/10/2011 97,915 (9,588)
(153,190) HK Call Option
strike price HKD 17.556
expiring on 28/10/2011 207 (11,101)
(177) NIKKEI Call Option
strike price USD 10,996.49
expiring on 18/11/2011 17,316 (1,003)
(188) NIKKEI Call Option
strike price USD 11,019.32
expiring on 18/11/2011 18,235 (499)
(101) SM Energy Call Option
strike price USD 90
expiring on 19/11/2011 3,989 (22,977)
(197) Mead Call Option
strike price USD 75
expiring on 19/11/2011 8,238 (40,385)

154 BlackRock Global Funds (BGF)
Global Dynamic Equity Fund continued
Written Call Options as at 31 August 2011
Number of contracts
subjectto Call Issuer
Unrealisedprofit/(loss)
USD ValueUSD
(563) Marvell Technology Group Call Option
strike price USD 17.5
expiring on 21/1/2012 83,877 (16,327)
(570) Syamant Call Option
strike price USD 17.5
expiring on 21/1/2012 11,726 (81,510)
(1,602) Sarah Lee Call Option
strike price USD 19
expiring on 21/1/2012 7,170 (148,185)
(123) AES Call Option
strike price USD 12
expiring on 18/2/2012 (1,023) (7,072)
(1,373) American Call Option
strike price USD 15
expiring on 18/2/2012 120,529 (27,460)
(3,620) BEI Call Option
strike price EUR 48
expiring on 16/3/2012 6,383 (4,301)
(72) NRG Energy Call Option
strike price USD 24
expiring on 17/3/2012 (3,638) (13,320)
(34,230) UNA Call Option
strike price EUR 26
expiring on 15/6/2012 3,858 (29,949)
(54,805) MXEUG Call Option
strike price USD 113.846
expiring on 12/7/2012 57,297 (2,989)
(200) Teva Pharmaceutical Industries
Call Option
strike price USD 47.5
expiring on 19/1/2013 14,294 (59,100)
(216) EMC Corp/Massachusetts
Call Option
strike price USD 25
expiring on 19/1/2013 210 (53,136)
(243) Activis Call Option
strike price USD 12.5
expiring on 19/1/2013 (4,259) (33,655)
(292) Dell Call Option
strike price USD 15
expiring on 19/1/2013 (9,057) (76,212)
(319) Corning Call Option
strike price USD 15
expiring on 19/1/2013 (2,401) (85,333)
(517) Oracle Call Option
strike price USD 30
expiring on 19/1/2013 (41,957) (195,168)
(537) Cisco Systems Call Option
strike price USD 20
expiring on 19/1/2013 6,699 (52,357)
(1,447) Corning Call Option
strike price USD 17.5
expiring on 19/1/2013 (3,716) (240,925)
Total Written Call Options 281,183 (2,230,597)
Note: Written Call Options are included in the Statement of Net Assets (see Note 2c).
Written Put Options as at 31 August 2011
Number of contracts
subjectto Put Issuer
Unrealisedprofit/(loss)
USD ValueUSD
(48) KBR Inc Put Option
strike price USD 36
expiring on 17/9/2011 (12,027) (26,640)
(318) Urban Put Option
strike price USD 27
expiring on 17/9/2011 2,405 (47,700)
(300) SPDR Gold Trust Put Option
strike price USD 120
expiring on 30/9/2011 55,794 (2,400)
(34) Mastercard Inc Put Option
strike price USD 220
expiring on 22/10/2011 16,952 (4,199)
(694) Wells Fargo Put Option
strike price USD 24
expiring on 22/10/2011 7,617 (68,706)
(47) KOSPI Put Option
strike price USD 208
expiring on 8/12/2011 24,016 (15,061)
(1,740) SPX Put Option
strike price USD 988.5652
expiring on 8/12/2011 94,981 (33,827)
(10,234) BEI Put Option
strike price EUR 38
expiring on 16/12/2011 19,360 (13,818)
(29,400) TT Put Option
strike price USD 857.1429
expiring on 4/1/2012 (65,755) (149,646)
(5,848) BEI Put Option
strike price EUR 38
expiring on 20/1/2012 10,309 (9,824)
(71) Timewarner Put Option
strike price USD 60
expiring on 21/1/2012 (2,849) (20,412)
(199) SPDR Gold Trust Put Option
strike price USD 105
expiring on 21/1/2012 50,194 (2,090)
(14,100) SLE Put Option
strike price USD 15
expiring on 16/3/2012 5,998 (8,156)
(43,794) AEO Put Option
strike price USD 11.75
expiring on 16/3/2012 (46,047) (90,024)
(108,801) AEO Put Option
strike price USD 12
expiring on 16/3/2012 (140,697) (241,096)
(386) Urban Put Option
strike price USD 20
expiring on 17/3/2012 2,708 (44,390)
(19,106) MXEUG Put Option
strike price USD 98.1152
expiring on 15/6/2012 (193,206) (344,588)
(41,000) MXEUG Put Option
strike price USD 99.84
expiring on 15/6/2012 (461,250) (776,950)
(54,805) MXEUG Put Option
strike price USD 92.966
expiring on 12/7/2012 (448,354) (755,262)

Audited Annual Report and Accounts 155
The notes on pages 261 to 270 form an integral part of these financial statements.
Global Dynamic Equity Fund continued
Written Put Options as at 31 August 2011
Number of contracts
subjectto Put Issuer
Unrealisedprofit/(loss)
USD ValueUSD
(5,883) TWSE Put Option
strike price USD 7,608.62
expiring on 19/9/2012 (100,881) (211,456)
(8,867) TWSE Put Option
strike price USD 7,758.1976
expiring on 19/9/2012 (140,808) (325,617)
(5,916) TWSE Put Option
strike price USD 7,557.8236
expiring on 20/3/2013 (82,357) (234,396)
(5,940) TWSE Put Option
strike price USD 7,574.49
expiring on 19/6/2013 (77,038) (260,466)
(2,828) TWSE Put Option
strike price USD 7,176.382
expiring on 18/9/2013 (34,101) (121,769)
(2,970) TWSE Put Option
strike price USD 6,957.96
expiring on 18/9/2013 (33,574) (114,476)
(5,648) TWSE Put Option
strike price USD 7,180.59
expiring on 18/12/2013 (77,489) (264,306)
Total Written Put Options (1,626,099) (4,187,275)
Note: Written Put Options are included in the Statement of Net Assets (see Note 2c).
Purchased Put Options as at 31 August 2011
Number of contracts
subjectto Put Issuer
UnrealisedlossUSD
ValueUSD
300 SPDR Gold Trust Put Option
strike price USD 132
expiring on 30/9/2011 (161,554) 1,350
94 KOSPI 200 Put Option
strike price USD 230.7075
expiring on 8/12/2011 (63,828) 64,589
252 SPDR Gold Trust Put Option
strike price USD 165
expiring on 17/12/2011 (62,948) 126,630
203 SPDR Gold Trust Put Option
strike price USD 125
expiring on 21/1/2012 (174,531) 7,207
Total Purchased Put Options (462,861) 199,776
Note: Purchased Put Options are included in the Statement of Net Assets (see Note 2c).
Open Forward Foreign Exchange Transactionsas at 31 August 2011
Purchases Sales Value date Unrealised
profit/(loss)
Unrealisedprofit/(loss)
USD Equivalent
Core Fund USD
USD 12,176 MYR 36,450 2/9/2011 (43) (43)
AUD 6,788,405 USD 7,000,000 12/9/2011 256,133 256,133
CAD 7,702,093 USD 7,808,000 12/9/2011 104,578 104,578
CHF 15,743,179 USD 20,766,351 12/9/2011 (1,224,221) (1,224,221)
EUR 4,322,394 USD 6,199,698 12/9/2011 41,714 41,714
JPY 1,552,218,790 USD 20,028,164 12/9/2011 216,230 216,230
USD 1,435,000 CHF 1,173,361 12/9/2011 (21,502) (21,502)
USD 1,428,000 JPY 109,564,156 12/9/2011 (961) (961)
Net unrealised loss (628,072) (628,072)
EUR Hedged Share Class EUR
EUR 49,057,970 USD 69,761,938 14/9/2011 744,192 1,074,801
USD 8,428,886 EUR 5,903,767 14/9/2011 (66,325) (95,790)
Net unrealised profit 677,867 979,011
Total net unrealised profit 350,939
Note: The net unrealised profit attributed to these transactions is included in the Statement
of Net Assets (see Note 2c).

156 BlackRock Global Funds (BGF)
Global Enhanced Equity Yield Fund
COMMON / PREFERRED STOCKS (SHARES)
Australia 88,001 AMP Ltd 426,690 0.18
32,718 Australia & New Zealand Banking Group Ltd 710,551 0.29
32,396 Commonwealth Bank of Australia 1,672,033 0.68
32,714 Leighton Holdings Ltd 710,113 0.29
31,749 National Australia Bank Ltd 806,067 0.33
33,333 OZ Minerals Ltd 421,000 0.17
43,570 QBE Insurance Group Ltd 658,489 0.27
579,586 TABCORP Holdings Ltd * 1,743,213 0.71
158,811 Telstra Corp Ltd 515,050 0.21
169,014 Transurban Group 935,275 0.38
63,463 Westpac Banking Corp 1,399,310 0.57
9,997,791 4.08
Austria 51,274 Telekom Austria AG 572,388 0.23
Bermuda 149,652 Esprit Holdings Ltd 419,572 0.17
74,319 Orient Overseas International Ltd 366,664 0.15
26,694 Seadrill Ltd 868,077 0.36
1,654,313 0.68
Canada 33,032 ARC Resources Ltd (Unit) * 813,277 0.33
11,949 Bank of Montreal 744,573 0.30
11,200 Bank of Nova Scotia 622,748 0.25
10,204 Baytex Energy Corp * 524,792 0.22
9,351 Canadian Imperial Bank of Commerce/Canada 727,684 0.30
21,146 Cenovus Energy Inc 759,438 0.31
42,521 CI Financial Corp (Unit) 881,305 0.36
28,361 Crescent Point Energy Corp * 1,287,258 0.53
25,280 Enerplus Corp 739,693 0.30
1 Enerplus Corp (Unit) 29 0.00
11,732 Goldcorp Inc 'A' (Unit) 607,718 0.25
40,308 Pengrowth Energy Corp 463,945 0.19
23,830 Penn West Petroleum Ltd 447,527 0.18
74,628 Penn West Petroleum Ltd (Unit) * 1,401,828 0.57
126,894 Provident Energy Ltd 1,110,323 0.45
34,137 Sun Life Financial Inc * 930,284 0.38
12,062,422 4.92
Finland 163,896 Nokia OYJ 1,072,211 0.44
18,307 Sampo OYJ 'A' 526,383 0.21
1,598,594 0.65
France 35,930 AXA SA 575,962 0.23
43,891 Credit Agricole SA 424,555 0.17
40,509 France Telecom SA * 781,284 0.32
40,588 GDF Suez 1,277,815 0.52
8,096 Neopost SA 590,907 0.24
33,170 Societe Television Francaise 527,168 0.22
27,881 Total SA 1,367,381 0.56
23,146 Veolia Environnement SA 385,239 0.16
55,250 Vivendi SA 1,337,672 0.55
7,267,983 2.97
Germany 6,866 Allianz SE 712,235 0.29
19,020 BASF SE 1,366,661 0.56
9,735 Daimler AG 525,449 0.21
20,836 Deutsche Lufthansa AG 351,757 0.14
64,136 Deutsche Post AG 982,722 0.40
38,005 Deutsche Telekom AG 534,032 0.22
28,896 E.ON AG 629,710 0.26
20,818 ProSiebenSat.1 Media AG (Pref) 418,587 0.17
19,138 RWE AG 713,204 0.29
6,379 Siemens AG 661,164 0.27
6,895,521 2.81
Greece 45,344 OPAP SA 555,957 0.23
Hong Kong 195,847 Cathay Pacific Airways Ltd 394,036 0.16
59,693 Hang Seng Bank Ltd 878,535 0.36
32,166 Hong Kong Exchanges and Clearing Ltd 601,765 0.25
1,874,336 0.77
Ireland 7,631 Accenture Plc 'A' 412,379 0.17
15,059 Covidien Plc 792,254 0.32
87,761 Seagate Technology Plc 1,027,681 0.42
2,232,314 0.91
Italy 44,767 ENI SpA 897,995 0.37
46,690 Exor SpA 1,111,881 0.45
234,607 Mediaset SpA 910,040 0.37
2,919,916 1.19
Japan 47,945 Alfresa Holdings Corp 1,882,035 0.77
17,630 Astellas Pharma Inc 661,700 0.27
11,992 Canon Inc 562,223 0.23
35,421 Daiichi Sankyo Co Ltd 703,523 0.29
2,798 Fanuc Ltd 460,495 0.19
21,743 Honda Motor Co Ltd 701,515 0.29
86,281 Isuzu Motors Ltd 383,696 0.16
142 Japan Tobacco Inc 608,333 0.25
28,015 Kao Corp 739,833 0.30
97,138 Mitsubishi Heavy Industries Ltd 409,175 0.17
98,151 Mitsubishi UFJ Financial Group Inc 440,323 0.18
23,107 Mitsui & Co Ltd 392,349 0.16
7,393 Murata Manufacturing Co Ltd 449,288 0.18
4,093 Nintendo Co Ltd 715,261 0.29
66,544 Nissan Motor Co Ltd 604,866 0.25
8,675 Nitto Denko Corp 335,212 0.14
91 Nomura Real Estate Office Fund Inc (Reit) 582,694 0.24
38,295 Ricoh Co Ltd 344,595 0.14
8,039 Sankyo Co Ltd 409,918 0.17
41,099 Seven & I Holdings Co Ltd 1,081,609 0.44
247 Seven Bank Ltd 476,734 0.19
18,567 Sony Corp 403,157 0.16
30,721 Sumitomo Mitsui Financial Group Inc 903,441 0.37
17,253 Suzuken Co Ltd 418,725 0.17
26,563 T&D Holdings Inc 543,523 0.22
18,048 Takeda Pharmaceutical Co Ltd 869,684 0.35
144,959 Toshiba Corp 625,736 0.25
22,264 Toyota Motor Corp 793,815 0.32
17,503,458 7.14
Portfolio of Investments 31 August 2011
Transferable Securities Admitted to an Official Stock Exchange Listing or Dealt in on Another Regulated Market
Holding Description Value (USD) %
Transferable Securities Admitted to an Official Stock Exchange Listing or Dealt in on Another Regulated Market
Holding Description Value (USD) %

Audited Annual Report and Accounts 157
The notes on pages 261 to 270 form an integral part of these financial statements.
Global Enhanced Equity Yield Fund continued
Netherlands 16,898 European Aeronautic Defence and Space Co NV 536,385 0.22
14,290 Koninklijke Boskalis Westminster NV 488,167 0.20
38,540 Koninklijke Philips Electronics NV 815,385 0.33
112,521 PostNL NV 664,291 0.27
2,504,228 1.02
Netherlands Antilles 14,135 Schlumberger Ltd ^ 1,109,739 0.45
Norway 35,362 Statoil ASA 848,762 0.35
Portugal 82,453 Portugal Telecom SGPS SA 697,779 0.28
Spain 51,713 Banco Bilbao Vizcaya Argentaria SA 463,399 0.19
82,280 Banco Santander SA 746,340 0.30
4,098 CaixaBank 21,157 0.01
57,999 Telefonica SA 1,212,000 0.50
2,442,896 1.00
Sweden 19,775 Atlas Copco 'A' 447,653 0.18
28,289 Boliden AB 394,995 0.16
38,152 Hennes & Mauritz AB 'B' 1,190,091 0.49
36,536 Industrivarden AB 'C' 459,968 0.19
27,781 Skanska AB 'B' 423,863 0.17
2,916,570 1.19
Switzerland 33,995 ABB Ltd 730,252 0.30
20,619 Nestle SA 1,269,910 0.52
21,157 Nobel Biocare Holding AG 269,378 0.11
32,035 Novartis AG 1,865,278 0.76
4,387 Roche Holding AG 761,089 0.31
150 TE Connectivity Ltd 4,721 0.00
5,766 Zurich Financial Services AG 1,291,555 0.53
6,192,183 2.53
United Kingdom 10,817 Anglo American Plc 452,915 0.18
42,009 Antofagasta Plc 921,973 0.38
28,694 AstraZeneca Plc 1,365,079 0.56
104,237 Aviva Plc 576,261 0.23
20,562 BHP Billiton Plc 705,599 0.29
54,698 BP Plc 359,200 0.15
35,462 British American Tobacco Plc 1,573,931 0.64
37,506 Eurasian Natural Resources Corp Plc 419,835 0.17
32,260 Fresnillo Plc 1,100,708 0.45
38,368 GlaxoSmithKline Plc 822,969 0.34
240,316 Home Retail Group Plc 493,699 0.20
149,408 HSBC Holdings Plc 1,301,142 0.53
334,263 Man Group Plc 1,227,226 0.50
11,667 Rio Tinto Plc 720,574 0.29
53,857 Royal Dutch Shell Plc 'A' 1,806,837 0.74
26,589 Royal Dutch Shell Plc 'B' 895,282 0.36
55,753 Scottish & Southern Energy Plc 1,177,216 0.48
21,349 Standard Chartered Plc 484,049 0.20
47,723 United Utilities Group Plc 468,011 0.19
457,000 Vodafone Group Plc 1,215,507 0.50
22,211 Xstrata Plc 394,322 0.16
18,482,335 7.54
United States 11,850 3M Co ^ 982,483 0.40
23,767 Abbott Laboratories ^ 1,235,171 0.50
15,719 Aflac Inc ^ 596,064 0.24
10,704 Air Products & Chemicals Inc ^ 893,356 0.36
42,381 Alcoa Inc 545,020 0.22
75,763 Altria Group Inc ^ 2,063,784 0.84
3,793 Amazon.com Inc 809,806 0.33
106,860 American Capital Agency Corp (Reit) ^ 3,083,445 1.26
174,153 Annaly Capital Management Inc (Reit) 3,146,945 1.28
7,794 Apple Inc ^ 3,037,634 1.24
134,125 Ares Capital Corp 2,036,353 0.83
28,690 AT&T Inc ^ 856,110 0.35
7,033 Autoliv Inc 397,294 0.16
17,308 Automatic Data Processing Inc ^ 869,035 0.35
3,257 AvalonBay Communities Inc (Reit) 440,184 0.18
11,598 Avery Dennison Corp 339,705 0.14
6,053 Baker Hughes Inc 369,959 0.15
9,317 Bank of Hawaii Corp 383,954 0.16
39,380 Bristol-Myers Squibb Co ^ 1,165,254 0.48
17,507 Caterpillar Inc ^ 1,632,353 0.67
19,490 CBS Corp 'B' 498,164 0.20
36,118 CenterPoint Energy Inc 719,471 0.29
29,788 CenturyTel Inc ^ 1,072,964 0.44
24,913 Chevron Corp ^ 2,476,850 1.01
47,587 Cisco Systems Inc 754,492 0.31
7,329 Coach Inc 415,188 0.17
22,410 Coca-Cola Co ^ 1,575,647 0.64
16,971 Comcast Corp 'A' 369,798 0.15
13,605 ConocoPhillips ^ 931,534 0.38
24,708 Dow Chemical Co/The 717,273 0.29
35,328 EI du Pont de Nemours & Co 1,719,060 0.70
38,914 Eli Lilly & Co 1,459,275 0.60
16,205 EMC Corp/Massachusetts 364,937 0.15
25,989 Emerson Electric Co ^ 1,226,161 0.50
50,535 Exxon Mobil Corp ^ 3,774,964 1.54
49,820 Ford Motor Co 555,991 0.23
16,188 Freeport-McMoRan Copper & Gold Inc 779,128 0.32
200,741 Frontier Communications Corp 'B' 1,509,572 0.62
115,572 General Electric Co ^ 1,900,004 0.78
2,943 Google Inc 'A' ^ 1,603,788 0.65
11,971 Halliburton Co 533,188 0.22
19,427 HCP Inc (Reit) 717,245 0.29
38,557 Home Depot Inc ^ 1,303,612 0.53
10,161 Honeywell International Inc 489,963 0.20
59,326 Intel Corp 1,205,801 0.49
8,858 International Business Machines Corp ^ 1,523,753 0.62
16,922 International Paper Co 462,309 0.19
11,852 Johnson & Johnson 782,588 0.32
13,367 Johnson Controls Inc 432,957 0.18
39,339 JPMorgan Chase & Co ^ 1,486,227 0.61
25,414 Kraft Foods Inc 'A' 888,728 0.36
24,211 Leggett & Platt Inc 533,126 0.22
20,420 Liberty Property Trust (Reit) 684,683 0.28
21,655 Linear Technology Corp 620,632 0.25
5,668 Lorillard Inc 633,569 0.26
5,431 M&T Bank Corp 413,788 0.17
37,391 Maxim Integrated Products Inc 871,584 0.36
36,681 MeadWestvaco Corp 1,015,697 0.41
42,221 Merck & Co Inc 1,397,515 0.57
36,182 Microchip Technology Inc 1,197,986 0.49
65,302 Microsoft Corp 1,727,695 0.70
5,502 Monsanto Co 385,140 0.16
38,459 New York Community Bancorp Inc 499,198 0.20
7,522 Norfolk Southern Corp 514,204 0.21
Portfolio of Investments 31 August 2011
Transferable Securities Admitted to an Official Stock Exchange Listing or Dealt in on Another Regulated Market
Holding Description Value (USD) %
Transferable Securities Admitted to an Official Stock Exchange Listing or Dealt in on Another Regulated Market
Holding Description Value (USD) %

* Securities lent, see Note 11, for further details.^ Securities pledged, see Note 12, for further details.
158 BlackRock Global Funds (BGF)
Global Enhanced Equity Yield Fund continued
26,890 Nucor Corp 980,141 0.40
29,766 NYSE Euronext 814,100 0.33
7,447 Occidental Petroleum Corp 656,602 0.27
42,638 Old Republic International Corp 428,938 0.18
36,686 Oracle Corp 1,040,048 0.42
41,136 Paychex Inc 1,113,552 0.45
17,643 PepsiCo Inc/NC ^ 1,140,444 0.47
95,282 Pfizer Inc ^ 1,817,981 0.74
21,853 Philip Morris International Inc 1,536,266 0.63
55,488 Pitney Bowes Inc 1,126,406 0.46
27,007 Procter & Gamble Co ^ 1,721,156 0.70
15,972 Progress Energy Inc 775,281 0.32
15,704 QUALCOMM Inc 815,744 0.33
21,442 Regency Centers Corp (Reit) ^ 900,135 0.37
22,271 Reynolds American Inc 836,944 0.34
46,483 RR Donnelley & Sons Co 692,132 0.28
28,950 Southern Co 1,193,608 0.49
39,380 Spectra Energy Corp 1,023,880 0.42
9,586 Stanley Black & Decker Inc 602,001 0.25
8,611 Starwood Hotels & Resorts Worldwide Inc 384,826 0.16
27,122 Sysco Corp 760,772 0.31
16,553 United Parcel Service Inc 'B' ^ 1,131,563 0.46
8,864 United Technologies Corp 665,864 0.27
50,082 Verizon Communications Inc ^ 1,832,000 0.75
6,407 Vornado Realty Trust (Reit) 546,325 0.22
18,232 Wal-Mart Stores Inc ^ 969,395 0.40
11,402 Western Digital Corp 339,210 0.14
22,799 Williams Cos Inc/The 626,517 0.26
36,521 Windstream Corp 463,086 0.19
3,665 Wynn Resorts Ltd 568,478 0.23
27,844 Xcel Energy Inc 683,013 0.28
97,815,766 39.92
Total Common / Preferred Stocks (Shares) 198,145,251 80.86
Total Transferable Securities Admitted
to an Official Stock Exchange Listing or
Dealt in on Another Regulated Market 198,145,251 80.86
Unquoted Securities
COMMON STOCKS (SHARES)
Canada 15,640 Bonavista Energy Corp 415,761 0.17
Total Unquoted Securities 415,761 0.17
Total Portfolio 198,561,012 81.03
Other Net Assets 46,499,963 18.97
Total Net Assets (USD) 245,060,975 100.00
Portfolio of Investments 31 August 2011
Transferable Securities Admitted to an Official Stock Exchange Listing or Dealt in on Another Regulated Market
Holding Description Value (USD) %
Transferable Securities Admitted to an Official Stock Exchange Listing or Dealt in on Another Regulated Market
Holding Description Value (USD) %

Audited Annual Report and Accounts 159
The notes on pages 261 to 270 form an integral part of these financial statements.
Global Enhanced Equity Yield Fund continued
Open Futures Contractsas at 31 August 2011
Numberof contracts Contract/Description
Expirationdate
ValueUSD
442 E-mini S&P500 September 2011 27,089,075
222 Euro Stoxx 50 September 2011 7,361,028
81 Yen Denom Nikkei September 2011 4,779,929
57 FTSE 100 Index September 2011 4,999,739
29 Swiss Market Index September 2011 1,982,225
Total commitment 46,211,996
Note: The net unrealised loss of USD 1,731,008 attributed to these transactions is included
in the Statement of Net Assets (see Note 2c).
Written Call Options as at 31 August 2011
Number of contracts
subjectto Call Issuer
Unrealisedprofit/(loss)
USD ValueUSD
(60) NIKKEI Call Option
strike price JPY 9,500
expiring on 9/9/2011 52,326 (5,477)
(3) SMI Call Option
strike price CHF 5,400
expiring on 16/9/2011 (3,181) (7,072)
(11) FTSE 100 Call Option
strike price GBP 5,275
expiring on 16/9/2011 (11,563) (31,591)
(50) ESTX 50 Call Option
strike price EUR 2,325
expiring on 16/9/2011 (4,009) (31,663)
(65) SMI Call Option
strike price CHF 5,300
expiring on 16/9/2011 (130,341) (217,951)
(125) FTSE 100 Call Option
strike price GBP 5,150
expiring on 16/9/2011 (328,283) (559,384)
(650) ESTX 50 Call Option
strike price EUR 2,250
expiring on 16/9/2011 (327,370) (834,974)
(650) S&P 500 Call Option
strike price USD 1,175
expiring on 17/9/2011 (2,562,850) (4,111,250)
Total Written Call Options (3,315,271) (5,799,362)
Note: Written Call Options are included in the Statement of Net Assets (see Note 2c).
Sector Breakdownas at 31 August 2011
% of netassets
Financials 16.35
Energy 10.84
Information Technology 9.31
Industrials 8.60
Healthcare 7.46
Consumer Staples 7.10
Consumer Discretionary 6.68
Materials 6.25
Telecommunication Services 5.16
Utilities 3.28
Other Net Assets 18.97
100.00
Open Forward Foreign Exchange Transactionsas at 31 August 2011
Purchases Sales Value date Unrealised
profit/(loss)
Unrealisedprofit/(loss)
USD Equivalent
USD
CAD 4,481,000 USD 4,647,318 7/10/2011 (46,639) (46,639)
DKK 5,745,000 USD 1,104,990 7/10/2011 8,070 8,070
EUR 4,882,000 USD 7,035,273 7/10/2011 12,040 12,040
GBP 3,573,000 USD 5,761,752 7/10/2011 66,132 66,132
HKD 3,175,000 USD 406,848 7/10/2011 692 692
JPY 602,396,000 USD 7,738,158 7/10/2011 120,031 120,031
SEK 7,785,000 USD 1,198,668 7/10/2011 27,878 27,878
USD 1,228,496 AUD 1,180,000 7/10/2011 (28,640) (28,640)
USD 99,952 CAD 95,000 7/10/2011 2,415 2,415
USD 3,318,306 EUR 2,314,000 7/10/2011 (22,021) (22,021)
USD 884,604 GBP 550,000 7/10/2011 (12,496) (12,496)
USD 2,481,464 JPY 191,001,000 7/10/2011 (10,123) (10,123)
USD 351,203 NOK 1,902,000 7/10/2011 (3,345) (3,345)
USD 539,107 SEK 3,436,000 7/10/2011 (2,243) (2,243)
Net unrealised profit 111,751 111,751
EUR Hedged Share Class EUR
EUR 13,567,131 USD 19,267,696 14/9/2011 223,247 322,425
USD 1,880,950 EUR 1,314,019 14/9/2011 (11,363) (16,411)
Net unrealised profit 211,884 306,014
SGD Hedged Share Class SGD
SGD 524,389 USD 429,922 14/9/2011 7,386 6,142
USD 39,665 SGD 48,168 14/9/2011 (469) (390)
Net unrealised profit 6,917 5,752
Total net unrealised profit 423,517
Note: The net unrealised profit attributed to these transactions is included in the Statement
of Net Assets (see Note 2c).

* Securities lent, see Note 11, for further details.
160 BlackRock Global Funds (BGF)
Global Equity Fund
Portfolio of Investments 31 August 2011
FUNDS
Ireland 11,022,879 Institutional Cash Series Plc - Institutional
US Dollar Liquidity Fund 11,022,879 3.91
Total Funds 11,022,879 3.91
COMMON STOCKS (SHARES) & WARRANTS
Bermuda 3,191,000 Huabao International Holdings Ltd 2,456,690 0.87
208,894 Ports Design Ltd 343,090 0.12
2,799,780 0.99
Brazil 595,100 OGX Petroleo e Gas Participacoes SA 4,332,454 1.54
370,600 Souza Cruz SA 4,497,523 1.59
8,829,977 3.13
Canada 101,311 Teck Resources Ltd 'B' 4,553,572 1.62
Cayman Islands 25,684 Baidu Inc/China ADR 3,808,937 1.35
1,802,000 ENN Energy Holdings Ltd 6,185,160 2.20
341,825 Focus Media Holding Ltd ADR 10,791,415 3.83
9,160,000 Hengdeli Holdings Ltd * 4,407,569 1.57
109,487 Home Inns & Hotels Management Inc ADR 4,265,614 1.51
2,286,800 Sands China Ltd 7,100,941 2.52
36,559,636 12.98
China 1,873,620 Changsha Zoomlion Heavy Industry Science
and Technology Development Co Ltd 'H' * 3,211,888 1.14
7,758,450 China Construction Bank Corp 'H' 5,754,070 2.04
8,965,958 3.18
France 72,810 Eutelsat Communications SA 3,233,328 1.15
50,814 Schneider Electric SA 6,808,499 2.42
10,041,827 3.57
Germany 156,576 Daimler AG 8,451,231 3.00
997,128 Deutsche Bank AG (Lepo Wts 28/2/2018
- Sberbank) 2,918,525 1.04
33,422 Linde AG 5,152,452 1.83
16,522,208 5.87
Hong Kong 6,374,000 Lenovo Group Ltd 4,269,283 1.52
India 150,400 ICICI Bank Ltd ADR 5,868,608 2.08
667,798 ITC Ltd 2,900,317 1.03
8,768,925 3.11
Indonesia 10,091,000 Bumi Resources 2,986,027 1.06
Italy 1,048,900 Prada SpA 5,491,192 1.95
Japan 73,700 Nidec Corp 6,410,785 2.28
451,000 OKUMA Corp * 3,446,609 1.22
9,857,394 3.50
Luxembourg 2,018,400 Samsonite International SA 3,625,832 1.29
Spain 69,900 Red Electrica Corp SA 3,456,404 1.23
Switzerland 16,966 Swatch Group AG 7,741,658 2.75
Thailand 1,548,400 Siam Commercial Bank PCL 6,148,134 2.18
United Kingdom 130,850 British American Tobacco Plc 5,807,594 2.06
127,259 Rio Tinto Plc 7,859,737 2.79
333,129 Standard Chartered Plc 7,553,089 2.68
21,220,420 7.53
United States 64,353 Anadarko Petroleum Corp 4,819,396 1.71
19,815 Apple Inc 7,722,698 2.74
282,396 Arch Coal Inc 5,803,238 2.06
324,343 Comcast Corp 'A' 7,067,434 2.51
187,653 DIRECTV 'A' 8,371,200 2.97
309,303 EMC Corp/Massachusetts 6,965,504 2.47
201,014 Halliburton Co 8,953,164 3.18
8,213 Intuitive Surgical Inc 3,178,924 1.13
85,985 National Oilwell Varco Inc 5,814,306 2.07
140,518 NII Holdings Inc 5,367,085 1.91
116,554 Polycom Inc 2,841,586 1.01
89,060 Solera Holdings Inc 5,267,899 1.87
62,967 Tiffany & Co 4,544,958 1.61
101,809 Trimble Navigation Ltd 3,838,199 1.36
60,299 United Technologies Corp 4,529,661 1.61
71,397 Veeco Instruments Inc 2,648,829 0.94
53,271 Vertex Pharmaceuticals Inc 2,460,587 0.87
90,194,668 32.02
Total Common Stocks (Shares)
& Warrants 252,032,895 89.48
Total Transferable Securities Admitted
to an Official Stock Exchange Listing or
Dealt in on Another Regulated Market 263,055,774 93.39
Total Portfolio 263,055,774 93.39
Other Net Assets 18,618,099 6.61
Total Net Assets (USD) 281,673,873 100.00
Transferable Securities Admitted to an Official Stock Exchange Listing or Dealt in on Another Regulated Market
Holding Description Value (USD) %
Transferable Securities Admitted to an Official Stock Exchange Listing or Dealt in on Another Regulated Market
Holding Description Value (USD) %

Audited Annual Report and Accounts 161
The notes on pages 261 to 270 form an integral part of these financial statements.
Global Equity Fund continued
Sector Breakdownas at 31 August 2011
% of netassets
Consumer Discretionary 26.78
Information Technology 13.26
Energy 11.62
Financials 10.02
Industrials 8.67
Materials 7.11
Consumer Staples 4.68
Investment Funds 3.91
Utilities 3.43
Healthcare 2.00
Telecommunication Services 1.91
Other Net Assets 6.61
100.00
Open Forward Foreign Exchange Transactionsas at 31 August 2011
Purchases Sales Value date Unrealised
profit/(loss)
Unrealisedprofit/(loss)
USD Equivalent
Core Fund USD
CAD 5,803,000 GBP 3,631,096 8/9/2011 37,550 37,550
CHF 5,130,000 USD 6,104,527 8/9/2011 262,687 262,687
USD 5,857,749 CHF 5,130,000 8/9/2011 (509,464) (509,464)
KRW 5,900,000,000 GBP 3,441,154 7/10/2011 (83,642) (83,642)
TWD 129,200,000 GBP 2,823,476 7/10/2011 (136,802) (136,802)
GBP 19,150,000 USD 31,200,571 13/10/2011 32,734 32,734
JPY 1,077,170,822 USD 13,694,210 13/10/2011 358,161 358,161
USD 14,846,168 GBP 9,244,817 13/10/2011 (231,962) (231,962)
Net unrealised loss (270,738) (270,738)
SGD Hedged Share Class SGD
SGD 878,556 USD 720,530 14/9/2011 12,082 10,047
USD 70,426 SGD 85,466 14/9/2011 (776) (645)
Net unrealised profit 11,306 9,402
Total net unrealised loss (261,336)
Note: The net unrealised loss attributed to these transactions is included in the Statement
of Net Assets (see Note 2c).

(1) New Fund launched, see Note 1, for further details.
162 BlackRock Global Funds (BGF)
Global Equity Income Fund(1)
Portfolio of Investments 31 August 2011
FUNDS
Ireland 7,837,871 Institutional Cash Series Plc - Institutional
US Dollar Liquidity Fund 7,837,871 1.83
Total Funds 7,837,871 1.83
COMMON STOCKS (SHARES)
Brazil 442,200 Souza Cruz SA 5,366,445 1.25
Canada 98,957 National Bank of Canada 7,354,985 1.71
217,715 Rogers Communications Inc 'B' 8,463,334 1.97
15,818,319 3.68
France 165,990 Eutelsat Communications SA 7,371,242 1.72
204,547 Sanofi-Aventis SA 14,955,972 3.48
187,258 Total SA 9,183,784 2.14
31,510,998 7.34
Hong Kong 1,232,500 Power Assets Holdings Ltd 9,552,042 2.22
Israel 3,714,520 Bezeq The Israeli Telecommunication
Corp Ltd 8,184,913 1.91
Italy 172,082 ENI SpA 3,451,845 0.80
Japan 92,900 Canon Inc 4,355,444 1.01
Netherlands 327,602 Koninklijke KPN NV 4,664,843 1.09
Norway 508,664 DnB NOR ASA 6,114,001 1.42
Singapore 476,000 DBS Group Holdings Ltd 5,244,450 1.22
2,038,000 Singapore Post Ltd 1,796,335 0.42
1,022,000 Singapore Telecommunications Ltd 2,642,947 0.61
9,683,732 2.25
South Africa 315,198 MTN Group Ltd 6,407,491 1.49
Spain 525,958 Telefonica SA 10,990,899 2.56
Sweden 245,786 Hennes & Mauritz AB 'B' 7,666,904 1.78
192,694 Svenska Handelsbanken AB 'A' 5,311,147 1.24
12,978,051 3.02
Switzerland 163,180 Nestle SA 10,050,140 2.34
213,452 Novartis AG 12,428,512 2.89
22,478,652 5.23
Taiwan 204,428 Chunghwa Telecom Co Ltd ADR 7,132,493 1.66
2,431,000 Far Eastone Telecommunications 3,888,326 0.90
1,733,000 Taiwan Mobile Co Ltd 4,695,490 1.09
935,613 Taiwan Semiconductor Manufacturing Co
Ltd ADR 11,236,712 2.62
26,953,021 6.27
United Kingdom 207,547 BHP Billiton Plc 7,122,121 1.66
217,141 British American Tobacco Plc 9,637,499 2.24
416,239 Diageo Plc 8,360,927 1.95
690,493 GlaxoSmithKline Plc 14,810,629 3.45
407,600 HSBC Holdings Plc 3,517,214 0.82
182,204 Imperial Tobacco Group Plc 6,062,179 1.41
110,576 Reckitt Benckiser Group Plc 5,887,509 1.37
342,739 Royal Dutch Shell Plc 'B' 11,540,420 2.69
670,314 Tesco Plc 4,102,787 0.95
353,927 Unilever Plc 11,862,269 2.76
4,187,570 Vodafone Group Plc 11,137,900 2.59
94,041,454 21.89
United States 367,496 Altria Group Inc 10,010,591 2.33
294,340 AT&T Inc 8,783,106 2.04
93,441 Chevron Corp 9,289,904 2.16
94,872 Coca-Cola Co 6,670,450 1.55
135,415 Dominion Resources Inc/VA 6,620,439 1.54
81,198 Emerson Electric Co 3,830,922 0.89
180,199 Johnson & Johnson 11,898,540 2.77
257,259 Kraft Foods Inc 'A' 8,996,347 2.09
86,691 Lorillard Inc 9,690,320 2.26
132,267 McDonald's Corp 12,016,457 2.80
165,073 Merck & Co Inc 5,463,916 1.27
108,348 PepsiCo Inc/NC 7,003,615 1.63
465,522 Pfizer Inc 8,882,160 2.07
128,971 Philip Morris International Inc 9,066,661 2.11
243,055 Reynolds American Inc 9,134,007 2.13
58,660 United Technologies Corp 4,406,539 1.03
293,865 Verizon Communications Inc 10,749,582 2.50
142,513,556 33.17
Total Common Stocks (Shares) 415,065,706 96.60
Total Transferable Securities Admitted
to an Official Stock Exchange Listing or
Dealt in on Another Regulated Market 422,903,577 98.43
Total Portfolio 422,903,577 98.43
Other Net Assets 6,754,914 1.57
Total Net Assets (USD) 429,658,491 100.00
Transferable Securities Admitted to an Official Stock Exchange Listing or Dealt in on Another Regulated Market
Holding Description Value (USD) %
Transferable Securities Admitted to an Official Stock Exchange Listing or Dealt in on Another Regulated Market
Holding Description Value (USD) %

Audited Annual Report and Accounts 163
The notes on pages 261 to 270 form an integral part of these financial statements.
Global Equity Income Fund(1) continued
Open Forward Foreign Exchange Transactionsas at 31 August 2011
Purchases Sales Value date Unrealised
profit/(loss)
Unrealisedprofit/(loss)
USD Equivalent
USD
USD 52,886,496 GBP 32,581,909 3/11/2011 (241,609) (241,609)
Net unrealised loss (241,609) (241,609)
EUR Hedged Share Class EUR
EUR 15,775 USD 22,404 14/9/2011 260 376
USD 1,879 EUR 1,313 14/9/2011 (12) (17)
Net unrealised profit 248 359
PLN Hedged Share Class PLN
USD 42 PLN 122 14/9/2011 – –
PLN 5,217 USD 1,798 14/9/2011 47 16
Net unrealised profit 47 16
Total net unrealised loss (241,234)
Note: The net unrealised loss attributed to these transactions is included in the Statement
of Net Assets (see Note 2c).
Sector Breakdownas at 31 August 2011
% of netassets
Consumer Staples 28.37
Telecommunication Services 20.41
Healthcare 15.93
Energy 7.79
Financials 6.41
Consumer Discretionary 6.30
Utilities 3.76
Information Technology 3.63
Industrials 2.34
Investment Funds 1.83
Materials 1.66
Other Net Assets 1.57
100.00

164 BlackRock Global Funds (BGF)
Portfolio of Investments 31 August 2011
BONDS
Australia AUD 3,590,000 Australia Government Bond 3% 20/9/2025 4,601,806 0.89
AUD 4,434,000 Australia Government Bond 4.5%
15/4/2020 4,797,453 0.92
AUD 3,675,000 Australia Government Bond 5.75%
15/5/2021 4,358,142 0.84
AUD 820,000 Commonwealth Bank of Australia 5.75%
17/12/2013 903,268 0.17
AUD 5,590,000 New South Wales Treasury Corp 2.75%
20/11/2025 6,787,187 1.30
AUD 4,660,000 Queensland Treasury Corp 6% 14/9/2017 5,359,304 1.03
26,807,160 5.15
Belgium EUR 3,230,000 Belgium Government Bond 2.75%
28/3/2016 4,596,399 0.88
EUR 800,000 Belgium Government Bond 4.25%
28/3/2041 1,094,553 0.21
5,690,952 1.09
Bermuda GBP 1,150,000 Holcim GB Finance Ltd 8.75% 24/4/2017 2,306,255 0.44
Canada CAD 2,494,000 Canadian Government Bond 3.25%
1/6/2021 2,753,078 0.53
CAD 2,489,000 Canadian Government Bond 5%
1/6/2037 3,429,890 0.66
USD 3,100,000 CDP Financial Inc '144A' 3% 25/11/2014 3,270,976 0.63
9,453,944 1.82
Cayman Islands USD 2,800,000 Petrobras International Finance Co - Pifco
3.875% 27/1/2016 2,875,830 0.55
EUR 736,000 UPCB Finance II Ltd 6.375% 1/7/2020 944,209 0.18
3,820,039 0.73
Denmark EUR 1,950,000 Kommunekredit 4.375% 2/10/2012 2,906,948 0.56
DKK 42,100,000 Nykredit Realkredit A/S 4% 1/10/2041 7,954,172 1.53
EUR 260,000 TDC A/S 6.5% 19/4/2012 385,641 0.07
11,246,761 2.16
France USD 1,370,000 Dexia Credit Local SA '144A' 2.375%
23/9/2011 1,371,135 0.26
EUR 4,751,000 France Government Bond OAT 3.75%
25/4/2021 7,409,728 1.42
EUR 3,525,000 France Government Bond OAT 4.5%
25/4/2041 5,828,177 1.12
USD 1,000,000 Societe Generale SA '144A' FRN
5/4/2017 (Perpetual) 713,591 0.14
GBP 1,000,000 Societe Generale SA FRN 16/6/2018
(Perpetual) 1,325,701 0.26
16,648,332 3.20
Germany EUR 5,863,000 Bundesobligation 2.25% 10/4/2015 8,837,596 1.70
EUR 5,050,000 Bundesobligation 3.5% 12/4/2013 7,622,513 1.46
EUR 555,000 Bundesrepublik Deutschland 3.25%
4/7/2015 866,977 0.17
EUR 11,299,000 Bundesrepublik Deutschland 3.25%
4/7/2021 17,878,350 3.44
EUR 1,225,000 Bundesrepublik Deutschland 3.25%
4/7/2042 1,841,144 0.35
EUR 3,140,000 Bundesrepublik Deutschland 4.75%
4/7/2040 5,992,306 1.15
EUR 7,580,000 Bundesrepublik Deutschland
Bundesobligation Inflation
Linked Bond 2.25% 15/4/2013 12,469,654 2.40
EUR 4,001,000 Deutsche Bundesrepublik Inflation
Linked Bond 1.5% 15/4/2016 6,888,950 1.32
EUR 2,150,000 Duesseldorfer Hypothekenbank AG
1.875% 13/12/2013 3,129,896 0.60
EUR 170,000 HSH Nordbank AG FRN 14/2/2017 142,403 0.03
EUR 1,175,000 Kreditanstalt fuer Wiederaufbau 2.625%
16/8/2019 1,701,217 0.33
EUR 1,250,000 Kreditanstalt fuer Wiederaufbau 4.125%
4/7/2017 1,991,850 0.38
CAD 3,765,000 Kreditanstalt fuer Wiederaufbau 4.375%
9/2/2016 4,283,009 0.82
CAD 1,350,000 Kreditanstalt fuer Wiederaufbau 4.7%
2/6/2037 1,534,409 0.30
AUD 590,000 Kreditanstalt fuer Wiederaufbau 5.5%
8/8/2013 644,592 0.12
EUR 605,000 UPC Germany GmbH 8.125% 1/12/2017 882,835 0.17
76,707,701 14.74
India USD 700,000 Bank of Baroda/London 5% 24/8/2016 716,524 0.14
USD 850,000 Bank of India 6.25% 16/2/2021 874,909 0.17
USD 595,000 Canara Bank/London 5.125% 9/9/2016 607,462 0.11
2,198,895 0.42
International EUR 1,170,000 European Financial Stability Facility 2.75%
18/7/2016 1,733,592 0.33
EUR 2,560,000 European Investment Bank 2.125%
15/1/2014 3,761,548 0.72
USD 1,125,000 European Investment Bank 3.125%
4/6/2014 1,202,436 0.23
AUD 2,310,000 European Investment Bank 6% 6/8/2020 2,548,380 0.49
AUD 4,345,000 European Investment Bank 6.5%
7/8/2019 4,942,365 0.95
AUD 1,115,000 Nordic Investment Bank 6% 20/8/2014 1,241,179 0.24
15,429,500 2.96
Ireland EUR 1,100,000 Ardagh Packaging Finance Plc 7.375%
15/10/2017 1,477,378 0.28
USD 5,188,000 Governor & Co of the Bank of Ireland/The
'144A' 2.75% 2/3/2012 4,889,023 0.94
EUR 2,538,000 Ireland Government Bond 4% 15/1/2014 3,358,701 0.65
EUR 3,565,000 Ireland Government Bond 5%
18/10/2020 4,063,769 0.78
USD 2,290,000 Irish Life & Permanent Plc '144A' 3.6%
14/1/2013 1,882,870 0.36
15,671,741 3.01
Global Government Bond Fund
Transferable Securities Admitted to an Official Stock Exchange Listing or Dealt in on Another Regulated Market
Holding Description Value (USD) %
Transferable Securities Admitted to an Official Stock Exchange Listing or Dealt in on Another Regulated Market
Holding Description Value (USD) %

Audited Annual Report and Accounts 165
The notes on pages 261 to 270 form an integral part of these financial statements.
Portfolio of Investments 31 August 2011
Italy EUR 2,376,000 Italy Buoni Poliennali Del Tesoro 3%
15/4/2015 3,313,411 0.64
EUR 3,970,000 Italy Buoni Poliennali Del Tesoro 3.5%
1/6/2014 5,689,806 1.09
EUR 8,296,000 Italy Buoni Poliennali Del Tesoro 4%
1/9/2020 11,328,475 2.18
EUR 7,500,000 Italy Buoni Poliennali Del Tesoro 4.25%
15/10/2012 10,963,623 2.10
EUR 1,730,000 Italy Buoni Poliennali Del Tesoro 4.5%
1/2/2020 2,464,109 0.47
EUR 2,725,000 Italy Buoni Poliennali Del Tesoro 5%
1/8/2039 3,367,493 0.65
EUR 2,330,000 Italy Buoni Poliennali Del Tesoro 5%
1/9/2040 2,870,881 0.55
39,997,798 7.68
Japan JPY 410,000,000 Japan Government Fifteen Year Bond
FRN 20/3/2021 5,507,303 1.06
JPY 1,500,000,000 Japan Government Five Year Bond 0.9%
20/12/2012 19,760,366 3.80
JPY 964,000,000 Japan Government Ten Year Bond 1%
20/9/2020 12,656,585 2.43
JPY 494,000,000 Japan Government Ten Year Bond 1.1%
20/6/2020 6,561,638 1.26
JPY 2,597,200,000 Japan Government Ten Year Bond 1.4%
20/9/2019 35,596,337 6.84
JPY 315,000,000 Japan Government Thirty Year Bond 2.5%
20/9/2035 4,537,162 0.87
JPY 2,352,000,000 Japan Government Twenty Year Bond
2.1% 20/12/2027 32,570,044 6.26
JPY 905,500,000 Japan Government Twenty Year Bond
2.2% 20/6/2026 12,830,927 2.46
JPY 705,000,000 Japanese Government CPI Linked Bond
1.3% 10/9/2017 9,436,056 1.81
EUR 1,300,000 Tokyo Electric Power Co Inc/The 4.5%
24/3/2014 1,619,258 0.31
141,075,676 27.10
Luxembourg EUR 2,000,000 Bumper 2 SA '2011-2 A' FRN
23/2/2023 2,888,306 0.56
Netherlands EUR 900,000 Fortis Bank Nederland NV 3.375%
19/5/2014 1,363,569 0.26
EUR 1,125,000 LeasePlan Corp NV 3.25% 22/5/2014 1,698,320 0.33
USD 1,970,000 MDC-GMTN B.V. 3.75% 20/4/2016 2,056,187 0.40
USD 1,715,000 MDC-GMTN B.V. 5.75% 6/5/2014 1,880,575 0.36
6,998,651 1.35
Norway EUR 1,775,000 DnB NOR Bank ASA FRN 18/10/2016 2,550,647 0.49
USD 1,075,000 Eksportfinans ASA 3% 17/11/2014 1,140,151 0.22
3,690,798 0.71
Poland PLN 8,000,000 Poland Government Bond 5%
25/4/2016 2,788,271 0.53
USD 2,380,000 Poland Government International Bond
5.125% 21/4/2021 2,481,150 0.48
5,269,421 1.01
Portugal EUR 700,000 Portugal Obrigacoes do Tesouro OT
4.2% 15/10/2016 762,250 0.15
EUR 1,990,000 Portugal Obrigacoes do Tesouro OT
4.95% 25/10/2023 1,741,061 0.34
EUR 3,750,000 Portugal Obrigacoes do Tesouro OT
5.45% 23/9/2013 4,856,095 0.93
EUR 920,000 Portugal Obrigacoes do Tesouro OT
6.4% 15/2/2016 1,095,017 0.21
8,454,423 1.63
Qatar USD 1,455,000 Qatari Diar Finance QSC 5%
21/7/2020 1,578,675 0.30
South Korea USD 785,000 Lotte Shopping Co Ltd 3.875% 7/4/2016 796,842 0.15
USD 655,000 POSCO '144A' 5.25% 14/4/2021 667,532 0.13
1,464,374 0.28
Spain EUR 1,700,000 Banco Financiero y de Ahorros SA 3.875%
30/11/2013 2,432,353 0.47
EUR 700,000 BBVA Senior Finance SAU 2.75%
10/9/2012 999,626 0.19
EUR 2,500,000 Instituto de Credito Oficial 2.875%
15/11/2013 3,526,119 0.68
EUR 3,075,000 Spain Government Bond 3.15% 31/1/2016 4,278,775 0.82
EUR 2,185,000 Spain Government Bond 4.2% 31/1/2037 2,470,013 0.48
EUR 1,300,000 Spain Government Bond 4.8% 31/1/2024 1,784,207 0.34
EUR 2,295,000 Spain Government Bond 4.85%
31/10/2020 3,300,630 0.63
USD 1,450,000 Telefonica Emisiones SAU 5.462%
16/2/2021 1,404,266 0.27
20,195,989 3.88
Sweden EUR 2,635,000 Svensk Exportkredit AB 3.625%
27/5/2014 3,999,857 0.77
EUR 2,400,000 Svenska Handelsbanken AB FRN
19/10/2017 3,361,991 0.64
EUR 1,861,000 Swedbank Hypotek AB 2% 31/1/2014 2,694,129 0.52
10,055,977 1.93
Switzerland USD 2,000,000 UBS AG/Stamford CT 2.25% 12/8/2013 2,017,411 0.39
United Kingdom EUR 870,000 Aviva Plc FRN 28/11/2014 (Perpetual) 1,002,512 0.19
GBP 500,000 Barclays Bank Plc FRN 15/12/2017
(Perpetual) 554,733 0.11
USD 950,000 Barclays Bank Plc '144A' FRN 15/12/2016
(Perpetual) 774,250 0.15
GBP 806,000 Barclays Bank Plc 10% 21/5/2021 1,435,768 0.28
GBP 621,000 Co-Operative Bank Plc/United Kingdom
9.25% 28/4/2021 941,118 0.18
EUR 1,050,000 FCE Bank Plc 9.375% 17/1/2014 1,584,598 0.30
GBP 865,000 Fosse Master Issuer Plc '2011-1X A3' FRN
18/10/2054 1,409,029 0.27
USD 1,565,000 HBOS Plc FRN 30/9/2016 1,232,437 0.24
EUR 867,983 Headingley RMBS '2011-1 A1B' FRN
11/3/2051 1,250,211 0.24
GBP 660,000 Lloyds TSB Bank Plc 6.5% 17/9/2040 947,165 0.18
Global Government Bond Fund continued
Transferable Securities Admitted to an Official Stock Exchange Listing or Dealt in on Another Regulated Market
Holding Description Value (USD) %
Transferable Securities Admitted to an Official Stock Exchange Listing or Dealt in on Another Regulated Market
Holding Description Value (USD) %

166 BlackRock Global Funds (BGF)
Portfolio of Investments 31 August 2011
USD 1,130,000 Northern Rock Asset Management Plc
'144A' 5.625% 22/6/2017 1,223,711 0.24
EUR 649,000 Royal Bank of Scotland Plc/The 3.625%
17/5/2013 931,337 0.18
GBP 410,000 United Kingdom Gilt 4.25% 7/6/2032 725,978 0.14
GBP 2,305,000 United Kingdom Gilt 4.25% 7/9/2039 4,026,987 0.77
GBP 2,060,000 United Kingdom Gilt 4.25% 7/12/2040 3,586,720 0.69
GBP 1,435,000 United Kingdom Gilt 4.25% 7/12/2049 2,522,658 0.48
GBP 895,000 United Kingdom Gilt 4.5% 7/12/2042 1,629,576 0.31
GBP 3,875,000 United Kingdom Gilt 4.75% 7/12/2038 7,329,721 1.41
GBP 1,065,000 Virgin Media Secured Finance Plc 5.5%
15/1/2021 1,714,744 0.33
GBP 1,138,000 Virgin Media Secured Finance Plc 7%
15/1/2018 1,942,174 0.37
36,765,427 7.06
United States USD 216,000 Altria Group Inc 9.25% 6/8/2019 285,437 0.06
USD 1,300,000 Ball Corp 5.75% 15/5/2021 1,290,250 0.25
USD 510,000 Ball Corp 6.75% 15/9/2020 538,050 0.10
USD 1,000,000 Capital One Capital V 10.25% 15/8/2039 1,037,500 0.20
USD 945,000 Celanese US Holdings LLC 5.875%
15/6/2021 948,544 0.18
USD 694,000 CF Industries Inc 6.875% 1/5/2018 780,750 0.15
USD 1,915,000 Chesapeake Energy Corp 6.125%
15/2/2021 1,936,544 0.37
USD 1,950,000 Citibank Omni Master Trust '2009-A8 A8'
'144A' FRN 16/5/2016 1,969,893 0.38
USD 23,856 Citigroup Mortgage Loan Trust Inc
'2005-2 1A4' FRN 25/5/2035 21,314 0.01
USD 249,446 Countrywide Asset-Backed Certificate
'2007-2 2A1' FRN 25/8/2037 243,243 0.05
USD 1,950,953 Credit Suisse First Boston Mortgage
Securities Corp '2002-CKS4 A2'
5.183% 15/11/2036 1,990,973 0.38
USD 900,000 Crown Castle Towers LLC '144A' 6.113%
15/1/2020 1,021,208 0.20
USD 1,110,000 DISH DBS Corp 6.625% 1/10/2014 1,143,300 0.22
USD 500,000 Domtar Corp 9.5% 1/8/2016 592,500 0.12
USD 680,000 Domtar Corp 10.75% 1/6/2017 851,700 0.16
USD 2,050,000 Federal Home Loan Banks 2% 14/9/2012 2,087,525 0.40
USD 350,000 Ford Motor Credit Co LLC 6.625%
15/8/2017 365,588 0.07
USD 710,876 GE Capital Commercial Mortgage Corp
'2005-C1 A2' 4.353% 10/6/2048 710,431 0.14
EUR 2,799,000 Goldman Sachs Group Inc/The 3.5%
8/12/2011 4,066,583 0.78
USD 824,409 Greenwich Capital 4.305% 10/8/2042 824,531 0.16
USD 632,924 GSR Mortgage Loan Trust '2005-AR1 4A1'
FRN 25/1/2035 627,537 0.12
USD 280,272 Home Equity Asset Trust '2007-2 2A1' FRN
25/7/2037 270,561 0.05
USD 1,345,000 Jabil Circuit Inc 7.75% 15/7/2016 1,472,775 0.28
EUR 1,800,000 JPMorgan Chase & Co 3.625% 12/12/2011 2,616,621 0.50
USD 1,900,000 Morgan Stanley Capital I '2006-IQ12 A4'
5.332% 15/12/2043 2,047,301 0.39
USD 210,000 SLM Corp 5.4% 25/10/2011 210,008 0.04
USD 1,900,000 Southwestern Energy Co 7.5% 1/2/2018 2,186,790 0.42
USD 2,450,000 State of California 5.95% 1/4/2016 2,772,788 0.53
USD 7,581,000 United States Treasury Note/Bond 3.75%
15/8/2041 7,866,472 1.51
42,776,717 8.22
Total Bonds 509,210,923 97.82
Total Transferable Securities Admitted
to an Official Stock Exchange Listing or
Dealt in on Another Regulated Market 509,210,923 97.82
Unquoted Securities
BONDS
Canada CAD 1,220,000 Air Canada '144A' 10.125% 1/8/2015 1,222,310 0.23
Malaysia USD 685,000 Hong Leong Bank Bhd 3.75% 17/3/2016 705,447 0.13
Norway USD 2,700,000 DnB NOR Bank ASA FRN 1/9/2016 2,691,360 0.52
United States USD 600,000 Metropolitan Life Global Funding I
2.875% 17/9/2012 609,347 0.12
Total Bonds 5,228,464 1.00
Total Unquoted Securities 5,228,464 1.00
Total Portfolio 514,439,387 98.82
Other Net Assets 6,136,948 1.18
Total Net Assets (USD) 520,576,335 100.00
Global Government Bond Fund continued
Transferable Securities Admitted to an Official Stock Exchange Listing or Dealt in on Another Regulated Market
Holding Description Value (USD) %
Transferable Securities Admitted to an Official Stock Exchange Listing or Dealt in on Another Regulated Market
Holding Description Value (USD) %

Audited Annual Report and Accounts 167
The notes on pages 261 to 270 form an integral part of these financial statements.
Global Government Bond Fund continued
Note: The total market value of USD 398,708 of these transactions is included in the Statement of Net Assets (see Note 2c).
Nominal Value Description
Unrealisedprofit/(loss)
USD
Nominal Value Description
Unrealisedprofit/(loss)
USD
Swaps as at 31 August 2011
EUR (1,300,000) Credit Default Swaps (Barclays) (Fund provides default
protection on Imperial Tobacco Group Plc 6.25%
4/12/2018; and receives Fixed 0.71%) (20/9/2012) 2,428
EUR 1,100,000 Credit Default Swaps (Citibank) (Fund receives default
protection on STMicroelectronics NV 0% 5/7/2013;
and pays Fixed 0.255%) (20/9/2012) 11,980
EUR 17,400,000 Interest Rate Swaps (Barclays) (Fund receives Fixed
3.14%; and pays Floating EUR Euribor 6 Month)
(5/5/2013) 658,235
EUR (2,850,000) Credit Default Swaps (Deutsche Bank) (Fund provides
default protection on Alstom SA 4% 23/9/2014;
and receives Fixed 1%) (20/9/2016) (111,493)
EUR 4,915,000 Credit Default Swaps (Deutsche Bank) (Fund receives
default protection on Koninklijke KPN NV 8.375%
1/10/2030; and pays Fixed 1%) (20/9/2016) 133,784
EUR (2,310,000) Credit Default Swaps (Credit Suisse) (Fund provides
default protection on Glencore International
AG 5.25% 11/1/2013; and receives Fixed 1%)
(20/9/2016) (130,660)
EUR 3,025,000 Credit Default Swaps (Credit Suisse) (Fund receives
default protection on Xstrata Plc 5.25% 13/6/2017;
and pays Fixed 1%) (20/9/2016) 100,092
EUR (4,915,000) Credit Default Swaps (Deutsche Bank) (Fund provides
default protection on Vodafone Group Plc 5%
4/8/2016; and receives Fixed 1%) (20/9/2016) (45,669)
USD 2,900,000 Interest Rate Swaps (Deutsche Bank) (Fund receives
Floating USD LIBOR 3 Month; and pays Fixed 3.29%)
(19/8/2041) (54,586)
564,111
Open Futures Contractsas at 31 August 2011
Numberof contracts Contract/Description
Expirationdate
ValueUSD
(12) Japanese 10 Year Bond (TSE) September 2011 (22,281,688)
(25) Australian 10 Year Bond September 2011 (20,486,865)
(53) Euro BOBL September 2011 (9,340,963)
(156) Australian 3 Year Bond September 2011 (45,150,292)
(674) Euro Schatz September 2011 (106,505,055)
103 US Long Bond (CBT) December 2011 14,107,781
81 US Treasury 2 Year Note (CBT) December 2011 17,860,500
25 US Long Bond (CBT) December 2011 3,611,719
(56) Long Gilt December 2011 (11,609,575)
(79) US Treasury 10 Year Note December 2011 (10,219,391)
(109) Banker's Acceptance December 2011 (27,690,812)
(121) US Treasury 5 Year Note (CBT) December 2011 (14,840,461)
(177) 90 Day Bank Bill December 2011 (43,853,455)
(51) Banker's Acceptance June 2012 (12,962,802)
Total commitment (289,361,359)
Note: The net unrealised loss of USD 2,676,565 attributed to these transactions is included
in the Statement of Net Assets (see Note 2c).
Open Forward Foreign Exchange Transactionsas at 31 August 2011
Purchases Sales Value date Unrealised
profit/(loss)
Unrealisedprofit/(loss)
USD Equivalent
Core Fund USD
USD 7,495,668 DKK 39,202,500 1/9/2011 (103,007) (103,007)
EUR 4,660,000 GBP 4,158,151 8/9/2011 (55,341) (55,341)
GBP 4,508,602 EUR 5,080,000 8/9/2011 20,651 20,651
JPY 406,140,000 USD 5,149,225 9/9/2011 147,622 147,622
USD 5,657,633 JPY 453,960,000 9/9/2011 (262,879) (262,879)
GBP 1,758,700 USD 2,865,771 7/10/2011 2,827 2,827
JPY 444,503,700 USD 5,617,683 7/10/2011 180,818 180,818
USD 34,927,910 AUD 33,798,000 7/10/2011 (1,079,431) (1,079,431)
USD 12,612,710 CAD 12,489,500 7/10/2011 (210,360) (210,360)
USD 34,572,007 GBP 21,626,500 7/10/2011 (702,761) (702,761)
USD 136,725,657 JPY 11,079,516,800 7/10/2011 (7,805,421) (7,805,421)
USD 2,830,186 PLN 8,111,000 7/10/2011 16,550 16,550
USD 5,099,433 ZAR 35,350,700 7/10/2011 87,315 87,315
ZAR 35,350,000 USD 4,838,045 7/10/2011 173,974 173,974
SEK 68,583,300 EUR 7,450,000 14/10/2011 47,929 47,929
EUR 4,765,000 USD 6,800,946 26/10/2011 76,108 76,108
USD 207,520,822 EUR 144,707,500 26/10/2011 (1,327,300) (1,327,300)
USD 2,773,238 EUR 1,915,000 14/11/2011 10,037 10,037
AUD 4,895,000 USD 5,131,321 18/11/2011 58,032 58,032
USD 5,117,603 AUD 4,940,000 18/11/2011 (119,456) (119,456)
USD 7,553,171 DKK 38,781,000 1/12/2011 43,166 43,166
CNY 48,138,800 USD 7,550,000 13/2/2012 61,496 61,496
Net unrealised loss (10,739,431) (10,739,431)
EUR Hedged Share Class EUR
EUR 239,939,247 USD 340,282,074 14/9/2011 4,276,173 6,175,871
USD 8,148,995 EUR 5,684,929 14/9/2011 (41,325) (59,684)
Net unrealised profit 4,234,848 6,116,187
Total net unrealised loss (4,623,244)
Note: The net unrealised loss attributed to these transactions is included in the Statement
of Net Assets (see Note 2c).

168 BlackRock Global Funds (BGF)
Global High Yield Bond Fund
Portfolio of Investments 31 August 2011
PREFERRED STOCKS (SHARES)
United States 15,200 Dana Holding Corp (Pref) 1,711,900 0.15
153,784 Federal Home Loan Mortgage Corp (Pref) 347,936 0.03
60,000 Federal National Mortgage Association
(Pref) 186,000 0.02
95,400 General Motors Co Series B (Pref) 3,760,668 0.33
220,670 GMAC Capital Trust I (Pref) 4,444,625 0.40
10,451,129 0.93
Preferred Stocks (Shares) 10,451,129 0.93
BONDS
Australia USD 900,000 Boart Longyear Management Pty Ltd
'144A' 7% 1/4/2021 895,500 0.08
USD 3,115,000 FMG Resources August 2006 Pty Ltd
'144A' 7% 1/11/2015 3,138,363 0.28
4,033,863 0.36
Austria USD 625,000 Sappi Papier Holding GmbH '144A' 6.625%
15/4/2021 553,125 0.05
Belgium EUR 598,000 Ideal Standard International SPRL 11.75%
1/5/2018 669,293 0.06
EUR 690,000 Ontex IV SA 7.5% 15/4/2018 885,196 0.08
1,554,489 0.14
Bermuda EUR 1,250,000 Central European Media Enterprises Ltd
11.625% 15/9/2016 1,674,677 0.15
USD 3,785,000 Digicel Group Ltd '144A' 8.875%
15/1/2015 3,766,075 0.33
USD 2,970,000 Digicel Group Ltd '144A' 9.125%
15/1/2015 2,970,000 0.26
USD 900,000 Digicel Group Ltd '144A' 10.5%
15/4/2018 972,000 0.09
USD 1,865,000 Digicel Ltd '144A' 8.25% 1/9/2017 1,870,595 0.17
11,253,347 1.00
Brazil USD 20,020,000 OGX Petroleo e Gas Participacoes SA
'144A' 8.5% 1/6/2018 20,145,125 1.79
Canada USD 3,540,000 Air Canada '144A' 9.25% 1/8/2015 3,416,100 0.30
USD 450,000 Bombardier Inc '144A' 7.75% 15/3/2020 491,625 0.04
USD 660,000 Cascades Inc 7.75% 15/12/2017 636,900 0.06
USD 1,770,000 Connacher Oil and Gas Ltd '144A' 8.5%
1/8/2019 1,438,125 0.13
USD 1,235,000 Goldcorp Inc 2% 1/8/2014 1,637,919 0.15
USD 225,000 Harvest Operations Corp '144A' 6.875%
1/10/2017 228,375 0.02
USD 4,075,000 MEG Energy Corp '144A' 6.5% 15/3/2021 4,049,531 0.36
USD 1,190,000 MPL 2 Acquisition Canco Inc '144A'
9.875% 15/8/2018 1,142,400 0.10
USD 725,000 Nova Chemicals Corp 8.625% 1/11/2019 795,687 0.07
USD 13,020,000 Novelis Inc/GA 8.75% 15/12/2020 13,573,350 1.21
USD 1,365,000 Precision Drilling Corp '144A' 6.5%
15/12/2021 1,368,413 0.12
USD 1,520,000 Taseko Mines Ltd 7.75% 15/4/2019 1,447,800 0.13
30,226,225 2.69
Cayman Islands EUR 4,383,000 UPCB Finance II Ltd 6.375% 1/7/2020 5,622,919 0.50
France USD 1,615,000 Cie Generale de Geophysique - Veritas
'144A' 6.5% 1/6/2021 1,534,250 0.13
USD 775,000 Cie Generale de Geophysique - Veritas
7.75% 15/5/2017 780,812 0.07
USD 360,000 Cie Generale de Geophysique - Veritas
9.5% 15/5/2016 378,000 0.03
EUR 2,020,000 Crown European Holdings SA 7.125%
15/8/2018 2,793,211 0.25
EUR 2,300,000 Rexel SA 7% 17/12/2018 3,113,327 0.28
8,599,600 0.76
Germany EUR 560,000 ALBA Group Plc & Co KG 8% 15/5/2018 776,381 0.07
EUR 6,000,000 Commerzbank AG 6.375% 22/3/2019 * 7,363,411 0.65
EUR 1,200,000 IVG Immobilien AG FRN 5/5/2013
(Perpetual) 1,247,749 0.11
EUR 5,015,000 Kabel BW Erste Beteiligungs GmbH /
Kabel Baden-Wurttemberg GmbH & Co
KG 7.5% 15/3/2019 7,133,798 0.63
EUR 3,670,000 Kabel Deutschland Vertrieb und Service
GmbH & Co KG 6.5% 29/6/2018 5,167,280 0.46
EUR 5,990,000 Kinove German Bondco GmbH 10%
15/6/2018 8,112,122 0.72
EUR 1,729,000 Musketeer GmbH 9.5% 15/3/2021 2,484,458 0.22
EUR 8,595,000 UPC Germany GmbH 8.125% 1/12/2017 12,549,355 1.12
EUR 6,154,000 UPC Germany GmbH 9.625% 1/12/2019 8,941,894 0.80
53,776,448 4.78
Ireland EUR 3,115,000 Ardagh Packaging Finance Plc 7.375%
15/10/2017 4,183,666 0.37
EUR 620,000 Ardagh Packaging Finance Plc 9.25%
15/10/2020 771,702 0.07
USD 504,560 AWAS Aviation Capital Ltd '144A' 7%
15/10/2016 488,162 0.04
EUR 2,937,000 Smurfit Kappa Acquisitions 7.25%
15/11/2017 4,044,422 0.36
EUR 1,739,000 Smurfit Kappa Acquisitions 7.75%
15/11/2019 2,391,817 0.21
11,879,769 1.05
Japan EUR 6,300,000 Tokyo Electric Power Co Inc/The 4.5%
24/3/2014 7,847,174 0.70
Luxembourg USD 3,261,000 Aguila 3 SA '144A' 7.875% 31/1/2018 3,073,492 0.27
EUR 3,501,000 Beverage Packaging Holdings Luxembourg
II SA 8% 15/12/2016 4,003,708 0.36
USD 1,540,000 Calcipar SA '144A' 6.875% 1/5/2018 1,466,850 0.13
EUR 556,000 Cirsa Funding Luxembourg SA 8.75%
15/5/2018 708,696 0.06
USD 290,000 ConvaTec Healthcare E SA '144A' 10.5%
15/12/2018 265,350 0.02
EUR 2,649,000 GCL Holdings SCA 9.375% 15/4/2018 3,366,497 0.30
USD 680,000 Intelsat Jackson Holdings SA '144A' 7.5%
1/4/2021 642,600 0.06
USD 2,680,000 Intelsat Jackson Holdings SA 11.25%
15/6/2016 2,787,200 0.25
USD 3,690,000 Intelsat Luxembourg SA '144A' 11.5%
4/2/2017 3,487,050 0.31
Transferable Securities Admitted to an Official Stock Exchange Listing or Dealt in on Another Regulated Market
Holding Description Value (USD) %
Transferable Securities Admitted to an Official Stock Exchange Listing or Dealt in on Another Regulated Market
Holding Description Value (USD) %

Audited Annual Report and Accounts 169
The notes on pages 261 to 270 form an integral part of these financial statements.
Global High Yield Bond Fund continued
Portfolio of Investments 31 August 2011
USD 1,530,000 Intelsat Luxembourg SA 11.5% 4/2/2017 1,445,850 0.13
EUR 2,845,000 KION Finance SA 7.875% 15/4/2018 3,453,849 0.31
EUR 3,367,750 OXEA Finance & Cy SCA 9.625%
15/7/2017 * 4,741,962 0.42
EUR 1,247,000 Sunrise Communications Holdings SA
8.5% 31/12/2018 1,733,328 0.15
EUR 2,669,000 Xefin Lux SCA 8% 1/6/2018 3,497,912 0.31
34,674,344 3.08
Netherlands EUR 3,000,000 Allianz Finance II BV FRN 8/7/2041 3,692,125 0.33
EUR 1,869,000 Elster Finance BV 6.25% 15/4/2018 2,496,690 0.22
EUR 5,500,000 GMAC International Finance BV 7.5%
21/4/2015 7,608,614 0.68
EUR 2,355,000 Hertz Holdings Netherlands BV 8.5%
31/7/2015 3,348,557 0.30
EUR 6,800,000 ING Verzekeringen NV FRN 7/5/2027 7,602,494 0.67
EUR 5,017,000 New World Resources NV 7.875%
1/5/2018 6,947,721 0.62
EUR 2,950,000 Trafigura Beheer BV 6.375% 8/4/2015 3,919,861 0.35
EUR 217,000 Ziggo Bond Co BV 8% 15/5/2018 310,639 0.03
EUR 5,775,000 Ziggo Finance BV 6.125% 15/11/2017 8,155,094 0.72
44,081,795 3.92
Spain USD 1,330,000 International Automotive Components
Group SL '144A' 9.125% 1/6/2018 1,310,050 0.12
United Kingdom EUR 1,160,000 Boparan Finance Plc 9.75% 30/4/2018 1,323,423 0.12
GBP 3,490,000 Enterprise Inns Plc 6.5% 6/12/2018 4,370,793 0.39
EUR 3,250,000 FCE Bank Plc 9.375% 17/1/2014 4,881,242 0.43
GBP 3,006,000 House of Fraser Funding Plc 8.875%
15/8/2018 4,302,015 0.38
GBP 4,750,000 Infinis Plc 9.125% 15/12/2014 8,017,208 0.71
USD 1,060,000 Inmarsat Finance Plc '144A' 7.375%
1/12/2017 1,094,450 0.10
GBP 4,000,000 LBG Capital No.1 Plc 7.588% 12/5/2020 5,056,597 0.45
EUR 2,000,000 Lloyds TSB Bank Plc 6.5% 24/3/2020 2,403,001 0.21
GBP 2,174,000 Odeon & UCI Finco Plc 9% 1/8/2018 3,236,564 0.29
GBP 1,880,000 Phones4u Finance Plc 9.5% 1/4/2018 2,318,821 0.21
GBP 2,030,000 Priory Group No 3 Plc '144A' 7%
15/2/2018 2,997,690 0.27
GBP 906,000 Priory Group No 3 Plc 7% 15/2/2018 1,361,952 0.12
GBP 550,000 Punch Taverns Finance Plc 7.274%
15/4/2022 833,004 0.07
GBP 1,517,000 Scottish Widows Plc FRN 24/9/2015
(Perpetual) 1,839,192 0.16
GBP 3,461,576 Titan Europe Plc/Ireland '2006-4FSX A1'
FRN 3/9/2014 5,282,916 0.47
GBP 1,795,000 Unique Pub Finance Co Plc/The 5.659%
30/6/2027 2,002,955 0.18
GBP 4,793,000 Virgin Media Secured Finance Plc 7%
15/1/2018 8,164,514 0.73
59,486,337 5.29
United States USD 2,715,000 AES Corp/The '144A' 7.375% 1/7/2021 2,698,031 0.24
USD 985,000 AES Corp/The 7.75% 15/10/2015 1,031,787 0.09
USD 3,355,000 AES Corp/The 9.75% 15/4/2016 3,690,500 0.33
USD 3,860,000 Affinion Group Inc 7.875% 15/12/2018 3,416,100 0.30
USD 1,120,000 Allison Transmission Inc '144A' 11%
1/11/2015 1,173,200 0.10
USD 7,570,000 Ally Financial Inc 8% 1/11/2031 7,305,050 0.65
USD 1,645,000 Alpha Natural Resources Inc 6% 1/6/2019 1,603,875 0.14
USD 3,395,000 Alpha Natural Resources Inc 6.25%
1/6/2021 3,335,588 0.30
USD 885,000 AMC Entertainment Inc 9.75% 1/12/2020 854,025 0.08
USD 840,000 AMC Networks Inc '144A' 7.75% 15/7/2021 867,300 0.08
USD 640,000 American Airlines Inc '144A' 7.5%
15/3/2016 572,800 0.05
USD 400,000 American Airlines Pass Through Trust
2001-02 7.858% 1/10/2011* 400,000 0.04
USD 2,340,000 American Capital Ltd 7.96% 31/12/2013 2,325,242 0.21
USD 2,080,000 American General Institutional Capital A
'144A' 7.57% 1/12/2045 2,048,800 0.18
USD 652,000 American Rock Salt Co LLC/American Rock
Capital Corp '144A' 8.25% 1/5/2018 606,360 0.05
USD 1,670,000 American Standard Americas '144A'
10.75% 15/1/2016 1,361,050 0.12
USD 1,355,000 Aptalis Pharma Inc 12.75% 1/3/2016 1,415,975 0.13
USD 2,354,000 Arch Coal Inc 7.25% 1/10/2020 2,342,230 0.21
USD 1,950,000 Arch Coal Inc '144A' 7.25% 15/6/2021 1,935,375 0.17
USD 2,710,000 Asbury Automotive Group Inc 8.375%
15/11/2020 2,676,125 0.24
USD 300,000 AutoNation Inc 6.75% 15/4/2018 312,000 0.03
USD 1,950,000 Avaya Inc '144A' 7% 1/4/2019 1,735,500 0.15
USD 1,490,000 Avaya Inc 9.75% 1/11/2015 1,268,362 0.11
USD 2,890,000 Avaya Inc 10.125% 1/11/2015 2,499,850 0.22
USD 2,460,000 Aviation Capital Group Corp '144A' 6.75%
6/4/2021 2,435,063 0.22
USD 2,565,000 Avis Budget Car Rental LLC / Avis Budget
Finance Inc 7.75% 15/5/2016 2,532,938 0.23
USD 3,730,000 Avis Budget Car Rental LLC / Avis Budget
Finance Inc 8.25% 15/1/2019 3,599,450 0.32
USD 855,000 Avis Budget Car Rental LLC / Avis Budget
Finance Inc 9.625% 15/3/2018 874,237 0.08
USD 1,555,000 Aviv Healthcare Properties LP/Aviv
Healthcare Capital Corp 7.75%
15/2/2019 1,555,000 0.14
USD 1,135,000 Ball Corp 7.375% 1/9/2019 1,225,800 0.11
USD 1,085,000 B-Corp Merger Sub Inc '144A' 8.25%
1/6/2019 1,009,050 0.09
USD 800,000 BE Aerospace Inc 6.875% 1/10/2020 820,000 0.07
USD 1,520,000 Beazer Homes USA Inc 9.125% 15/6/2018 1,052,600 0.09
USD 2,710,000 Beazer Homes USA Inc 9.125% 15/5/2019 1,822,475 0.16
USD 1,805,000 Beazer Homes USA Inc 12% 15/10/2017 1,832,075 0.16
USD 2,320,000 Berry Plastics Corp 8.25% 15/11/2015 2,401,200 0.21
USD 387,000 Bill Barrett Corp 9.875% 15/7/2016 426,667 0.04
USD 160,000 Boise Paper Holdings LLC / Boise Finance
Co 9% 1/11/2017 169,600 0.01
USD 1,455,000 Brickman Group Holdings Inc '144A'
9.125% 1/11/2018 1,367,700 0.12
USD 2,000,000 Briggs & Stratton Corp 6.875%
15/12/2020 1,995,000 0.18
USD 715,000 Broadview Networks Holdings Inc 11.375%
1/9/2012 618,475 0.05
USD 400,000 Building Materials Corp '144A' 7%
15/2/2020 400,000 0.04
USD 6,470,000 Building Materials Corp of America '144A'
6.75% 1/5/2021 6,097,975 0.54
USD 970,000 Caesars Entertainment Operating Co Inc
11.25% 1/6/2017 1,034,262 0.09
USD 1,675,000 Calfrac Holdings LP '144A' 7.5% 1/12/2020 1,628,938 0.14
USD 1,315,000 Calpine Corp '144A' 7.25% 15/10/2017 1,315,000 0.12
USD 495,000 Calpine Corp '144A' 7.5% 15/2/2021 492,525 0.04
USD 2,905,000 Calpine Corp '144A' 7.875% 15/1/2023 2,908,631 0.26
USD 370,000 Carrizo Oil & Gas Inc 8.625% 15/10/2018 371,850 0.03
USD 2,176,000 Casella Waste Systems Inc '144A' 7.75%
15/2/2019 2,110,720 0.19
Transferable Securities Admitted to an Official Stock Exchange Listing or Dealt in on Another Regulated Market
Holding Description Value (USD) %
Transferable Securities Admitted to an Official Stock Exchange Listing or Dealt in on Another Regulated Market
Holding Description Value (USD) %

170 BlackRock Global Funds (BGF)
Global High Yield Bond Fund continued
Portfolio of Investments 31 August 2011
USD 500,000 Casella Waste Systems Inc 11% 15/7/2014 537,500 0.05
USD 800,000 CB Richard Ellis Services Inc 6.625%
15/10/2020 784,000 0.07
USD 2,928,697 CCH II Capital Corp 13.5% 30/11/2016 3,389,967 0.30
USD 1,848,000 CCO Holdings LLC / CCO Holdings Capital
Corp 6.5% 30/4/2021 1,792,560 0.16
USD 1,810,000 CCO Holdings LLC / CCO Holdings Capital
Corp 7.875% 30/4/2018 1,882,400 0.17
USD 1,920,000 CDW LLC / CDW Finance Corp '144A' 8%
15/12/2018 1,900,800 0.17
USD 44,000 CDW LLC / CDW Finance Corp 11%
12/10/2015 45,100 0.00
USD 2,350,000 CDW LLC / CDW Finance Corp 11.5%
12/10/2015 2,408,750 0.21
USD 2,920,000 Celanese US Holdings LLC 5.875%
15/6/2021 2,930,950 0.26
USD 1,750,000 Celanese US Holdings LLC 6.625%
15/10/2018 1,848,438 0.16
USD 2,795,000 Cengage Learning Acquisitions Inc '144A'
10.5% 15/1/2015 2,166,125 0.19
USD 1,468,000 CF Industries Inc 6.875% 1/5/2018 1,651,500 0.15
USD 2,200,000 Checkout Holding Corp '144A' 0%
15/11/2015 (Zero Coupon) 1,309,000 0.12
USD 1,205,000 Chesapeake Energy Corp 6.125%
15/2/2021 1,218,556 0.11
USD 4,752,000 Chesapeake Energy Corp 6.625%
15/8/2020 4,965,840 0.44
USD 1,657,000 Chesapeake Midstream Partners LP /
CHKM Finance Corp '144A' 5.875%
15/4/2021 1,578,293 0.14
USD 2,400,000 CIT Group Inc 7% 1/5/2015 2,367,000 0.21
USD 16,426,158 CIT Group Inc 7% 1/5/2017 16,077,102 1.43
USD 2,570,000 CIT Group Inc '144A' 7% 2/5/2017 2,515,388 0.22
USD 1,965,000 Citadel Broadcasting Corp '144A' 7.75%
15/12/2018 2,124,656 0.19
USD 1,290,000 Clean Harbors Inc 7.625% 15/8/2016 1,370,625 0.12
USD 23,465,000 Clear Channel Worldwide Holdings Inc
Series B 9.25% 15/12/2017 24,990,225 2.22
USD 3,170,000 Clearwater Paper Corp 7.125% 1/11/2018 3,162,075 0.28
USD 600,000 Clearwater Paper Corp 10.625%
15/6/2016 657,000 0.06
USD 1,910,000 CNO Financial Group Inc '144A' 9%
15/1/2018 1,981,625 0.18
USD 511,000 Coffeyville Resources LLC / Coffeyville
Finance Inc '144A' 9% 1/4/2015 544,215 0.05
USD 4,280,000 Concho Resources Inc/Midland TX 7%
15/1/2021 4,354,900 0.39
USD 1,180,000 Consol Energy Inc '144A' 6.375%
1/3/2021 1,156,400 0.10
USD 7,880,000 Consol Energy Inc 8.25% 1/4/2020 8,431,600 0.75
USD 500,000 Continental Airlines 2010-1 Class B
Pass Through Trust 6% 12/1/2019 460,313 0.04
USD 1,440,000 Continental Airlines Inc '144A' 6.75%
15/9/2015 1,409,400 0.13
USD 780,000 Continental Resources Inc/OK 7.125%
1/4/2021 795,600 0.07
USD 2,175,000 Continental Resources Inc/OK 8.25%
1/10/2019 2,349,000 0.21
USD 1,460,000 Copano Energy LLC / Copano Energy
Finance Corp 7.125% 1/4/2021 1,434,450 0.13
USD 800,000 Corrections Corp of America 7.75%
1/6/2017 852,000 0.08
USD 605,000 Cott Beverages Inc 8.125% 1/9/2018 629,200 0.06
USD 2,075,000 Credit Acceptance Corp 9.125% 1/2/2017 2,116,500 0.19
USD 7,324,000 Cricket Communications Inc 7.75%
15/5/2016 7,397,240 0.66
USD 465,000 Cricket Communications Inc 10%
15/7/2015 480,694 0.04
USD 1,700,000 Crown Americas LLC / Crown Americas
Capital Corp III '144A' 6.25% 1/2/2021 1,704,250 0.15
USD 680,000 CSC Holdings LLC 8.5% 15/4/2014 737,800 0.07
USD 640,000 Cumulus Media Inc '144A' 7.75% 1/5/2019 560,000 0.05
USD 480,000 Dana Holding Corp 6.5% 15/2/2019 470,400 0.04
USD 330,000 Dana Holding Corp 6.75% 15/2/2021 324,225 0.03
USD 1,755,000 Del Monte Foods Co '144A' 7.625%
15/2/2019 1,750,613 0.16
USD 1,470,000 Delphi Corp '144A' 6.125% 15/5/2021 1,411,200 0.13
USD 1,321,920 Delta Air Lines 2009-1 Series B
Pass Through Trust Series B 9.75%
17/12/2016 1,354,968 0.12
USD 1,750,000 Denbury Resources Inc 6.375% 15/8/2021 1,706,250 0.15
USD 5,841,000 Denbury Resources Inc 8.25% 15/2/2020 6,162,255 0.55
USD 2,680,000 Diamond Resorts Corp 12% 15/8/2018 2,613,000 0.23
USD 2,030,000 DISH DBS Corp '144A' 6.75% 1/6/2021 2,030,000 0.18
USD 950,000 DISH DBS Corp 7% 1/10/2013 997,500 0.09
USD 2,293,000 DJO Finance LLC 10.875% 15/11/2014 2,381,853 0.21
USD 2,435,000 DJO Finance LLC / DJO Finance Corp
'144A' 7.75% 15/4/2018 2,237,156 0.20
USD 5,694,000 Dollar General Corp 11.875% 15/7/2017 6,334,575 0.56
USD 1,995,000 Drummond Co Inc 7.375% 15/2/2016 2,034,900 0.18
USD 300,000 Drummond Co Inc '144A' 9% 15/10/2014 308,250 0.03
USD 814,000 E*Trade Financial CorpSeries A 0%
31/8/2019 (Zero Coupon) 909,645 0.08
USD 2,990,000 E*Trade Financial Corp 12.5% 30/11/2017 3,442,237 0.31
USD 3,660,000 Eagle Parent Inc '144A' 8.625% 1/5/2019 3,367,200 0.30
USD 2,100,000 EH Holding Corp '144A' 6.5% 15/6/2019 2,084,250 0.19
USD 2,405,000 El Paso Corp 7.25% 1/6/2018 2,683,049 0.24
USD 305,000 Encore Acquisition Co 9.5% 1/5/2016 335,500 0.03
USD 8,990,000 Energy Future Holdings Corp 10%
15/1/2020 9,089,241 0.81
USD 13,220,000 Energy Future Intermediate Holding Co LLC
/ EFIH Finance Inc 10% 1/12/2020 13,432,036 1.19
USD 5,520,000 Energy XXI Gulf Coast Inc 7.75%
15/6/2019 5,147,400 0.46
USD 1,210,000 Energy XXI Gulf Coast Inc 9.25%
15/12/2017 1,222,100 0.11
USD 1,570,000 Equinix Inc 7% 15/7/2021 1,597,475 0.14
USD 1,306,000 ExamWorks Group Inc '144A' 9%
15/7/2019 1,237,435 0.11
USD 1,360,000 Exterran Holdings Inc '144A' 7.25%
1/12/2018 1,322,600 0.12
USD 6,195,000 Felcor Lodging LP '144A' 6.75% 1/6/2019 5,792,325 0.51
USD 4,015,000 First Data Corp '144A' 7.375% 15/6/2019 3,713,875 0.33
USD 1,235,000 First Data Corp '144A' 8.875% 15/8/2020 1,210,300 0.11
USD 11,797,000 First Data Corp '144A' 12.625%
15/1/2021 10,794,255 0.96
USD 1,300,000 Florida East Coast Railway Corp '144A'
8.125% 1/2/2017 1,296,750 0.12
USD 1,850,000 Forbes Energy Services Ltd '144A' 9%
15/6/2019 1,771,375 0.16
USD 1,950,000 Ford Motor Co 7.45% 16/7/2031 2,131,994 0.19
USD 8,592,000 Ford Motor Credit Co LLC 7% 15/4/2015 9,133,846 0.81
USD 750,000 Forest City Enterprises Inc 7.625%
1/6/2015 727,500 0.06
USD 1,135,000 Forest Oil Corp 8.5% 15/2/2014 1,220,125 0.11
USD 5,760,000 Frac Tech Services LLC/Frac Tech Finance
Inc '144A' 7.125% 15/11/2018 5,918,400 0.53
USD 2,665,000 Fresenius Medical Care US Finance Inc
6.875% 15/7/2017 2,768,269 0.25
USD 2,250,000 Fresenius US Finance II Inc '144A' 9%
15/7/2015 2,511,562 0.22
USD 3,480,000 FTI Consulting Inc 6.75% 1/10/2020 3,445,200 0.31
Transferable Securities Admitted to an Official Stock Exchange Listing or Dealt in on Another Regulated Market
Holding Description Value (USD) %
Transferable Securities Admitted to an Official Stock Exchange Listing or Dealt in on Another Regulated Market
Holding Description Value (USD) %

Audited Annual Report and Accounts 171
The notes on pages 261 to 270 form an integral part of these financial statements.
Global High Yield Bond Fund continued
Portfolio of Investments 31 August 2011
USD 1,552,000 GCI Inc 6.75% 1/6/2021 1,532,600 0.14
USD 1,850,000 General Motors Financial Co Inc '144A'
6.75% 1/6/2018 1,822,250 0.16
USD 1,880,000 Genworth Financial Inc 7.625% 24/9/2021 1,663,187 0.15
USD 790,000 Graphic Packaging International Inc 7.875%
1/10/2018 825,550 0.07
USD 1,065,000 Graphic Packaging International Inc 9.5%
15/6/2017 1,152,863 0.10
USD 2,950,000 Gray Television Inc 10.5% 29/6/2015 * 2,857,812 0.25
USD 1,175,000 Greif Inc 7.75% 1/8/2019 1,251,375 0.11
USD 1,850,000 Griffon Corp 7.125% 1/4/2018 1,734,375 0.15
USD 5,635,000 HCA Inc 6.5% 15/2/2020 5,649,087 0.50
USD 9,385,000 HCA Inc 7.25% 15/9/2020 9,549,237 0.85
USD 6,340,000 HCA Inc 7.5% 15/2/2022 6,213,200 0.55
USD 130,000 HCA Inc 8.5% 15/4/2019 139,912 0.01
USD 5,027,000 Hertz Corp/The '144A' 7.375% 15/1/2021 4,800,785 0.43
USD 1,645,000 Hertz Corp/The '144A' 7.5% 15/10/2018 1,620,325 0.14
USD 310,000 Hexion US Finance Corp / Hexion Nova
Scotia Finance ULC 8.875% 1/2/2018 285,975 0.03
USD 5,595,000 Hexion US Finance Corp / Hexion Nova
Scotia Finance ULC 9% 15/11/2020 4,804,706 0.43
USD 5,475,000 Hilcorp Energy I LP/Hilcorp Finance Co
'144A' 7.625% 15/4/2021 5,557,125 0.49
USD 560,000 Hilcorp Energy I LP/Hilcorp Finance Co
'144A' 7.75% 1/11/2015 574,000 0.05
USD 1,680,000 Hilcorp Energy I LP/Hilcorp Finance Co
'144A' 8% 15/2/2020 1,726,200 0.15
USD 1,170,000 Hillman Group Inc 10.875% 1/6/2018 1,187,550 0.11
USD 1,295,000 Host Hotels & Resorts LP 6.875%
1/11/2014 1,324,138 0.12
USD 2,955,000 Huntington Ingalls Industries Inc '144A'
6.875% 15/3/2018 2,755,538 0.24
USD 2,190,000 Huntington Ingalls Industries Inc '144A'
7.125% 15/3/2021 2,050,388 0.18
EUR 355,000 Huntsman International LLC '144A' 6.875%
15/11/2013 510,111 0.05
USD 985,000 Huntsman International LLC 8.625%
15/3/2021 1,017,013 0.09
USD 3,330,000 IASIS Healthcare LLC / IASIS Capital Corp
'144A' 8.375% 15/5/2019 2,972,025 0.26
USD 130,000 Icahn Enterprises LP / Icahn Enterprises
Finance Corp 7.75% 15/1/2016 130,000 0.01
USD 8,503,000 Icahn Enterprises LP / Icahn Enterprises
Finance Corp 8% 15/1/2018 8,503,000 0.76
USD 6,590,000 IMS Health Inc '144A' 12.5% 1/3/2018 7,615,569 0.68
USD 2,015,000 INC Research LLC '144A' 11.5% 15/7/2019 1,868,912 0.17
USD 1,920,000 Interactive Data Corp 10.25% 1/8/2018 2,025,600 0.18
USD 750,000 Interline Brands Inc 7% 15/11/2018 746,250 0.07
USD 600,000 Interpublic Group of Cos Inc/The 10%
15/7/2017 693,000 0.06
USD 2,880,000 inVentiv Health Inc '144A' 10% 15/8/2018 2,613,600 0.23
USD 3,385,000 Ipalco Enterprises Inc '144A' 7.25%
1/4/2016 3,648,458 0.32
USD 2,625,000 iPCS Inc FRN 1/5/2013 2,434,687 0.22
USD 530,000 ITC Deltacom Inc 10.5% 1/4/2016 544,575 0.05
USD 1,370,000 Jabil Circuit Inc 7.75% 15/7/2016 1,500,150 0.13
USD 780,000 Jabil Circuit Inc 8.25% 15/3/2018 883,350 0.08
USD 2,475,000 James River Escrow Inc '144A' 7.875%
1/4/2019 2,258,437 0.20
USD 1,135,000 Jarden Corp 7.5% 1/5/2017 1,163,375 0.10
USD 1,590,000 Jarden Corp 8% 1/5/2016 1,703,287 0.15
USD 480,000 JBS USA LLC/JBS USA Finance Inc '144A'
7.25% 1/6/2021 439,152 0.04
USD 1,920,000 Key Energy Services Inc 6.75% 1/3/2021 1,886,400 0.17
USD 1,465,000 KKR Group Finance Co LLC '144A' 6.375%
29/9/2020 1,566,167 0.14
USD 1,700,000 Koppers Inc 7.875% 1/12/2019 1,793,500 0.16
USD 465,000 Kraton Polymers LLC/Kraton Polymers
Capital Corp 6.75% 1/3/2019 448,725 0.04
USD 2,308,000 Kratos Defense & Security Solutions Inc
10% 1/6/2017 2,365,700 0.21
USD 4,680,000 Leucadia National Corp 7.125% 15/3/2017 4,785,300 0.43
USD 12,712,000 Level 3 Escrow Inc '144A' 8.125%
1/7/2019 11,917,500 1.06
USD 2,058,000 Level 3 Financing Inc 8.75% 15/2/2017 1,975,680 0.18
USD 1,210,000 Linn Energy LLC/Linn Energy Finance Corp
'144A' 6.5% 15/5/2019 1,140,425 0.10
USD 5,465,000 Linn Energy LLC/Linn Energy Finance Corp
'144A' 7.75% 1/2/2021 5,492,325 0.49
USD 1,205,000 Linn Energy LLC/Linn Energy Finance Corp
8.625% 15/4/2020 1,277,300 0.11
USD 2,260,000 Live Nation Entertainment Inc '144A'
8.125% 15/5/2018 2,175,250 0.19
USD 1,800,000 Longview Fibre Paper & Packaging Inc
'144A' 8% 1/6/2016 1,737,000 0.15
USD 580,000 Lyondell Chemical Co 11% 1/5/2018 646,700 0.06
USD 1,090,000 MarkWest Energy Partners LP / MarkWest
Energy Finance Corp 6.75% 1/11/2020 1,119,975 0.10
USD 2,465,000 MedAssets Inc '144A' 8% 15/11/2018 2,391,050 0.21
USD 2,470,000 MetroPCS Wireless Inc 6.625%
15/11/2020 2,266,225 0.20
USD 790,000 MetroPCS Wireless Inc 7.875% 1/9/2018 797,900 0.07
USD 3,560,000 MGM Resorts International 10.375%
15/5/2014 3,916,000 0.35
USD 400,000 MGM Resorts International 11.125%
15/11/2017 449,976 0.04
USD 1,375,000 Micron Technology IncSeries A '144A' 1.5%
1/8/2031 1,187,656 0.11
USD 457,000 Micron Technology Inc Series B '144A'
1.875% 1/8/2031 383,880 0.03
USD 4,300,000 Mobile Mini Inc 7.875% 1/12/2020 4,171,000 0.37
USD 4,515,000 Momentive Performance Materials Inc
9% 15/1/2021 3,837,750 0.34
USD 960,000 Momentive Performance Materials Inc
11.5% 1/12/2016 955,200 0.08
USD 3,290,000 NAI Entertainment Holdings LLC '144A'
8.25% 15/12/2017 3,339,350 0.30
USD 7,890,000 Navistar International Corp 3% 15/10/2014 8,797,350 0.78
USD 2,230,000 Newfield Exploration Co 6.875% 1/2/2020 2,319,200 0.21
USD 1,090,000 Newmont Mining CorpSeries A 1.25%
15/7/2014 1,585,950 0.14
USD 8,914,000 NewPage Corp 11.375% 31/12/2014 * 7,755,180 0.69
USD 1,415,000 Nexeo Solutions LLC / Nexeo Solutions
Finance Corp '144A' 8.375% 1/3/2018 1,475,138 0.13
USD 7,685,000 Nielsen Finance LLC / Nielsen Finance Co
'144A' 7.75% 15/10/2018 7,953,975 0.71
USD 552,000 Nielsen Finance LLC / Nielsen Finance Co
11.5% 1/5/2016 629,280 0.06
USD 1,667,000 NII Capital Corp 7.625% 1/4/2021 1,708,675 0.15
USD 6,475,000 Niska Gas Storage US LLC/Niska Gas
Storage Canada ULC 8.875% 15/3/2018 6,442,625 0.57
USD 5,530,000 NRG Energy Inc '144A' 7.625% 15/1/2018 5,371,013 0.48
USD 2,115,000 Oasis Petroleum Inc '144A' 7.25%
1/2/2019 2,077,987 0.18
USD 1,735,000 Oil States International Inc '144A' 6.5%
1/6/2019 1,735,000 0.15
USD 2,075,000 Omnicare Inc 6.875% 15/12/2015 2,126,875 0.19
USD 2,270,000 Omnova Solutions Inc 7.875% 1/11/2018 2,091,238 0.19
USD 20,000 Oshkosh Corp 8.25% 1/3/2017 20,650 0.00
USD 765,000 Penn Virginia Corp 7.25% 15/4/2019 731,531 0.06
USD 1,160,000 Penske Automotive Group Inc 7.75%
15/12/2016 1,183,200 0.11
USD 6,900,000 Petrohawk Energy Corp '144A' 6.25%
1/6/2019 7,995,375 0.71
Transferable Securities Admitted to an Official Stock Exchange Listing or Dealt in on Another Regulated Market
Holding Description Value (USD) %
Transferable Securities Admitted to an Official Stock Exchange Listing or Dealt in on Another Regulated Market
Holding Description Value (USD) %

172 BlackRock Global Funds (BGF)
Global High Yield Bond Fund continued
Portfolio of Investments 31 August 2011
USD 1,375,000 Petrohawk Energy Corp 7.875% 1/6/2015 1,495,313 0.13
USD 1,845,000 Petrohawk Energy Corp 10.5% 1/8/2014 2,089,462 0.19
USD 1,000,000 PH Glatfelter Co 7.125% 1/5/2016 1,020,000 0.09
USD 525,000 Phillips-Van Heusen Corp 7.75%
15/11/2023 554,152 0.05
USD 1,550,000 Pioneer Natural Resources Co 6.875%
1/5/2018 1,690,628 0.15
USD 400,000 Pioneer Natural Resources Co 7.2%
15/1/2028 434,468 0.04
USD 795,000 Plains Exploration & Production Co 6.625%
1/5/2021 795,994 0.07
USD 1,565,000 Plains Exploration & Production Co 7.75%
15/6/2015 1,619,775 0.14
USD 460,000 PolyOne Corp 7.375% 15/9/2020 473,800 0.04
EUR 1,180,000 Pregis Corp FRN 15/4/2013 1,583,111 0.14
USD 1,475,000 ProQuest LLC/ProQuest Notes Co '144A'
9% 15/10/2018 1,449,187 0.13
USD 1,780,000 PVH Corp 7.375% 15/5/2020 1,873,450 0.17
USD 1,070,000 QVC Inc '144A' 7.125% 15/4/2017 1,123,500 0.10
USD 850,000 QVC Inc '144A' 7.375% 15/10/2020 913,750 0.08
USD 1,105,000 QVC Inc '144A' 7.5% 1/10/2019 1,187,875 0.11
USD 1,705,000 Qwest Communications International Inc
Series B 7.5% 15/2/2014 1,730,575 0.15
USD 4,196,000 Qwest Communications International Inc
8% 1/10/2015 4,463,495 0.40
USD 3,860,000 Range Resources Corp 5.75% 1/6/2021 3,879,300 0.34
USD 2,000,000 Range Resources Corp 6.75% 1/8/2020 2,100,000 0.19
USD 1,510,000 Range Resources Corp 8% 15/5/2019 1,638,350 0.15
USD 8,516,000 Realogy Corp '144A' 7.875% 15/2/2019 7,110,860 0.63
USD 9,400,000 Realogy Corp 11.5% 15/4/2017 7,402,500 0.66
USD 485,000 Realogy Corp 12% 15/4/2017 388,000 0.03
USD 870,000 Reddy Ice Corp 11.25% 15/3/2015 796,050 0.07
USD 1,560,000 Regal Entertainment Group 9.125%
15/8/2018 1,579,500 0.14
USD 2,150,000 Republic Of Indonesia '144A' 4.875%
5/5/2021 2,268,250 0.20
USD 697,000 Reynolds Group Issuer Inc '144A' 8.5%
15/10/2016 712,683 0.06
USD 585,000 Reynolds Group Issuer Inc / Reynolds
Group Issuer LLC / Reynolds Group
Issuer Lu '144A' 7.125% 15/4/2019 558,675 0.05
USD 3,845,000 Reynolds Group Issuer Inc / Reynolds
Group Issuer LLC / Reynolds Group
Issuer Lu '144A' 7.875% 15/8/2019 3,825,775 0.34
USD 5,670,000 Reynolds Group Issuer Inc / Reynolds
Group Issuer LLC / Reynolds Group
Issuer Lu '144A' 8.25% 15/2/2021 4,805,325 0.43
USD 655,000 Reynolds Group Issuer Inc / Reynolds
Group Issuer LLC / Reynolds Group
Issuer Lu '144A' 9% 15/4/2019 591,137 0.05
USD 2,110,000 Reynolds Group Issuer Inc / Reynolds
Group Issuer LLC / Reynolds Group
Issuer Lu '144A' 9.875% 15/8/2019 1,988,675 0.18
USD 925,000 Rouse Co LP / TRC Co-Issuer Inc '144A'
6.75% 1/5/2013 946,969 0.08
USD 1,500,000 Rouse Co LP/The 6.75% 9/11/2015 1,520,625 0.14
USD 990,000 Rouse Co LP/The 7.2% 15/9/2012 1,027,125 0.09
USD 2,479,000 RSC Equipment Rental Inc/RSC Holdings
III LLC 8.25% 1/2/2021 2,317,865 0.21
USD 3,015,000 RSC Equipment Rental Inc/RSC Holdings
III LLC '144A' 10% 15/7/2017 3,256,200 0.29
USD 2,670,000 Ryland Group Inc 6.625% 1/5/2020 2,282,850 0.20
USD 5,690,000 SandRidge Energy Inc '144A' 7.5%
15/3/2021 5,497,963 0.49
USD 1,025,000 Sealed Air Corp 7.875% 15/6/2017 1,079,680 0.10
USD 4,180,000 Sequa Corp '144A' 11.75% 1/12/2015 4,389,000 0.39
USD 2,846,701 Sequa Corp '144A' 13.5% 1/12/2015 3,038,853 0.27
USD 3,275,000 SESI LLC '144A' 6.375% 1/5/2019 3,250,437 0.29
USD 3,700,000 Shea Homes LP / Shea Homes Funding
Corp '144A' 8.625% 15/5/2019 3,135,750 0.28
USD 670,000 Sinclair Television Group Inc 8.375%
15/10/2018 675,025 0.06
USD 3,260,000 SM Energy Co '144A' 6.625% 15/2/2019 3,276,300 0.29
USD 2,366,000 Solutia Inc 7.875% 15/3/2020 2,519,790 0.22
USD 414,000 Solutia Inc 8.75% 1/11/2017 441,945 0.04
USD 1,425,000 Sonic Automotive Inc 9% 15/3/2018 1,446,375 0.13
USD 840,000 Spansion LLC '144A' 7.875% 15/11/2017 861,000 0.08
USD 8,070,000 Sprint Capital Corp 6.875% 15/11/2028 7,141,950 0.63
USD 815,000 SPX Corp 6.875% 1/9/2017 851,675 0.08
USD 243,000 Standard Pacific Corp 8.375% 15/5/2018 208,373 0.02
USD 4,920,000 Standard Pacific Corp 8.375% 15/1/2021 4,108,200 0.37
USD 1,885,000 Standard Pacific Corp 10.75% 15/9/2016 1,866,150 0.17
USD 1,015,000 SunCoke Energy Inc '144A' 7.625%
1/8/2019 999,775 0.09
USD 3,180,000 SunGard Data Systems Inc 7.375%
15/11/2018 3,036,900 0.27
USD 1,710,000 SunGard Data Systems Inc 7.625%
15/11/2020 1,641,600 0.15
USD 1,235,000 SunGard Data Systems Inc 10.625%
15/5/2015 1,302,925 0.12
USD 1,850,000 Symbion Inc '144A' 8% 15/6/2016 1,739,000 0.15
USD 2,625,000 Targa Resources Partners LP / Targa
Resources Partners Finance Corp
'144A' 6.875% 1/2/2021 2,565,937 0.23
USD 8,330,000 Tenet Healthcare Corp 8.875% 1/7/2019 8,871,450 0.79
USD 1,000,000 Tenneco Inc 7.75% 15/8/2018 1,040,000 0.09
USD 747,000 Thermon Industries Inc 9.5% 1/5/2017 784,350 0.07
USD 1,075,000 Titan International Inc 7.875% 1/10/2017 1,134,125 0.10
USD 970,000 Toys R US - Delaware Inc '144A' 7.375%
1/9/2016 938,475 0.08
USD 165,000 TPC Group LLC '144A' 8.25% 1/10/2017 168,919 0.01
USD 305,000 Travelport LLC FRN 1/9/2014 232,562 0.02
USD 65,000 Travelport LLC 9.875% 1/9/2014 * 55,412 0.00
USD 1,470,000 Travelport LLC/Travelport Inc 9% 1/3/2016 1,183,350 0.11
USD 510,000 tw telecom holdings inc 8% 1/3/2018 527,850 0.05
USD 1,080,288 United Air Lines Inc 12.75% 15/7/2012 1,131,602 0.10
USD 275,000 United States Steel Corp 7.375%
1/4/2020 * 262,625 0.02
USD 2,110,000 US Airways 2011-1 Class C Pass Through
Trust 10.875% 22/10/2014 2,046,700 0.18
USD 5,050,000 Valeant Pharmaceuticals International
'144A' 6.5% 15/7/2016 4,721,750 0.42
USD 200,000 Verso Paper Holdings LLC / Verso Paper
Inc Series B FRN 1/8/2014 165,000 0.01
USD 2,043,000 Verso Paper Holdings LLC / Verso Paper
Inc 11.5% 1/7/2014 2,165,580 0.19
USD 355,000 West Corp 8.625% 1/10/2018 353,225 0.03
USD 775,000 Whiting Petroleum Corp 6.5% 1/10/2018 778,875 0.07
USD 3,544,000 Windstream Corp 7.875% 1/11/2017 3,703,480 0.33
USD 560,000 WMG Acquisition Corp '144A' 9.5%
15/6/2016 572,600 0.05
USD 2,720,000 WMG Acquisition Corp '144A' 11.5%
1/10/2018 2,475,200 0.22
735,320,369 65.38
Total Bonds 1,030,364,979 91.61
Total Transferable Securities Admitted
to an Official Stock Exchange Listing or
Dealt in on Another Regulated Market 1,040,816,108 92.54
Transferable Securities Admitted to an Official Stock Exchange Listing or Dealt in on Another Regulated Market
Holding Description Value (USD) %
Transferable Securities Admitted to an Official Stock Exchange Listing or Dealt in on Another Regulated Market
Holding Description Value (USD) %

* Securities lent, see Note 11, for further details.
Audited Annual Report and Accounts 173
The notes on pages 261 to 270 form an integral part of these financial statements.
Global High Yield Bond Fund continued
Portfolio of Investments 31 August 2011
PREFERRED STOCKS (SHARES) & WARRANTS
United States 14,331 Ally Financial Inc (Pref) 10,487,605 0.93
14,085 Healthsouth Corp (Wts 16/1/2014) – 0.00
10,487,605 0.93
Preferred Stocks (Shares) & Warrants 10,487,605 0.93
BONDS
Iceland USD 1,030,000 Glitnir Banki HF (Defaulted) 6.375%
25/9/2012 – 0.00
Luxembourg EUR 800,000 Capsugel FinanceCo SCA '144A' 9.875%
1/8/2019 1,101,890 0.10
EUR 1,000,000 ConvaTec Healthcare E SA '144A' 7.375%
15/12/2017 1,292,518 0.12
EUR 580,000 Greif Luxembourg Finance SCA '144A'
7.375% 15/7/2021 825,883 0.07
EUR 75,000 Hayes Lemmerz Finance LLC - Luxembourg
SCA (Defaulted) 8.25% 15/6/2015 3,791 0.00
3,224,082 0.29
United Kingdom GBP 1,426,000 Boparan Finance Plc 9.875%
30/4/2018 1,858,848 0.16
United States USD 2,175,000 Chemtura Corp 7.875% 1/9/2018 2,245,688 0.20
USD 160,000 Lear Corp 0% 1/12/2013 (Zero Coupon) 3,200 0.00
USD 500,000 Lear Corp 0% 1/8/2014 (Zero Coupon) 10,000 0.00
EUR 6,110,000 Lehman Brothers Holdings Inc (Defaulted)
4.75% 16/1/2014 1,897,113 0.17
EUR 1,050,000 Lehman Brothers Holdings Inc (Defaulted)
5.375% 17/10/2012 367,718 0.03
EUR 2,042,000 Lehman Brothers Holdings Inc (Defaulted)
6.375% 10/5/2011 722,496 0.07
EUR 2,114,910 Lyondell Chemical Co 8% 1/11/2017 3,241,330 0.29
USD 1,618,500 National Air Cargo Group Inc Series 1
12.375% 16/8/2015 1,683,092 0.15
USD 1,635,000 National Air Cargo Group Inc Series 2
12.375% 16/8/2015 1,700,241 0.15
USD 990,000 Old AII Inc (Defaulted) 9% 15/12/2014 4,950 0.00
USD 1,050,000 Old AII Inc (Defaulted) 10% 15/12/2016 * 2,730 0.00
EUR 2,275,000 Reynolds Group Issuer Inc 8.75%
15/10/2016 3,170,460 0.28
USD 100,000 Tropicana Entertainment LLC / Tropicana
Finance Corp 9.625% 15/12/2014 113 0.00
EUR 13,830,000 WinStar Communications Inc (Defaulted)
12.75% 15/4/2010 – 0.00
15,049,131 1.34
Total Bonds 20,132,061 1.79
Total Unquoted Securities 30,619,666 2.72
Total Portfolio 1,071,435,774 95.26
Other Net Assets 53,289,055 4.74
Total Net Assets (USD) 1,124,724,829 100.00
Unquoted Securities
Holding Description Value (USD) %
Unquoted Securities
Holding Description Value (USD) %

174 BlackRock Global Funds (BGF)
Global High Yield Bond Fund continued
Note: The total market value of USD (398,430) of these transactions is included in the Statement of Net Assets (see Note 2c).
Nominal Value Description
Unrealisedprofit/(loss)
USD
Nominal Value Description
Unrealisedprofit/(loss)
USD
Swaps as at 31 August 2011
USD 900,000 Credit Default Swaps (Deutsche Bank) (Fund receives
default protection on Hungary Government
International Bond 4.75% 3/2/2015; and pays
Fixed 1%) (20/12/2015) 20,880
USD (2,000,000) Credit Default Swaps (Union Bank of Switzerland)
(Fund provides default protection on Level 3
Communications Inc 15% 15/1/2013; and receives
Fixed 5%) (20/3/2016) 24,328
USD (3,000,000) Credit Default Swaps (Union Bank of Switzerland)
(Fund provides default protection on Level 3
Communications Inc 15% 15/1/2013; and receives
Fixed 5%) (20/3/2016) (53,507)
USD (1,750,000) Credit Default Swaps (JP Morgan) (Fund provides
default protection on Aramark Corporation 8.5%
1/2/2015; and receives Fixed 5%) (20/6/2016) (85,599)
USD (700,000) Credit Default Swaps (JP Morgan) (Fund provides
default protection on Aramark Corporation 8.5%
1/2/2015; and receives Fixed 5%) (20/6/2016) (34,538)
USD (2,500,000) Credit Default Swaps (Credit Suisse) (Fund provides
default protection on Aramark Corporation 8.5%
1/2/2015; and receives Fixed 5%) (20/9/2016) (140,788)
USD 575,000 Credit Default Swaps (Morgan Stanley) (Fund receives
default protection on Beazer Homes USA Inc 9.125%
15/6/2018; and pays Fixed 5%) (20/9/2016) (27,458)
(296,682)
Open Forward Foreign Exchange Transactionsas at 31 August 2011
Purchases Sales Value date Unrealised
profit/(loss)
Unrealisedprofit/(loss)
USD Equivalent
Core Fund USD
GBP 575,000 USD 924,368 7/10/2011 13,509 13,509
USD 56,920,395 GBP 35,606,000 7/10/2011 (1,156,196) (1,156,196)
EUR 3,826,827 USD 5,440,907 26/10/2011 82,135 82,135
USD 202,428,134 EUR 141,196,500 26/10/2011 (1,352,762) (1,352,762)
Net unrealised loss (2,413,314) (2,413,314)
EUR Hedged Share Class EUR
EUR 573,918,292 USD 814,089,229 14/9/2011 10,119,064 14,614,477
USD 102,522,323 EUR 71,752,801 14/9/2011 (750,748) (1,084,269)
Net unrealised profit 9,368,316 13,530,208
GBP Hedged Share Class GBP
GBP 45,355,337 USD 74,143,968 14/9/2011 (89,328) (145,770)
USD 4,478,314 GBP 2,749,437 14/9/2011 (4,567) (7,453)
Net unrealised loss (93,895) (153,223)
Total net unrealised profit 10,963,671
Note: The net unrealised profit attributed to these transactions is included in the Statement
of Net Assets (see Note 2c).
Open Futures Contractsas at 31 August 2011
Numberof contracts Contract/Description
Expirationdate
ValueUSD
(380) E-mini S&P500 September 2011 (23,080,250)
Total commitment (23,080,250)
Note: The net unrealised loss of USD 1,223,744 attributed to this transaction is included
in the Statement of Net Assets (see Note 2c).

Audited Annual Report and Accounts 175
The notes on pages 261 to 270 form an integral part of these financial statements.
Global Inflation Linked Bond Fund
Portfolio of Investments 31 August 2011
FUNDS
Ireland 26,428,803 Institutional Cash Series Plc - Institutional
US Dollar Liquidity Fund 26,428,803 8.42
Total Funds 26,428,803 8.42
BONDS
Australia AUD 800,000 Australia Government Bond 2.5%
20/9/2030 944,586 0.30
AUD 2,915,000 Australia Government Bond 3%
20/9/2025 3,736,564 1.19
AUD 370,000 New South Wales Treasury Corp 2.75%
20/11/2025 449,241 0.14
5,130,391 1.63
Canada CAD 602,000 Canadian Government Bond 2% 1/12/2041 879,002 0.28
CAD 372,000 Canadian Government Bond 3% 1/12/2036 665,893 0.21
CAD 277,000 Canadian Government Bond 4% 1/12/2031 600,004 0.19
CAD 136,000 Canadian Government Bond 4.25%
1/12/2021 281,705 0.09
CAD 350,000 Canadian Government Bond 4.25%
1/12/2026 752,408 0.24
3,179,012 1.01
France EUR 1,438,000 France Government Bond OAT 1%
25/7/2017 2,378,079 0.76
EUR 120,000 France Government Bond OAT 1.1%
25/7/2022 181,179 0.06
EUR 1,605,000 France Government Bond OAT 1.6%
25/7/2015 2,818,516 0.90
EUR 320,000 France Government Bond OAT 1.8%
25/7/2040 554,824 0.17
EUR 1,540,000 France Government Bond OAT 2.1%
25/7/2023 2,671,877 0.85
EUR 790,000 France Government Bond OAT 2.25%
25/7/2020 1,491,322 0.47
EUR 1,725,000 France Government Bond OAT 2.5%
25/7/2013 3,036,975 0.97
EUR 493,000 France Government Bond OAT 3.15%
25/7/2032 ‡ 1,105,092 0.35
EUR 1,438,000 France Government Bond OAT 3.4%
25/7/2029 3,390,746 1.08
17,628,610 5.61
Germany EUR 6,058,000 Bundesrepublik Deutschland Bundesobligation
Inflation Linked Bond 2.25% 15/4/2013 9,965,853 3.17
EUR 4,040,000 Deutsche Bundesrepublik Inflation Linked
Bond 1.5% 15/4/2016 6,956,101 2.22
EUR 2,700,000 Deutsche Bundesrepublik Inflation Linked
Bond 1.75% 15/4/2020 4,582,440 1.46
21,504,394 6.85
Italy EUR 1,070,000 Italy Buoni Poliennali Del Tesoro 2.1%
15/9/2016 1,506,179 0.48
EUR 1,426,000 Italy Buoni Poliennali Del Tesoro 2.1%
15/9/2017 2,131,921 0.68
EUR 7,513,000 Italy Buoni Poliennali Del Tesoro 2.1%
15/9/2021 9,617,917 3.06
EUR 3,578,000 Italy Buoni Poliennali Del Tesoro 2.15%
15/9/2014 5,937,102 1.89
EUR 1,993,000 Italy Buoni Poliennali Del Tesoro 2.35%
15/9/2019 2,794,405 0.89
EUR 515,000 Italy Buoni Poliennali Del Tesoro 2.35%
15/9/2035 640,252 0.20
EUR 4,320,000 Italy Buoni Poliennali Del Tesoro 2.55%
15/9/2041 4,786,345 1.53
27,414,121 8.73
Japan JPY 550,600,000 Japanese Government CPI Linked Bond
1.2% 10/12/2017 7,277,527 2.32
Sweden SEK 5,405,000 Sweden Government Bond 3.5%
1/12/2015 1,182,174 0.38
SEK 4,735,000 Sweden Government Bond 3.5%
1/12/2028 1,336,442 0.42
SEK 7,120,000 Sweden Government Bond 4%
1/12/2020 1,894,237 0.60
4,412,853 1.40
United Kingdom GBP 840,000 United Kingdom Gilt Inflation Linked 0.5%
22/3/2050 1,528,705 0.49
GBP 3,365,000 United Kingdom Gilt Inflation Linked 0.625%
22/3/2040 6,194,707 1.97
GBP 1,170,000 United Kingdom Gilt Inflation Linked 0.625%
22/11/2042 2,218,737 0.71
GBP 1,735,000 United Kingdom Gilt Inflation Linked 0.75%
22/3/2034 3,040,079 0.97
GBP 2,252,000 United Kingdom Gilt Inflation Linked 0.75%
22/11/2047 4,563,877 1.45
GBP 2,180,000 United Kingdom Gilt Inflation Linked 1.125%
22/11/2037 4,808,855 1.53
GBP 8,472,000 United Kingdom Gilt Inflation Linked 1.25%
22/11/2017 18,880,943 6.01
GBP 3,539,000 United Kingdom Gilt Inflation Linked 1.25%
22/11/2027 7,984,495 2.54
GBP 3,178,000 United Kingdom Gilt Inflation Linked 1.25%
22/11/2032 6,574,431 2.10
GBP 931,000 United Kingdom Gilt Inflation Linked 1.25%
22/11/2055 2,464,716 0.79
GBP 1,505,000 United Kingdom Gilt Inflation Linked 1.875%
22/11/2022 3,351,423 1.07
GBP 927,000 United Kingdom Gilt Inflation Linked 2%
26/1/2035 2,730,725 0.87
GBP 1,284,000 United Kingdom Gilt Inflation Linked 2.5%
16/8/2013 5,970,304 1.90
GBP 1,019,000 United Kingdom Gilt Inflation Linked 2.5%
26/7/2016 5,596,379 1.78
GBP 480,000 United Kingdom Gilt Inflation Linked 2.5%
16/4/2020 2,709,008 0.86
78,617,384 25.04
United States USD 12,785,000 United States Treasury Inflation Indexed
Bonds 0.125% 15/4/2016 13,659,877 4.35
USD 1,802,000 United States Treasury Inflation Indexed
Bonds 0.5% 15/4/2015 1,971,197 0.63
Transferable Securities Admitted to an Official Stock Exchange Listing or Dealt in on Another Regulated Market
Holding Description Value (USD) %
Transferable Securities Admitted to an Official Stock Exchange Listing or Dealt in on Another Regulated Market
Holding Description Value (USD) %

‡ Securities given in guarantee, see Note 12, for further details.
176 BlackRock Global Funds (BGF)
Portfolio of Investments 31 August 2011
USD 861,000 United States Treasury Inflation Indexed
Bonds 0.625% 15/4/2013 940,095 0.30
USD 1,000,000 United States Treasury Inflation Indexed
Bonds 0.625% 15/7/2021 1,050,365 0.33
USD 10,095,000 United States Treasury Inflation Indexed
Bonds 1.125% 15/1/2021 11,447,747 3.65
USD 145,000 United States Treasury Inflation Indexed
Bonds 1.375% 15/7/2018 170,183 0.05
USD 1,328,000 United States Treasury Inflation Indexed
Bonds 1.625% 15/1/2015 1,705,389 0.54
USD 4,129,000 United States Treasury Inflation Indexed
Bonds 1.875% 15/7/2013 5,342,274 1.70
USD 1,699,700 United States Treasury Inflation Indexed
Bonds 1.875% 15/7/2015 2,187,493 0.70
USD 895,000 United States Treasury Inflation Indexed
Bonds 1.875% 15/7/2019 1,100,568 0.35
USD 14,056,700 United States Treasury Inflation Indexed
Bonds 2% 15/4/2012 15,872,445 5.06
USD 2,210,000 United States Treasury Inflation Indexed
Bonds 2% 15/1/2014 2,890,944 0.92
USD 4,919,500 United States Treasury Inflation Indexed
Bonds 2% 15/7/2014 6,396,377 2.04
USD 450,000 United States Treasury Inflation Indexed
Bonds 2% 15/1/2016 575,004 0.18
USD 107,100 United States Treasury Inflation Indexed
Bonds 2.125% 15/1/2019 132,549 0.04
USD 15,487,800 United States Treasury Inflation Indexed
Bonds 2.125% 15/2/2040 20,164,404 6.42
USD 10,546,400 United States Treasury Inflation Indexed
Bonds 2.125% 15/2/2041 13,622,613 4.34
USD 2,000,000 United States Treasury Inflation Indexed
Bonds 2.375% 15/1/2017 2,600,781 0.83
USD 1,831,200 United States Treasury Inflation Indexed
Bonds 2.375% 15/1/2025 ‡ 2,743,715 0.87
USD 1,984,000 United States Treasury Inflation Indexed
Bonds 2.5% 15/1/2029 2,684,845 0.86
USD 6,855,000 United States Treasury Inflation Indexed
Bonds 3% 15/7/2012 8,908,668 2.84
USD 294,000 United States Treasury Inflation Indexed
Bonds 3.375% 15/1/2012 378,554 0.12
USD 755,800 United States Treasury Inflation Indexed
Bonds 3.375% 15/4/2032 1,422,225 0.45
USD 1,523,000 United States Treasury Inflation Indexed
Bonds 3.625% 15/4/2028 3,073,654 0.98
USD 927,000 United States Treasury Inflation Indexed
Bonds 3.875% 15/4/2029 1,921,193 0.61
USD 660,000 United States Treasury Note/Bond 1.5%
31/7/2016 678,691 0.22
USD 7,550,000 United States Treasury Note/Bond 3.125%
15/5/2021 8,203,547 2.61
131,845,397 41.99
Total Bonds 297,009,689 94.58
Total Transferable Securities Admitted
to an Official Stock Exchange Listing or
Dealt in on Another Regulated Market 323,438,492 103.00
Total Portfolio 323,438,492 103.00
Other Net Liabilities (9,422,326) (3.00)
Total Net Assets (USD) 314,016,166 100.00
Global Inflation Linked Bond Fund continued
Transferable Securities Admitted to an Official Stock Exchange Listing or Dealt in on Another Regulated Market
Holding Description Value (USD) %
Transferable Securities Admitted to an Official Stock Exchange Listing or Dealt in on Another Regulated Market
Holding Description Value (USD) %
Note: The total market value of USD 109,905 of these transactions is included in the Statement of Net Assets (see Note 2c).
Nominal Value Description
Unrealisedprofit/(loss)
USD
Nominal Value Description
Unrealisedprofit/(loss)
USD
Swaps as at 31 August 2011
USD 2,500,000 Inflation Swap (Deutsche Bank) (Fund pays Fixed
1.84%; and recieves Floating USCPIU + 0bps)
(25/10/2015) 40,955
USD 1,350,000 Inflation Swap (Deutsche Bank) (Fund pays Floating
USCPIU + 0bps; and receives Fixed 2.465%)
(25/10/2020) (3,706)
USD 2,855,000 Inflation Swap (Deutsche Bank) (Fund receives
Fixed 2.665%; and pays USCPIU + 0bps)
(23/6/2021) 72,656
109,905

Audited Annual Report and Accounts 177
The notes on pages 261 to 270 form an integral part of these financial statements.
Global Inflation Linked Bond Fund continued
Open Futures Contractsas at 31 August 2011
Numberof contracts Contract/Description
Expirationdate
ValueUSD
38 Euro Bund September 2011 7,399,731
(9) Euro BOBL September 2011 (1,586,201)
(11) Australian 10 Year Bond September 2011 (9,014,221)
186 US Treasury 10 Year Note December 2011 24,060,844
56 US Treasury 5 Year Note (CBT) December 2011 6,868,312
(84) US Ultra Bond (CBT) December 2011 (12,135,375)
(158) US Treasury 2 Year Note (CBT) December 2011 (34,839,000)
(113) Banker's Acceptance Future June 2012 (28,721,502)
Total commitment (47,967,412)
Note: The net unrealised gain of USD 48,192 attributed to these transactions is included
in the Statement of Net Assets (see Note 2c).
Open Forward Foreign Exchange Transactionsas at 31 August 2011
Purchases Sales Value date Unrealised
profit/(loss)
Unrealisedprofit/(loss)
USD Equivalent
Core Fund USD
GBP 1,839,300 USD 2,965,358 7/10/2011 34,706 34,706
USD 4,820,003 AUD 4,646,500 7/10/2011 (130,234) (130,234)
USD 3,180,694 CAD 3,142,500 7/10/2011 (45,736) (45,736)
USD 80,585,207 GBP 50,230,500 7/10/2011 (1,345,260) (1,345,260)
USD 6,446,527 JPY 522,466,500 7/10/2011 (368,991) (368,991)
USD 4,252,722 SEK 27,128,000 7/10/2011 (21,359) (21,359)
EUR 3,565,000 USD 5,108,086 26/10/2011 37,076 37,076
USD 72,363,513 EUR 50,494,000 26/10/2011 (511,611) (511,611)
JPY 111,325,000 USD 1,397,662 5/12/2011 55,477 55,477
USD 5,404,375 JPY 436,769,730 5/12/2011 (296,835) (296,835)
Net unrealised loss (2,592,767) (2,592,767)
EUR Hedged Share Class EUR
EUR 106,126,889 USD 150,653,054 14/9/2011 1,791,795 2,587,803
USD 7,413,215 EUR 5,132,141 14/9/2011 1,897 2,740
Net unrealised profit 1,793,692 2,590,543
Total net unrealised loss (2,224)
Note: The net unrealised loss attributed to these transactions is included in the Statement
of Net Assets (see Note 2c).

178 BlackRock Global Funds (BGF)
Global Opportunities Fund
Portfolio of Investments 31 August 2011
COMMON / PREFERRED STOCKS (SHARES)
Australia 11,900 BHP Billiton Ltd 506,175 0.48
17,900 Newcrest Mining Ltd 771,161 0.74
84,460 PanAust Ltd 329,063 0.32
1,606,399 1.54
Austria 7,900 Erste Group Bank AG 288,244 0.28
Belgium 17,200 Anheuser-Busch InBev NV 955,077 0.91
Brazil 58,900 Banco Bradesco SA (Pref) 1,036,401 0.99
103,100 BM&F - Bovespa 607,095 0.58
1,643,496 1.57
Canada 13,400 Enbridge Inc 440,077 0.42
23,000 First Quantum Minerals Ltd 557,299 0.54
37,000 Manulife Financial Corp * 517,080 0.50
20,800 Petrominerales Ltd 659,807 0.63
14,500 Suncor Energy Inc 468,007 0.45
6,400 Toronto-Dominion Bank/The * 503,170 0.48
10,000 TransCanada Corp 430,146 0.41
3,575,586 3.43
Cayman Islands 14,900 Lentuo International Inc ADR 94,466 0.09
18,000 New Oriental Education & Technology
Group ADR 534,060 0.51
22,100 Tencent Holdings Ltd 524,610 0.50
1,153,136 1.10
China 913,900 China Construction Bank Corp 'H' 677,796 0.65
183,300 China Merchants Bank Co Ltd 'H' 390,900 0.37
1,068,696 1.02
Denmark 5,400 Carlsberg A/S 'B' 404,022 0.39
France 7,450 BNP Paribas SA 381,996 0.36
8,300 Danone 569,777 0.54
3,600 LVMH Moet Hennessy Louis Vuitton SA 612,437 0.59
7,400 Sanofi-Aventis SA 541,070 0.52
5,000 Technip SA 488,413 0.47
2,400 Unibail-Rodamco SE (Reit) 519,896 0.50
3,113,589 2.98
Germany 10,200 BASF SE 732,910 0.70
6,100 Bayerische Motoren Werke AG 493,323 0.47
4,900 Continental AG 362,168 0.35
13,900 Deutsche Bank AG 566,581 0.54
10,100 K+S AG 721,567 0.69
13,400 Kabel Deutschland Holding AG 765,068 0.73
7,500 Merck KGaA 672,507 0.65
8,600 Metro AG 380,540 0.37
14,200 SAP AG ADR 780,432 0.75
3,130 Volkswagen AG (Pfd Non-Vtg) 523,892 0.50
5,998,988 5.75
Hong Kong 190,400 AIA Group Ltd 668,185 0.64
160,400 China Resources Enterprise Ltd 650,375 0.62
319,100 China Unicom Hong Kong Ltd 675,589 0.65
26,500 Hong Kong Exchanges and Clearing Ltd 495,765 0.48
110,100 Wharf Holdings Ltd 700,715 0.67
3,190,629 3.06
Indonesia 1,891,800 Adaro Energy Tbk PT 448,950 0.43
Ireland 11,700 Accenture Plc 'A' 632,268 0.61
Japan 23,700 Bridgestone Corp 523,885 0.50
16,200 Daikin Industries Ltd 507,042 0.49
83,500 Hino Motors Ltd 480,223 0.46
155 Japan Tobacco Inc 664,026 0.64
67,400 Mitsubishi Chemical Holdings Corp 469,374 0.45
21,900 Nabtesco Corp 486,095 0.47
6,200 ORIX Corp 557,903 0.53
3,800 SMC Corp/Japan 597,653 0.57
21,700 Softbank Corp 715,127 0.68
34,000 Sumitomo Electric Industries Ltd 450,052 0.43
17,700 Sumitomo Mitsui Financial Group Inc * 520,520 0.50
5,971,900 5.72
Luxembourg 25,100 ArcelorMittal 555,867 0.53
29,000 Subsea 7 SA 677,102 0.65
1,232,969 1.18
Malaysia 148,800 CIMB Group Holdings Bhd 352,671 0.34
Mexico 8,400 Fomento Economico Mexicano SAB
de CV ADR 573,636 0.55
63,100 Grupo Modelo SAB de CV 'C' 370,580 0.35
944,216 0.90
Netherlands 80,700 Aegon NV 362,450 0.35
10,900 Akzo Nobel NV 561,255 0.54
17,200 ASML Holding NV 611,547 0.58
4,200 Corio NV (Reit) 246,560 0.24
16,100 Unilever NV * 544,885 0.52
2,326,697 2.23
Netherlands Antilles 10,800 Schlumberger Ltd 847,908 0.81
Norway 37,700 DnB NOR ASA 453,144 0.43
Singapore 159,900 Sakari Resources Ltd 362,985 0.35
South Africa 8,200 Naspers Ltd 'N' 426,288 0.41
Transferable Securities Admitted to an Official Stock Exchange Listing or Dealt in on Another Regulated Market
Holding Description Value (USD) %
Transferable Securities Admitted to an Official Stock Exchange Listing or Dealt in on Another Regulated Market
Holding Description Value (USD) %

* Securities lent, see Note 11, for further details.
Audited Annual Report and Accounts 179
The notes on pages 261 to 270 form an integral part of these financial statements.
Global Opportunities Fund continued
Portfolio of Investments 31 August 2011
South Korea 18,100 Dongbu Insurance Co Ltd 878,830 0.84
4,000 GS Engineering & Construction Corp 389,933 0.37
10,800 Hyundai Engineering & Construction Co Ltd 718,751 0.69
6,000 Kia Motors Corp 397,057 0.38
30,100 KT Corp ADR 516,215 0.50
6,500 Samsung Life Insurance Co Ltd 517,880 0.50
3,418,666 3.28
Spain 44,100 Telefonica SA 921,554 0.88
Switzerland 14,700 Adecco SA 689,010 0.66
7,100 Julius Baer Group Ltd 292,785 0.28
6,800 Roche Holding AG 1,179,715 1.13
19,500 UBS AG 281,675 0.27
25,600 Weatherford International Ltd 439,552 0.42
2,882,737 2.76
Taiwan 728,420 First Financial Holding Co Ltd 559,946 0.54
195,000 Nan Ya Plastics Corp 464,486 0.44
1,024,432 0.98
Thailand 104,700 Bangkok Bank PCL 571,186 0.55
32,500 Banpu PCL 688,342 0.66
1,259,528 1.21
United Kingdom 169,900 Afren Plc 290,264 0.28
19,800 Antofagasta Plc 434,551 0.42
190,200 Barclays Plc 526,347 0.50
1,300 Bellway Plc 12,622 0.01
24,700 BG Group Plc 534,031 0.51
17,800 GlaxoSmithKline Plc 381,798 0.37
128,800 HSBC Holdings Plc 1,121,674 1.08
16,400 Kazakhmys Plc 290,086 0.28
67,400 National Grid Plc 681,876 0.65
48,600 Royal Dutch Shell Plc 'A' 1,630,068 1.56
17,400 Unilever Plc 583,181 0.56
38,500 Vodafone Group Plc ADR 1,026,795 0.98
30,600 Xstrata Plc 543,255 0.52
8,056,548 7.72
United States 9,200 Allergan Inc/United States 752,560 0.72
22,500 American Electric Power Co Inc 869,175 0.83
8,900 Ameriprise Financial Inc 408,777 0.39
2,900 Apple Inc 1,130,246 1.08
32,500 Applied Materials Inc 374,075 0.36
31,500 AT&T Inc 939,960 0.90
4,600 Baxter International Inc 259,072 0.25
14,200 Bristol-Myers Squibb Co 420,178 0.40
13,300 Broadcom Corp 'A' 477,869 0.46
9,400 Celgene Corp 564,752 0.54
27,490 Citigroup Inc 860,712 0.82
8,600 Citrix Systems Inc 516,387 0.49
6,400 Clorox Co 450,240 0.43
46,400 Comcast Corp 'A' 1,011,056 0.97
13,400 Comerica Inc 341,700 0.33
24,700 ConAgra Foods Inc 607,373 0.58
9,500 Costco Wholesale Corp 746,130 0.71
14,300 Crown Holdings Inc 511,225 0.49
19,500 CVS Caremark Corp 702,585 0.67
12,200 Darden Restaurants Inc 596,580 0.57
13,300 Dominion Resources Inc/VA 650,237 0.62
16,800 Dover Corp 985,320 0.94
17,900 Dow Chemical Co/The 519,637 0.50
19,900 eBay Inc 621,676 0.60
23,400 EMC Corp/Massachusetts 526,968 0.51
16,700 Exelon Corp 719,770 0.69
22,600 Exxon Mobil Corp 1,688,220 1.62
6,200 F5 Networks Inc 508,431 0.49
7,400 Federal Realty Investment Trust (Reit) 668,294 0.64
11,100 FedEx Corp 890,442 0.85
11,000 Freeport-McMoRan Copper & Gold Inc 529,430 0.51
55,900 General Electric Co 918,996 0.88
2,500 Google Inc 'A' 1,362,375 1.31
9,900 Halliburton Co 440,946 0.42
9,700 Henry Schein Inc 644,371 0.62
16,500 HJ Heinz Co 867,570 0.83
26,400 Huntsman Corp 356,136 0.34
11,500 Informatica Corp 509,105 0.49
11,000 Johnson & Johnson 726,330 0.70
33,100 JPMorgan Chase & Co 1,250,518 1.20
13,300 Kellogg Co 721,392 0.69
62,500 KeyCorp 416,875 0.40
26,800 Kraft Foods Inc 'A' 937,196 0.90
15,700 Las Vegas Sands Corp 739,784 0.71
20,800 Liberty Global Inc 'A' 828,464 0.79
18,200 Merck & Co Inc 602,420 0.58
18,200 MetLife Inc 614,614 0.59
6,400 National Oilwell Varco Inc 432,768 0.41
40,700 News Corp 'A' 709,401 0.68
10,600 NII Holdings Inc 404,867 0.39
8,000 NIKE Inc 'B' 700,560 0.67
12,100 Norfolk Southern Corp 827,156 0.79
9,500 Occidental Petroleum Corp 837,615 0.80
21,300 PepsiCo Inc/NC 1,376,832 1.32
34,800 Pfizer Inc 663,984 0.64
32,400 PPL Corp 926,640 0.89
19,700 Procter & Gamble Co 1,255,481 1.20
18,700 QLIK Technologies Inc 480,964 0.46
24,700 Reynolds American Inc 928,226 0.89
12,400 Rowan Cos Inc 455,576 0.44
7,200 Sohu.com Inc 596,808 0.57
97,600 Sprint Nextel Corp 353,312 0.34
11,500 SPX Corp 667,575 0.64
8,000 Stanley Black & Decker Inc 502,400 0.48
9,000 Teradata Corp 469,260 0.45
20,800 Texas Instruments Inc 549,328 0.53
17,600 Verizon Communications Inc 643,808 0.62
6,500 Whole Foods Market Inc 425,425 0.41
46,994,155 45.03
Total Common / Preferred Stocks (Shares) 101,555,478 97.30
Total Transferable Securities Admitted
to an Official Stock Exchange Listing or
Dealt in on Another Regulated Market 101,555,478 97.30
Total Portfolio 101,555,478 97.30
Other Net Assets 2,815,181 2.70
Total Net Assets (USD) 104,370,659 100.00
Transferable Securities Admitted to an Official Stock Exchange Listing or Dealt in on Another Regulated Market
Holding Description Value (USD) %
Transferable Securities Admitted to an Official Stock Exchange Listing or Dealt in on Another Regulated Market
Holding Description Value (USD) %

180 BlackRock Global Funds (BGF)
Global Opportunities Fund continued
Open Forward Foreign Exchange Transactionsas at 31 August 2011
Purchases Sales
Unrealisedprofit/(loss)
USDValue date
Core Fund
AUD 1,513,000 USD 1,597,317 7/10/2011 14,586
CAD 1,977,000 USD 2,056,368 7/10/2011 (26,566)
CHF 1,171,000 USD 1,431,556 7/10/2011 23,077
EUR 3,344,000 USD 4,781,942 7/10/2011 45,221
GBP 4,366,000 USD 7,090,344 7/10/2011 30,995
HKD 3,102,000 USD 398,182 7/10/2011 (12)
JPY 439,453,000 USD 5,699,222 7/10/2011 33,394
MXN 3,270,000 USD 266,542 7/10/2011 (3,296)
NOK 542,000 USD 99,049 7/10/2011 1,985
SEK 7,810,000 USD 1,202,517 7/10/2011 27,967
SGD 3,913,258 USD 3,200,000 7/10/2011 54,442
USD 530,712 AUD 499,500 7/10/2011 (1,440)
USD 650,467 CAD 642,000 7/10/2011 (8,679)
USD 911,608 CHF 724,000 7/10/2011 12,245
USD 110,766 DKK 580,000 7/10/2011 (1,605)
USD 11,773,815 EUR 8,233,500 7/10/2011 (111,487)
USD 1,822,943 GBP 1,113,000 7/10/2011 7,540
USD 1,700,770 HKD 13,263,000 7/10/2011 (1,658)
USD 3,470,647 JPY 277,245,000 7/10/2011 (145,984)
USD 813,681 NOK 4,475,000 7/10/2011 (20,496)
USD 477,419 SGD 575,000 7/10/2011 (777)
Net unrealised loss (70,548)
Note: The net unrealised loss attributed to these transactions is included in the Statement
of Net Assets (see Note 2c).
Sector Breakdownas at 31 August 2011
% of netassets
Financials 18.36
Consumer Staples 14.08
Energy 11.74
Information Technology 10.24
Consumer Discretionary 8.93
Industrials 8.72
Materials 8.49
Healthcare 7.12
Telecommunication Services 5.94
Utilities 3.68
Other Net Assets 2.70
100.00

Audited Annual Report and Accounts 181
The notes on pages 261 to 270 form an integral part of these financial statements.
Global SmallCap Fund
Portfolio of Investments 31 August 2011
COMMON STOCKS (SHARES)
Australia 132,900 Ansell Ltd 1,978,693 0.61
594,000 Mount Gibson Iron Ltd 1,058,588 0.32
190,900 Myer Holdings Ltd 437,266 0.13
3,474,547 1.06
Austria 23,000 Schoeller-Bleckmann Oilfield Equipment AG 1,743,816 0.53
Belgium 17,200 D'ieteren SA/NV 946,383 0.29
Bermuda 1,158,500 Clear Media Ltd 500,955 0.16
11,042,700 Dominion Petroleum Ltd * 688,323 0.21
160,615 Hoegh LNG Holdings Ltd 1,140,028 0.35
44,150 Lazard Ltd 'A' 1,308,164 0.40
580,500 Ports Design Ltd 953,421 0.29
4,590,891 1.41
Brazil 44,200 Anhanguera Educacional Participacoes SA 692,562 0.21
154,300 Santos Brasil Participacoes SA 2,721,857 0.84
3,414,419 1.05
British Virgin Islands 71,800 Arcos Dorados Holdings Inc 'A' 2,017,580 0.62
Canada 13,387 Bank of Montreal 833,876 0.25
311,000 Cathedral Energy Services Ltd (Unit) 2,387,249 0.73
1,411,500 Diagnocure Inc 1,305,390 0.40
80,950 Dollarama Inc 2,760,006 0.84
1,221,400 Eastern Platinum Ltd 966,419 0.30
126,000 Eldorado Gold Corp 2,475,570 0.76
262,100 Lundin Mining Corp 1,508,245 0.46
43,200 Open Text Corp 2,542,752 0.78
171,900 Quadra FNX Mining Ltd 2,252,179 0.69
17,031,686 5.21
Cayman Islands 1,498,000 AMVIG Holdings Ltd 1,009,121 0.31
1,034,300 Daphne International Holdings Ltd 1,147,982 0.35
2,602,700 Ming Fai International Holdings Ltd 567,735 0.17
2,465,100 Polarcus Ltd 1,777,329 0.55
22,200 WuXi PharmaTech Cayman Inc ADR 291,708 0.09
4,793,875 1.47
China 2,465,200 Shenzhen Expressway Co Ltd 'H' 1,110,278 0.34
Denmark 59,000 Bavarian Nordic A/S 611,829 0.19
16,800 Topdanmark A/S 2,686,503 0.82
3,298,332 1.01
Finland 161,100 Ramirent OYJ 1,272,613 0.39
France 15,800 Bonduelle S.C.A. 1,533,345 0.47
22,225 Eurofins Scientific 1,882,771 0.58
308,000 GameLoft SA 1,774,750 0.54
77,900 Ingenico 3,206,239 0.98
42,400 Ipsen SA 1,460,693 0.45
9,857,798 3.02
Germany 29,093 Deutsche Euroshop AG 1,164,230 0.36
89,300 GEA Group AG 2,615,369 0.80
57,100 Gerresheimer AG 2,730,291 0.83
149,900 Paion AG * 366,715 0.11
39,050 Rheinmetall AG * 2,609,361 0.80
13,400 Salzgitter AG 840,733 0.26
48,500 Symrise AG 1,325,885 0.41
11,652,584 3.57
Hong Kong 5,352,500 Emperor Watch & Jewellery Ltd 1,160,689 0.35
1,262,900 Techtronic Industries Co 1,200,769 0.37
2,361,458 0.72
India 45,800 Container Corp Of India 929,377 0.29
265,300 Motherson Sumi Systems Ltd 1,078,483 0.33
519,200 United Phosphorus Ltd 1,640,469 0.50
3,648,329 1.12
Ireland 130,700 Elan Corp Plc 1,395,813 0.43
91,996 Ryanair Holdings Plc ADR 2,440,654 0.74
3,836,467 1.17
Israel 79,600 NICE Systems Ltd ADR 2,514,564 0.77
Italy 33,500 DiaSorin SpA * 1,446,054 0.44
71,700 Salvatore Ferragamo Italia SpA 1,258,082 0.39
2,704,136 0.83
Japan 106,600 Asics Corp 1,652,939 0.51
100,000 CMIC Co Ltd 1,776,213 0.54
40,300 Don Quijote Co Ltd * 1,509,410 0.46
87,400 Hisaka Works Ltd 1,052,037 0.32
363,100 Itoham Foods Inc 1,292,727 0.40
33,600 Japan Petroleum Exploration Co 1,380,282 0.42
124,500 JSR Corp 2,230,868 0.68
30,900 Koito Manufacturing Co Ltd 461,807 0.14
61,000 NGK Insulators Ltd 945,866 0.29
1,808,100 Shinsei Bank Ltd 2,145,763 0.66
108,400 Shizuoka Bank Ltd/The 1,063,078 0.32
29,300 Toyo Suisan Kaisha Ltd 771,857 0.24
16,282,847 4.98
Jersey 160,600 Charter International Plc 1,996,890 0.61
Transferable Securities Admitted to an Official Stock Exchange Listing or Dealt in on Another Regulated Market
Holding Description Value (USD) %
Transferable Securities Admitted to an Official Stock Exchange Listing or Dealt in on Another Regulated Market
Holding Description Value (USD) %

182 BlackRock Global Funds (BGF)
Global SmallCap Fund continued
Portfolio of Investments 31 August 2011
Malaysia 1,754,210 AirAsia BHD 1,952,393 0.60
Netherlands 29,500 InterXion Holding NV 376,420 0.12
Norway 1,170,700 Sevan Marine ASA * 104,962 0.03
Singapore 76,200 Avago Technologies Ltd 2,578,608 0.79
4,650,600 Cityspring Infrastructure Trust 1,527,507 0.47
2,557,830 Cityspring Infrastructure Trust - Right 2,127 0.00
1,203,800 Sakari Resources Ltd 2,732,714 0.83
6,840,956 2.09
South Korea 65,400 Dongbu Insurance Co Ltd 3,175,442 0.97
85,266 Kangwon Land Inc 2,229,855 0.69
5,405,297 1.66
Spain 138,500 Grifols SA 2,849,219 0.87
281,800 Laboratorios Farmaceuticos Rovi SA 2,116,206 0.65
4,965,425 1.52
Switzerland 28,800 Addex Pharmaceuticals Ltd 307,363 0.09
63,200 Aryzta AG 2,995,997 0.92
9,400 Basilea Pharmaceutica 451,440 0.14
137,300 Clariant AG 1,569,246 0.48
48,800 Foster Wheeler AG 1,224,392 0.38
73 Lindt & Spruengli AG * 2,693,715 0.82
29,600 Lonza Group AG 1,930,302 0.59
7,700 Sonova Holding AG 658,849 0.20
7,700 Straumann Holding AG 1,469,630 0.45
15,800 Sulzer AG 2,125,432 0.65
15,426,366 4.72
Taiwan 2,572,000 D-Link Corp 2,056,926 0.63
1,153,472 Lite-On Technology Corp 1,252,499 0.38
3,309,425 1.01
Thailand 3,046,665 Mermaid Maritime PCL 760,017 0.23
United Kingdom 222,100 Britvic Plc 1,159,717 0.36
205,150 easyJet Plc 1,145,861 0.35
54,800 Filtrona Plc 327,188 0.10
465,000 G4S Plc 1,971,268 0.60
200,300 GKN Plc 666,099 0.20
213,450 Halfords Group Plc 1,072,755 0.33
250,780 Inchcape Plc 1,318,476 0.40
57,000 Intertek Group Plc 1,870,426 0.57
113,500 Mothercare Plc 692,291 0.21
1,815,400 Premier Foods Plc 393,983 0.12
436,787 Rexam Plc 2,528,756 0.78
27,300 SDL Plc 286,436 0.09
13,433,256 4.11
United States 54,800 Acxiom Corp 607,458 0.19
58,100 Aegerion Pharmaceuticals Inc 820,372 0.25
45,300 Albemarle Corp 2,360,130 0.72
15,700 Alliant Energy Corp 637,106 0.19
102,400 American Superconductor Corp 743,424 0.23
57,900 Aqua America Inc 1,289,433 0.39
44,300 Ariba Inc 1,214,263 0.37
199,000 Arris Group Inc 2,194,970 0.67
650 Autoliv Inc 36,718 0.01
69,400 Bill Barrett Corp 3,356,184 1.03
156,000 BioMed Realty Trust Inc (Reit) 2,847,000 0.87
53,100 BMC Software Inc 2,171,259 0.66
16,325 BorgWarner Inc 1,189,603 0.36
426,700 Brocade Communications Systems Inc 1,649,196 0.50
67,800 Brown & Brown Inc 1,425,834 0.44
15,500 Cabot Oil & Gas Corp 1,203,575 0.37
121,100 Cadence Design Systems Inc 1,131,074 0.35
30,700 Camden Property Trust (Reit) 2,044,006 0.63
85,800 CB Richard Ellis Group Inc 'A' 1,278,420 0.39
50,300 Celanese Corp 'A' 2,389,250 0.73
15,300 Cepheid Inc 559,674 0.17
26,600 Checkpoint Systems Inc 413,630 0.13
65,700 Collective Brands Inc 892,863 0.27
39,200 CommonWealth REIT (Reit) 798,504 0.24
59,450 comScore Inc 991,626 0.30
85,650 Covanta Holding Corp 1,408,086 0.43
102,900 Coventry Health Care Inc 3,481,107 1.07
27,400 Cullen/Frost Bankers Inc 1,394,934 0.43
45,300 Cytec Industries Inc 2,077,005 0.64
7,100 Deckers Outdoor Corp 642,621 0.20
116,200 Developers Diversified Realty Corp (Reit) 1,424,612 0.44
76,000 Discover Financial Services 1,927,360 0.59
51,300 Drew Industries Inc 1,036,260 0.32
230,850 DSP Group Inc 1,486,674 0.45
193,800 Duke Realty Corp (Reit) 2,315,910 0.71
17,700 Dunkin' Brands Group Inc 462,324 0.14
63,000 East West Bancorp Inc 1,062,810 0.32
131,900 Electronic Arts Inc 2,994,130 0.92
11,690 Equinix Inc 1,118,499 0.34
22,000 F5 Networks Inc 1,804,110 0.55
87,600 Fidelity National Financial Inc 'A' 1,493,580 0.46
68,950 Flowers Foods Inc 1,310,739 0.40
66,800 Foot Locker Inc 1,425,512 0.44
3,000 Fresh Market Inc/The 114,420 0.03
46,400 Guess? Inc 1,623,072 0.50
63,300 Health Net Inc 1,579,335 0.48
99,300 Healthways Inc 1,269,054 0.39
24,939 HollyFrontier Corp 1,816,058 0.56
45,300 IAC/InterActiveCorp 1,804,299 0.55
60,550 IDEX Corp 2,279,102 0.70
59,300 IPC The Hospitalist Co Inc 2,487,635 0.76
97,350 j2 Global Communications Inc 3,103,518 0.95
34,800 Kennametal Inc 1,293,516 0.40
31,700 Kilroy Realty Corp (Reit) 1,125,667 0.34
48,050 Landstar System Inc 1,979,660 0.61
87,500 LKQ Corp 2,239,125 0.69
25,000 Manpower Inc 1,015,500 0.31
126,900 Meadowbrook Insurance Group Inc 1,214,433 0.37
44,900 Mentor Graphics Corp 523,085 0.16
73,800 Mistras Group Inc 1,508,472 0.46
19,800 National Instruments Corp 505,494 0.15
Transferable Securities Admitted to an Official Stock Exchange Listing or Dealt in on Another Regulated Market
Holding Description Value (USD) %
Transferable Securities Admitted to an Official Stock Exchange Listing or Dealt in on Another Regulated Market
Holding Description Value (USD) %

* Securities lent, see Note 11, for further details.
Audited Annual Report and Accounts 183
The notes on pages 261 to 270 form an integral part of these financial statements.
Global SmallCap Fund continued
Portfolio of Investments 31 August 2011
40,600 Nordson Corp 1,819,692 0.56
218,900 Northwest Bancshares Inc 2,618,044 0.80
86,600 NRG Energy Inc 1,995,264 0.61
148,100 Nuance Communications Inc 2,766,508 0.85
99,600 Oasis Petroleum Inc 2,652,348 0.81
88,400 Omnicare Inc 2,669,680 0.82
15,200 Owens & Minor Inc 448,248 0.14
37,800 Packaging Corp of America 957,474 0.29
52,500 Patterson-UTI Energy Inc 1,302,000 0.40
68,800 Pharmaceutical Product Development Inc 2,164,792 0.66
306,600 PMC - Sierra Inc 1,857,996 0.57
18,900 PVH Corp 1,259,685 0.39
129,100 QLogic Corp 1,809,982 0.55
66,150 Regis Corp 989,604 0.30
71,100 Riverbed Technology Inc 1,820,871 0.56
39,600 Silgan Holdings Inc 1,509,552 0.46
75,100 Steel Dynamics Inc 970,292 0.30
18,650 Stratasys Inc 449,092 0.14
347,050 support.com Inc 871,095 0.27
55,900 SVB Financial Group 2,565,810 0.79
318,500 Tenet Healthcare Corp 1,758,120 0.54
82,100 Terex Corp 1,366,144 0.42
202,900 Tetra Technologies Inc 2,100,015 0.64
76,250 Timken Co 3,003,488 0.92
75,500 UIL Holdings Corp 2,564,735 0.78
35,450 Urban Outfitters Inc 929,854 0.28
123,000 Valley National Bancorp 1,436,640 0.44
28,900 Vera Bradley Inc 982,311 0.30
63,900 VeriFone Systems Inc 2,287,620 0.70
46,100 Vertex Pharmaceuticals Inc 2,129,359 0.65
35,850 Warnaco Group Inc/The 1,948,089 0.60
60,000 Weingarten Realty Investors (Reit) 1,459,800 0.45
67,000 WR Berkley Corp 2,071,640 0.63
92,400 Wright Medical Group Inc 1,439,592 0.44
42,200 Zoran Corp 342,242 0.10
149,910,968 45.88
Total Common Stocks (Shares) 301,034,978 92.14
Total Transferable Securities Admitted
to an Official Stock Exchange Listing or
Dealt in on Another Regulated Market 301,034,978 92.14
Unquoted Securities
COMMON STOCKS (SHARES)
Singapore 405,500 Ascendas Real Estate Investment Trust (Reit) 714,832 0.22
Total Unquoted Securities 714,832 0.22
Total Portfolio 301,749,810 92.36
Other Net Assets 24,965,943 7.64
Total Net Assets (USD) 326,715,753 100.00
Transferable Securities Admitted to an Official Stock Exchange Listing or Dealt in on Another Regulated Market
Holding Description Value (USD) %
Transferable Securities Admitted to an Official Stock Exchange Listing or Dealt in on Another Regulated Market
Holding Description Value (USD) %
Sector Breakdownas at 31 August 2011
% of netassets
Information Technology 16.06
Healthcare 14.03
Industrials 13.61
Financials 13.34
Consumer Discretionary 12.07
Materials 9.19
Energy 7.69
Consumer Staples 3.93
Utilities 2.44
Other Net Assets 7.64
100.00
Open Forward Foreign Exchange Transactionsas at 31 August 2011
Purchases Sales Value date Unrealised
profit/(loss)
Unrealisedprofit/(loss)
USD Equivalent
GBP Hedged Share Class GBP
GBP 20,707,207 USD 33,854,503 14/9/2011 (43,052) (70,255)
USD 3,537,401 GBP 2,159,234 14/9/2011 8,926 14,566
Net unrealised loss (34,126) (55,689)
Total net unrealised loss (55,689)
Note: The net unrealised loss attributed to these transactions is included in the Statement
of Net Assets (see Note 2c).

(2) Fund valuation policy, see Note 1, for further details.
184 BlackRock Global Funds (BGF)
India Fund(2)
Portfolio of Investments 31 August 2011
COMMON STOCKS (SHARES)
India 51,917 3M India Ltd 5,189,104 0.64
140,000 ACC Ltd 3,049,200 0.38
1,818,104 Allied Digital Services Ltd 927,233 0.11
396,000 Alstom Projects India Ltd 4,466,880 0.55
134,900 Axis Bank Ltd 3,143,170 0.39
301,198 Bank of Baroda 4,861,336 0.60
369,682 Bharat Electronics Ltd 12,376,953 1.53
131,321 Bharat Heavy Electricals Ltd 5,042,726 0.62
1,297,644 Bharat Petroleum Corp Ltd 19,010,485 2.35
4,869,677 Bharti Airtel Ltd 42,804,461 5.29
3,662,351 BL Kashyap & Sons Ltd 915,588 0.11
809,338 Cadila Healthcare Ltd 14,851,352 1.83
333,097 Cairn India Ltd 2,018,568 0.25
682,130 Century Textile & Industries Ltd 4,222,385 0.52
6,162,130 Chambal Fertilizers & Chemicals Ltd 14,234,520 1.76
607,672 Cipla Ltd/India 3,706,799 0.46
1,137,295 Coal India Ltd 9,280,327 1.15
462,279 DB Corp Ltd 2,440,833 0.30
901,445 DCM Shriram Consolidated 874,402 0.11
2,819,640 Dish TV India Ltd 4,821,584 0.60
474,967 Dr Reddy's Laboratories Ltd 15,431,678 1.91
732,192 Emami Ltd 7,329,242 0.90
1,506,495 GAIL India Ltd 13,437,935 1.66
168,666 GlaxoSmithKline Pharmaceuticals Ltd 7,763,696 0.96
1,044,599 Godrej Consumer Products Ltd 9,693,879 1.20
124,393 Grasim Industries Ltd 6,199,747 0.77
5,964,000 Gujarat Pipavav Port Ltd 8,707,440 1.08
2,594,939 Gujarat State Petronet Ltd 5,631,018 0.70
1,180,561 Havells India Ltd 8,594,484 1.06
3,356,890 HDFC Bank Ltd 34,408,123 4.25
159,000 Hero Motocorp Ltd 7,083,450 0.87
1,153,797 Hindustan Petroleum Corp Ltd 9,357,294 1.16
2,305,176 Housing Development Finance Corp 33,171,483 4.10
1,494,945 ICICI Bank Ltd 28,344,157 3.50
5,267,575 Idea Cellular Ltd 11,430,638 1.41
1,700,073 Indian Oil Corp Ltd 11,305,485 1.40
636,692 Infosys Ltd 32,394,889 4.00
1,711,988 Infrastructure Development Finance Co Ltd 4,228,610 0.52
608,112 ING Vysya Bank Ltd 4,238,541 0.52
1,387,814 Ipca Laboratories Ltd 9,353,866 1.15
8,979,794 ITC Ltd 38,972,306 4.81
659,526 Jindal Saw Ltd 1,701,577 0.21
2,034,994 Jubilant Life Sciences Ltd 8,241,726 1.02
2,476,101 Karur Vysya Bank Ltd 20,130,701 2.49
1,286,274 KPIT Cummins Infosystems Ltd 4,193,253 0.52
473,565 Larsen & Toubro Ltd 16,546,361 2.04
1,668,979 Lupin Ltd 16,255,855 2.01
201,920 Maharashtra Seamless Ltd 1,552,765 0.19
388,709 Mahindra & Mahindra Financial Services Ltd 5,212,588 0.64
1,889,234 Marico Ltd 6,083,333 0.75
2,511,350 Motherson Sumi Systems Ltd 10,221,195 1.26
2,300,000 NCC Ltd/India 2,691,000 0.33
195,870 Nestle India Ltd 18,668,370 2.31
2,472,936 NIIT Technologies Ltd 10,386,331 1.28
2,224,613 Nitesh Estates Ltd 912,091 0.11
1,449,864 NTPC Ltd 5,335,500 0.66
2,525,912 Oil & Natural Gas Corp Ltd 14,448,217 1.78
267,561 Oil India Ltd 7,563,949 0.93
487,715 Oracle Financial Services Software Ltd 19,235,480 2.38
1,444,734 Rallis India Ltd 5,287,726 0.65
2,514,523 Reliance Industries Ltd 42,721,746 5.28
509,170 Shoppers Stop Ltd 4,414,504 0.54
329,264 Siemens India Ltd 6,331,747 0.78
457,126 State Bank of India Ltd 19,592,420 2.42
669,282 Sterlite Industries India Ltd ADR 7,502,651 0.93
786,849 Sun Pharmaceutical Industries Ltd 8,403,547 1.04
1,208,120 Tata Consultancy Services Ltd 27,351,837 3.38
1,310,728 Tata Motors Ltd 12,229,092 1.51
315,237 Thermax Ltd 3,347,817 0.41
419,086 United Breweries Ltd 3,847,210 0.47
1,781,517 United Phosphorus Ltd 5,629,594 0.69
3,422,250 Voltas Ltd 8,624,070 1.06
415,740 Zee Entertainment Enterprises Ltd 1,043,507 0.13
791,023,627 97.68
Total Common Stocks (Shares) 791,023,627 97.68
Total Transferable Securities Admitted
to an Official Stock Exchange Listing or
Dealt in on Another Regulated Market 791,023,627 97.68
Total Portfolio 791,023,627 97.68
Other Net Assets 18,818,265 2.32
Total Net Assets (USD) 809,841,892 100.00
Transferable Securities Admitted to an Official Stock Exchange Listing or Dealt in on Another Regulated Market
Holding Description Value (USD) %
Transferable Securities Admitted to an Official Stock Exchange Listing or Dealt in on Another Regulated Market
Holding Description Value (USD) %
Sector Breakdownas at 31 August 2011
% of netassets
Financials 19.54
Energy 14.30
Information Technology 11.67
Consumer Staples 10.44
Healthcare 10.38
Industrials 10.21
Telecommunication Services 6.70
Materials 6.21
Consumer Discretionary 5.21
Utilities 3.02
Other Net Assets 2.32
100.00

* Securities lent, see Note 11, for further details.
Audited Annual Report and Accounts 185
The notes on pages 261 to 270 form an integral part of these financial statements.
Japan Fund
Portfolio of Investments 31 August 2011
COMMON STOCKS (SHARES)
Japan 366,000 All Nippon Airways Co Ltd * 93,585,178 2.00
26,500 Asahi Diamond Industrial Co Ltd 38,566,820 0.82
20,800 Astellas Pharma Inc * 60,500,587 1.29
61,800 Bridgestone Corp 105,867,740 2.26
10,600 Capcom Co Ltd 23,847,150 0.51
145 Central Japan Railway Co 93,203,148 1.99
92,000 Chiba Bank Ltd/The 46,211,459 0.99
100,600 CKD Corp 56,834,920 1.21
47,800 Credit Saison Co Ltd 70,532,003 1.50
320 CyberAgent Inc * 81,337,989 1.73
12,700 Dai-ichi Seiko Co Ltd 40,303,135 0.86
10,800 Dena Co Ltd 43,223,945 0.92
89,000 Denki Kagaku Kogyo KK 29,233,367 0.62
42,300 Denso Corp 103,756,571 2.21
6,900 Fanuc Ltd 88,006,330 1.88
162,000 Fuji Heavy Industries Ltd 77,934,084 1.66
211,000 Fujitsu Ltd 82,314,288 1.76
237,000 Furukawa Electric Co Ltd 63,953,611 1.36
39,000 Hitachi High-Technologies Corp 57,034,627 1.22
419,000 Hitachi Ltd 174,891,837 3.73
31,300 Honda Motor Co Ltd 78,261,740 1.67
17,400 Ibiden Co Ltd 32,744,200 0.70
4,100 Idemitsu Kosan Co Ltd 32,942,492 0.70
164,000 IHI Corp 31,823,691 0.68
86 Inpex Corp 44,762,171 0.95
47 Japan Tobacco Inc 15,604,099 0.33
24,900 JFE Holdings Inc 44,467,362 0.95
41,900 JS Group Corp 81,856,155 1.75
90,000 Kansai Paint Co Ltd 64,035,475 1.37
67,000 Kirin Holdings Co Ltd 68,662,280 1.46
29,000 Komatsu Ltd 59,351,062 1.27
14,400 Komeri Co Ltd 32,352,468 0.69
30,300 Mitsubishi Corp 55,948,267 1.19
155,000 Mitsubishi Electric Corp 119,055,854 2.54
480,800 Mitsubishi UFJ Financial Group Inc 167,158,462 3.56
49,200 Mitsui & Co Ltd 64,741,320 1.38
147,000 Mitsui Chemicals Inc 39,073,161 0.83
47,000 Mitsui Fudosan Co Ltd 60,896,362 1.30
1,113,800 Mizuho Financial Group Inc 130,578,197 2.78
3,400 Nidec Corp 22,919,768 0.49
37,800 Nippon Paper Group Inc 73,999,176 1.58
7,290 Nippon Television Network Corp 81,929,024 1.75
187,500 Nissan Motor Co Ltd 132,080,747 2.82
13,100 Nitto Denko Corp 39,229,106 0.84
12,700 Nomura Research Institute Ltd 22,179,560 0.47
25,100 NPC Inc/Japan * 29,654,711 0.63
73,000 NTN Corp 28,109,512 0.60
445 NTT DoCoMo Inc 62,334,532 1.33
48,000 Omron Corp 88,970,501 1.90
23,000 Organo Corp 14,133,082 0.30
13,540 ORIX Corp 94,422,006 2.01
12,900 Otsuka Holdings Co Ltd 25,879,488 0.55
127,800 Pioneer Corp 46,240,162 0.99
63,000 Press Kogyo Co Ltd 23,622,177 0.50
712 Rakuten Inc 62,100,666 1.32
24,500 Sega Sammy Holdings Inc 43,678,743 0.93
89,000 Seiko Holdings Corp 18,529,458 0.39
19,100 Seven & I Holdings Co Ltd 38,954,712 0.83
31,400 Softbank Corp 80,193,719 1.71
47,900 Sony Financial Holdings Inc 58,238,022 1.24
283,000 Sumitomo Metal Industries Ltd 45,762,726 0.98
58,000 Sumitomo Metal Mining Co Ltd 71,631,602 1.53
345,000 Sumitomo Osaka Cement Co Ltd 81,590,655 1.74
51,000 Taihei Dengyo Kaisha Ltd 29,946,893 0.64
15,000 Taisho Pharmaceutical Co Ltd 26,863,367 0.57
75,300 Taiyo Yuden Co Ltd 53,500,244 1.14
90,000 Takashimaya Co Ltd * 49,118,120 1.05
53,000 Tatsuta Electric Wire and Cable Co Ltd 19,926,190 0.42
55,000 Tokyo Gas Co Ltd 19,510,809 0.42
118,000 Tokyo Rope Manufacturing Co Ltd * 26,356,015 0.56
210,000 Tokyu Land Corp 66,218,502 1.41
249,000 Toshiba Corp 83,297,661 1.78
33,500 Toyota Motor Corp 92,565,422 1.97
32,600 TS Tech Co Ltd 38,153,258 0.81
11,730 Yamada Denki Co Ltd 66,269,743 1.41
55,000 Yamazaki Baking Co Ltd 62,256,712 1.33
4,575,820,398 97.56
Total Common Stocks (Shares) 4,575,820,398 97.56
Total Transferable Securities Admitted
to an Official Stock Exchange Listing or
Dealt in on Another Regulated Market 4,575,820,398 97.56
Total Portfolio 4,575,820,398 97.56
Other Net Assets 114,216,126 2.44
Total Net Assets (JPY) 4,690,036,524 100.00
Transferable Securities Admitted to an Official Stock Exchange Listing or Dealt in on Another Regulated Market
Holding Description Value (JPY) %
Transferable Securities Admitted to an Official Stock Exchange Listing or Dealt in on Another Regulated Market
Holding Description Value (JPY) %
Sector Breakdownas at 31 August 2011
% of netassets
Consumer Discretionary 24.16
Industrials 20.52
Information Technology 15.62
Financials 14.79
Materials 11.00
Consumer Staples 3.95
Telecommunication Services 3.04
Healthcare 2.41
Energy 1.65
Utilities 0.42
Other Net Assets 2.44
100.00
Open Forward Foreign Exchange Transactionsas at 31 August 2011
Purchases Sales Value date Unrealised
profit/(loss)
Unrealisedprofit/(loss)
JPY Equivalent
EUR Hedged Share Class EUR
EUR 1,289,163 JPY 141,840,936 14/9/2011 7,975 886,111
JPY 71,607,294 EUR 649,339 14/9/2011 (2,541) (282,333)
Net unrealised profit 5,434 603,778
Total net unrealised profit 603,778
Note: The net unrealised profit attributed to these transactions is included in the Statement
of Net Assets (see Note 2c).

* Securities lent, see Note 11, for further details.
186 BlackRock Global Funds (BGF)
Japan Small & MidCap Opportunities Fund
Portfolio of Investments 31 August 2011
COMMON STOCKS (SHARES)
Japan 20,400 Aeon Fantasy Co Ltd 24,357,600 0.15
261,400 Aida Engineering Ltd 97,502,200 0.59
114,400 Aisan Industry Co Ltd 83,969,600 0.51
676,000 All Nippon Airways Co Ltd * 171,028,000 1.03
265,000 Anest Iwata Corp 88,245,000 0.53
55,000 Anicom Holdings Inc 131,065,000 0.79
366,000 Anritsu Corp * 341,478,000 2.06
84,000 Arc Land Sakamoto Co Ltd 109,200,000 0.66
164,300 Asahi Diamond Industrial Co Ltd 236,592,000 1.42
85,300 ASKUL Corp 88,029,600 0.53
622,000 Bank of Yokohama Ltd/The 237,604,000 1.43
57,500 Capcom Co Ltd 127,995,000 0.77
463,000 Chiba Bank Ltd/The 230,111,000 1.38
51,700 Chiyoda Co Ltd 61,884,900 0.37
27,000 COOKPAD Inc 44,361,000 0.27
139,600 Cosel Co Ltd 168,497,200 1.01
160,700 Credit Saison Co Ltd 234,622,000 1.41
218 CyberAgent Inc 54,827,000 0.33
18,500 Dai-ichi Seiko Co Ltd 58,090,000 0.35
595,000 Daishinku Corp 188,615,000 1.14
319,000 Daiso Co Ltd 87,087,000 0.52
48,200 Dena Co Ltd 190,872,000 1.15
437,000 Denki Kagaku Kogyo KK 142,025,000 0.85
73,400 Elecom Co Ltd 86,612,000 0.52
126,800 ESPEC Corp 68,598,800 0.41
89,400 Ferrotec Corp * 135,888,000 0.82
181,000 Fuji Heavy Industries Ltd 86,156,000 0.52
15,600 Furuya Metal Co Ltd 57,018,000 0.34
501 GMO Cloud K.K. 34,268,400 0.21
96,600 Gree Inc 238,312,200 1.43
74,500 HAJIME CONSTRUCTION Co Ltd 158,312,500 0.95
95,000 Hisaka Works Ltd 87,685,000 0.53
405,000 Hodogaya Chemical Co Ltd 131,625,000 0.79
36,600 Idec Corp/Japan 28,840,800 0.17
22,400 Idemitsu Kosan Co Ltd 178,080,000 1.07
954,000 IHI Corp 183,168,000 1.10
280 Internet Initiative Japan Inc 99,680,000 0.60
124,000 Iyo Bank Ltd/The 92,628,000 0.56
301,000 Japan Aviation Electronics Industry Ltd 177,590,000 1.07
54,000 JGC Corp 116,478,000 0.70
143,900 JS Group Corp 278,158,700 1.67
171,400 JTEKT Corp 160,601,800 0.97
61,900 Kadokawa Group Holdings Inc * 169,791,700 1.02
135,000 Kamigumi Co Ltd 93,150,000 0.56
162,000 Kansai Paint Co Ltd 114,048,000 0.69
61,100 Kato Sangyo Co Ltd 96,476,900 0.58
268,000 Kinugawa Rubber Industrial Co Ltd * 161,336,000 0.97
602,000 Kobe Steel Ltd 85,484,000 0.51
332,300 Kohnan Shoji Co Ltd 471,866,000 2.84
61,200 Koshidaka Holdings Co Ltd 140,760,000 0.85
86,800 Kuraray Co Ltd 94,872,400 0.57
114,800 Lintec Corp 208,247,200 1.25
718,000 Maeda Corp 180,936,000 1.09
168,000 Marubeni Corp 80,808,000 0.49
747,000 Maruha Nichiro Holdings Inc 100,845,000 0.61
45,800 Maruwa Co Ltd/Aichi 150,453,000 0.91
88,600 MISUMI Group Inc 159,302,800 0.96
677,000 Mitsui Chemicals Inc * 178,051,000 1.07
156 Mixi Inc * 51,480,000 0.31
107,200 MonotaRO Co Ltd 92,299,200 0.56
115 Mori Trust Sogo Reit Inc (Reit) 92,230,000 0.56
47,600 Musashi Seimitsu Industry Co Ltd 88,060,000 0.53
36,700 NEC Mobiling Ltd 102,062,700 0.61
278,600 Neturen Co Ltd 176,632,400 1.06
25,100 Nidec Corp 167,417,000 1.01
84,600 Nidec-Read Corp 99,828,000 0.60
516,600 Nidec-Tosok Corp 466,489,800 2.81
966 NIFTY Corp 93,702,000 0.56
127,000 Nikkiso Co Ltd 88,265,000 0.53
266 Nippon Accommodations Fund Inc (Reit) 'A' 153,748,000 0.93
97,400 Nippon Ceramic Co Ltd 150,970,000 0.91
55,100 Nippon Kodoshi Corp 122,322,000 0.74
404,000 Nishi-Nippon City Bank Ltd/The 88,880,000 0.53
262,000 Nissin Electric Co Ltd 150,650,000 0.91
88,900 Nissin Kogyo Co Ltd 106,146,600 0.64
32,700 Nitori Holdings Co Ltd 256,368,000 1.54
48,300 Nitto Denko Corp 143,112,900 0.86
108,200 Noritz Corp 178,638,200 1.08
156,800 NPC Inc/Japan * 183,299,200 1.10
436,000 NS United Kaiun Kaisha Ltd 56,244,000 0.34
344,000 OJI Paper Co Ltd 140,352,000 0.84
224,000 OKUMA Corp 131,264,000 0.79
676 OncoTherapy Science Inc 89,232,000 0.54
11,700 ORIX Corp 80,730,000 0.49
180,600 OSG Corp 179,516,400 1.08
35,300 Paramount Bed Co Ltd 71,411,900 0.43
111,300 Park24 Co Ltd 98,389,200 0.59
133,300 Pigeon Corp 369,640,900 2.22
251,900 Pioneer Corp 90,180,200 0.54
39,700 Proto Corp 113,025,900 0.68
2,936 Rakuten Inc 253,376,800 1.52
661,000 Ryobi Ltd 218,130,000 1.31
94,900 Saizeriya Co Ltd 132,860,000 0.80
737,000 Seiko Holdings Corp 151,822,000 0.91
405 Seria Co Ltd 194,602,500 1.17
1,940 Seven Bank Ltd 287,120,000 1.73
79,000 Shin-Kobe Electric Machinery Co Ltd 105,860,000 0.64
171,000 Sumitomo Bakelite Co Ltd 74,385,000 0.45
130,000 Sumitomo Metal Mining Co Ltd 158,860,000 0.96
198,500 Sumitomo Rubber Industries Ltd 190,957,000 1.15
34,300 Sysmex Corp 98,612,500 0.59
1,011 Systena Corp 68,444,700 0.41
73,700 Taikisha Ltd 117,625,200 0.71
118,400 Taiyo Yuden Co Ltd * 83,235,200 0.50
196,500 Takara Leben Co Ltd 87,639,000 0.53
542,000 Tatsuta Electric Wire and Cable Co Ltd 201,624,000 1.21
50,300 Tocalo Co Ltd 81,385,400 0.49
417,000 Tokyo Rope Manufacturing Co Ltd * 92,157,000 0.55
647,000 Tokyo Tatemono Co Ltd 165,632,000 1.00
171,000 TOTO Ltd 105,678,000 0.64
115,600 Unipres Corp 225,420,000 1.36
1,430 UT Holdings Co Ltd 91,520,000 0.55
80,000 Xebio Co Ltd 143,280,000 0.86
193,000 Yamazaki Baking Co Ltd 216,160,000 1.30
85,400 Yasunaga Corp 73,529,400 0.44
16,176,690,500 97.35
Total Common Stocks (Shares) 16,176,690,500 97.35
Total Transferable Securities Admitted
to an Official Stock Exchange Listing or
Dealt in on Another Regulated Market 16,176,690,500 97.35
Total Portfolio 16,176,690,500 97.35
Other Net Assets 439,629,127 2.65
Total Net Assets (JPY) 16,616,319,627 100.00
Transferable Securities Admitted to an Official Stock Exchange Listing or Dealt in on Another Regulated Market
Holding Description Value (JPY) %
Transferable Securities Admitted to an Official Stock Exchange Listing or Dealt in on Another Regulated Market
Holding Description Value (JPY) %

Audited Annual Report and Accounts 187
The notes on pages 261 to 270 form an integral part of these financial statements.
Japan Small & MidCap Opportunities Fund continued
Open Forward Foreign Exchange Transactionsas at 31 August 2011
Purchases Sales Value date Unrealised
profit/(loss)
Unrealisedprofit/(loss)
JPY Equivalent
EUR Hedged Share Class EUR
EUR 2,339,378 JPY 257,475,087 14/9/2011 13,717 1,524,111
JPY 24,337,252 EUR 221,757 14/9/2011 (1,929) (214,333)
Net unrealised profit 11,788 1,309,778
Total net unrealised profit 1,309,778
Note: The net unrealised profit attributed to these transactions is included in the Statement
of Net Assets (see Note 2c).
Sector Breakdownas at 31 August 2011
% of netassets
Consumer Discretionary 24.92
Industrials 24.18
Information Technology 17.33
Materials 11.71
Financials 11.34
Consumer Staples 4.71
Healthcare 2.09
Energy 1.07
Other Net Assets 2.65
100.00

* Securities lent, see Note 11, for further details.
188 BlackRock Global Funds (BGF)
Japan Value Fund
Portfolio of Investments 31 August 2011
COMMON STOCKS (SHARES)
Japan 140,100 Astellas Pharma Inc * 407,633,840 3.39
105,400 Capcom Co Ltd 237,195,844 1.98
318,000 Daiwa House Industry Co Ltd 303,487,228 2.53
288,400 EDION Corp 193,599,682 1.61
1,092,000 Hitachi Ltd 455,946,614 3.80
214,000 Honda Motor Co Ltd 535,247,655 4.46
136,100 JFE Holdings Inc 243,128,561 2.02
177,400 JS Group Corp 346,678,392 2.89
676,400 JX Holdings Inc 329,603,597 2.74
311,000 Kirin Holdings Co Ltd 318,815,662 2.65
864,000 Marubeni Corp 420,145,894 3.50
617,000 Mitsubishi Gas Chemical Co Inc 334,342,248 2.78
1,457,000 Mitsubishi UFJ Financial Group Inc 506,709,795 4.22
14,348 Monex Group Inc 212,070,395 1.77
359,000 Nippon Electric Glass Co Ltd 280,190,273 2.33
154,300 Nippon Paper Group Inc * 302,159,916 2.52
305,000 Nippon Shokubai Co Ltd 294,780,694 2.45
117,300 Nippon Telegraph & Telephone Corp 421,578,954 3.51
29,350 Nippon Television Network Corp 329,954,608 2.75
622,900 Nissan Motor Co Ltd * 438,927,118 3.65
520,000 NSK Ltd 319,630,510 2.66
3,196 NTT DoCoMo Inc 447,828,064 3.73
175,500 Omron Corp 325,400,156 2.71
49,330 ORIX Corp 344,113,342 2.87
402,100 Showa Shell Sekiyu KK 248,379,980 2.07
214,700 Sony Corp 361,399,533 3.01
345,300 Sumitomo Corp 346,995,839 2.89
723,000 Sumitomo Heavy Industries Ltd 335,499,817 2.79
184,800 Sumitomo Mitsui Financial Group Inc * 421,298,408 3.51
1,375,000 Sumitomo Osaka Cement Co Ltd * 325,281,872 2.71
83,900 TDK Corp 283,302,060 2.36
1,174,000 Toshiba Corp 392,859,623 3.27
228,300 Toyota Industries Corp 497,617,876 4.14
11,561,804,050 96.27
Total Common Stocks (Shares) 11,561,804,050 96.27
Total Transferable Securities Admitted
to an Official Stock Exchange Listing or
Dealt in on Another Regulated Market 11,561,804,050 96.27
Unquoted Securities
COMMON STOCKS (SHARES)
Japan 67,600 Tokyo Electron Ltd 249,790,192 2.08
Total Unquoted Securities 249,790,192 2.08
Total Portfolio 11,811,594,242 98.35
Other Net Assets 198,201,751 1.65
Total Net Assets (JPY) 12,009,795,993 100.00
Transferable Securities Admitted to an Official Stock Exchange Listing or Dealt in on Another Regulated Market
Holding Description Value (JPY) %
Transferable Securities Admitted to an Official Stock Exchange Listing or Dealt in on Another Regulated Market
Holding Description Value (JPY) %
Open Forward Foreign Exchange Transactionsas at 31 August 2011
Purchases Sales Value date Unrealised
profit/(loss)
Unrealisedprofit/(loss)
JPY Equivalent
EUR Hedged Share Class EUR
EUR 10,748,873 JPY 1,182,870,762 14/9/2011 64,514 7,168,222
JPY 233,899,796 EUR 2,129,421 14/9/2011 (16,705) (1,856,111)
Net unrealised profit 47,809 5,312,111
Total net unrealised profit 5,312,111
Note: The net unrealised profit attributed to these transactions is included in the Statement
of Net Assets (see Note 2c).
Sector Breakdownas at 31 August 2011
% of netassets
Consumer Discretionary 19.62
Information Technology 18.53
Financials 14.90
Industrials 14.73
Materials 12.48
Telecommunication Services 7.24
Energy 4.81
Healthcare 3.39
Consumer Staples 2.65
Other Net Assets 1.65
100.00

Audited Annual Report and Accounts 189
The notes on pages 261 to 270 form an integral part of these financial statements.
Latin American Fund
FUNDS
United Kingdom 2,170,000 Blackrock Latin American Investment
Trust Plc 20,891,295 0.31
Total Funds 20,891,295 0.31
COMMON / PREFERRED STOCKS (SHARES) & WARRANTS
Bermuda 564,000 Credicorp Ltd 55,909,320 0.83
Brazil 781,000 AES Tiete SA 10,087,950 0.15
1,005,000 AES Tiete SA (Unit) (Pref) 14,133,216 0.21
18,095,000 Banco Bradesco SA ADR * 321,367,200 4.77
9,000,000 Banco do Brasil SA 150,655,050 2.23
28,852,000 BM&F - Bovespa 169,892,318 2.52
7,001,000 BR Malls Participacoes SA 76,012,243 1.13
5,086,000 BR Properties SA 55,540,740 0.82
9,600,000 Bradespar SA (Pref) 212,148,912 3.15
1,780,000 Braskem SA (Pref) 20,469,488 0.30
4,405,000 Brookfield Incorporacoes SA 19,224,956 0.28
5,235,000 CCR SA 153,205,927 2.27
10,938,000 Cia de Bebidas das Americas ADR 383,048,760 5.68
333,000 Cia Energetica de Minas Gerais (Pref) 6,169,829 0.09
5,915,000 Cia Energetica de Minas Gerais ADR 111,734,350 1.66
1,874,000 Cielo SA 48,034,160 0.71
2,800,000 Cyrela Brazil Realty SA Empreendimentos e
Participacoes 26,662,203 0.40
2,830,000 Diagnosticos da America SA 28,284,569 0.42
945,000 EDP - Energias do Brasil SA 22,210,567 0.33
3,800,000 Even Construtora e Incorporadora SA 16,656,320 0.25
56,000 HRT Participacoes em Petroleo SA 36,290,221 0.54
8,660,000 Hypermarcas SA 72,427,280 1.07
31,900,000 Itau Unibanco Holding SA ADR 580,261,000 8.61
29,750,000 Itausa - Investimentos Itau SA (Pref) 178,927,276 2.65
1,904,000 Localiza Rent a Car SA 32,339,559 0.48
840,500 Lojas Renner SA 31,320,270 0.46
1,964,000 Magazine Luiza SA 15,461,005 0.23
6,420,000 Marcopolo SA (Pref) 25,310,200 0.38
1,779,000 Metalfrio Solutions SA 8,559,640 0.13
3,719,000 Natura Cosmeticos SA 89,375,967 1.33
25,950,000 OGX Petroleo e Gas Participacoes SA 188,921,509 2.80
26,675,000 PDG Realty SA Empreendimentos e
Participacoes 129,522,439 1.92
21,130,000 Petroleo Brasileiro SA ADR 559,311,100 8.30
2,370,000 Porto Seguro SA 28,731,962 0.43
5,966,000 QGEP Participacoes SA 58,350,007 0.87
2,784,000 Redecard SA 42,499,914 0.63
6,727,000 Rossi Residencial SA 51,812,446 0.77
2,864,000 Totvs SA 49,781,537 0.74
2,588,000 Tractebel Energia SA 41,235,475 0.61
23,940,000 Vale SA ADR 'A' 616,933,800 9.15
4,682,911,365 69.47
Canada 4,420,000 Pacific Rubiales Energy Corp * 112,139,898 1.66
Chile 1,236,000 Banco Santander Chile ADR 111,586,080 1.65
15,800,000 E.CL SA 42,299,208 0.63
930,000 Empresa Nacional de Electricidad SA/Chile
ADR 47,774,100 0.71
1,775,000 ENTEL Chile SA 37,334,156 0.55
238,993,544 3.54
Luxembourg 1,372,000 Ternium SA ADR 34,807,640 0.52
Mexico 20,763,000 America Movil SAB de CV ADR 'L' 513,676,620 7.62
2,971,800 Empresas ICA SAB de CV 4,511,452 0.07
3,357,000 Fomento Economico Mexicano SAB
de CV ADR 229,249,530 3.40
12,150,000 Grupo Financiero Banorte SAB de CV 'O' 46,102,089 0.68
32,100,000 Grupo Mexico SAB de CV 'B' 107,570,209 1.60
7,856,000 Grupo Televisa SA ADR 172,282,080 2.56
32,600,000 Wal-Mart de Mexico SAB de CV 'V' 85,843,474 1.27
1,159,235,454 17.20
Netherlands 47,007 Morgan Stanley BV (Cert 16/4/2012
- Itasua Inv) 282,720 0.01
3,365,000 Morgan Stanley BV (Cert 21/6/2013
- Cyrela Brazil) 32,042,573 0.48
910,000 Morgan Stanley BV (Cert 25/2/2014
- Lojas Renner) 33,910,445 0.50
700 Morgan Stanley BV (Cert 28/10/2013
- OGX Petroleo E Gas) 5,086 0.00
1,400,000 Morgan Stanley BV (Cert 28/11/2013
- Lojas Renner) 52,169,915 0.77
450,000 Morgan Stanley BV (Cert 29/10/2012
- Natura Cosmeticos SA) 10,814,624 0.16
1,084,500 Morgan Stanley BV (Wts 22/7/2013
- Lojas Renner) 40,413,052 0.60
845,000 Morgan Stanley BV (Wts 22/7/2013
- Natura Cosmeticos SA) 20,307,460 0.30
189,945,875 2.82
Panama 930,000 Copa Holdings SA 'A' 63,472,500 0.94
Peru 1,086,000 Cia de Minas Buenaventura SA ADR 51,259,200 0.76
United States 994,000 Southern Copper Corp 34,074,320 0.51
Total Common / Preferred Stocks (Shares)
& Warrants 6,622,749,116 98.25
BONDS
Brazil BRL 16,388 Lupatech SA 6.5% 15/4/2018 10,741,064 0.16
Total Bonds 10,741,064 0.16
Total Transferable Securities Admitted
to an Official Stock Exchange Listing or
Dealt in on Another Regulated Market 6,654,381,475 98.72
Transferable Securities Admitted to an Official Stock Exchange Listing or Dealt in on Another Regulated Market
Holding Description Value (USD) %
Transferable Securities Admitted to an Official Stock Exchange Listing or Dealt in on Another Regulated Market
Holding Description Value (USD) %
Portfolio of Investments 31 August 2011

* Securities lent, see Note 11, for further details.
190 BlackRock Global Funds (BGF)
Portfolio of Investments 31 August 2011
WARRANTS
Brazil 13,737 Hypermarcas SA (Wts 15/10/2015) – 0.00
BONDS
Brazil BRL 13,737,000 Hypermarcas SA 0% 15/10/2015
(Zero Coupon) 9,472,513 0.14
BRL 13,737,000 Hypermarcas SA 11.3% 15/10/2018 9,028,434 0.13
18,500,947 0.27
Total Bonds 18,500,947 0.27
Total Unquoted Securities 18,500,947 0.27
Total Portfolio 6,672,882,422 98.99
Other Net Assets 67,991,817 1.01
Total Net Assets (USD) 6,740,874,239 100.00
Unquoted Securities
Holding Description Value (USD) %
Latin American Fund continued
Sector Breakdownas at 31 August 2011
% of netassets
Financials 29.14
Materials 15.99
Energy 14.17
Consumer Staples 13.02
Telecommunication Services 8.17
Consumer Discretionary 6.87
Industrials 4.43
Utilities 4.39
Information Technology 2.08
Healthcare 0.42
Investment Funds 0.31
Other Net Assets 1.01
100.00
Open Forward Foreign Exchange Transactionsas at 31 August 2011
Purchases Sales Value date Unrealised
profit/(loss)
Unrealisedprofit/(loss)
USD Equivalent
CHF Hedged Share Class CHF
CHF 534,950 USD 654,267 14/9/2011 7,900 9,804
Net unrealised profit 7,900 9,804
PLN Hedged Share Class PLN
PLN 25,483,891 USD 8,836,133 14/9/2011 76,330 26,582
USD 1,831,814 PLN 5,311,675 14/9/2011 (44,448) (15,479)
Net unrealised profit 31,882 11,103
SGD Hedged Share Class SGD
SGD 6,949,953 USD 5,702,786 14/9/2011 92,064 76,554
USD 673,210 SGD 817,282 14/9/2011 (7,713) (6,414)
Net unrealised profit 84,351 70,140
Total net unrealised profit 91,047
Note: The net unrealised profit attributed to these transactions is included in the Statement
of Net Assets (see Note 2c).

Audited Annual Report and Accounts 191
The notes on pages 261 to 270 form an integral part of these financial statements.
Local Emerging Markets Short Duration Bond Fund
Portfolio of Investments 31 August 2011
BONDS
Brazil BRL 397,600 Brazil Notas do Tesouro Nacional
Serie F 10% 1/1/2012 248,729,394 9.52
BRL 70,000 Brazil Notas do Tesouro Nacional
Serie F 10% 1/1/2014 42,911,965 1.64
BRL 22,060,000 Brazilian Government International
Bond 10.25% 10/1/2028 15,629,470 0.60
307,270,829 11.76
Colombia COP 27,132,000,000 Colombia Government International
Bond 7.75% 14/4/2021 17,771,686 0.68
Czech Republic CZK 1,700,000,000 Czech Republic Government Bond
3.55% 18/10/2012 104,537,525 4.00
Hungary HUF 1,600,000,000 Hungary Government Bond 6%
12/10/2011 8,495,395 0.32
HUF 7,000,000,000 Hungary Government Bond 6.75%
12/2/2013 37,570,059 1.44
HUF 14,000,000,000 Hungary Government Bond 7.25%
12/6/2012 75,088,455 2.87
HUF 4,000,000,000 Hungary Government Bond 7.5%
24/10/2013 21,864,231 0.84
143,018,140 5.47
Mexico MXN 27,150,000 Mexican Bonos Series M 7.5%
21/6/2012 224,626,480 8.60
MXN 3,200,000 Mexican Bonos 8% 19/12/2013 27,830,144 1.07
MXN 33,000,000 Mexican Bonos 9% 20/12/2012 281,838,914 10.79
MXN 98,464 Mexican Bonos 9.5% 18/12/2014 912,170 0.03
MXN 100,000,000 Mexico Cetes 0% 15/12/2011
(Zero Coupon) 79,715,731 3.05
614,923,439 23.54
Poland PLN 137,000,000 Poland Government Bond '0412' 4.75%
25/4/2012 47,770,609 1.83
PLN 200,000,000 Poland Government Bond '0414' 5.75%
25/4/2014 71,660,484 2.74
PLN 300,000,000 Poland Government Bond '0712' 0%
25/7/2012 (Zero Coupon) 100,472,512 3.85
PLN 260,000,000 Poland Government Bond '0713' 0%
25/7/2013 (Zero Coupon) 83,443,004 3.19
PLN 13,000,000 Poland Government Bond '1017' 5.25%
25/10/2017 4,530,487 0.17
PLN 97,000,000 Poland Government Bond '1019' 5.5%
25/10/2019 33,822,986 1.30
PLN 200,000,000 Poland Treasury Bill 0% 28/3/2012
(Zero Coupon) 67,889,576 2.60
409,589,658 15.68
South Africa ZAR 350,000,000 South Africa Government Bond 'R201'
8.75% 21/12/2014 53,566,888 2.05
ZAR 31,500,000 South Africa Government Bond 'R203'
8.25% 15/9/2017 4,682,003 0.18
ZAR 850,000,000 South Africa Government Bond 'R206'
7.5% 15/1/2014 125,199,100 4.79
ZAR 50,000,000 South Africa Treasury Bill 0%
12/10/2011 (Zero Coupon) 7,081,326 0.27
ZAR 600,000,000 South Africa Treasury Bill 0%
19/10/2011 (Zero Coupon) 84,881,843 3.25
ZAR 300,000,000 South Africa Treasury Bill 0%
9/11/2011 (Zero Coupon) 42,339,158 1.62
317,750,318 12.16
Turkey TRY 50,000,000 Turkey Government Bond 0%
16/11/2011 (Zero Coupon) 28,661,116 1.10
United States USD 25,000,000 United States Treasury Bill 0%
22/9/2011 (Zero Coupon) 24,999,838 0.96
USD 153,000,000 United States Treasury Bill 0%
29/9/2011 (Zero Coupon) 152,998,776 5.85
USD 202,000,000 United States Treasury Bill 0%
10/11/2011 (Zero Coupon) 201,995,758 7.73
USD 47,000,000 United States Treasury Bill 0%
25/11/2011 (Zero Coupon) 46,998,825 1.80
426,993,197 16.34
Total Bonds 2,370,515,908 90.73
Total Transferable Securities Admitted
to an Official Stock Exchange Listing or
Dealt in on Another Regulated Market 2,370,515,908 90.73
Total Portfolio 2,370,515,908 90.73
Other Net Assets 242,243,864 9.27
Total Net Assets (USD) 2,612,759,772 100.00
Transferable Securities Admitted to an Official Stock Exchange Listing or Dealt in on Another Regulated Market
Holding Description Value (USD) %
Transferable Securities Admitted to an Official Stock Exchange Listing or Dealt in on Another Regulated Market
Holding Description Value (USD) %

192 BlackRock Global Funds (BGF)
Local Emerging Markets Short Duration Bond Fund continued
Note: The total market value of USD (9,760,091) of these transactions is included in the Statement of Net Assets (see Note 2c).
Nominal Value Description
Unrealisedprofit/(loss)
USD
Nominal Value Description
Unrealisedprofit/(loss)
USD
Swaps as at 31 August 2011
MXN 8,565,630,000 Interest Rate Swaps (JP Morgan) (Fund receives
Floating MXN MXIBTIIE 28 Days; and pays Fixed
4.98%) (4/10/2011) (154,269)
ZAR 5,793,010,000 Interest Rate Swaps (Barclays) (Fund receives Fixed
6.1275%; and pays Floating ZAR JIBOR 3 Month)
(17/2/2012) 817,394
BRL 157,647,500 Interest Rate Swaps (UBS) (Fund receives Floating
1D BROIS + 0 bps; and pays Fixed 11.8275%)
(2/1/2013) (944,247)
BRL 318,890,000 Interest Rate Swaps (Deutsche Bank) (Fund receives
Floating 1D BROIS + 0 bps; and pays Fixed 11.89%)
(2/1/2013) (2,236,715)
MXN 5,000,000,000 Interest Rate Swaps (Royal Bank of Scotland) (Fund
receives Floating MXN MXIBTIIE 28 Days; and pays
Fixed 5.59%) (31/1/2013) (4,928,458)
KRW 238,384,650,000 Interest Rate Swaps (HSBC) (Fund receives Floating
KRW KORIBOR 3 Month; and pays Fixed 4.135%)
(29/4/2013) (1,295,996)
USD 103,278,710 Currency Swaps (TRY/USD) (JP Morgan) (Fund
receives 3M Libor + 0bps; and pays Fixed 5.959%)
(15/9/2013) 259,758
USD 15,000,000 Credit Default Swaps (HSBC) (Fund receives default
protection on Mexico (United Mexican States) 7.5%
8/4/2033; and pays Fixed 2.7%) (20/5/2014) (668,024)
MXN 325,000,000 Interest Rate Swaps (HSBC) (Fund receives Floating
MXN MXIBTIIE 28 Days; and pays Fixed 7.32%)
(27/5/2014) (1,743,416)
USD 56,150,000 Credit Default Swaps (Citibank) (Fund receives default
protection on Bundesrepublik Deutschland 6%
20/6/2016; and pays Fixed 0.25%) (20/3/2016) 284,291
(10,609,682)
Purchased Put Options as at 31 August 2011
Number of contracts
subjectto Put Issuer
UnrealisedlossUSD
ValueUSD
77,800,000 OTC AUD/USD Put Option
strike price AUD 1.0122
expiring on 12/10/2011 (695,015) 505,302
77,700,000 OTC AUD/USD Put Option
strike price AUD 1.025
expiring on 14/10/2011 (478,025) 709,492
Total Purchased Put Options (1,173,040) 1,214,794
Note: Purchased Put Options are included in the Statement of Net Assets (see Note 2c).
Purchased Call Options as at 31 August 2011
Number of contracts
subjectto Call Issuer
UnrealisedlossUSD
ValueUSD
77,880,000 OTC EUR/USD Call Option
strike price EUR 1.46
expiring on 8/9/2011 (687,342) 266,893
144,720,000 OTC USD/CNY Call Option
strike price USD 6.445
expiring on 27/2/2012 (1,887,583) 485,825
144,965,000 OTC USD/CNY Call Option
strike price USD 6.4125
expiring on 1/3/2012 (1,706,383) 656,547
Total Purchased Call Options (4,281,308) 1,409,265
Note: Purchased Call Options are included in the Statement of Net Assets (see Note 2c).

Audited Annual Report and Accounts 193
The notes on pages 261 to 270 form an integral part of these financial statements.
Local Emerging Markets Short Duration Bond Fund continued
Open Forward Foreign Exchange Transactionsas at 31 August 2011
Purchases Sales Value date Unrealised
profit/(loss)
Unrealisedprofit/(loss)
USD Equivalent
Core Fund USD
BRL 884,534,808 USD 547,444,400 2/9/2011 9,614,524 9,614,524
HKD 2,112,000,000 USD 271,011,752 2/9/2011 (13,631) (13,631)
USD 547,444,400 BRL 872,714,842 2/9/2011 (2,170,593) (2,170,593)
USD 110,898,507 EUR 76,506,000 2/9/2011 412,035 412,035
MXN 1,802,933,930 USD 144,595,328 8/9/2011 914,223 914,223
USD 53,497,565 MXN 669,348,000 8/9/2011 (523,564) (523,564)
CNY 2,657,800,438 USD 412,750,000 9/9/2011 4,168,843 4,168,843
USD 206,375,000 CNY 1,328,023,125 9/9/2011 (1,946,835) (1,946,835)
USD 110,866,252 EUR 77,880,000 12/9/2011 (1,590,229) (1,590,229)
KRW 35,002,500,000 USD 32,500,000 14/9/2011 310,455 310,455
USD 32,500,000 KRW 35,662,250,000 14/9/2011 (928,888) (928,888)
ARS 125,774,350 USD 29,900,000 15/9/2011 (73,700) (73,700)
AUD 97,060,000 USD 101,307,443 15/9/2011 2,397,862 2,397,862
EUR 66,640,000 CZK 1,609,788,494 15/9/2011 (172,761) (172,761)
EUR 168,800,000 USD 244,520,726 15/9/2011 (787,650) (787,650)
IDR 334,148,100,000 USD 38,945,000 15/9/2011 200,473 200,473
MYR 122,959,260 USD 41,220,000 15/9/2011 75,266 75,266
PEN 119,340,170 USD 43,258,000 15/9/2011 454,846 454,846
RUB 1,745,922,100 USD 60,770,000 15/9/2011 (377,250) (377,250)
TRY 57,913,492 USD 33,320,000 15/9/2011 307,828 307,828
USD 179,039,518 AUD 170,980,000 15/9/2011 (3,646,789) (3,646,789)
USD 303,742,771 EUR 211,000,000 15/9/2011 (923,573) (923,573)
USD 6,026,000 IDR 51,847,704,000 15/9/2011 (47,962) (47,962)
USD 33,408,634 MXN 417,333,000 15/9/2011 (252,539) (252,539)
USD 102,590,000 RUB 3,000,751,000 15/9/2011 (1,208,219) (1,208,219)
USD 57,894,617 TRY 101,898,000 15/9/2011 (1,273,087) (1,273,087)
USD 261,579,400 BRL 421,600,598 4/10/2011 (2,446,513) (2,446,513)
ILS 336,593,700 USD 98,023,676 6/10/2011 (3,469,966) (3,469,966)
USD 15,000,000 ILS 52,035,000 6/10/2011 382,667 382,667
CHF 127,283,000 USD 165,502,490 7/10/2011 (7,389,735) (7,389,735)
CZK 2,255,550,000 USD 130,883,156 7/10/2011 4,200,210 4,200,210
HKD 39,000,000 USD 5,015,787 7/10/2011 (9,780) (9,780)
HUF 17,306,847,000 USD 89,539,525 7/10/2011 2,014,429 2,014,429
MXN 2,284,483,000 USD 184,470,526 7/10/2011 (561,718) (561,718)
PLN 3,936,000 USD 1,325,580 7/10/2011 39,784 39,784
RON 308,281,000 USD 103,934,797 7/10/2011 937,565 937,565
SGD 353,003,000 USD 284,828,225 7/10/2011 8,745,069 8,745,069
TRY 350,767,400 USD 203,241,503 7/10/2011 (358,411) (358,411)
USD 179,388,705 CHF 127,284,000 7/10/2011 21,274,708 21,274,708
USD 30,000,000 CZK 524,670,000 7/10/2011 (1,422,132) (1,422,132)
USD 89,113,087 HUF 16,660,574,000 7/10/2011 977,945 977,945
USD 453,392,121 MXN 5,481,002,082 7/10/2011 12,152,433 12,152,433
USD 156,240,461 PLN 437,903,500 7/10/2011 4,335,505 4,335,505
USD 19,000,000 RON 57,114,000 7/10/2011 (429,287) (429,287)
USD 14,925,274 SGD 18,000,000 7/10/2011 (44,342) (44,342)
USD 312,545,102 ZAR 2,134,897,858 7/10/2011 9,853,484 9,853,484
ZAR 812,220,500 USD 115,078,213 7/10/2011 80,616 80,616
COP 80,663,951,250 USD 44,145,000 11/10/2011 869,612 869,612
AUD 117,627,000 USD 120,217,682 18/10/2011 4,934,740 4,934,740
EUR 61,089,000 USD 86,830,072 26/10/2011 1,336,215 1,336,215
THB 1,727,505,000 USD 57,564,312 26/10/2011 (207,410) (207,410)
CLP 25,916,718,398 USD 54,134,200 9/11/2011 1,243,669 1,243,669
CNY 1,325,959,375 USD 206,375,000 9/11/2011 2,426,847 2,426,847
INR 2,459,867,444 USD 54,018,500 9/11/2011 (707,123) (707,123)
PHP 2,376,631,260 USD 55,711,000 9/11/2011 825,249 825,249
RUB 3,002,755,586 USD 100,033,500 9/11/2011 3,026,996 3,026,996
USD 67,640,000 TWD 1,961,881,200 9/11/2011 (398,350) (398,350)
USD 35,354,000 MYR 107,617,576 10/11/2011 (821,225) (821,225)
CNY 526,141,440 USD 83,040,000 15/12/2011 (45,730) (45,730)
Net unrealised profit 64,265,106 64,265,106
Open Forward Foreign Exchange Transactionsas at 31 August 2011
Purchases Sales Value date Unrealised
profit/(loss)
Unrealisedprofit/(loss)
USD Equivalent
AUD Hedged Share Class AUD
AUD 628,383 USD 639,331 14/9/2011 30,100 32,217
USD 16,839 AUD 16,239 14/9/2011 (481) (515)
Net unrealised profit 29,619 31,702
CHF Hedged Share Class CHF
CHF 5,132 USD 6,276 14/9/2011 76 94
Net unrealised profit 76 94
EUR Hedged Share Class EUR
EUR 200,318,377 USD 284,180,282 14/9/2011 3,508,718 5,067,473
USD 51,561,676 EUR 36,212,827 14/9/2011 (503,679) (727,439)
Net unrealised profit 3,005,039 4,340,034
PLN Hedged Share Class PLN
PLN 9,379,893 USD 3,249,401 14/9/2011 36,512 12,715
USD 162,533 PLN 476,480 14/9/2011 (9,128) (3,179)
Net unrealised profit 27,384 9,536
SGD Hedged Share Class SGD
SGD 11,020,957 USD 9,027,292 14/9/2011 165,180 137,353
USD 418,819 SGD 507,988 14/9/2011 (4,338) (3,607)
Net unrealised profit 160,842 133,746
Total net unrealised profit 68,780,218
Note: The net unrealised profit attributed to these transactions is included in the Statement
of Net Assets (see Note 2c).

t
194 BlackRock Global Funds (BGF)
New Energy Fund
Portfolio of Investments 31 August 2011
FUNDS
Ireland 83,772,157 Institutional Cash Series Plc - Institutional
US Dollar Liquidity Fund 83,772,157 3.88
Isle of Man 1,158,000 Trading Emissions Plc 1,341,592 0.07
United Kingdom 2,150,000 BlackRock New Energy Investment Trust Plc 1,117,768 0.05
Total Funds 86,231,517 4.00
COMMON STOCKS (SHARES) & WARRANTS
Austria 519,000 Verbund AG 'A' * 20,087,032 0.93
Belgium 36,859,562 Hansen Transmissions International NV 38,643,542 1.79
979,246 Umicore SA 47,629,662 2.21
86,273,204 4.00
Bermuda 41,780,000 China WindPower Group Ltd 2,466,032 0.11
Brazil 3,850,000 Cia Energetica de Minas Gerais ADR 72,726,500 3.37
Canada 71,669,898 Azure Dynamics Corp 8,837,610 0.41
10,546,875 Canada Lithium Corp 6,502,672 0.30
968,000 Dynetek Industries Ltd 139,258 0.01
737,000 Potash Corp of Saskatchewan Inc 43,895,720 2.03
26,035,370 Ram Power Corp (Unit) 8,427,351 0.39
16,600,000 Ram Power Corp (Wts 19/5/2014) 938,183 0.05
68,740,794 3.19
Cayman Islands 1,377,770 Trina Solar Ltd ADR * 22,870,982 1.06
15,000,000 Wasion Group Holdings Ltd 5,889,590 0.27
3,240,000 Yingli Green Energy Holding Co Ltd ADR * 21,027,600 0.98
49,788,172 2.31
China 1,000,000 Byd Co Ltd 'H' * 2,086,378 0.10
30,666,000 China Longyuan Power Group Corp 'H' 27,819,474 1.29
20,946,000 Shanghai Electric Group Co Ltd 'H' 9,594,927 0.44
5,546,800 Xinjiang Goldwind Science & Technology Co
Ltd 'H' * 2,939,442 0.14
42,440,221 1.97
Denmark 696,000 Novozymes A/S 'B' * 103,271,028 4.79
3,796,630 Vestas Wind Systems A/S * 80,066,572 3.71
183,337,600 8.50
Finland 1,476,164 Fortum OYJ 39,694,277 1.84
France 828,000 Schneider Electric SA 110,942,594 5.15
Germany 473,000 Aixtron SE NA * 10,826,897 0.50
384,000 Centrotherm Photovoltaics AG * 12,693,770 0.59
1,689,557 Elster Group SE ADR 29,432,083 1.37
226,280 SMA Solar Technology AG * 23,593,751 1.09
390,000 Wacker Chemie AG * 56,310,755 2.61
132,857,256 6.16
Greece 1,248,110 Terna Energy SA 3,893,321 0.18
Hong Kong 14,498,000 China Agri-Industries Holdings Ltd 13,524,302 0.63
Ireland 4,412,508 Kingspan Group Plc 39,196,279 1.82
Isle of Man 3,639,000 Greenko Group Plc 10,391,392 0.48
Italy 15,309,000 Enel Green Power SpA 35,307,369 1.64
Japan 620,000 Yamatake Corp 13,227,959 0.61
Jersey 2,938,046 Camco International Ltd 683,167 0.03
Russian Federation 2,500,000 Federal Hydrogenerating Co JSC ADR 11,022,500 0.51
South Africa 1,176,000 Sasol Ltd 56,400,901 2.62
Spain 881,000 Abengoa SA * 23,168,583 1.07
256,352 Acciona SA * 23,897,175 1.11
10,955,000 EDP Renovaveis SA 64,801,632 3.01
5,053,118 Iberdrola SA 37,304,730 1.73
149,172,120 6.92
Switzerland 1,013,000 ABB Ltd 21,760,427 1.01
United Kingdom 2,117,000 AMEC Plc 30,968,828 1.44
10,685,768 D1 Oils Plc 326,934 0.01
3,205,398 Johnson Matthey Plc 89,439,980 4.15
2,694,000 Scottish & Southern Energy Plc 56,883,393 2.64
8,789,645 SIG Plc 14,744,093 0.68
192,363,228 8.92
United States 2,053,000 Archer-Daniels-Midland Co 59,044,280 2.74
5,400,000 Axion Power International Inc 3,186,000 0.15
868,000 Clean Energy Fuels Corp * 11,665,920 0.54
621,000 Covanta Holding Corp 10,209,240 0.47
300,000 EnerNOC Inc 3,939,000 0.18
528,000 ESCO Technologies Inc 16,436,640 0.76
1,240,000 General Cable Corp 37,820,000 1.75
1,280,000 ITC Holdings Corp 97,894,400 4.54
1,080,892 Itron Inc 43,332,960 2.01
Transferable Securities Admitted to an Official Stock Exchange Listing or Dealt in on Another Regulated Market
Holding Description Value (USD) %
Transferable Securities Admitted to an Official Stock Exchange Listing or Dealt in on Another Regulated Market
Holding Description Value (USD) %

* Securities lent, see Note 11, for further details.
Audited Annual Report and Accounts 195
The notes on pages 261 to 270 form an integral part of these financial statements.
New Energy Fund continued
Portfolio of Investments 31 August 2011
3,030,843 Johnson Controls Inc 98,169,005 4.55
1,054,000 MasTec Inc 23,166,920 1.08
1,465,000 NextEra Energy Inc 82,889,700 3.84
686,166 Ormat Technologies Inc 11,507,004 0.53
4,906,000 Quanta Services Inc 94,538,620 4.39
8,163,532 Rentech Inc 7,646,780 0.36
1,977,780 Shaw Group Inc/The 46,121,830 2.14
735,000 STR Holdings Inc * 8,775,900 0.41
279,000 Veeco Instruments Inc * 10,350,900 0.48
666,695,099 30.92
Total Common Stocks (Shares) & Warrants 2,022,991,746 93.82
Total Transferable Securities Admitted
to an Official Stock Exchange Listing or
Dealt in on Another Regulated Market 2,109,223,263 97.82
Unquoted Securities
COMMON / PREFERRED STOCKS (SHARES) & WARRANTS
Bermuda 2,988,167 Infinity Bio-Energy Ltd (Defaulted) – 0.00
Canada 2,520,000 Tantalus Systems Corp 2,278,767 0.11
United Kingdom 667,000 Pelamis Wave Power Ltd (Defaulted) – 0.00
United States 115,000 Homeland Renewable Energy Com 285,200 0.01
5,722,012 Imperium Renewables 3,433,207 0.16
147,126,100 Imperium Renewables (Wts 31/12/2049) 1,472 0.00
4,052,827 Ls9 IncCom Stk Usd (Placing) 17,295,845 0.80
3,281,600 Mascoma Corp Ser D (Pref) (Restricted) 12,306,000 0.57
23,000 Medis Technologies Com (Restricted) 253 0.00
482,212 Rentech Inc (Defaulted) (Wts 25/4/2012) – 0.00
33,321,977 1.54
Total Common / Preferred Stocks (Shares)
& Warrants 35,600,744 1.65
BONDS
United States USD 708,486 Mascoma Corporation 8% 1/8/2016 708,486 0.03
Total Bonds 708,486 0.03
Total Unquoted Securities 36,309,230 1.68
Total Portfolio 2,145,532,493 99.50
Other Net Assets 10,801,868 0.50
Total Net Assets (USD) 2,156,334,361 100.00
Transferable Securities Admitted to an Official Stock Exchange Listing or Dealt in on Another Regulated Market
Holding Description Value (USD) %
Unquoted Securities
Holding Description Value (USD) %
Sector Breakdownas at 31 August 2011
% of netassets
Utilities 28.19
Industrials 26.76
Materials 16.50
Information Technology 8.96
Energy 6.54
Consumer Discretionary 5.07
Investment Funds 4.00
Consumer Staples 3.37
Financials 0.11
Other Net Assets 0.50
100.00

196 BlackRock Global Funds (BGF)
Pacific Equity Fund
FUNDS
Ireland 2,601,048 Institutional Cash Series Plc - Institutional
US Dollar Liquidity Fund 2,601,048 1.52
Total Funds 2,601,048 1.52
COMMON STOCKS (SHARES) & WARRANTS
Australia 385,077 AMP Ltd 1,887,224 1.10
199,688 Australia & New Zealand Banking Group Ltd 4,383,405 2.56
3,146,690 Commonwealth Property Office Fund (Reit) 3,268,156 1.91
170,381 National Australia Bank Ltd 4,372,335 2.55
97,915 Newcrest Mining Ltd 4,263,761 2.49
42,213 Rio Tinto Ltd 3,311,934 1.94
899,975 Telstra Corp Ltd 2,950,195 1.72
24,437,010 14.27
Bermuda 2,080,000 Huabao International Holdings Ltd * 1,618,595 0.95
Cayman Islands 1,391,000 China High Precision Automation Group Ltd 748,685 0.44
1,318,000 China Shanshui Cement Group Ltd 1,321,353 0.77
942,000 MGM China Holdings Ltd 1,842,366 1.08
1,191,000 Shimao Property Holdings Ltd * 1,265,084 0.74
132,268 Trina Solar Ltd ADR 2,219,291 1.30
228,804 WuXi PharmaTech Cayman Inc ADR 3,038,857 1.77
10,435,636 6.10
China 811,940 Changsha Zoomlion Heavy Industry Science
and Technology Development Co Ltd 'H' * 1,406,871 0.82
2,535,000 China Citic Bank Corp Ltd 'H' 1,374,289 0.80
3,208,690 China Construction Bank Corp 'H' 2,405,357 1.41
383,200 China Pacific Insurance Group Co Ltd 'H' 1,513,340 0.88
2,804,000 China Petroleum & Chemical Corp 'H' 2,796,585 1.63
1,476,489 China Vanke 'B' 1,914,935 1.12
1,278,000 Dongfeng Motor Group Co Ltd 'H' 2,058,621 1.20
3,677,885 Industrial & Commercial Bank of China 'H' 2,442,260 1.43
15,912,258 9.29
Germany 73,396 Deutsche Bank AG (Cert 10/10/2018 -
KB Financial Group Inc) 3,066,614 1.79
Hong Kong 400,500 China Mobile Ltd 4,103,490 2.40
319,299 Wharf Holdings Ltd 2,054,012 1.20
6,157,502 3.60
India 91,261 ICICI Bank Ltd 1,749,225 1.02
Indonesia 2,847,000 Bank Mandiri Tbk PT 2,310,084 1.35
271,000 Indo Tambangraya Megah PT 1,385,158 0.81
3,695,242 2.16
Japan 39,200 Astellas Pharma Inc * 1,487,121 0.87
778 Fuji Media Holdings Inc 1,156,800 0.68
667,000 Hitachi Ltd 3,631,158 2.12
51,600 Honda Motor Co Ltd 1,682,747 0.98
113,400 JS Group Corp 2,889,444 1.69
416,840 JX Holdings Inc 2,648,413 1.55
280 KDDI Corp 2,103,789 1.23
506,000 Marubeni Corp 3,208,226 1.87
386,000 Mitsubishi Gas Chemical Co Inc 2,727,228 1.59
293,400 Mitsubishi UFJ Financial Group Inc 1,330,417 0.78
5,526 Monex Group Inc 1,064,946 0.62
59,200 Nabtesco Corp 1,328,160 0.78
366,000 Nissan Motor Co Ltd 3,362,661 1.96
375,000 NSK Ltd 3,005,413 1.76
1,204 NTT DoCoMo Inc 2,199,678 1.28
118,100 Omron Corp 2,855,082 1.67
24,310 ORIX Corp 2,211,074 1.29
281,700 Showa Shell Sekiyu KK * 2,268,806 1.33
91,700 Sony Corp 2,012,578 1.18
230,800 Sumitomo Corp 3,024,068 1.77
103,800 Sumitomo Mitsui Financial Group Inc * 3,085,412 1.80
895,000 Sumitomo Osaka Cement Co Ltd 2,760,629 1.61
48,400 TDK Corp 2,130,891 1.24
716,000 Toshiba Corp 3,123,994 1.82
57,298,735 33.47
Luxembourg 786,300 Samsonite International SA 1,427,711 0.83
Singapore 252,000 DBS Group Holdings Ltd 2,806,371 1.64
South Korea 75,310 Hyundai Development Co 1,780,210 1.04
6,054 KB Financial Group Inc 252,947 0.15
52,460 LG Display Co Ltd 1,038,777 0.61
15,346 LG Electronics Inc 968,317 0.56
6,708 Samsung Electronics Co Ltd 4,728,397 2.76
96,540 Samsung Heavy Industries Co Ltd 3,178,412 1.86
73,220 Shinhan Financial Group Co Ltd 3,114,757 1.82
147,153 SNU Precision Co Ltd 1,791,514 1.04
16,853,331 9.84
Taiwan 3,166,000 AU Optronics Corp 1,522,303 0.89
239,000 Hon Hai Precision Industry Co Ltd 610,398 0.36
166,000 MediaTek Inc 1,686,001 0.98
1,963,000 Prince Housing & Development Corp 1,874,054 1.09
4,112,000 Taishin Financial Holding Co Ltd 1,876,876 1.10
7,569,632 4.42
Thailand 657,700 Kasikornbank PCL 2,828,152 1.65
United Kingdom 221,391 BHP Billiton Plc 7,678,994 4.49
United States 14,080 Citigroup Global Markets Holdings Inc (Call Wts
20/1/2015 - Shinhan Financial Group) 598,959 0.35
13,318 Sohu.com Inc 1,115,816 0.65
1,714,775 1.00
Total Common Stocks (Shares)
& Warrants 165,249,783 96.52
Total Transferable Securities Admitted
to an Official Stock Exchange Listing or
Dealt in on Another Regulated Market 167,850,831 98.04
Transferable Securities Admitted to an Official Stock Exchange Listing or Dealt in on Another Regulated Market
Holding Description Value (USD) %
Transferable Securities Admitted to an Official Stock Exchange Listing or Dealt in on Another Regulated Market
Holding Description Value (USD) %
Portfolio of Investments 31 August 2011

* Securities lent, see Note 11, for further details.
Audited Annual Report and Accounts 197
The notes on pages 261 to 270 form an integral part of these financial statements.
Pacific Equity Fund continued
Portfolio of Investments 31 August 2011
COMMON (SHARES)
Japan 36,200 Tokyo Electron Ltd 1,744,075 1.02
Total Unquoted Securities 1,744,075 1.02
Total Portfolio 169,594,906 99.06
Other Net Assets 1,613,899 0.94
Total Net Assets (USD) 171,208,805 100.00
Unquoted Securities
Holding Description Value (USD) %
Sector Breakdownas at 31 August 2011
% of netassets
Financials 32.15
Information Technology 16.90
Materials 13.84
Industrials 11.59
Consumer Discretionary 8.47
Telecommunication Services 6.63
Energy 5.32
Healthcare 2.64
Investment Funds 1.52
Other Net Assets 0.94
100.00

* Securities lent, see Note 11, for further details.
198 BlackRock Global Funds (BGF)
Swiss Small & MidCap Opportunities Fund
Portfolio of Investments 31 August 2011
COMMON STOCKS (SHARES)
Israel 762,591 Oridion Systems Ltd 8,807,926 2.72
Switzerland 70,817 Actelion Ltd 2,426,190 0.75
191,545 Bank Sarasin & Cie AG 'B' 5,056,788 1.56
44,952 Banque Cantonale Vaudoise 20,992,584 6.48
22,383 Barry Callebaut AG 17,302,059 5.34
24,239 Burckhardt Compression Holding AG 5,429,536 1.68
239,250 Cie Financiere Richemont SA 'A' 11,127,518 3.44
54,267 Dufry AG 4,658,822 1.44
769,891 GAM Holding AG 9,007,725 2.78
40,135 Gategroup Holding AG 1,187,996 0.37
71,920 Geberit AG 12,017,832 3.71
9,417 Helvetia Holding AG 2,770,952 0.86
656,030 Implenia AG 16,269,544 5.02
15,486 Inficon Holding AG 2,104,547 0.65
31,161 Julius Baer Group Ltd 1,035,480 0.32
56,144 Kaba Holding AG 'B' 16,716,876 5.16
25,868 Kuoni Reisen Holding AG 'B' 7,165,436 2.21
827 Lindt & Spruengli AG 2,067,500 0.64
838,182 Logitech International SA * 8,096,838 2.50
269,615 Novartis AG 12,650,336 3.91
22,600 Partners Group Holding AG 3,098,460 0.96
38,756 PSP Swiss Property AG 3,090,791 0.96
78,497 Roche Holding AG 10,973,881 3.39
18,613 Schaffner Holding AG 4,764,928 1.47
19,900 Schindler Holding AG 1,912,390 0.59
8,946 Sika AG 16,460,640 5.08
167,582 Sonova Holding AG 11,554,779 3.57
83,372 Starrag-Heckert Holding AG 5,644,284 1.74
55,111 Sulzer AG 5,974,032 1.85
12,981 Swisscom AG 4,705,613 1.45
320,158 Swissquote Group Holding SA 11,669,759 3.60
28,650 Syngenta AG 7,385,970 2.28
103,980 Tecan Group AG 6,992,655 2.16
62,283 Valora Holding AG 14,829,582 4.58
33,900 VZ Holding AG 3,308,640 1.02
343,483 Zehnder Group AG 18,084,380 5.59
45,288 Zurich Financial Services AG 8,174,484 2.52
296,709,827 91.63
Total Common Stocks (Shares) 305,517,753 94.35
Total Transferable Securities Admitted
to an Official Stock Exchange Listing or
Dealt in on Another Regulated Market 305,517,753 94.35
Total Portfolio 305,517,753 94.35
Other Net Assets 18,301,709 5.65
Total Net Assets (CHF) 323,819,462 100.00
Transferable Securities Admitted to an Official Stock Exchange Listing or Dealt in on Another Regulated Market
Holding Description Value (CHF) %
Transferable Securities Admitted to an Official Stock Exchange Listing or Dealt in on Another Regulated Market
Holding Description Value (CHF) %
Sector Breakdownas at 31 August 2011
% of netassets
Industrials 25.71
Financials 21.06
Healthcare 16.50
Consumer Discretionary 11.67
Materials 7.36
Consumer Staples 5.98
Information Technology 4.62
Telecommunication Services 1.45
Other Net Assets 5.65
100.00

* Securities lent, see Note 11, for further details.
Audited Annual Report and Accounts 199
The notes on pages 261 to 270 form an integral part of these financial statements.
United Kingdom Fund
Portfolio of Investments 31 August 2011
FUNDS
United Kingdom 5,188,903 Blackrock UK Smaller Companies Fund 20,389,794 4.98
Total Funds 20,389,794 4.98
COMMON STOCKS (SHARES)
Jersey 527,680 Shire Plc 10,384,742 2.54
784,045 United Business Media Ltd 3,652,082 0.89
592,722 Wolseley Plc 9,459,843 2.31
23,496,667 5.74
Luxembourg 565,314 AZ Electronic Materials SA 1,295,134 0.31
United Kingdom 524,134 AMEC Plc 4,698,861 1.15
257,640 Anglo American Plc 6,611,042 1.61
1,166,019 BG Group Plc 15,449,752 3.77
556,378 BHP Billiton Plc 11,700,629 2.86
562,700 BowLeven Plc 728,697 0.18
3,316,072 BP Plc 13,345,532 3.26
719,010 British American Tobacco Plc 19,557,072 4.77
3,553,900 BT Group Plc 6,137,585 1.50
2,693,459 Capital & Counties Properties Plc 4,449,594 1.09
1,751,885 Carphone Warehouse Group Plc 6,254,229 1.53
900,810 Compass Group Plc 4,958,959 1.21
1,525,690 GlaxoSmithKline Plc 20,055,195 4.90
1,282,519 Great Portland Estates Plc (Reit) 4,608,091 1.12
306,683 Hargreaves Lansdown Plc 1,296,962 0.32
3,096,820 HSBC Holdings Plc 16,527,728 4.03
755,206 IMI Plc 6,736,438 1.64
395,737 Imperial Tobacco Group Plc 8,069,077 1.97
1,889,937 Intermediate Capital Group Plc 4,694,604 1.15
911,242 John Wood Group Plc 5,389,996 1.32
1,127,276 Jupiter Fund Management Plc 2,114,770 0.52
23,585,181 Lloyds Banking Group Plc 7,846,790 1.92
1,632,381 Michael Page International Plc 6,377,713 1.56
224,384 Next Plc 5,273,024 1.29
968,636 Premier Oil Plc 3,194,562 0.78
234,547 Pursuit Dynamics Plc * 510,140 0.12
1,051,217 Reed Elsevier Plc 5,277,109 1.29
494,464 Rio Tinto Plc 18,715,462 4.57
1,347,203 Royal Dutch Shell Plc 'B' 27,799,534 6.79
526,870 SABMiller Plc 11,722,858 2.86
2,000,696 Sage Group Plc/The 5,047,756 1.23
357,418 Schroders Plc 4,263,997 1.04
4,342,845 Senior Plc 6,822,610 1.67
316,199 Severn Trent Plc 4,632,315 1.13
274,527 Spirax-Sarco Engineering Plc 5,045,806 1.23
803,747 Standard Chartered Plc 11,168,065 2.73
2,723,623 Standard Life Plc 5,539,849 1.35
2,775,653 Tesco Plc 10,411,474 2.54
832,301 Tullow Oil Plc 8,880,652 2.17
487,501 Unilever Plc 10,013,271 2.44
15,088,994 Vodafone Group Plc 24,595,060 6.00
432,081 Whitbread Plc 6,550,348 1.60
537,023 Xstrata Plc 5,842,810 1.43
358,916,018 87.64
Total Common Stocks (Shares) 383,707,819 93.69
Total Transferable Securities Admitted
to an Official Stock Exchange Listing or
Dealt in on Another Regulated Market 404,097,613 98.67
Total Portfolio 404,097,613 98.67
Other Net Assets 5,436,329 1.33
Total Net Assets (GBP) 409,533,942 100.00
Transferable Securities Admitted to an Official Stock Exchange Listing or Dealt in on Another Regulated Market
Holding Description Value (GBP) %
Transferable Securities Admitted to an Official Stock Exchange Listing or Dealt in on Another Regulated Market
Holding Description Value (GBP) %
Sector Breakdownas at 31 August 2011
% of netassets
Energy 19.42
Financials 15.27
Consumer Staples 14.58
Materials 10.78
Industrials 8.53
Consumer Discretionary 7.81
Telecommunication Services 7.50
Healthcare 7.44
Investment Funds 4.98
Information Technology 1.23
Utilities 1.13
Other Net Assets 1.33
100.00

200 BlackRock Global Funds (BGF)
US Basic Value Fund
COMMON STOCKS (SHARES)
China 457,400 ACE Ltd 29,406,246 1.75
Ireland 335,900 Seagate Technology Plc 3,933,389 0.23
Netherlands 1,690,800 Unilever NV (NY Shares) 57,216,672 3.40
Switzerland 516,200 Noble Corp 17,514,666 1.04
887,100 Tyco International Ltd 37,231,587 2.21
54,746,253 3.25
United Kingdom 558,000 Ensco Plc ADR 27,057,420 1.61
United States 409,000 Aetna Inc 16,769,000 1.00
506,100 Aflac Inc 19,191,312 1.14
1,828,300 Alcoa Inc 23,511,938 1.40
596,700 Amgen Inc 33,078,064 1.97
704,000 Archer-Daniels-Midland Co 20,247,040 1.20
610,480 AT&T Inc 18,216,723 1.08
847,100 Bank of New York Mellon Corp 17,806,042 1.06
498,300 Baxter International Inc 28,064,256 1.67
294,809 Bristol-Myers Squibb Co 8,723,398 0.52
160,300 Chevron Corp 15,937,026 0.95
209,500 Cisco Systems Inc 3,321,623 0.20
1,349,300 Citigroup Inc 42,246,583 2.51
1,049,800 Comcast Corp 'A' 22,476,218 1.34
2,281,900 Corning Inc 34,411,052 2.04
191,000 CVS Caremark Corp 6,881,730 0.41
2,600,900 Delta Air Lines Inc 20,261,011 1.20
330,300 Devon Energy Corp 22,427,370 1.33
657,400 Dominion Resources Inc/VA 32,140,286 1.91
651,809 EI du Pont de Nemours & Co 31,717,026 1.88
657,800 Eli Lilly & Co 24,667,500 1.47
729,800 Exxon Mobil Corp 54,516,060 3.24
2,546,800 General Electric Co 41,869,392 2.49
255,900 General Mills Inc 9,693,492 0.58
1,060,000 General Motors Co 25,895,800 1.54
387,900 Halliburton Co 17,277,066 1.03
658,600 Hartford Financial Services Group Inc 12,855,872 0.76
191,400 Hess Corp 11,390,214 0.68
439,200 Honeywell International Inc 21,178,224 1.26
194,600 International Business Machines Corp 33,475,092 1.99
662,200 Jacobs Engineering Group Inc 24,991,428 1.48
339,700 Johnson & Johnson 22,430,391 1.33
1,691,300 JPMorgan Chase & Co 63,897,314 3.80
352,600 Kimberly-Clark Corp 24,325,874 1.45
1,162,800 Kroger Co 27,151,380 1.61
701,500 Lincoln National Corp 14,801,650 0.88
5,281,621 LSI Corp 36,020,655 2.14
780,600 Marathon Oil Corp 21,091,812 1.25
163,650 Marathon Petroleum Corp 6,010,865 0.36
898,800 Medtronic Inc 31,475,976 1.87
1,623,922 Merck & Co Inc 53,751,818 3.19
1,223,200 MetLife Inc 41,307,464 2.45
3,874,400 Micron Technology Inc 23,207,656 1.38
2,769,000 Microsoft Corp 73,259,433 4.35
91,100 Newfield Exploration Co 4,667,053 0.28
490,500 Nucor Corp 17,878,725 1.06
343,400 Peabody Energy Corp 17,018,904 1.01
138,200 PepsiCo Inc/NC 8,933,248 0.53
2,800,570 Pfizer Inc 53,434,876 3.18
402,500 Prudential Financial Inc 20,245,750 1.20
40,400 Raytheon Co 1,748,108 0.10
763,100 Southern Co 31,462,613 1.87
571,966 Time Warner Inc 18,159,920 1.08
664,800 Travelers Cos Inc 33,539,160 1.99
519,100 United States Steel Corp 16,071,336 0.95
868,300 US Bancorp 20,318,220 1.21
759,200 Verizon Communications Inc 27,771,536 1.65
604,109 Viacom Inc 'B' 29,244,917 1.74
220,300 Walt Disney Co/The 7,547,478 0.45
1,738,800 Wells Fargo & Co 45,087,084 2.68
1,078,827 Western Union Co 17,930,105 1.07
1,505,029,159 89.44
Total Common Stocks (Shares) 1,677,389,139 99.68
Total Transferable Securities Admitted
to an Official Stock Exchange Listing or
Dealt in on Another Regulated Market 1,677,389,139 99.68
Total Portfolio 1,677,389,139 99.68
Other Net Assets 5,331,667 0.32
Total Net Assets (USD) 1,682,720,806 100.00
Transferable Securities Admitted to an Official Stock Exchange Listing or Dealt in on Another Regulated Market
Holding Description Value (USD) %
Transferable Securities Admitted to an Official Stock Exchange Listing or Dealt in on Another Regulated Market
Holding Description Value (USD) %
Portfolio of Investments 31 August 2011

US Basic Value Fund continued
Audited Annual Report and Accounts 201
The notes on pages 261 to 270 form an integral part of these financial statements.
Sector Breakdownas at 31 August 2011
% of netassets
Financials 21.43
Healthcare 16.20
Information Technology 13.40
Energy 12.78
Consumer Staples 9.18
Industrials 8.74
Consumer Discretionary 6.15
Materials 5.29
Utilities 3.78
Telecommunication Services 2.73
Other Net Assets 0.32
100.00
Open Forward Foreign Exchange Transactionsas at 31 August 2011
Purchases Sales Value date Unrealised
profit/(loss)
Unrealisedprofit/(loss)
USD Equivalent
EUR Hedged Share Class EUR
EUR 126,288,779 USD 179,865,570 14/9/2011 1,722,496 2,487,718
USD 23,353,129 EUR 16,319,061 14/9/2011 (145,802) (210,575)
Net unrealised profit 1,576,694 2,277,143
SGD Hedged Share Class SGD
SGD 626,819 USD 514,158 14/9/2011 8,518 7,083
USD 62,609 SGD 75,939 14/9/2011 (648) (539)
Net unrealised profit 7,870 6,544
Total net unrealised profit 2,283,687
Note: The net unrealised profit attributed to these transactions is included in the Statement
of Net Assets (see Note 2c).

202 BlackRock Global Funds (BGF)
US Dollar Core Bond Fund
Portfolio of Investments 31 August 2011
BONDS
Argentina USD 350,000 Argentina Bonos 7% 3/10/2015 325,335 0.11
Australia USD 135,000 Woodside Finance Ltd '144A' 4.6%
10/5/2021 141,208 0.05
Bermuda USD 115,000 Weatherford International Ltd/Bermuda
6.75% 15/9/2040 127,365 0.04
Brazil USD 330,000 Brazilian Government International Bond
7.125% 20/1/2037 437,110 0.14
USD 910,000 HSBC Bank Brasil SA - Banco Multiplo
'144A' 4% 11/5/2016 908,271 0.30
USD 200,000 OGX Petroleo e Gas Participacoes SA
'144A' 8.5% 1/6/2018 201,250 0.07
1,546,631 0.51
Canada USD 1,810,000 Barrick Gold Corp '144A' 2.9% 30/5/2016 1,862,125 0.61
USD 1,185,000 Canadian Imperial Bank of Commerce/
Canada '144A' 2.75% 27/1/2016 1,255,356 0.41
USD 390,000 Fairfax Financial Holdings Ltd '144A' 5.8%
15/5/2021 382,833 0.13
USD 1,455,000 Hydro Quebec 8.05% 7/7/2024 2,169,628 0.71
USD 540,000 Hydro Quebec 8.4% 15/1/2022 789,006 0.26
USD 300,000 Hydro Quebec 9.4% 1/2/2021 457,979 0.15
USD 1,790,000 Manulife Financial Corp 3.4% 17/9/2015 1,824,840 0.60
USD 405,000 MEG Energy Corp '144A' 6.5% 15/3/2021 402,469 0.13
USD 475,000 Nexen Inc 7.5% 30/7/2039 551,779 0.18
USD 470,000 Novelis Inc/GA 8.75% 15/12/2020 489,975 0.16
USD 1,530,000 Royal Bank of Canada '144A' 3.125%
14/4/2015 1,632,781 0.54
11,818,771 3.88
Cayman Islands USD 2,285,000 Petrobras International Finance Co 5.75%
20/1/2020 2,481,010 0.81
USD 70,000 Petrobras International Finance Co 5.875%
1/3/2018 76,220 0.03
USD 1,100,000 Petrobras International Finance Co - Pifco
3.875% 27/1/2016 1,129,790 0.37
USD 21,000 Transocean Inc 6% 15/3/2018 23,265 0.01
3,710,285 1.22
Chile USD 266,000 Corp Nacional del Cobre de Chile '144A'
3.75% 4/11/2020 269,833 0.09
USD 185,000 Inversiones CMPC SA '144A' 4.75%
19/1/2018 189,991 0.06
459,824 0.15
France USD 115,000 Lafarge SA 7.125% 15/7/2036 96,404 0.03
Germany USD 750,000 Kreditanstalt fuer Wiederaufbau 1.375%
15/7/2013 763,489 0.25
USD 445,000 Kreditanstalt fuer Wiederaufbau 2%
1/6/2016 463,530 0.15
1,227,019 0.40
Greece EUR 120,000 Hellenic Republic Government Bond
4.6% 20/9/2040 71,922 0.02
Indonesia USD 200,000 Republic of Indonesia 4.875% 5/5/2021 213,751 0.07
International USD 295,000 Corporation Andina de Fomento 6.875%
15/3/2012 304,816 0.10
Ireland USD 250,000 XL Group Plc FRN 15/4/2017 (Perpetual) 222,500 0.07
Isle of Man USD 220,000 AngloGold Ashanti Holdings Plc 5.375%
15/4/2020 225,432 0.07
Jersey USD 355,000 Swiss Re Capital I LP '144A' FRN
25/5/2016 (Perpetual) 340,535 0.11
Luxembourg USD 264,000 Intelsat Jackson Holdings SA '144A'
7.25% 1/4/2019 249,480 0.08
Mexico USD 1,525,000 Mexico Government International Bond
5.125% 15/1/2020 1,708,762 0.56
USD 435,000 Mexico Government International Bond
5.625% 15/1/2017 500,794 0.17
2,209,556 0.73
Netherlands Antilles USD 520,000 Teva Pharmaceutical Finance II BV / Teva
Pharmaceutical Finance III LLC 3%
15/6/2015 545,536 0.18
Norway USD 2,480,000 Eksportfinans ASA 2% 15/9/2015 2,552,380 0.84
USD 625,000 Eksportfinans ASA 5.5% 25/5/2016 737,984 0.24
3,290,364 1.08
Peru USD 70,000 Peruvian Government International Bond
6.55% 14/3/2037 84,891 0.03
Poland USD 580,000 Poland Government International Bond
5.125% 21/4/2021 604,650 0.20
USD 120,000 Poland Government International Bond
6.375% 15/7/2019 138,225 0.04
742,875 0.24
Russian Federation USD 635,775 Russian Foreign Bond - Eurobond
(Step-up coupon) 7.5% 31/3/2030 761,341 0.25
South Africa USD 300,000 South Africa Government International
Bond 5.5% 9/3/2020 342,375 0.11
Spain USD 875,000 Telefonica Emisiones SAU 4.949%
15/1/2015 892,425 0.29
Transferable Securities Admitted to an Official Stock Exchange Listing or Dealt in on Another Regulated Market
Holding Description Value (USD) %
Transferable Securities Admitted to an Official Stock Exchange Listing or Dealt in on Another Regulated Market
Holding Description Value (USD) %

Audited Annual Report and Accounts 203
The notes on pages 261 to 270 form an integral part of these financial statements.
US Dollar Core Bond Fund continued
Portfolio of Investments 31 August 2011
Switzerland USD 385,000 Credit Suisse AG/Guernsey '144A' 2.6%
27/5/2016 396,598 0.13
USD 260,000 Credit Suisse AG/Guernsey FRN
15/5/2017 (Perpetual) 219,700 0.07
USD 180,000 Credit Suisse/New York NY 5.4%
14/1/2020 178,774 0.06
795,072 0.26
Turkey USD 505,000 Turkey Government International Bond
5.625% 30/3/2021 539,340 0.18
USD 170,000 Turkey Government International Bond
7% 11/3/2019 196,945 0.06
736,285 0.24
United Kingdom USD 200,000 Barclays Bank Plc '144A' FRN 15/12/2016
(Perpetual) 163,000 0.05
USD 840,000 BP Capital Markets Plc 3.125% 10/3/2012 851,699 0.28
USD 1,646,000 BP Capital Markets Plc 3.125% 1/10/2015 1,725,714 0.57
USD 240,000 BP Capital Markets Plc 3.875% 10/3/2015 256,277 0.08
USD 120,000 Ensco Plc 3.25% 15/3/2016 124,588 0.04
USD 251,000 Ensco Plc 4.7% 15/3/2021 262,954 0.09
USD 416,667 Holmes Master Issuer Plc '2007-2A 3A1'
FRN 15/7/2021 416,004 0.14
USD 465,000 HSBC Bank Plc '144A' 3.1% 24/5/2016 472,978 0.16
USD 385,000 Virgin Media Secured Finance Plc 6.5%
15/1/2018 410,025 0.13
USD 1,411,000 Vodafone Group Plc 4.15% 10/6/2014 1,522,038 0.50
6,205,277 2.04
United States USD 872,329 321 Henderson Receivables I LLC '2010-3A A'
'144A' 3.82% 15/12/2048 874,080 0.29
USD 465,950 321 Henderson Receivables I LLC '2010-2A A'
'144A' 4.07% 15/1/2048 484,377 0.16
USD 919,401 321 Henderson Receivables I LLC '2010-1A A'
'144A' 5.56% 15/7/2059 1,045,903 0.34
USD 121,848 ACE Securities Corp '2006-NC3 A2A' FRN
25/12/2036 118,615 0.04
USD 305,000 Alabama Power Co 3.95% 1/6/2021 327,940 0.11
USD 240,000 American International Group Inc 5.45%
18/5/2017 241,604 0.08
USD 80,000 American International Group Inc '144A'
FRN 15/5/2058 78,860 0.03
USD 785,000 AmeriCredit Automobile Receivables Trust
'2011-2 C' 3.19% 12/10/2016 808,187 0.27
USD 862,000 Anadarko Petroleum Corp 5.95%
15/9/2016 962,684 0.32
USD 966,000 Anadarko Petroleum Corp 6.375%
15/9/2017 1,105,407 0.36
USD 154,000 Anadarko Petroleum Corp 6.95%
15/6/2019 181,511 0.06
USD 650,000 Arch Coal Inc 7.25% 1/10/2020 646,750 0.21
USD 292,000 AT&T Inc 5.35% 1/9/2040 299,135 0.10
USD 720,000 Banc of America Large Loan Inc
'2010-UB4 A4A' '144A' FRN 20/12/2041 760,106 0.25
USD 268,425 Banc of America Merrill Lynch Commercial
Mortgage Inc '2002-2 A3' 5.118%
11/7/2043 270,718 0.09
USD 115,000 Banc of America Merrill Lynch Commercial
Mortgage Inc '2006-5 AM' 5.448%
10/9/2047 97,714 0.03
USD 200,000 Banc of America Merrill Lynch Commercial
Mortgage Inc '2006-4 AM' 5.675%
10/7/2046 188,842 0.06
USD 1,500,000 Bank of America Corp 3.625% 17/3/2016 1,458,239 0.48
USD 10,000 Barrick North America Finance LLC '144A'
4.4% 30/5/2021 10,525 0.00
USD 82,830 BCAP LLC Trust '2007-AA1 1A1' FRN
25/2/2047 74,221 0.02
USD 58,947 Bear Stearns Asset Backed Securities Trust
'2007-HE1 21A1' FRN 25/1/2037 54,539 0.02
USD 41,290 Bear Stearns Asset Backed Securities Trust
'2006-HE10 21A1' FRN 25/12/2036 38,237 0.01
USD 140,000 Bear Stearns Commercial Mortgage Securities
'2005-PW10 AM' FRN 11/12/2040 132,848 0.04
USD 280,000 BorgWarner Inc 4.625% 15/9/2020 298,593 0.10
USD 770,000 Burlington Northern Santa Fe LLC 5.75%
1/5/2040 851,602 0.28
USD 290,000 Caesars Entertainment Operating Co Inc
10% 15/12/2018 219,675 0.07
USD 175,000 Capital One Capital V 10.25% 15/8/2039 181,562 0.06
USD 3,365,000 Capital One Financial Corp 3.15%
15/7/2016 3,348,977 1.10
USD 170,000 Capital One Financial Corp 4.75%
15/7/2021 167,733 0.06
USD 330,000 Capital One Multi-Asset Execution Trust
'2006-A5 A5' FRN 15/1/2016 329,588 0.11
USD 550,000 CareFusion Corp 6.375% 1/8/2019 658,393 0.22
USD 300,000 Carolina Power & Light Co 5.3% 15/1/2019 352,860 0.12
USD 185,844 Carrington Mortgage Loan Trust
'2006-NC5 A1' FRN 25/1/2037 183,105 0.06
USD 105,000 CBS Corp 4.625% 15/5/2018 111,665 0.04
USD 180,000 CBS Corp 5.75% 15/4/2020 200,660 0.07
USD 405,000 CBS Corp 8.875% 15/5/2019 523,768 0.17
USD 890,000 CCH II LLC / CCH II Capital Corp 13.5%
30/11/2016 1,030,175 0.34
USD 710,000 CF Industries Inc 7.125% 1/5/2020 811,175 0.27
USD 139,000 CIT Group Inc '144A' 6.625% 1/4/2018 * 137,610 0.05
USD 368,211 CIT Group Inc 7% 1/5/2017 360,387 0.12
USD 2,085,000 Citibank Omni Master Trust '2009-A8 A8'
'144A' FRN 16/5/2016 2,106,270 0.69
USD 645,000 Citibank Omni Master Trust '2009-A12 A12'
'144A' 3.35% 15/8/2016 658,302 0.22
USD 1,515,000 Citibank Omni Master Trust '2009-A17 A17'
'144A' 4.9% 15/11/2018 1,656,237 0.54
USD 580,000 Citibank Omni Master Trust '2009-A13 A13'
'144A' 5.35% 15/8/2018 639,088 0.21
USD 1,391,429 Citigroup Commercial Mortgage Trust
'2005-EMG A4' '144A' 4.518%
20/9/2051 1,424,005 0.47
USD 2,750,000 Citigroup Inc 4.587% 15/12/2015 2,846,154 0.93
USD 390,000 Citigroup Inc 4.75% 19/5/2015 406,874 0.13
USD 200,000 Citigroup Inc 5% 15/9/2014 203,779 0.07
USD 130,000 Citigroup Inc 5.375% 9/8/2020 137,490 0.05
USD 65,000 Citigroup Inc 6% 15/8/2017 69,493 0.02
USD 64,000 Citigroup Inc 8.5% 22/5/2019 78,419 0.03
USD 1,730,000 Citigroup/Deutsche Bank Commercial
Mortgage Trust '2006-CD3 A5' 5.617%
15/10/2048 1,846,079 0.61
USD 350,000 Citigroup/Deutsche Bank Commercial
Mortgage Trust '2006-CD3 AM' 5.648%
15/10/2048 307,616 0.10
USD 1,500,000 Citigroup/Deutsche Bank Commercial
Mortgage Trust '2007-CD5 A4' FRN
15/11/2044 1,610,744 0.53
Transferable Securities Admitted to an Official Stock Exchange Listing or Dealt in on Another Regulated Market
Holding Description Value (USD) %
Transferable Securities Admitted to an Official Stock Exchange Listing or Dealt in on Another Regulated Market
Holding Description Value (USD) %

204 BlackRock Global Funds (BGF)
US Dollar Core Bond Fund continued
Portfolio of Investments 31 August 2011
USD 693,000 Clear Channel Worldwide Holdings Inc
Series B 9.25% 15/12/2017 738,045 0.24
USD 128,000 Clear Channel Worldwide Holdings Inc
9.25% 15/12/2017 135,680 0.04
USD 129,000 Cleveland Electric Illuminating Co/The
5.95% 15/12/2036 139,344 0.05
USD 72,000 Cleveland Electric Illuminating Co/The
8.875% 15/11/2018 96,982 0.03
USD 375,000 Cliffs Natural Resources Inc 4.875%
1/4/2021 372,814 0.12
USD 780,000 Comcast Corp 5.875% 15/2/2018 913,073 0.30
USD 275,000 Comcast Corp 6.45% 15/3/2037 307,104 0.10
USD 1,283,806 Countrywide Alternative Loan Trust
'2005-21CB A17' 6% 25/6/2035 1,153,281 0.38
USD 60,466 Countrywide Asset-Backed Certificates
'2007-1 2A1' FRN 25/7/2037 58,799 0.02
USD 32,724 Countrywide Asset-Backed Certificates
'2004-5 A' FRN 25/10/2034 26,048 0.01
USD 45,177 Countrywide Asset-Backed Certificates
'2003-BC3 A2' FRN 25/9/2033 36,886 0.01
USD 42,306 Countrywide Home Loan Mortgage
Pass Through Trust '2004-29 1A1'
FRN 25/2/2035 34,850 0.01
USD 675,797 Countrywide Home Loan Mortgage
Pass Through Trust '2006-J2 1A1'
6% 25/4/2036 579,099 0.19
USD 752,875 Countrywide Home Loan Mortgage
Pass Through Trust '2006-J4 A9'
6.25% 25/9/2036 614,507 0.20
USD 580,000 COX Communications Inc '144A' 8.375%
1/3/2039 802,788 0.26
USD 185,928 Credit Suisse First Boston Mortgage
Securities Corp '2002-CP5 A1' 4.106%
15/12/2035 186,469 0.06
USD 248,050 Credit Suisse Mortgage Capital Certificates
'2006-8 3A1' 6% 25/10/2021 203,442 0.07
USD 346,000 Cricket Communications Inc 7.75%
15/5/2016 349,460 0.11
USD 235,000 CSC Holdings LLC 8.5% 15/4/2014 254,975 0.08
USD 1,055,000 DIRECTV Holdings LLC / DIRECTV
Financing Co Inc 3.125% 15/2/2016 1,086,837 0.36
USD 485,000 Dollar General Corp 11.875% 15/7/2017 539,562 0.18
USD 510,000 Dominion Resources Inc/VA 1.95%
15/8/2016 508,656 0.17
USD 310,000 Dow Chemical Co/The 4.25% 15/11/2020 317,668 0.10
USD 160,000 El Paso Pipeline Partners Operating Co LLC
6.5% 1/4/2020 183,021 0.06
USD 530,000 Energy Future Intermediate Holding Co LLC
/ EFIH Finance Inc 10% 1/12/2020 538,501 0.18
USD 80,000 Enterprise Products Operating LLC 5.2%
1/9/2020 86,995 0.03
USD 495,000 Enterprise Products Operating LLC 6.125%
15/10/2039 515,302 0.17
USD 922,047 Extended Stay America Trust '2010-ESHA A'
'144A' 2.951% 5/11/2027 909,000 0.30
USD 575,000 Extended Stay America Trust '2010-ESHA C'
'144A' 4.86% 5/11/2027 556,101 0.18
USD 3,700,000 Fannie Mae Pool '3.5 9/11' 3.5% TBA 3,765,531 1.24
USD (9,800,000) Fannie Mae Pool '4 9/11' 4% TBA ± (10,312,188) (3.39)
USD (3,600,000) Fannie Mae Pool '4.5 9/11' 4.5% TBA ± (3,802,078) (1.25)
USD 2,245 Fannie Mae Pool '420781' 6% 1/6/2013 2,442 0.00
USD 11,500,000 Fannie Mae Pool '5 9/11' 5% TBA 12,375,643 4.06
USD 11,100,000 Fannie Mae Pool '5.5 9/11' 5.5% TBA 12,100,691 3.97
USD 15,133 Fannie Mae Pool '555250' 6% 1/2/2018 16,487 0.01
USD 41,813 Fannie Mae Pool '555424' 5.5% 1/5/2033 45,918 0.02
USD 5,900,000 Fannie Mae Pool '6 9/11' 6% TBA 6,516,736 2.14
USD 367,161 Fannie Mae Pool '793181' 6% 1/7/2019 400,809 0.13
USD 676,706 Fannie Mae Pool '794412' 6% 1/9/2019 742,741 0.24
USD 412,601 Fannie Mae Pool '804967' 6% 1/1/2020 452,864 0.15
USD 47,121 Fannie Mae Pool '806549' FRN 1/1/2035 49,750 0.02
USD 14,310 Fannie Mae Pool '821570' 6% 1/5/2020 15,652 0.01
USD 11,762 Fannie Mae Pool '821758' 6% 1/6/2020 12,898 0.00
USD 19,023 Fannie Mae Pool '845490' 6% 1/6/2021 20,772 0.01
USD 370,056 Fannie Mae Pool '888596' 6.5% 1/7/2037 415,327 0.14
USD 3,320,659 Fannie Mae Pool '888649' 5.5% 1/9/2036 3,653,652 1.20
USD 1,682,357 Fannie Mae Pool '889984' 6.5% 1/10/2038 1,888,166 0.62
USD 381,107 Fannie Mae Pool 'AB1535' 4.5% 1/10/2040 407,923 0.13
USD 59,349 Fannie Mae Pool 'AB2010' 4.5% 1/1/2041 63,136 0.02
USD 1,573,351 Fannie Mae Pool 'AB2469' 4.5% 1/3/2041 1,673,733 0.55
USD 798,376 Fannie Mae Pool 'AB2638' 4.5% 1/5/2041 854,554 0.28
USD 830,466 Fannie Mae Pool 'AB2755' 4% 1/4/2026 888,156 0.29
USD 898,912 Fannie Mae Pool 'AB3395' 4.5% 1/8/2041 952,612 0.31
USD 785,921 Fannie Mae Pool 'AE0775' FRN 1/12/2040 824,260 0.27
USD 96,214 Fannie Mae Pool 'AE9722' 4.5% 1/12/2040 102,984 0.03
USD 2,249,150 Fannie Mae Pool 'AH1187' 4% 1/1/2026 2,405,392 0.79
USD 2,200,000 Fannie Mae Pool 'AH1505' 4% 1/12/2040 2,298,427 0.75
USD 496,633 Fannie Mae Pool 'AH3997' 4.5% 1/3/2041 526,302 0.17
USD 197,174 Fannie Mae Pool 'AH4038' 4.5% 1/4/2041 209,754 0.07
USD 59,371 Fannie Mae Pool 'AH4172' 4.5% 1/1/2041 63,159 0.02
USD 371,885 Fannie Mae Pool 'AH4479' 4.5% 1/2/2041 394,101 0.13
USD 394,618 Fannie Mae Pool 'AH4878' 4.5% 1/2/2041 418,192 0.14
USD 1,393,178 Fannie Mae Pool 'AH5618' 4% 1/2/2026 1,489,957 0.49
USD 269,433 Fannie Mae Pool 'AH6147' 4.5% 1/3/2041 286,623 0.09
USD 266,546 Fannie Mae Pool 'AH6216' FRN 1/3/2041 277,713 0.09
USD 2,549,301 Fannie Mae Pool 'AH6788' 4.5% 1/3/2041 2,711,951 0.89
USD 297,909 Fannie Mae Pool 'AH8669' 4.5% 1/4/2041 316,916 0.10
USD 99,443 Fannie Mae Pool 'AH8670' 4.5% 1/4/2041 105,384 0.03
USD 713,547 Fannie Mae Pool 'AH8822' 4.5% 1/3/2041 759,072 0.25
USD 371,323 Fannie Mae Pool 'AH8831' 4.5% 1/3/2041 395,014 0.13
USD 1,291,129 Fannie Mae Pool 'AH8854' 4.5% 1/4/2041 1,368,261 0.45
USD 443,136 Fannie Mae Pool 'AH9040' FRN 1/3/2041 460,886 0.15
USD 489,838 Fannie Mae Pool 'AH9870' 4.5% 1/4/2041 524,305 0.17
USD 1,089,591 Fannie Mae Pool 'AI1161' 4.5% 1/4/2041 1,159,109 0.38
USD 2,070,425 Fannie Mae Pool 'AI1191' 4.5% 1/4/2041 2,202,522 0.72
USD 117,982 Fannie Mae Pool 'AI3504' 4.5% 1/6/2041 126,284 0.04
USD 224,325 Fannie Mae Pool 'AI3506' 4.5% 1/6/2041 238,638 0.08
USD 57,612 Fannie Mae Pool 'AI4794' 5% 1/6/2041 62,386 0.02
USD 727,068 Fannie Mae Pool 'AI4812' 4.5% 1/6/2041 778,228 0.26
USD 1,014,517 Fannie Mae Pool 'AI4814' 4.5% 1/6/2041 1,079,246 0.35
USD 241,390 Fannie Mae Pool 'AI4820' 5% 1/6/2041 261,392 0.09
USD 1,800,000 Fannie Mae Pool 'AI4884' 4% 1/6/2041 1,880,531 0.62
USD 297,017 Fannie Mae Pool 'AI5526' 4% 1/6/2026 316,722 0.10
USD 199,755 Fannie Mae Pool 'AI5918' 4.5% 1/8/2041 211,689 0.07
USD 2,500,000 Fannie Mae Pool 'AI8185' 4% 1/8/2041 2,611,849 0.86
USD 500,000 Fannie Mae Pool 'AI8217' 4% 1/8/2041 522,370 0.17
USD 1,576,331 Fannie Mae Pool 'AL0298' 4% 1/5/2026 1,682,879 0.55
USD 1,950,023 Fannie Mae Pool 'AL0518' 4% 1/6/2026 2,085,485 0.68
USD 641,393 Fannie Mae Pool 'AL0519' 4% 1/3/2026 685,948 0.23
USD 4,000,000 Fannie Mae Pool 'AL0564' 4% 1/7/2041 4,165,208 1.37
USD 1,265,000 Fannie Mae Pool 'AL0583' 6.5%
1/10/2039 1,409,487 0.46
USD 5,346,438 Fannie Mae REMICS '55 SH' '2011-55 SH'
FRN 25/6/2041 871,833 0.29
USD 450,000 Federal Home Loan Bank of Chicago
5.625% 13/6/2016 512,081 0.17
USD 780,000 Federal National Mortgage Association 0%
9/10/2019 (Zero Coupon) 584,436 0.19
USD 3,295,000 Federal National Mortgage Association
5.125% 2/1/2014 3,617,520 1.19
USD 710,000 Federal National Mortgage Association
5.25% 1/8/2012 742,941 0.24
USD 530,000 FHLMC Multifamily Structured Pass Through
Certificates FRN 25/1/2021 570,794 0.19
USD 340,000 Fifth Third Capital Trust IV FRN 15/4/2037 313,650 0.10
Transferable Securities Admitted to an Official Stock Exchange Listing or Dealt in on Another Regulated Market
Holding Description Value (USD) %
Transferable Securities Admitted to an Official Stock Exchange Listing or Dealt in on Another Regulated Market
Holding Description Value (USD) %

Audited Annual Report and Accounts 205
The notes on pages 261 to 270 form an integral part of these financial statements.
US Dollar Core Bond Fund continued
Portfolio of Investments 31 August 2011
USD 435,000 First Data Corp '144A' 7.375% 15/6/2019 402,375 0.13
USD 425,000 First Data Corp '144A' 12.625% 15/1/2021 388,875 0.13
USD 73,054 First Horizon Asset Securities Inc
'2005-AR3 3A1' FRN 25/8/2035 62,196 0.02
USD 50,560 First Union National Bank Commercial
Mortgage '2001-C4 A2' 6.223%
12/12/2033 50,519 0.02
USD 30,000 Florida Power & Light Co 4.95% 1/6/2035 32,806 0.01
USD 235,000 Florida Power & Light Co 5.625% 1/4/2034 277,197 0.09
USD 300,000 Florida Power & Light Co 5.95% 1/2/2038 374,039 0.12
USD 430,000 Ford Motor Credit Co LLC 6.625%
15/8/2017 449,152 0.15
USD (3,600,000) Freddie Mac Gold Pool '4 9/11' 4% TBA ± (3,787,313) (1.24)
USD 300,000 Freddie Mac Gold Pool '4.5 9/11' 4.5% TBA 316,828 0.10
USD 1,100,000 Freddie Mac Gold Pool '5 9/11' 5% TBA 1,182,500 0.39
USD 3,500,000 Freddie Mac Gold Pool '5 9/11' 5% TBA 3,759,657 1.24
USD 157 Freddie Mac Gold Pool 'A20431' 6%
1/1/2034 175 0.00
USD 175,948 Freddie Mac Gold Pool 'A35615' 6%
1/6/2035 195,795 0.06
USD 3,690,866 Freddie Mac Gold Pool 'E02882' 4%
1/5/2026 3,925,243 1.29
USD 29,427 Freddie Mac Gold Pool 'Q01447' 5%
1/6/2041 31,801 0.01
USD 221,911 Freddie Mac Gold Pool 'Q01535' 5%
1/6/2041 239,809 0.08
USD 470,849 Freddie Mac Non Gold Pool '1B8096' FRN
1/2/2041 490,766 0.16
USD 198,884 Freddie Mac Non Gold Pool '1G1288' FRN
1/11/2036 209,606 0.07
USD 475,516 Freddie Mac Non Gold Pool '1J1095' FRN
1/5/2038 512,314 0.17
USD 44,074 Freddie Mac REMICS '2825 VP' 5.5%
15/6/2015 47,474 0.02
USD 310,805 Freddie Mac REMICS '3068 VA' 5.5%
15/10/2016 313,873 0.10
USD 1,480,000 General Electric Capital Corp 5.5%
8/1/2020 1,620,620 0.53
USD 2,600,000 Ginnie Mae I pool '4 9/11' 4% 31/12/2049 2,758,844 0.91
USD 4,800,000 Ginnie Mae I pool '4.5 9/11' 4.5% TBA 5,199,000 1.71
USD 5,100,000 Ginnie Mae I pool '5 9/11' 5% TBA 5,618,767 1.84
USD 2,300,000 Ginnie Mae I pool '5.5 9/11' 5.5% TBA 2,561,985 0.84
USD 2,200,000 Ginnie Mae I pool '6 9/11' 6% TBA 2,475,688 0.81
USD 200,000 GMAC Commercial Mortgage Securities
Inc '2006-C1 AM' FRN 10/11/2045 190,352 0.06
USD 1,238,382 GMAC Mortgage Corp Loan Trust
'2006-AR1 2A1' FRN 19/4/2036 991,543 0.33
USD 2,009,000 Goldman Sachs Group Inc/The 3.625%
7/2/2016 1,993,446 0.65
USD 910,000 Goldman Sachs Group Inc/The 3.7%
1/8/2015 908,792 0.30
USD 1,034,708 Government National Mortgage Association
'2010-121 IB' 5% 20/8/2040 200,134 0.07
USD 635,000 Greenwich Capital Commercial Funding
Corp '2007-GG9 A4' 5.444% 10/3/2039 672,582 0.22
USD 330,000 Greenwich Capital Commercial Funding
Corp '2006-GG7 AM' FRN 10/7/2038 309,372 0.10
USD 842,325 Harborview Mortgage Loan Trust
'2006-11 A1A' FRN 19/12/2036 491,761 0.16
USD 75,138 Harborview Mortgage Loan Trust
'2005-10 2A1A' FRN 19/11/2035 47,747 0.02
USD 285,000 Hartford Financial Services Group Inc 6%
15/1/2019 296,111 0.10
USD 608,000 HCA Inc 6.5% 15/2/2020 609,520 0.20
USD 515,000 HCA Inc 7.25% 15/9/2020 524,012 0.17
USD 343,000 Hospitality Properties Trust 5.625%
15/3/2017 349,002 0.11
USD 33,607 Impac Secured Assets CMN Owner Trust
'2004-3 1A4' FRN 25/11/2034 30,492 0.01
USD 770,000 International Game Technology 7.5%
15/6/2019 917,923 0.30
USD 31,000 International Paper Co 5.3% 1/4/2015 33,748 0.01
USD 160,000 Jersey Central Power & Light Co 7.35%
1/2/2019 204,707 0.07
USD 180,000 JP Morgan Chase Capital XXV 6.8%
1/10/2037 181,611 0.06
USD 1,190,000 JP Morgan Chase Commercial Mortgage
Securities Corp '2007-CB18 A4' 5.44%
12/6/2047 1,267,604 0.42
USD 955,000 JP Morgan Chase Commercial Mortgage
Securities Corp '2007-CB18 A3' 5.447%
12/6/2047 990,818 0.33
USD 260,000 JP Morgan Chase Commercial Mortgage
Securities Corp '2006-CB14 AM' FRN
12/12/2044 241,791 0.08
USD 100,883 JP Morgan Mortgage Trust '2006-S2 2A2'
5.875% 25/7/2036 96,944 0.03
USD 760,000 JPMorgan Chase & Co 3.15% 5/7/2016 771,734 0.25
USD 1,345,000 JPMorgan Chase Bank NA 6% 5/7/2017 1,488,532 0.49
USD 165,000 KeySpan Gas East Corp '144A' 5.819%
1/4/2041 190,943 0.06
USD 110,000 Kinder Morgan Energy Partners LP 6.375%
1/3/2041 117,003 0.04
USD 75,000 Kinder Morgan Energy Partners LP 6.55%
15/9/2040 81,555 0.03
USD 725,000 Kraft Foods Inc 5.375% 10/2/2020 823,480 0.27
USD 285,000 Kraft Foods Inc 6.5% 11/8/2017 344,495 0.11
USD 4,840 LB-UBS Commercial Mortgage Trust
'2003-C7 A2' FRN 15/9/2027 4,841 0.00
USD 140,000 LB-UBS Commercial Mortgage Trust
'2006-C7 AM' 5.378% 15/11/2038 126,433 0.04
USD 605,000 LB-UBS Commercial Mortgage Trust
'2007-C6 A4' FRN 15/7/2040 644,766 0.21
USD 140,000 LB-UBS Commercial Mortgage Trust
'2006-C4 AM' FRN 15/6/2038 132,856 0.04
USD 392,000 Level 3 Escrow Inc '144A' 8.125% 1/7/2019 367,500 0.12
USD 65,000 Level 3 Financing Inc 8.75% 15/2/2017 62,400 0.02
USD 65,000 Liberty Mutual Group Inc '144A' FRN
15/6/2058 80,600 0.03
USD 109,000 Life Technologies Corp 5% 15/1/2021 113,110 0.04
USD 400,000 Life Technologies Corp 6% 1/3/2020 441,934 0.15
USD 250,000 Lincoln National Corp FRN 20/4/2067 223,125 0.07
USD 320,000 Lincoln National Corp 7% 15/6/2040 337,808 0.11
USD 340,000 Mack-Cali Realty LP 7.75% 15/8/2019 426,071 0.14
USD 760,000 Macy's Retail Holdings Inc 5.9% 1/12/2016 839,942 0.28
USD 569,000 Marathon Petroleum Corp '144A' 6.5%
1/3/2041 632,227 0.21
USD 89,000 MetroPCS Wireless Inc 7.875% 1/9/2018 89,890 0.03
USD 475,000 Metropolitan Life Global Funding I '144A'
2.875% 17/9/2012 482,400 0.16
USD 560,000 Metropolitan Life Global Funding I '144A'
5.125% 10/6/2014 611,330 0.20
USD 75,000 MGM Resorts International 10.375%
15/5/2014 82,500 0.03
USD 1,160,000 Midamerican Energy Holdings Co 5.95%
15/5/2037 1,324,578 0.43
USD 1,390,000 Morgan Stanley FRN 14/5/2013 1,381,552 0.45
USD 24,414 Morgan Stanley ABS Capital I
'2005-HE1 A2MZ' FRN 25/12/2034 20,358 0.01
USD 146,365 Morgan Stanley Capital I '2007-HQ12 A2FL'
FRN 12/4/2049 136,098 0.04
USD 292,730 Morgan Stanley Capital I '2007-HQ12 A2FX'
FRN 12/4/2049 309,272 0.10
Transferable Securities Admitted to an Official Stock Exchange Listing or Dealt in on Another Regulated Market
Holding Description Value (USD) %
Transferable Securities Admitted to an Official Stock Exchange Listing or Dealt in on Another Regulated Market
Holding Description Value (USD) %

206 BlackRock Global Funds (BGF)
US Dollar Core Bond Fund continued
Portfolio of Investments 31 August 2011
USD 610,000 Morgan Stanley Capital I '1998-WF2 G' '144A'
FRN 15/7/2030 643,770 0.21
USD 560,000 Morgan Stanley Reremic Trust 'IO B'
'2009-IO B' '144A' 0% 17/7/2056
(Zero Coupon) 459,200 0.15
USD 280,119 Morgan Stanley Reremic Trust 'IO A'
'2011-IO A' '144A' 2.5% 23/3/2051 278,718 0.09
USD 1,492,663 MortgageIT Trust '2004-1 A1' FRN
25/11/2034 1,276,780 0.42
USD 150,000 Navistar International Corp 3% 15/10/2014 167,250 0.05
USD 325,000 NBCUniversal Media LLC 4.375% 1/4/2021 335,354 0.11
USD 102,532 New Century Home Equity Loan Trust
'2005-2 A2MZ' FRN 25/6/2035 96,788 0.03
USD 310,000 New York City Municipal Water Finance
Authority 5.375% 15/6/2043 341,256 0.11
USD 370,000 New York City Municipal Water Finance
Authority 5.5% 15/6/2043 410,854 0.13
USD 1,900,000 New York Times Co/The 6.625%
15/12/2016 1,909,500 0.63
USD 410,000 News America Inc 7.625% 30/11/2028 474,817 0.16
USD 205,000 Northern Rock Asset Management Plc
'144A' 5.625% 22/6/2017 222,001 0.07
USD 98,609 Option One Mortgage Loan Trust '2003-4 A2'
FRN 25/7/2033 79,081 0.03
USD 246,000 Oracle Corp '144A' 5.375% 15/7/2040 274,751 0.09
USD 95,000 Plains Exploration & Production Co 10%
1/3/2016 104,737 0.03
USD 1,330,000 PMI Group Inc/The 6% 15/9/2016 359,100 0.12
USD 165,000 Pride International Inc 6.875% 15/8/2020 198,037 0.06
USD 825,000 Prudential Financial Inc 4.75% 17/9/2015 879,360 0.29
USD 760,000 Prudential Financial Inc 5.375% 21/6/2020 816,326 0.27
USD 194,000 Qwest Communications International Inc
7.125% 1/4/2018 203,700 0.07
USD 411,000 Qwest Communications International Inc
8% 1/10/2015 437,201 0.14
USD 70,000 Qwest Corp '144A' 6.5% 1/6/2017 75,075 0.02
USD 130,000 Qwest Corp 7.625% 15/6/2015 144,625 0.05
USD 135,000 Qwest Corp 8.375% 1/5/2016 154,575 0.05
USD 336,393 RAAC Series '2005-SP2 2A' FRN
25/6/2044 229,166 0.08
USD 1,330,000 Radian Group Inc 5.375% 15/6/2015 857,850 0.28
USD 1,330,000 Radian Group Inc 5.625% 15/2/2013 * 1,037,400 0.34
USD 1,490,000 RBSCF Trust '2010-RR3 WBTA' '144A' FRN
16/2/2051 1,662,018 0.55
USD 455,000 Realogy Corp '144A' 7.875% 15/2/2019 379,925 0.12
USD 755,274 Residential Accredit Loans Inc '2006-QA9 A1'
FRN 25/11/2036 361,031 0.12
USD 43,863 Residential Asset Securities Corp
'2003-KS5 AIIB' FRN 25/7/2033 27,400 0.01
USD 773,099 Residential Funding Mortgage Securities I
'2005-S8 A1' 5.5% 25/11/2035 741,173 0.24
USD 315,000 Reynolds Group Issuer Inc / Reynolds
Group Issuer LLC / Reynolds Group
Issuer Lu '144A' 7.875% 15/8/2019 313,425 0.10
USD 740,000 Rockies Express Pipeline LLC '144A' 3.9%
15/4/2015 762,506 0.25
USD 150,000 Rockies Express Pipeline LLC '144A' 6.85%
15/7/2018 174,454 0.06
USD 520,690 Santander Consumer Acquired Receivables
Trust '2011-S1A B' '144A' 1.66%
15/8/2016 517,842 0.17
USD 378,929 Santander Consumer Acquired Receivables
Trust '2011-S1A C' '144A' 2.01%
15/8/2016 376,428 0.12
USD 460,000 Santander Consumer Acquired Receivables
Trust '2011-WO C' '144A' 3.19%
15/10/2015 463,301 0.15
USD 352,309 Santander Drive Auto Receivables Trust
'2011-S1A B' '144A' 1.48% 15/5/2017 350,134 0.11
USD 735,000 Santander Drive Auto Receivables Trust
'2010-B B' '144A' 2.1% 15/9/2014 736,580 0.24
USD 705,000 Santander Drive Auto Receivables Trust
'2010-2 B' 2.24% 15/12/2014 708,062 0.23
USD 775,000 Santander Drive Auto Receivables Trust
'2010-B C' '144A' 3.02% 17/10/2016 786,143 0.26
USD 391,560 Santander Drive Auto Receivables Trust
'2011-S1A D' '144A' 3.1% 15/5/2017 389,955 0.13
USD 695,000 Santander Drive Auto Receivables Trust
'2010-2 C' 3.89% 17/7/2017 712,592 0.23
USD 414,964 SCHOLAR FUNDING TRUST '2011-A A'
'144A' FRN 28/10/2043 413,978 0.14
USD 465,000 SLM Corp 5.4% 25/10/2011 465,017 0.15
USD 548,000 SLM Corp 6.25% 25/1/2016 550,750 0.18
USD 820,000 SLM Student Loan Trust '2008-5 A3' FRN
25/1/2018 837,295 0.27
USD 176,422 SLM Student Loan Trust '2004-B A2' FRN
15/6/2021 171,439 0.06
USD 1,610,000 SLM Student Loan Trust '2008-5 A4' FRN
25/7/2023 1,668,339 0.55
USD 614,790 Soundview Home Equity Loan Trust
'2005-OPT3 A4' FRN 25/11/2035 562,760 0.18
USD 142,000 Sprint Capital Corp 6.875% 15/11/2028 125,670 0.04
USD 50,000 State Street Capital Trust IV FRN 15/6/2037 38,133 0.01
USD 1,191,391 Structured Adjustable Rate Mortgage Loan
Trust '2007-3 3A1' FRN 25/4/2047 759,198 0.25
USD 698,714 Structured Asset Investment Loan Trust
'2003-BC6 M1' FRN 25/7/2033 542,593 0.18
USD 523,066 Structured Asset Investment Loan Trust
'2003-BC7 M1' FRN 25/7/2033 404,520 0.13
USD 35,395 Structured Asset Investment Loan Trust
'2004-8 M4' FRN 25/9/2034 15,310 0.01
USD 26,615 Structured Asset Securities Corp
'2006-BC6 A2' FRN 25/1/2037 26,076 0.01
USD 51,221 Structured Asset Securities Corp
'2007-BC1 A2' FRN 25/2/2037 49,264 0.02
USD 28,309 Structured Asset Securities Corp
'2005-GEL2 A' FRN 25/4/2035 25,099 0.01
USD 76,663 Structured Asset Securities Corp
'2004-23XS 2A1' FRN 25/1/2035 51,567 0.02
USD 40,000 SunTrust Capital VIII FRN 15/12/2036 38,923 0.01
USD 475,000 Tenet Healthcare Corp 8.875% 1/7/2019 505,875 0.17
USD 215,000 Tenet Healthcare Corp 9% 1/5/2015 230,050 0.08
USD 85,000 Tennessee Gas Pipeline Co 7%
15/10/2028 102,709 0.03
USD 1,440,000 Tennessee Valley Authority 5.25%
15/9/2039 1,720,886 0.56
USD 475,000 Time Warner Cable Inc 5.875%
15/11/2040 496,008 0.16
USD 220,000 Time Warner Inc 4.7% 15/1/2021 234,199 0.08
USD 140,000 Time Warner Inc 6.1% 15/7/2040 152,156 0.05
USD 185,000 Trans-Allegheny Interstate Line Co '144A'
4% 15/1/2015 196,025 0.06
USD 75,000 UBS Preferred Funding Trust V FRN
15/5/2016 (Perpetual) 68,250 0.02
USD 1,250,000 United States Treasury Note/Bond 0.125%
31/8/2013 1,248,340 0.41
USD 17,550,000 United States Treasury Note/Bond 1%
31/8/2016 17,611,697 5.78
Transferable Securities Admitted to an Official Stock Exchange Listing or Dealt in on Another Regulated Market
Holding Description Value (USD) %
Transferable Securities Admitted to an Official Stock Exchange Listing or Dealt in on Another Regulated Market
Holding Description Value (USD) %

* Securities lent, see Note 11, for further details. ± Securities sold short, see Note 2, for further details.
Audited Annual Report and Accounts 207
The notes on pages 261 to 270 form an integral part of these financial statements.
US Dollar Core Bond Fund continued
Portfolio of Investments 31 August 2011
USD 1,050,000 United States Treasury Note/Bond 1.5%
31/8/2018 1,049,754 0.34
USD 19,055,000 United States Treasury Note/Bond 2.125%
15/8/2021 18,976,100 6.23
USD 2,525,000 United States Treasury Note/Bond 2.25%
31/7/2018 2,654,308 0.87
USD 530,000 United States Treasury Note/Bond 2.5%
30/4/2015 568,591 0.19
USD 1,055,000 United States Treasury Note/Bond 3.125%
15/5/2021 1,147,024 0.38
USD 550,000 United States Treasury Note/Bond 3.75%
15/8/2041 572,344 0.19
USD 12,285,000 United States Treasury Note/Bond 4.375%
15/5/2041 14,240,043 4.67
USD 2,411,000 United States Treasury Note/Bond 4.75%
15/2/2041 2,965,247 0.97
USD 180,000 Valero Energy Corp 6.125% 1/2/2020 201,475 0.07
USD 43,000 Valero Energy Corp 6.625% 15/6/2037 45,758 0.01
USD 185,000 Ventas Realty LP / Ventas Capital Corp
4.75% 1/6/2021 179,345 0.06
USD 154,000 Verizon Communications Inc 6.4%
15/2/2038 179,258 0.06
USD 1,150,000 Verizon Communications Inc 8.75%
1/11/2018 1,559,906 0.51
USD 1,500,000 Wachovia Bank Commercial Mortgage
Trust '2007-C33 A4' FRN 15/2/2051 1,593,092 0.52
USD 970,000 Wachovia Bank Commercial Mortgage
Trust '2006-C28 A4' 5.572%
15/10/2048 1,024,379 0.34
USD 40,000 Wachovia Capital Trust III FRN 3/10/2011
(Perpetual) 35,150 0.01
USD 233,000 Wal-Mart Stores Inc 4.875% 8/7/2040 238,790 0.08
USD 400,985 WaMu Mortgage Pass Through Certificates
'2007-OA4 1A' FRN 25/5/2047 262,108 0.09
USD 604,006 WaMu Mortgage Pass Through Certificates
'2003-S7 A1' 4.5% 25/8/2018 621,700 0.20
USD 200,000 WEA Finance LLC '144A' 4.625% 10/5/2021 195,853 0.06
USD 983,318 Wells Fargo Mortgage Backed Securities
Trust '2006-AR10 3A1' FRN 25/7/2036 870,376 0.29
USD 485,000 Western Gas Partners LP 5.375% 1/6/2021 512,465 0.17
USD 780,000 Williams Partners LP 4.125% 15/11/2020 784,324 0.26
USD 120,000 Xcel Energy Inc 6.5% 1/7/2036 148,070 0.05
USD 114,000 Yum! Brands Inc 5.3% 15/9/2019 127,827 0.04
USD 172,000 Yum! Brands Inc 6.25% 15/4/2016 202,301 0.07
280,246,108 91.99
Venezuela USD 275,000 Venezuela Government International
Bond 7.65% 21/4/2025 166,265 0.06
Total Bonds 318,099,648 104.41
Total Transferable Securities Admitted
to an Official Stock Exchange Listing or
Dealt in on Another Regulated Market 318,099,648 104.41
Unquoted Securities
BONDS
United States USD 409,441 Countrywide Home Loan Mortgage
Pass Through Trust '2006-OA5 2A1'
FRN 25/4/2046 222,510 0.07
USD 1,523,982 JP Morgan Mortgage Trust '2007-S1 1A2'
5.5% 25/3/2022 1,478,903 0.49
USD 622,430 Lehman XS Trust '2005-5N 3A2' FRN
25/11/2035 224,598 0.07
USD 880,000 Novus USA Trust 2010-1 '144A' FRN
18/11/2011 869,658 0.29
2,795,669 0.92
Total Bonds 2,795,669 0.92
Total Unquoted Securities 2,795,669 0.92
Total Portfolio 320,895,317 105.33
Other Net Liabilities (16,237,955) (5.33)
Total Net Assets (USD) 304,657,362 100.00
Transferable Securities Admitted to an Official Stock Exchange Listing or Dealt in on Another Regulated Market
Holding Description Value (USD) %
Transferable Securities Admitted to an Official Stock Exchange Listing or Dealt in on Another Regulated Market
Holding Description Value (USD) %

208 BlackRock Global Funds (BGF)
US Dollar Core Bond Fund continued
Note: The total market value of USD 608,697 of these transactions is included in the Statement of Net Assets (see Note 2c).
Nominal Value Description
Unrealisedprofit/(loss)
USD
Nominal Value Description
Unrealisedprofit/(loss)
USD
Swaps as at 31 August 2011
USD (770,000) Credit Default Swaps (Deutsche Bank) (Fund provides
default protection on Aviva Plc; and receives Fixed 1%)
(25/5/2012) 5,953
USD 5,700,000 Interest Rate Swaps (Deutsche Bank) (Fund receives
Floating USD LIBOR 3 Month; and pays Fixed 0.915%)
(28/2/2013) (39,454)
USD 1,330,000 Credit Default Swaps (Citibank) (Fund receives default
protection on Radian Group Inc 5.375% 15/6/2015;
and pays Fixed 5%) (20/3/2013) 257,281
USD 2,200,000 Interest Rate Swaps (Barclays) (Fund receives Floating
USD LIBOR 3 Month; and pays Fixed 0.6475%)
(22/7/2013) (7,706)
USD 18,100,000 Interest Rate Swaps (BNP Paribas) (Fund receives Floating
USD LIBOR 3 Month; and pays Fixed 0.4475%)
(18/8/2013) 5,943
USD 2,900,000 Interest Rate Swaps (Citibank) (Fund receives Floating
USD LIBOR 3 Month; and pays Fixed 1.32%)
(17/12/2013) (54,123)
USD 4,300,000 Interest Rate Swaps (Deutsche Bank) (Fund receives
Floating USD LIBOR 3 Month; and pays Fixed 1.41%)
(20/12/2013) (89,283)
USD 4,300,000 Interest Rate Swaps (Deutsche Bank) (Fund receives
Floating USD LIBOR 3 Month; and pays Fixed 1.255%)
(24/12/2013) (74,210)
USD 1,300,000 Interest Rate Swaps (Citibank) (Fund receives Fixed 0.8%;
and pays Floating USD LIBOR 3 Month) (9/8/2014) 6,728
USD 1,330,000 Credit Default Swaps (Citibank) (Fund receives default
protection on Radian Group Inc 5.375% 15/6/2015;
and pays Fixed 5%) (20/6/2015) 360,304
USD 970,000 Credit Default Swaps (Morgan Stanley) (Fund receives
default protection on CDX.EM 14; and pays Fixed 5%)
(20/12/2015) 16,354
USD 878,000 Credit Default Swaps (JP Morgan) (Fund receives default
protection on Spain (Kingdom of) 5.5% 30/7/2017;
and pays Fixed 1%) (20/3/2016) 35,991
USD 351,000 Credit Default Swaps (Citibank) (Fund receives default
protection on Spain (Kingdom of) 5.5% 30/7/2017;
and pays Fixed 1%) (20/3/2016) 13,684
USD 1,300,000 Interest Rate Swaps (Deutsche Bank) (Fund receives
Fixed 2.095%; and pays Floating USD LIBOR 3 Month)
(10/5/2016) 57,536
USD 1,530,000 Credit Default Swaps (Deutsche Bank) (Fund receives
default protection on CDX.NA.HY.16-V1; and pays
Fixed 5%) (20/6/2016) (44,886)
USD 630,000 Credit Default Swaps (JP Morgan) (Fund receives default
protection on CDX.NA.HY.16-V1; and pays Fixed 1%)
(20/6/2016)) (360)
USD 8,800,000 Credit Default Swaps (JP Morgan) (Fund receives default
protection on CDX.NA.HY.16-V1; and pays Fixed 1%)
(20/6/2016) (44,097)
USD 630,000 Credit Default Swaps (Credit Suisse) (Fund receives
default protection on CDX.NA.HY.16-V1; and pays
Fixed 1%) (20/6/2016) (1,798)
USD 1,260,000 Credit Default Swaps (Morgan Stanley) (Fund receives
default protection on CDX.NA.HY.16-V1; and pays
Fixed 1%) (20/6/2016) (4,132)
USD 1,080,000 Credit Default Swaps (Morgan Stanley) (Fund receives
default protection on CDX.NA.HY.16-V1; and pays
Fixed 5%) (20/6/2016) (6,836)
USD 1,330,000 Credit Default Swaps (Citibank) (Fund receives default
protection on PMI Group Inc/The 6% 15/9/2016;
and pays Fixed 5%) (20/9/2016) 805,779
USD (175,000) Credit Default Swaps (Credit Suisse) (Fund provides
default protection on Lincoln National Corporation
6.2% 15/12/2011; and receives Fixed 1%)
(20/9/2016) 1,917
USD 1,400,000 Credit Default Swaps (JP Morgan) (Fund receives default
protection on News America Inc 7.25% 18/5/2018;
and pays Fixed 1%) (20/9/2016) (6,082)
USD (70,000) Credit Default Swaps (Morgan Stanley) (Fund provides
default protection on Lincoln National Corporation
6.2% 15/12/2011; and receives Fixed 1%) (20/9/2016) 713
USD (380,000) Credit Default Swaps (Morgan Stanley) (Fund provides
default protection on Metlife Inc 5% 15/6/2015; and
receives Fixed 1%) (20/9/2016) 2,665
USD (110,000) Credit Default Swaps (Morgan Stanley) (Fund provides
default protection on Prudential Financial Inc 4.5%
15/7/2013; and receives Fixed 1%) (20/9/2016) 839
USD (300,000) Credit Default Swaps (Deutsche Bank) (Fund provides
default protection on Metlife Inc 5% 15/6/2015; and
receives Fixed 1%) (20/9/2016) 2,597
USD 1,900,000 Credit Default Swaps (Barclays) (Fund receives default
protection on New York Times Co/The 5% 15/3/2015;
and pays Fixed 1%) (20/12/2016) 53,695
USD 5,600,000 Interest Rate Swaps (Morgan Stanley) (Fund receives
Floating USD LIBOR 3 Month; and pays Fixed
3.54125%) (18/5/2020) (635,884)
USD (1,230,000) Credit Default Swaps (Goldman Sachs) (Fund provides
default protection on MCDX.NA.14; and receives
Fixed 0%) (20/6/2020) 56,479
USD 1,100,000 Interest Rate Swaps (Morgan Stanley) (Fund receives
Floating USD LIBOR 3 Month; and pays Fixed 3.3%)
(6/5/2021) (97,979)
USD 540,000 Interest Rate Swaps (Deutsche Bank) (Fund receives
Floating USD LIBOR 3 Month; and pays Fixed 3.267%)
(16/5/2021) (46,431)
USD 2,460,000 Credit Default Swaps (Morgan Stanley) (Fund receives
default protection on MCDX.NA.16-V1; and pays Fixed
1%) (20/6/2021) 75,384
USD 900,000 Interest Rate Swaps (Union Bank of Switzerland) (Fund
receives Floating USD LIBOR 3 Month; and pays Fixed
3.24625%) (5/7/2021) (74,989)
USD 1,100,000 Interest Rate Swaps (Citibank) (Fund receives Floating
USD LIBOR 3 Month; and pays Fixed 2.69%)
(9/8/2021) (35,254)
USD 942,603 Total Return Swap (Bank of America) (Fund receives
Interest Only Component 2008 FN 30 Year Fixed Rate
5.00% + 0bps; and pays USD LIBOR 1 Month BBA)
(12/1/2039) 2,343
USD 2,085,248 Total Return Swap (Royal Bank of Scotland) (Fund
receives USD LIBOR 1 Month BBA; and pays Interest
Only Component 2008 FN 30 Year Fixed Rate 6.00%
+ 0bps) (12/1/2039) –
USD 551,240 Total Return Swap (Bank of America) (Fund receives
USD LIBOR 1 Month BBA; and pays Interest Only
Component 2009 FN 30 Year Fixed Rate 4.50%
+ 0bps) (12/1/2040) 4,799
USD 945,013 Total Return Swap (Bank of America) (Fund receives
USD LIBOR 1 Month BBA; and pays Interest Only
Component 2009 FN 30 Year Fixed Rate 5.00%
+ 0bps) (12/1/2040) 7,843
USD 787,485 Total Return Swap (JP Morgan Chase) (Fund receives
USD LIBOR 1 Month BBA; and pays Interest Only
Component 2009 FN 30 Year Fixed Rate 4.50%
+ 0bps) (12/1/2040) 6,854
USD 1,417,473 Total Return Swap (Citibank) (Fund receives Interest Only
Component 2009 FN 30 Year Fixed Rate 4.50%
+ 0bps; and pays USD LIBOR 1 Month BBA)
(12/1/2040) (11,397)
USD 787,485 Total Return Swap (Bank of America) (Fund receives
USD LIBOR 1 Month BBA; and pays Interest Only
Component 2009 FN 30 Year Fixed Rate 4.50%
+ 0bps) (12/1/2040) 6,855
USD 236,246 Total Return Swap (Barclays) (Fund receives Interest Only
Component 2009 FN 30 Year Fixed Rate 4.50%
+ 0bps; and pays USD LIBOR 1 Month BBA)
(12/1/2040) (2,027)
USD 472,491 Total Return Swap (Barclays) (Fund receives Interest Only
Component 2009 FN 30 Year Fixed Rate 4.50%
+ 0bps; and pays USD LIBOR 1 Month BBA)
(12/1/2040) (4,054)
507,554

Audited Annual Report and Accounts 209
The notes on pages 261 to 270 form an integral part of these financial statements.
US Dollar Core Bond Fund continued
Open Forward Foreign Exchange Transactionsas at 31 August 2011
Purchases Sales
Unrealisedprofit/(loss)
USDValue date
Core Fund
JPY 149,869,840 USD 1,880,000 27/9/2011 74,867
USD 1,736,017 JPY 139,870,850 27/9/2011 (88,426)
SEK 3,476,664 USD 525,000 28/9/2011 23,026
USD 525,000 SEK 3,348,596 28/9/2011 (2,839)
GBP 45,000 USD 73,160 7/10/2011 239
USD 132,977 EUR 92,000 26/10/2011 199
Net unrealised profit 7,066
Note: The net unrealised profit attributed to these transactions is included in the Statement
of Net Assets (see Note 2c).
Purchased Call Options as at 31 August 2011
Number of contracts
subjectto Call Issuer
Unrealisedprofit/(loss)
USD ValueUSD
2,150,000 OTC USD/SEK Call Option
strike price USD 7
expiring on 26/9/2011 (23,113) 1,720
3,245,000 OTC USD/EUR Call Option
strike price USD 1.307
expiring on 18/10/2011 (12,701) 13,973
2,435,000 OTC USD/GBP Call Option
strike price USD 1.54
expiring on 18/10/2011 (1,985) 12,650
1,620,000 OTC USD/AUD Call Option
strike price USD 0.92
expiring on 18/10/2011 (10,219) 6,856
810,000 OTC USD/CAD Call Option
strike price USD 1.07
expiring on 18/10/2011 (2,328) 2,249
400,000 OTC USD/CAD Call Option
strike price USD 1.0725
expiring on 10/11/2011 (1,894) 876
145,000,000 DXY Call Option
strike price USD 82
expiring on 11/11/2011 (5,024) 2,089
5,110,000 OTC USD/GBP Call Option
strike price USD 1.54
expiring on 18/11/2011 (2,786) 26,546
1,625,000 OTC USD/EUR Call Option
strike price USD 1.307
expiring on 18/11/2011 (3,890) 6,997
1,220,000 OTC USD/GBP Call Option
strike price USD 1.54
expiring on 18/11/2011 299 6,338
810,000 OTC USD/AUD Call Option
strike price USD 0.92
expiring on 18/11/2011 (3,518) 3,428
405,000 OTC USD/CAD Call Option
strike price USD 1.07
expiring on 18/11/2011 (739) 1,124
Total Purchased Call Options (67,898) 84,846
Note: Purchased Call Options are included in the Statement of Net Assets (see Note 2c).
Purchased Put Options as at 31 August 2011
Number of contracts
subjectto Put Issuer
Unrealisedprofit/(loss)
USD ValueUSD
2,150,000 OTC USD/SEK Put Option
strike price USD 6.3686
expiring on 15/9/2011 198 29,373
450,000 OTC EUR/GBP Put Option
strike price EUR 0.84
expiring on 13/10/2011 (1,949) 945
300,000 OTC AUD/USD Put Option
strike price AUD 0.9
expiring on 11/11/2011 (2,363) 699
9,740,000 OTC EUR/USD Put Option
strike price EUR 1.41
expiring on 16/11/2011 (66,878) 213,439
381 Euro/$ 1Year MIDCV Put Option
strike price USD 99.25
expiring on 16/3/2012 (22,479) 78,581
Total Purchased Put Options (93,471) 323,037
Note: Purchased Put Options are included in the Statement of Net Assets (see Note 2c).
Written Put Options as at 31 August 2011
Number of contracts
subjectto Put Issuer
Unrealisedprofit/(loss)
USD ValueUSD
(2,150,000) OTC USD/SEK Put Option
strike price USD 6.3686
expiring on 15/9/2011 (509) (29,374)
(9,740,000) OTC EUR/USD Put Option
strike price EUR 1.36
expiring on 16/11/2011 39,445 (108,421)
Total Written Put Options 38,936 (137,795)
Note: Written Put Options are included in the Statement of Net Assets (see Note 2c).

210 BlackRock Global Funds (BGF)
US Dollar Core Bond Fund continued
Swaptions as at 31 August 2011
Nominal
Value Description
UnrealisedlossUSD
ValueUSD
USD 6,200,000 Fund purchases a put option (expiring
13/10/2011) to enter into an Interest Rate
Swap (BNP Paribas SA). If exercised Fund
receives Floating US$ Libor 3-month-BBA
quarterly from 17/1/2012; and pays 2.3%
Fixed semi-annually from 17/4/2012;
13/10/2011) (36,470) 198
USD 4,100,000 Fund purchases a put option (expiring
24/10/2011) to enter into an Interest
Rate Swap (Credit Suisse International). If
exercised Fund receives Floating US$ Libor
3-month-BBA quarterly from 26/1/2012;
and pays 3.75% Fixed semi-annually from
26/4/2012; 24/10/2011) (27,555) 1,062
USD 3,500,000 Fund purchases a put option (expiring
26/1/2012) to enter into an Interest Rate
Swap (Deutsche Bank). If exercised Fund
receives Floating US$ Libor 3-month-BBA
quarterly from 30/4/2012; and pays 2.5%
Fixed semi-annually from 30/7/2012;
26/1/2012) (22,666) 84
(86,691) 1,344
Note: Swaptions are included in the Statement of Net Assets (see Note 2c).
Open Futures Contractsas at 31 August 2011
Numberof contracts Contract/Description
Expirationdate
ValueUSD
4 Euro Bund September 2011 780,652
2 Dollar Index September 2011 September 2011 148,070
(2) US Long Bond (CBT) September 2011 (276,875)
(4) US Treasury 10 Year Note September 2011 (521,813)
250 US Treasury 2 Year Note (CBT) December 2011 55,132,813
120 US Treasury 5 Year Note (CBT) December 2011 14,727,187
89 US Long Bond (CBT) December 2011 12,209,688
(50) US Ultra Bond (CBT) December 2011 (7,234,375)
(90) 90 Day Euro $ Future December 2011 (22,393,125)
(156) US Treasury 10 Year Note December 2011 (20,199,563)
20 90 Day Euro $ Future March 2012 4,976,250
30 90 Day Euro $ Future June 2012 7,465,500
37 90 Day Euro $ Future September 2012 9,206,988
12 90 Day Euro $ Future December 2012 2,985,150
6 90 Day Euro $ Future March 2013 1,492,275
11 90 Day Euro $ Future June 2013 2,733,913
20 90 Day Euro $ Future September 2013 4,965,000
13 90 Day Euro $ Future December 2013 3,221,562
(1) 90 Day Euro $ Future March 2014 (247,350)
(2) 90 Day Euro $ Future June 2014 (493,650)
Total commitment 68,678,297
Note: The net unrealised gain of USD 194,835 attributed to these transactions is included
in the Statement of Net Assets (see Note 2c).

Audited Annual Report and Accounts 211
The notes on pages 261 to 270 form an integral part of these financial statements.
COMMON / PREFERRED STOCKS (SHARES)
Canada 25,114 Ainsworth Lumber Co Ltd 50,839 0.00
United States 144,560 Dana Holding Corp (Pref) 16,281,070 0.71
110,000 Federal National Mortgage Association
(Pref) 341,000 0.02
231,720 General Motors Co Series B (Pref) 9,134,402 0.40
548,230 GMAC Capital Trust I (Pref) 11,042,175 0.48
34,239 MPG Office Trust Inc Series A (Pref) 531,047 0.02
37,329,694 1.63
Total Common / Preferred Stocks (Shares) 37,380,533 1.63
BONDS
Australia USD 1,615,000 Boart Longyear Management Pty Ltd
'144A' 7% 1/4/2021 1,606,925 0.07
USD 9,240,000 FMG Resources August 2006 Pty Ltd
'144A' 7% 1/11/2015 9,309,300 0.41
10,916,225 0.48
Austria USD 1,270,000 Sappi Papier Holding GmbH '144A'
6.625% 15/4/2021 1,123,950 0.05
Belgium EUR 564,000 Ideal Standard International SPRL 11.75%
1/5/2018 631,240 0.03
EUR 1,330,000 Ontex IV SA 7.5% 15/4/2018 1,706,247 0.07
2,337,487 0.10
Bermuda USD 6,200,000 Digicel Group Ltd '144A' 8.875%
15/1/2015 6,169,000 0.27
USD 11,223,000 Digicel Group Ltd '144A' 9.125%
15/1/2015 11,223,000 0.49
USD 1,900,000 Digicel Group Ltd '144A' 10.5%
15/4/2018 2,052,000 0.09
USD 4,380,000 Digicel Ltd '144A' 8.25% 1/9/2017 4,393,140 0.19
23,837,140 1.04
Brazil USD 34,390,000 OGX Petroleo e Gas Participacoes SA
'144A' 8.5% 1/6/2018 34,604,938 1.51
Canada USD 242,029 Ainsworth Lumber Co Ltd '144A' 11%
29/7/2015 180,917 0.01
USD 7,190,000 Air Canada '144A' 9.25% 1/8/2015 6,938,350 0.30
USD 1,815,000 Cascades Inc 7.75% 15/12/2017 1,751,475 0.08
USD 3,185,000 Connacher Oil and Gas Ltd '144A' 8.5%
1/8/2019 2,587,813 0.11
USD 3,100,000 Goldcorp Inc '144A' 2% 1/8/2014 4,111,375 0.18
USD 8,680,000 MEG Energy Corp '144A' 6.5% 15/3/2021 8,625,750 0.38
USD 2,400,000 MPL 2 Acquisition Canco Inc '144A'
9.875% 15/8/2018 2,304,000 0.10
USD 860,000 Nova Chemicals Corp 8.375% 1/11/2016 927,725 0.04
USD 2,710,000 Nova Chemicals Corp 8.625% 1/11/2019 2,974,225 0.13
USD 30,600,000 Novelis Inc/GA 8.75% 15/12/2020 31,900,500 1.39
USD 2,815,000 Precision Drilling Corp '144A' 6.5%
15/12/2021 2,822,037 0.12
USD 2,905,000 Taseko Mines Ltd 7.75% 15/4/2019 2,767,012 0.12
67,891,179 2.96
Cayman Islands EUR 5,909,000 UPCB Finance II Ltd 6.375% 1/7/2020 7,580,614 0.33
Czech Republic EUR 1,059,000 CET 21 spol sro 9% 1/11/2017 1,476,910 0.06
France USD 1,240,000 Cie Generale de Geophysique - Veritas
'144A' 6.5% 1/6/2021 1,178,000 0.05
USD 2,125,000 Cie Generale de Geophysique - Veritas
7.75% 15/5/2017 2,140,937 0.09
USD 1,515,000 Cie Generale de Geophysique - Veritas
9.5% 15/5/2016 1,590,750 0.07
EUR 935,000 Crown European Holdings SA 7.125%
15/8/2018 1,292,897 0.06
EUR 2,100,000 Rexel SA 7% 17/12/2018 2,842,603 0.12
9,045,187 0.39
Germany EUR 532,000 ALBA Group Plc & Co KG 8% 15/5/2018 737,562 0.03
EUR 1,400,000 IVG Immobilien AG FRN 5/5/2013
(Perpetual) 1,455,708 0.06
EUR 5,286,000 Kabel BW Erste Beteiligungs GmbH /
Kabel Baden-Wurttemberg GmbH & Co
KG 7.5%
15/3/2019 7,519,293 0.33
EUR 3,315,000 Kabel Deutschland Vertrieb und Service
GmbH & Co KG 6.5% 29/6/2018 4,667,448 0.20
EUR 5,517,000 Kinove German Bondco GmbH 10%
15/6/2018 7,471,548 0.33
EUR 2,607,000 Musketeer GmbH 9.5% 15/3/2021 3,746,086 0.16
EUR 8,599,000 UPC Germany GmbH 8.125% 1/12/2017 12,555,195 0.55
USD 6,070,000 UPC Germany GmbH '144A' 8.125%
1/12/2017 6,183,812 0.27
EUR 1,710,000 UPC Germany GmbH 9.625% 1/12/2019 2,484,667 0.11
46,821,319 2.04
Indonesia USD 4,470,000 Republic of Indonesia '144A' 4.875%
5/5/2021 4,715,850 0.21
Ireland EUR 3,005,000 Ardagh Packaging Finance Plc 7.375%
15/10/2017 4,035,928 0.18
USD 504,560 AWAS Aviation Capital Ltd '144A' 7%
15/10/2016 488,162 0.02
EUR 1,568,000 Smurfit Kappa Acquisitions 7.25%
15/11/2017 2,159,228 0.09
EUR 2,161,000 Smurfit Kappa Acquisitions 7.75%
15/11/2019 2,972,235 0.13
9,655,553 0.42
Japan EUR 11,000,000 Tokyo Electric Power Co Inc/The 4.5%
24/3/2014 13,701,415 0.60
Luxembourg USD 3,496,000 Aguila 3 SA '144A' 7.875% 31/1/2018 3,294,980 0.14
EUR 1,492,000 Beverage Packaging Holdings Luxembourg
II SA 8% 15/12/2016 1,706,236 0.07
USD 2,940,000 Calcipar SA '144A' 6.875% 1/5/2018 2,800,350 0.12
EUR 403,000 Cirsa Funding Luxembourg SA 8.75%
15/5/2018 513,677 0.02
USD 1,660,000 ConvaTec Healthcare E SA '144A' 10.5%
15/12/2018 1,518,900 0.07
EUR 2,515,000 GCL Holdings SCA 9.375% 15/4/2018 3,196,202 0.14
US Dollar High Yield Bond Fund
Portfolio of Investments 31 August 2011
Transferable Securities Admitted to an Official Stock Exchange Listing or Dealt in on Another Regulated Market
Holding Description Value (USD) %
Transferable Securities Admitted to an Official Stock Exchange Listing or Dealt in on Another Regulated Market
Holding Description Value (USD) %

212 BlackRock Global Funds (BGF)
USD 1,350,000 Intelsat Jackson Holdings SA '144A' 7.5%
1/4/2021 1,275,750 0.06
USD 7,560,000 Intelsat Jackson Holdings SA 11.25%
15/6/2016 7,862,400 0.34
USD 3,530,000 Intelsat Luxembourg SA 11.25% 4/2/2017 3,362,325 0.15
USD 9,030,000 Intelsat Luxembourg SA '144A' 11.5%
4/2/2017 8,533,350 0.37
USD 1,220,000 Intelsat Luxembourg SA 11.5% 4/2/2017 1,152,900 0.05
EUR 2,776,000 KION Finance SA 7.875% 15/4/2018 3,370,083 0.15
USD 610,000 OXEA Finance & Cy SCA '144A' 9.5%
15/7/2017 605,425 0.03
EUR 1,667,250 OXEA Finance & Cy SCA 9.625%
15/7/2017 2,347,572 0.10
EUR 1,293,000 Sunrise Communications Holdings SA
8.5% 31/12/2018 1,797,268 0.08
EUR 2,384,000 Xefin Lux SCA 8% 1/6/2018 3,124,399 0.14
46,461,817 2.03
Marshall Islands USD 1,550,000 Teekay Corp 8.5% 15/1/2020 1,511,250 0.07
Netherlands EUR 1,785,000 Elster Finance BV 6.25% 15/4/2018 2,384,479 0.10
EUR 7,200,000 GMAC International Finance BV 7.5%
21/4/2015 9,960,367 0.44
EUR 5,150,000 Hertz Holdings Netherlands BV 8.5%
31/7/2015 7,322,748 0.32
EUR 4,000,000 ING Verzekeringen NV FRN 7/5/2027 4,472,055 0.20
EUR 4,112,000 New World Resources NV 7.875%
1/5/2018 5,694,445 0.25
EUR 554,000 OI European Group BV 6.875% 31/3/2017 772,619 0.03
EUR 2,850,000 Trafigura Beheer BV 6.375% 8/4/2015 3,786,984 0.17
USD 750,000 UPC Holding BV '144A' 9.875% 15/4/2018 784,688 0.03
EUR 178,000 Ziggo Bond Co BV 8% 15/5/2018 254,810 0.01
EUR 6,375,000 Ziggo Finance BV 6.125% 15/11/2017 9,002,376 0.39
44,435,571 1.94
Spain USD 2,620,000 International Automotive Components
Group SL '144A' 9.125% 1/6/2018 2,580,700 0.11
United Kingdom EUR 1,102,000 Boparan Finance Plc 9.75% 30/4/2018 1,257,252 0.06
GBP 1,779,000 Enterprise Inns Plc 6.5% 6/12/2018 2,227,977 0.10
EUR 420,000 FCE Bank Plc 4.75% 19/1/2015 553,973 0.02
EUR 8,600,000 FCE Bank Plc 9.375% 17/1/2014 12,916,517 0.56
GBP 2,658,000 House of Fraser Funding Plc 8.875%
15/8/2018 3,803,977 0.17
GBP 2,070,000 Infinis Plc 9.125% 15/12/2014 3,493,815 0.15
USD 1,610,000 Inmarsat Finance Plc '144A' 7.375%
1/12/2017 1,662,325 0.07
GBP 1,996,000 Odeon & UCI Finco Plc 9% 1/8/2018 2,971,564 0.13
GBP 3,610,000 Phones4u Finance Plc 9.5% 1/4/2018 4,452,629 0.19
GBP 2,099,000 Priory Group No 3 Plc '144A' 7%
15/2/2018 3,099,582 0.14
GBP 1,139,000 Priory Group No 3 Plc 7% 15/2/2018 1,712,211 0.07
GBP 490,000 Punch Taverns Finance Plc 7.274%
15/4/2022 742,130 0.03
GBP 3,185,000 Unique Pub Finance Co Plc/The 5.659%
30/6/2027 3,553,991 0.16
GBP 4,455,000 Virgin Media Secured Finance Plc 7%
15/1/2018 7,588,757 0.33
50,036,700 2.18
United States USD 1,000,000 ACCO Brands Corp 10.625% 15/3/2015 1,092,500 0.05
USD 4,745,000 AES Corp/The '144A' 7.375% 1/7/2021 4,715,344 0.21
USD 1,730,000 AES Corp/The 7.75% 15/10/2015 1,812,175 0.08
USD 3,100,000 AES Corp/The 8% 15/10/2017 3,224,000 0.14
USD 7,454,000 AES Corp/The 9.75% 15/4/2016 8,199,400 0.36
USD 8,190,000 Affinion Group Inc 7.875% 15/12/2018 7,248,150 0.32
USD 4,940,000 Allison Transmission Inc '144A' 11%
1/11/2015 5,174,650 0.23
USD 2,560,000 Ally Financial Inc 7.5% 15/9/2020 2,467,200 0.11
USD 1,160,000 Ally Financial Inc 8% 15/3/2020 1,151,300 0.05
USD 21,525,000 Ally Financial Inc 8% 1/11/2031 20,766,618 0.91
USD 2,735,000 Alpha Natural Resources Inc 6% 1/6/2019 2,666,625 0.12
USD 15,810,000 Alpha Natural Resources Inc 6.25%
1/6/2021 15,533,325 0.68
USD 1,845,000 AMC Entertainment Inc 9.75% 1/12/2020 1,780,425 0.08
USD 1,830,000 AMC Networks Inc '144A' 7.75%
15/7/2021 1,889,475 0.08
USD 1,090,000 American Airlines Inc '144A' 7.5%
15/3/2016 975,550 0.04
USD 1,310,000 American Airlines Inc 10.5% 15/10/2012 1,350,938 0.06
USD 4,065,000 American Capital Ltd (Step-up coupon)
7.96% 31/12/2013 4,039,362 0.18
USD 4,205,000 American General Institutional Capital A
'144A' 7.57% 1/12/2045 4,141,925 0.18
USD 810,000 American Pacific Corp 9% 1/2/2015 799,875 0.03
USD 1,252,000 American Rock Salt Co LLC/American Rock
Capital Corp '144A' 8.25% 1/5/2018 1,164,360 0.05
USD 3,800,000 American Standard Americas '144A'
10.75% 15/1/2016 3,097,000 0.13
USD 1,575,000 Antero Resources Finance Corp '144A'
7.25% 1/8/2019 1,535,625 0.07
USD 3,205,000 Aptalis Pharma Inc 12.75% 1/3/2016 3,349,225 0.15
USD 4,000,000 ARAMARK Corp 8.5% 1/2/2015 4,110,000 0.18
USD 3,681,000 Arch Coal Inc 7.25% 1/10/2020 3,662,595 0.16
USD 4,020,000 Arch Coal Inc '144A' 7.25% 15/6/2021 3,989,850 0.17
USD 1,280,000 Arch Coal Inc 8.75% 1/8/2016 1,385,600 0.06
USD 2,079,000 Asbury Automotive Group Inc 7.625%
15/3/2017 2,063,407 0.09
USD 6,230,000 Asbury Automotive Group Inc 8.375%
15/11/2020 6,152,125 0.27
USD 560,000 AutoNation Inc 6.75% 15/4/2018 582,400 0.03
USD 4,050,000 Avaya Inc '144A' 7% 1/4/2019 3,604,500 0.16
USD 2,700,000 Avaya Inc 9.75% 1/11/2015 2,298,375 0.10
USD 5,820,000 Avaya Inc 10.125% 1/11/2015 5,034,300 0.22
USD 4,200,000 Aviation Capital Group Corp '144A' 6.75%
6/4/2021 4,157,425 0.18
USD 2,225,000 Avis Budget Car Rental LLC / Avis Budget
Finance Inc 7.75% 15/5/2016 2,197,187 0.10
USD 7,845,000 Avis Budget Car Rental LLC / Avis Budget
Finance Inc 8.25% 15/1/2019 7,570,425 0.33
USD 2,760,000 Avis Budget Car Rental LLC / Avis Budget
Finance Inc 9.625% 15/3/2018 2,822,100 0.12
USD 2,950,000 Aviv Healthcare Properties LP/Aviv
Healthcare Capital Corp 7.75%
15/2/2019 2,950,000 0.13
USD 190,000 Ball Corp 6.625% 15/3/2018 194,275 0.01
USD 2,485,000 Ball Corp 7.375% 1/9/2019 2,683,800 0.12
USD 2,605,000 B-Corp Merger Sub Inc '144A' 8.25%
1/6/2019 2,422,650 0.11
USD 1,310,000 Beazer Homes USA Inc 8.125% 15/6/2016 923,550 0.04
USD 2,630,000 Beazer Homes USA Inc 9.125% 15/6/2018 1,821,275 0.08
USD 4,230,000 Beazer Homes USA Inc 9.125% 15/5/2019 2,844,675 0.12
USD 4,600,000 Beazer Homes USA Inc 12% 15/10/2017 4,669,000 0.20
US Dollar High Yield Bond Fund continued
Portfolio of Investments 31 August 2011
Transferable Securities Admitted to an Official Stock Exchange Listing or Dealt in on Another Regulated Market
Holding Description Value (USD) %
Transferable Securities Admitted to an Official Stock Exchange Listing or Dealt in on Another Regulated Market
Holding Description Value (USD) %

Audited Annual Report and Accounts 213
The notes on pages 261 to 270 form an integral part of these financial statements.
USD 275,000 Berry Petroleum Co 8.25% 1/11/2016 284,625 0.01
USD 5,770,000 Berry Plastics Corp 8.25% 15/11/2015 5,971,950 0.26
USD 498,000 Bill Barrett Corp 9.875% 15/7/2016 549,045 0.02
USD 505,000 Boise Cascade LLC 7.125% 15/10/2014 494,900 0.02
USD 1,290,000 Boise Paper Holdings LLC / Boise
Co-Issuer Co 8% 1/4/2020 1,315,800 0.06
USD 470,000 Boise Paper Holdings LLC / Boise Finance
Co 9% 1/11/2017 498,200 0.02
USD 3,250,000 Brickman Group Holdings Inc '144A'
9.125% 1/11/2018 3,055,000 0.13
USD 4,573,000 Briggs & Stratton Corp 6.875%
15/12/2020 4,561,568 0.20
USD 2,345,000 Broadview Networks Holdings Inc 11.375%
1/9/2012 2,028,425 0.09
USD 19,025,000 Building Materials Corp of America '144A'
6.75% 1/5/2021 17,931,062 0.78
USD 2,210,000 Building Materials Corp of America '144A'
7% 15/2/2020 2,210,000 0.10
USD 2,700,000 Cablevision Systems Corp 7.75%
15/4/2018 2,760,750 0.12
USD 1,500,000 Caesars Entertainment Operating Co Inc
11.25% 1/6/2017 1,599,375 0.07
USD 3,630,000 Calfrac Holdings LP '144A' 7.5%
1/12/2020 3,530,175 0.15
USD 2,435,000 Calpine Corp '144A' 7.25% 15/10/2017 2,435,000 0.11
USD 1,590,000 Calpine Corp '144A' 7.5% 15/2/2021 1,582,050 0.07
USD 6,145,000 Calpine Corp '144A' 7.875% 15/1/2023 6,152,681 0.27
USD 885,000 Carrizo Oil & Gas Inc 8.625% 15/10/2018 889,425 0.04
USD 5,291,000 Casella Waste Systems Inc '144A' 7.75%
15/2/2019 5,132,270 0.22
USD 2,010,000 CB Richard Ellis Services Inc 6.625%
15/10/2020 1,969,800 0.09
USD 8,222,788 CCH II LLC / CCH II Capital Corp 13.5%
30/11/2016 9,517,877 0.41
USD 4,860,000 CCO Holdings LLC / CCO Holdings Capital
Corp 6.5% 30/4/2021 4,714,200 0.21
USD 1,260,000 CCO Holdings LLC / CCO Holdings Capital
Corp 7.25% 30/10/2017 1,294,650 0.06
USD 3,260,000 CCO Holdings LLC / CCO Holdings Capital
Corp 7.875% 30/4/2018 3,390,400 0.15
USD 4,580,000 CDW LLC / CDW Finance Corp '144A' 8%
15/12/2018 4,534,200 0.20
USD 87,000 CDW LLC / CDW Finance Corp 11%
12/10/2015 89,175 0.00
USD 5,070,000 CDW LLC / CDW Finance Corp 11.5%
12/10/2015 5,196,750 0.23
USD 5,070,000 Celanese US Holdings LLC 5.875%
15/6/2021 5,089,013 0.22
USD 4,700,000 Celanese US Holdings LLC 6.625%
15/10/2018 4,964,375 0.22
USD 5,168,000 Cengage Learning Acquisitions Inc '144A'
10.5% 15/1/2015 4,005,200 0.17
USD 2,081,000 CF Industries Inc 6.875% 1/5/2018 2,341,125 0.10
USD 2,000,000 Charter Communications Operating LLC /
Charter Communications Operating
Capital '144A' 10.875% 15/9/2014 2,170,000 0.09
USD 6,651,000 Checkout Holding Corp '144A' 0%
15/11/2015 (Zero Coupon) 3,957,345 0.17
USD 1,335,000 Chesapeake Energy Corp 2.25%
15/12/2038 1,194,825 0.05
USD 1,760,000 Chesapeake Energy Corp 6.125%
15/2/2021 1,779,800 0.08
USD 8,451,000 Chesapeake Energy Corp 6.625%
15/8/2020 8,831,295 0.38
USD 200,000 Chesapeake Energy Corp 6.875%
15/11/2020 209,000 0.01
USD 3,167,000 Chesapeake Midstream Partners LP /
CHKM Finance Corp '144A' 5.875%
15/4/2021 3,016,568 0.13
USD 909,005 CIT Group Inc 7% 1/5/2014* 914,686 0.04
USD 4,490,000 CIT Group Inc 7% 1/5/2015 4,428,262 0.19
USD 886,587 CIT Group Inc 7% 1/5/2016 878,829 0.04
USD 35,882,222 CIT Group Inc 7% 1/5/2017 35,119,725 1.53
USD 4,710,000 CIT Group Inc '144A' 7% 2/5/2017 4,609,913 0.20
USD 3,580,000 Citadel Broadcasting Corp '144A' 7.75%
15/12/2018 3,870,875 0.17
USD 2,430,000 Clean Harbors Inc '144A' 7.625%
15/8/2016 2,581,875 0.11
USD 37,953,000 Clear Channel Worldwide Holdings Inc
Series B 9.25% 15/12/2017 40,419,945 1.76
USD 10,494,000 Clear Channel Worldwide Holdings Inc
9.25% 15/12/2017 11,123,640 0.48
USD 7,255,000 Clearwater Paper Corp '144A' 7.125%
1/11/2018 7,236,862 0.32
USD 1,215,000 Clearwater Paper Corp 10.625%
15/6/2016 1,330,425 0.06
USD 3,946,000 CNO Financial Group Inc '144A' 9%
15/1/2018 4,093,975 0.18
USD 1,502,000 Coffeyville Resources LLC / Coffeyville
Finance Inc '144A' 9% 1/4/2015 1,599,630 0.07
USD 5,815,000 Concho Resources Inc/Midland TX 7%
15/1/2021 5,916,762 0.26
USD 1,646,000 Consol Energy Inc '144A' 6.375%
1/3/2021 1,613,080 0.07
USD 10,620,000 Consol Energy Inc 8.25% 1/4/2020 11,363,400 0.50
USD 40,214 Continental Airlines 1999-1 Class B
Pass Through Trust 6.795%
2/8/2018 38,806 0.00
USD 1,000,000 Continental Airlines 2010-1 Class B
Pass Through Trust Series B 6%
12/1/2019 920,625 0.04
USD 3,600,000 Continental Airlines Inc '144A' 6.75%
15/9/2015 3,523,500 0.15
USD 4,895,000 Continental Resources Inc/OK 7.125%
1/4/2021 4,992,900 0.22
USD 4,700,000 Copano Energy LLC / Copano Energy
Finance Corp 7.125% 1/4/2021 4,617,750 0.20
USD 1,286,000 Cott Beverages Inc 8.125% 1/9/2018 1,337,440 0.06
USD 1,210,000 Credit Acceptance Corp '144A' 9.125%
1/2/2017 1,231,175 0.05
USD 4,985,000 Credit Acceptance Corp 9.125% 1/2/2017 5,084,700 0.22
USD 10,160,000 Cricket Communications Inc 7.75%
15/5/2016 10,261,600 0.45
USD 2,710,000 Cricket Communications Inc 10%
15/7/2015 2,801,462 0.12
USD 1,760,000 Crown Castle International Corp 7.125%
1/11/2019 1,804,000 0.08
USD 1,210,000 Cumulus Media Inc '144A' 7.75% 1/5/2019 1,058,750 0.05
USD 1,735,000 Darling International Inc 8.5% 15/12/2018 1,886,812 0.08
USD 5,360,000 Del Monte Foods Co '144A' 7.625%
15/2/2019 5,346,600 0.23
USD 7,720,000 Delphi Corp '144A' 6.125% 15/5/2021 7,411,200 0.32
USD 4,738,039 Delta Air Lines 2009-1 Series B
Pass Through Trust Series B 9.75%
17/12/2016 4,856,490 0.21
USD 15,936,000 Denbury Resources Inc 8.25% 15/2/2020 16,812,480 0.73
USD 6,020,000 Diamond Resorts Corp 12% 15/8/2018 5,869,500 0.26
USD 390,000 DISH DBS Corp 6.625% 1/10/2014 401,700 0.02
USD 5,530,000 DISH DBS Corp '144A' 6.75% 1/6/2021 5,530,000 0.24
USD 10,020,000 DJO Finance LLC 10.875% 15/11/2014 10,408,275 0.45
USD 2,550,000 DJO Finance LLC / DJO Finance Corp
'144A' 7.75% 15/4/2018 2,342,813 0.10
US Dollar High Yield Bond Fund continued
Portfolio of Investments 31 August 2011
Transferable Securities Admitted to an Official Stock Exchange Listing or Dealt in on Another Regulated Market
Holding Description Value (USD) %
Transferable Securities Admitted to an Official Stock Exchange Listing or Dealt in on Another Regulated Market
Holding Description Value (USD) %

214 BlackRock Global Funds (BGF)
USD 14,182,000 Dollar General Corp 11.875% 15/7/2017 15,777,475 0.69
USD 2,285,000 Drummond Co Inc 7.375% 15/2/2016 2,330,700 0.10
USD 695,000 Drummond Co Inc '144A' 9% 15/10/2014 714,113 0.03
USD 924,000 E*Trade Financial CorpSeries A 0%
31/8/2019 (Zero Coupon) 1,032,570 0.04
USD 6,010,000 E*Trade Financial Corp 12.5% 30/11/2017 6,919,013 0.30
USD 6,750,000 Eagle Parent Inc '144A' 8.625% 1/5/2019 6,210,000 0.27
USD 3,700,000 EH Holding Corp '144A' 6.5% 15/6/2019 3,672,250 0.16
USD 3,625,000 El Paso Corp 7% 15/6/2017 4,055,458 0.18
USD 3,932,000 El Paso Corp 7.25% 1/6/2018 4,386,590 0.19
USD 1,760,000 Eldorado Resorts LLC / Eldorado Capital
Corp '144A' 8.625% 15/6/2019 1,522,400 0.07
USD 1,735,000 Endo Pharmaceuticals Holdings Inc '144A'
7% 15/7/2019 1,761,025 0.08
USD 31,110,000 Energy Future Holdings Corp 10%
15/1/2020 31,453,423 1.37
USD 18,285,000 Energy Future Intermediate Holding Co
LLC / EFIH Finance Inc 10%
1/12/2020 18,578,273 0.81
USD 6,360,000 Energy XXI Gulf Coast Inc 7.75%
15/6/2019 5,930,700 0.26
USD 4,115,000 Energy XXI Gulf Coast Inc 9.25%
15/12/2017 4,156,150 0.18
USD 2,620,000 Equinix Inc 7% 15/7/2021 2,665,850 0.12
USD 2,642,000 ExamWorks Group Inc '144A' 9%
15/7/2019 2,503,295 0.11
USD 2,800,000 Exterran Holdings Inc '144A' 7.25%
1/12/2018 2,723,000 0.12
USD 11,725,000 Felcor Lodging LP '144A' 6.75%
1/6/2019 10,962,875 0.48
USD 414,570 FiberTower Corp '144A' 9% 1/1/2016 260,143 0.01
USD 7,810,000 First Data Corp '144A' 7.375% 15/6/2019 7,224,250 0.31
USD 1,595,000 First Data Corp '144A' 8.875% 15/8/2020 1,563,100 0.07
USD 27,123,000 First Data Corp '144A' 12.625%
15/1/2021 24,817,545 1.08
USD 2,340,000 Florida East Coast Railway Corp '144A'
8.125% 1/2/2017 2,334,150 0.10
USD 3,360,000 Forbes Energy Services Ltd '144A' 9%
15/6/2019 3,217,200 0.14
USD 3,500,000 Ford Motor Co 7.45% 16/7/2031 3,826,655 0.17
USD 21,250,000 Ford Motor Credit Co LLC 7% 15/4/2015 22,590,110 0.99
USD 1,155,000 Forest Oil Corp 8.5% 15/2/2014 1,241,625 0.05
USD 293,315 FPL Energy National Wind Portfolio LLC
'144A' 6.125% 25/3/2019 287,731 0.01
USD 15,350,000 Frac Tech Services LLC/Frac Tech Finance
Inc '144A' 7.125% 15/11/2018 15,772,125 0.69
USD 4,883,000 Fresenius Medical Care US Finance Inc
6.875% 15/7/2017 5,072,216 0.22
USD 6,990,000 FTI Consulting Inc 6.75% 1/10/2020 6,920,100 0.30
USD 3,190,000 GCI Inc 6.75% 1/6/2021 3,150,125 0.14
USD 2,220,000 General Motors Financial Co Inc '144A'
6.75% 1/6/2018 2,186,700 0.10
USD 7,370,000 Genworth Financial Inc FRN 15/11/2016
(Perpetual) 4,348,300 0.19
USD 3,375,000 Genworth Financial Inc 7.625% 24/9/2021 2,985,775 0.13
USD 680,000 GeoEye Inc 9.625% 1/10/2015 761,600 0.03
USD 5,000,000 Georgia-Pacific LLC '144A' 5.4%
1/11/2020 5,107,770 0.22
USD 585,000 Georgia-Pacific LLC 7.7% 15/6/2015 671,235 0.03
USD 1,840,000 Graphic Packaging International Inc 7.875%
1/10/2018 1,922,800 0.08
USD 2,085,000 Graphic Packaging International Inc 9.5%
15/6/2017 2,257,012 0.10
USD 6,365,000 Gray Television Inc 10.5% 29/6/2015* 6,166,094 0.27
USD 3,185,000 NewPage Corp 11.375% 31/12/2014 3,392,025 0.15
USD 3,350,000 Griffon Corp 7.125% 1/4/2018 3,140,625 0.14
USD 310,000 Harland Clarke Holdings Corp FRN
15/5/2015 237,150 0.01
USD 270,000 Harland Clarke Holdings Corp 9.5%
15/5/2015 224,100 0.01
USD 12,685,000 HCA Inc 6.5% 15/2/2020 12,716,713 0.55
USD 19,600,000 HCA Inc 7.25% 15/9/2020 19,943,000 0.87
USD 13,500,000 HCA Inc 7.5% 15/2/2022 13,230,000 0.58
USD 2,240,000 HCA Inc 7.875% 15/2/2020 2,352,000 0.10
USD 1,515,000 HCA Inc 8.5% 15/4/2019 1,630,519 0.07
USD 3,380,000 Hertz Corp/The '144A' 6.75% 15/4/2019 3,168,750 0.14
USD 8,950,000 Hertz Corp/The '144A' 7.375% 15/1/2021 8,547,250 0.37
USD 7,820,000 Hertz Corp/The '144A' 7.5% 15/10/2018 7,702,700 0.34
USD 1,780,000 Hexion US Finance Corp / Hexion Nova
Scotia Finance ULC 8.875% 1/2/2018 1,642,050 0.07
USD 12,470,000 Hexion US Finance Corp / Hexion Nova
Scotia Finance ULC '144A' 9%
15/11/2020 10,708,613 0.47
USD 11,985,000 Hilcorp Energy I LP/Hilcorp Finance Co
'144A' 7.625% 15/4/2021 12,164,775 0.53
USD 5,295,000 Hilcorp Energy I LP/Hilcorp Finance Co
'144A' 7.75% 1/11/2015 5,427,375 0.24
USD 4,630,000 Hilcorp Energy I LP/Hilcorp Finance Co
'144A' 8% 15/2/2020 4,757,325 0.21
USD 2,220,000 Hillman Group Inc 10.875% 1/6/2018 2,253,300 0.10
USD 5,370,000 Huntington Ingalls Industries Inc '144A'
6.875% 15/3/2018 5,007,525 0.22
USD 5,400,000 Huntington Ingalls Industries Inc '144A'
7.125% 15/3/2021 5,055,750 0.22
USD 3,435,000 Huntsman International LLC '144A' 8.625%
15/3/2021 3,546,638 0.15
USD 7,220,000 IASIS Healthcare LLC / IASIS Capital Corp
'144A' 8.375% 15/5/2019 6,443,850 0.28
USD 695,000 Icahn Enterprises LP '144A' FRN 15/8/2013 655,038 0.03
USD 5,230,000 Icahn Enterprises LP / Icahn Enterprises
Finance Corp 7.75% 15/1/2016 5,230,000 0.23
USD 24,220,000 Icahn Enterprises LP / Icahn Enterprises
Finance Corp 8% 15/1/2018 24,220,000 1.06
USD 13,195,000 IMS Health Inc '144A' 12.5% 1/3/2018 15,248,472 0.66
USD 3,920,000 INC Research LLC '144A' 11.5% 15/7/2019 3,635,800 0.16
USD 4,525,000 Interactive Data Corp 10.25% 1/8/2018 4,773,875 0.21
USD 1,740,000 Interline Brands Inc 7% 15/11/2018 1,731,300 0.08
USD 1,240,000 Interpublic Group of Cos Inc/The 10%
15/7/2017 1,432,200 0.06
USD 5,545,000 inVentiv Health Inc '144A' 10% 15/8/2018 5,032,088 0.22
USD 3,845,000 Ipalco Enterprises Inc '144A' 7.25%
1/4/2016 4,144,260 0.18
USD 7,300,000 iPCS Inc FRN 1/5/2013 6,770,750 0.30
USD 1,180,000 ITC Deltacom Inc 10.5% 1/4/2016 1,212,450 0.05
USD 2,800,000 Jabil Circuit Inc 7.75% 15/7/2016 3,066,000 0.13
USD 1,335,000 Jabil Circuit Inc 8.25% 15/3/2018 1,511,888 0.07
USD 6,360,000 James River Escrow Inc '144A' 7.875%
1/4/2019 5,803,500 0.25
USD 1,120,000 Jarden Corp 7.5% 1/5/2017 1,148,000 0.05
USD 4,170,000 Jarden Corp 8% 1/5/2016 4,467,113 0.19
USD 845,000 JBS USA LLC/JBS USA Finance Inc '144A'
7.25% 1/6/2021 773,091 0.03
USD 920,000 JBS USA LLC/JBS USA Finance Inc
11.625% 1/5/2014 1,023,500 0.04
USD 3,540,000 Key Energy Services Inc 6.75% 1/3/2021 3,478,050 0.15
USD 3,390,000 KKR Group Finance Co LLC '144A' 6.375%
29/9/2020 3,624,100 0.16
USD 3,500,000 Koppers Inc 7.875% 1/12/2019 3,692,500 0.16
USD 960,000 Kraton Polymers LLC/Kraton Polymers
Capital Corp 6.75% 1/3/2019 926,400 0.04
USD 5,380,000 Kratos Defense & Security Solutions Inc
10% 1/6/2017 5,514,500 0.24
US Dollar High Yield Bond Fund continued
Portfolio of Investments 31 August 2011
Transferable Securities Admitted to an Official Stock Exchange Listing or Dealt in on Another Regulated Market
Holding Description Value (USD) %
Transferable Securities Admitted to an Official Stock Exchange Listing or Dealt in on Another Regulated Market
Holding Description Value (USD) %

Audited Annual Report and Accounts 215
The notes on pages 261 to 270 form an integral part of these financial statements.
USD 1,025,000 Kratos Defense & Security Solutions Inc
'144A' 10% 1/6/2017 1,037,812 0.05
USD 11,290,000 Leucadia National Corp 7.125%
15/3/2017 11,544,025 0.50
USD 975,000 Leucadia National Corp 8.125% 15/9/2015 1,051,781 0.05
USD 25,624,000 Level 3 Escrow Inc '144A' 8.125%
1/7/2019 24,022,500 1.05
USD 5,615,000 Level 3 Financing Inc 8.75% 15/2/2017 5,390,400 0.23
USD 2,270,000 Level 3 Financing Inc 9.25% 1/11/2014 2,281,350 0.10
USD 5,045,000 Linn Energy LLC/Linn Energy Finance Corp
'144A' 6.5% 15/5/2019 4,754,912 0.21
USD 4,640,000 Linn Energy LLC/Linn Energy Finance Corp
'144A' 7.75% 1/2/2021 4,663,200 0.20
USD 9,790,000 Linn Energy LLC/Linn Energy Finance Corp
8.625% 15/4/2020 10,377,400 0.45
USD 5,465,000 Live Nation Entertainment Inc '144A'
8.125% 15/5/2018 5,260,062 0.23
USD 3,230,000 Longview Fibre Paper & Packaging Inc
'144A' 8% 1/6/2016 3,116,950 0.14
USD 4,750,000 Lyondell Chemical Co 11% 1/5/2018 5,296,250 0.23
USD 1,935,000 MarkWest Energy Partners LP / MarkWest
Energy Finance Corp 6.75% 1/11/2020 1,988,212 0.09
USD 4,950,000 MedAssets Inc '144A' 8% 15/11/2018 4,801,500 0.21
USD 8,630,000 MetroPCS Wireless Inc 6.625%
15/11/2020 7,918,025 0.35
USD 1,990,000 MetroPCS Wireless Inc 7.875% 1/9/2018 2,009,900 0.09
USD 5,190,000 MGM Resorts International 10.375%
15/5/2014 5,709,000 0.25
USD 4,235,000 MGM Resorts International 13%
15/11/2013 4,880,837 0.21
USD 2,745,000 Micron Technology IncSeries A '144A' 1.5%
1/8/2031 2,370,994 0.10
USD 915,000 Micron Technology Inc Series B '144A'
1.875% 1/8/2031 768,600 0.03
USD 7,145,000 Mobile Mini Inc 7.875% 1/12/2020 6,930,650 0.30
USD 9,195,000 Momentive Performance Materials Inc 9%
15/1/2021 7,815,750 0.34
USD 4,000,000 Momentive Performance Materials Inc
11.5% 1/12/2016 3,980,000 0.17
USD 2,305,000 Momentive Performance Materials Inc
12.5% 15/6/2014 2,440,419 0.11
USD 7,630,000 NAI Entertainment Holdings LLC '144A'
8.25% 15/12/2017 7,744,450 0.34
USD 16,800,000 Navistar International Corp 3%
15/10/2014 18,732,000 0.82
USD 1,160,000 Navistar International Corp 8.25%
1/11/2021 1,186,100 0.05
USD 5,740,000 Newfield Exploration Co 6.875% 1/2/2020 5,969,600 0.26
USD 6,115,000 Newmont Mining CorpSeries A 1.25%
15/7/2014 8,897,325 0.39
USD 15,568,000 NewPage Corp 11.375% 31/12/2014* 13,544,160 0.59
USD 2,620,000 Nexeo Solutions LLC / Nexeo Solutions
Finance Corp '144A' 8.375% 1/3/2018 2,731,350 0.12
USD 12,855,000 Nielsen Finance LLC / Nielsen Finance Co
'144A' 7.75% 15/10/2018 13,304,925 0.58
USD 1,194,000 Nielsen Finance LLC / Nielsen Finance Co
11.5% 1/5/2016 1,361,160 0.06
USD 1,618,000 Nielsen Finance LLC / Nielsen Finance Co
11.625% 1/2/2014 1,840,475 0.08
USD 3,194,000 NII Capital Corp 7.625% 1/4/2021 3,273,850 0.14
USD 11,175,000 Niska Gas Storage US LLC/Niska Gas
Storage Canada ULC 8.875%
15/3/2018 11,119,125 0.48
USD 3,930,000 NRG Energy Inc 7.375% 15/1/2017 4,057,725 0.18
USD 12,485,000 NRG Energy Inc '144A' 7.625%
15/1/2018 12,126,056 0.53
USD 5,150,000 Oasis Petroleum Inc '144A' 7.25%
1/2/2019 5,059,875 0.22
USD 3,110,000 Oil States International Inc '144A' 6.5%
1/6/2019 3,110,000 0.14
USD 7,330,000 Omnicare Inc 6.875% 15/12/2015 7,513,250 0.33
USD 4,170,000 Omnova Solutions Inc 7.875% 1/11/2018 3,841,612 0.17
USD 2,210,000 Oshkosh Corp 8.25% 1/3/2017 2,281,825 0.10
USD 1,450,000 Penn Virginia Corp 7.25% 15/4/2019 1,386,562 0.06
USD 3,410,000 Penske Auto Group Inc 7.75% 15/12/2016 3,478,200 0.15
USD 8,340,000 Petrohawk Energy Corp '144A' 6.25%
1/6/2019 9,663,975 0.42
USD 3,050,000 Petrohawk Energy Corp 7.25% 15/8/2018 3,576,125 0.16
USD 7,530,000 Petrohawk Energy Corp 7.875% 1/6/2015 8,188,875 0.36
USD 4,510,000 Petrohawk Energy Corp 10.5% 1/8/2014 5,107,575 0.22
USD 885,000 PH Glatfelter Co 7.125% 1/5/2016 902,700 0.04
USD 3,210,000 Pioneer Natural Resources Co 6.875%
1/5/2018 3,501,237 0.15
USD 820,000 Pioneer Natural Resources Co 7.2%
15/1/2028 890,659 0.04
USD 525,000 Pioneer Natural Resources Co 7.5%
15/1/2020 592,458 0.03
USD 2,415,000 Plains Exploration & Production Co 6.625%
1/5/2021 2,418,019 0.11
USD 3,065,000 Plains Exploration & Production Co 7.75%
15/6/2015 3,172,275 0.14
USD 1,075,000 PolyOne Corp 7.375% 15/9/2020 1,107,250 0.05
USD 1,135,000 Pregis Corp 12.375% 15/10/2013 1,049,875 0.05
USD 2,955,000 ProQuest LLC/ProQuest Notes Co '144A'
9% 15/10/2018 2,903,287 0.13
USD 230,000 Pulte Homes Inc 6.375% 15/5/2033 174,225 0.01
USD 3,900,000 PVH Corp 7.375% 15/5/2020 4,104,750 0.18
USD 1,251,684 QHP Royalty Sub LLC '144A' 10.25%
15/3/2015 1,274,440 0.06
USD 2,105,000 QVC Inc '144A' 7.125% 15/4/2017 2,210,250 0.10
USD 1,985,000 QVC Inc '144A' 7.375% 15/10/2020 2,133,875 0.09
USD 3,070,000 QVC Inc '144A' 7.5% 1/10/2019 3,300,250 0.14
USD 6,705,000 Qwest Communications International Inc
Series B 7.5% 15/2/2014 6,805,575 0.30
USD 2,000,000 Qwest Communications International Inc
8% 1/10/2015 2,127,500 0.09
USD 500,000 Qwest Corp 7.5% 15/6/2023 495,625 0.02
USD 7,260,000 Range Resources Corp 5.75% 1/6/2021 7,296,300 0.32
USD 4,005,000 Range Resources Corp 6.75% 1/8/2020 4,205,250 0.18
USD 5,830,000 Range Resources Corp 8% 15/5/2019 6,325,550 0.28
USD 19,175,000 Realogy Corp '144A' 7.875% 15/2/2019* 16,011,125 0.70
USD 18,260,000 Realogy Corp 11.5% 15/4/2017 14,379,750 0.63
USD 925,000 Realogy Corp 12% 15/4/2017 740,000 0.03
USD 1,740,000 Reddy Ice Corp 11.25% 15/3/2015 1,592,100 0.07
USD 2,750,000 Regal Entertainment Group 9.125%
15/8/2018 2,784,375 0.12
USD 2,785,000 Reynolds Group Issuer Inc / Reynolds
Group Issuer LLC / Reynolds Group
Issuer Lu '144A' 7.125% 15/4/2019 2,659,675 0.12
USD 6,710,000 Reynolds Group Issuer Inc / Reynolds
Group Issuer LLC / Reynolds Group
Issuer Lu '144A' 7.875% 15/8/2019 6,676,450 0.29
USD 10,475,000 Reynolds Group Issuer Inc / Reynolds
Group Issuer LLC / Reynolds Group
Issuer Lu '144A' 8.25% 15/2/2021 8,877,563 0.39
USD 2,352,000 Reynolds Group Issuer Inc / Reynolds
Group Issuer LLC / Reynolds Group
Issuer Lu '144A' 8.5% 15/10/2016 2,404,920 0.10
USD 2,145,000 Reynolds Group Issuer Inc / Reynolds
Group Issuer LLC / Reynolds Group
Issuer Lu '144A' 9% 15/4/2019 1,935,863 0.08
US Dollar High Yield Bond Fund continued
Portfolio of Investments 31 August 2011
Transferable Securities Admitted to an Official Stock Exchange Listing or Dealt in on Another Regulated Market
Holding Description Value (USD) %
Transferable Securities Admitted to an Official Stock Exchange Listing or Dealt in on Another Regulated Market
Holding Description Value (USD) %

216 BlackRock Global Funds (BGF)
US Dollar High Yield Bond Fund continued
Portfolio of Investments 31 August 2011
USD 4,730,000 Reynolds Group Issuer Inc / Reynolds
Group Issuer LLC / Reynolds Group
Issuer Lu '144A' 9.875% 15/8/2019 4,458,025 0.19
USD 437,000 Rock-Tenn Co 9.25% 15/3/2016 461,035 0.02
USD 3,600,000 Rouse Co LP/The 6.75% 9/11/2015 3,649,500 0.16
USD 610,000 Rouse Co LP/The 7.2% 15/9/2012 632,875 0.03
USD 5,745,000 RSC Equipment Rental Inc '144A' 10%
15/7/2017 6,204,600 0.27
USD 5,331,000 RSC Equipment Rental Inc/RSC Holdings
III LLC 8.25% 1/2/2021 4,984,485 0.22
USD 7,062,000 Ryland Group Inc 6.625% 1/5/2020 6,038,010 0.26
USD 12,975,000 SandRidge Energy Inc '144A' 7.5%
15/3/2021 12,537,094 0.55
USD 2,595,000 Scientific Games Corp 8.125% 15/9/2018 2,614,462 0.11
USD 2,085,000 Sealed Air Corp 7.875% 15/6/2017 2,196,227 0.10
USD 13,190,000 Sequa Corp '144A' 11.75% 1/12/2015 13,849,500 0.60
USD 9,174,418 Sequa Corp '144A' 13.5% 1/12/2015 9,793,691 0.43
USD 6,215,000 SESI LLC '144A' 6.375% 1/5/2019 6,168,387 0.27
USD 10,270,000 Shea Homes LP / Shea Homes Funding
Corp '144A' 8.625% 15/5/2019 8,703,825 0.38
USD 1,545,000 Sinclair Television Group Inc 8.375%
15/10/2018 1,556,587 0.07
USD 1,600,000 Sinclair Television Group Inc '144A' 9.25%
1/11/2017 1,712,000 0.07
USD 6,750,000 SM Energy Co '144A' 6.625% 15/2/2019 6,783,750 0.30
USD 4,937,000 Solutia Inc 7.875% 15/3/2020 5,257,905 0.23
USD 4,078,000 Solutia Inc 8.75% 1/11/2017 4,353,265 0.19
USD 3,145,000 Sonic Automotive Inc 9% 15/3/2018 3,192,175 0.14
USD 3,970,000 Spansion LLC '144A' 7.875% 15/11/2017 4,069,250 0.18
USD 390,000 Spirit Aerosystems Inc 7.5% 1/10/2017 406,575 0.02
USD 14,385,000 Sprint Capital Corp 6.875% 15/11/2028 12,730,725 0.56
USD 1,685,000 SPX Corp 6.875% 1/9/2017 1,760,825 0.08
USD 735,000 Stanadyne Corp 10% 15/8/2014 716,625 0.03
USD 930,000 Standard Pacific Corp 8.375% 15/5/2018 797,475 0.03
USD 10,450,000 Standard Pacific Corp 8.375% 15/1/2021 8,725,750 0.38
USD 4,255,000 Standard Pacific Corp 10.75% 15/9/2016 4,212,450 0.18
USD 2,035,000 SunCoke Energy Inc '144A' 7.625%
1/8/2019 2,004,475 0.09
USD 5,370,000 SunGard Data Systems Inc 7.375%
15/11/2018 5,128,350 0.22
USD 4,110,000 SunGard Data Systems Inc 7.625%
15/11/2020 3,945,600 0.17
USD 3,255,000 Symbion Inc '144A' 8% 15/6/2016 3,059,700 0.13
USD 4,110,000 Targa Resources Partners LP / Targa
Resources Partners Finance Corp
'144A' 6.875% 1/2/2021 4,017,525 0.17
USD 2,750,000 Teleflex Inc 6.875% 1/6/2019 2,729,375 0.12
USD 17,210,000 Tenet Healthcare Corp 8.875% 1/7/2019 18,328,650 0.80
USD 4,709,000 Tenet Healthcare Corp 10% 1/5/2018 5,174,014 0.23
USD 2,460,000 Tenneco Inc 7.75% 15/8/2018 2,558,400 0.11
USD 1,588,000 Thermon Industries Inc 9.5% 1/5/2017 1,667,400 0.07
USD 3,230,000 Titan International Inc 7.875% 1/10/2017 3,407,650 0.15
USD 2,110,000 Toys R US - Delaware Inc '144A' 7.375%
1/9/2016 2,041,425 0.09
USD 220,000 TPC Group LLC '144A' 8.25% 1/10/2017 225,225 0.01
USD 1,025,000 Travelport LLC FRN 1/9/2014 781,563 0.03
USD 230,000 Travelport LLC 9.875% 1/9/2014* 196,075 0.01
USD 2,820,000 Travelport LLC 11.875% 1/9/2016* 2,016,300 0.09
USD 990,000 Travelport LLC/Travelport Inc 9% 1/3/2016 796,950 0.03
USD 2,320,000 tw telecom holdings inc 8% 1/3/2018 2,401,200 0.10
USD 5,106,816 United Air Lines Inc 12.75% 15/7/2012 5,349,390 0.23
USD 4,080,000 United Rentals North America Inc 8.375%
15/9/2020 3,723,000 0.16
USD 515,000 United States Steel Corp 7.375% 1/4/2020* 491,825 0.02
USD 2,100,000 Universal Health Services Inc 7%
1/10/2018 2,063,250 0.09
USD 3,900,000 US Airways 2011-1 Class C Pass Through
Trust 10.875% 22/10/2014* 3,783,000 0.16
USD 140,000 USI Holdings Corp '144A' FRN 15/11/2014 123,900 0.01
USD 9,780,000 Valeant Pharmaceuticals International
'144A' 6.5% 15/7/2016 9,144,300 0.40
USD 285,000 Verso Paper Holdings LLC / Verso Paper
Inc Series B FRN 1/8/2014 235,125 0.01
USD 11,189,000 Verso Paper Holdings LLC / Verso Paper
Inc 11.5% 1/7/2014 11,860,340 0.52
USD 1,665,000 Vulcan Materials Co 7.5% 15/6/2021* 1,612,033 0.07
USD 266,457 Waterford Gaming LLC '144A' 8.625%
15/9/2014 139,890 0.01
USD 1,390,000 West Corp 8.625% 1/10/2018 1,383,050 0.06
USD 1,835,000 Whiting Petroleum Corp 6.5% 1/10/2018 1,844,175 0.08
USD 6,655,000 Windstream Corp 7.875% 1/11/2017 6,954,475 0.30
USD 1,140,000 WMG Acquisition Corp '144A' 9.5%
15/6/2016 1,165,650 0.05
USD 5,500,000 WMG Acquisition Corp '144A' 11.5%
1/10/2018 5,005,000 0.22
1,686,134,579 73.56
Total Bonds 2,064,868,384 90.08
Total Transferable Securities Admitted
to an Official Stock Exchange Listing or
Dealt in on Another Regulated Market 2,102,248,917 91.71
Unquoted Securities
COMMON / PREFERRED STOCKS (SHARES) & WARRANTS
Australia 8,000 Australis Media (Defaulted)
(Wts 4/6/2014) – 0.00
Canada 28,522 Ainsworth Lumber Co Ltd '144A' 57,306 0.00
United States 830,312 Adelphia Recovery Trust 830 0.00
31,195 Ally Financial Inc (Pref) 22,828,891 1.00
739 Bankruptcy Management Solutions 15,809 0.00
492 Bankruptcy Management Solutions
(Wts 28/9/17) 30 0.00
17,056 CMP Susquehanna (Wts 26/3/2019) 99,191 0.01
14,926 CMP Susquehanna Radio Holdings Corp
(Pref) 126,871 0.00
65,370 Curative Health Services Inc 6,576 0.00
215,000 Eagle-Picher Industries Inc (Defaulted) – 0.00
26 Marsico Parent Holdco LLC (Defaulted)
(Wts 15/1/2016) – 0.00
690,000 Mirant Corp Escrowed 43 0.00
23,078,241 1.01
Total Common / Preferred Stocks (Shares)
& Warrants 23,135,547 1.01
BONDS
Bermuda EUR 1,556,000 Central European Media Enterprises Ltd
'144A' 11.625% 15/9/2016 2,056,100 0.09
USD 2,380,829 ProtoStar I Ltd (Defaulted) '144A' 18%
15/10/2012 1,191 0.00
2,057,291 0.09
Transferable Securities Admitted to an Official Stock Exchange Listing or Dealt in on Another Regulated Market
Holding Description Value (USD) %
Transferable Securities Admitted to an Official Stock Exchange Listing or Dealt in on Another Regulated Market
Holding Description Value (USD) %

* Securities lent, see Note 11, for further details.
Audited Annual Report and Accounts 217
The notes on pages 261 to 270 form an integral part of these financial statements.
Luxembourg EUR 1,500,000 Capsugel FinanceCo SCA '144A' 9.875%
1/8/2019 2,066,043 0.09
EUR 2,600,000 ConvaTec Healthcare E SA '144A' 7.375%
15/12/2017 3,360,547 0.15
EUR 1,180,000 Greif Luxembourg Finance SCA '144A'
7.375% 15/7/2021 1,680,245 0.07
7,106,835 0.31
United Kingdom GBP 1,361,000 Boparan Finance Plc 9.875% 30/4/2018 1,774,118 0.08
United States USD 4,205,000 Chemtura Corp 7.875% 1/9/2018 4,341,662 0.19
USD 64,000 CMP Susquehanna Radio Holdings '144A'
0% 15/5/2014 (Zero Coupon) 60,800 0.00
USD 850,000 Erscrew Adelphia FRN 31/12/2049 1,581 0.00
USD 1,795,000 Lear Corp 5.75% 1/8/2014 35,900 0.00
USD 2,030,000 Lear Corp 8.5% 1/12/2013 40,600 0.00
EUR 14,950,000 Lehman Brothers Holdings Inc (Defaulted)
0% 5/2/2014 (Zero Coupon) 5,127,651 0.22
EUR 7,165,000 Lehman Brothers Holdings Inc (Defaulted)
4.75% 16/1/2014 2,224,684 0.10
EUR 1,250,000 Lehman Brothers Holdings Inc (Defaulted)
5.375% 17/10/2012 437,759 0.02
USD 5,760,000 Lehman Brothers Holdings Inc (Defaulted)
5.75% 17/5/2013 1,404,000 0.06
USD 1,610,000 Lehman Brothers Holdings Inc (Defaulted)
8.8% 1/3/2015 398,475 0.02
USD 3,596,667 National Air Cargo Group Inc Series 1
12.375% 16/8/2015 3,740,205 0.16
USD 3,633,333 National Air Cargo Group Inc Series 2
12.375% 16/8/2015 3,778,313 0.17
USD 2,130,000 Old AII Inc 9% (Defaulted) 15/12/2014 10,650 0.00
USD 1,725,000 Old AII Inc 10% (Defaulted) 15/12/2016 4,485 0.00
EUR 1,450,000 Reynolds Group Issuer '144A' 8.75%
15/10/2016 1,996,317 0.09
EUR 3,141,000 Reynolds Group Issuer Inc 8.75%
15/10/2016 4,377,326 0.19
USD 240,000 Southern Energy Home (Defaulted) 7.9%
15/7/2009 – 0.00
USD 115,000 Tropicana Entertainment LLC / Tropicana
Finance Corp (Defaulted) 9.625%
15/12/2014 129 0.00
27,980,537 1.22
Total Bonds 38,918,781 1.70
Total Unquoted Securities 62,054,328 2.71
Total Portfolio 2,164,303,245 94.42
Other Net Assets 128,033,153 5.58
Total Net Assets (USD) 2,292,336,398 100.00
US Dollar High Yield Bond Fund continued
Portfolio of Investments 31 August 2011
Unquoted Securities
Holding Description Value (USD) %
Unquoted Securities
Holding Description Value (USD) %
Note: The total market value of USD 119,701 of these transactions is included in the Statement of Net Assets (see Note 2c).
Nominal Value Description
Unrealisedprofit/(loss)
USD
Nominal Value Description
Unrealisedprofit/(loss)
USD
Swaps as at 31 August 2011
USD (2,000,000) Credit Default Swaps (Bank of America) (Fund provides
default protection on Dynegy Holdings Inc 8.375%
1/5/2016; and receives Fixed 5%) (20/12/2011 58,178
USD 2,250,000 Credit Default Swaps (Deutsche Bank) (Fund receives
default protection on Hungary Government
International Bond 4.75% 3/2/2015; and pays
Fixed 1%) (20/12/2015) 52,200
USD (3,000,000) Credit Default Swaps (Union Bank of Switzerland)
(Fund provides default protection on Level 3
Communications Inc 15% 15/1/2013; and receives
Fixed 5%) (20/3/2016) 36,493
USD (2,000,000) Credit Default Swaps (Union Bank of Switzerland)
(Fund provides default protection on Level 3
Communications Inc 15% 15/1/2013; and receives
Fixed 5%) (20/3/2016) (35,672)
USD (3,150,000) Credit Default Swaps (JP Morgan) (Fund provides
default protection on Aramark Corporation 8.5%
1/2/2015; and receives Fixed 5%) (20/6/2016) (154,078)
USD (1,200,000) Credit Default Swaps (JP Morgan) (Fund provides
default protection on Aramark Corporation 8.5%
1/2/2015; and receives Fixed 5%) (20/6/2016) (59,209)
USD (875,000) Credit Default Swaps (Credit Suisse) (Fund provides
default protection on CDX.NA.HY.16-V1; and
receives Fixed 5%) (20/6/2016) 25,758
USD (1,875,000) Credit Default Swaps (Deutsche Bank) (Fund provides
default protection on CDX.NA.HY.16-V1; and
receives Fixed 5%) (20/6/2016) 31,758
USD (875,000) Credit Default Swaps (Deutsche Bank) (Fund provides
default protection on CDX.NA.HY.16-V1; and
receives Fixed 5%) (20/6/2016) 22,476
USD (1,225,000) Credit Default Swaps (Deutsche Bank) (Fund provides
default protection on CDX.NA.HY.16-V1; and
receives Fixed 5%) (20/6/2016) 10,795
USD 1,150,000 Credit Default Swaps (Credit Suisse) (Fund receives
default protection on Beazer Homes USA Inc 9.125%
15/6/2018; and pays Fixed 5%) (20/9/2016) (54,916)
USD (2,500,000) Credit Default Swaps (Credit Suisse) (Fund provides
default protection on Aramark Corporation 8.5%
1/2/2015; and receives Fixed 5%) (20/9/2016) (140,788)
USD 18,205,000 Inflation Swaps (Bank of America) (Fund receives Fixed
3.11%; and pays USCPIU + 0bps) (2/8/2021) 174,896
USD 13,885,000 Inflation Swaps (Deutsche Bank) (Fund receives Fixed
3.09%; and pays Floating USCPIU + 0bps)
(3/8/2021) 120,901
USD 13,820,000 Inflation Swaps (Credit Suisse) (Fund receives Fixed
3.15%; and pays Floating USCPIU + 0bps)
(11/8/2021) 156,102
USD 13,820,000 Inflation Swaps (Deutsche Bank) (Fund receives Fixed
3.11%; and pays Floating USCPIU + 0bps)
(11/8/2021) 131,508
376,402

US Dollar High Yield Bond Fund continued
218 BlackRock Global Funds (BGF)
Open Forward Foreign Exchange Transactionsas at 31 August 2011
Purchases Sales Value date Unrealised
profit/(loss)
Unrealisedprofit/(loss)
USD Equivalent
Core Fund USD
USD 38,295,252 GBP 23,943,500 7/10/2011 (758,752) (758,752)
EUR 4,600,000 USD 6,586,873 26/10/2011 52,045 52,045
USD 190,457,116 EUR 132,860,500 26/10/2011 (1,292,903) (1,292,903)
Net unrealised loss (1,999,610) (1,999,610)
AUD Hedged Share Class AUD
AUD 2,643,152 USD 2,695,548 14/9/2011 120,674 129,160
USD 208,381 AUD 203,261 14/9/2011 (8,259) (8,840)
Net unrealised profit 112,415 120,320
EUR Hedged Share Class EUR
EUR 401,184,756 USD 569,063,550 14/9/2011 7,078,584 10,223,258
USD 108,430,738 EUR 76,024,705 14/9/2011 (930,767) (1,344,262)
Net unrealised profit 6,147,817 8,878,996
SGD Hedged Share Class SGD
SGD 1,018,427 USD 834,105 14/9/2011 15,374 12,784
USD 47,124 SGD 57,171 14/9/2011 (502) (417)
Net unrealised profit 14,872 12,367
Total net unrealised profit 7,012,073
Note: The net unrealised profit attributed to these transactions is included in the Statement
of Net Assets (see Note 2c).
Open Futures Contractsas at 31 August 2011
Numberof contracts Contract/Description
Expirationdate
ValueUSD
(807) E-mini S&P500 September 2011 (49,015,162)
Total commitment (49,015,162)
Note: The net unrealised loss of USD 3,080,388 attributed to this transaction is included
in the Statement of Net Assets (see Note 2c).

Audited Annual Report and Accounts 219
The notes on pages 261 to 270 form an integral part of these financial statements.
US Dollar Reserve Fund
COMMERCIAL PAPER
United States USD 15,000,000 Amsterdam Funding Corp 0% 22/9/2011 14,998,181 3.95
USD 10,000,000 Antlantis One Funding Corp 0% 6/9/2011 9,999,757 2.63
USD 8,000,000 Antlantis One Funding Corp 0% 22/9/2011 7,999,030 2.11
USD 10,000,000 Cancara Asset Securitisation 0% 6/9/2011 9,999,757 2.64
USD 14,704,000 Chariot Funding LLC 0% 13/9/2011 14,703,048 3.87
USD 4,000,000 Credit Suiss First Boston 0% 1/9/2011 4,000,000 1.05
USD 9,087,000 Credit Suiss First Boston 0% 4/10/2011 9,085,116 2.39
USD 12,000,000 Falcon Asset Securitization Co 0%
23/9/2011 11,998,465 3.16
USD 10,000,000 Grampian Funding LLC 0% 7/9/2011 9,999,698 2.63
USD 5,000,000 ING (US) Funding LLC 0% 10/11/2011 4,997,200 1.32
USD 4,000,000 Kells Funding 0% 2/9/2011 3,999,983 1.05
USD 10,000,000 Mizuho Funding LLC 0% 7/10/2011 9,997,691 2.63
USD 5,000,000 National Australia Bank Ltd 0% 3/10/2011 4,999,002 1.32
USD 7,000,000 Nieuw Amsterdam Receivable Corp 0%
1/11/2011 6,996,792 1.84
USD 1,500,000 Nordea Bank AB 0% 12/10/2011 1,499,592 0.40
USD 10,000,000 Nordea Bank AB 0% 14/11/2011 9,993,919 2.63
USD 17,000,000 Old Line Funding LLC 0% 9/9/2011 16,999,289 4.48
USD 5,000,000 Solitaire Funding LLC 0% 12/9/2011 4,999,706 1.32
USD 5,000,000 Solitaire Funding LLC 0% 11/10/2011 4,998,682 1.32
USD 5,000,000 Solitaire Funding LLC 0% 18/10/2011 4,998,380 1.32
USD 8,000,000 State Street Corp 0% 3/11/2011 7,996,159 2.11
USD 10,000,000 Thunder Bay Funding LLC 0% 1/11/2011 9,995,417 2.63
USD 5,000,000 UBS AG 0% 26/9/2011 4,999,257 1.32
USD 10,000,000 Variable Funding 0% 7/9/2011 9,999,698 2.63
200,253,819 52.75
Total Commercial Paper 200,253,819 52.75
CERTIFICATES OF DEPOSIT
United States USD 10,000,000 Bank of Montreal 0.18% 6/10/2011 9,999,489 2.63
USD 5,000,000 Bank of Montreal 0.25% 14/11/2011 4,999,459 1.32
USD 8,000,000 Bank of Nova Scotia 0.2% 14/11/2011 7,998,311 2.10
USD 5,000,000 Bank of Nova Scotia 0.25% 21/12/2011 4,998,072 1.31
USD 5,000,000 Credit Suisse Group AG 0.29%
10/11/2011 4,999,967 1.32
USD 5,000,000 DnB NOR Bank ASA 0.21% 8/9/2011 5,000,005 1.32
USD 3,000,000 Lloyds TSB Bank Plc 0.3% 12/9/2011 2,999,809 0.79
USD 5,000,000 Nordea Bank AB 0.26% 21/11/2011 4,999,336 1.32
USD 5,000,000 Norinchukin Bank 0.18% 1/9/2011 5,000,000 1.32
USD 7,000,000 Rabobank Nederland NV 0.43%
1/3/2012 6,981,545 1.84
USD 6,000,000 Royal Bank of Scotland Plc 0.52%
19/9/2011 6,000,915 1.58
USD 9,000,000 State Street Corp 0.15% 12/9/2011 8,999,839 2.37
USD 3,000,000 Svenska Handelsbanken AB 0.215%
3/10/2011 2,999,392 0.79
75,976,139 20.01
Total Certificates of Deposit 75,976,139 20.01
BONDS
Canada USD 5,000,000 Royal Bank of Canada/New York NY FRN
29/2/2012 4,999,383 1.32
USD 5,000,000 Royal Bank of Canada/New York NY FRN
9/7/2012 4,991,707 1.31
9,991,090 2.63
United Kingdom USD 2,895,000 Lloyds TSB Bank Plc/New York NY FRN
14/2/2012 2,894,628 0.76
United States USD 6,555,000 Fannie Mae Discount Notes 0%
18/1/2012 (Zero Coupon) 6,553,981 1.73
USD 12,000,000 Fannie Mae Discount Notes 0%
30/3/2012 (Zero Coupon) 11,995,764 3.16
USD 2,000,000 Federal Home Loan Banks FRN
6/10/2011 2,000,055 0.53
USD 10,000,000 Federal Home Loan Mortgage Corp FRN
29/12/2011 10,000,380 2.63
USD 5,000,000 Federal Home Loan Mortgage Corp FRN
2/11/2012 4,997,925 1.32
USD 3,000,000 Federal National Mortgage Association
FRN 26/7/2012 3,000,975 0.79
USD 5,000,000 Federal National Mortgage Association
FRN 23/8/2012 5,002,827 1.32
USD 4,500,000 Freddie Mac Discount Notes 0%
15/2/2012 (Zero Coupon) 4,498,949 1.18
USD 4,000,000 JPMorgan Chase & Co FRN 16/3/2012 3,988,116 1.05
USD 3,375,000 JPMorgan Chase Bank NA FRN
17/9/2012 3,376,099 0.89
USD 2,539,000 United States Treasury Bill 0%
20/10/2011 (Zero Coupon) 2,538,963 0.67
57,954,034 15.27
Total Bonds 70,839,752 18.66
Total Transferable Securities Admitted
to an Official Stock Exchange Listing or
Dealt in on Another Regulated Market 347,069,710 91.42
Unquoted Securities
BONDS
Australia USD 7,000,000 Westpac Banking Corp/NY FRN
4/4/2012 6,996,948 1.84
France USD 1,500,000 Societe Generale/New York NY FRN
21/11/2011 1,498,784 0.39
Switzerland USD 2,810,000 UBS AG/Stamford CT FRN 4/10/2011 2,809,933 0.74
USD 8,000,000 UBS AG/Stamford CT FRN 10/11/2011 7,999,740 2.11
10,809,673 2.85
Total Bonds 19,305,405 5.08
Total Unquoted Securities 19,305,405 5.08
Total Portfolio 366,375,115 96.50
Other Net Assets 13,284,016 3.50
Total Net Assets (USD) 379,659,131 100.00
Portfolio of Investments 31 August 2011
Transferable Securities Admitted to an Official Stock Exchange Listing or Dealt in on Another Regulated Market
Holding Description Value (USD) %
Transferable Securities Admitted to an Official Stock Exchange Listing or Dealt in on Another Regulated Market
Holding Description Value (USD) %

220 BlackRock Global Funds (BGF)
US Dollar Reserve Fund continued
Open Forward Foreign Exchange Transactionsas at 31 August 2011
Purchases Sales Value date Unrealised
profit/(loss)
Unrealisedprofit/(loss)
USD Equivalent
GBP Hedged Share Class GBP
GBP 12,464,500 USD 20,375,115 14/9/2011 (23,910) (39,018)
USD 689,742 GBP 420,460 14/9/2011 2,299 3,752
Net unrealised loss (21,611) (35,266)
Total net unrealised loss (35,266)
Note: The net unrealised loss attributed to these transactions is included in the Statement
of Net Assets (see Note 2c).

Audited Annual Report and Accounts 221
The notes on pages 261 to 270 form an integral part of these financial statements.
US Dollar Short Duration Bond Fund
BONDS
Australia USD 840,000 Asciano Finance Ltd '144A' 3.125%
23/9/2015 856,675 0.49
USD 840,000 Commonwealth Bank of Australia '144A'
2.5% 10/12/2012 862,541 0.50
USD 745,000 Commonwealth Bank of Australia '144A'
3.492% 13/8/2014 794,846 0.46
USD 990,000 Macquarie Bank Ltd '144A' 4.1%
17/12/2013 1,066,800 0.61
EUR 566,957 Superannuation Members Home Loans
Global Fund '2007-1 A2' FRN
12/6/2040 792,391 0.46
4,373,253 2.52
Bermuda USD 320,000 Ingersoll-Rand Global Holding Co Ltd
9.5% 15/4/2014 380,917 0.22
Canada USD 1,100,000 Barrick Gold Corp '144A' 1.75%
30/5/2014 1,116,210 0.64
USD 270,000 CDP Financial Inc '144A' 3% 25/11/2014 284,891 0.16
USD 750,000 Nova Chemicals Corp 8.375% 1/11/2016 809,062 0.47
2,210,163 1.27
Cayman Islands USD 910,000 Petrobras International Finance Co - Pifco
3.875% 27/1/2016 934,645 0.54
USD 375,000 Petrobras International Finance Co - Pifco
7.75% 15/9/2014 434,062 0.25
1,368,707 0.79
Chile USD 290,000 Celulosa Arauco y Constitucion SA 5.125%
9/7/2013 308,548 0.18
USD 255,000 Celulosa Arauco y Constitucion SA 5.625%
20/4/2015 278,860 0.16
USD 750,000 Corp Nacional del Cobre de Chile '144A'
4.75% 15/10/2014 815,641 0.47
1,403,049 0.81
Denmark USD 615,000 FIH Erhvervsbank A/S '144A' 1.75%
6/12/2012 624,650 0.36
France USD 1,485,000 Dexia Credit Local SA '144A' 2.375%
23/9/2011 1,486,230 0.86
Ireland USD 360,000 XL Group Plc 5.25% 15/9/2014 386,559 0.22
Luxembourg EUR 700,000 Bumper 2 SA '2011-2 A' FRN 23/2/2023 1,010,907 0.58
USD 345,000 Covidien International Finance SA 5.45%
15/10/2012 363,190 0.21
1,374,097 0.79
Mexico USD 593,000 America Movil SAB de CV 5.5% 1/3/2014 655,840 0.38
Netherlands EUR 349,530 Globaldrive BV '2008-2 A' 4% 20/10/2016 510,053 0.29
USD 755,000 Volkswagen International Finance NV
'144A' 1.625% 12/8/2013 762,863 0.44
1,272,916 0.73
Norway USD 400,000 Eksportfinans ASA 1.875% 2/4/2013 408,591 0.23
USD 200,000 Eksportfinans ASA 3% 17/11/2014 212,121 0.12
USD 1,076,000 Kommunalbanken AS '144A' 1%
16/6/2014 1,087,463 0.63
1,708,175 0.98
Switzerland USD 720,000 Credit Suisse/New York NY 3.5%
23/3/2015 732,150 0.42
USD 400,000 Credit Suisse/New York NY 5%
15/5/2013 419,895 0.24
1,152,045 0.66
United Kingdom GBP 1,350,000 Arkle Master Issuer Plc '2006-1X 5A2' FRN
17/2/2052 2,181,627 1.26
USD 295,284 Arran Residential Mortgages Funding Plc
'2010-1A A1C' '144A' FRN 16/5/2047 294,995 0.17
EUR 332,141 Arran Residential Mortgages Funding Plc
'2007-3X A2C' FRN 16/9/2056 475,161 0.27
GBP 501,985 Arran Residential Mortgages Funding Plc
'2007-3X A2A' FRN 16/9/2056 811,485 0.47
EUR 243,483 Arran Residential Mortgages Funding Plc
'2006-2X A2C' FRN 20/9/2056 351,229 0.20
USD 1,495,000 BP Capital Markets Plc 5.25% 7/11/2013 1,616,941 0.93
GBP 219,000 Centre Parcs Mortgage Finance Plc
'2007-1 A2' FRN 10/10/2018 348,438 0.20
EUR 450,000 FCE Bank Plc 7.125% 16/1/2012 655,371 0.38
USD 368,020 GE Capital Commercial Mortgage Corp
'2005-C1 A2' 4.353% 10/6/2048 367,790 0.21
EUR 193,333 Holmes Master Issuer Plc '2007-2X 3A2'
FRN 15/7/2021 278,673 0.16
GBP 108,333 Holmes Master Issuer Plc '2007-2X 3A3'
FRN 15/7/2021 176,428 0.10
USD 141,667 Holmes Master Issuer Plc '2007-2A 3A1'
FRN 15/7/2021 141,441 0.08
GBP 550,000 Permanent Financing Plc FRN 10/9/2032 895,488 0.52
GBP 1,430,000 Permanent Master Issuer Plc '2008-2 1A'
FRN 15/4/2014 2,326,869 1.34
GBP 1,230,000 Permanent Master Issuer Plc '2006-1 6A1'
FRN 15/4/2020 1,960,790 1.13
GBP 613,193 Titan Europe Plc/Ireland '2006-4FSX A1'
FRN 3/9/2014 935,831 0.54
GBP 596,481 Turbo Finance '2011-1 A' FRN 20/1/2019 974,458 0.56
GBP 270,000 Unique Pub Finance Co Plc/The Series M
7.395% 28/3/2024 275,364 0.16
GBP 334,000 Virgin Media Secured Finance Plc 7%
15/1/2018 568,944 0.33
USD 300,000 XL Capital Finance Europe Plc 6.5%
15/1/2012 305,667 0.18
15,942,990 9.19
Transferable Securities Admitted to an Official Stock Exchange Listing or Dealt in on Another Regulated Market
Holding Description Value (USD) %
Transferable Securities Admitted to an Official Stock Exchange Listing or Dealt in on Another Regulated Market
Holding Description Value (USD) %
Portfolio of Investments 31 August 2011

222 BlackRock Global Funds (BGF)
US Dollar Short Duration Bond Fund continued
United States USD 1,510,000 Agilent Technologies Inc 4.45%
14/9/2012 1,559,594 0.90
USD 750,000 Airgas Inc 2.85% 1/10/2013 771,716 0.44
USD 200,000 Ally Financial Inc 8.3% 12/2/2015 205,500 0.12
USD 850,000 American Airlines Inc 10.5% 15/10/2012 876,562 0.51
USD 375,000 American Express Credit Corp Series C
7.3% 20/8/2013 413,121 0.24
USD 1,070,000 American International Group Inc 3.65%
15/1/2014 1,062,653 0.61
USD 263,498 AmeriCredit Automobile Receivables Trust
'2007-AX A4' FRN 6/10/2013 262,632 0.15
USD 461,857 AmeriCredit Automobile Receivables Trust
'2010-1 A3' 0% 17/3/2014 463,225 0.27
USD 440,000 AmeriCredit Automobile Receivables Trust
'2011-2 B' 2.33% 8/3/2016 444,074 0.26
USD 330,000 AmeriCredit Automobile Receivables Trust
'2010-B A3' 2.49% 6/11/2017 339,498 0.20
USD 100,000 Amsouth Bank/Birmingham AL 5.2%
1/4/2015 94,000 0.05
USD 325,000 Anadarko Petroleum Corp 5.95% 15/9/2016 362,961 0.21
USD 158,000 Analog Devices Inc 5% 1/7/2014 175,348 0.10
USD 1,767,000 Anheuser-Busch Cos Inc 4.375%
15/1/2013 1,846,291 1.06
USD 725,000 Arkle Master Issuer Plc '2010-1A 2A'
'144A' FRN 17/5/2060 722,370 0.42
USD 1,016,804 Arran Residential Mortgages Funding Plc
'2007-3A A2B' '144A' FRN 16/9/2056 1,007,154 0.58
USD 273,918 Arran Residential Mortgages Funding Plc
'2006-2X A2B' FRN 20/9/2056 273,614 0.16
USD 447,399 Arran Residential Mortgages Funding Plc
'2006-2A A2B' '144A' FRN 20/9/2056 447,109 0.26
USD 119,000 AvalonBay Communities Inc 6.125%
1/11/2012 125,292 0.07
USD 403,551 Banc of America Merrill Lynch Commercial
Mortgage Inc '2007-3 A2' FRN 10/6/2049 410,737 0.24
USD 170,877 Banc of America Mortgage Securities Inc
'2003-J 2A1' FRN 25/11/2033 160,169 0.09
USD 109,697 Banc of America Mortgage Securities Inc
'2004-A 2A2' FRN 25/2/2034 91,646 0.05
USD 192,729 Bank of America Auto Trust '2009-1A A3'
'144A' 0% 15/7/2013 193,734 0.11
USD 345,000 Bank of America Corp 4.875% 15/9/2012 350,691 0.20
USD 450,000 BCAP LLC Trust '2010-RR6 9A6' '144A'
FRN 26/7/2037 391,500 0.23
USD 102,607 Bear Stearns Alt-A Trust '2004-13 A1' FRN
25/11/2034 90,521 0.05
USD 643,368 Bear Stearns Asset Backed Securities Trust
'2007-HE1 21A1' FRN 25/1/2037 595,251 0.34
USD 112,096 Bear Stearns Asset Backed Securities Trust
'2007-HE3 1A1' FRN 25/4/2037 108,597 0.06
USD 212,673 Bear Stearns Commercial Mortgage
Securities '2004-T16 A4' 4.32%
13/2/2046 212,504 0.12
USD 370,000 Best Buy Co Inc 3.75% 15/3/2016 373,750 0.22
USD 547,332 BNC Mortgage Loan Trust '2006-2 A3' FRN
25/11/2036 517,975 0.30
USD 400,778 BNC Mortgage Loan Trust '2007-3 A2' FRN
25/7/2037 346,208 0.20
USD 605,000 Broadcom Corp '144A' 1.5% 1/11/2013 608,417 0.35
USD 1,420,000 Brocade Communications Systems Inc
6.625% 15/1/2018 1,437,750 0.83
USD 135,000 Burlington Northern Santa Fe LLC 7%
1/2/2014 154,157 0.09
USD 303,631 Capital One Auto Finance Trust '2007-B A4'
FRN 15/4/2014 302,697 0.17
USD 484,000 Capital One Financial Corp 3.15% 15/7/2016 481,695 0.28
USD 1,100,000 Capital One Financial Corp 6.25%
15/11/2013 1,192,211 0.69
USD 1,020,000 CareFusion Corp 4.125% 1/8/2012 1,048,054 0.60
USD 304,702 Carrington Mortgage Loan Trust
'2006-NC5 A1' FRN 25/1/2037 300,212 0.17
USD 215,000 CCH II LLC / CCH II Capital Corp 13.5%
30/11/2016 248,862 0.14
USD 305,000 CenterPoint Energy Inc Series B 6.85%
1/6/2015 357,460 0.21
USD 610,000 CenturyLink Inc 5.5% 1/4/2013 633,045 0.36
USD 410,000 Charter Communications Operating LLC /
Charter Communications Operating Capital
'144A' 8% 30/4/2012 422,300 0.24
USD 172,439 Chrysler Financial Auto Securitization Trust
'2009-A A3' 2.82% 15/1/2016 174,227 0.10
USD 900,000 CIT Group Inc '144A' 5.25% 1/4/2014 873,000 0.50
USD 2,470,000 Citibank Omni Master Trust '2009-A8 A8'
'144A' FRN 16/5/2016 2,495,197 1.44
USD 370,000 Citibank Omni Master Trust '2009-A17 A17'
'144A' 4.9% 15/11/2018 404,494 0.23
USD 594,237 Citicorp Mortgage Securities Inc
'2006-2 1A7' 5.75% 25/4/2036 591,746 0.34
USD 980,000 Citigroup Inc 5.5% 11/4/2013 1,020,477 0.59
USD 315,000 Citigroup/Deutsche Bank Commercial
Mortgage Trust '2007-CD4 A2B' 5.205%
11/12/2049 318,158 0.18
USD 300,000 City National Corp/CA 5.125% 15/2/2013 310,587 0.18
USD 440,000 Clear Channel Worldwide Holdings Inc
Series B 9.25% 15/12/2017 468,600 0.27
USD 600,000 Comcast Corp 5.9% 15/3/2016 695,455 0.40
USD 18,065 Commercial Mortgage Pass Through
Certificates '2001-J2A A2' '144A' 0%
16/7/2034 18,032 0.01
USD 448,000 Constellation Energy Group Inc 4.55%
15/6/2015 479,189 0.28
USD 360,000 Continental Airlines Inc '144A' 6.75%
15/9/2015 352,350 0.20
USD 490,000 Continental Resources Inc/OK 8.25%
1/10/2019 529,200 0.30
USD 520,373 Countrywide Asset-Backed Certificates
'2005-17 1AF2' FRN 25/5/2036 428,647 0.25
USD 139,794 Countrywide Asset-Backed Certificates
'2006-13 1AF2' 0% 25/1/2037 127,809 0.07
USD 527,897 Countrywide Asset-Backed Certificates
'2007-12 2A1' FRN 25/8/2047 487,341 0.28
USD 960,000 Countrywide Asset-Backed Certificates
'2007-7 2A2' FRN 25/10/2047 757,632 0.44
USD 601,889 Countrywide Home Loan Mortgage
Pass Through Trust '2005-HYB8 2A1'
FRN 20/12/2035 418,382 0.24
USD 500,000 COX Communications Inc 5.45%
15/12/2014 557,926 0.32
USD 500,000 Crown Castle Towers LLC '144A' 3.214%
15/8/2015 513,307 0.30
USD 660,000 Crown Castle Towers LLC '144A' 4.523%
15/1/2015 699,671 0.40
USD 620,000 CSX Corp 6.25% 1/4/2015 721,668 0.42
USD 363,990 Daimler Chrysler Auto Trust '2007-A A4'
5.28% 8/3/2013 368,112 0.21
USD 870,775 DBUBS Mortgage Trust '2011-LC1A A1'
'144A' 3.742% 10/11/2046 889,375 0.51
USD 510,000 Delta Air Lines 2002-1 Class G-2
Pass Through Trust 6.417% 2/7/2012 519,563 0.30
USD 750,000 DIRECTV Holdings LLC / DIRECTV
Financing Co Inc 3.125% 15/2/2016 772,633 0.45
Transferable Securities Admitted to an Official Stock Exchange Listing or Dealt in on Another Regulated Market
Holding Description Value (USD) %
Transferable Securities Admitted to an Official Stock Exchange Listing or Dealt in on Another Regulated Market
Holding Description Value (USD) %
Portfolio of Investments 31 August 2011

Audited Annual Report and Accounts 223
The notes on pages 261 to 270 form an integral part of these financial statements.
US Dollar Short Duration Bond Fund continued
USD 800,000 DIRECTV Holdings LLC / DIRECTV
Financing Co Inc 7.625% 15/5/2016 858,849 0.49
USD 850,000 DISH DBS Corp '144A' 7.75% 31/5/2015 892,500 0.51
USD 830,000 Dollar General Corp 11.875% 15/7/2017 923,375 0.53
USD 520,000 Domtar Corp 7.125% 15/8/2015 572,000 0.33
USD 815,000 Duke Energy Ohio Inc 5.7% 15/9/2012 854,971 0.49
USD 1,100,000 Enterprise Products Operating LLC 4.6%
1/8/2012 1,136,520 0.65
USD 354,000 Enterprise Products Operating LLC 6.125%
1/2/2013 376,588 0.22
USD 250,000 Enterprise Products Operating LLC Series C
6.375% 1/2/2013 266,604 0.15
USD 1,449,636 Extended Stay America Trust '2010-ESHA A'
'144A' 2.951% 5/11/2027 1,429,123 0.82
USD 164,528 Fannie Mae Pool '255316' 5% 1/7/2019 178,360 0.10
USD 7,590,000 Fannie Mae Pool '3.5 9/11' 3.5% TBA 7,924,434 4.57
USD 860,243 Fannie Mae Pool '650201' 5% 1/12/2017 932,565 0.54
USD 182,416 Fannie Mae Pool '745500' 5.5% 1/12/2018 198,421 0.11
USD 912,605 Fannie Mae Pool '890083' 5% 1/12/2021 989,329 0.57
USD 626,176 Fannie Mae Pool 'AD0454' 5% 1/11/2021 678,820 0.39
USD 180,204 Fannie Mae Pool 'AD5102' 3.5% 1/12/2025 188,442 0.11
USD 1,904,523 Fannie Mae Pool 'AE0812' 5% 1/7/2025 2,064,639 1.19
USD 3,101,114 Fannie Mae Pool 'AE0968' 4% 1/7/2019 3,306,848 1.91
USD 206,330 Fannie Mae Pool 'AE2913' 3.5% 1/12/2025 215,763 0.12
USD 246,404 Fannie Mae Pool 'AH0330' 3.5% 1/12/2025 257,669 0.15
USD 793,388 Fannie Mae Pool 'AH0376' 3.5% 1/12/2025 829,659 0.48
USD 214,498 Fannie Mae Pool 'AH1892' 3.5% 1/2/2026 224,371 0.13
USD 87,273 Fannie Mae Pool 'AH1900' 3.5% 1/3/2026 91,290 0.05
USD 700,823 Fannie Mae Pool 'AH4053' 3.5% 1/1/2026 732,862 0.42
USD 26,337 Fannie Mae Pool 'AH4088' 3.5% 1/2/2026 27,541 0.02
USD 52,788 Fannie Mae Pool 'AH4511' 3.5% 1/1/2026 55,202 0.03
USD 706,422 Fannie Mae Pool 'AH4526' 3.5% 1/2/2026 738,717 0.43
USD 759,082 Fannie Mae Pool 'AH8374' 3.5% 1/3/2026 793,784 0.46
USD 500,000 Fannie Mae Pool 'AJ0189' 3.5% 1/8/2026 523,015 0.30
USD 26,421 Fannie Mae Pool 'MA0669' 3.5% 1/3/2026 27,629 0.02
USD 601,265 Fannie Mae REMICS '29 CA' '2008-29 CA'
4.5% 25/9/2035 639,591 0.37
USD 210,749 Fannie Mae REMICS '22 DA' '2006-22 DA'
5.5% 25/6/2033 216,550 0.12
USD 371,339 Fannie Mae REMICS '68 PC' '2005-68 PC'
5.5% 25/7/2035 405,243 0.23
USD 4,690,437 Fannie Mae REMICS '126 UI' '2010-126 UI'
5.5% 25/10/2040 745,000 0.43
USD 368,464 Fannie Mae-Aces '2006-M2 A1A' FRN
25/8/2016 388,841 0.22
USD 465,000 Ford Credit Auto Owner Trust '2009-D A4'
2.98% 15/8/2014 479,030 0.28
USD 90,172 Ford Credit Auto Owner Trust '2009-A A3A'
3.96% 15/5/2013 90,830 0.05
USD 380,000 Ford Credit Floorplan Master Owner Trust
'2010-1 A' '144A' FRN 15/12/2014 386,004 0.22
USD 1,076,000 Freeport-McMoRan Copper & Gold Inc
8.375% 1/4/2017 1,162,033 0.67
USD 348,534 GCO Slims Trust '2006-1A NOTE' '144A'
5.72% 1/3/2022 277,433 0.16
USD 200,416 GE Capital Commercial Mortgage Corp
'2001-3 A2' 6.07% 10/6/2038 200,304 0.12
USD 1,043,000 General Electric Capital Corp 2.8%
8/1/2013 1,063,687 0.61
USD 450,000 Georgia-Pacific LLC '144A' 8.25% 1/5/2016 513,771 0.30
USD 610,000 Government National Mortgage
Association '2006-3 B' FRN 16/1/2037 663,137 0.38
USD 492,437 Government National Mortgage
Association '2006-6 C' FRN 16/2/2044 531,584 0.31
USD 330,000 Great Plains Energy Inc 2.75% 15/8/2013 337,700 0.19
USD 227,619 GS Mortgage Securities Corp II '2000-1A A'
'144A' FRN 20/6/2024 178,424 0.10
USD 430,000 HCP Inc 2.7% 1/2/2014 427,881 0.25
USD 2,670,000 Holmes Master Issuer Plc '2007-2A 4A'
FRN 15/7/2020 2,638,531 1.52
USD 113,333 Holmes Master Issuer Plc '2007-2X 3A1'
FRN 15/7/2021 113,118 0.07
USD 738,065 Homebanc Mortgage Trust '2005-3 A1'
FRN 25/7/2035 533,103 0.31
USD 765,000 HSBC Bank USA NA/New York NY 4.625%
1/4/2014 789,815 0.46
USD 870,000 Interpublic Group of Cos Inc/The 6.25%
15/11/2014 946,125 0.55
USD 285,000 Interpublic Group of Cos Inc/The 10%
15/7/2017 329,175 0.19
USD 1,053,000 Jabil Circuit Inc 7.75% 15/7/2016 1,153,035 0.66
USD 560,000 JP Morgan Chase Commercial Mortgage
Securities Corp '2007-LD11 ASB' FRN
15/6/2049 593,466 0.34
USD 920,000 JP Morgan Chase Commercial Mortgage
Securities Corp '2002-C2 A2' 5.05%
12/12/2034 949,816 0.55
USD 204,508 JP Morgan Chase Commercial Mortgage
Securities Corp '2001-CIB3 A3' 6.465%
15/11/2035 204,790 0.12
USD 110,000 Kraft Foods Inc 6.25% 1/6/2012 114,564 0.07
USD 810,000 LB-UBS Commercial Mortgage Trust
'2007-C6 A4' FRN 15/7/2040 863,240 0.50
USD 550,000 Life Technologies Corp 3.375% 1/3/2013 565,627 0.33
USD 940,000 Lincoln National Corp 4.3% 15/6/2015 993,541 0.57
USD 40,734 Mastr Asset Backed Securities Trust
'2007-HE1 A1' FRN 25/5/2037 38,660 0.02
USD 485,000 Maxim Integrated Products Inc 3.45%
14/6/2013 501,728 0.29
EUR 295,000 MBNA Credit Card Master Note Trust
'2004-A9 A9' FRN 20/2/2014 425,938 0.25
USD 960,000 Merrill Lynch Mortgage Trust
'2003-KEY1 A4' FRN 12/11/2035 1,020,392 0.59
USD 710,000 MetLife Inc 6.75% 1/6/2016 828,450 0.48
USD 150,000 Metropolitan Life Global Funding I '144A'
2.875% 17/9/2012 152,337 0.09
USD 1,245,000 Metropolitan Life Global Funding I '144A'
5.125% 10/4/2013 1,315,979 0.76
USD 650,000 MGM Resorts International 13%
15/11/2013 749,125 0.43
USD 1,027,102 Morgan Stanley Reremic Trust 'IO A'
'2011-IO A' '144A' 2.5% 23/3/2051 1,021,966 0.59
USD 725,000 National Semiconductor Corp 6.15%
15/6/2012 748,717 0.43
USD 850,000 NBCUniversal Media LLC 2.1% 1/4/2014 867,151 0.50
USD 1,358,969 Nelnet Student Loan Trust '2005-1 A4' FRN
26/10/2020 1,344,499 0.77
USD 690,000 Newell Rubbermaid Inc 5.5% 15/4/2013 732,697 0.42
USD 275,000 North Fork Bancorporation Inc 5.875%
15/8/2012 285,052 0.16
USD 363,675 Opteum Mortgage Acceptance Corp
'2005-4 1A1B' FRN 25/11/2035 314,318 0.18
USD 225,000 ProLogis LP 5.75% 1/4/2016 244,456 0.14
USD 190,000 ProLogis LP 6.25% 15/3/2017 208,999 0.12
USD 885,000 Prudential Financial Inc 2.75% 14/1/2013 896,503 0.52
USD 446,000 Qwest Communications International Inc
8% 1/10/2015 474,433 0.27
USD 55,000 Qwest Corp FRN 15/6/2013 54,725 0.03
USD 790,000 Qwest Corp 8.875% 15/3/2012 813,700 0.47
USD 1,503,000 Regions Financial Corp 4.875% 26/4/2013 1,458,477 0.84
Transferable Securities Admitted to an Official Stock Exchange Listing or Dealt in on Another Regulated Market
Holding Description Value (USD) %
Transferable Securities Admitted to an Official Stock Exchange Listing or Dealt in on Another Regulated Market
Holding Description Value (USD) %
Portfolio of Investments 31 August 2011

224 BlackRock Global Funds (BGF)
US Dollar Short Duration Bond Fund continued
USD 912,140 Residential Asset Mortgage Products Inc
'2003-RZ3 A6' 3.4% 25/3/2033 899,216 0.52
USD 280,226 Residential Asset Securitization Trust
'2005-A5 A12' FRN 25/5/2035 238,265 0.14
USD 425,000 Rockies Express Pipeline LLC '144A' 6.25%
15/7/2013 455,037 0.26
USD 400,000 Rouse Co LP / TRC Co-Issuer Inc '144A'
6.75% 1/5/2013 409,500 0.24
USD 430,000 Rouse Co LP/The 7.2% 15/9/2012 446,125 0.26
USD 1,520,000 Santander Consumer Acquired Receivables
Trust '2011-WO A3' '144A' 1.4%
15/10/2014 1,528,415 0.88
USD 669,458 Santander Consumer Acquired Receivables
Trust '2011-S1A B' '144A' 1.66%
15/8/2016 665,797 0.38
USD 602,841 Santander Consumer Acquired Receivables
Trust '2011-S1A C' '144A' 2.01%
15/8/2016 598,862 0.34
USD 603,648 Santander Drive Auto Receivables Trust
'2010-B A2' '144A' 1.01% 15/7/2013 604,099 0.35
USD 505,129 Santander Drive Auto Receivables Trust
'2010-A A2' '144A' 1.37% 15/8/2013 506,222 0.29
USD 314,260 Santander Drive Auto Receivables Trust
'2011-S2A B' '144A' 2.06% 15/6/2017 313,671 0.18
USD 1,385,000 Santander Drive Auto Receivables Trust
'2010-2 B' 2.24% 15/12/2014 1,391,014 0.80
USD 322,794 Santander Drive Auto Receivables Trust
'2011-S2A C' '144A' 2.86% 15/6/2017 322,290 0.19
USD 454,988 Santander Drive Auto Receivables Trust
'2011-S2A D' '144A' 3.35% 15/6/2017 453,623 0.26
USD 805,000 Santander Drive Auto Receivables Trust
'2010-2 C' 3.89% 17/7/2017 825,377 0.48
USD 380,000 SBA Tower Trust '144A' 4.254% 15/4/2015 404,082 0.23
USD 76,000 Sheraton Holding Corp 7.375% 15/11/2015 83,980 0.05
USD 626,173 SLC Student Loan Trust '2006-A A4' FRN
15/1/2019 613,019 0.35
USD 860,000 SLM Corp 5.125% 27/8/2012 864,335 0.50
USD 796,669 SLM Student Loan Trust '2010-C A1' '144A'
FRN 15/12/2017 799,529 0.46
USD 1,450,000 SLM Student Loan Trust '2008-5 A3' FRN
25/1/2018 1,480,582 0.85
USD 1,022,340 SLM Student Loan Trust '2004-B A2' FRN
15/6/2021 993,466 0.57
USD 703,090 SLM Student Loan Trust '2003-B A2' FRN
15/3/2022 683,868 0.39
USD 464,379 SLM Student Loan Trust '2010-1 A' FRN
25/3/2025 462,406 0.27
USD 290,730 SLM Student Loan Trust '144A' 0%
15/7/2042 273,942 0.16
USD 677,266 Soundview Home Equity Loan Trust
'2003-2 A2' FRN 25/11/2033 592,484 0.34
USD 340,000 Southeast Supply Header LLC '144A'
4.85% 15/8/2014 365,498 0.21
USD 640,000 Southwest Airlines Co '144A' 10.5%
15/12/2011 655,534 0.38
USD 704,000 Starwood Hotels & Resorts Worldwide Inc
7.875% 15/10/2014 777,920 0.45
USD 170,000 State of California 3.95% 1/11/2015 182,262 0.10
USD 195,000 State of California 5.1% 1/8/2014 206,187 0.12
USD 390,000 State of California 5.65% 1/4/2039 414,297 0.24
USD 935,000 State of Illinois 2.766% 1/1/2012 941,017 0.54
USD 215,000 State of Illinois 4.071% 1/1/2014 222,842 0.13
USD 400,000 Steel Dynamics Inc 7.375% 1/11/2012 411,000 0.24
USD 351,692 Structured Asset Securities Corp
'2006-BC6 A2' FRN 25/1/2037 344,571 0.20
USD 160,000 Temple-Inland Inc 7.875% 1/5/2012 166,663 0.10
USD 198,098 Thornburg Mortgage Securities Trust
'2007-2 A2A' FRN 25/6/2037 191,996 0.11
USD 736,068 Thornburg Mortgage Securities Trust
'2006-6 A1' FRN 25/11/2046 725,163 0.42
USD 212,761 TIAA Seasoned Commercial Mortgage
Trust '2007-C4 A1' FRN 15/8/2039 212,832 0.12
USD 830,000 Time Warner Cable Inc 6.2% 1/7/2013 903,440 0.52
USD 420,000 Time Warner Cable Inc 7.5% 1/4/2014 480,295 0.28
USD 663,658 UAL 2009-1 Pass Through Trust 10.4%
1/11/2016 726,706 0.42
USD 622,539 UAL 2009-2A Pass Through Trust 9.75%
15/1/2017 706,582 0.41
USD 920,000 Union Pacific Corp 5.45% 31/1/2013 980,010 0.56
USD 491,040 United Air Lines Inc 12.75% 15/7/2012 514,364 0.30
USD 3,000,000 United States Treasury Note/Bond 0.125%
31/8/2013 2,996,016 1.73
USD 1,750,000 United States Treasury Note/Bond 0.375%
31/7/2013 1,756,221 1.01
USD 8,310,000 United States Treasury Note/Bond 0.5%
15/8/2014 8,357,068 4.82
USD 2,535,000 United States Treasury Note/Bond 1.5%
31/7/2016 2,609,763 1.50
USD 1,180,000 Ventas Realty LP / Ventas Capital Corp
3.125% 30/11/2015 1,193,511 0.69
USD 1,310,000 Verizon Communications Inc 5.25%
15/4/2013 1,399,591 0.81
USD 480,000 Wachovia Bank Commercial Mortgage
Trust '2007-C33 A4' FRN 15/2/2051 509,790 0.29
USD 12,574 Wachovia Bank Commercial Mortgage
Trust '2003-C3 A1' 4.037% 15/2/2035 12,559 0.01
USD 625,000 WM Wrigley Jr Co '144A' 2.45% 28/6/2012 625,291 0.36
USD 680,000 Wyndham Worldwide Corp 9.875%
1/5/2014 799,695 0.46
148,056,706 85.32
Total Bonds 182,396,297 105.10
Total Transferable Securities Admitted
to an Official Stock Exchange Listing or
Dealt in on Another Regulated Market 182,396,297 105.10
Unquoted Securities
BONDS
United States USD 465,000 Novus USA Trust 2010-1 '144A' FRN
18/11/2011 459,536 0.27
Total Bonds 459,536 0.27
Total Unquoted Securities 459,536 0.27
Total Portfolio 182,855,832 105.37
Other Net Liabilities (9,314,441) (5.37)
Total Net Assets (USD) 173,541,391 100.00
Portfolio of Investments 31 August 2011
Transferable Securities Admitted to an Official Stock Exchange Listing or Dealt in on Another Regulated Market
Holding Description Value (USD) %
Transferable Securities Admitted to an Official Stock Exchange Listing or Dealt in on Another Regulated Market
Holding Description Value (USD) %

Audited Annual Report and Accounts 225
The notes on pages 261 to 270 form an integral part of these financial statements.
US Dollar Short Duration Bond Fund continued
Note: The total market value of USD (9,809) of these transactions is included in the Statement of Net Assets (see Note 2c).
Nominal Value Description
Unrealisedprofit/(loss)
USD
Nominal Value Description
Unrealisedprofit/(loss)
USD
Swaps as at 31 August 2011
USD (1,500,000) Credit Default Swaps (Deutsche Bank) (Fund provides
default protection on Aviva Plc; and receives Fixed
1%) (25/5/2012) 11,596
USD 3,400,000 Interest Rate Swaps (Deutsche Bank) (Fund receives
Floating USD LIBOR 3 Month; and pays Fixed
0.625%) (26/11/2012) (7,745)
USD 9,100,000 Interest Rate Swaps (Deutsche Bank) (Fund receives
Floating USD LIBOR 3 Month; and pays Fixed
0.78125%) (1/12/2012) (38,639)
USD 500,000 Credit Default Swaps (Credit Suisse) (Fund receives
default protection on Hershey Company 6.95%
15/8/2012; and pays Fixed 1% ) (20/12/2014) (8,281)
USD 575,000 Credit Default Swaps (Citibank) (Fund receives default
protection on Whirlpool Corp 7.75% 15/7/2016; and
pays Fixed 1%) (20/3/2016) 14,037
USD 2,500,000 Credit Default Swaps (Morgan Stanley) (Fund receives
default protection on CDX.NA.HY.16-V1; and pays
Fixed 1%) (20/6/2016) 30,354
1,322
Open Forward Foreign Exchange Transactionsas at 31 August 2011
Purchases Sales
Unrealisedprofit/(loss)
USDValue date
Core Fund
GBP 1,033,000 USD 1,668,111 7/10/2011 16,805
USD 13,099,276 GBP 8,042,000 7/10/2011 (17,950)
EUR 830,000 USD 1,195,953 26/10/2011 1,939
USD 5,483,405 EUR 3,825,000 26/10/2011 (37,000)
Net unrealised loss (36,206)
Note: The net unrealised loss attributed to these transactions is included in the Statement
of Net Assets (see Note 2c).
Open Futures Contractsas at 31 August 2011
Numberof contracts Contract/Description
Expirationdate
ValueUSD
1 90 Day Euro $ Future September 2011 249,094
199 US Treasury 2 Year Note (CBT) December 2011 43,885,719
1 90 Day Euro $ Future December 2011 248,813
(77) US Treasury 5 Year Note (CBT) December 2011 (9,449,946)
(1) 90 Day Euro $ Future March 2012 (248,813)
1 90 Day Euro $ Future June 2012 248,850
1 90 Day Euro $ Future September 2012 248,838
(1) 90 Day Euro $ Future March 2013 (248,713)
1 90 Day Euro $ Future June 2013 248,538
1 90 Day Euro $ Future December 2013 247,812
1 90 Day Euro $ Future March 2014 247,350
Total commitment 35,677,542
Note: The net unrealised gain of USD 15,284 attributed to these transactions is included
in the Statement of Net Assets (see Note 2c).
Swaptions as at 31 August 2011
Nominal
Value Description
UnrealisedlossUSD
ValueUSD
USD 2,500,000 Fund purchases a put option (expiring
21/12/2011) to enter into an Interest Rate
Swap (Morgan Stanley Capital Services
Inc). If exercised Fund receives 1.2% Fixed
semi-annually from 23/6/2012; and pays
Floating US$ Libor 3-month-BBA quarterly
from 23/3/2012; 21/12/2011) (14,419) (24,169)
(14,419) (24,169)
Note: Swaptions are included in the Statement of Net Assets (see Note 2c).

226 BlackRock Global Funds (BGF)
COMMON STOCKS (SHARES)
Cayman Islands 280,000 Herbalife Ltd 15,996,400 1.08
Ireland 990,000 Seagate Technology Plc 11,592,900 0.79
Netherlands 90,000 Chicago Bridge & Iron Co NV (NY Shares) 3,256,200 0.22
450,000 LyondellBasell Industries NV 'A' 15,723,000 1.06
18,979,200 1.28
United States 1,310,000 Activision Blizzard Inc 15,549,700 1.05
1,450,000 AES Corp/The 15,689,000 1.06
410,000 Aetna Inc 16,810,000 1.14
320,000 AGCO Corp 14,147,200 0.96
370,000 Agilent Technologies Inc 13,908,300 0.94
1,150,000 Alcoa Inc 14,789,000 1.00
450,000 Altera Corp 16,569,000 1.12
130,000 AMERIGROUP Corp 6,457,100 0.44
400,000 AmerisourceBergen Corp 'A' 15,960,000 1.08
360,000 Amgen Inc 19,956,600 1.35
330,000 Apollo Group Inc 'A' 15,551,976 1.05
70,000 Apple Inc 27,281,800 1.84
1,420,000 Applied Materials Inc 16,344,200 1.11
210,000 AT&T Inc 6,266,400 0.42
440,000 Autodesk Inc 12,504,800 0.85
290,000 Baxter International Inc 16,332,800 1.10
170,000 Biogen Idec Inc 16,000,400 1.08
680,000 Bristol-Myers Squibb Co 20,121,200 1.36
300,000 Cadence Design Systems Inc 2,802,000 0.19
190,000 Capital One Financial Corp 8,779,900 0.59
370,000 Cardinal Health Inc 15,880,400 1.07
660,000 CBS Corp 'B' 16,869,600 1.14
100,000 Chevron Corp 9,942,000 0.67
340,000 CIGNA Corp 16,320,000 1.10
160,000 Coach Inc 9,064,000 0.61
30,000 Coca-Cola Co 2,109,300 0.14
540,000 Coca-Cola Enterprises Inc 14,882,400 1.01
80,000 ConocoPhillips 5,477,600 0.37
1,030,000 Corning Inc 15,532,400 1.05
770,000 Cypress Semiconductor Corp 12,581,800 0.85
1,190,000 Dell Inc 17,790,500 1.20
620,000 Discover Financial Services 15,723,200 1.06
360,000 DISH Network Corp 'A' 8,539,200 0.58
210,000 Dollar Tree Inc 15,283,800 1.03
110,000 Domtar Corp 8,945,200 0.61
380,000 Dr Pepper Snapple Group Inc 14,614,800 0.99
520,000 Eli Lilly & Co 19,500,000 1.32
530,000 Expedia Inc 16,117,300 1.09
400,000 Exxon Mobil Corp 29,880,000 2.02
260,000 Fluor Corp 16,049,800 1.09
660,000 Foot Locker Inc 14,084,400 0.95
460,000 Forest Laboratories Inc 15,888,400 1.07
610,000 Fortinet Inc 11,651,000 0.79
640,000 GameStop Corp 'A' 15,104,000 1.02
560,000 General Electric Co 9,206,400 0.62
1,070,000 H&R Block Inc 16,317,500 1.10
240,000 Helmerich & Payne Inc 13,869,600 0.94
210,000 HollyFrontier Corp 15,292,200 1.03
740,000 Huntsman Corp 9,982,600 0.68
60,000 International Business Machines Corp 10,321,200 0.70
510,000 International Paper Co 13,933,200 0.94
1,680,000 Interpublic Group of Cos Inc/The 14,767,200 1.00
200,000 ITT Educational Services Inc 14,578,000 0.99
100,000 Johnson & Johnson 6,603,000 0.45
80,000 JPMorgan Chase & Co 3,022,400 0.20
690,000 Kroger Co 16,111,500 1.09
380,000 Lam Research Corp 14,360,200 0.97
130,000 Leucadia National Corp 3,887,000 0.26
390,000 Lexmark International Inc 'A' 12,441,000 0.84
260,000 Lincare Holdings Inc 5,722,600 0.39
680,000 LSI Corp 4,637,600 0.31
380,000 Ltd Brands Inc 14,535,000 0.98
540,000 Manitowoc Co Inc/The 6,269,400 0.42
630,000 Marathon Oil Corp 17,022,600 1.15
660,000 Maxim Integrated Products Inc 15,384,600 1.04
210,000 McKesson Corp 16,793,700 1.14
1,350,000 MetroPCS Communications Inc 15,336,000 1.04
1,430,000 Microsoft Corp 37,833,510 2.56
90,000 Moody's Corp 2,814,300 0.19
390,000 Motorola Solutions Inc 16,563,300 1.12
270,000 Murphy Oil Corp 14,571,900 0.99
650,000 NASDAQ OMX Group Inc/The 15,470,000 1.05
480,000 Novellus Systems Inc 13,492,800 0.91
670,000 NRG Energy Inc 15,436,800 1.04
1,200,000 NVIDIA Corp 16,428,000 1.11
360,000 PetSmart Inc 15,490,800 1.05
1,660,000 Pfizer Inc 31,672,800 2.14
170,000 Pharmaceutical Product Development Inc 5,349,050 0.36
390,000 Philip Morris International Inc 27,417,000 1.85
130,000 Polaris Industries Inc 14,645,800 0.99
460,000 Principal Financial Group Inc 11,748,400 0.79
100,000 Procter & Gamble Co 6,373,000 0.43
430,000 Rackspace Hosting Inc 16,082,000 1.09
720,000 Safeway Inc 13,248,000 0.90
260,000 Sealed Air Corp 4,773,600 0.32
140,000 SEI Investments Co 2,419,200 0.16
1,630,000 Southwest Airlines Co 14,213,600 0.96
4,180,000 Sprint Nextel Corp 15,131,600 1.02
950,000 Symantec Corp 16,340,950 1.10
680,000 TD Ameritrade Holding Corp 10,546,800 0.71
80,000 Tempur-Pedic International Inc 4,766,400 0.32
2,760,000 Tenet Healthcare Corp 15,235,200 1.03
1,220,000 Teradyne Inc 15,128,000 1.02
670,000 Tesoro Corp 16,528,900 1.12
600,000 TIBCO Software Inc 13,590,000 0.92
330,000 TRW Automotive Holdings Corp 14,199,900 0.96
430,000 UnitedHealth Group Inc 20,807,700 1.41
770,000 Valero Energy Corp 17,494,400 1.18
360,000 Vishay Intertechnology Inc 4,244,400 0.29
270,000 WellPoint Inc 17,498,700 1.18
450,000 Western Digital Corp 13,387,500 0.91
950,000 Western Union Co 15,789,000 1.07
390,000 Williams-Sonoma Inc 12,959,700 0.88
360,000 Xilinx Inc 11,253,600 0.76
1,430,993,586 96.73
Total Common Stocks (Shares) 1,477,562,086 99.88
Total Transferable Securities Admitted
to an Official Stock Exchange Listing or
Dealt in on Another Regulated Market 1,477,562,086 99.88
US Flexible Equity Fund
Portfolio of Investments 31 August 2011
Transferable Securities Admitted to an Official Stock Exchange Listing or Dealt in on Another Regulated Market
Holding Description Value (USD) %
Transferable Securities Admitted to an Official Stock Exchange Listing or Dealt in on Another Regulated Market
Holding Description Value (USD) %

Audited Annual Report and Accounts 227
The notes on pages 261 to 270 form an integral part of these financial statements.
COMMON STOCKS (SHARES)
United States 28,100 World Access Inc 42 0.00
Total Unquoted Securities 42 0.00
Total Portfolio 1,477,562,128 99.88
Other Net Assets 1,844,456 0.12
Total Net Assets (USD) 1,479,406,584 100.00
Unquoted Securities
Holding Description Value (USD) %
Portfolio of Investments 31 August 2011
US Flexible Equity Fund continued
Sector Breakdownas at 31 August 2011
% of netassets
Information Technology 27.56
Healthcare 21.15
Consumer Discretionary 15.74
Energy 9.47
Consumer Staples 7.49
Financials 5.01
Materials 4.61
Industrials 4.27
Telecommunication Services 2.48
Utilities 2.10
Other Net Assets 0.12
100.00
Open Forward Foreign Exchange Transactionsas at 31 August 2011
Purchases Sales Value date Unrealised
profit/(loss)
Unrealisedprofit/(loss)
USD Equivalent
EUR Hedged Share Class EUR
EUR 160,290,375 USD 228,208,820 14/9/2011 2,243,871 3,240,715
USD 39,161,540 EUR 27,344,819 14/9/2011 (223,412) (322,663)
Net unrealised profit 2,020,459 2,918,052
Total net unrealised profit 2,918,052
Note: The net unrealised profit attributed to these transactions is included in the Statement
of Net Assets (see Note 2c).

228 BlackRock Global Funds (BGF)
US Government Mortgage Fund
BONDS
United States USD 710,059 Ally Auto Receivables Trust '2010-5 A2'
0.8% 15/3/2013 710,514 0.38
USD 506,342 AmeriCredit Automobile Receivables
Trust '2010-4 A2' 0.96% 8/5/2014 506,665 0.27
USD 374,269 AmeriCredit Automobile Receivables
Trust '2010-B A2' 1.18% 6/2/2014 374,811 0.20
USD 221,053 AmeriCredit Automobile Receivables
Trust '2010-2 A2' 1.22% 8/10/2013 221,432 0.12
USD 743,302 Banc of America Merrill Lynch Commercial
Mortgage Inc '2002-PB2 A4' 6.186%
11/6/2035 746,681 0.40
USD 380,898 Bayview Financial Acquisition Trust
'2006-C 2A2' FRN 28/11/2036 358,702 0.19
USD 438,819 Capital Auto Receivables Asset Trust
'2007-4A A4' 5.3% 15/5/2014 445,227 0.24
USD 419,500 Citigroup Mortgage Loan Trust Inc
'2009-11 6A1' '144A' FRN 25/10/2035 400,893 0.22
USD 223,500 Countrywide Alternative Loan Trust
'2004-12CB 1A1' 5% 25/7/2019 228,152 0.12
USD 270,291 Countrywide Alternative Loan Trust
'2004-24CB 2A1' 5% 25/11/2019 270,985 0.15
USD 158,602 Credit Suisse First Boston Mortgage
Securities Corp '2004-1 4A1' 5%
25/2/2019 161,576 0.09
USD 25,385 Fannie Mae Pool '253033' 7% 1/2/2015 27,061 0.01
USD 1,800,000 Fannie Mae Pool '3 10/11' 3% TBA 1,845,281 0.99
USD 16,800,000 Fannie Mae Pool '3.5 9/11' 3.5% TBA 17,540,250 9.42
USD 10,364 Fannie Mae Pool '323970' 7%
1/10/2014 11,049 0.01
USD 7,600,000 Fannie Mae Pool '4 9/11' 4% TBA 7,971,093 4.29
USD 15,300,000 Fannie Mae Pool '4.5 9/11' 4.5% TBA 16,220,702 8.71
USD 18,200,000 Fannie Mae Pool '5 9/11' 5% TBA 19,553,536 10.50
USD (10,300,000) Fannie Mae Pool '5.5 9/11' 5.5% TBA± (11,239,878) (6.04)
USD 1,800,000 Fannie Mae Pool '6 9/11' 6% TBA 1,988,157 1.07
USD 428,377 Fannie Mae Pool '695946' 5.5%
1/5/2018 467,033 0.25
USD 2,290,602 Fannie Mae Pool '725223' 5.5%
1/3/2034 2,520,660 1.35
USD 1,469,093 Fannie Mae Pool '725425' 5.5%
1/4/2034 1,611,179 0.87
USD 2,692,019 Fannie Mae Pool '735649' 6%
1/12/2032 3,011,250 1.62
USD 292,895 Fannie Mae Pool '811570' 5.5% 1/6/2021 320,881 0.17
USD 176,217 Fannie Mae Pool '888596' 6.5%
1/7/2037 197,775 0.11
USD 674,170 Fannie Mae Pool '889109' 5% 1/1/2023 727,899 0.39
USD 801,122 Fannie Mae Pool '889984' 6.5%
1/10/2038 899,127 0.48
USD 278,728 Fannie Mae Pool '952356' 5.5%
1/11/2022 303,037 0.16
USD 100,000 Fannie Mae Pool '970750' 5.5%
1/11/2023 108,721 0.06
USD 720,070 Fannie Mae Pool '995196' 6% 1/7/2038 798,708 0.43
USD 8,638,889 Fannie Mae Pool '995760' 5.5%
1/1/2038 9,505,191 5.11
USD 238,192 Fannie Mae Pool 'AB1535' 4.5%
1/10/2040 254,952 0.14
USD 490,176 Fannie Mae Pool 'AB2461' 4% 1/3/2041 513,331 0.28
USD 1,978,916 Fannie Mae Pool 'AB2641' 4.5%
1/5/2041 2,105,175 1.13
USD 2,160,975 Fannie Mae Pool 'AB2769' 4.5%
1/4/2041 2,298,850 1.23
USD 3,695,767 Fannie Mae Pool 'AD0784' 6% 1/5/2037 4,099,379 2.20
USD 1,563,432 Fannie Mae Pool 'AE0976' 5% 1/2/2041 1,668,801 0.90
USD 1,954,711 Fannie Mae Pool 'AE0994' 4% 1/2/2041 2,047,050 1.10
USD 34,709 Fannie Mae Pool 'AE2161' 4.5% 1/2/2041 37,152 0.02
USD 913,083 Fannie Mae Pool 'AE5266' 4.5% 1/9/2040 967,630 0.52
USD 96,214 Fannie Mae Pool 'AE9722' 4.5%
1/12/2040 102,984 0.05
USD 141,939 Fannie Mae Pool 'AH0053' 4.5% 1/2/2041 151,927 0.08
USD 298,887 Fannie Mae Pool 'AH4305' 4.5% 1/2/2041 319,918 0.17
USD 784,174 Fannie Mae Pool 'AH4477' 4% 1/2/2041 821,218 0.44
USD 223,007 Fannie Mae Pool 'AH4486' 4.5% 1/2/2041 238,699 0.13
USD 226,295 Fannie Mae Pool 'AH5013' 4.5% 1/2/2041 242,219 0.13
USD 1,322,090 Fannie Mae Pool 'AH5579' 4.5%
1/2/2041 1,415,118 0.76
USD 661,754 Fannie Mae Pool 'AH5822' 4.5% 1/2/2041 708,318 0.38
USD 132,212 Fannie Mae Pool 'AH6180' 4.5% 1/2/2041 141,516 0.08
USD 282,455 Fannie Mae Pool 'AH6228' 4.5% 1/3/2041 302,330 0.16
USD 84,075 Fannie Mae Pool 'AH6404' 4.5% 1/2/2041 89,991 0.05
USD 394,483 Fannie Mae Pool 'AH8422' 4.5% 1/4/2041 419,652 0.23
USD 198,762 Fannie Mae Pool 'AH8473' 4.5% 1/4/2041 211,444 0.11
USD 196,785 Fannie Mae Pool 'AH8536' 4.5% 1/3/2041 209,341 0.11
USD 492,905 Fannie Mae Pool 'AH8818' 4.5% 1/3/2041 527,587 0.28
USD 297,888 Fannie Mae Pool 'AH8827' 4.5% 1/3/2041 318,849 0.17
USD 724,386 Fannie Mae Pool 'AH8899' 4.5% 1/3/2041 775,357 0.42
USD 491,015 Fannie Mae Pool 'AH9350' 4.5% 1/4/2041 522,342 0.28
USD 398,190 Fannie Mae Pool 'AH9952' 4.5% 1/5/2041 423,595 0.23
USD 592,070 Fannie Mae Pool 'AI0655' 4.5% 1/5/2041 633,730 0.34
USD 198,862 Fannie Mae Pool 'AI0680' 4.5% 1/5/2041 211,550 0.11
USD 298,199 Fannie Mae Pool 'AI0916' 4.5% 1/4/2041 317,224 0.17
USD 1,281,089 Fannie Mae Pool 'AI1857' 4.5% 1/5/2041 1,362,825 0.73
USD 1,484,892 Fannie Mae Pool 'AI1886' 4.5% 1/5/2041 1,579,631 0.85
USD 69,401 Fannie Mae Pool 'AI3504' 4.5% 1/6/2041 74,285 0.04
USD 134,595 Fannie Mae Pool 'AI3506' 4.5% 1/6/2041 143,183 0.08
USD 57,612 Fannie Mae Pool 'AI4794' 5% 1/6/2041 62,386 0.03
USD 427,687 Fannie Mae Pool 'AI4812' 4.5% 1/6/2041 457,781 0.25
USD 608,711 Fannie Mae Pool 'AI4814' 4.5% 1/6/2041 647,547 0.35
USD 141,642 Fannie Mae Pool 'AI4820' 5% 1/6/2041 153,379 0.08
USD 680,000 Fannie Mae Pool 'AL0583' 6.5%
1/10/2039 757,669 0.41
USD 700,000 Fannie Mae Pool 'AL0603' 6.5%
1/10/2039 788,259 0.42
USD 2,467,060 Fannie Mae REMICS '43 IF' '2010-43 IF'
FRN 25/5/2040 2,483,366 1.33
USD (7,600,000) Freddie Mac Gold Pool '4.5 9/11' 4.5%
TBA± (8,026,312) (4.31)
USD (100,000) Freddie Mac Gold Pool '5 9/11' 5% TBA± (108,000) (0.06)
USD 19,500,000 Freddie Mac Gold Pool '5.5 9/11' 5.5%
TBA 21,236,723 11.41
USD 5,000,000 Freddie Mac Gold Pool '6 9/11' 6% TBA 5,524,220 2.97
USD 14,835,361 Freddie Mac Gold Pool 'A93505' 4.5%
1/8/2040 15,698,086 8.43
USD 2,416,751 Freddie Mac Gold Pool 'A93784' 4.5%
1/9/2040 2,557,293 1.37
USD 549,585 Freddie Mac Gold Pool 'C01527' 5.5%
1/4/2033 603,238 0.32
USD 842,415 Freddie Mac Gold Pool 'C03490' 4.5%
1/8/2040 891,404 0.48
USD 3,892,265 Freddie Mac Gold Pool 'C03517' 4.5%
1/9/2040 4,118,613 2.21
USD 299,550 Freddie Mac Gold Pool 'G12601' 5%
1/2/2022 323,845 0.17
Transferable Securities Admitted to an Official Stock Exchange Listing or Dealt in on Another Regulated Market
Holding Description Value (USD) %
Transferable Securities Admitted to an Official Stock Exchange Listing or Dealt in on Another Regulated Market
Holding Description Value (USD) %
Portfolio of Investments 31 August 2011

± Securities sold short, see Note 2, for further details.
Audited Annual Report and Accounts 229
The notes on pages 261 to 270 form an integral part of these financial statements.
US Government Mortgage Fund continued
USD 292,325 Freddie Mac Gold Pool 'G12633' 5%
1/4/2022 316,033 0.17
USD 17,310 Freddie Mac Gold Pool 'Q01447' 5%
1/6/2041 18,706 0.01
USD 130,536 Freddie Mac Gold Pool 'Q01535' 5%
1/6/2041 141,064 0.08
USD 1,357,055 Freddie Mac REMICS '3222 FN' FRN
15/9/2036 1,366,532 0.73
USD 5,671,207 Freddie Mac REMICS '3807 FM' FRN
15/2/2041 5,731,168 3.08
USD 359,956 Freddie Mac REMICS '2977 AM' 4.5%
15/5/2022 365,676 0.20
USD 3,600,000 Ginnie Mae I pool ''3.5 9/11' 3.5% TBA 3,699,000 1.99
USD (1,500,000) Ginnie Mae I pool '4.5 9/11' 4.5% TBA± (1,624,688) (0.87)
USD 6,300,000 Ginnie Mae I pool '5 9/11' 5% TBA 6,940,830 3.73
USD 2,700,000 Ginnie Mae I pool '6 9/11' 6% TBA 3,038,344 1.63
USD 5,600,000 Ginnie Mae I pool '6.5 9/11' 6.5% TBA 6,306,368 3.39
USD 856,897 Ginnie Mae I pool '688160' 6.5%
15/12/2038 966,081 0.52
USD 5,923 Ginnie Mae I pool '697713' 6.5%
15/12/2038 6,678 0.00
USD 692,259 Ginnie Mae I pool '699271' 6.5%
15/9/2038 780,464 0.42
USD 2,122,655 Ginnie Mae I pool '721747' 4.5%
15/8/2040 2,302,729 1.24
USD 2,115,070 Ginnie Mae I pool '721760' 4.5%
15/8/2040 2,296,154 1.23
USD 188,605 Ginnie Mae I pool '726377' 5%
15/10/2039 208,209 0.11
USD 3,011,396 Ginnie Mae I pool '729037' 5%
15/2/2040 3,324,409 1.79
USD 2,330,103 Ginnie Mae I pool '737269' 4.5%
15/5/2040 2,528,504 1.36
USD 625,763 Ginnie Mae I pool '737271' 4.5%
15/5/2040 678,849 0.36
USD 2,537,052 Ginnie Mae I pool '737310' 4.5%
15/8/2040 2,754,264 1.48
USD (4,700,000) Ginnie Mae II pool '4.5 9/11' 4.5% TBA± (5,089,219) (2.73)
USD 1,178,871 Ginnie Mae II pool '4678' 4.5% 20/4/2040 1,279,357 0.69
USD 3,565,956 Ginnie Mae II pool '4801' 4.5% 20/9/2040 3,869,914 2.08
USD 1,500,000 Government National Mortgage Association
'2005-50 C' FRN 16/3/2037 1,653,149 0.89
USD 13,842,528 Government National Mortgage Association
'2010-62 FM' FRN 20/2/2038 13,878,445 7.46
USD 1,302,758 Government National Mortgage Association
'2009-122 PY' 6% 20/12/2039 1,452,464 0.78
USD 1,420,000 Greenwich Capital Commercial Funding Corp
'2007-GG9 A4' 5.444% 10/3/2039 1,504,042 0.81
USD 3,345,000 GS Mortgage Securities Corp II
'2007-GG10 A4' FRN 10/8/2045 3,534,845 1.90
USD 975,896 MLCC Mortgage Investors Inc '2003-F A1'
FRN 25/10/2028 851,385 0.46
USD 900,000 Nelnet Student Loan Trust '2008-3 A4' FRN
25/11/2024 930,876 0.50
USD 428,140 Santander Drive Auto Receivables Trust
'2010-2 A2' 0.95% 15/8/2013 428,389 0.23
USD 1,857,054 Santander Drive Auto Receivables Trust
'2010-B A2' '144A' 1.01% 15/7/2013 1,858,445 1.00
USD 194,336 Santander Drive Auto Receivables Trust
'2010-1 A2' 1.36% 15/3/2013 194,644 0.10
USD 3,911,944 Santander Drive Auto Receivables Trust
'2010-A A2' '144A' 1.37% 15/8/2013 3,920,409 2.11
USD 1,679,618 SCHOLAR FUNDING TRUST '2011-A A'
'144A' FRN 28/10/2043 1,675,626 0.90
USD 1,123,508 SLM Student Loan Trust '2010-C A1' '144A'
FRN 15/12/2017 1,127,541 0.61
USD 690,000 SLM Student Loan Trust '2008-5 A3' FRN
25/1/2018 704,553 0.38
USD 4,120,000 SLM Student Loan Trust '2008-5 A4' FRN
25/7/2023 4,269,289 2.29
USD 818,566 SLM Student Loan Trust '2010-1 A' FRN
25/3/2025 815,089 0.44
USD 522,329 SLM Student Loan Trust '2009-B A1' '144A'
FRN 15/7/2042 492,168 0.26
USD 900,000 United States Treasury Note/Bond 3.125%
15/5/2021 978,504 0.53
USD 318,670 WaMu Mortgage Pass Through Certificates
'2004-AR13 A1A' FRN 25/11/2034 251,015 0.13
235,967,304 126.77
Total Bonds 235,967,304 126.77
Total Transferable Securities Admitted
to an Official Stock Exchange Listing or
Dealt in on Another Regulated Market 235,967,304 126.77
Unquoted Securities
BONDS
United States USD 105,419 Countrywide Alternative Loan Trust
'2006-41CB 2A17' 6% 25/1/2037 81,675 0.05
USD 122,238 Countrywide Alternative Loan Trust
'2006-43CB 1A7' 6% 25/2/2037 79,079 0.04
USD 558,451 Countrywide Alternative Loan Trust
'2007-16CB 1A7' 6% 25/8/2037 414,300 0.22
USD 339,985 Countrywide Alternative Loan Trust
'2008-2R 3A1' 6% 25/8/2037 284,806 0.15
USD 975,431 Wells Fargo Alternative Loan Trust
'2007-PA2 1A1' 6% 25/6/2037 796,680 0.43
1,656,540 0.89
Total Bonds 1,656,540 0.89
Total Unquoted Securities 1,656,540 0.89
Total Portfolio 237,623,844 127.66
Other Net Liabilities (51,492,081) (27.66)
Total Net Assets (USD) 186,131,763 100.00
Transferable Securities Admitted to an Official Stock Exchange Listing or Dealt in on Another Regulated Market
Holding Description Value (USD) %
Transferable Securities Admitted to an Official Stock Exchange Listing or Dealt in on Another Regulated Market
Holding Description Value (USD) %
Portfolio of Investments 31 August 2011

230 BlackRock Global Funds (BGF)
US Government Mortgage Fund continued
Note: The total market value of USD (606,190) of these transactions is included in the Statement of Net Assets (see Note 2c).
Nominal Value Description
Unrealisedprofit/(loss)
USD
Nominal Value Description
Unrealisedprofit/(loss)
USD
Swaps as at 31 August 2011
USD 3,400,000 Interest Rate Swaps (JP Morgan) (Fund receives Floating
USD Libor 3 Month; and pays Fixed 2.3425%)
(8/1/2014) (145,605)
USD 4,195,000 Interest Rate Swaps (Deutsche Bank) (Fund receives
Fixed 1.83%; and pays Floating USD LIBOR 3 Month)
(16/8/2018) 13,896
USD 4,500,000 Interest Rate Swaps (Deutsche Bank) (Fund receives
Floating USD LIBOR 3 Month; and pays Fixed 3.6625%)
(17/12/2020) (549,404)
USD 1,099,703 Total Return Swap (Citibank) (Fund receives Interest Only
Component 2008 FN 30 Year Fixed Rate 5.00%
+ 0bps; and pays USD LIBOR 1 Month BBA)
(12/1/2039) 7,220
USD 673,288 Total Return Swap (Bank of America) (Fund receives
Interest Only Component 2008 FN 30 Year Fixed Rate
5.00% + 0bps; and pays USD LIBOR 1 Month BBA)
(12/1/2039) 1,673
USD 1,517,903 Total Return Swap (Barclays) (Fund receives USD LIBOR
1 Month BBA; and pays Interest Only Component
2009 FN 30 Year Fixed Rate 4.00% + 0bps)
(12/1/2040) (4,412)
USD 654,240 Total Return Swap (Bank of America) (Fund receives
USD LIBOR 1 Month BBA; and pays Interest Only
Component 2009 FN 30 Year Fixed Rate 5.00%
+ 0bps) (12/1/2040) 5,430
USD 1,134,015 Total Return Swap (Citibank) (Fund receives USD LIBOR
1 Month BBA; and pays Interest Only Component
2009 FN 30 Year Fixed Rate 4.50% + 0bps)
(12/1/2040) 4,075
USD 1,512,020 Total Return Swap (Barclays) (Fund receives USD LIBOR
1 Month BBA; and pays Interest Only Component
2009 FN 30 Year Fixed Rate 5.00% + 0bps)
(12/1/2040) (12,336)
USD 3,016,068 Total Return Swap (Barclays) (Fund receives Interest Only
Component 2009 FN 30 Year Fixed Rate 4.50%
+ 0bps; and pays USD LIBOR 1 Month BBA)
(12/1/2040) 75,805
USD 1,900,000 Interest Rate Swaps (Barclays) (Fund receives Floating
USD LIBOR 3 Month Fund; and pays Fixed 3.185%)
(19/8/2041) 1,271
(602,387)
Open Futures Contractsas at 31 August 2011
Numberof contracts Contract/Description
Expirationdate
ValueUSD
8 US Long Bond (CBT) December 2011 1,097,500
6 US Ultra Bond (CBT) December 2011 868,125
(35) US Treasury 5 Year Note (CBT) December 2011 (4,295,430)
(40) US Treasury 10 Year Note December 2011 (5,179,375)
(60) US Treasury 2 Year Note (CBT) December 2011 (13,231,875)
Total commitment (20,741,055)
Note: The net unrealised loss of USD 2,818 attributed to these transactions is included
in the Statement of Net Assets (see Note 2c).
Purchased Put Options as at 31 August 2011
Number of contracts
subjectto Put Issuer
UnrealisedprofitUSD
ValueUSD
160 Euro/$ 1Year MIDCV Put Option
strike price USD 99.25
expiring on 16/3/2012 2,560 33,000
Total Purchased Put Options 2,560 33,000
Note: Purchased Put Options are included in the Statement of Net Assets (see Note 2c).

Audited Annual Report and Accounts 231
The notes on pages 261 to 270 form an integral part of these financial statements.
US Growth Fund
COMMON STOCKS (SHARES)
France 334,400 Alcatel-Lucent/France ADR 'A' 1,250,656 0.50
Ireland 55,500 Accenture Plc 'A' 2,999,220 1.19
Israel 81,600 Check Point Software Technologies Ltd 4,472,496 1.78
Netherlands 36,500 NXP Semiconductor NV 617,215 0.25
Netherlands Antilles 93,500 Schlumberger Ltd 7,340,685 2.92
United States 44,100 Allergan Inc/United States 3,607,380 1.44
80,592 Alpha Natural Resources Inc 2,778,006 1.11
57,700 Altera Corp 2,124,514 0.85
37,200 Amazon.com Inc 7,942,200 3.16
95,600 AmerisourceBergen Corp 'A' 3,814,440 1.52
58,100 Anadarko Petroleum Corp 4,351,109 1.73
83,700 Apollo Group Inc 'A' 3,944,547 1.57
47,900 Apple Inc 18,668,546 7.43
32,000 Biogen Idec Inc 3,011,840 1.20
181,400 Boeing Co/The 12,112,078 4.82
31,500 BorgWarner Inc 2,295,405 0.91
98,400 Broadcom Corp 'A' 3,535,512 1.41
27,400 Celanese Corp 'A' 1,301,500 0.52
61,200 Cerner Corp 4,142,628 1.65
4,500 Chipotle Mexican Grill Inc 'A' 1,422,090 0.57
22,000 Coach Inc 1,246,300 0.50
97,100 Coca-Cola Co 6,827,101 2.72
59,500 Covance Inc 3,114,825 1.24
137,100 Danaher Corp 6,283,293 2.50
39,900 eBay Inc 1,246,476 0.50
26,000 Express Scripts Inc 1,239,303 0.49
58,100 Exxon Mobil Corp 4,340,070 1.73
110,400 Freeport-McMoRan Copper & Gold Inc 5,313,552 2.11
18,000 Google Inc 'A' 9,809,100 3.90
12,400 Green Mountain Coffee Roasters Inc 1,320,724 0.53
81,000 Halliburton Co 3,607,740 1.44
114,200 Home Depot Inc 3,861,102 1.54
16,300 International Business Machines Corp 2,803,926 1.12
143,600 Jefferies Group Inc 2,365,092 0.94
71,100 Johnson & Johnson 4,694,733 1.87
68,800 Johnson Controls Inc 2,228,432 0.89
98,800 Las Vegas Sands Corp 4,655,456 1.85
71,600 Manpower Inc 2,908,392 1.16
17,000 Monsanto Co 1,190,000 0.47
82,500 Moody's Corp 2,579,775 1.03
65,800 NetApp Inc 2,485,266 0.99
103,400 Oracle Corp 2,931,390 1.17
50,800 PepsiCo Inc/NC 3,283,712 1.31
20,200 Precision Castparts Corp 3,394,408 1.35
127,800 Procter & Gamble Co 8,144,694 3.24
188,000 QUALCOMM Inc 9,765,660 3.89
23,000 Rackspace Hosting Inc 860,200 0.34
42,000 Range Resources Corp 2,780,820 1.11
84,500 Red Hat Inc 3,284,515 1.31
28,500 Salesforce.com Inc 3,630,900 1.44
42,500 Stanley Black & Decker Inc 2,669,000 1.06
73,000 Starbucks Corp 2,838,167 1.13
42,300 Starwood Hotels & Resorts Worldwide Inc 1,890,387 0.75
25,400 Stryker Corp 1,241,552 0.49
75,200 Terex Corp 1,251,328 0.50
59,800 Tesla Motors Inc 1,514,136 0.60
38,900 Thermo Fisher Scientific Inc 2,155,449 0.86
37,400 Tiffany & Co 2,699,532 1.07
48,600 United Parcel Service Inc 'B' 3,322,296 1.32
48,190 VeriFone Systems Inc 1,725,202 0.69
113,100 Verizon Communications Inc 4,137,198 1.65
58,500 Vertex Pharmaceuticals Inc 2,702,115 1.07
92,100 Viacom Inc 'B' 4,458,561 1.77
27,800 VMware Inc 'A' 2,615,146 1.04
67,600 Wal-Mart Stores Inc 3,594,292 1.43
49,000 Wells Fargo & Co 1,270,570 0.51
35,600 Whole Foods Market Inc 2,330,020 0.93
229,663,703 91.44
Total Common Stocks (Shares) 246,343,975 98.08
Total Transferable Securities Admitted
to an Official Stock Exchange Listing or
Dealt in on Another Regulated Market 246,343,975 98.08
Total Portfolio 246,343,975 98.08
Other Net Assets 4,827,597 1.92
Total Net Assets (USD) 251,171,572 100.00
Transferable Securities Admitted to an Official Stock Exchange Listing or Dealt in on Another Regulated Market
Holding Description Value (USD) %
Transferable Securities Admitted to an Official Stock Exchange Listing or Dealt in on Another Regulated Market
Holding Description Value (USD) %
Portfolio of Investments 31 August 2011
Sector Breakdownas at 31 August 2011
% of netassets
Information Technology 29.80
Consumer Discretionary 16.31
Industrials 12.71
Healthcare 11.83
Consumer Staples 10.16
Energy 10.04
Materials 3.10
Financials 2.48
Telecommunication Services 1.65
Other Net Assets 1.92
100.00

232 BlackRock Global Funds (BGF)
US Small & MidCap Opportunities Fund
COMMON STOCKS (SHARES)
Bermuda 235,700 Kosmos Energy Ltd 3,273,873 0.57
40,700 RenaissanceRe Holdings Ltd 2,648,349 0.46
5,922,222 1.03
Ireland 191,200 Elan Corp Plc ADR 2,030,544 0.36
97,600 XL Group Plc 'A' 2,024,224 0.35
4,054,768 0.71
Panama 163,800 McDermott International Inc 2,365,272 0.41
Switzerland 133,800 Foster Wheeler AG 3,357,042 0.58
147,300 Weatherford International Ltd 2,529,141 0.44
5,886,183 1.02
United States 76,400 Abercrombie & Fitch Co 'A' 5,030,940 0.87
77,200 Acorda Therapeutics Inc 2,043,484 0.36
103,300 Actuant Corp 'A' 2,101,122 0.37
96,000 Advent Software Inc 2,213,760 0.38
81,600 Aetna Inc 3,345,600 0.58
49,400 Affiliated Managers Group Inc 4,348,682 0.76
30,500 Alexion Pharmaceuticals Inc 1,787,910 0.31
164,100 Alliant Energy Corp 6,659,178 1.16
62,900 Ameriprise Financial Inc 2,888,997 0.50
121,100 AmerisourceBergen Corp 'A' 4,831,890 0.84
88,200 AON Corp 4,154,220 0.72
135,500 Babcock & Wilcox Co/The 3,155,795 0.55
93,200 Brigham Exploration Co 2,797,864 0.49
117,100 Brown & Brown Inc 2,462,613 0.43
252,500 Calpine Corp 3,696,600 0.64
78,500 Cameron International Corp 4,106,335 0.71
338,700 CB Richard Ellis Group Inc 'A' 5,046,630 0.88
65,900 CBOE Holdings Inc 1,619,822 0.28
81,100 Celanese Corp 'A' 3,852,250 0.67
192,800 CenterPoint Energy Inc 3,840,576 0.67
131,300 CenturyLink Inc 4,729,426 0.82
129,500 Church & Dwight Co Inc 5,643,610 0.98
37,800 Clorox Co 2,659,230 0.46
160,400 CMS Energy Corp 3,139,028 0.55
84,200 Coach Inc 4,769,930 0.83
120,500 Coca-Cola Enterprises Inc 3,320,980 0.58
184,500 Comerica Inc 4,704,750 0.82
47,400 Commerce Bancshares Inc/MO 1,872,300 0.33
98,700 Complete Production Services Inc 2,953,104 0.51
174,100 ConAgra Foods Inc 4,281,119 0.74
28,800 Concho Resources Inc/Midland TX 2,531,232 0.44
30,900 CONMED Corp 735,111 0.13
63,800 Cooper Cos Inc/The 4,814,986 0.84
29,900 CR Bard Inc 2,853,656 0.50
66,400 Cracker Barrel Old Country Store Inc 2,792,784 0.49
80,600 Crown Holdings Inc 2,881,450 0.50
125,100 Darden Restaurants Inc 6,117,390 1.06
23,600 DaVita Inc 1,765,516 0.31
47,600 DENTSPLY International Inc 1,667,428 0.29
66,650 Dollar Tree Inc 4,850,787 0.84
108,000 Dover Corp 6,334,200 1.10
68,400 Dresser-Rand Group Inc 2,957,616 0.51
71,700 El Paso Pipeline Partners LP (Unit) 2,627,805 0.46
42,000 Essex Property Trust Inc (Reit) 5,995,500 1.04
62,300 F5 Networks Inc 5,108,911 0.89
67,500 Federal Realty Investment Trust (Reit) 6,095,925 1.06
566,500 Ferro Corp 4,945,545 0.86
220,300 Fidelity National Information Services Inc 6,232,287 1.08
94,100 FirstEnergy Corp 4,150,751 0.72
64,500 Fiserv Inc 3,595,875 0.63
43,100 Flowserve Corp 4,100,534 0.71
41,000 Forest Laboratories Inc 1,416,140 0.25
150,600 Fortinet Inc 2,876,460 0.50
82,500 Global Payments Inc 3,801,600 0.66
283,200 Goodyear Tire & Rubber Co/The 3,678,768 0.64
90,100 Guess? Inc 3,151,698 0.55
244,900 Hartford Financial Services Group Inc 4,780,448 0.83
79,300 Health Care REIT Inc (Reit) 4,031,612 0.70
71,000 Henry Schein Inc 4,716,530 0.82
51,800 Hill-Rom Holdings Inc 1,578,864 0.27
132,800 HJ Heinz Co 6,982,624 1.21
208,800 Hologic Inc 3,514,104 0.61
54,400 Hospira Inc 2,520,896 0.44
233,600 Hospitality Properties Trust (Reit) 5,498,944 0.96
15,200 Humana Inc 1,193,352 0.21
39,200 Iberiabank Corp 1,882,776 0.33
63,200 Informatica Corp 2,797,864 0.49
43,700 Integra LifeSciences Holdings Corp 1,757,177 0.31
122,800 International Rectifier Corp 2,841,592 0.49
311,800 Interpublic Group of Cos Inc/The 2,740,722 0.48
262,100 Intersil Corp 'A' 2,964,351 0.52
138,800 Jabil Circuit Inc 2,360,988 0.41
85,900 Jacobs Engineering Group Inc 3,241,866 0.56
146,600 Jarden Corp 4,260,196 0.74
80,300 Kansas City Southern 4,487,967 0.78
556,500 KeyCorp 3,711,855 0.65
7,400 Kronos Worldwide Inc 163,984 0.03
16,800 Laboratory Corp of America Holdings 1,416,912 0.25
68,600 Lam Research Corp 2,592,394 0.45
80,600 Lear Corp 3,863,158 0.67
160,600 Liberty Global Inc 'A' 6,396,698 1.11
63,500 Liberty Media Corp - Capital 'A' 4,574,540 0.80
70,000 Life Technologies Corp 2,949,450 0.51
197,500 Lincoln National Corp 4,167,250 0.72
47,700 Lorillard Inc 5,331,906 0.93
115,800 Macy's Inc 3,079,122 0.54
106,500 Mattel Inc 2,905,320 0.51
53,800 Medicis Pharmaceutical Corp 'A' 2,105,732 0.37
417,700 Meritor Inc 3,759,300 0.65
251,000 MetroPCS Communications Inc 2,851,360 0.50
44,900 Mylan Inc/PA 928,079 0.16
93,800 Natus Medical Inc 973,644 0.17
14,000 Netflix Inc 3,319,260 0.58
89,700 NII Holdings Inc 3,426,091 0.60
71,300 Nordstrom Inc 3,299,051 0.57
118,500 Novellus Systems Inc 3,331,035 0.58
75,000 NTELOS Holdings Corp 1,440,750 0.25
83,300 Nucor Corp 3,036,285 0.53
76,900 Oceaneering International Inc 3,309,776 0.58
249,600 Och-Ziff Capital Management Group LLC 2,850,432 0.50
284,400 Office Depot Inc 753,660 0.13
81,600 O'Reilly Automotive Inc 5,370,912 0.93
129,700 Parametric Technology Corp 2,361,837 0.41
44,800 Peabody Energy Corp 2,220,288 0.39
73,400 Penn National Gaming Inc 2,946,276 0.51
28,300 Pioneer Natural Resources Co 2,233,153 0.39
46,400 Plains All American Pipeline LP (Unit) 2,803,488 0.49
49,400 PPG Industries Inc 3,819,114 0.66
150,200 PPL Corp 4,295,720 0.75
Transferable Securities Admitted to an Official Stock Exchange Listing or Dealt in on Another Regulated Market
Holding Description Value (USD) %
Transferable Securities Admitted to an Official Stock Exchange Listing or Dealt in on Another Regulated Market
Holding Description Value (USD) %
Portfolio of Investments 31 August 2011

Audited Annual Report and Accounts 233
The notes on pages 261 to 270 form an integral part of these financial statements.
US Small & MidCap Opportunities Fund continued
128,600 Public Service Enterprise Group Inc 4,346,680 0.76
272,600 Pulte Group Inc 1,338,466 0.23
105,000 QLIK Technologies Inc 2,700,600 0.47
61,798 Ralcorp Holdings Inc 5,360,359 0.93
132,450 Rayonier Inc (Reit) 5,511,244 0.96
41,000 Reinsurance Group of America Inc 2,185,710 0.38
662,400 RF Micro Devices Inc 4,239,360 0.74
266,400 Robert Half International Inc 6,425,568 1.12
49,700 Rock-Tenn Co 'A' 2,616,705 0.45
95,200 Rovi Corp 4,681,936 0.81
162,500 Rowan Cos Inc 5,970,250 1.04
51,800 Rue21 Inc 1,314,684 0.23
127,200 Ryder System Inc 6,034,368 1.05
119,800 SAIC Inc 1,794,604 0.31
232,900 Saks Inc 2,315,026 0.40
251,200 Sara Lee Corp 4,594,448 0.80
101,469 SBA Communications Corp 'A' 3,719,854 0.65
104,200 Sempra Energy 5,452,786 0.95
18,000 Skullcandy Inc 295,200 0.05
40,700 SL Green Realty Corp (Reit) 2,897,840 0.50
102,600 Snap-on Inc 5,424,462 0.94
60,200 Sohu.com Inc 4,989,978 0.87
56,400 Solera Holdings Inc 3,336,060 0.58
58,050 Stanley Black & Decker Inc 3,645,540 0.63
107,700 Starwood Hotels & Resorts Worldwide Inc 4,813,113 0.84
135,500 SunTrust Banks Inc 2,703,225 0.47
43,600 T Rowe Price Group Inc 2,338,268 0.41
229,100 TD Ameritrade Holding Corp 3,553,341 0.62
140,000 Tenet Healthcare Corp 772,800 0.13
48,900 Teradata Corp 2,549,646 0.44
235,200 Teradyne Inc 2,916,480 0.51
137,900 Toll Brothers Inc 2,414,629 0.42
29,000 Vertex Pharmaceuticals Inc 1,339,510 0.23
127,500 Waddell & Reed Financial Inc 'A' 4,004,775 0.70
140,900 Washington Real Estate Investment Trust (Reit) 4,362,264 0.76
63,200 Watson Pharmaceuticals Inc 4,307,712 0.75
44,400 Whiting Petroleum Corp 2,112,552 0.37
35,800 Whole Foods Market Inc 2,343,110 0.41
122,800 Wisconsin Energy Corp 3,875,568 0.67
92,500 Wright Medical Group Inc 1,441,150 0.25
16,500 Wynn Resorts Ltd 2,559,315 0.45
174,200 Xcel Energy Inc 4,273,126 0.74
33,500 Zimmer Holdings Inc 1,900,790 0.33
518,651,507 90.23
Total Common Stocks (Shares) 536,879,952 93.40
Total Transferable Securities Admitted
to an Official Stock Exchange Listing or
Dealt in on Another Regulated Market 536,879,952 93.40
Total Portfolio 536,879,952 93.40
Other Net Assets 37,925,662 6.60
Total Net Assets (USD) 574,805,614 100.00
Transferable Securities Admitted to an Official Stock Exchange Listing or Dealt in on Another Regulated Market
Holding Description Value (USD) %
Transferable Securities Admitted to an Official Stock Exchange Listing or Dealt in on Another Regulated Market
Holding Description Value (USD) %
Portfolio of Investments 31 August 2011
Sector Breakdownas at 31 August 2011
% of netassets
Financials 16.66
Consumer Discretionary 15.47
Information Technology 12.22
Healthcare 10.58
Industrials 9.04
Energy 7.80
Utilities 7.61
Consumer Staples 7.04
Materials 3.70
Telecommunication Services 2.82
Financial 0.46
Other Net Assets 6.60
100.00
Open Futures Contractsas at 31 August 2011
Numberof contracts Contract/Description
Expirationdate
ValueUSD
395 Mini Russell 2000® Index September 2011 28,941,650
Total commitment 28,941,650
Note: The net unrealised gain of USD 2,311,402 attributed to this transaction is included
in the Statement of Net Assets (see Note 2c).

234 BlackRock Global Funds (BGF)
World Agriculture Fund
FUNDS
Ireland 12,235,788 Institutional Cash Series Plc - Institutional
US Dollar Liquidity Fund 12,235,788 2.08
Total Funds 12,235,788 2.08
COMMON STOCKS (SHARES)
Australia 245,000 GrainCorp Ltd 2,006,105 0.34
277,000 Incitec Pivot Ltd 1,120,722 0.19
190,000 Nufarm Ltd/Australia 778,894 0.13
3,905,721 0.66
Bermuda 2,000,000 Asian Citrus Holdings Ltd 1,449,943 0.25
230,000 Bunge Ltd 14,807,400 2.52
150,000 Cosan Ltd 'A' 1,744,500 0.30
259,498 PureCircle Ltd 355,686 0.06
1,600,000 Sinofert Holdings Ltd 496,830 0.08
18,854,359 3.21
Brazil 1,160,000 BRF - Brasil Foods SA ADR 22,875,200 3.89
30,000 Fertilizantes Heringer SA 163,805 0.03
250,000 Sao Martinho SA 3,507,853 0.60
260,000 SLC Agricola SA 2,636,243 0.45
29,183,101 4.97
Canada 55,000 AG Growth International Inc (Unit) * 2,269,160 0.39
260,000 Agrium Inc 23,002,200 3.91
110,000 Allana Potash Corp 163,899 0.03
65,000 Alliance Grain Traders Inc 1,534,232 0.26
1,140,000 Feronia Inc (Unit) 585,722 0.10
500,000 IC Potash Corp 606,274 0.10
930,000 Potash Corp of Saskatchewan Inc 55,390,800 9.42
949,300 Viterra Inc 10,193,811 1.74
93,746,098 15.95
Cayman Islands 720,000 China Forestry Holdings Co Ltd 68,134 0.01
170,000 Le Gaga Holdings Ltd ADR 1,020,000 0.18
1,088,134 0.19
Chile 107,600 Sociedad Quimica y Minera
de Chile SA ADR 'B' 6,821,840 1.16
China 790,000 China BlueChemical Ltd 'H' 621,384 0.11
1,434,000 First Tractor Co Ltd 'H' 1,289,851 0.22
1,911,235 0.33
Cyprus 200,000 Ros Agro Plc GDR 1,900,000 0.32
Denmark 400,000 Trigon Agri A/S 587,244 0.10
Germany 30,000 Asian Bamboo AG * 662,650 0.11
40,000 K+S AG 2,857,693 0.49
3,520,343 0.60
Hong Kong 1,300,000 China Agri-Industries Holdings Ltd 1,212,691 0.21
Indonesia 1,325,000 Astra Agro Lestari TBK PT 3,338,509 0.57
16,000,000 JA Wattie Tbk PT 881,284 0.15
14,000,000 Perusahaan Perkebunan London Sumatra
Indonesia Tbk PT 3,937,654 0.67
36,000,000 Salim Ivomas Pratama Tbk PT 5,273,643 0.90
13,431,090 2.29
Ireland 80,000 Origin Enterprises Plc 363,927 0.06
Isle of Man 1,000,000 Landkom International Plc 84,525 0.01
Israel 300,000 Israel Chemicals Ltd 4,335,594 0.74
120,000 Makhteshim-Agan Industries Ltd 667,456 0.11
5,003,050 0.85
Japan 1,604,000 Kubota Corp 13,094,730 2.23
Luxembourg 100,008 Adecoagro SA 1,061,085 0.18
Malaysia 2,155,000 IOI Corp 3,258,153 0.55
692,000 Kuala Lumpur Kepong Bhd 4,945,850 0.84
8,204,003 1.39
Mauritius 20,490,000 Golden Agri-Resources Ltd 11,245,093 1.91
Netherlands 285,000 CNH Global NV 9,647,250 1.64
Norway 370,000 Yara International ASA 20,581,280 3.50
Papua New Guinea 240,000 New Britain Palm Oil Ltd 3,358,141 0.57
Poland 5,742,726 Continental Farmers Group Plc 2,736,816 0.47
Russian Federation 245,780 Phosagro OAO GDR 2,900,204 0.49
Singapore 800,000 China Minzhong Food Corp Ltd * 818,224 0.14
5,100,000 GMG Global Ltd 1,038,995 0.18
2,902,363 Olam International Ltd 6,250,700 1.06
6,956,000 Wilmar International Ltd 30,655,796 5.21
38,763,715 6.59
Transferable Securities Admitted to an Official Stock Exchange Listing or Dealt in on Another Regulated Market
Holding Description Value (USD) %
Transferable Securities Admitted to an Official Stock Exchange Listing or Dealt in on Another Regulated Market
Holding Description Value (USD) %
Portfolio of Investments 31 August 2011

* Securities lent, see Note 11, for further details.
Audited Annual Report and Accounts 235
The notes on pages 261 to 270 form an integral part of these financial statements.
South Africa 20,000 Illovo Sugar Ltd 65,847 0.01
Switzerland 121,000 Syngenta AG 38,710,536 6.59
Thailand 400,000 Sri Trang Agro-Industry PCL 354,231 0.06
United Kingdom 85,000 Genus Plc 1,289,205 0.22
1,050,000 Plant Impact Plc 428,334 0.07
400,000 Tate & Lyle Plc 3,805,241 0.65
506,296 Wynnstay Group Plc 2,792,382 0.47
8,315,162 1.41
United States 370,000 AGCO Corp 16,357,700 2.78
950,000 Archer-Daniels-Midland Co 27,322,000 4.65
105,000 CF Industries Holdings Inc 20,069,700 3.41
295,000 Corn Products International Inc 13,876,800 2.36
335,000 Darling International Inc 5,684,950 0.97
550,000 Deere & Co 45,199,000 7.69
30,000 FMC Corp 2,282,100 0.39
130,195 HaloSource Inc 201,823 0.03
42,500 Intrepid Potash Inc 1,457,750 0.25
9,000 Lindsay Corp 576,540 0.10
675,000 Monsanto Co 47,250,000 8.04
379,009 Mosaic Co/The 27,868,532 4.74
20,000 Plum Creek Timber Co Inc (Reit) 755,400 0.13
45,000 Rayonier Inc (Reit) 1,872,450 0.32
320,000 Smithfield Foods Inc 7,059,200 1.20
440,000 Tyson Foods Inc 'A' 7,717,600 1.31
225,551,545 38.37
Total Common Stocks (Shares) 566,202,996 96.32
Total Transferable Securities Admitted
to an Official Stock Exchange Listing or
Dealt in on Another Regulated Market 578,438,784 98.40
Unquoted Securities
COMMON STOCKS (SHARES) & WARRANTS
Canada 570,000 Feronia Inc (Wts 31/3/2013) – 0.00
United States 653,000 Union Agriculture Group Corp Com Stk
(Placing) 1,292,940 0.22
Total Common Stocks (Shares) & Warrants 1,292,940 0.22
Total Unquoted Securities 1,292,940 0.22
Total Portfolio 579,731,724 98.62
Other Net Assets 8,084,532 1.38
Total Net Assets (USD) 587,816,256 100.00
Transferable Securities Admitted to an Official Stock Exchange Listing or Dealt in on Another Regulated Market
Holding Description Value (USD) %
Transferable Securities Admitted to an Official Stock Exchange Listing or Dealt in on Another Regulated Market
Holding Description Value (USD) %
Portfolio of Investments 31 August 2011
World Agriculture Fund continued
Sector Breakdownas at 31 August 2011
% of netassets
Fertilizers & Agricultural Chemicals 43.58
Agricultural Products 26.62
Construction & Farm Machinery & Heavy Trucks 15.05
Packaged Foods & Meats 8.60
Investment Funds 2.08
Food Distributors 1.06
Distributors 0.47
Specialized REITs 0.45
Diversified Chemicals 0.39
Biotechnology 0.22
Tires & Rubber 0.06
Environmental & Facilities Services 0.03
Forest Products 0.01
Other Net Assets 1.38
100.00
Open Forward Foreign Exchange Transactionsas at 31 August 2011
Purchases Sales Value date Unrealised
profit/(loss)
Unrealisedprofit/(loss)
USD Equivalent
EUR Hedged Share Class EUR
EUR 23,999,983 USD 34,101,111 14/9/2011 383,186 553,417
USD 3,299,487 EUR 2,306,259 14/9/2011 (21,193) (30,608)
Net unrealised profit 361,993 522,809
GBP Hedged Share Class GBP
GBP 4,393,812 USD 7,183,691 14/9/2011 (9,249) (15,093)
USD 646,616 GBP 395,000 14/9/2011 1,327 2,165
Net unrealised loss (7,922) (12,928)
PLN Hedged Share Class PLN
PLN 5,826,326 USD 2,020,029 14/9/2011 17,900 6,234
USD 318,035 PLN 923,384 14/9/2011 (8,901) (3,100)
Net unrealised profit 8,999 3,134
SGD Hedged Share Class SGD
SGD 30,295,149 USD 24,851,593 14/9/2011 409,848 340,802
USD 2,296,039 SGD 2,786,817 14/9/2011 (25,714) (21,382)
Net unrealised profit 384,134 319,420
Total net unrealised profit 832,435
Note: The net unrealised profit attributed to these transactions is included in the Statement
of Net Assets (see Note 2c).

236 BlackRock Global Funds (BGF)
World Bond Fund
BONDS
Australia AUD 2,820,000 Australia Government Bond 3% 20/9/2025 3,614,789 0.80
AUD 2,974,000 Australia Government Bond 4.5%
15/4/2020 3,217,777 0.71
AUD 4,025,000 Australia Government Bond 5.75%
15/5/2021 4,773,203 1.05
AUD 500,000 Commonwealth Bank of Australia 5.75%
17/12/2013 550,773 0.12
AUD 4,035,000 New South Wales Treasury Corp 2.75%
20/11/2025 4,899,159 1.08
AUD 2,685,000 Queensland Treasury Corp 6% 14/9/2017 3,087,925 0.68
USD 1,400,000 Westpac Banking Corp 3% 4/8/2015 1,430,927 0.31
USD 935,000 Westpac Banking Corp 4.875%
19/11/2019 988,283 0.22
22,562,836 4.97
Austria EUR 100,000 BAWAG PSK Bank fuer Arbeit und Wirtschaft
und Oesterreichische Postsparkasse
4.35% 28/5/2013 148,116 0.03
Belgium EUR 1,675,000 Belgium Government Bond 2.75%
28/3/2016 2,383,581 0.53
Bermuda GBP 1,200,000 Holcim GB Finance Ltd 8.75%
24/4/2017 2,406,527 0.53
Canada CAD 3,038,000 Canadian Government Bond 2.5%
1/6/2015 3,251,850 0.72
CAD 4,762,000 Canadian Government Bond 3.25%
1/6/2021 5,256,680 1.16
CAD 3,479,000 Canadian Government Bond 3.5%
1/6/2020 3,929,941 0.86
CAD 253,000 Canadian Government Bond 5% 1/6/2037 348,639 0.08
CAD 785,000 Canadian Government Bond 5.75%
1/6/2033 1,163,669 0.26
USD 1,700,000 CDP Financial Inc '144A' 3% 25/11/2014 1,793,761 0.39
CAD 125,000 Shaw Communications Inc 6.1%
16/11/2012 135,388 0.03
15,879,928 3.50
Cayman Islands USD 1,905,000 Petrobras International Finance Co - Pifco
3.875% 27/1/2016 1,956,591 0.43
EUR 499,000 UPCB Finance II Ltd 6.375% 1/7/2020 640,164 0.14
2,596,755 0.57
Denmark EUR 75,000 Kommunekredit 4.375% 2/10/2012 111,806 0.03
DKK 31,675,000 Nykredit Realkredit A/S 4% 1/10/2041 5,984,522 1.32
EUR 135,000 TDC A/S 6.5% 19/4/2012 200,236 0.04
6,296,564 1.39
France EUR 249,668 AUTO ABS Srl '2007-1 A' FRN 25/2/2019 359,449 0.08
EUR 213,048 AUTO ABS Srl '2007-2 A' FRN 25/10/2020 303,348 0.07
EUR 90,000 CIF Euromortgage 4.5% 10/12/2013 137,485 0.03
EUR 95,000 Compagnie de Financement Foncier
3.875% 25/4/2055 120,019 0.03
EUR 350,000 Credit Agricole Home Loan SFH 3.5%
21/7/2014 523,094 0.11
USD 700,000 Dexia Credit Local SA '144A' 2.375%
23/9/2011 700,580 0.15
EUR 525,000 France Government Bond OAT 3.5%
25/4/2020 806,780 0.18
EUR 775,000 France Government Bond OAT 3.75%
25/4/2017 1,221,293 0.27
EUR 205,000 France Government Bond OAT 3.75%
25/4/2021 319,721 0.07
EUR 1,440,000 France Government Bond OAT 4%
25/10/2038 2,197,255 0.48
EUR 220,000 France Government Bond OAT 6%
25/10/2025 416,089 0.09
EUR 600,000 Pernod-Ricard SA 5% 15/3/2017 860,484 0.19
USD 1,490,000 Societe Financement de l'Economie
Francaise 3.375% 5/5/2014 1,588,385 0.35
EUR 60,000 Veolia Environnement SA 4% 12/2/2016 89,605 0.02
9,643,587 2.12
Germany EUR 1,475,000 Bayerische Landesbank 1.875%
30/6/2014 2,140,118 0.47
EUR 3,775,000 Bundesobligation 3.5% 12/4/2013 5,698,017 1.25
EUR 697,000 Bundesrepublik Deutschland 2.25%
4/9/2020 1,021,946 0.22
EUR 7,738,000 Bundesrepublik Deutschland 3.25%
4/7/2021 12,243,798 2.70
EUR 150,000 Bundesrepublik Deutschland 4.25%
4/7/2018 252,261 0.06
EUR 2,220,000 Bundesrepublik Deutschland 4.75%
4/7/2040 4,236,599 0.93
EUR 6,590,000 Bundesrepublik Deutschland
Bundesobligation Inflation
Linked Bond 2.25% 15/4/2013 10,841,032 2.39
EUR 2,762,000 Deutsche Bundesrepublik Inflation Linked
Bond 1.5% 15/4/2016 4,755,631 1.05
EUR 274,000 Dexia Kommunalbank Deutschland AG
1.625% 21/10/2013 392,153 0.09
EUR 1,500,000 Duesseldorfer Hypothekenbank AG 1.875%
13/12/2013 2,183,648 0.48
GBP 1,300,000 FMS Wertmanagement FRN 11/4/2012 2,122,336 0.47
EUR 115,000 HSH Nordbank AG FRN 14/2/2017 96,332 0.02
EUR 1,050,000 Kreditanstalt fuer Wiederaufbau 2.625%
16/8/2019 1,520,236 0.33
EUR 775,000 Kreditanstalt fuer Wiederaufbau 4.125%
4/7/2017 1,234,947 0.27
AUD 330,000 Kreditanstalt fuer Wiederaufbau 5.5%
8/8/2013 360,534 0.08
EUR 330,000 UPC Germany GmbH 8.125% 1/12/2017 481,546 0.11
49,581,134 10.92
Guernsey USD 806,000 Credit Suisse Group Guernsey I Ltd FRN
24/2/2041 783,855 0.17
India USD 400,000 Bank of Baroda/London 5% 24/8/2016 409,442 0.09
USD 565,000 Bank of India 6.25% 16/2/2021 581,557 0.13
USD 405,000 Canara Bank/London 5.125% 9/9/2016 413,483 0.09
1,404,482 0.31
Transferable Securities Admitted to an Official Stock Exchange Listing or Dealt in on Another Regulated Market
Holding Description Value (USD) %
Transferable Securities Admitted to an Official Stock Exchange Listing or Dealt in on Another Regulated Market
Holding Description Value (USD) %
Portfolio of Investments 31 August 2011

Audited Annual Report and Accounts 237
The notes on pages 261 to 270 form an integral part of these financial statements.
World Bond Fund continued
International EUR 795,000 European Financial Stability Facility 2.75%
18/7/2016 1,177,953 0.26
EUR 1,670,000 European Investment Bank 2.125%
15/1/2014 2,453,823 0.54
USD 575,000 European Investment Bank 3.125%
4/6/2014 614,579 0.14
EUR 925,000 European Investment Bank 3.5%
15/4/2016 1,419,133 0.31
AUD 1,150,000 European Investment Bank 6% 6/8/2020 1,268,674 0.28
AUD 2,495,000 European Investment Bank 6.5%
7/8/2019 2,838,021 0.62
AUD 620,000 Nordic Investment Bank 6%
20/8/2014 690,162 0.15
10,462,345 2.30
Ireland EUR 800,000 Ardagh Packaging Finance Plc 7.375%
15/10/2017 1,074,457 0.24
EUR 205,369 Cars Alliance Funding Plc '2007-1 A' FRN
8/10/2023 293,322 0.06
CAD 145,000 Depfa ACS Bank 5.25% 31/3/2025 131,781 0.03
GBP 400,000 GE Capital UK Funding 5.125% 3/3/2015 693,035 0.15
USD 3,613,000 Governor & Co of the Bank of Ireland
/The '144A' 2.75% 2/3/2012 3,404,788 0.75
EUR 845,000 Ireland Government Bond 4% 15/1/2014 1,118,244 0.25
EUR 1,815,000 Ireland Government Bond 5%
18/10/2020 2,068,931 0.46
USD 1,300,000 Irish Life & Permanent Plc '144A' 3.6%
14/1/2013 1,068,878 0.24
EUR 305,000 Smurfit Kappa Acquisitions 7.25%
15/11/2017 420,003 0.09
EUR 145,553 Talisman Finance Plc '7H' FRN
22/4/2017 21,020 0.00
10,294,459 2.27
Italy EUR 193,000 Banco Popolare SC 6.375% 31/5/2021 211,392 0.05
EUR 1,050,000 Intesa Sanpaolo SpA FRN 26/6/2018 1,446,935 0.32
EUR 50,000 Italian Republic 4.5% 31/7/2014 73,495 0.02
EUR 1,106,000 Italy Buoni Poliennali Del Tesoro 3%
15/4/2015 1,542,354 0.34
EUR 4,404,000 Italy Buoni Poliennali Del Tesoro 4%
1/9/2020 6,013,814 1.32
EUR 2,095,000 Italy Buoni Poliennali Del Tesoro 4.25%
15/10/2012 3,062,505 0.67
EUR 590,000 Italy Buoni Poliennali Del Tesoro 5%
1/8/2039 729,109 0.16
EUR 1,180,000 Italy Buoni Poliennali Del Tesoro 5%
1/9/2040 1,453,923 0.32
EUR 95,000 Mediobanca SpA FRN 11/10/2016 132,852 0.03
14,666,379 3.23
Japan JPY 60,000,000 Japan Government Fifteen Year Bond
FRN 20/3/2021 805,947 0.18
JPY 65,000,000 Japan Government Five Year Bond 0.9%
20/12/2012 856,282 0.19
JPY 746,000,000 Japan Government Ten Year Bond 1%
20/9/2020 9,794,411 2.16
JPY 214,000,000 Japan Government Ten Year Bond 1.1%
20/6/2020 2,842,491 0.62
JPY 1,364,000,000 Japan Government Ten Year Bond 1.4%
20/9/2019 18,694,519 4.12
JPY 639,000,000 Japan Government Ten Year Bond 1.9%
20/6/2017 9,029,999 1.99
JPY 1,245,000,000 Japan Government Twenty Year Bond
2.1% 20/12/2027 17,240,521 3.80
JPY 312,500,000 Japan Government Twenty Year Bond
2.2% 20/6/2026 4,428,122 0.97
JPY 385,000,000 Japanese Government CPI Linked Bond
1.2% 10/6/2017 5,150,894 1.13
JPY 83,100,000 Japanese Government CPI Linked Bond
1.2% 10/12/2017 1,098,370 0.24
EUR 1,250,000 Tokyo Electric Power Co Inc/The 4.5%
24/3/2014 1,556,979 0.34
71,498,535 15.74
Jersey GBP 150,000 BAA Funding Ltd '144A' FRN
15/2/2023 246,853 0.05
Luxembourg EUR 1,400,000 Bumper 2 SA '2011-2 A' FRN
23/2/2023 2,021,814 0.45
EUR 1,100,000 ITW Finance Europe SA 5.25%
1/10/2014 1,744,528 0.38
USD 1,500,000 Unicredit Luxembourg Finance SA
'144A' FRN 13/1/2017 1,452,567 0.32
5,218,909 1.15
Netherlands EUR 400,000 ABN Amro Bank NV 3.75% 15/7/2014 605,753 0.13
EUR 900,000 ELM BV for Swiss Life Insurance &
Pension Group FRN 12/4/2017
(Perpetual) 934,200 0.20
EUR 1,400,000 Eureko BV FRN 24/6/2015 (Perpetual) 1,527,189 0.34
EUR 500,000 Fortis Bank Nederland NV 3.375%
19/5/2014 757,538 0.17
EUR 293,208 Globaldrive BV '2008-2 A' 4% 20/10/2016 427,865 0.09
EUR 650,000 LeasePlan Corp NV 3.25% 22/5/2014 981,252 0.22
USD 1,510,000 MDC-GMTN B.V. 3.75% 20/4/2016 1,576,063 0.35
USD 1,160,000 MDC-GMTN B.V. 5.75% 6/5/2014 1,271,992 0.28
GBP 45,000 RWE Finance BV 6.25% 3/6/2030 82,983 0.02
EUR 700,000 RWE Finance BV 6.625% 31/1/2019 1,213,282 0.27
EUR 457,193 Storm BV '2007-1 A2' FRN 22/4/2049 649,991 0.14
EUR 50,000 Syngenta Finance NV 4.125% 21/9/2011 72,294 0.01
USD 1,555,000 Volkswagen International Finance NV
'144A' 1.625% 12/8/2013 1,571,194 0.35
EUR 1,325,000 Ziggo Finance BV 6.125% 15/11/2017 1,871,369 0.41
13,542,965 2.98
Norway USD 610,000 Eksportfinans ASA 3% 17/11/2014 646,969 0.14
Poland PLN 3,875,000 Poland Government Bond 5% 25/4/2016 1,350,569 0.30
USD 1,790,000 Poland Government International Bond
5.125% 21/4/2021 1,866,075 0.41
3,216,644 0.71
Portugal EUR 550,000 Portugal Obrigacoes do Tesouro OT
4.2% 15/10/2016 598,911 0.13
EUR 495,000 Portugal Obrigacoes do Tesouro OT
4.95% 25/10/2023 433,078 0.10
EUR 2,540,000 Portugal Obrigacoes do Tesouro OT
5.45% 23/9/2013 3,289,195 0.72
EUR 730,000 Portugal Obrigacoes do Tesouro OT
6.4% 15/2/2016 868,872 0.19
5,190,056 1.14
Transferable Securities Admitted to an Official Stock Exchange Listing or Dealt in on Another Regulated Market
Holding Description Value (USD) %
Transferable Securities Admitted to an Official Stock Exchange Listing or Dealt in on Another Regulated Market
Holding Description Value (USD) %
Portfolio of Investments 31 August 2011

238 BlackRock Global Funds (BGF)
World Bond Fund continued
Qatar USD 805,000 Qatari Diar Finance QSC 5% 21/7/2020 873,425 0.19
South Africa ZAR 8,630,000 South Africa Government Bond 13.5%
15/9/2015 1,530,434 0.34
South Korea USD 575,000 Lotte Shopping Co Ltd 3.875%
7/4/2016 583,674 0.13
USD 485,000 POSCO '144A' 5.25% 14/4/2021 494,279 0.11
1,077,953 0.24
Spain EUR 600,000 Banco Bilbao Vizcaya Argentaria SA 4.25%
30/3/2015 867,931 0.19
EUR 1,000,000 Banco Financiero y de Ahorros SA 3.875%
30/11/2013 1,430,796 0.31
EUR 1,050,000 Banco Popular Espanol SA 4.25%
30/9/2015 1,493,389 0.33
EUR 1,200,000 Bankia SAU 3.5% 13/11/2014 1,649,490 0.36
EUR 400,000 BBVA Senior Finance SAU 2.75%
10/9/2012 571,215 0.13
EUR 1,600,000 Instituto de Credito Oficial 2.875%
15/11/2013 2,256,716 0.50
EUR 1,450,000 Spain Government Bond 3.15%
31/1/2016 2,017,634 0.44
EUR 1,105,000 Spain Government Bond 4.2% 31/1/2037 1,249,137 0.28
EUR 525,000 Spain Government Bond 4.8% 31/1/2024 720,545 0.16
EUR 875,000 Spain Government Bond 4.85%
31/10/2020 1,258,410 0.28
EUR 400,000 Telefonica Emisiones SAU 5.431%
3/2/2014 596,395 0.13
USD 950,000 Telefonica Emisiones SAU 5.462%
16/2/2021 920,037 0.20
USD 75,000 Telefonica Emisiones SAU 6.421%
20/6/2016 78,495 0.02
15,110,190 3.33
Sweden EUR 920,000 Svensk Exportkredit AB 3.625%
27/5/2014 1,396,535 0.31
USD 950,000 Svenska Handelsbanken AB 2.875%
14/9/2012 968,986 0.21
USD 2,135,000 Svenska Handelsbanken AB 3.125%
12/7/2016 2,155,496 0.47
EUR 1,241,000 Swedbank Hypotek AB 2% 31/1/2014 1,796,568 0.40
EUR 430,000 Swedish Covered Bond Corp 3%
3/2/2015 640,178 0.14
6,957,763 1.53
Switzerland EUR 1,100,000 Credit Suisse AG/London 6.125%
5/8/2013 1,698,816 0.37
EUR 1,250,000 UBS AG/Jersey FRN 25/9/2018 1,765,343 0.39
USD 200,000 UBS AG/Stamford CT 5.875%
20/12/2017 213,726 0.05
3,677,885 0.81
United Arab Emirates GBP 200,000 National Bank of Abu Dhabi PJSC
5.875% 27/2/2012 330,973 0.07
United Kingdom EUR 100,000 Anglian Water Services Financing Plc
4.625% 7/10/2013 151,979 0.03
GBP 50,000 Anglian Water Services Financing Plc
5.25% 30/10/2015 90,347 0.02
EUR 400,000 Arkle Master Issuer Plc '2006-1X 5A1' FRN
17/2/2052 572,032 0.13
EUR 1,078,932 Arran Residential Mortgages Funding Plc
'2006-2X A2C' FRN 20/9/2056 1,556,384 0.34
EUR 250,000 Aviva Plc FRN 14/11/2021 357,432 0.08
EUR 1,250,000 Aviva Plc FRN 28/11/2014 (Perpetual) 1,440,390 0.32
GBP 850,000 Aviva Plc FRN 3/6/2041 1,305,336 0.29
USD 100,000 Barclays Bank Plc '144A' FRN 15/12/2017
(Perpetual) 90,500 0.02
EUR 1,520,000 BAT International Finance Plc 5.875%
12/3/2015 2,439,288 0.54
EUR 1,200,000 BG Energy Capital Plc 3.625% 16/7/2019 1,781,232 0.39
GBP 221,000 Co-Operative Bank Plc/United Kingdom
9.25% 28/4/2021 334,923 0.07
EUR 600,000 FCE Bank Plc 9.375% 17/1/2014 905,485 0.20
GBP 670,000 Fosse Master Issuer Plc '2011-1X A3' FRN
18/10/2054 1,091,386 0.24
EUR 500,000 Hammerson Plc 4.875% 19/6/2015 750,386 0.17
GBP 50,000 Hammerson Plc 5.25% 15/12/2016 86,585 0.02
USD 340,000 HBOS Plc FRN 30/9/2016 267,750 0.06
EUR 634,949 Headingley RMBS '2011-1 A1B' FRN
11/3/2051 914,557 0.20
EUR 450,000 HSBC Holdings Plc 6% 10/6/2019 671,328 0.15
GBP 35,000 JTI UK Finance Plc 5.75% 6/2/2013 60,514 0.01
EUR 125,000 Lloyds TSB Bank Plc 6.25% 15/4/2014 190,803 0.04
EUR 1,250,000 Lloyds TSB Bank Plc 6.375% 17/6/2016 1,882,428 0.41
GBP 443,000 Marks & Spencer Plc 5.625% 24/3/2014 770,741 0.17
EUR 1,355,000 Mound Financing Plc FRN 8/2/2042 1,941,077 0.43
EUR 1,000,000 Nationwide Building Society 6.75%
22/7/2020 1,280,062 0.28
USD 1,240,000 Northern Rock Asset Management Plc
'144A' 5.625% 22/6/2017 1,342,833 0.30
EUR 300,000 Old Mutual Plc FRN 18/1/2017 425,664 0.09
EUR 1,785,000 Permanent Master Issuer Plc '2007-1 3A'
FRN 15/10/2033 2,568,278 0.57
GBP 578,000 Royal Bank of Scotland Plc/The 6%
17/5/2017 957,358 0.21
GBP 250,000 Royal Bank of Scotland Plc/The 6.625%
17/9/2018 421,160 0.09
GBP 649,000 Royal Bank of Scotland Plc/The 6.875%
17/5/2025 1,017,435 0.22
EUR 290,000 Severn Trent Utilities Finance Plc 5.25%
11/3/2016 462,333 0.10
USD 400,000 Standard Chartered Plc FRN 30/7/2037
(Perpetual) 377,854 0.08
EUR 20,000 Standard Life Plc FRN 12/7/2022 29,316 0.01
GBP 145,000 United Kingdom Gilt 4.25% 7/6/2032 256,748 0.06
GBP 2,505,000 United Kingdom Gilt 4.25% 7/9/2039 4,376,400 0.96
GBP 2,410,000 United Kingdom Gilt 4.25% 7/12/2040 4,196,114 0.92
GBP 190,000 United Kingdom Gilt 4.5% 7/12/2042 345,944 0.08
GBP 2,072,000 United Kingdom Gilt 4.75% 7/12/2038 3,919,273 0.86
GBP 730,000 Virgin Media Secured Finance Plc 5.5%
15/1/2021 1,175,365 0.26
GBP 765,000 Virgin Media Secured Finance Plc 7%
15/1/2018 1,305,591 0.29
USD 735,000 Vodafone Group Plc 4.15% 10/6/2014 792,840 0.18
USD 35,000 Vodafone Group Plc 5% 15/9/2015 39,260 0.01
44,942,711 9.90
Transferable Securities Admitted to an Official Stock Exchange Listing or Dealt in on Another Regulated Market
Holding Description Value (USD) %
Transferable Securities Admitted to an Official Stock Exchange Listing or Dealt in on Another Regulated Market
Holding Description Value (USD) %
Portfolio of Investments 31 August 2011

Audited Annual Report and Accounts 239
The notes on pages 261 to 270 form an integral part of these financial statements.
World Bond Fund continued
United States USD 185,000 Aetna Inc 6% 15/6/2016 215,335 0.05
USD 1,280,000 Ally Financial Inc 6.875% 15/9/2011 1,282,240 0.28
USD 980,000 Alpha Natural Resources Inc 6% 1/6/2019 955,500 0.21
USD 172,000 Altria Group Inc 9.25% 6/8/2019 227,292 0.05
USD 532,000 Altria Group Inc 10.2% 6/2/2039 764,606 0.17
GBP 1,250,000 American Express Credit Corp 5.375%
1/10/2014 2,168,415 0.48
USD 2,810,000 Arkle Master Issuer Plc '2010-2A 1A1'
'144A' FRN 17/5/2060 2,809,191 0.62
USD 5,415,000 Arran Residential Mortgages Funding Plc
'2006-2A A3B' '144A' FRN 20/9/2056 5,411,047 1.19
USD 150,000 AT&T Inc 6.5% 1/9/2037 172,075 0.04
EUR 375,000 BA Covered Bond Issuer 4.25% 5/4/2017 558,755 0.12
USD 450,000 BAE Systems Holdings Inc '144A' 4.95%
1/6/2014 486,583 0.11
USD 930,000 Ball Corp 5.75% 15/5/2021 923,025 0.20
USD 310,000 Ball Corp 6.75% 15/9/2020 327,050 0.07
USD 335,531 Banc of America Merrill Lynch Commercial
Mortgage Inc '2002-2 A3' 5.118%
11/7/2043 338,398 0.07
USD 1,325,000 Banc of America Merrill Lynch Commercial
Mortgage Inc '2007-4 A4' FRN
10/2/2051 1,418,156 0.31
USD 75,000 Bank of America Corp 5.75% 1/12/2017 77,226 0.02
USD 280,000 Bear Stearns Cos LLC/The 6.95%
10/8/2012 296,023 0.07
USD 650,000 Boeing Co/The 5% 15/3/2014 715,247 0.16
USD 1,000,000 Capital One Capital V 10.25% 15/8/2039 1,037,500 0.23
USD 1,855,000 Capital One Financial Corp 3.15%
15/7/2016 1,846,167 0.41
GBP 750,000 Capital One Multi-Asset Execution Trust
FRN 17/6/2014 1,286,401 0.28
USD 645,000 Capital One Multi-Asset Execution Trust
'2006-A5 A5' FRN 15/1/2016 644,195 0.14
USD 645,000 Capital One Multi-Asset Execution Trust
'2006-A12 A' FRN 15/7/2016 643,287 0.14
USD 700,000 Celanese US Holdings LLC 5.875%
15/6/2021 702,625 0.15
USD 1,280,000 Chesapeake Energy Corp 6.125%
15/2/2021 1,294,400 0.29
USD 511,000 Citibank Omni Master Trust '144A' FRN
15/8/2018 535,909 0.12
USD 748,000 Citibank Omni Master Trust '144A' 3.35%
15/8/2016 763,426 0.17
USD 300,000 Citigroup Inc 5.3% 17/10/2012 310,331 0.07
USD 300,000 Citigroup Inc 6.875% 5/3/2038 317,827 0.07
USD 250,000 Coca-Cola Co/The 3.625% 15/3/2014 268,662 0.06
USD 125,000 Comcast Cable Communications Holdings
Inc 8.375% 15/3/2013 138,768 0.03
USD 2,500,000 Comcast Corp 5.15% 1/3/2020 2,849,901 0.63
USD 75,000 Comcast Corp 6.5% 15/11/2035 84,423 0.02
USD 95,000 Comcast Corp 6.95% 15/8/2037 111,473 0.02
USD 1,050,000 Consol Energy Inc 8.25% 1/4/2020 1,123,500 0.25
USD 36,302 Countrywide Alternative Loan Trust
'2005-20CB 3A3' 5.5% 25/7/2035 35,448 0.01
USD 60,413 Countrywide Asset-Backed Certificate
'2007-2 2A1' FRN 25/8/2037 58,910 0.01
USD 35,255 Countrywide Home Loan Mortgage
Pass Through Trust '2004-29 1A1'
FRN 25/2/2035 29,042 0.01
USD 112,826 Credit Suisse First Boston Mortgage
Securities Corp '2002-CKS4 A2'
5.183% 15/11/2036 115,141 0.03
USD 500,000 Crown Castle Towers LLC '144A' 6.113%
15/1/2020 567,338 0.12
USD 940,041 DBUBS Mortgage Trust '144A' 3.742%
10/11/2046 960,121 0.21
USD 905,000 DISH DBS Corp 6.625% 1/10/2014 932,150 0.21
USD 440,000 Domtar Corp 10.75% 1/6/2017 551,100 0.12
USD 6,400,000 Fannie Mae Pool '4 9/11' 4% TBA 6,655,000 1.47
USD 8,200,000 Fannie Mae Pool '4.5 9/11' 4.5% TBA 8,675,343 1.91
USD 1,800,000 Fannie Mae Pool '5 9/11' 5% TBA 1,934,656 0.43
USD 4,800,000 Fannie Mae Pool '5.5 9/11' 5.5% TBA 5,236,595 1.15
USD 12,765 Fannie Mae Pool '545449' 6.5% 1/2/2017 14,040 0.00
USD 47,349 Fannie Mae Pool '545903' 5.5% 1/9/2017 51,533 0.01
USD 6,737 Fannie Mae Pool '589084' 6.5% 1/9/2031 7,688 0.00
USD 9,092 Fannie Mae Pool '657415' 5.5% 1/8/2017 9,896 0.00
USD 160,354 Fannie Mae Pool '675681' 5.5% 1/3/2018 174,825 0.04
USD 137,848 Fannie Mae Pool '735989' 5.5% 1/2/2035 151,672 0.03
USD 54,439 Fannie Mae Pool '745832' 6% 1/4/2021 59,309 0.01
USD 13,702 Fannie Mae Pool '745833' 6% 1/1/2021 14,902 0.00
USD 15,727 Fannie Mae Pool '885501' 5.5% 1/6/2021 17,196 0.00
USD 1,100,000 Federal Home Loan Banks 2% 14/9/2012 1,120,136 0.25
USD 69,699 First Union National Bank Commercial
Mortgage '2002-C1 A2' 6.141%
12/2/2034 70,175 0.02
USD 84,722 First Union National Bank Commercial
Mortgage '2001-C4 A2' 6.223%
12/12/2033 84,654 0.02
USD 1,122,000 Ford Credit Auto Owner Trust 1.35%
15/12/2016 1,137,105 0.25
USD 405,000 Ford Credit Floorplan Master Owner Trust
'144A' 1.77% 15/9/2014 409,831 0.09
USD 585,000 Ford Motor Credit Co LLC 6.625%
15/8/2017 611,055 0.13
USD 5,200,000 Freddie Mac Gold Pool '4 9/11' 4% TBA 5,400,687 1.19
USD 3,472,174 Freddie Mac Gold Pool 'A90278' 4.5%
1/12/2039 3,698,506 0.81
USD 906,546 Freddie Mac Gold Pool 'A91182' 4.5%
1/2/2040 965,639 0.21
USD 3,304,453 Freddie Mac Gold Pool 'A92415' 4.5%
1/6/2040 3,525,532 0.78
USD 46,929 Freddie Mac Gold Pool 'B19552' 5%
1/8/2020 50,794 0.01
USD 8,468 Freddie Mac Gold Pool 'G01443' 6.5%
1/8/2032 9,683 0.00
USD 27,703 Freddie Mac Gold Pool 'G11720' 4.5%
1/8/2020 29,712 0.01
USD 126,137 Freddie Mac Gold Pool 'G11769' 5%
1/10/2020 136,525 0.03
USD 51,417 Freddie Mac Gold Pool 'G11777' 5%
1/10/2020 55,651 0.01
USD 140,911 Freddie Mac Gold Pool 'G12454' 5.5%
1/11/2021 153,102 0.03
USD 54,951 Freddie Mac Gold Pool 'G18052' 4.5%
1/5/2020 58,928 0.01
USD 90,064 Freddie Mac Gold Pool 'J03831' 5%
1/11/2021 97,369 0.02
USD 50,000 GE Capital Commercial Mortgage Corp
4.578% 10/6/2048 51,356 0.01
USD 350,455 GE Capital Commercial Mortgage Corp
'2002-3A A2' 4.996% 10/12/2037 359,168 0.08
USD 229,270 GE Capital Commercial Mortgage Corp
'2002-1A A3' 6.269% 10/12/2035 232,166 0.05
USD 425,000 General Electric Capital Corp 6.15%
7/8/2037 447,382 0.10
USD 850,000 General Mills Inc 5.65% 15/2/2019 1,005,547 0.22
USD 450,000 Georgia-Pacific LLC 5.4% 1/11/2020 459,699 0.10
USD 26,044 Ginnie Mae I pool '437096' 6.5% 15/7/2031 29,884 0.01
USD 3,000,000 Ginnie Mae I pool '5 9/11' 5% TBA 3,305,157 0.73
USD 7,400,000 Ginnie Mae I pool '5.5 9/11' 5.5% TBA 8,242,908 1.81
Transferable Securities Admitted to an Official Stock Exchange Listing or Dealt in on Another Regulated Market
Holding Description Value (USD) %
Transferable Securities Admitted to an Official Stock Exchange Listing or Dealt in on Another Regulated Market
Holding Description Value (USD) %
Portfolio of Investments 31 August 2011

240 BlackRock Global Funds (BGF)
World Bond Fund continued
USD 9,375 Ginnie Mae I pool '781276' 6.5% 15/4/2031 10,757 0.00
USD 600,000 Ginnie Mae II pool '5.5 9/11' 5.5% TBA 669,562 0.15
SEK 1,000,000 Goldman Sachs Group Inc/The FRN
23/1/2012 157,118 0.03
EUR 1,381,000 Goldman Sachs Group Inc/The 3.5%
8/12/2011 2,006,413 0.44
USD 235,000 Goldman Sachs Group Inc/The 5.25%
15/10/2013 245,120 0.05
USD 1,000,000 Goldman Sachs Group Inc/The 6%
15/6/2020 1,044,885 0.23
USD 275,000 Goldman Sachs Group Inc/The 6.25%
1/9/2017 296,367 0.07
USD 55,051 GS Mortgage Securities Corp II '2000-1A A'
'144A' FRN 20/6/2024 43,153 0.01
USD 57,623 GSR Mortgage Loan Trust '2005-AR1 4A1'
FRN 25/1/2035 57,132 0.01
USD 1,148,000 Holmes Master Issuer Plc '2010-1A A2'
'144A' FRN 15/10/2054 1,147,664 0.25
USD 43,598 Home Equity Asset Trust '2007-2 2A1' FRN
25/7/2037 42,087 0.01
USD 520,000 Jabil Circuit Inc 7.75% 15/7/2016 569,400 0.13
USD 445,000 JP Morgan Chase Capital XXV 6.8%
1/10/2037 448,982 0.10
USD 200,000 JP Morgan Chase Commercial Mortgage
Securities Corp '2002-C2 A2' 5.05%
12/12/2034 206,482 0.05
USD 52,788 JP Morgan Chase Commercial Mortgage
Securities Corp '2001-C1 A3' 5.857%
12/10/2035 52,726 0.01
USD 785,000 JPMorgan Chase & Co 6% 15/1/2018 874,727 0.19
USD 1,405,000 Kraft Foods Inc 5.375% 10/2/2020 1,595,847 0.35
EUR 450,000 Kraft Foods Inc 5.75% 20/3/2012 663,224 0.15
USD 145,000 Kraft Foods Inc 6.5% 11/8/2017 175,269 0.04
USD 175,000 Lincoln National Corp FRN 17/5/2066 164,500 0.04
USD 423,863 Merrill Lynch Mortgage Trust '2002-MW1 A4'
5.619% 12/7/2034 430,064 0.09
USD 400,000 MetLife Inc 5.7% 15/6/2035 413,414 0.09
USD 849,000 MetLife Inc 6.75% 1/6/2016 990,640 0.22
USD 1,000,000 Morgan Stanley 4.75% 1/4/2014 1,012,010 0.22
USD 30,000 Morgan Stanley 5.55% 27/4/2017 30,718 0.01
USD 620,000 Morgan Stanley 6% 13/5/2014 648,903 0.14
USD 420,000 Morgan Stanley 6.25% 28/8/2017 445,631 0.10
USD 47,488 Morgan Stanley Home Equity Loan Trust
'2007-2 A1' FRN 25/4/2037 41,305 0.01
USD 850,000 New Jersey State Turnpike Authority 7.414%
1/1/2040 1,104,567 0.24
USD 35,000 News America Inc 6.2% 15/12/2034 37,022 0.01
USD 625,000 News America Inc 6.4% 15/12/2035 672,933 0.15
USD 575,000 PacifiCorp 6% 15/1/2039 692,820 0.15
USD 400,000 Prudential Financial Inc 3.875% 14/1/2015 414,286 0.09
USD 25,000 Qwest Corp FRN 15/6/2013 24,875 0.01
USD 695,000 Qwest Corp 8.875% 15/3/2012 715,850 0.16
USD 170,000 SLM Corp 5.4% 25/10/2011 170,006 0.04
USD 920,886 SLM Student Loan Trust '2010-1 A' FRN
25/3/2025 916,975 0.20
USD 852,481 SLM Student Loan Trust '144A' 0%
15/7/2042 803,255 0.18
USD 2,265,000 SLM Student Loan Trust FRN 25/1/2018 2,312,771 0.51
USD 1,475,000 State of California 5.25% 1/4/2014 1,606,644 0.35
USD 40,000 TCI Communications Inc 7.125% 15/2/2028 48,612 0.01
USD 50,000 TCI Communications Inc 7.875% 15/2/2026 67,971 0.02
USD 600,000 Time Warner Cable Inc 8.25% 14/2/2014 692,617 0.15
USD 15,000,000 United States Treasury Bill 0% 20/10/2011
(Zero Coupon) 14,999,783 3.30
USD 5,259,000 United States Treasury Note/Bond 0.375%
31/8/2012 5,272,250 1.16
USD 4,840,000 United States Treasury Note/Bond 0.375%
30/6/2013 4,856,070 1.07
USD 2,545,000 United States Treasury Note/Bond 3.75%
15/8/2041 2,640,835 0.58
USD 670,000 United States Treasury Note/Bond 6.875%
15/8/2025 994,165 0.22
USD 1,000,000 Verizon Communications Inc 6.35%
1/4/2019 1,216,405 0.27
USD 350,000 Verizon Communications Inc 8.75%
1/11/2018 474,754 0.10
USD 15,000 Verizon New Jersey IncSeries A 5.875%
17/1/2012 15,282 0.00
USD 700,000 Waste Management Inc 7.375%
11/3/2019 893,440 0.20
USD 200,000 Wells Fargo & Co 4.375% 31/1/2013 208,305 0.05
EUR 1,250,000 Zurich Finance USA Inc FRN 2/10/2023 1,802,404 0.40
149,244,212 32.86
Total Bonds 472,417,025 104.02
Total Transferable Securities Admitted
to an Official Stock Exchange Listing or
Dealt in on Another Regulated Market 472,417,025 104.02
Unquoted Securities
BONDS
Canada CAD 865,000 Air Canada '144A' 10.125% 1/8/2015 866,638 0.19
Germany CAD 200,000 Landwirtschaftliche Rentenbank 4.875%
21/2/2020 227,037 0.05
Malaysia USD 465,000 Hong Leong Bank Bhd 3.75%
17/3/2016 478,880 0.11
Netherlands CAD 100,000 Bank Nederlandse Gemeenten 5.15%
7/3/2025 115,049 0.02
United Kingdom EUR 100,000 Lehman Brothers UK Capital Funding III
LP (Defaulted) 3.875% 22/11/2011 – 0.00
Total Bonds 1,687,604 0.37
Total Unquoted Securities 1,687,604 0.37
Total Portfolio 474,104,629 104.39
Other Net Liabilities (19,932,896) (4.39)
Total Net Assets (USD) 454,171,733 100.00
Transferable Securities Admitted to an Official Stock Exchange Listing or Dealt in on Another Regulated Market
Holding Description Value (USD) %
Transferable Securities Admitted to an Official Stock Exchange Listing or Dealt in on Another Regulated Market
Holding Description Value (USD) %
Portfolio of Investments 31 August 2011

Audited Annual Report and Accounts 241
The notes on pages 261 to 270 form an integral part of these financial statements.
World Bond Fund continued
Note: The total market value of USD 270,041 of these transactions is included in the Statement of Net Assets (see Note 2c).
Nominal Value Description
Unrealisedprofit/(loss)
USD
Nominal Value Description
Unrealisedprofit/(loss)
USD
Swaps as at 31 August 2011
EUR (100,000) Credit Default Swaps (Barclays) (Fund provides default
protection on Imperial Tobacco Group Plc 6.25%
4/12/2018; and receives Fixed 0.71%) (20/9/2012) 187
EUR (300,000) Credit Default Swaps (Barclays) (Fund provides default
protection on Imperial Tobacco Group Plc 6.25%
4/12/2018; and receives Fixed 0.71%) (20/9/2012) (3,267)
EUR 300,000 Credit Default Swaps (Barclays) (Fund receives default
protection on StMicroelectronics 0% 5/7/2013; and
pays Fixed 0.26%) (20/9/2012) 3,692
EUR 150,000 Credit Default Swaps (Citibank) (Fund receives default
protection on STMicroelectronics NV 0% 5/7/2013;
and pays Fixed 0.255%) (20/9/2012) 1,634
EUR 10,200,000 Interest Rate Swaps (Barclays) (Fund receives Fixed
3.14%; and pays Floating EUR Euribor 6 Month)
(5/5/2013) 385,862
EUR (3,275,000) Credit Default Swaps (Deutsche Bank) (Fund provides
default protection on Vodafone Group Plc 5%
4/8/2016; and receives Fixed 1%) (20/9/2016) (30,431)
EUR (2,245,000) Credit Default Swaps (Deutsche Bank) (Fund provides
default protection on Alstom SA 4% 23/9/2014;
and receives Fixed 1%) (20/9/2016) (87,826)
EUR 3,275,000 Credit Default Swaps (Deutsche Bank) (Fund receives
default protection on Koninklijke KPN NV 8.375%
1/10/2030; and pays Fixed 1%) (20/9/2016) 89,144
USD 2,500,000 Interest Rate Swaps (Deutsche Bank) (Fund receives
Floating USD LIBOR 3 Month; and pays Fixed
3.29%) (19/8/2041) (47,057)
311,938
Open Futures Contractsas at 31 August 2011
Numberof contracts Contract/Description
Expirationdate
ValueUSD
(6) Australian 10 Year Bond September 2011 (4,916,848)
(12) Japanese 10 Year Bond (TSE) September 2011 (22,281,689)
(38) Australian 3 Year Bond September 2011 (10,998,148)
(58) Euro BOBL September 2011 (10,222,187)
(462) Euro Schatz September 2011 (73,004,948)
100 US Long Bond (CBT) December 2011 13,696,875
21 Canadian 10 Year Bond December 2011 2,808,322
21 US Ultra Bond (CBT) December 2011 3,033,844
10 US Treasury 2 Year Note (CBT) December 2011 2,205,000
(24) Long Gilt December 2011 (4,975,532)
(134) US Treasury 5 Year Note (CBT) December 2011 (16,434,891)
(156) US Treasury 10 Year Note December 2011 (20,180,062)
Total commitment (141,270,264)
Note: The net unrealised loss of USD 1,858,313 attributed to these transactions is included
in the Statement of Net Assets (see Note 2c).
Open Forward Foreign Exchange Transactionsas at 31 August 2011
Purchases Sales Value date Unrealised
profit/(loss)
Unrealisedprofit/(loss)
USD Equivalent
Core Fund USD
USD 5,740,241 DKK 29,764,000 1/9/2011 (28,956) (28,956)
EUR 4,035,000 GBP 3,593,842 8/9/2011 (37,123) (37,123)
GBP 3,044,194 EUR 3,430,000 8/9/2011 13,944 13,944
JPY 368,040,000 USD 4,666,176 9/9/2011 133,773 133,773
USD 4,181,160 JPY 335,490,000 9/9/2011 (194,275) (194,275)
GBP 2,218,000 USD 3,614,683 7/10/2011 3,075 3,075
USD 25,506,777 AUD 24,672,500 7/10/2011 (778,539) (778,539)
USD 14,840,003 CAD 14,690,500 7/10/2011 (242,852) (242,852)
USD 34,122,767 GBP 21,346,000 7/10/2011 (694,481) (694,481)
USD 68,291,452 JPY 5,528,490,000 7/10/2011 (3,827,092) (3,827,092)
USD 1,370,604 PLN 3,928,000 7/10/2011 8,015 8,015
USD 4,717,683 ZAR 32,704,300 7/10/2011 80,779 80,779
ZAR 23,603,000 USD 3,225,983 7/10/2011 120,515 120,515
SEK 61,080,042 EUR 6,635,000 14/10/2011 42,603 42,603
EUR 5,000,000 USD 7,122,345 26/10/2011 93,871 93,871
USD 156,009,844 EUR 108,792,000 26/10/2011 (1,003,475) (1,003,475)
USD 2,222,935 EUR 1,535,000 14/11/2011 8,045 8,045
AUD 4,260,000 USD 4,465,664 18/11/2011 50,504 50,504
USD 4,102,370 AUD 3,960,000 18/11/2011 (95,759) (95,759)
USD 5,735,237 DKK 29,447,000 1/12/2011 32,776 32,776
CNY 37,172,080 USD 5,830,000 13/2/2012 47,486 47,486
Net unrealised loss (6,267,166) (6,267,166)
CHF Hedged Share Class CHF
CHF 175,894,546 USD 215,102,322 14/9/2011 2,617,149 3,247,889
Net unrealised profit 2,617,149 3,247,889
EUR Hedged Share Class EUR
EUR 18,889,015 USD 26,788,840 14/9/2011 336,347 485,770
USD 212,820 EUR 147,987 14/9/2011 (598) (864)
Net unrealised profit 335,749 484,906
Total net unrealised loss (2,534,371)
Note: The net unrealised loss attributed to these transactions is included in the Statement
of Net Assets (see Note 2c).

242 BlackRock Global Funds (BGF)
World Energy Fund
FUNDS
Ireland 199,979,398 Institutional Cash Series Plc - Institutional
US Dollar Liquidity Fund 199,979,398 3.75
Total Funds 199,979,398 3.75
COMMON STOCKS (SHARES)
Australia 26,682,660 Rialto Energy Ltd 11,138,326 0.21
Canada 1,188,444 Athabasca Oil Sands Corp 16,877,323 0.32
9,986,320 BNK Petroleum Inc 31,811,487 0.60
1,735,600 C&C Energia Ltd 14,446,128 0.27
1,743,000 Canadian Natural Resources Ltd 66,077,130 1.24
2,000,000 Canadian Oil Sands Ltd (Unit) * 47,844,252 0.90
1,433,000 Cenovus Energy Inc * 51,464,786 0.96
2,543,500 Crescent Point Energy Corp * 115,445,215 2.17
3,016,406 Enbridge Inc * 99,063,431 1.86
24,211,500 LNG Energy Ltd 6,344,226 0.12
2,550,000 Nexen Inc 54,922,242 1.03
883,194 Niko Resources Ltd * 49,915,520 0.94
3,052,000 Penn West Petroleum Ltd (Unit) * 57,329,416 1.07
1,800,000 PetroNova Inc 2,108,600 0.04
3,382,036 Sterling Resources Ltd 4,448,412 0.08
4,052,600 Suncor Energy Inc 130,803,232 2.45
6,027,000 Talisman Energy Inc 101,135,627 1.90
14,376,450 Ur-Energy Inc 18,170,780 0.34
868,207,807 16.29
Cayman Islands 5,174,005 Coastal Energy Co 55,293,869 1.04
11,949,878 Green Dragon Gas Ltd 105,218,676 1.97
35,875,134 Greka Drilling Ltd 18,147,167 0.34
178,659,712 3.35
China 6,278,000 Yanzhou Coal Mining Co Ltd 'H' 18,245,757 0.34
France 1,472,000 Technip SA 143,788,788 2.70
1,250,000 Total SA 61,304,352 1.15
205,093,140 3.85
Ireland 68,132,777 San Leon Energy Plc 20,011,619 0.38
Isle of Man 8,845,328 3Legs Resources Plc 31,176,066 0.59
Italy 2,700,000 ENI SpA 54,160,120 1.02
1,124,000 Saipem SpA 50,076,630 0.94
104,236,750 1.96
Netherlands Antilles 3,001,100 Schlumberger Ltd 235,616,361 4.42
Nigeria 17,555,700 Oando Plc 5,004,282 0.09
Papua New Guinea 3,559,000 Oil Search Ltd 24,075,275 0.45
Spain 1,870,000 Repsol YPF SA 54,038,378 1.01
United Kingdom 36,171,520 Afren Plc * 61,796,953 1.16
9,993,020 Aurelian Oil & Gas Plc 7,582,341 0.14
7,391,000 BG Group Plc 159,798,501 3.00
38,314,690 BP Plc 251,611,722 4.72
1,387,444 Bumi Plc 22,220,785 0.42
17,289,950 Cairn Energy Plc 94,484,921 1.77
3,719,000 Royal Dutch Shell Plc 'B' 125,223,049 2.35
722,718,272 13.56
United States 3,531,709 Anadarko Petroleum Corp 264,489,687 4.96
898,965 Apache Corp 94,094,667 1.76
1,688,000 Baker Hughes Inc 103,170,560 1.94
1,225,000 Cameron International Corp 64,079,750 1.20
1,303,100 Chevron Corp 129,554,202 2.43
2,149,222 ConocoPhillips 147,157,230 2.76
843,000 Consol Energy Inc 38,938,170 0.73
2,290,772 Denbury Resources Inc 37,270,861 0.70
777,000 EOG Resources Inc 72,890,370 1.37
1,706,000 Exxon Mobil Corp 127,438,200 2.39
3,991,700 Halliburton Co 177,790,318 3.34
1,217,000 Hess Corp 72,423,670 1.36
18,696,712 Hyperdynamics Corp * 83,200,368 1.56
3,576,100 Marathon Oil Corp 96,626,222 1.81
3,178,012 National Oilwell Varco Inc 214,897,172 4.03
1,737,140 Noble Energy Inc 153,841,118 2.89
1,714,700 Occidental Petroleum Corp 151,185,099 2.84
800,000 Peabody Energy Corp 39,648,000 0.74
1,094,000 Range Resources Corp 72,433,740 1.36
2,802,000 Rowan Cos Inc 102,945,480 1.93
4,000,000 SandRidge Energy Inc 30,520,000 0.57
2,411,400 Southwestern Energy Co 92,573,646 1.74
2,367,168,529 44.41
Total Common Stocks (Shares) 4,845,390,274 90.91
BONDS
Luxembourg USD 40,000,000 Glencore Finance Europe SA 5%
31/12/2014 53,250,000 1.00
Total Bonds 53,250,000 1.00
Total Transferable Securities Admitted
to an Official Stock Exchange Listing or
Dealt in on Another Regulated Market 5,098,619,672 95.66
Transferable Securities Admitted to an Official Stock Exchange Listing or Dealt in on Another Regulated Market
Holding Description Value (USD) %
Transferable Securities Admitted to an Official Stock Exchange Listing or Dealt in on Another Regulated Market
Holding Description Value (USD) %
Portfolio of Investments 31 August 2011

* Securities lent, see Note 11, for further details.
Audited Annual Report and Accounts 243
The notes on pages 261 to 270 form an integral part of these financial statements.
World Energy Fund continued
COMMON STOCKS (SHARES) & WARRANTS
Bermuda 16,967,860 Mitra Energy Ltd 76,355,370 1.43
987,500 Mitra Energy Ltd (Wts 17/5/2011) – 0.00
76,355,370 1.43
Canada 350,000 Connaught Oil And Gas Ord Shares Cad
(Private) 14,386,158 0.27
7,110,000 Griffiths Energy Intl Inc Npv (Placing) 46,759,125 0.88
61,145,283 1.15
United Kingdom 3,852,000 Hurricane Exploration Plc 69,769,061 1.31
United States 450,218 Caithness Petroleum Ltd 19,174,785 0.36
Total Common Stocks (Shares) & Warrants 226,444,499 4.25
Total Unquoted Securities 226,444,499 4.25
Total Portfolio 5,325,064,171 99.91
Other Net Assets 4,997,844 0.09
Total Net Assets (USD) 5,330,062,015 100.00
Unquoted Securities
Holding Description Value (USD) %
Unquoted Securities
Holding Description Value (USD) %
Portfolio of Investments 31 August 2011
Open Forward Foreign Exchange Transactionsas at 31 August 2011
Purchases Sales Value date Unrealised
profit/(loss)
Unrealisedprofit/(loss)
USD Equivalent
CHF Hedged Share Class CHF
CHF 1,176,695 USD 1,488,690 14/9/2011 (22,531) (27,961)
USD 607,227 CHF 483,332 14/9/2011 5,825 7,229
Net unrealised loss (16,706) (20,732)
EUR Hedged Share Class EUR
EUR 357,664,999 USD 508,143,841 14/9/2011 5,748,900 8,302,860
USD 99,121,085 EUR 69,262,428 14/9/2011 (615,910) (889,529)
Net unrealised profit 5,132,990 7,413,331
SGD Hedged Share Class SGD
SGD 149,897,441 USD 122,969,107 14/9/2011 2,020,853 1,680,403
USD 17,163,753 SGD 20,810,219 14/9/2011 (169,936) (141,307)
Net unrealised profit 1,850,917 1,539,096
Total net unrealised profit 8,931,695
Note: The net unrealised profit attributed to these transactions is included in the Statement
of Net Assets (see Note 2c).
Sector Breakdownas at 31 August 2011
% of netassets
Oil & Gas Exploration & Production 40.48
Integrated Oil & Gas 28.44
Oil & Gas Equipment & Services 19.45
Investment Funds 3.75
Coal & Consumable Fuels 2.57
Oil & Gas Drilling 2.27
Oil & Gas Storage & Transportation 1.86
Coatings/Paint 1.00
Oil & Gas Refining & Marketing 0.09
Other Net Assets 0.09
100.00

* Securities lent, see Note 11, for further details.
244 BlackRock Global Funds (BGF)
World Financials Fund
COMMON STOCKS (SHARES)
Australia 157,800 Australia & New Zealand Banking Group Ltd 3,427,009 1.83
47,950 Commonwealth Bank of Australia 2,474,811 1.33
5,901,820 3.16
Bermuda 66,300 Arch Capital Group Ltd 2,237,625 1.20
Canada 179,900 Bank of Nova Scotia * 10,002,890 5.35
3,600 Fairfax Financial Holdings Ltd 1,436,067 0.77
36,700 Intact Financial Corp * 2,111,888 1.13
13,550,845 7.25
France 102,400 BNP Paribas SA 5,250,529 2.81
20,550 Unibail-Rodamco SE (Reit) 4,451,606 2.38
9,702,135 5.19
Germany 41,350 Allianz SE 4,289,385 2.29
553,820 Commerzbank AG 1,656,389 0.89
44,600 Deutsche Bank AG 1,817,952 0.97
65,200 Muenchener Rueckversicherungs AG 8,511,961 4.55
16,275,687 8.70
Hong Kong 523,300 AIA Group Ltd 1,836,456 0.98
Indonesia 3,342,100 Bank Rakyat Indonesia Persero Tbk PT 2,565,423 1.37
Ireland 76,900 XL Group Plc 'A' 1,594,906 0.85
Italy 191,300 Assicurazioni Generali SpA 3,425,707 1.83
430,300 Credito Emiliano SpA 1,933,858 1.03
858,900 Fondiaria-Sai SpA 1,879,182 1.01
1,977,214 Intesa Sanpaolo SpA 3,232,315 1.73
10,471,062 5.60
Japan 249,150 Mitsubishi Estate Co Ltd 4,074,518 2.18
669,900 Mitsubishi UFJ Financial Group Inc 3,005,289 1.61
272 Nippon Building Fund Inc (Reit) 2,915,806 1.56
194,500 Promise Co Ltd 1,377,328 0.73
11,372,941 6.08
Netherlands 179,800 Aegon NV 807,539 0.43
322,700 ING Groep NV 2,798,968 1.50
3,606,507 1.93
Norway 679,488 DnB NOR ASA 8,167,259 4.37
Spain 218,200 Banco Santander SA 1,979,234 1.06
Switzerland 600 Banque Cantonale Vaudoise 347,719 0.18
223,600 UBS AG 3,229,875 1.73
13,950 Zurich Financial Services AG 3,124,729 1.67
6,702,323 3.58
Thailand 693,500 Siam Commercial Bank PCL 2,753,637 1.47
United Kingdom 615,400 Amlin Plc 3,081,373 1.65
948,400 Barclays Plc 2,624,539 1.40
177,600 Hargreaves Lansdown Plc 1,225,559 0.66
833,620 HSBC Holdings Plc 7,259,705 3.88
202,440 Standard Chartered Plc 4,589,956 2.45
18,781,132 10.04
United States 48,700 Affiliated Managers Group Inc 4,287,061 2.29
21,300 Aflac Inc 807,696 0.43
610,438 Bank of America Corp 5,030,009 2.69
88,400 Bank of New York Mellon Corp/The 1,858,168 0.99
49,200 Berkshire Hathaway Inc 'B' 3,610,788 1.93
137,340 Citigroup Inc 4,300,115 2.30
38,250 Cullen/Frost Bankers Inc 1,947,308 1.04
26,900 Franklin Resources Inc 3,246,292 1.74
31,800 Goldman Sachs Group Inc 3,675,762 1.97
180,300 Host Hotels & Resorts Inc (Reit) 2,138,358 1.14
151,300 JPMorgan Chase & Co 5,716,114 3.06
12,300 Mastercard Inc 'A' 4,110,783 2.20
37,150 Public Storage (Reit) 4,579,109 2.45
57,462 Simon Property Group Inc (Reit) 6,717,308 3.59
20,800 SunTrust Banks Inc 414,960 0.22
378,700 Wells Fargo & Co 9,819,691 5.25
62,259,522 33.29
Total Common Stocks (Shares) 179,758,514 96.12
Total Transferable Securities Admitted
to an Official Stock Exchange Listing or
Dealt in on Another Regulated Market 179,758,514 96.12
Total Portfolio 179,758,514 96.12
Other Net Assets 7,265,363 3.88
Total Net Assets (USD) 187,023,877 100.00
Transferable Securities Admitted to an Official Stock Exchange Listing or Dealt in on Another Regulated Market
Holding Description Value (USD) %
Transferable Securities Admitted to an Official Stock Exchange Listing or Dealt in on Another Regulated Market
Holding Description Value (USD) %
Portfolio of Investments 31 August 2011

Audited Annual Report and Accounts 245
The notes on pages 261 to 270 form an integral part of these financial statements.
World Financials Fund continued
Sector Breakdownas at 31 August 2011
% of netassets
Diversified Banks 37.83
Other Diversified Financial Services 9.55
Property & Casualty Insurance 6.57
Multi-line Insurance 6.56
Retail REITs 5.97
Reinsurance 5.75
Asset Management & Custody Banks 5.68
Specialized REITs 3.59
Diversified Capital Markets 2.70
Data Processing & Outsourced Services 2.20
Diversified Real Estate Activities 2.18
Investment Banking & Brokerage 1.97
Life & Health Insurance 1.84
Office REITs 1.56
Regional Banks 1.44
Consumer Finance 0.73
Other Net Assets 3.88
100.00

246 BlackRock Global Funds (BGF)
World Gold Fund
FUNDS
Ireland 143,589,287 Institutional Cash Series Plc - Institutional
US Dollar Liquidity Fund 143,589,287 1.55
Jersey 200,000 ETFS Physical Palladium - ETF 15,332,000 0.17
150,000 ETFS Physical Platinum - ETF 27,156,000 0.29
42,488,000 0.46
Total Funds 186,077,287 2.01
COMMON STOCKS (SHARES) & WARRANTS
Australia 9,368,766 Ampella Mining Ltd 19,905,317 0.21
3,000,000 Centamin Egypt Ltd 5,140,012 0.06
3,500,000 Kingsgate Consolidated Ltd 34,165,602 0.37
3,000,000 Medusa Mining Ltd 25,848,975 0.28
19,500,000 Newcrest Mining Ltd 840,091,690 9.07
925,151,596 9.99
Bermuda 679,999,000 G-Resources Group Ltd 50,606,772 0.55
British Virgin Islands 5,000,000 Chaarat Gold Holdings Ltd 2,094,351 0.02
Canada 4,175,000 Agnico-Eagle Mines Ltd (Unit) 288,684,726 3.12
1,781,200 Alacer Gold Corp 19,895,691 0.21
2,000,000 Alamos Gold Inc * 38,719,317 0.42
9,000,000 B2Gold Corp 35,420,777 0.38
10,350,000 Banro Corp 50,518,536 0.55
4,000,000 Barrick Gold Corp 201,480,000 2.18
5,527,077 Belo Sun Mining Corp 6,815,435 0.07
3,333,300 Canaco Resources Inc 9,898,948 0.11
7,150,000 Centerra Gold Inc 150,397,522 1.62
1,180,000 Detour Gold Corp 42,851,433 0.46
17,875,000 Eldorado Gold Corp 351,196,950 3.79
6,000,000 European Goldfields Ltd 71,519,758 0.77
5,050,000 Franco-Nevada Corp (Unit) * 218,728,690 2.36
12,665,000 Goldcorp Inc 656,703,359 7.09
14,750,000 Great Basin Gold Ltd 32,284,081 0.35
1,250,000 Guyana Goldfields Inc 12,138,321 0.13
1,900,000 Harry Winston Diamond Corp 29,676,589 0.32
12,200,000 IAMGOLD Corp 252,986,758 2.73
2,788,700 Keegan Resources Inc 22,409,148 0.24
39,000,000 Kinross Gold Corp 673,272,206 7.27
869,000 Kinross Gold Corp (Call Wts 17/9/2014) 2,696,768 0.03
4,000,000 Lake Shore Gold Corp 9,289,348 0.10
5,500,000 Nevsun Resources Ltd (Unit) 37,866,424 0.41
12,350,000 New Gold Inc 167,516,537 1.81
30,813,155 Romarco Minerals Inc 46,544,707 0.50
19,969,667 Rusoro Mining Ltd 2,770,266 0.03
2,187,282 Teranga Gold Corp 5,259,415 0.06
666,660 Tigray Resources Inc 616,544 0.01
12,600,000 Yamana Gold Inc 200,945,858 2.17
3,639,104,112 39.29
China 37,500,000 Zijin Mining Group Co Ltd 'H' 17,418,558 0.19
Jersey 1,245,107 Polyus Gold International Ltd GDR 4,357,874 0.05
3,965,000 Randgold Resources Ltd ADR 420,488,250 4.54
424,846,124 4.59
Mexico 9,150,000 Industrias Penoles SAB de CV 441,089,821 4.76
Peru 10,935,000 Cia de Minas Buenaventura SA ADR 516,132,000 5.57
22,500,442 Volcan Cia Minera SAA 'B' 24,665,919 0.27
540,797,919 5.84
Russian Federation 4,721,400 Polymetal JSC 102,960,892 1.11
3,400,000 Polymetal JSC GDR 74,800,000 0.81
177,760,892 1.92
South Africa 6,275,000 African Rainbow Minerals Ltd 165,096,961 1.78
3,750,000 AngloGold Ashanti Ltd ADR 167,175,000 1.80
12,000,000 Gold Fields Ltd 196,976,432 2.13
1,900,000 Gold Fields Ltd ADR 31,312,000 0.34
12,500,000 Harmony Gold Mining Co Ltd 166,006,989 1.79
8,500,000 Harmony Gold Mining Co Ltd ADR * 113,560,000 1.23
12,150,000 Impala Platinum Holdings Ltd 313,782,070 3.39
1,153,909,452 12.46
United Kingdom 13,000,000 Archipelago Resources Plc 16,121,690 0.17
21,970,000 Fresnillo Plc 749,614,038 8.09
15,442,182 Hochschild Mining Plc 125,736,925 1.36
9,000,000 Patagonia Gold Plc 9,330,151 0.10
7,700,000 Petropavlovsk Plc 109,939,156 1.19
2,215,000 Rio Tinto Plc 136,802,248 1.48
1,147,544,208 12.39
United States 1,400,000 Gold Resource Corp * 33,754,000 0.36
5,050,000 Newmont Mining Corp 317,190,500 3.43
350,944,500 3.79
Total Common Stocks (Shares) & Warrants 8,871,268,305 95.79
BONDS
Bermuda USD 9,000,000 Aquarius Platinum Ltd 4% 18/12/2015 8,856,000 0.10
Canada CAD 3,348,000 Great Basin Gold Ltd 8% 30/11/2014 4,362,016 0.05
United Kingdom USD 10,000,000 Hochschild Mining Plc 5.75%
20/10/2014 14,216,550 0.15
Total Bonds 27,434,566 0.30
Total Transferable Securities Admitted
to an Official Stock Exchange Listing or
Dealt in on Another Regulated Market 9,084,780,158 98.10
Transferable Securities Admitted to an Official Stock Exchange Listing or Dealt in on Another Regulated Market
Holding Description Value (USD) %
Transferable Securities Admitted to an Official Stock Exchange Listing or Dealt in on Another Regulated Market
Holding Description Value (USD) %
Portfolio of Investments 31 August 2011

* Securities lent, see Note 11, for further details.
Audited Annual Report and Accounts 247
The notes on pages 261 to 270 form an integral part of these financial statements.
COMMON STOCKS (SHARES)
International 2,956 Grafton Resource Investments Ltd 74,265 0.00
Jersey 23,790,165 Polyus Gold International Ltd 85,168,791 0.92
Russian Federation 5,317,500 Vysochajshiy OAO 67,532,250 0.73
Total Common Stocks (Shares) 152,775,306 1.65
Total Unquoted Securities 152,775,306 1.65
Total Portfolio 9,237,555,464 99.75
Other Net Assets 23,403,734 0.25
Total Net Assets (USD) 9,260,959,198 100.00
Unquoted Securities
Holding Description Value (USD) %
Portfolio of Investments 31 August 2011
World Gold Fund continued
Sector Breakdownas at 31 August 2011
% of netassets
Gold 72.47
Precious Metals & Minerals 21.42
Diversified Metals & Mining 3.85
Investment Funds 2.01
Other Net Assets 0.25
100.00
Open Forward Foreign Exchange Transactionsas at 31 August 2011
Purchases Sales Value date Unrealised
profit/(loss)
Unrealisedprofit/(loss)
USD Equivalent
CHF Hedged Share Class CHF
CHF 18,018,673 USD 22,037,108 14/9/2011 266,504 330,733
Net unrealised profit 266,504 330,733
EUR Hedged Share Class EUR
EUR 569,425,227 USD 810,504,096 14/9/2011 8,108,891 11,711,281
USD 64,881,635 EUR 45,133,808 14/9/2011 (199,894) (288,697)
Net unrealised profit 7,908,997 11,422,584
SGD Hedged Share Class SGD
SGD 50,978,135 USD 41,827,031 14/9/2011 679,009 564,617
USD 4,074,628 SGD 4,934,855 14/9/2011 (34,908) (29,027)
Net unrealised profit 644,101 535,590
Total net unrealised profit 12,288,907
Note: The net unrealised profit attributed to these transactions is included in the Statement
of Net Assets (see Note 2c).

* Securities lent, see Note 11, for further details.
248 BlackRock Global Funds (BGF)
World Healthscience Fund
COMMON STOCKS (SHARES)
Cayman Islands 169,200 3SBio Inc ADR 2,270,664 0.43
23,900 China Kanghui Holdings Inc ADR 456,490 0.08
74,800 ShangPharma Corp ADR 733,788 0.14
3,460,942 0.65
France 53,800 Sanofi-Aventis SA 3,933,723 0.74
Germany 65,500 Fresenius Medical Care AG & Co KGaA 4,445,356 0.84
49,300 Merck KGaA 4,420,610 0.83
8,865,966 1.67
Ireland 197,000 Covidien Plc 10,364,170 1.95
436,200 Elan Corp Plc ADR 4,632,444 0.87
14,996,614 2.82
Italy 72,200 DiaSorin SpA * 3,116,569 0.59
Jersey 61,800 Shire Plc ADR 5,953,812 1.12
Switzerland 49,100 Roche Holding AG 8,518,234 1.60
United Kingdom 131,900 GlaxoSmithKline Plc 2,829,170 0.53
64,600 GlaxoSmithKline Plc ADR 2,770,048 0.52
136,600 Smith & Nephew Plc 1,395,335 0.27
6,994,553 1.32
United States 156,200 Abbott Laboratories 8,117,714 1.53
102,500 Achillion Pharmaceuticals Inc 616,025 0.12
210,600 Acorda Therapeutics Inc 5,574,582 1.05
416,300 Aetna Inc 17,068,300 3.21
96,900 Agilent Technologies Inc 3,642,471 0.68
111,200 Alexion Pharmaceuticals Inc 6,518,544 1.23
209,384 Allergan Inc/United States 17,127,611 3.22
312,000 AmerisourceBergen Corp 'A' 12,448,800 2.34
174,800 Amgen Inc 9,690,038 1.82
98,200 Ariad Pharmaceuticals Inc 983,964 0.19
14,200 Arqule Inc 63,616 0.01
82,800 Auxilium Pharmaceuticals Inc 1,462,248 0.27
165,800 Baxter International Inc 9,337,856 1.76
114,400 Biogen Idec Inc 10,767,328 2.02
106,800 BioMarin Pharmaceutical Inc 3,177,300 0.60
352,800 Bristol-Myers Squibb Co 10,439,352 1.96
382,200 Cardinal Health Inc 16,404,024 3.08
222,600 Celgene Corp 13,373,808 2.51
68,400 CIGNA Corp 3,283,200 0.62
27,700 CONMED Corp 658,983 0.12
153,300 Cooper Cos Inc/The 11,569,551 2.18
40,200 CR Bard Inc 3,836,688 0.72
85,800 Cubist Pharmaceuticals Inc 2,973,828 0.56
107,200 DaVita Inc 8,019,632 1.51
126,300 DENTSPLY International Inc 4,424,289 0.83
105,100 Eli Lilly & Co 3,941,250 0.74
128,900 Express Scripts Inc 6,144,083 1.16
73,100 Forest Laboratories Inc 2,524,874 0.47
245,000 Gilead Sciences Inc 9,797,550 1.84
222,800 Henry Schein Inc 14,800,604 2.78
624,700 Hologic Inc 10,513,701 1.98
144,200 Hospira Inc 6,682,228 1.26
35,000 Humana Inc 2,747,850 0.52
91,500 Incyte Corp Ltd 1,464,000 0.28
109,100 Integra LifeSciences Holdings Corp 4,386,911 0.82
124,100 Ironwood Pharmaceuticals Inc 1,609,577 0.30
312,300 Johnson & Johnson 20,621,169 3.88
51,200 Laboratory Corp of America Holdings 4,318,208 0.81
185,900 Life Technologies Corp 7,832,897 1.47
168,100 McKesson Corp 13,442,957 2.53
278,000 Medco Health Solutions Inc 15,548,540 2.92
105,900 Medicis Pharmaceutical Corp 'A' 4,144,926 0.78
184,500 Medtronic Inc 6,461,190 1.22
382,500 Merck & Co Inc 12,660,750 2.38
34,800 Mettler-Toledo International Inc 5,463,600 1.03
150,200 Momenta Pharmaceuticals Inc 2,625,496 0.49
82,700 Mylan Inc/PA 1,709,401 0.32
92,400 Natus Medical Inc 959,112 0.18
215,300 NPS Pharmaceuticals Inc 1,629,821 0.31
161,400 Pall Corp 8,407,326 1.58
57,300 Par Pharmaceutical Cos Inc 1,748,796 0.33
1,122,300 Pfizer Inc 21,413,484 4.03
80,900 Rigel Pharmaceuticals Inc 649,627 0.12
31,400 Sirona Dental Systems Inc 1,466,380 0.28
208,400 St Jude Medical Inc 9,575,980 1.80
193,300 Stewart Enterprises Inc 'A' 1,188,795 0.22
46,400 Stryker Corp 2,268,032 0.43
339,100 Synta Pharmaceuticals Corp 1,502,213 0.28
40,777 Synutra International Inc 254,448 0.05
66,700 Thermo Fisher Scientific Inc 3,695,847 0.70
36,400 United Therapeutics Corp 1,561,560 0.29
406,000 UnitedHealth Group Inc 19,646,340 3.69
94,900 Vertex Pharmaceuticals Inc 4,383,431 0.82
136,800 Watson Pharmaceuticals Inc 9,324,288 1.75
53,100 WellPoint Inc 3,441,411 0.65
162,600 Wright Medical Group Inc 2,533,308 0.48
53,000 Zimmer Holdings Inc 3,007,220 0.57
439,678,933 82.68
Total Common Stocks (Shares) 495,519,346 93.19
Total Transferable Securities Admitted
to an Official Stock Exchange Listing or
Dealt in on Another Regulated Market 495,519,346 93.19
Total Portfolio 495,519,346 93.19
Other Net Assets 36,237,449 6.81
Total Net Assets (USD) 531,756,795 100.00
Transferable Securities Admitted to an Official Stock Exchange Listing or Dealt in on Another Regulated Market
Holding Description Value (USD) %
Transferable Securities Admitted to an Official Stock Exchange Listing or Dealt in on Another Regulated Market
Holding Description Value (USD) %
Portfolio of Investments 31 August 2011

Audited Annual Report and Accounts 249
The notes on pages 261 to 270 form an integral part of these financial statements.
World Healthscience Fund continued
Sector Breakdownas at 31 August 2011
% of netassets
Pharmaceuticals 29.13
Biotechnology 15.27
Health Care Equipment 13.25
Health Care Distributors 10.73
Managed Health Care 8.69
Health Care Services 7.24
Life Sciences Tools & Services 4.02
Health Care Supplies 3.01
Industrial Machinery 1.58
Specialized Consumer Services 0.22
Personal Products 0.05
Other Net Assets 6.81
100.00
Open Forward Foreign Exchange Transactionsas at 31 August 2011
Purchases Sales
Unrealisedprofit/(loss)
USDValue date
AUD 6,130,000 USD 6,410,203 7/10/2011 120,509
CAD 3,330,000 USD 3,453,597 7/10/2011 (34,659)
CHF 60,126,000 USD 71,602,971 7/10/2011 3,086,403
DKK 64,507,000 USD 12,471,391 7/10/2011 26,464
EUR 30,096,000 USD 43,293,950 7/10/2011 150,521
GBP 33,830,000 USD 54,468,641 7/10/2011 711,134
HKD 17,700,000 USD 2,271,819 7/10/2011 138
JPY 2,869,978,000 USD 35,759,752 7/10/2011 1,678,796
SEK 7,280,000 USD 1,120,912 7/10/2011 26,069
USD 24,200,895 CHF 19,046,000 7/10/2011 541,682
USD 15,319,087 EUR 10,636,000 7/10/2011 (34,296)
USD 7,564,101 GBP 4,618,000 7/10/2011 31,728
USD 2,215,893 HKD 17,233,000 7/10/2011 3,880
USD 4,919,648 JPY 377,335,000 7/10/2011 (2,646)
Net unrealised profit 6,305,723
Note: The net unrealised profit attributed to these transactions is included in the Statement
of Net Assets (see Note 2c).

250 BlackRock Global Funds (BGF)
World Income Fund
BONDS
Australia AUD 3,300,000 Australia Government Bond 3% 20/9/2025 4,230,072 1.22
AUD 590,000 Commonwealth Bank of Australia 5.75%
17/12/2013 649,912 0.19
AUD 8,615,000 New South Wales Treasury Corp 2.75%
20/11/2025 10,460,038 3.01
AUD 3,230,000 Queensland Treasury Corp 6% 14/9/2017 3,714,711 1.07
19,054,733 5.49
Belgium EUR 2,680,000 Belgium Government Bond 2.75%
28/3/2016 3,813,730 1.10
Canada CAD 1,610,000 Canadian Government Bond 3.25%
1/6/2021 1,777,248 0.51
USD 2,800,000 CDP Financial Inc '144A' 3% 25/11/2014 2,954,430 0.85
4,731,678 1.36
Cayman Islands USD 4,020,000 Petrobras International Finance Co - Pifco
3.875% 27/1/2016 4,128,870 1.19
Colombia USD 1,010,000 Colombia Government International
Bond 7.375% 18/9/2037 1,360,091 0.39
Denmark EUR 1,125,000 Kommunekredit 4.375% 2/10/2012 1,677,086 0.48
DKK 26,675,000 Nykredit Realkredit A/S 4% 1/10/2041 5,039,846 1.45
EUR 210,000 TDC A/S 6.5% 19/4/2012 311,479 0.09
7,028,411 2.02
Dominican Republic USD 737,759 Dominican Republic International Bond
9.04% 23/1/2018 822,502 0.24
El Salvador USD 1,420,000 El Salvador Government International
Bond 7.625% 1/2/2041 1,476,800 0.43
France EUR 312,085 AUTO ABS Srl '2007-1 A' FRN 25/2/2019 449,311 0.13
EUR 266,310 AUTO ABS Srl '2007-2 A' FRN 25/10/2020 379,185 0.11
USD 2,050,000 BNP Paribas SA FRN 27/4/2017 1,985,046 0.57
EUR 500,000 Credit Agricole Home Loan SFH 3.5%
21/7/2014 747,278 0.21
EUR 2,322,000 France Government Bond OAT 4.5%
25/4/2041 3,839,156 1.11
EUR 600,000 Pernod-Ricard SA 5% 15/3/2017 860,483 0.25
EUR 1,200,000 Societe Generale SA FRN 7/6/2017 1,613,877 0.46
9,874,336 2.84
Germany EUR 525,000 Bundesrepublik Deutschland 3.25%
4/7/2021 830,705 0.24
EUR 325,000 Bundesrepublik Deutschland 4.75%
4/7/2040 620,223 0.18
EUR 5,020,000 Bundesrepublik Deutschland
Bundesobligation Inflation Linked Bond
2.25% 15/4/2013 8,258,267 2.38
EUR 331,000 Dexia Kommunalbank Deutschland AG
1.625% 21/10/2013 473,732 0.13
EUR 110,000 HSH Nordbank AG FRN 14/2/2017 92,143 0.03
EUR 995,000 Kreditanstalt fuer Wiederaufbau 4.125%
4/7/2017 1,585,513 0.46
EUR 555,000 UPC Germany GmbH 8.125% 1/12/2017 809,873 0.23
12,670,456 3.65
Guernsey USD 796,000 Credit Suisse Group Guernsey I Ltd FRN
24/2/2041 774,130 0.22
India USD 400,000 Bank of Baroda/London 5% 24/8/2016 409,442 0.12
USD 575,000 Bank of India 6.25% 16/2/2021 591,850 0.17
USD 390,000 Canara Bank/London 5.125% 9/9/2016 398,169 0.11
1,399,461 0.40
Indonesia USD 1,520,000 Republic of Indonesia 4.875% 5/5/2021 1,627,646 0.47
International EUR 830,000 European Financial Stability Facility 2.75%
18/7/2016 1,229,813 0.35
AUD 1,845,000 European Investment Bank 6% 6/8/2020 2,035,394 0.59
AUD 5,335,000 European Investment Bank 6.5%
7/8/2019 6,068,474 1.75
9,333,681 2.69
Ireland EUR 1,000,000 Ardagh Packaging Finance Plc 7.375%
15/10/2017 1,343,071 0.39
EUR 256,711 Cars Alliance Funding Plc '2007-1 A' FRN
8/10/2023 366,652 0.11
CAD 750,000 Depfa ACS Bank 4.2% 30/11/2012 788,110 0.23
USD 5,800,000 Governor & Co of the Bank of Ireland/The
'144A' 2.75% 2/3/2012 5,465,755 1.57
EUR 1,482,000 Ireland Government Bond 4% 15/1/2014 1,961,227 0.56
EUR 4,955,000 Ireland Government Bond 5% 18/10/2020 5,648,240 1.63
USD 2,410,000 Irish Life & Permanent Plc '144A' 3.6%
14/1/2013 1,981,536 0.57
EUR 580,000 Smurfit Kappa Acquisitions 7.75%
15/11/2019 800,528 0.23
EUR 1,027,430 Talisman Finance Plc '7A' FRN
22/4/2017 1,168,467 0.34
19,523,586 5.63
Italy EUR 1,150,000 Intesa Sanpaolo SpA FRN 28/5/2018 1,585,710 0.46
EUR 1,200,000 Intesa Sanpaolo SpA FRN 14/10/2019
(Perpetual) 1,446,427 0.42
EUR 3,257,000 Italy Buoni Poliennali Del Tesoro 3%
15/4/2015 4,541,995 1.31
EUR 4,075,000 Italy Buoni Poliennali Del Tesoro 4%
1/9/2020 5,564,553 1.60
EUR 1,300,000 Italy Buoni Poliennali Del Tesoro 4.5%
1/2/2020 1,851,643 0.53
EUR 1,258,000 Italy Buoni Poliennali Del Tesoro 5%
1/8/2039 1,554,608 0.45
EUR 2,280,000 Italy Buoni Poliennali Del Tesoro 5%
1/9/2040 2,809,275 0.81
19,354,211 5.58
Transferable Securities Admitted to an Official Stock Exchange Listing or Dealt in on Another Regulated Market
Holding Description Value (USD) %
Transferable Securities Admitted to an Official Stock Exchange Listing or Dealt in on Another Regulated Market
Holding Description Value (USD) %
Portfolio of Investments 31 August 2011

Audited Annual Report and Accounts 251
The notes on pages 261 to 270 form an integral part of these financial statements.
World Income Fund continued
Japan JPY 170,000,000 Japan Government Fifteen Year Bond
FRN 20/3/2021 2,283,516 0.66
JPY 519,000,000 Japan Government Twenty Year Bond
2.1% 20/12/2027 7,187,012 2.07
JPY 58,708,000 JLOC Ltd FRN 15/1/2015 704,340 0.20
JPY 79,764,000 JLOC Ltd FRN 16/2/2016 956,973 0.28
EUR 1,100,000 Tokyo Electric Power Co Inc/The 4.5%
24/3/2014 1,370,142 0.39
12,501,983 3.60
Jersey EUR 400,000 UBS Capital Securities Ltd/Jersey FRN
11/4/2013 (Perpetual) 579,429 0.17
Kazakhstan USD 2,330,000 KazMunayGas National Co 7%
5/5/2020 2,528,050 0.73
Lithuania USD 1,210,000 Lithuania Government International
Bond 7.375% 11/2/2020 1,409,650 0.41
Luxembourg EUR 1,300,000 Bumper 2 SA '2011-2 A' FRN
23/2/2023 1,877,399 0.54
USD 2,230,000 Russian Agricultural Bank OJSC Via
RSHB Capital SA 9% 11/6/2014 2,503,175 0.72
USD 3,020,000 VTB Bank OJSC Via VTB Capital SA
6.875% 29/5/2018 3,191,672 0.92
7,572,246 2.18
Mexico MXN 332,100 Mexican Bonos 7.75% 14/12/2017 3,036,365 0.88
MXN 262,060 Mexican Bonos 9.5% 18/12/2014 2,427,723 0.70
USD 2,080,000 Mexico Government International Bond
5.625% 15/1/2017 2,399,800 0.69
USD 1,400,000 Petroleos Mexicanos '144A' 6.5%
2/6/2041 1,502,995 0.43
9,366,883 2.70
Netherlands EUR 500,000 ABN Amro Bank NV 3.75% 15/7/2014 757,192 0.22
USD 1,200,000 Cooperatieve Centrale Raiffeisen-
Boerenleenbank BA/Netherlands
'144A' FRN 30/6/2019 (Perpetual) 1,513,335 0.44
EUR 900,000 ELM BV for Swiss Life Insurance &
Pension Group FRN 12/4/2017
(Perpetual) 934,200 0.27
EUR 477,084 Globaldrive BV '2008-2 A' 4% 20/10/2016 696,186 0.20
USD 1,330,000 MDC-GMTN B.V. 5.75% 6/5/2014 1,458,405 0.42
USD 1,640,000 VimpelCom Holdings BV 7.504%
1/3/2022 1,563,592 0.45
USD 3,856,500 Waha Aerospace BV 3.925% 28/7/2020 4,011,146 1.15
EUR 1,565,000 Ziggo Finance BV 6.125% 15/11/2017 2,210,334 0.64
13,144,390 3.79
Poland PLN 4,175,000 Poland Government Bond 5% 25/4/2016 1,455,129 0.42
USD 1,980,000 Poland Government International Bond
3.875% 16/7/2015 2,057,715 0.59
USD 2,340,000 Poland Government International Bond
5.125% 21/4/2021 2,439,450 0.70
5,952,294 1.71
Portugal EUR 440,000 Portugal Obrigacoes do Tesouro OT
4.2% 15/10/2016 479,129 0.14
EUR 455,000 Portugal Obrigacoes do Tesouro OT
4.95% 25/10/2023 398,082 0.11
EUR 3,000,000 Portugal Obrigacoes do Tesouro OT
5.45% 23/9/2013 3,884,876 1.12
EUR 590,000 Portugal Obrigacoes do Tesouro OT
6.4% 15/2/2016 702,239 0.20
5,464,326 1.57
Qatar USD 1,710,000 Qatari Diar Finance QSC 5%
21/7/2020 1,855,350 0.53
South Africa USD 1,600,000 Eskom Holdings Ltd 5.75% 26/1/2021 1,718,562 0.50
ZAR 12,375,000 South Africa Government Bond 13.5%
15/9/2015 2,194,568 0.63
USD 2,980,000 South Africa Government International
Bond 5.5% 9/3/2020 3,408,375 0.98
USD 420,000 South Africa Government International
Bond 6.875% 27/5/2019 519,225 0.15
7,840,730 2.26
South Korea KRW 3,510,000,000 Inflation Linked Korea Treasury Bond
2.75% 10/3/2017 4,238,678 1.22
KRW 8,197,000,000 Korea Treasury Bond 5% 10/9/2014 8,000,920 2.31
USD 525,000 Lotte Shopping Co Ltd 3.875%
7/4/2016 532,920 0.15
USD 445,000 POSCO '144A' 5.25% 14/4/2021 453,514 0.13
13,226,032 3.81
Spain EUR 1,250,000 Banco Financiero y de Ahorros SA
3.875% 30/11/2013 1,788,495 0.52
EUR 550,000 BBVA Senior Finance SAU 2.75%
10/9/2012 785,421 0.23
CAD 1,000,000 Instituto de Credito Oficial 4.53%
17/3/2016 954,301 0.27
EUR 400,000 Santander Issuances S.A Unipersonal
FRN 23/3/2017 502,566 0.14
EUR 1,810,000 Spain Government Bond 3.15%
31/1/2016 2,518,563 0.73
EUR 1,455,000 Spain Government Bond 4.2%
31/1/2037 1,644,791 0.47
EUR 1,799,000 Spain Government Bond 4.85%
31/10/2020 2,587,291 0.75
USD 1,000,000 Telefonica Emisiones SAU 5.462%
16/2/2021 968,459 0.28
11,749,887 3.39
Sweden EUR 1,120,000 Svensk Exportkredit AB 3.625%
27/5/2014 1,700,129 0.49
SEK 21,550,000 Sweden Government Bond 4.5%
12/8/2015 3,773,912 1.09
5,474,041 1.58
Switzerland USD 1,100,000 UBS AG/Stamford CT 5.875%
20/12/2017 1,175,491 0.34
Transferable Securities Admitted to an Official Stock Exchange Listing or Dealt in on Another Regulated Market
Holding Description Value (USD) %
Transferable Securities Admitted to an Official Stock Exchange Listing or Dealt in on Another Regulated Market
Holding Description Value (USD) %
Portfolio of Investments 31 August 2011

252 BlackRock Global Funds (BGF)
World Income Fund continued
Turkey USD 1,110,000 Republic of Turkey 7.5% 14/7/2017 1,307,025 0.38
USD 1,200,000 Turkey Government International Bond
6.75% 3/4/2018 1,380,252 0.40
USD 850,000 Turkey Government International Bond
7% 5/6/2020 992,375 0.28
3,679,652 1.06
United Kingdom EUR 370,000 Arkle Master Issuer Plc '2006-1X 5A1' FRN
17/2/2052 529,130 0.15
EUR 660,000 Aviva Plc FRN 14/11/2021 943,620 0.27
EUR 1,200,000 Barclays Bank Plc FRN 30/5/2017 1,611,165 0.46
USD 800,000 Barclays Bank Plc '144A' FRN 15/12/2017
(Perpetual) 724,000 0.21
GBP 1,640,000 Enterprise Inns Plc 6.5% 6/12/2018 2,053,897 0.59
EUR 500,000 FCE Bank Plc 7.125% 16/1/2012 728,197 0.21
EUR 1,000,000 FCE Bank Plc 9.375% 17/1/2014 1,509,141 0.44
GBP 560,000 Fosse Master Issuer Plc '2011-1X A3' FRN
18/10/2054 912,203 0.26
USD 1,500,000 HBOS Plc FRN 30/9/2016 1,181,250 0.34
EUR 588,719 Headingley RMBS '2011-1 A1B' FRN
11/3/2051 847,969 0.25
EUR 250,000 Lloyds TSB Bank Plc 6.25% 15/4/2014 381,605 0.11
USD 1,900,000 Northern Rock Asset Management Plc
'144A' 5.625% 22/6/2017 2,057,567 0.59
EUR 400,000 Old Mutual Plc FRN 18/1/2017 567,553 0.16
EUR 350,000 Royal Bank of Scotland Plc/The 4.875%
20/1/2017 480,404 0.14
GBP 700,000 Royal Bank of Scotland Plc/The 6.375%
29/4/2014 1,182,106 0.34
USD 1,300,000 Standard Chartered Plc '144A' FRN
30/1/2017 (Perpetual) 1,189,284 0.34
GBP 1,330,000 United Kingdom Gilt 4.25% 7/12/2040 2,315,698 0.67
GBP 5,648,000 United Kingdom Gilt 4.75% 7/12/2038 10,683,423 3.08
GBP 710,000 Virgin Media Secured Finance Plc 5.5%
15/1/2021 1,143,163 0.33
GBP 785,000 Virgin Media Secured Finance Plc 7%
15/1/2018 1,339,725 0.39
32,381,100 9.33
United States USD 2,080,000 Ally Financial Inc 6.875% 15/9/2011 2,083,640 0.60
USD 324,000 Altria Group Inc 9.25% 6/8/2019 428,155 0.12
USD 485,000 Altria Group Inc 10.2% 6/2/2039 697,056 0.20
USD 2,130,000 Argentina Bonos 7% 3/10/2015 1,979,894 0.57
USD 182,000 Ashton Woods USA LLC / Ashton Woods
Finance Co '144A' 0% 30/6/2015
(Zero Coupon) 131,495 0.04
EUR 1,350,000 BA Covered Bond Issuer 4.25% 5/4/2017 2,011,518 0.58
USD 1,467,948 Banc of America Merrill Lynch Commercial
Mortgage Inc '2002-2 A3' 5.118%
11/7/2043 1,480,491 0.43
GBP 950,000 Capital One Multi-Asset Execution Trust
FRN 17/6/2014 1,629,441 0.47
USD 544,000 CF Industries Inc 6.875% 1/5/2018 612,000 0.18
USD 1,290,000 Chesapeake Energy Corp 6.125%
15/2/2021 1,304,512 0.38
USD 343,000 Comcast Corp 6.4% 1/3/2040 391,719 0.11
USD 750,000 Consol Energy Inc 8.25% 1/4/2020 802,500 0.23
USD 222,162 Countrywide Asset-Backed Certificate
'2007-2 2A1' FRN 25/8/2037 216,638 0.06
USD 1,255,000 COX Communications Inc '144A' 8.375%
1/3/2039 1,737,066 0.50
USD 570,000 Cricket Communications Inc 10%
15/7/2015 589,237 0.17
USD 1,100,000 Crown Castle Towers LLC '144A' 6.113%
15/1/2020 1,248,143 0.36
USD 1,530,000 CSC Holdings LLC 6.75% 15/4/2012 1,564,425 0.45
USD 525,000 DISH DBS Corp 6.625% 1/10/2014 540,750 0.16
USD 640,000 DISH DBS Corp 7% 1/10/2013 672,000 0.19
USD 390,000 Domtar Corp 9.5% 1/8/2016 462,150 0.13
USD 2,000,000 El Paso Natural Gas Co 8.625%
15/1/2022 2,691,830 0.78
USD 669,000 Georgia-Pacific LLC '144A' 8.25%
1/5/2016 763,807 0.22
USD 362,991 GS Mortgage Loan Trust FRN 25/1/2035 359,901 0.10
USD 180,620 Home Equity Asset Trust '2007-2 2A1' FRN
25/7/2037 174,361 0.05
USD 1,075,000 Jabil Circuit Inc 7.75% 15/7/2016 1,177,125 0.34
USD 1,100,000 JP Morgan Chase Commercial Mortgage
Securities Corp '2002-C2 A2' 5.05%
12/12/2034 1,135,650 0.33
USD 2,045,000 Kraft Foods Inc 5.375% 10/2/2020 2,322,782 0.67
USD 310,000 Kraft Foods Inc 6.5% 1/11/2031 378,208 0.11
USD 1,290,000 Lincoln National Corp 6.25% 15/2/2020 1,381,513 0.40
USD 128,000 Little Traverse Bay Bands of Odawa Indians
'144A' 9% 31/8/2020 106,240 0.03
USD 1,610,679 Merrill Lynch Mortgage Trust '2002-MW1 A4'
5.619% 12/7/2034 1,634,242 0.47
USD 549,000 MetLife Inc 6.75% 1/6/2016 640,590 0.18
USD 765,000 News America Inc 6.4% 15/12/2035 823,671 0.24
USD 1,230,000 Oracle Corp '144A' 5.375% 15/7/2040 1,373,754 0.40
USD 2,240,000 Pemex Project Funding Master Trust
6.625% 15/6/2035 2,471,786 0.71
USD 800,000 Prudential Financial Inc 3.875% 14/1/2015 828,572 0.24
USD 720,000 Qwest Communications International Inc
Series B 7.5% 15/2/2014 730,800 0.21
USD 1,010,000 Southwestern Energy Co 7.5% 1/2/2018 1,162,451 0.33
USD 705,000 State of California 5.5% 1/3/2016 786,174 0.23
USD 850,000 Time Warner Cable Inc 5.875% 15/11/2040 887,593 0.26
USD 4,099,000 United States Treasury Note/Bond 3.75%
15/8/2041 4,253,353 1.22
USD 1,530,000 Verizon Communications Inc 6.9%
15/4/2038 1,877,976 0.54
48,545,209 13.99
Total Bonds 301,421,065 86.85
Total Transferable Securities Admitted
to an Official Stock Exchange Listing or
Dealt in on Another Regulated Market 301,421,065 86.85
Transferable Securities Admitted to an Official Stock Exchange Listing or Dealt in on Another Regulated Market
Holding Description Value (USD) %
Transferable Securities Admitted to an Official Stock Exchange Listing or Dealt in on Another Regulated Market
Holding Description Value (USD) %
Portfolio of Investments 31 August 2011

Audited Annual Report and Accounts 253
The notes on pages 261 to 270 form an integral part of these financial statements.
World Income Fund continued
COMMON STOCKS (SHARES)
Canada 31,342 Ainsworth Lumber Co Ltd 63,448 0.02
BONDS
Canada CAD 970,000 Air Canada '144A' 10.125% 1/8/2015 971,836 0.28
Germany CAD 1,510,000 Landwirtschaftliche Rentenbank 4.875%
21/2/2020 1,714,131 0.49
Malaysia USD 455,000 Hong Leong Bank Bhd 3.75% 17/3/2016 468,582 0.14
United Kingdom GBP 449,000 Boparan Finance Plc 9.875% 30/4/2018 588,762 0.17
United States USD 205,669 RathGibson Inc 11.25% 15/2/2014 10 0.00
EUR 600,000 Reynolds Group Issuer '144A' 8.75%
15/10/2016 826,063 0.24
826,073 0.24
Total Bonds 4,569,384 1.32
Total Unquoted Securities 4,632,832 1.34
Total Portfolio 306,053,897 88.19
Other Net Assets 40,991,623 11.81
Total Net Assets (USD) 347,046,464 100.00
Unquoted Securities
Holding Description Value (USD) %
Unquoted Securities
Holding Description Value (USD) %
Portfolio of Investments 31 August 2011
Note: The total market value of USD (153,453) of these transactions is included in the Statement of Net Assets (see Note 2c).
Nominal Value Description
Unrealisedprofit/(loss)
USD
Nominal Value Description
Unrealisedprofit/(loss)
USD
Swaps as at 31 August 2011
EUR 800,000 Credit Default Swaps (Citibank) (Fund receives default
protection on STMicroelectronics NV 0% 5/7/2013;
and pays Fixed 0.255%) (20/9/2012) 8,713
EUR 12,500,000 Interest Rate Swaps (Deutsche Bank) (Fund receives
Fixed 3.15%; and pays Floating EUR Euribor 6 Month)
(5/5/2013) 475,866
USD 36,390,000 Credit Default Swaps (Credit Suisse) (Fund receives
default protection on CDX.NA.HY.14-V1; and pays
Fixed 5%) (20/6/2015) (845,746)
USD 7,280,000 Credit Default Swaps (Deutsche Bank) (Fund receives
default protection on CDX.NA.HY.14-V1; and pays
Fixed 5%) (20/6/2015) (176,133)
USD (2,800,000) Credit Default Swaps (Credit Suisse) (Fund provides
default protection on Portugual (Republic of) 5.45%
23/9/2013; and receives Fixed 1%) (20/6/2016) (304,134)
USD (4,280,000) Credit Default Swaps (Deutsche Bank) (Fund provides
default protection on iTraxx Sovereign Western
S5 V1; and receives Fixed 1%) (20/6/2016) (113,875)
EUR 1,900,000 Credit Default Swaps (Credit Suisse) (Fund receives
default protection on Banco Espirito Santo SA
1.838% 19/1/2015; and pays Fixed 5%)
(20/6/2016) 272,734
EUR (1,985,000) Credit Default Swaps (Deutsche Bank) (Fund provides
default protection on Telefonica SA 4.375%
2/2/2015; and receives Fixed 1%) (20/9/2016) (135,016)
EUR 1,985,000 Credit Default Swaps (Deutsche Bank) (Fund receives
default protection on Gas Natural Capital Markets SA
4.5% 27/1/2020; and pays Fixed 1%) (20/9/2016) 76,147
EUR (3,855,000) Credit Default Swaps (Deutsche Bank) (Fund provides
default protection on Vodafone Group Plc 5%
4/8/2016; and receives Fixed 1%) (20/9/2016) (35,820)
EUR 3,855,000 Credit Default Swaps (Deutsche Bank) (Fund receives
default protection on Koninklijke KPN NV 8.375%
1/10/2030; and pays Fixed 1%) (20/9/2016) 104,932
EUR 1,065,000 Credit Default Swaps (Credit Suisse) Fund receives
default protection on Royal Bank of Scotland Plc
4.25% 11/5/2016; and pays Fixed 1%) (20/9/2016) 58,152
EUR 925,000 Credit Default Swaps (Credit Suisse) (Fund receives
default protection on Xstrata Plc 5.25% 13/6/2017;
and pays Fixed 1%) (20/9/2016) 30,607
EUR (750,000) Credit Default Swaps (Credit Suisse) (Fund provides
default protection on Glencore International
AG 5.25% 11/1/2013; and receives Fixed 1%)
(20/9/2016) (42,422)
EUR (1,065,000) Credit Default Swaps (Credit Suisse) (Fund provides
default protection on Lloyds TSB Bank Plc 6.375%
17/6/2016; and receives Fixed 1%) (20/9/2016) (50,937)
EUR (1,850,000) Credit Default Swaps (Deutsche Bank) (Fund provides
default protection on Alstom SA 4% 23/9/2014;
and receives Fixed 1%) (20/9/2016) (72,373)
HUF 2,181,700,000 Interest Rate Swaps (Deutsche Bank) (Fund receives
Floating HUF BUBOR 6 Month; and pays Fixed
6.67%) (29/8/2021) (162,748)
USD 1,800,000 Interest Rate Swaps (Deutsche Bank) (Fund receives
Floating USD LIBOR 3 Month; and pays Fixed 3.29%)
(19/8/2041) (33,881)
(945,934)

254 BlackRock Global Funds (BGF)
World Income Fund continued
Open Futures Contractsas at 31 August 2011
Numberof contracts Contract/Description
Expirationdate
ValueUSD
98 Euro BOBL September 2011 17,271,970
67 Euro Bund September 2011 13,046,895
45 30 Year Euro-BUXL September 2011 7,554,083
9 Australian 10 Year Bond September 2011 7,375,271
(10) Japanese 10 Year Bond (TSE) September 2011 (18,568,073)
(191) Australian 3 Year Bond September 2011 (55,280,165)
(378) Euro Schatz September 2011 (59,731,322)
18 Canadian 10 Year Bond December 2011 2,407,133
15 US Ultra Bond (CBT) December 2011 2,167,031
(39) US Long Bond (CBT) December 2011 (5,341,781)
(58) US Treasury 2 Year Note (CBT) December 2011 (12,789,000)
(70) Banker's Acceptance Future December 2011 (17,783,090)
(114) 90 Day Bank Bill December 2011 (28,244,598)
(121) US Treasury 10 Year Note December 2011 (15,652,484)
(146) US Treasury 5 Year Note (CBT) December 2011 (17,906,672)
(33) Banker's Acceptance Future June 2012 (8,387,695)
Total commitment (189,862,497)
Note: The net unrealised loss of USD 116,434 attributed to these transactions is included
in the Statement of Net Assets (see Note 2c).
Open Forward Foreign Exchange Transactionsas at 31 August 2011
Purchases Sales Value date Unrealised
profit/(loss)
Unrealisedprofit/(loss)
USD Equivalent
Core Fund USD
USD 4,917,756 DKK 25,233,500 1/9/2011 26,712 26,712
EUR 11,465,000 GBP 10,230,300 8/9/2011 (136,155) (136,155)
GBP 10,175,417 EUR 11,465,000 8/9/2011 46,606 46,606
KRW 1,297,292,940 USD 1,194,000 15/9/2011 22,054 22,054
JPY 874,340,000 USD 11,135,862 7/10/2011 269,807 269,807
SGD 6,830,000 USD 5,510,936 7/10/2011 169,202 169,202
USD 25,573,654 AUD 24,803,000 7/10/2011 (850,693) (850,693)
USD 6,243,982 CAD 6,185,500 7/10/2011 (106,721) (106,721)
USD 19,199,970 GBP 12,016,000 7/10/2011 (399,207) (399,207)
USD 20,179,071 JPY 1,635,437,000 7/10/2011 (1,155,025) (1,155,025)
USD 5,277,799 MXN 63,842,900 7/10/2011 138,224 138,224
USD 1,477,029 PLN 4,233,000 7/10/2011 8,637 8,637
USD 3,686,800 SEK 23,518,000 7/10/2011 (18,517) (18,517)
USD 10,963,190 ZAR 75,999,900 7/10/2011 187,717 187,717
ZAR 65,580,000 USD 9,030,079 7/10/2011 268,032 268,032
SEK 86,460,739 EUR 9,390,000 14/10/2011 63,270 63,270
EUR 4,000,000 USD 5,697,876 26/10/2011 75,097 75,097
USD 104,642,725 EUR 72,994,500 26/10/2011 (706,094) (706,094)
USD 4,862,496 DKK 24,966,000 1/12/2011 27,789 27,789
CNY 159,400,000 USD 25,000,000 13/2/2012 203,629 203,629
Net unrealised loss (1,865,636) (1,865,636)
AUD Hedged Share Class AUD
AUD 65,841,027 USD 66,968,266 14/9/2011 3,172,507 3,395,598
USD 1,883,420 AUD 1,804,776 14/9/2011 (42,282) (45,255)
Net unrealised profit 3,130,225 3,350,343
EUR Hedged Share Class EUR
EUR 5,637,063 USD 7,994,716 14/9/2011 100,305 144,866
USD 402,168 EUR 282,247 14/9/2011 (3,725) (5,380)
Net unrealised profit 96,580 139,486
Total net unrealised profit 1,624,193
Note: The net unrealised profit attributed to these transactions is included in the Statement
of Net Assets (see Note 2c).

Audited Annual Report and Accounts 255
The notes on pages 261 to 270 form an integral part of these financial statements.
World Mining Fund
FUNDS
Ireland 165,752,329 Institutional Cash Series Plc - Institutional
US Dollar Liquidity Fund 165,752,329 1.03
Jersey 300,000 ETFS Physical Gold/Jersey - ETF 53,514,000 0.34
Total Funds 219,266,329 1.37
COMMON / PREFERRED STOCKS (SHARES)
Australia 20,000,000 African Iron Ltd 6,743,211 0.04
17,000,000 Alumina Ltd 32,024,900 0.20
14,150,000 Aquila Resources Ltd 96,930,981 0.61
27,000,000 Atlas Iron Ltd * 112,418,959 0.70
2,000,000 Coal & Allied Industries Ltd 263,734,470 1.64
17,000,000 Coal of Africa Ltd 18,100,187 0.11
5,000,000 Equatorial Resources Ltd 15,252,501 0.10
30,000,000 Fortescue Metals Group Ltd 194,268,695 1.21
5,800,000 Iluka Resources Ltd 101,687,620 0.63
10,020,000 Mawson West Ltd 11,840,836 0.07
52,654,728 Metals X Ltd 13,526,169 0.09
3,440,931 Mineral Deposits Ltd 15,751,741 0.10
17,750,000 Newcrest Mining Ltd 764,698,846 4.76
14,600,000 OZ Minerals Ltd 184,400,059 1.15
1,800,000 PanAust Ltd 7,012,939 0.04
5,169,231 Rex Minerals Ltd 10,097,526 0.06
1,848,489,640 11.51
Belgium 5,949,993 Nyrstar * 67,933,952 0.42
Bermuda 15,500,000 African Minerals Ltd 127,978,152 0.80
5,900,000 Aquarius Platinum Ltd 24,068,313 0.15
28,000,000 Katanga Mining Ltd 41,144,413 0.25
193,190,878 1.20
Brazil 12,900,000 Bradespar SA (Pref) 285,075,101 1.78
34,400,000 Vale SA ADR 'A' 886,488,000 5.52
1,171,563,101 7.30
British Virgin Islands 8,400,000 Gem Diamonds Ltd 28,592,176 0.18
10,637,500 Zanaga Iron Ore Co Ltd 13,893,136 0.09
42,485,312 0.27
Canada 10,000,000 Anvil Mining Ltd 63,196,338 0.40
22,181,235 First Quantum Minerals Ltd 537,460,215 3.35
4,150,000 Goldcorp Inc * 215,185,072 1.34
4,500,000 IAMGOLD Corp 93,314,788 0.58
2,000,000 Ivanhoe Mines Ltd/CA 45,501,363 0.28
15,550,000 Kinross Gold Corp 268,445,713 1.67
350,000 Potash Corp of Saskatchewan Inc 20,846,000 0.13
4,500,000 Sunridge Gold Corp 3,236,886 0.02
20,676,000 Teck Resources Ltd 'B' 929,313,187 5.79
2,176,499,562 13.56
Cayman Islands 900,000 Vale Capital II (Pref) 72,787,500 0.45
China 5,000,000 China Shenhua Energy Co Ltd 'H' 23,160,587 0.14
Finland 7,500,000 Talvivaara Mining Co Plc * 41,854,387 0.26
France 769,000 Eramet * 165,028,428 1.03
Hong Kong 178,000,000 IRC Ltd 34,259,706 0.21
Ireland 98,356,530 Kenmare Resources Plc 72,221,970 0.45
Jersey 30,000,000 Glencore International Plc * 207,485,171 1.29
650,000 Randgold Resources Ltd ADR 68,932,500 0.43
65,032,000 United Co RUSAL Plc 70,510,888 0.44
346,928,559 2.16
Mexico 33,300,000 Grupo Mexico SAB de CV 'B' 111,591,525 0.70
2,300,000 Industrias Penoles SAB de CV 110,875,037 0.69
222,466,562 1.39
Peru 12,450,000 Cia de Minas Buenaventura SA ADR 587,640,000 3.66
12,782,349 Minsur SA 15,231,024 0.10
2,830,000 Sociedad Minera Cerro Verde SAA 109,238,000 0.68
23,998,098 Volcan Cia Minera SAA 'B' 26,307,711 0.16
738,416,735 4.60
South Africa 10,077,000 African Rainbow Minerals Ltd 265,128,618 1.65
200,000 AngloGold Ashanti Ltd ADR 8,916,000 0.06
1,500,000 Gold Fields Ltd 24,622,054 0.15
6,500,000 Harmony Gold Mining Co Ltd 86,323,634 0.54
6,500,000 Harmony Gold Mining Co Ltd ADR 86,840,000 0.54
21,660,000 Impala Platinum Holdings Ltd 559,384,333 3.48
5,000,000 Kumba Iron Ore Ltd 342,746,174 2.14
1,373,960,813 8.56
United Kingdom 6,976,000 Anglo American Plc 292,090,038 1.82
14,450,000 Antofagasta Plc 317,134,692 1.98
36,800,000 BHP Billiton Plc 1,262,817,852 7.87
8,086,784 Bumi Plc 129,514,910 0.81
16,400,000 Eurasian Natural Resources Corp Plc 183,578,402 1.14
6,000,000 Fresnillo Plc 204,719,355 1.27
8,000,000 Kazakhmys Plc 141,505,360 0.88
5,273,340 London Mining Plc 28,653,893 0.18
1,718,081 Petropavlovsk Plc 24,530,438 0.15
24,050,000 Rio Tinto Plc 1,485,369,787 9.25
2,000,000 Vedanta Resources Plc * 45,950,080 0.29
28,400,000 Xstrata Plc 504,197,696 3.14
4,620,062,503 28.78
United States 500,000 Consol Energy Inc 23,095,000 0.14
19,930,000 Freeport-McMoRan Copper & Gold Inc 959,230,900 5.98
350,000 Mosaic Co/The 25,735,500 0.16
3,500,000 Newmont Mining Corp 219,835,000 1.37
6,360,000 Peabody Energy Corp 315,201,600 1.96
4,500,000 Southern Copper Corp 154,260,000 0.96
1,697,358,000 10.57
Total Common / Preferred Stocks (Shares) 14,908,668,195 92.86
Transferable Securities Admitted to an Official Stock Exchange Listing or Dealt in on Another Regulated Market
Holding Description Value (USD) %
Transferable Securities Admitted to an Official Stock Exchange Listing or Dealt in on Another Regulated Market
Holding Description Value (USD) %
Portfolio of Investments 31 August 2011

* Securities lent, see Note 11, for further details.
256 BlackRock Global Funds (BGF)
World Mining Fund continued
BONDS
Belgium EUR 5,000,000 Nyrstar 7% 10/7/2014 10,118,107 0.06
Brazil BRL 6,750 Vale SA FRN (Perpetual) 24,496 0.00
Jersey USD 10,800,000 London Mining Jersey Plc 8%
15/2/2016 10,750,536 0.07
Luxembourg USD 335,000,000 Glencore Finance Europe SA 5%
31/12/2014 445,968,750 2.78
United Kingdom USD 150,000,000 Anglo American Plc 4% 7/5/2014 240,472,500 1.50
USD 50,000,000 Vedanta Resources Jersey Ltd 5.5%
13/7/2016 48,100,000 0.30
288,572,500 1.80
Total Bonds 755,434,389 4.71
Total Transferable Securities Admitted
to an Official Stock Exchange Listing or
Dealt in on Another Regulated Market 15,883,368,913 98.94
COMMON STOCKS (SHARES)
Canada 816,049 Ivanhoe Nickel & Platinum Ltd 14,674,762 0.09
Germany 11,892,500 Dia Bras Exploration Inc 31,773,372 0.20
Total Common / Preferred Stocks (Shares) 46,448,134 0.29
Total Unquoted Securities 46,448,134 0.29
Total Portfolio 15,929,817,047 99.23
Other Net Assets 124,168,552 0.77
Total Net Assets (USD) 16,053,985,599 100.00
Transferable Securities Admitted to an Official Stock Exchange Listing or Dealt in on Another Regulated Market
Holding Description Value (USD) %
Unquoted Securities
Holding Description Value (USD) %
Portfolio of Investments 31 August 2011
Open Forward Foreign Exchange Transactionsas at 31 August 2011
Purchases Sales Value date Unrealised
profit/(loss)
Unrealisedprofit/(loss)
USD Equivalent
CHF Hedged Share Class CHF
CHF 52,626,238 USD 64,363,574 14/9/2011 777,647 965,062
USD 37,642 CHF 30,786 14/9/2011 (464) (576)
Net unrealised profit 777,183 964,486
EUR Hedged Share Class EUR
EUR 432,680,451 USD 614,793,300 14/9/2011 6,904,043 9,971,177
USD 89,381,342 EUR 62,452,895 14/9/2011 (551,657) (796,732)
Net unrealised profit 6,352,386 9,174,445
PLN Hedged Share Class PLN
PLN 26,336,653 USD 9,131,325 14/9/2011 80,292 27,962
USD 1,621,597 PLN 4,706,987 14/9/2011 (44,220) (15,400)
Net unrealised profit 36,072 12,562
SGD Hedged Share Class SGD
SGD 200,043,043 USD 164,155,634 14/9/2011 2,637,567 2,193,221
USD 16,287,964 SGD 19,761,284 14/9/2011 (174,181) (144,837)
Net unrealised profit 2,463,386 2,048,384
Total net unrealised profit 12,199,877
Note: The net unrealised profit attributed to these transactions is included in the Statement
of Net Assets (see Note 2c).
Sector Breakdownas at 31 August 2011
% of netassets
Diversified Metals & Mining 54.36
Gold 15.34
Steel 11.94
Coal & Consumable Fuels 8.18
Precious Metals & Minerals 6.57
Investment Funds 1.37
Aluminum 0.64
Diversified Financial Services 0.45
Fertilizers & Agricultural Chemicals 0.29
Diversfied Metals & Mining 0.09
Other Net Assets 0.77
100.00

(1) New Fund launched, see Note 1, for further details.† Securities pledged, see Note 12, for further details.
Audited Annual Report and Accounts 257
The notes on pages 261 to 270 form an integral part of these financial statements.
World Resources Equity Income Fund(1)
COMMON / PREFERRED STOCKS (SHARES)
Australia 9,203 Alumina Ltd 17,337 0.58
290 Coal & Allied Industries Ltd 38,241 1.29
5,200 Fortescue Metals Group Ltd 33,673 1.14
1,200 Newcrest Mining Ltd 51,698 1.74
140,949 4.75
Bermuda 400 Bunge Ltd 25,752 0.87
2,100 Cosan Ltd 'A' 24,423 0.82
50,175 1.69
Brazil 700 Cia Siderurgica Nacional SA ADR 7,140 0.24
1,130 Vale SA ADR 'A' (Pref) 29,120 0.98
36,260 1.22
Canada 500 Agrium Inc 44,235 1.49
1,700 Canadian Oil Sands Ltd (Unit) 40,668 1.37
850 Centerra Gold Inc 17,879 0.60
500 Crescent Point Energy Corp 22,694 0.77
2,200 Enbridge Inc 72,251 2.44
1,250 First Quantum Minerals Ltd † 30,288 1.02
800 Goldcorp Inc † 41,483 1.40
900 IAMGOLD Corp † 18,663 0.63
1,300 Imperial Oil Ltd 53,755 1.81
1,200 Kinross Gold Corp 20,716 0.70
1,400 Potash Corp of Saskatchewan Inc † 83,384 2.81
1,800 Teck Resources Ltd 'B' 80,904 2.73
526,920 17.77
France 200 Technip SA 19,537 0.66
600 Total SA 29,426 0.99
48,963 1.65
Germany 300 K+S AG 21,433 0.72
Indonesia 9,000 Astra Agro Lestari TBK PT 22,677 0.77
Israel 1,600 Israel Chemicals Ltd 23,123 0.78
Japan 8 Inpex Corp 53,730 1.81
9,000 Nippon Steel Corp 26,878 0.91
80,608 2.72
Jersey 5,000 Glencore International Plc 34,581 1.17
2,300 Petrofac Ltd 50,816 1.71
13,000 United Co RUSAL Plc 14,095 0.47
99,492 3.35
Luxembourg 600 APERAM 11,039 0.37
1,000 ArcelorMittal 22,146 0.75
33,185 1.12
Mauritius 54,000 Golden Agri-Resources Ltd 29,636 1.00
Netherlands 700 CNH Global NV 23,695 0.80
Netherlands Antilles 700 Schlumberger Ltd 54,957 1.85
Norway 700 Yara International ASA 38,937 1.31
Papua New Guinea 1,800 New Britain Palm Oil Ltd 25,186 0.85
Russian Federation 1,400 Gazprom OAO ADR 17,276 0.58
South Africa 1,300 Kumba Iron Ore Ltd 89,114 3.01
South Korea 43 POSCO 16,303 0.55
Switzerland 200 Syngenta AG 63,984 2.16
United Kingdom 2,000 Antofagasta Plc 43,894 1.48
1,950 BHP Billiton Plc 66,916 2.26
10,200 BP Plc 66,983 2.26
1,700 Eurasian Natural Resources Corp Plc 19,030 0.64
1,150 Fresnillo Plc 39,238 1.32
1,700 Rio Tinto Plc 104,995 3.54
1,900 Royal Dutch Shell Plc 'B' 63,975 2.16
800 Vedanta Resources Plc 18,380 0.62
3,900 Xstrata Plc 69,238 2.33
492,649 16.61
United States 800 AGCO Corp 35,368 1.19
400 Anadarko Petroleum Corp 29,956 1.01
1,100 Archer-Daniels-Midland Co 31,636 1.07
200 CF Industries Holdings Inc 38,228 1.29
1,600 Chevron Corp 159,072 5.36
600 Corn Products International Inc 28,224 0.95
500 Deere & Co 41,090 1.39
1,300 Enterprise Products Partners LP (Unit) 54,977 1.85
2,000 Exxon Mobil Corp 149,400 5.04
2,000 Freeport-McMoRan Copper & Gold Inc 96,260 3.25
900 Kinder Morgan Energy Partners LP (Unit) 63,018 2.12
400 Marathon Oil Corp 10,808 0.36
1,100 Monsanto Co 77,000 2.60
600 Mosaic Co/The 44,118 1.49
600 Plum Creek Timber Co Inc (Reit) 22,662 0.76
700 Range Resources Corp 46,347 1.56
900 Southwestern Energy Co 34,551 1.17
962,715 32.46
Total Common / Preferred Stocks (Shares) 2,898,237 97.72
Total Transferable Securities Admitted
to an Official Stock Exchange Listing or
Dealt in on Another Regulated Market 2,898,237 97.72
Total Portfolio 2,898,237 97.72
Other Net Assets 67,692 2.28
Total Net Assets (USD) 2,965,929 100.00
Transferable Securities Admitted to an Official Stock Exchange Listing or Dealt in on Another Regulated Market
Holding Description Value (USD) %
Transferable Securities Admitted to an Official Stock Exchange Listing or Dealt in on Another Regulated Market
Holding Description Value (USD) %
Portfolio of Investments 31 August 2011

258 BlackRock Global Funds (BGF)
World Resources Equity Income Fund(1) continued
Sector Breakdownas at 31 August 2011
% of netassets
Diversified Metals & Mining 19.04
Integrated Oil & Gas 18.20
Fertilizers & Agricultural Chemicals 14.65
Oil & Gas Exploration & Production 8.05
Steel 7.95
Oil & Gas Storage & Transportation 6.41
Agricultural Products 6.33
Gold 5.07
Oil & Gas Equipment & Services 4.22
Construction & Farm Machinery & Heavy Trucks 3.38
Precious Metals & Minerals 1.32
Coal & Consumable Fuels 1.29
Aluminum 1.05
Specialized REITs 0.76
Other Net Assets 2.28
100.00
Open Forward Foreign Exchange Transactionsas at 31 August 2011
Purchases Sales Value date Unrealised
profit/(loss)
Unrealisedprofit/(loss)
USD Equivalent
EUR Hedged Share Class EUR
EUR 5,216 USD 7,413 14/9/2011 82 118
USD 797 EUR 556 14/9/2011 (4) (6)
Net unrealised profit 78 112
Total net unrealised profit 112
Note: The net unrealised profit attributed to these transactions is included in the Statement
of Net Assets (see Note 2c).
Written Call Options as at 31 August 2011
Number of contracts
subjectto Call Issuer
Unrealisedprofit/(loss)
USD ValueUSD
(3) Goldcorp Inc Call Option
strike price CAD 50
expiring on 17/9/2011 76 (549)
(4) Potash Corp of Saskatchewan Call Option
strike price USD 57.5
expiring on 17/9/2011 (100) (1,220)
(6) First Quantum Minerals Call Option
strike price CAD 24
expiring on 17/9/2011 65 (586)
(9) IAMGOLD Call Option
strike price CAD 19
expiring on 17/9/2011 (455) (1,341)
Total Written Call Options (414) (3,696)
Note: Written Call Options are included in the Statement of Net Assets (see Note 2c).

* Securities lent, see Note 11, for further details.
Audited Annual Report and Accounts 259
The notes on pages 261 to 270 form an integral part of these financial statements.
World Technology Fund
FUNDS
United States 271 iShares S&P Global Technology Sector
Index Fund - ETF 15,574 0.01
267 iShares S&P North American Technology
Sector Index Fund - ETF 15,545 0.01
31,119 0.02
Total Funds 31,119 0.02
COMMON STOCKS (SHARES)
Cayman Islands 21,503 Baidu Inc/China ADR 3,188,895 2.07
France 73,558 Eutelsat Communications SA 3,266,545 2.13
Hong Kong 2,764,000 Lenovo Group Ltd 1,851,318 1.20
Israel 121,361 Check Point Software Technologies 6,651,796 4.33
Japan 43,600 Kyocera Corp 3,980,177 2.59
65,900 Murata Manufacturing Co Ltd 4,004,877 2.61
64,400 Nidec Corp 5,601,826 3.65
257,000 Taiyo Yuden Co Ltd 2,356,168 1.53
15,943,048 10.38
Jersey 94,523 Velti Plc 931,052 0.61
Netherlands 106,711 ASML Holding NV 3,794,118 2.47
South Korea 9,534 Samsung Electronics Co Ltd 6,648,822 4.33
Sweden 72,892 Hexagon AB 'B' 1,217,423 0.79
Switzerland 70,420 TE Connectivity Ltd 2,216,117 1.44
Taiwan 24,600 Foxconn Technology Co Ltd 87,344 0.06
172,000 HTC Corp 4,482,394 2.92
202,000 MediaTek Inc 2,029,783 1.32
6,599,521 4.30
United Kingdom 2,769,833 Monitise Plc 1,656,461 1.08
United States 460,129 Activision Blizzard Inc 5,461,731 3.56
43,469 Agilent Technologies Inc 1,634,000 1.06
30,859 Apple Inc 12,026,987 7.83
91,144 Cerner Corp 6,169,537 4.02
98,744 Cognizant Technology Solutions Corp 'A' 6,280,118 4.09
34,772 DIRECTV 'A' 1,551,179 1.01
449,595 EMC Corp/Massachusetts 10,124,879 6.59
69,695 MercadoLibre Inc 4,841,712 3.15
157,982 Microchip Technology Inc 5,230,784 3.41
54,091 NII Holdings Inc 2,066,006 1.34
251,978 Oracle Corp 7,143,576 4.65
191,954 Polycom Inc 4,679,839 3.05
112,350 QUALCOMM Inc 5,836,021 3.80
84,769 RealD Inc 1,232,541 0.80
63,300 RealPage Inc 1,320,755 0.86
52,439 RPX Corp 1,400,121 0.91
98,729 Solera Holdings Inc 5,839,820 3.80
76,388 TIBCO Software Inc 1,730,188 1.13
101,483 Trimble Navigation Ltd 3,825,909 2.49
123,244 Veeco Instruments Inc * 4,572,352 2.98
90,002 Xilinx Inc 2,813,463 1.83
95,781,518 62.36
Total Common Stocks (Shares) 149,746,634 97.49
Total Transferable Securities Admitted
to an Official Stock Exchange Listing or
Dealt in on Another Regulated Market 149,777,753 97.51
Total Portfolio 149,777,753 97.51
Other Net Assets 3,819,667 2.49
Total Net Assets (USD) 153,597,420 100.00
Transferable Securities Admitted to an Official Stock Exchange Listing or Dealt in on Another Regulated Market
Holding Description Value (USD) %
Transferable Securities Admitted to an Official Stock Exchange Listing or Dealt in on Another Regulated Market
Holding Description Value (USD) %
Portfolio of Investments 31 August 2011

260 BlackRock Global Funds (BGF)
World Technology Fund continued
Sector Breakdownas at 31 August 2011
% of netassets
Semiconductors 10.89
Systems Software 10.06
Communications Equipment 9.77
Computer Hardware 9.09
Electronic Components 6.73
Computer Storage & Peripherals 6.59
Internet Software & Services 5.83
Application Software 5.79
Semiconductor Equipment 5.45
Home Entertainment Software 4.36
IT Consulting & Other Services 4.09
Health Care Technology 4.02
Electronic Manufacturing Services 3.93
Electrical Components & Equipment 3.65
Cable & Satellite 3.14
Wireless Telecommunication Services 1.34
Life Sciences Tools & Services 1.06
Research & Consulting Services 0.91
Electronic Equipment & Instruments 0.79
Investment Funds 0.02
Other Net Assets 2.49
100.00

Audited Annual Report and Accounts 261
Notes to the Financial Statements
1. OrganisationBlackRock Global Funds (the “Company”) is an open-ended
investment company (Société d’Investissement à Capital Variable
or SICAV) and organized under Part I of the Luxembourg Law dated
20 December 2002 (the “2002 Law”) until 30 June 2011 and under
Part I of the Luxembourg Law dated 17 December 2010 as from
1 July 2011 (the “2010” Law). Implementation of UCITS IV will be
effective for accounting periods beginning on or after 1 July 2011.
As at 31 August 2011, the Company offered shares in 63 Funds.
Each Fund is a separate pool of assets and is represented by separate
shares of each Fund which are divided into share classes as follows:
Classes of SharesAs at 31 August 2011, the Company offers the following share classes:
A Class
A Class distributing (A) share
A Class distributing (A) share EUR hedged
A Class distributing (D) share
A Class distributing (D) share EUR hedged
A Class distributing (G) share
A Class distributing (M) share
A Class distributing (M) share AUD hedged
A Class distributing (M) share EUR hedged
A Class distributing (M) share HKD hedged
A Class distributing (M) share SGD hedged
A Class distributing (Q) share
A Class distributing (Q) share AUD hedged
A Class distributing (Q) share EUR hedged
A Class distributing (Q) share GBP hedged
A Class distributing (Q) share SGD hedged
A Class distributing (Q) share USD hedged
A Class distributing (Q) UK reporting fund share
A Class non-distributing share
A Class non-distributing share AUD hedged
A Class non-distributing share CHF hedged
A Class non-distributing share EUR hedged
A Class non-distributing share GBP hedged
A Class non-distributing share HKD unhedged
A Class non-distributing share PLN hedged
A Class non-distributing share SGD hedged
A Class non-distributing share USD hedged
A Class UK reporting fund share
A Class UK reporting fund share GBP hedged
A Class UK reporting fund share USD hedged
B Class
B Class distributing (D) share
B Class distributing (D) share EUR hedged
B Class distributing (Q) share
B Class distributing (Q) share EUR hedged
B Class distributing (Q) share GBP hedged
B Class distributing (Q) share USD hedged
B Class non-distributing share
B Class non-distributing share EUR hedged
B Class non-distributing share GBP hedged
B Class non-distributing share SGD hedged
B Class non-distributing share USD hedged
C Class
C Class distributing (D) share
C Class distributing (D) share EUR hedged
C Class continued
C Class distributing (M) share
C Class distributing (M) share EUR hedged
C Class distributing (Q) share
C Class distributing (Q) share EUR hedged
C Class distributing (Q) share GBP hedged
C Class distributing (Q) share SGD hedged
C Class distributing (Q) share USD hedged
C Class non-distributing share
C Class non-distributing share EUR hedged
C Class non-distributing share GBP hedged
C Class non-distributing share SGD hedged
C Class non-distributing share USD hedged
D Class
D Class distributing (M) share
D Class non-distributing share
D Class non-distributing share EUR hedged
D Class non-distributing share GBP hedged
D Class UK reporting fund share
D Class UK reporting fund share GBP hedged
E Class
E Class distributing (Q) share
E Class distributing (Q) share EUR hedged
E Class distributing (Q) share GBP hedged
E Class non-distributing share
E Class non-distributing share EUR hedged
E Class non-distributing share GBP hedged
E Class non-distributing share PLN hedged
E Class non-distributing share USD hedged
I Class
I Class non-distributing share*
I Class non-distributing share EUR hedged*
J Class
J Class distributing (M) share*
J Class non-distributing share*
Q Class
Q Class distributing (D) share**
Q Class distributing (D) share EUR hedged**
Q Class non-distributing share**
Q Class non-distributing share EUR hedged**
X Class
X Class distributing (D) share*
X Class distributing (M) share*
X Class distributing (M) share AUD hedged*
X Class distributing (M) share EUR hedged*
X Class non-distributing share*
X Class non-distributing share AUD hedged*
X Class non-distributing share CHF hedged*
X Class non-distributing share EUR hedged*
X Class non-distributing share GBP hedged*
X Class non-distributing share JPY hedged*
X Class UK reporting fund share*
X Class UK reporting fund share GBP hedged*
* available to institutional investors.
** grandfathered share class available to investors previously holding shares in other Funds
sponsored by entities within the BlackRock Group. Within the Company they are no longer
available for subscription.

262 BlackRock Global Funds (BGF)
Notes to the Financial Statements continued
The classes of shares have equivalent rights in the Company but
carry different features and charging structures, which are more
fully described in the Company’s Prospectus.
India FundThe BlackRock Global Funds India Fund invests substantially all of
its net assets in Indian securities exclusively through the BlackRock
India Equities Fund (Mauritius) Limited (the “Subsidiary”), a
wholly owned subsidiary of the Company, in accordance with its
investment objectives and policies.
All assets and liabilities, income and expenses of the Subsidiary are
consolidated in the Statement of Net Assets and Operations of the
Company. All investments held by the Subsidiary are disclosed in
the accounts of the Company.
The Subsidiary was incorporated on 1 September 2004 under the
laws of Mauritius as an open-ended investment company with
limited liability. Currently, the Subsidiary benefits from relief due to
the India/Mauritius double tax treaty. There can be no assurance
that this will not change in the future.
As communicated to the shareholders of the Company dated
27 July 2011, it was a public holiday in India on 31 August 2011
and 1 September 2011 and the stock exchanges in India were
closed to trading. As a substantial proportion of the investments
of the Subsidiary are listed and traded on Indian stock exchanges,
the Directors took the view that it was in the best interest of the
shareholders that the Company be closed to dealing on certain
consecutive days during the public holidays.
Consequently, the Subsidiary was closed to trading on
30 August 2011, 31 August 2011 and 1 September 2011. Although
30 August 2011 was not a public holiday in India, the impact of the
stock exchange closures on 31 August 2011 and 1 September 2011
would have resulted in the inability to effectively value and deal the
investments of the Subsidiary on the 30 August 2011.
The Directors therefore resolved that 30 August 2011 should not
be treated as a Business Day and consequently, there was no
valuation of the Subsidiary or dealing in the Subsidiary on this day.
As a result, the last published valuation for the Subsidiary prior
to the year end was as at 29 August 2011. However, for financial
statements purposes, due to material differences noted between
the investment valuation as at 29 August 2011 and that as at
30 August 2011, the investments held by the Subsidiary at year end
were fair valued based on the market prices as at 30 August 2011.
Fund LaunchesEffective 12 November 2010, the Global Equity Income Fund,
denominated in USD was launched.
Effective 3 December 2010, the European Equity Income Fund,
denominated in EUR was launched.
Effective 15 April 2011, the World Resources Equity Income Fund,
denominated in USD was launched.
Effective 12 August 2011, the Emerging Markets Equity Income
Fund, denominated in USD was launched.
Significant events during the year ended 31 August 2011
Francine Keiser was appointed as Director of the Board on
1 January 2011 and her appointment was approved at the Annual
General Meeting held on 21 February 2011.
Emilio Novela Berlin resigned from the Board on 4 February 2011.
Maarten F. Slendebroek was appointed as a Director of the Board at
the Annual General Meeting held on 21 February 2011.
As approved at an Extraordinary General Meeting held on
27 May 2011, the Company’s Articles of Association were amended
with effect from 27 May 2011, including the change of address of
the Registered Office of the Company.
James Charrington resigned from the Board on 1 June 2011.
Douglas A. Shaw was appointed as a Director of the Board on
9 June 2011.
Share Classes LaunchedThe dates disclosed are the launch dates but the classes may have been seeded at a later date.
Effective date Type Fund
10 September 2010 D Class non-distributing share Global Government Bond Fund
15 September 2010 I Class non-distributing share European Focus Fund
15 September 2010 I Class non-distributing share Global Dynamic Equity Fund
24 September 2010 A Class UK reporting fund share GBP hedged Continental European Flexible Fund
1 October 2010 A Class non-distributing share SGD hedged Asian Tiger Bond Fund
7 October 2010 A Class non-distributing share USD hedged European Fund
8 October 2010 X Class non-distributing share JPY hedged Emerging Markets Bond Fund
14 October 2010 D Class non-distributing share US Dollar Core Bond Fund
14 October 2010 A Class distributing (A) share Local Emerging Markets Short Duration Bond Fund
8 November 2010 D Class UK reporting fund share GBP hedged Euro Short Duration Bond Fund
10 November 2010 D Class non-distributing share US Dollar High Yield Bond Fund
12 November 2010 X Class non-distributing share Global Equity Income Fund
12 November 2010 A Class non-distributing share Global Equity Income Fund
12 November 2010 A Class distributing (Q) share Global Equity Income Fund

Audited Annual Report and Accounts 263
Notes to the Financial Statements continued
Effective date Type Fund
19 November 2010 A Class distributing (Q) UK reporting fund share Global Equity Income Fund
24 November 2010 D Class non-distributing share Global Equity Income Fund
25 November 2010 X Class non-distributing share Emerging Markets Fund
3 December 2010 A Class distributing (Q) share European Equity Income Fund
3 December 2010 A Class non-distributing share European Equity Income Fund
8 December 2010 A Class non-distributing share HUF unhedged Global Allocation Fund
14 December 2010 A Class non-distributing share GBP hedged Global High Yield Bond Fund
18 January 2011 D Class non-distributing share EUR hedged World Agriculture Fund
21 January 2011 D Class non-distributing share European Equity Income Fund
21 January 2011 E Class distributing (Q) share European Equity Income Fund
21 January 2011 E Class distributing (Q) share Global Equity Income Fund
21 January 2011 X Class non-distributing share Global High Yield Bond Fund
28 January 2011 A Class non-distributing share SGD hedged Emerging Europe Fund
28 January 2011 A Class non-distributing share SGD hedged Latin American Fund
1 February 2011 X Class UK reporting fund share World Agriculture Fund
4 March 2011 A Class distributing (M) share AUD hedged Local Emerging Markets Short Duration Bond Fund
4 March 2011 A Class distributing (M) share AUD hedged US Dollar High Yield Bond Fund
4 March 2011 A Class non-distributing share AUD hedged US Dollar High Yield Bond Fund
4 March 2011 X Class non-distributing share Global Equity Fund
9 March 2011 A Class non-distributing share SGD hedged Global Equity Fund
9 March 2011 A Class distributing (M) share SGD hedged US Dollar High Yield Bond Fund
9 March 2011 A Class non-distributing share SGD hedged US Dollar High Yield Bond Fund
11 March 2011 I Class non-distributing share European Focus Fund
16 March 2011 A Class non-distributing share CHF hedged Euro-Markets Fund
25 March 2011 A Class non-distributing share CHF hedged World Energy Fund
15 April 2011 A Class non-distributing share World Resources Equity Income Fund
15 April 2011 A Class distributing (Q) share World Resources Equity Income Fund
19 April 2011 C Class non-distributing share Global Equity Income Fund
19 April 2011 C Class distributing (Q) share Global Equity Income Fund
19 April 2011 A Class non-distributing share SGD hedged US Basic Value Fund
19 April 2011 D Class distributing (M) share US Dollar Core Bond Fund
19 April 2011 D Class distributing (M) share US Government Mortgage Fund
19 April 2011 D Class distributing (M) share US Dollar High Yield Bond Fund
19 April 2011 D Class distributing (M) share US Dollar Short Duration Bond Fund
20 April 2011 A Class non-distributing share PLN hedged World Agriculture Fund
21 April 2011 A Class distributing (A), (G) share European Equity Income Fund
5 May 2011 D Class non-distributing share EUR hedged Local Emerging Markets Short Duration Bond Fund
17 May 2011 A Class non-distributing share CHF hedged Local Emerging Markets Short Duration Bond Fund
18 May 2011 A Class distributing (A) share Continental European Flexible Fund
20 May 2011 D Class non-distributing share Asia Pacific Equity Income Fund
20 May 2011 E Class non-distributing share Asia Pacific Equity Income Fund
20 May 2011 E Class distributing (Q) share EUR hedged Asia Pacific Equity Income Fund
20 May 2011 E Class non-distributing share European Equity Income Fund
20 May 2011 E Class non-distributing share Global Equity Income Fund
20 May 2011 E Class distributing (Q) share EUR hedged Global Equity Income Fund
20 May 2011 E Class distributing (Q) share EUR hedged World Resources Equity Income Fund
20 May 2011 D Class non-distributing share World Resources Equity Income Fund
20 May 2011 E Class non-distributing share World Resources Equity Income Fund
20 May 2011 E Class non-distributing share Global High Yield Bond Fund
24 May 2011 D Class non-distributing share World Agriculture Fund
27 May 2011 D Class UK reporting fund share World Energy Fund
9 June 2011 X Class UK reporting fund share World Agriculture Fund
17 June 2011 A Class distributing (Q) share EUR hedged Global Equity Income Fund
17 June 2011 A Class non-distributing share EUR hedged Global Equity Income Fund
12 July 2011 A Class non-distributing share CHF hedged Latin American Fund
2 August 2011 A Class distributing (A), (G) share World Resources Equity Income Fund
12 August 2011 A Class non-distributing share Emerging Markets Equity Income Fund
12 August 2011 A Class distributing (Q) share Emerging Markets Equity Income Fund
22 August 2011 A Class non-distributing share PLN hedged Global Equity Income Fund

264 BlackRock Global Funds (BGF)
Notes to the Financial Statements continued
2. Summary of Significant Accounting PoliciesThe financial statements have been prepared in accordance with
the legal and regulatory requirements relating to the preparation
of the Financial Statements as prescribed by the Luxembourg
authorities for Luxembourg investment companies and include the
following significant accounting policies:
(a) Valuation of Investments and Other Assets
The Company’s investments and other assets are valued as follows:
� transferable securities which are admitted to an official exchange
listing or dealt in on another regulated market, are valued on
the basis of the latest available price prevailing on the valuation
date. Where such securities or other assets are quoted or dealt
in on or by more than one stock exchange or regulated market
the Directors may in their discretion select one of such stock
exchanges or regulated markets for such purposes;
For non-quoted securities or securities not traded or dealt in
on any stock exchange or other regulated market (including
securities of closed-ended investment funds), as well as quoted
or non quoted securities on such other markets for which no
valuation price is available, or securities for which the quoted
prices are, in the opinion of the Board of Directors of the Fund, not
representative of the fair market value, the value thereof shall be
determined prudently and in good faith by the Board of Directors
of the Fund on the basis of the realisable sale price;
� the date included in the description of the perpetual bonds in the
Portfolio of Investments is referring to the callable date of the
bonds (not to the maturity date);
The interest rate disclosed under the description in the Portfolio
of Investments is the interest rate applicable at year end and is
for information only as these bonds are bearing variable interest
rates;
� securities lending: securities are delivered to a third party broker
as per lending agent instructions, the assets of which continue to
be valued as part of the portfolio of the Fund;
� liquid assets and money market instruments may be valued at
nominal values plus any accrued interest or on an amortised cost
basis;
� cash, money market deposits, bills payable on demand and other
debts are valued at their nominal amount;
� assets which include in particular interest and dividends
receivable, receivable for investments sold, receivable for fund
shares subscribed and restructuring expenses, are valued at
nominal value;
� liabilities, which include in particular income distribution payable,
payable for investments purchased and payable for fund shares
redeemed are valued at nominal value; and
� To Be Announced Securities (TBAs) are related to mortgage
backed securities issued by government sponsored agencies.
These agencies usually pool mortgage loans and sell interests in
the pools created. TBAs relate to future pools of these agencies
that are bought and sold for future settlement for which either
the interest rate or the maturity date is not yet fixed. TBAs are
separately disclosed in the Portfolio of Investments.
Although the Funds will generally enter into TBA purchase
commitments with the intention of acquiring securities, the
Funds may also dispose of a commitment prior to settlement if
it is deemed appropriate to do so. Proceeds of TBA sales are not
received until the contractual settlement date. During the time a TBA
sale commitment is outstanding, equivalent deliverable securities,
or an offsetting TBA purchase commitment (deliverable on or before
the sale commitment date), are held as cover for the transaction.
If the TBA sale commitment is closed through the acquisition of an
offsetting purchase commitment, the Fund realises a gain or loss
on the commitment without regard to any unrealised gain or loss
on the underlying security. If the Fund delivers securities under
the commitment, the Fund realises a gain or loss from the sale
of the securities upon the unit price established at the date the
commitment was entered into.
The Funds had TBAs outstanding as of 31 August 2011, which
are included within receivable for investments sold and payable
for investments purchased in the Statement of Net Assets.
(b) Income from Investments
The Company takes credit for income from its investments on the
following basis:
� interest income is accrued daily and includes the amortisation on
a straight line basis of premiums and accretion of discounts;
� bank interest and money market deposit income are recognized
on an accrual basis;
� dividend income is accrued on the ex-dividend date; and
� security lending income is accrued on a monthly basis.
(c) Financial Instruments
During the year, the Company has entered into a number of
forward foreign exchange and futures contracts. Open forward
foreign exchange and futures contracts are valued at the cost to
close the contracts on the accounting date. Surpluses/deficits
arising from these and closed unsettled contracts are taken to
unrealised profit/loss and are included under assets or liabilities
(as appropriate) in the Statement of Net Assets on pages 7 to 12.
The Company can write covered call and put options and purchase
call and put options. The Company can also invest in spread
options, this is a type of option that derives its value from the
difference between the prices of two or more assets. When the
Company writes and/or purchases an option, an amount equal to
the premium received or paid by the Company is reflected as a
liability or an asset. The liability for a written option and the asset
for a purchased option is subsequently marked to market to reflect

Audited Annual Report and Accounts 265
Notes to the Financial Statements continued
the current value of the option. The Board of Directors have agreed
to value options based on mid prices rather than last traded prices
as this methodology best reflects their estimated probable value.
When a security is sold through the exercise of an option, the
premium received (or paid) is deducted from (or added to) the
basis of the security sold. When an option expires (or the Company
enters into a closing transaction), the Company realises a gain or
loss on the option to the extent of the premiums received or paid
(or gain or loss to the extent the cost of the closing transaction
exceeds the premium paid or received).
The Company has entered into swap agreements to exchange
the return generated by one instrument for the return generated
by another investment. In the case of credit default swaps, a
series of premiums is paid to the seller of the protection, in return
for a payment contingent on a credit event (predefined in the
agreement). Where possible, swaps are marked to market based
upon daily prices obtained from third party pricing agents and
verified against the actual market maker. Where such quotations are
not available swaps are priced based upon daily quotations from the
market maker. In both cases changes in quotations are recorded
as unrealised appreciation or depreciation in the Statement of
Operations and Changes in Net Assets. Realised gains or losses
on maturity or termination of the swaps and the interest earned in
relation to the swaps are presented in the Statement of Operations
and Changes in Net Assets on pages 30 to 39.
Securities repurchase (or reverse repurchase) transactions
are treated as lending (or, respectively, borrowing) operations
guaranteed by the underlying securities. These are operations
by which the assignor assigns to another person (the assignee)
ownership of the securities and by which the assignor undertakes
irrevocably to repurchase the securities and the assignee
undertakes irrevocably to resell them, at an agreed price and date.
Securities repurchase agreements are valued at their purchase
price expressed in the original currency. At 31 August 2011, there
are no outstanding securities repurchase (or reverse repurchase).
(d) Foreign Exchange
The cost of investments in currencies other than the currency of
denomination of the respective Fund has been translated at the rates
of exchange ruling at the time of purchase. Investments and other
assets in currencies other than the currency of denomination of the
respective Fund has been translated at the exchange rate prevailing
at the Fund’s valuation point in Luxembourg on 31 August 2011.
(e) Total Consolidated Figures
The consolidated figures of the Company are expressed in USD and
include the total of the financial statements of the different Funds.
For the Statement of Net Assets, the exchange rate prevailing at
the Fund’s valuation point in Luxembourg on 31 August 2011 is:
CCY EUR GBP JPY CHFUSD 0.6924 0.6128 76.6800 0.8058
For the Statement of Operations and Changes in Net Assets,
the exchange rate is the average rate calculated over the year
CCY EUR GBP JPY CHFUSD 0.7209 0.6237 81.6669 0.9140
These figures are presented for information purposes only.
(f) Exchange rates
The following exchange rates were used to translate the investments
and other assets and other liabilities denominated in currencies
other than the base currency of the Fund at 31 August 2011
CCY GBP USD EUR JPY CHFAED 0.1668 0.2723 0.1885 20.8766 0.2194
ARS 0.1459 0.2382 0.1649 18.2614 0.1919
AUD 0.6560 1.0704 0.7412 82.0745 0.8625
BRL 0.3860 0.6298 0.4361 48.2912 0.5075
CAD 0.6297 1.0276 0.7115 78.7951 0.8280
CHF 0.7605 1.2410 0.8593 95.1575 1.0000
CLP 0.0013 0.0022 0.0015 0.1654 0.0017
CNY 0.0961 0.1568 0.1086 12.0222 0.1263
COP 0.0003 0.0006 0.0004 0.0429 0.0005
CZK 0.0367 0.0599 0.0415 4.5913 0.0482
DKK 0.1188 0.1938 0.1342 14.8630 0.1562
EGP 0.1029 0.1680 0.1163 12.8803 0.1354
EUR 0.8850 1.4442 1.0000 110.7378 1.1637
GBP 1.0000 1.6318 1.1299 125.1226 1.3149
HKD 0.0786 0.1283 0.0889 9.8391 0.1034
HUF 0.0033 0.0053 0.0037 0.4071 0.0043
IDR 0.0001 0.0001 0.0001 0.0090 0.0001
ILS 0.1722 0.2811 0.1946 21.5515 0.2265
INR 0.0133 0.0217 0.0150 1.6651 0.0175
ISK 0.0054 0.0088 0.0061 0.6771 0.0071
JPY 0.0080 0.0130 0.0090 1.0000 0.0105
KRW 0.0006 0.0009 0.0006 0.0719 0.0008
KWD 2.2507 3.6726 2.5431 281.6174 2.9595
MAD 0.0781 0.1274 0.0882 9.7688 0.1027
MXN 0.0495 0.0807 0.0559 6.1919 0.0651
MYR 0.2054 0.3352 0.2321 25.7057 0.2701
NOK 0.1145 0.1868 0.1293 14.3228 0.1505
NZD 0.5240 0.8551 0.5921 65.5693 0.6891
PEN 0.2247 0.3666 0.2539 28.1136 0.2954
PHP 0.0145 0.0236 0.0164 1.8133 0.0191
PKR 0.0070 0.0115 0.0079 0.8789 0.0092
PLN 0.2134 0.3483 0.2411 26.7042 0.2806
QAR 0.1683 0.2746 0.1902 21.0580 0.2213
RUB 0.0212 0.0347 0.0240 2.6576 0.0279
SAR 0.1634 0.2666 0.1846 20.4460 0.2149
SEK 0.0967 0.1579 0.1093 12.1048 0.1272
SGD 0.5096 0.8315 0.5758 63.7616 0.6701
SKK 0.0294 0.0479 0.0332 3.6758 0.0386
THB 0.0204 0.0334 0.0231 2.5586 0.0269
TRY 0.3567 0.5820 0.4030 44.6293 0.4690
TWD 0.0211 0.0345 0.0239 2.6433 0.0278
USD 0.6128 1.0000 0.6924 76.6800 0.8058
ZAR 0.0873 0.1425 0.0987 10.9289 0.1149

266 BlackRock Global Funds (BGF)
Notes to the Financial Statements continued
(g) Swing Adjustment
If on any dealing day the aggregate transactions in shares of all
classes of a Fund result in a net increase or decrease of shares
which exceeds a threshold set by the Directors, the Net Asset
Value of the relevant Fund will be adjusted by an amount which
reflects the estimated dealing costs to be incurred by the Fund
and the estimated bid/offer spread of the assets in which the Fund
invests. In accordance with the prospectus Appendix B, 17 (c),
such a swing was applied as at 31 August 2011 to the Emerging
Markets Bond Fund and as at 31 August 2010 to the Asian Tiger
Bond Fund and the Global High Yield Bond Fund.
The published/dealing NAV per share is disclosed in the Three
Year Summary of Net Asset Values and may include a swing pricing
adjustment. This adjustment is not recognised in the Statement of Net
Assets and the Statement of Operations and Changes in Net Assets.
3. Management CompanyBlackRock (Luxembourg) S.A. has been appointed by the Company
to act as its Management Company. The Management Company is
authorised to act as a Fund Management Company in accordance
with Chapter 15 of the law of 17 December 2010.
The Company has signed restated Management Company Agreement,
with the Management Company effective 1 August 2009. Under this
agreement, the Management Company is entrusted with the day-to-
day management of the Company, with responsibility for performing
directly or by way of delegation all operational functions relating
to the Company’s investment management, administration, and
marketing of the Funds.
In agreement with the Company, the Management Company has
decided to delegate several of its functions as is further described
in the Prospectus.
The Directors of the Management Company are: Graham Bamping,
Frank P. Le Feuvre and Geoffrey D. Radcliffe. BlackRock
(Luxembourg) S.A. is a wholly owned subsidiary within the
BlackRock Group. It is regulated by the Commission de Surveillance
du Secteur Financier (“CSSF”).
4. Management and Distribution FeesDuring the year the Company paid management fees to the
Management Company, BlackRock (Luxembourg) S.A.
The Company pays management fees as shown in Appendix E of
the Prospectus. The level of management fee varies from 0.25% to
1.75% according to which Fund and Share Class the investor buys
and, with the exception of certain Class D, Class I and Class Q
Shares, is the same for all classes of shares within each Fund.
Management fees accrue daily, are based on the Net Asset Value of
the relevant Fund and are paid monthly. The Management Company
pays certain costs and fees out of the management fee, including
the fees of the Investment Advisers. There are no management fees
charged on Class J and Class X Shares.
During the year the Company paid distribution fees to BlackRock
(Channel Islands) Limited who acted as Principal Distributor.
The Company pays annual distribution fees as shown in Appendix E
of the Prospectus. The level of distribution fee varies from 0.50% to
1.25%. Class A, D, I, J and X Shares do not pay a distribution fee.
Class A, B, C, D, I, J and X Shares do not pay a distribution fee for
Euro Reserve Fund and US Dollar Reserve Fund. These rates have
changed as per the updated prospectus dated 31 May 2011. These
fees accrue daily, are based on the Net Asset Value of the relevant
Fund (reflecting, when applicable, any swing adjustment to the Net
Asset Value of the relevant Fund, as described in paragraph 17(c) of
Appendix B) and are paid monthly.
The Principal Distributor may rebate all or part of its distribution
fee as described in paragraph 22 of Appendix C of the current
Prospectus, such rebates, if any, are included in the administration
fee subsidy as discussed in note 5.
Management fees and distribution fees due and payable at
31 August 2011 are included on the Statement of Net Assets
as other liabilities.
During the year the following active Funds were subject to a
management fee subsidy:
Euro Reserve Fund
US Dollar Reserve Fund
5. Administration FeesThe Company pays an administration fee to the Management
Company.
The level of administration fee may vary at the Directors’ discretion,
as agreed with the Management Company, and will apply at
different rates across the various Funds and Share Classes
issued by the Company. However, it has been agreed between the
Directors and the Management Company that the administration
fee currently paid shall not exceed 0.25% per annum. It is accrued
daily, based on the Net Asset Value of the relevant Share Class and
paid monthly.
The rates charged per annum are as follows:
Share Class Equity Funds
Fixed Income Funds
Balanced / Multi-Assets Funds
Cash / Short Term Funds
A, B, C, D, E, Q 0.25% 0.15% 0.20% 0.075%*
I, J, X 0.03% 0.03% 0.03% 0.03%
Investment in I, J and X Shares is restricted to institutional investors within the meaning of Article
129 of the law of 17 December 2010.
* except for Class Q (0.10%) and for the Local Emerging Markets Short Duration Bond Fund,
Class A,B,C,D,E,Q (0.15%) and Class I,J,X (0.03%).
The Directors and the Management Company set the level of
the administration fee at a rate which aims to ensure that the
total expense ratio of each Fund remains competitive when
compared across a broad market of similar investment products
available to investors in the Funds, taking into account a number
of criteria such as the market sector of each Fund and the Fund's
performance relative to its peer group.

Audited Annual Report and Accounts 267
The administration fee is used by the Management Company to meet
all fixed and variable operating and administrative costs and expenses
incurred by the Company, with the exception of the Custodian fees,
Distribution fees and Securities Lending fees, plus any taxes thereon
and any taxes at an investment or Company level. These operating
and administrative expenses include all third party expenses and other
recoverable costs incurred by or on behalf of the Company from time
to time, including but not limited to, fund accounting fees, transfer
agency fees (including sub-transfer agency and associated platform
dealing charges), all professional costs, such as consultancy, legal, tax
advisory and audit fees, Directors’ fees (for those Directors who are
not employees of the BlackRock Group), travel expenses, reasonable
out-of-pocket expenses, printing, publication, translation and all other
costs relating to shareholder reporting, regulatory filing and licence
fees, correspondent and other banking charges, software support
and maintenance, operational costs and expenses attributed to the
Investor Servicing teams and other global administration services
provided by various BlackRock Group companies.
The Management Company bears the risk of ensuring that the Fund's
total expense ratio remains competitive. Accordingly the Management
Company is entitled to retain any amount of the Administration Fee
paid to it which is in excess of the actual expenses incurred by the
Company during any year whereas any costs and expenses incurred by
the Company in any year which exceed the amount of Administration
Fee that is paid to the Management Company, shall be borne by the
Management Company or another BlackRock Group company.
Directors who are not representatives of the BlackRock Group
receive a fee of EUR 30,000 net of taxation in return for their duties
performed per financial year.
The custody fee is charged directly to the Funds. Taxation
applicable in certain jurisdictions is also charged directly to the
Funds (see Note 7).
During the year the following active Funds were subject to an
Administration fee subsidy:
Euro Corporate Bond Fund US Dollar Core Bond Fund
Euro Short Duration Bond Fund US Dollar High Yield Bond Fund
European Enhanced Equity Yield Fund US Dollar Short Duration Bond Fund
Flexible Multi-Asset Fund US Government Mortgage Fund
Global Corporate Bond Fund World Agriculture Fund
Global Government Bond Fund World Income Fund
The administration fee subsidy is disclosed separately on the
Statement of Operations and Changes in Net Assets.
Administration fees due and payable at 31 August 2011 are
included on the Statement of Net Assets as other liabilities.
6. Custodian and Depositary FeesThroughout the year the Custodian of the Company was The Bank
of New York Mellon (International) Ltd. The Custodian receives
annual fees, based on the value of securities, which accrue daily,
plus transaction fees. The annual custody safe keeping fees range
from 0.24 bps to 65 bps per annum and the transaction fees range
from USD 5.50 to USD 245 per transaction. The rates for both
categories of fees will vary according to the country of investment
and, in some cases, according to asset class. Investments in bonds
and developed equity markets will be at the lower end of these
ranges, while some investments in emerging or developing markets
will be at the upper end. Thus the custody cost to each Fund will
depend on its asset allocation at any time.
Custodian and depositary fees due and payable at 31 August 2011
are included on the Statement of Net Assets as other liabilities.
7. Tax
LuxembourgThe Company is registered under Luxembourg law as an investment
company. Accordingly, no Luxembourg income or capital gains tax is
at present payable by the Company. However, it is subject to an annual
“taxe d’abonnement” calculated at an annual rate of 0.05% and, in the
case of the Euro Reserve Fund, US Dollar Reserve Fund and all Class I,
J and X Shares at a rate of 0.01% of the Net Asset Value of each
Fund at the end of each quarter. For the year ended 31 August 2011
USD 48,480,217 was charged in relation to Luxembourg tax.
BelgiumThe Company is registered with the Banking and Finance
Commission in Belgium in accordance with Article 130 of the Act
of 20 July 2004 relating to financial transactions and the financial
markets. Funds registered for public distribution in Belgium are
subject to an annual tax of 0.08% on the net asset value of units
distributed in Belgium via Belgian intermediaries as at 31 December
of the previous year. For the year ended 31 August 2011,
USD 1,293,504 was charged in relation to Belgium tax.
BrazilThe Brazilian government increased the tax on financial transactions
(Imposto sobre Operaçoes Financeiras, or IOF) related to foreign
investments in the Brazilian financial and capital markets from zero to
two percent on foreign exchange inflows, effective 20 October 2009.
The IOF tax applies only to foreign exchange transactions into
Brazilian Reais for any new equity or debt investment made by
foreign investors on the Brazilian stock exchanges (principally Bolsa
de Valores, Mercadorias & Futuros de Sao Paulo (BM&F-BOVESPA))
or the OTC market. This charge is included in the custodian and
depositary fees. For the year ended 31 August 2011, USD 9,424,364
was charged in relation to Brazilian tax.
United KingdomReporting Funds
The UK Reporting Funds regime applies to the Company. Under
this regime, investors in UK Reporting Funds are subject to tax on
the share of the UK Reporting Fund's income attributable to their
holdings in the Fund, whether or not distributed, but any gains
on disposal of their holdings are subject to capital gains tax. The
Directors have made a successful application for UK Reporting
Fund status in relation to Funds which previously had UK Distributor
Status as well as certain newly launched Funds. The Directors may
also choose to apply for UK Reporting Fund status in respect of
Funds which did not previously have UK Distributor Status. A list
of the Funds which currently have UK Reporting Fund status is
available at www.blackrock.co.uk/reportingfundstatus.
Notes to the Financial Statements continued

268 BlackRock Global Funds (BGF)
Notes to the Financial Statements continued
8. Investment AdviceThe Management Company, BlackRock (Luxembourg) S.A., has
delegated some management and investment advice to the
Investment Advisers: BlackRock Financial Management, Inc.,
BlackRock International Limited, BlackRock Investment
Management LLC, BlackRock Investment Management (UK) Limited
and BlackRock (Singapore) Limited as described in the Prospectus.
BlackRock Financial Management, Inc. provides investment advice
on the following Funds:
Asian Tiger Bond Fund
Emerging Markets Bond Fund
Global Inflation Linked Bond Fund
Local Emerging Markets Short Duration Bond Fund
US Dollar Core Bond Fund
US Dollar High Yield Bond Fund
US Dollar Reserve Fund
US Dollar Short Duration Bond Fund
US Government Mortgage Fund
World Income Fund
BlackRock International Limited provides investment advice on the
following Fund:
Global Opportunities Fund
BlackRock Investment Management, LLC provides investment
advice on the following Funds:
European Enhanced Equity Yield Fund
Global Allocation Fund
Global Dynamic Equity Fund
Global Enhanced Equity Yield Fund
Global SmallCap Fund
Latin American Fund
US Basic Value Fund
US Flexible Equity Fund
US Growth Fund
US Small & MidCap Opportunities Fund
World Financials Fund
World Healthscience Fund
In the case of the following Funds, BlackRock Investment
Management (UK) Limited has in turn sub-delegated some
functions to BlackRock Japan Co., Ltd:
Japan Fund
Japan Small & MidCap Opportunities Fund
In the case of the following Funds, BlackRock Investment
Management (UK) Limited has sub-delegated some functions to
BlackRock Japan Co., Ltd, who has in turn sub-delegated some
functions to BlackRock (Hong Kong) Limited:
Japan Value Fund
Pacific Equity Fund
BlackRock Financial Management, Inc. has in turn sub-delegated
some functions to BlackRock Investment Management (UK) Limited
and BlackRock Investment Management (Australia) Limited for the
following Funds:
Fixed Income Global Opportunities Fund
Global Corporate Bond Fund
Global Government Bond Fund
Global High Yield Bond Fund
World Bond Fund
In the case for the following Funds, BlackRock Investment
Management (UK) Limited, has in turn sub-delegated some
functions to BlackRock (Hong Kong) Limited:
Asia Pacific Equity Income Fund
Asian Dragon Fund
China Fund
India Fund
For the remaining Funds, BlackRock Investment Management (UK)
Limited is the Investment Adviser.
The Management Company remunerates the Investment Advisers
from the management fee charged to the Company.
9. Transactions with Connected PersonsThe ultimate holding company of the Management Company, the
Investment Manager and the Investment Advisers is BlackRock,
Inc., a company incorporated in Delaware, USA. PNC Bank N.A.
is a substantial shareholder in BlackRock Inc. When arranging
transactions in securities for the Company, companies in the
PNC Group may have provided securities brokerage, foreign
exchange, banking and other services, or may have acted as
principal, on their usual terms and may have benefited therefrom.
Commissions have been paid to brokers and agents in accordance
with the relevant market practice and the benefit of any bulk or
other commission discounts or cash commissions rebates provided
by brokers or agents have been passed on to the Company. The
services of PNC Group companies could have been used by the
Investment Advisers where it was considered appropriate to do
so provided that their commissions and other terms of business
are generally comparable with those available from unassociated
brokers and agents in the markets concerned, and this is
consistent with the above policy of obtaining best net results.
During the year, there have been no transactions which were
outside the ordinary course of business or which were not on
normal commercial terms. There was no transactions of the
Company effected through BlackRock companies.
During the year, no Director purchased shares in any of the Funds.
10. Use of CommissionsOne or more of the Investment Advisers (“Advisers”) may and do
enter into commission sharing arrangements or their equivalent,
where they are permitted to do so by local law or regulation. Such
arrangements will only be entered into where the Advisers believe
that the research or execution services obtained through these
arrangements either enhances their investment decision-making
capabilities or their execution of trades, thereby increasing the
prospects for higher investment returns. The Advisers will enter into

Audited Annual Report and Accounts 269
Notes to the Financial Statements continued
such arrangements with key global brokers and the brokers agree to
use some of the commission arising on the trades from the Advisers
in recognition of the research and execution services they provide
to the Advisers or to pay for third party services that support the
execution of trades by the Advisers or the provision of research to
the Advisers. All trades remain subject to the requirements of best
execution and the arrangements are kept under review.
11. Securities LendingThe Company has appointed BlackRock Advisors (UK) Limited
as securities lending agent which in turn may sub-delegate the
provision of securities lending agency services to other BlackRock
Group companies. From 31 March 2011, BlackRock Investment
Management, LLC, ceased to be the securities lending agent and
BlackRock Advisors (UK) Limited commenced.
BlackRock Advisors (UK) Limited has the discretion to arrange
stock loans with highly rated specialist financial institutions (the
“counterparties”). Such counterparties can include associates
of BlackRock Advisors (UK) Limited. Such lending may only be
effected in accordance with the terms of the Prospectus which
reflects requirements of CSSF Circular 08/356.
The income earned from the securities lending program is shown
in the specific Fund’s Statement of Operations and Changes in Net
Assets on pages 30 to 39. As at 31 August 2011 the total valuation
of securities on loan is USD 1,351,823,169 and the market value of
stock collateral is USD 1,544,009,765. These are priced based on
the closing prices of the previous day.
The collateral consists of shares admitted to or dealt in on a
regulated market. This collateral is held by the Custodian and
JP Morgan UK, is not reflected in the financial statements.
The table below provides the value of securities on loan which are
evidenced by a “*” in the relevant Fund’s Portfolio of Investments at a
Fund level as at 31 August 2011 and the value of collateral held.
Fund Values of Securities on loan
USD
Collateral Market Value
USD
Asia Pacific Equity Income Fund 850,501 947,205 Asian Dragon Fund 26,178,708 29,639,747 Continental European Flexible Fund 23,684,950 27,839,724 Emerging Europe Fund 58,495,619 66,568,150 Emerging Markets Bond Fund 8,448,631 9,025,660 Emerging Markets Fund 17,439,022 19,568,135 Euro Bond Fund 5,849,280 6,170,900 Euro Corporate Bond Fund 1,605,237 1,686,460 Euro-Markets Fund 59,251,867 67,809,852 European Enhanced Equity Yield Fund 158,316 176,106 European Fund 44,031,986 49,048,680 European Growth Fund 2,949,566 3,264,799 European Small & MidCap Opportunities Fund 9,860,704 11,741,382 European Value Fund 103,075 113,211 Euro Short Duration Bond Fund 1,645,372 1,713,237 Flexible Multi-Asset Fund 3,507,234 3,880,638 Global Allocation Fund 229,815,239 261,334,414 Global Corporate Bond Fund 2,227,083 2,284,212 Global Dynamic Equity Fund 9,357,504 10,558,838
Fund Values of Securities on loan
USD
Collateral Market Value
USD
Global Enhanced Equity Yield Fund 6,100,253 7,030,561 Global Equity Fund 3,912,889 4,346,200 Global High Yield Bond Fund 12,289,592 12,882,715 Global Opportunities Fund 1,661,775 1,874,774 Global SmallCap Fund 5,149,379 5,996,464 Japan Fund 3,622,240 4,058,355 Japan Small & MidCap Opportunities Fund 15,121,426 16,914,257 Japan Value Fund 19,385,169 21,687,510 Latin American Fund 28,875,559 34,013,982 New Energy Fund 204,817,206 236,810,381 Pacific Equity Fund 8,498,593 9,504,032 Swiss Small & MidCap Opportunities Fund 9,197,308 10,365,124 United Kingdom Fund 520,765 633,709 US Dollar Core Bond Fund 1,209,940 1,293,092 US Dollar High Yield Bond Fund 26,160,033 27,576,271 World Agriculture Fund 3,140,063 3,641,094 World Energy Fund 232,040,285 260,850,133 World Financials Fund 11,617,516 13,005,186 World Gold Fund 75,457,010 88,295,184 World Healthscience Fund 845,879 964,865 World Mining Fund 175,816,906 207,857,772 World Technology Fund 923,489 1,036,754
12. Securities Pledged or Given in GuaranteeUnderlying securities of written call options which are pledged are
evidenced by a “†” in the Portfolio of Investments of the Funds.
As at 31 August 2011 the value of these securities amounts to
USD 305,762,772.
For the European Enhanced Equity Yield Fund and the Global
Enhanced Equity Yield Fund, the collateral on written call options is
pledged under a tri-party agreement between BlackRock Investment
Management (UK) Limited, Merrill Lynch International and Bank
of New York Mellon (International) Limited. As at 31 August 2011
the value of the collateral, evidenced by a “^” in the Portfolio of
Investments of the Fund, amounts to USD 32,975,868.
Securities which have been given as guarantee for futures
transactions, are evidenced by “‡” in the Portfolio of Investments
of the Funds. As at 31 August 2011 the value of these securities
amounts to USD 78,377,258.
Securities which have been received in guarantee are detailed in
table below. As at 31 August 2011 the value of these securities
amounts to USD 2,508,934.
Fund Holdings Description Value (USD)
Euro Bond Fund 1,148,000 Bundesrepublik
Deutschland 2.5%
27/2/2015 1,762,562
98,000 Bundesrepublik
Deutschland 4.25%
4/1/2014 157,015
World Bond Fund 95,000 United Kingdom Gilt
Inflation Linked 2.5%
26/7/2016 527,105
World Income Fund 62,000 US Treasury Note
0.875% 29/2/2012 62,252

270 BlackRock Global Funds (BGF)
Notes to the Financial Statements continued
13. Cash CollateralThe table below provides the cash collateral balances due from /
(due to) to the brokers in relation to the swap contracts held as at
31 August 2011:
Fund CCY Due from / (Due to) to brokers
Asian Tiger Bond Fund USD (990,000)Continental European Flexible Fund EUR 533,900 Emerging Markets Bond Fund USD 1,200,000 Euro Bond Fund EUR (2,680,875)Euro Short Duration Bond Fund EUR (7,339,802)European Enhanced Equity Yield Fund EUR 665,000 Fixed Income Global Opportunities Fund USD (480,000)Global Allocation Fund USD 30,990,000 Global Dynamic Equity Fund USD 5,150,000 Global Government Bond Fund USD (685,973)Global High Yield Bond Fund USD 10,000 Local Emerging Markets Short Duration
Bond Fund USD 11,753,498 US Dollar Core Bond Fund USD 300,000 US Dollar High Yield Bond Fund USD (630,000)US Government Mortgage Fund USD 610,000 World Income Fund USD (600,000)
14. DividendsThe Directors’ current policy is to retain and reinvest all net income
except for income from the distributing Funds and income from the
UK reporting fund classes (detailed in note 1). For the distributing
share classes and UK reporting fund classes, the policy is to
distribute substantially all the investment income for the year after
deduction of expenses (or gross income in the case of Distributing (G)
Shares). The Board of Directors may also determine if and to what
extent dividends may include distributions from both realised and
unrealised capital gains and in the case of Funds which distribute
income gross of expenses from initially subscribed capital.
For those Funds which offer distributing shares, the frequency at
which the dividend payment is made is determined by the fund
type, with dividends normally paid as follows:
� monthly on the bond distributing Funds where there is income to
distribute;
� quarterly on the Asia Pacific Equity Income Fund, European Fund,
Emerging Markets Equity Income Fund, Euro Bond Fund, Euro
Corporate Bond Fund, European Enhanced Equity Yield Fund,
European Equity Income Fund, Fixed Income Global Opportunities
Fund, Global Enhanced Equity Yield Fund, Global Equity Income
Fund and World Resources Equity Income Fund (and such other
Funds as the Board of Directors may determine from time to
time) where there is income to distribute;
� annually on the equity distributing Funds, at the discretion of the
Board of Directors. UK reporting equity Funds will pay an annual
dividend, if there is income to distribute.
Those Distributing Funds which pay dividends monthly are further
divided into shares as follows:
� those shares for which dividends are calculated daily are known
as Distributing (D) Shares;
� those shares for which dividends are calculated monthly are
known as Distributing (M) Shares.
With effect from 31 March 2011, investors may choose to hold
either Distributing (M) Shares or Distributing (D) Shares.
Distributing shares with quarterly dividend payment are known as
Distributing (Q) Shares.
Distributing shares with annual dividend payment are known as
Distributing (A) Shares.
The declaration and payment of dividends and the reinvestment
options available to shareholders are set out in the Prospectus.
15. Subsequent EventsEffective 11 November 2011, the Renminbi Bond Fund, denominated
in RMB was launched.
On 20 October 2011, the Directors approved an updated prospectus
expected to come into effect 15 December 2011.

Audited Annual Report and Accounts 271
Audit report
To the Shareholders of
BlackRock Global Funds
Following our appointment by the General Meeting of the Shareholders dated 21 February 2011, we have audited the accompanying financial statements of BlackRock Global Funds and of each of its sub-funds, which comprise the statement of net assets and the portfolio of investments as at 31 August 2011 and the statement of operations and changes in net assets for the year then ended, and a summary of significant accounting policies and other explanatory notes to the financial statements.
Responsibility of the Board of Directors of the SICAV for the financial statements
The Board of Directors of the SICAV is responsible for the preparation and fair presentation of these financial statements in accordance with Luxembourg legal and regulatory requirements relating to the preparation of the financial statements and for such internal control as the Board of Directors of the SICAV determines is necessary to enable the preparation of financial statements that are free from material misstatement, whether due to fraud or error.
Responsibility of the “Réviseur d’entreprises agréé”
Our responsibility is to express an opinion on these financial statements based on our audit. We conducted our audit in accordance with International Standards on Auditing as adopted for Luxembourg by the “Commission de Surveillance du Secteur Financier”. Those standards require that we comply with ethical requirements and plan and perform the audit to obtain reasonable assurance about whether the financial statements are free from material misstatement.
An audit involves performing procedures to obtain audit evidence about the amounts and disclosures in the financial statements. The procedures selected depend on the judgment of the “Réviseur d’entreprises agréé”, including the assessment of the risks of material misstatement of the financial statements, whether due to fraud or error. In making those risk assessments, the “Réviseur d’entreprises agréé” considers internal control relevant to the entity’s preparation and fair presentation of the financial statements in order to design audit procedures that are appropriate in the circumstances, but not for the purpose of expressing an opinion on the effectiveness of the entity’s internal control. An audit also includes evaluating the appropriateness of accounting policies used and the reasonableness of accounting estimates made by the Board of Directors of the SICAV, as well as evaluating the overall presentation of the financial statements.
We believe that the audit evidence we have obtained is sufficient and appropriate to provide a basis for our audit opinion.
PricewaterhouseCoopers S.à r.l., 400 Route d’Esch, B.P. 1443, L-1014 LuxembourgT: +352 494848 1, F:+352 494848 2900, www.pwc.lu
Cabinet de révision agréé. Expert-comptable (autorisation gouvernementale n°00123693)R.C.S. Luxembourg B 65 477 - Capital social EUR 516 950 - TVA LU17564447

272 BlackRock Global Funds (BGF)
Opinion
In our opinion, the financial statements give a true and fair view of the financial position of BlackRock Global Funds and of each of its sub-funds as of 31 August 2011, and of the results of their operations and changes in their net assets for the year then ended in accordance with Luxembourg legal and regulatory requirements relating to the preparation of the financial statements.
Other matters
Supplementary information included in the annual report has been reviewed in the context of our mandate but has not been subject to specific audit procedures carried out in accordance with the standards described above. Consequently, we express no opinion on such information. However, we have no observation to make concerning such information in the context of the financial statements taken as a whole.
PricewaterhouseCoopers S.à r.l. Luxembourg, 9 December 2011
Represented by
John Parkhouse

Audited Annual Report and Accounts 273
General Information
Current ProspectusThe Company’s Prospectus, and Simplified Prospectus dated 31 May 2011 along with copies of the Application Form may be obtained
from the Local Investor Services Centre, the Manager or any of the Representatives or Distributors. Copies of the Company’s Articles of
Association and the Audited Annual and Unaudited Interim Report and Accounts may also be obtained free of charge from any of these
offices and from the Paying Agents.
RepresentativesThe representative in Hong Kong is BlackRock (Hong Kong) Limited, 11/F York House, N°15 Queen’s Road, Central Hong Kong.
The representative in Switzerland is BlackRock Investment Management (UK) Limited (London), Zurich Branch, Claridenstrasse 25,
P.O. Box 2118, CH-8022 Zürich.
The representative in Poland is BlackRock Investment Management (UK) Limited, Oddział w Polsce, Rondo ONZ 1, 00-124 Warsaw, Poland.
Authorised StatusThe Company is an Undertaking for Collective Investment in Transferable Securities (“UCITS”) under the Luxembourg law of 17 December 2010.
Regulatory consents have been obtained or appropriate notifications have been made for the distribution of shares of all the Company’s Funds in
the umbrella in the following countries:
Austria, Denmark, Finland, France, Germany, Gibraltar, Guernsey, Hungary, Iceland, Ireland, Jersey, Luxembourg, Netherlands, Norway,
Poland, Spain, Sweden and the United Kingdom.
Regulatory consents have been obtained or appropriate notifications have been made for the distribution of shares of certain Funds in the
umbrella in the following countries:
Bahrain, Belgium, Brunei, Chile, Greece, Hong Kong, Italy, Japan, Korea, Macau, Peru, Portugal, Qatar, Singapore, Switzerland and Taiwan.
Shares of certain Funds in the umbrella may also be offered in Malta, Mauritius and Singapore by private placement.
Paying AgentsAustria
Raiffeisen Bank
International AG
Am Stadtpark 9
1030 Vienna
Belgium
J.P. Morgan Chase Bank
Brussels Branch
1 Boulevard du Roi Albert II
Brussels
B1210 – Belgium
Luxembourg
Central Paying Agent
J.P. Morgan Bank
Luxembourg S.A.
6, route de Trèves, Building C
L-2633 Senningerberg
Italy
Allfunds Bank S.A.
Milan branch
Via Santa Margherita 7
20121 Milan
Banca Monte Dei Paschi
di Siena S.p.A.
Con Piazza Salimbeni 3
53100 Siena
BNP Paribas Securities
Services
Succursale di Milano
Via Ansperto 5
20123 Milan
RBC Dexia Investor
Services Bank S.A.
Succursale di Milano
Via Vittor Pisani, 26
20124 Milan
Société Générale Securities
Services S.p.A.
Registered Office
Via Benigno Crespi, 19/A, MAC II
20159 Milan
State Street Bank S.p.A.
Via Col Moschin, 16
20136 Milan
Poland
Bank Handlowy
w Warszawie S.A.
ul. Senatorska 16
00-923 Warsaw
Switzerland
JPMorgan Chase Bank
National Association
Columbus
Zürich Branch
Dreikönigstrasse 21
CH-8002 Zurich
United Kingdom
J.P. Morgan Trustee and
Depositary Company Limited
Hampshire Building
1st Floor
Chaseside
Bournemouth
BH7 7DA

274 BlackRock Global Funds (BGF)
General Information continued
Mauritius Subsidiary
Directors Mauritian Auditor to the SubsidiaryCouldip Basanta Lala PricewaterhouseCoopers
Nicholas C.D. Hall 18, Cybercity, Ebene
Kapildeo Joory Mauritius
Frank P. Le Feuvre
Geoffrey D. Radcliffe
Indian Investment Adviser Investment ManagerDSP BlackRock Investment Managers Limited BlackRock Investment Management (UK) Limited
Mafatlal Centre, 10th Floor 12 Throgmorton Avenue
Nariman Point London EC2N 2DL
Mumbai - 400 021 UK
India [new address with effect from 1 August 2011]
[new address with effect from 17 January 2011]
Mauritian AdministratorIFS International Financial Services Limited
IFS Court
Twenty Eight, Cybercity
Ebene
Mauritius
Publication of Prices and Notices to ShareholdersNotices are sent to registered shareholders and (when legally required) published in such newspapers as decided by the Board of Directors
and in the Recueil des Sociétés et Associations du Mémorial in Luxembourg. Financial notices are given by publication in the Financial
Times in London, and also in Luxembourg. The previous Dealing Day’s prices for shares may be obtained during business hours from
the Investor Service Centre. They will also be published in such countries as required under applicable law and at the discretion of the
Directors in a number of newspapers worldwide. The Company cannot accept any responsibility for error or delay in the publication or non-
publication of prices. Historic dealing prices for all shares are available from the Fund Accountant or local Investor Services Centre.
Purchases and SalesA detailed list of investments purchased and sold for any Fund during the year is available upon request, free of charge, from the Registered
office, or the offices of the Representatives as mentioned above.
Disclosure PolicyDetails of month end holdings and valuations for all BlackRock Global Funds will be made available upon request from the Investor Services
Centre to any BlackRock Global Funds shareholder no earlier than 10 business days after a given month end. BlackRock Global Funds
reserves the right to require shareholders to sign an appropriate non-disclosure document prior to providing such information.


FOR MORE INFORMATIONTel +44 (0)20 7743 3000
blackrockinternational.com
PRISMA 11/1678 BGF AR ENG 0811BlackRock® is a trademark of the BlackRock Group registered, amongst others, in the United States,
the European Union and other jurisdictions around the world