Black Box Testing - Adam's Note · PDF file2 Agenda Black Box Testing – Techniques Cause...
25
Black Box Testing Adam Hendra Brata
Transcript of Black Box Testing - Adam's Note · PDF file2 Agenda Black Box Testing – Techniques Cause...

Black Box Testing
Adam Hendra Brata
2
Agenda
Black Box Testing– Techniques
Cause Effect Graph
Decision Table
3
Black Box Testing TechniquesCause Effect Graph
4
Cause Effect Graph
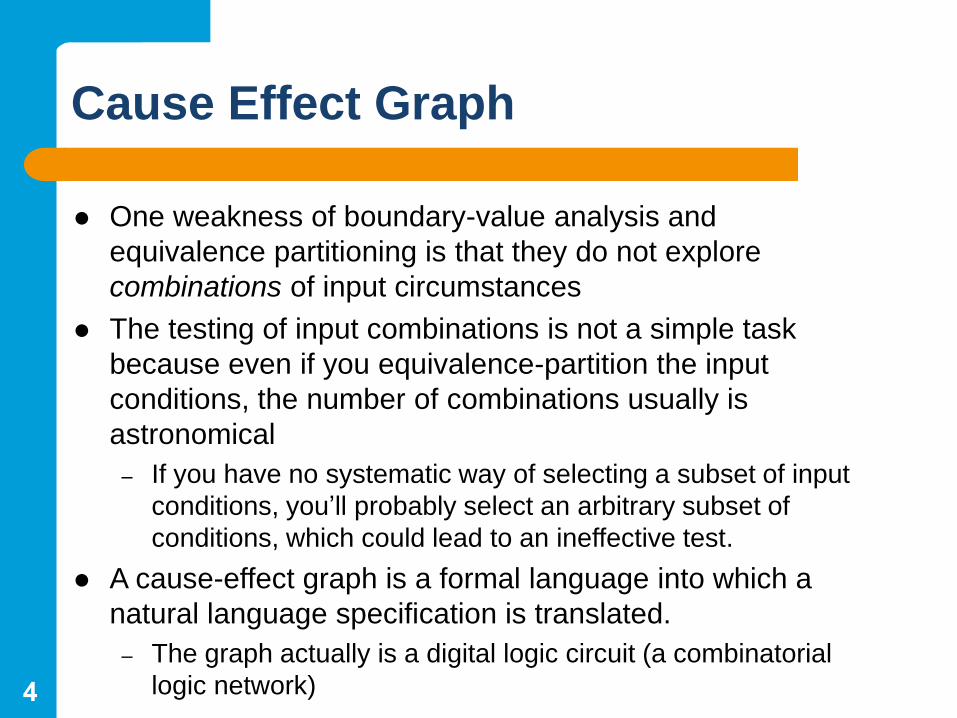
One weakness of boundary-value analysis and
equivalence partitioning is that they do not explore
combinations of input circumstances
The testing of input combinations is not a simple task
because even if you equivalence-partition the input
conditions, the number of combinations usually is
astronomical
– If you have no systematic way of selecting a subset of input
conditions, you’ll probably select an arbitrary subset of
conditions, which could lead to an ineffective test.
A cause-effect graph is a formal language into which a
natural language specification is translated.
– The graph actually is a digital logic circuit (a combinatorial
logic network)
5
Cause Effect Graph
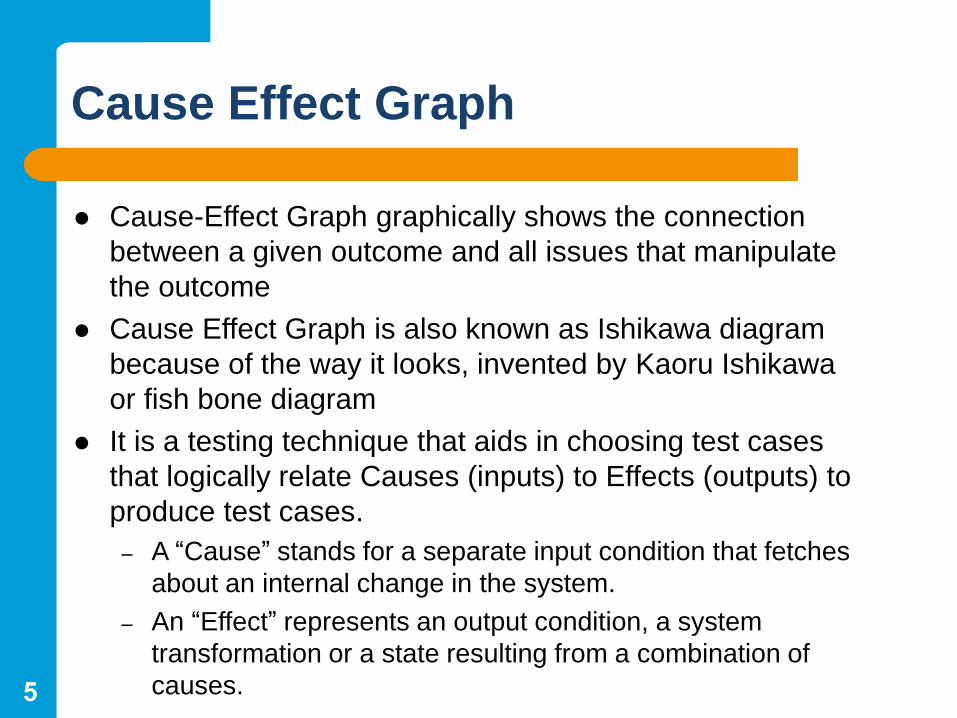
Cause-Effect Graph graphically shows the connection
between a given outcome and all issues that manipulate
the outcome
Cause Effect Graph is also known as Ishikawa diagram
because of the way it looks, invented by Kaoru Ishikawa
or fish bone diagram
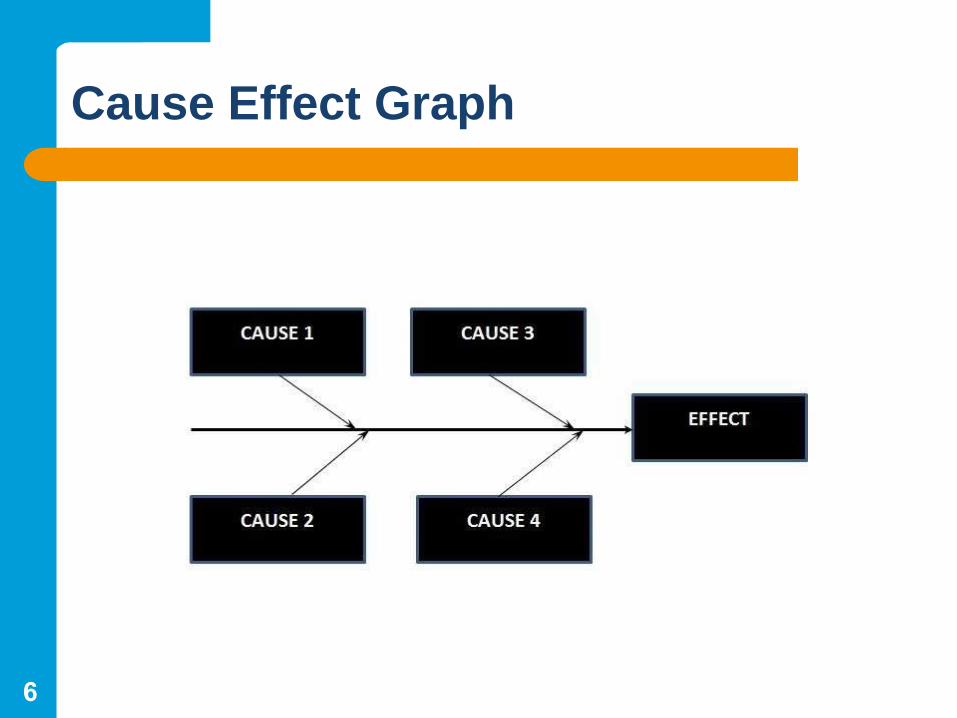
It is a testing technique that aids in choosing test cases
that logically relate Causes (inputs) to Effects (outputs) to
produce test cases.
– A “Cause” stands for a separate input condition that fetches
about an internal change in the system.
– An “Effect” represents an output condition, a system
transformation or a state resulting from a combination of
causes.
6
Cause Effect Graph
7
Cause Effect Graph
Circumstances under which Cause-Effect Diagram
used
– To Identify the possible root causes, the reasons for a
specific effect, problem, or outcome.
– To Relate the interactions and connections of the system
among the factors affecting a particular process or effect.
– To Analyze the existing problems so that corrective action or
the right decision can be taken at the earliest.
8
Cause Effect Graph
Benefits
– It Helps us to determine the root causes of a problem or
quality using a structured approach.
– It Uses an orderly, easy-to-read format to diagram cause-
and-effect relationships.
– It Indicates possible causes of variation in a process.
– It Identifies areas, where data should be collected for further
study.
– It Encourages team participation and utilizes the team
knowledge of the process.
– It Increases knowledge of the process by helping everyone
to learn more about the factors at work and how they relate.
9
Cause Effect Graph Notation : Basic
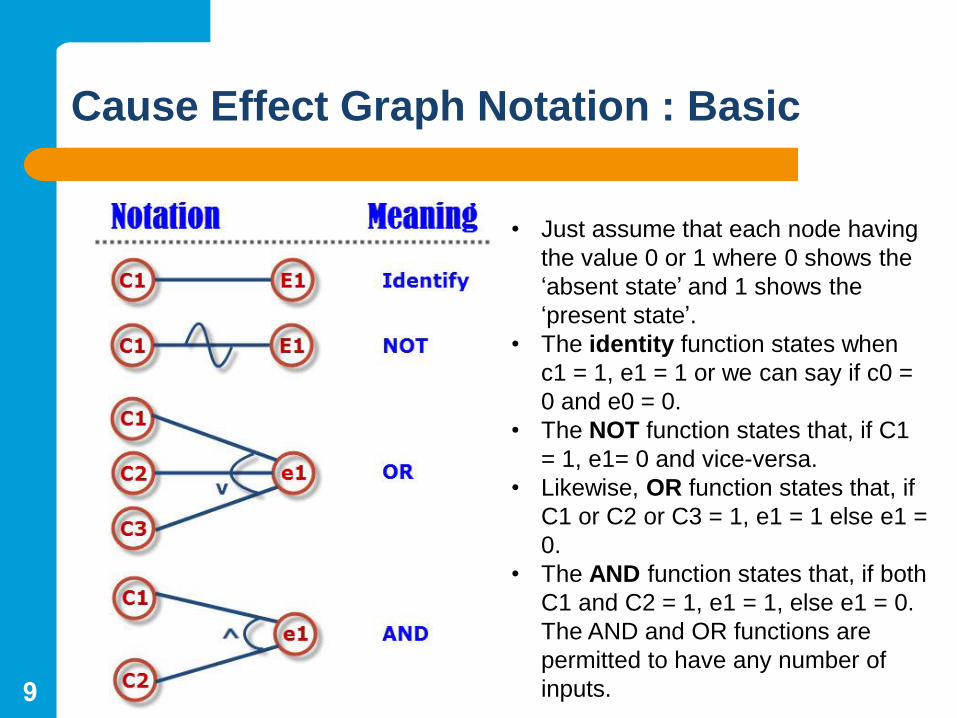
• Just assume that each node having
the value 0 or 1 where 0 shows the
‘absent state’ and 1 shows the
‘present state’.
• The identity function states when
c1 = 1, e1 = 1 or we can say if c0 =
0 and e0 = 0.
• The NOT function states that, if C1
= 1, e1= 0 and vice-versa.
• Likewise, OR function states that, if
C1 or C2 or C3 = 1, e1 = 1 else e1 =
0.
• The AND function states that, if both
C1 and C2 = 1, e1 = 1, else e1 = 0.
The AND and OR functions are
permitted to have any number of
inputs.
10
Cause Effect Graph
• Draw the graph using the basic notation could
contain an impossible combination of causes
• Suppose, it is impossible for both causes 1 and 2 to be
set to 1 simultaneously.
• In most programs, certain combinations of causes are
impossible because of syntactic or environmental
considerations
• To account for these problem, the constraint notation
can be used
11
Cause Effect Graph Notation : Constraint
12
Cause Effect Graph Notation : Constraint
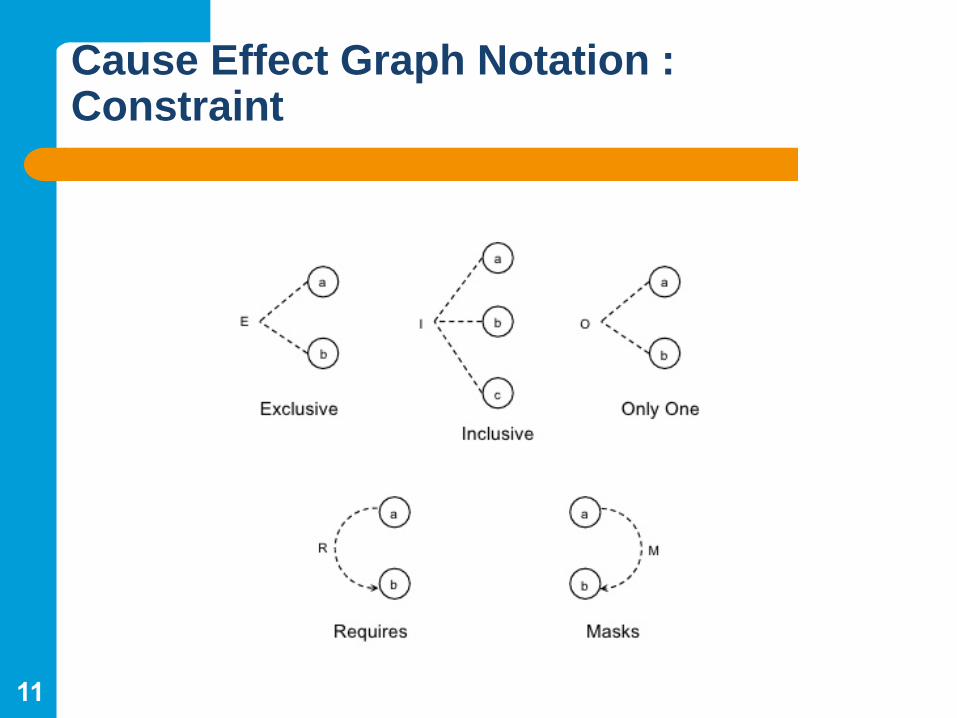
• The E constraint states that it must always be true that, at
most, one of a and b can be 1 (a and b cannot be 1
simultaneously)
• The I constraint states that at least one of a,b, and c must
always be 1 (a,and b cannot be 0 simultaneously)
• The O constraint states that one, and only one, of a and b
must be 1
• The R constraint states that for a to be 1, b must be 1
(i.e., it is impossible for a to be 1 and b to be 0)
• The M constraint states that if effect a is 1, effect b is
forced to 0
13
Cause Effect Graph
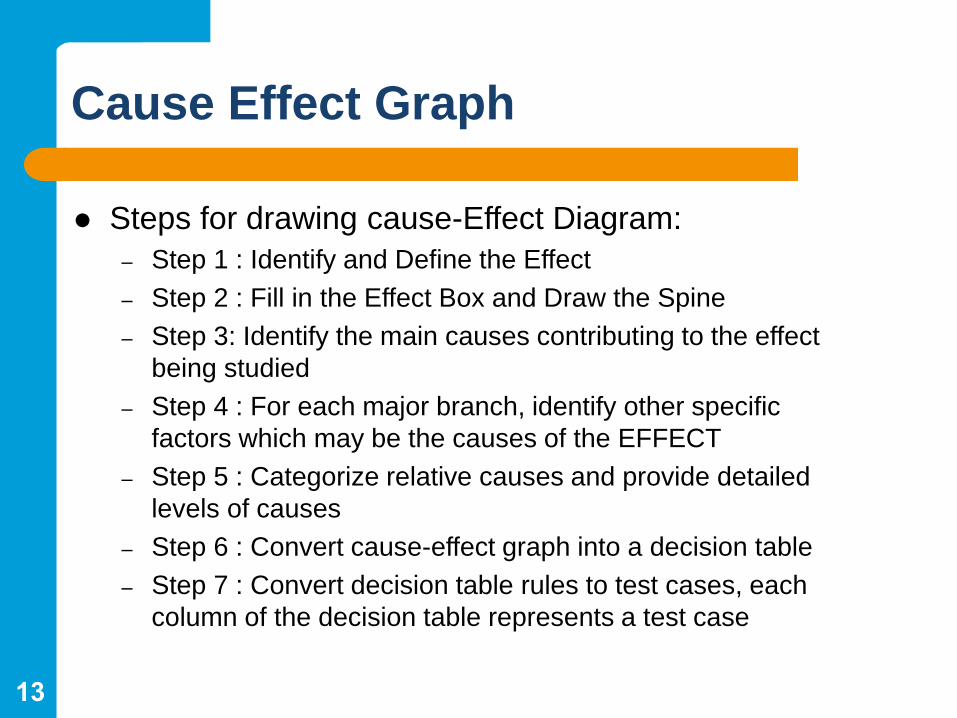
Steps for drawing cause-Effect Diagram:
– Step 1 : Identify and Define the Effect
– Step 2 : Fill in the Effect Box and Draw the Spine
– Step 3: Identify the main causes contributing to the effect
being studied
– Step 4 : For each major branch, identify other specific
factors which may be the causes of the EFFECT
– Step 5 : Categorize relative causes and provide detailed
levels of causes
– Step 6 : Convert cause-effect graph into a decision table
– Step 7 : Convert decision table rules to test cases, each
column of the decision table represents a test case
14
Cause Effect Graph Example
Consider this specification
– The character in column 1 must be an “A” or a “B.” The
character in column 2 must be a digit. In this situation, the
file update is made. If the first character is incorrect,
message X12 is issued. If the second character is not a
digit, message X13 is issued
15
Cause Effect Graph Example
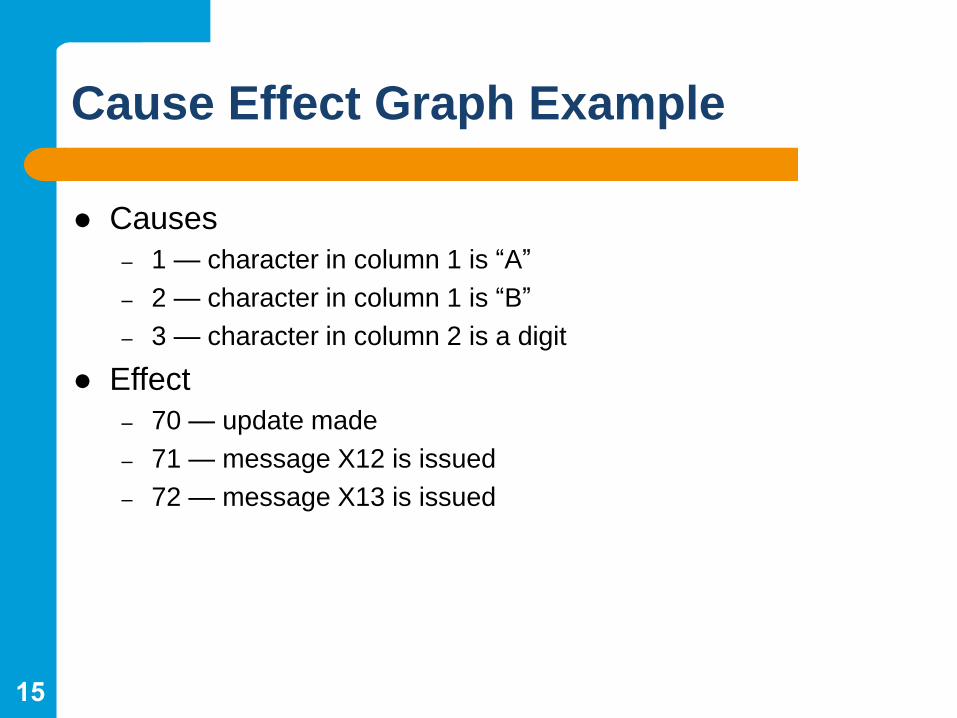
Causes
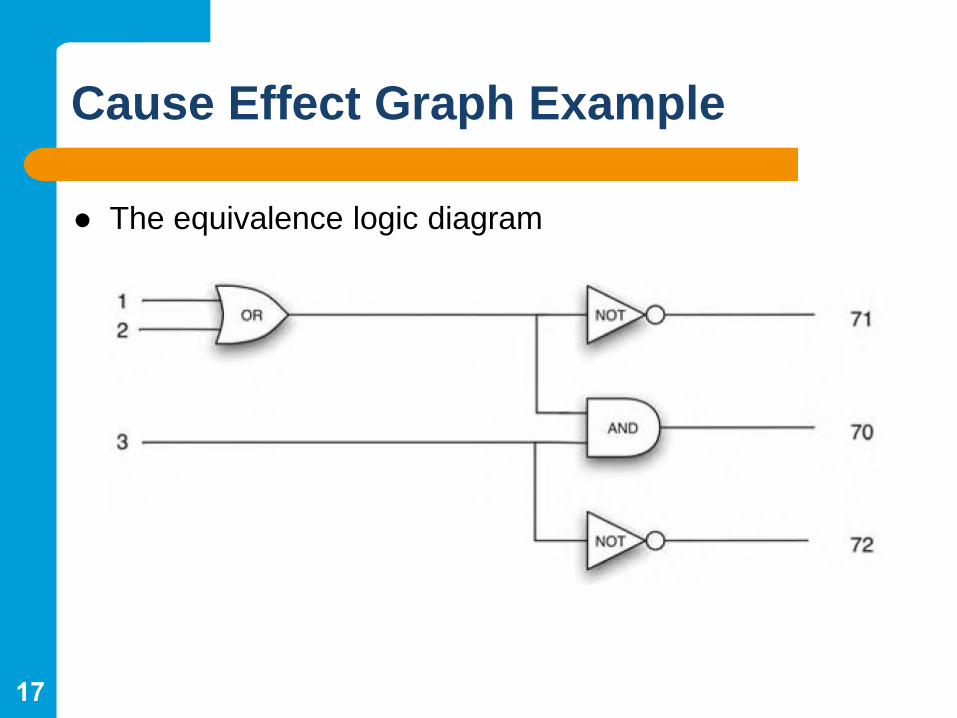
– 1 — character in column 1 is “A”
– 2 — character in column 1 is “B”
– 3 — character in column 2 is a digit
Effect
– 70 — update made
– 71 — message X12 is issued
– 72 — message X13 is issued
16
Cause Effect Graph Example
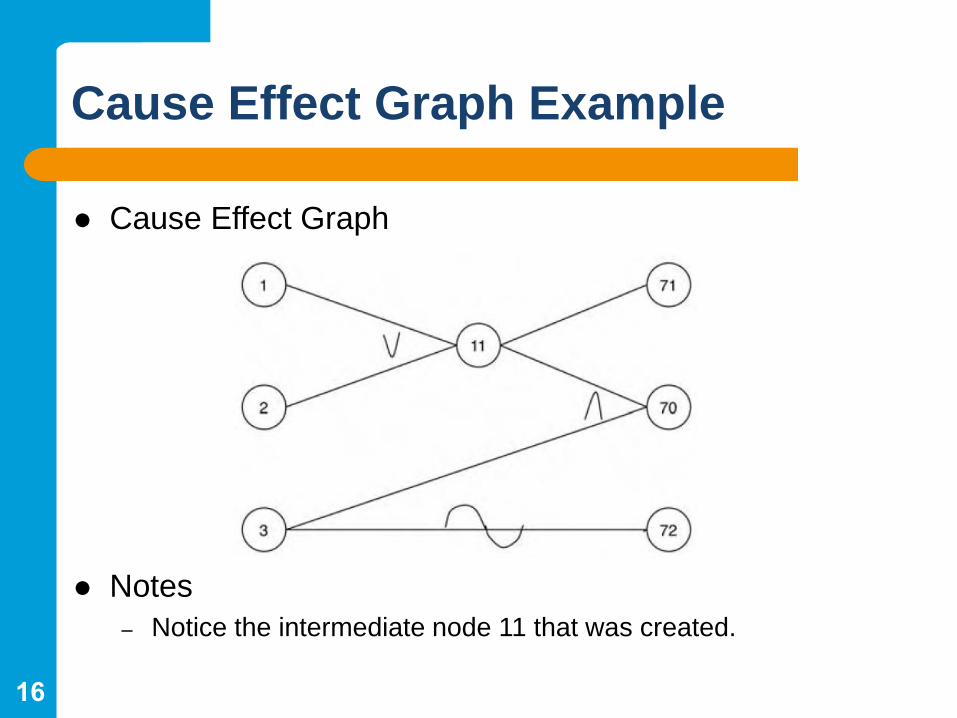
Cause Effect Graph
Notes
– Notice the intermediate node 11 that was created.
17
Cause Effect Graph Example
The equivalence logic diagram
18
Cause Effect Graph Example
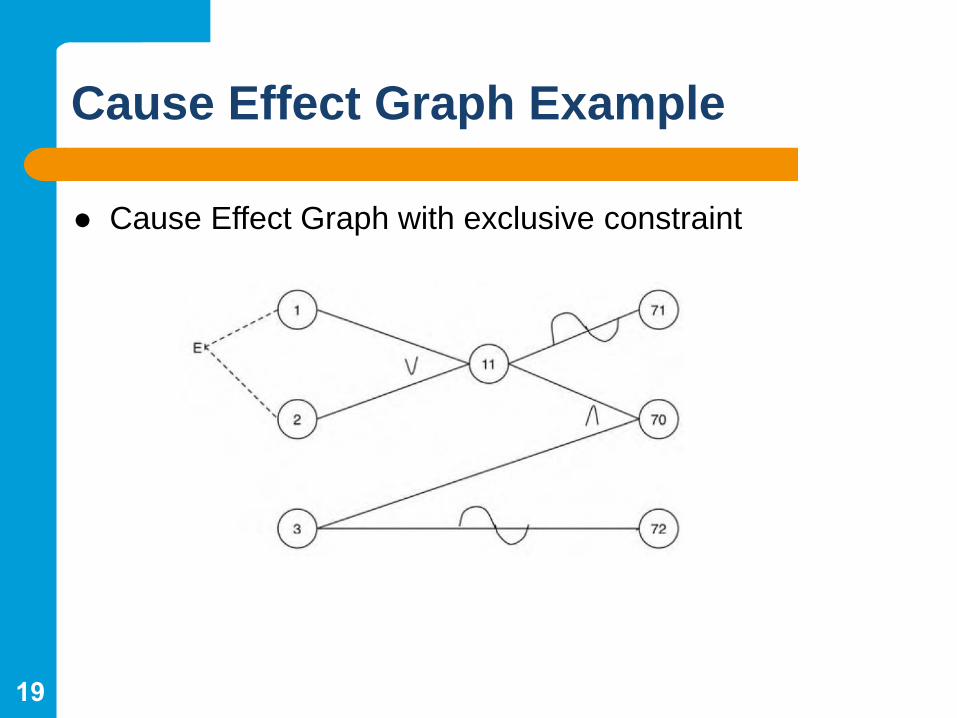
Consider this further specification
– Although the previous graph represents the specification, it
does contain an impossible combination of causes it is
impossible for both causes 1 and 2 to be set to 1
simultaneously
– In most programs, certain combinations of causes are
impossible because of syntactic or environmental
considerations (a character cannot be an “A” and a “B”
simultaneously)
– To account for these, the E constraint states that it must
always be true that, at most, one of a and b can be 1 (a and
b cannot be 1 simultaneously
19
Cause Effect Graph Example
Cause Effect Graph with exclusive constraint
20
Black Box Testing TechniquesDecision Table
21
Decision Table
A decision table is a good way to deal with different
combination inputs with their associated outputs and also
called cause-effect table
Reason to call cause-effect table is an associated logical
diagramming technique called ’cause-effect graphing that
is basically use to derive the decision table
Decision tables are very much helpful in test design
technique
– It helps testers to search the effects of combinations of
different inputs and other software states that must correctly
implement business rules
– Also, provides a regular way of stating complex business
rules, that’s helpful for developers as well as for testers
22
Decision Table Example
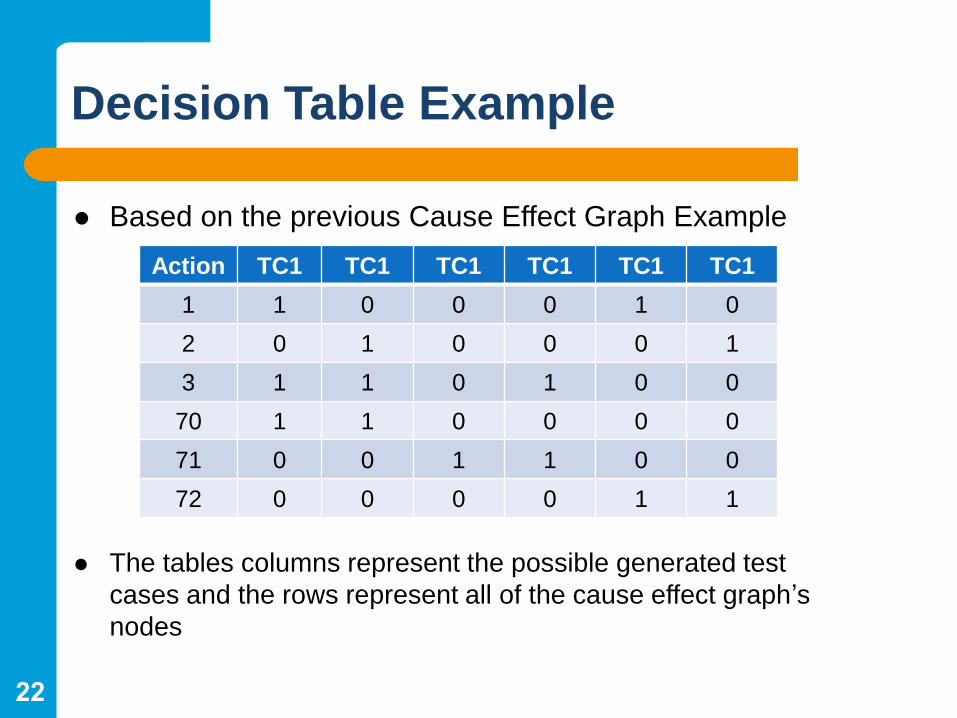
Based on the previous Cause Effect Graph Example
The tables columns represent the possible generated test
cases and the rows represent all of the cause effect graph’s
nodes
Action TC1 TC1 TC1 TC1 TC1 TC1
1 1 0 0 0 1 0
2 0 1 0 0 0 1
3 1 1 0 1 0 0
70 1 1 0 0 0 0
71 0 0 1 1 0 0
72 0 0 0 0 1 1
23
Decision Table Example
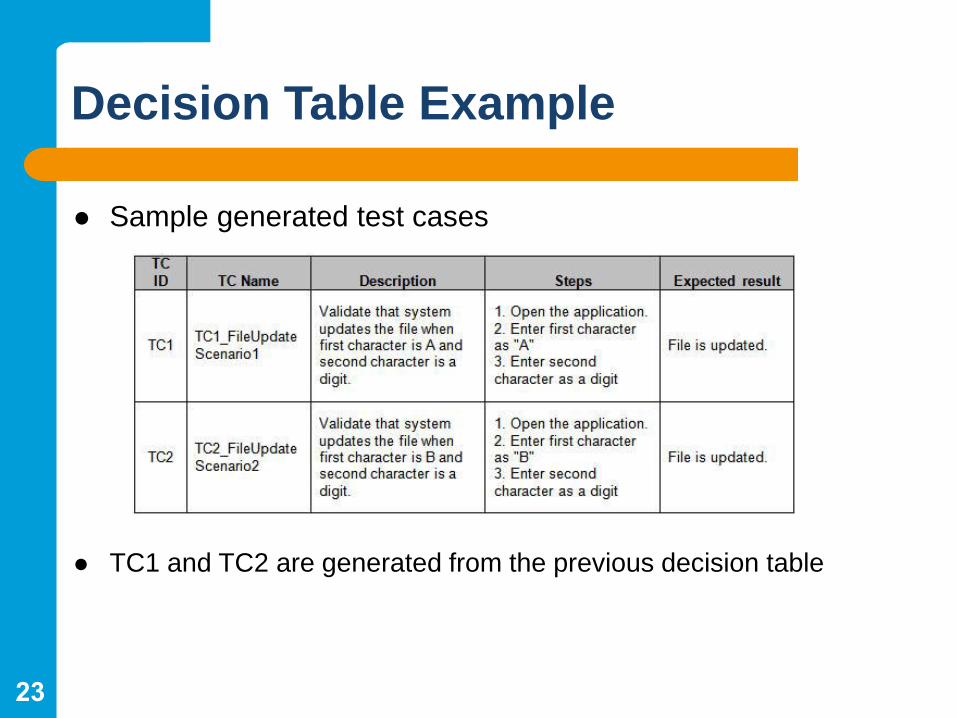
Sample generated test cases
TC1 and TC2 are generated from the previous decision table
24
Advantages of Decision Table
Advantages
– Any complex business flow can be easily converted into the
test scenarios & test cases using this technique
– Such type of table are work iteratively, means the table
created at the first iteration is used as input table for next
tables. Such iteration can be carried out only if the initial
table is unsatisfactory
– Simple to understand and everyone can use this method
design the test scenarios & test cases
– It provide complete coverage of test cases which help to
reduce the rework on writing test scenarios & test cases
– These tables guarantee that we consider every possible
combination of condition values. This is known as its
“completeness property”

25
Thank You

![ISTQB: Black Box testing Strategies used in Financial ...830538/...There are two classes of software testing; Black box testing and white box testing, Williams [10]. The black box](https://static.fdocuments.in/doc/165x107/6087237aa6f9bb4603074a7b/istqb-black-box-testing-strategies-used-in-financial-830538-there-are-two.jpg)