Bl Problem Solving Drawing a Diagram - Blake Education - Better
15
Problem Solving Drawing a Diagram by Sharon Shapiro Blake’s Topic Bank This unit contains: ■ Teaching notes ■ 3 teaching examples ■ 1 BLM ■ 18 task cards ■ Answers UNIT P1 ■ Problem Solving Middle Primary
Transcript of Bl Problem Solving Drawing a Diagram - Blake Education - Better

Problem SolvingDrawing a Diagram
by
Sharon Shapiro
Blake’s Topic B
ank
This unit contains:
■
Teaching notes
■
3 teaching examples
■
1 BLM
■
18 task cards
■
Answers
UNIT P1
■
Problem SolvingMiddle Primary

1
© Blake Education—Problem Solving: Drawing a Diagram
THE PROBLEMSOLVING PROCESS
It is important that students follow a logical andsystematic approach to their problem solving. Followingthese four steps will enable students to tackleproblems in a structured and meaningful way.
STEP 1: UNDERSTANDINGTHE PROBLEM
❖
Encourage students to read the problemcarefully a number of times until they fullyunderstand what is wanted.They may need todiscuss the problem with someone else orrewrite it in their own words.
❖
Students should ask internal questions such as,what is the problem asking me to do, whatinformation is relevant and necessary for solvingthe problem.
❖
They should underline any unfamiliar words andfind out their meanings.
❖
They should select the information they knowand decide what is unknown or needs to bediscovered.They should see if there is anyunnecessary information.
❖
A sketch of the problem often helps theirunderstanding.
STEP 2: STUDENTS SHOULDDECIDE ON A STRATEGY OR PLAN
Students should decide how they will solve theproblem by thinking about the different strategiesthat could be used.They could try to makepredictions, or guesses, about the problem. Oftenthese guesses result in generalisations which helpto solve problems. Students should be discouragedfrom making wild guesses but they should beencouraged to take risks.They should always thinkin terms of how this problem relates to otherproblems that they have solved.They should keep a record of the strategies they have tried so thatthey don’t repeat them.
Some possible strategies include:
❖
Drawing a sketch, graph or table.
❖
Acting out situations, or using concretematerials.
❖
Organising a list.
❖
Identifying a pattern and extending it.
❖
Guessing and checking.
❖
Working backwards.
❖
Using simpler numbers to solve the problem,then applying the same methodology to thereal problem.
❖
Writing a number sentence.
❖
Using logic and clues.
❖
Breaking the problem into smaller parts.
STEP 3: SOLVING THE PROBLEM
❖
Students should write down their ideas as theywork so they don’t forget how they approachedthe problem.
❖
Their approach should be systematic.
❖
If stuck, students should reread the problem and rethink their strategies.
❖
Students should be given the opportunity toorally demonstrate or explain how they reachedan answer.
STEP 4: REFLECT
❖
Students should consider if their answer makessense and if it has answered what was asked.
❖
Students should draw and write down theirthinking processes, estimations and approach, asthis gives them time to reflect on theirpractices.When they have an answer theyshould explain the process to someone else.
❖
Students should ask themselves ‘what if ’ to linkthis problem to another.This will take theirexploration to a deeper level and encouragetheir use of logical thought processes.
❖
Students should consider if it is possible to dothe problem in a simpler way.
Problem SolvingDrawing a Diagram
Sharon Shapiro
Middle Primary
For all your teaching needs visit www.blake.com.au

Drawing a picture of a word problem often revealsaspects of the problem that may not be apparentat first. If the situation described in the problem isdifficult to visualise, a diagram, using simplesymbols or pictures, may enable students to seethe situation more easily.The diagram will alsoassist students to keep track of the stages of aproblem where there are a number of steps.
In order to use the strategy of drawing adiagram effectively, students will need to developthe following skills and understanding.
USING A LINE TOSYMBOLISE AN OBJECT
Simple line drawings help students to visualise asituation. In a problem students were asked howmany markers would be needed if they placed amarker at every two metre point on a ten metrerope. In response, students may calculate mentally 10 ÷ 2 = 5, so five posts are needed. However, ifstudents draw the rope and markers, they will seethat actually six markers are needed because weneed one for the starting point and another at theend of the rope.
USING A TIME/DISTANCE LINETO DISPLAY THE INFORMATION
A time/distance line helps to show distance, ormovement from one point to another. Studentswere asked to calculate how far they are from thecity when they are 17 kilometres from the ocean,using the information on this signpost.
Students should draw aline and on it write thedistances.
30 km + (65 – 17 km) = 78 km
SCALE
When students are required to draw a diagram ofa large area the diagram will often need to bescaled down.For example, in a drawing, one centimetre couldhave the value of one kilometre.
Alternatively, a one centimetre line couldrepresent ten kilometres or even 500 kilometres,depending on the scale of the drawing.
Show students how to use scaled downmeasurements to solve a problem, then convertthe solution to the actual measurements.
MAPPING ORSHOWING DIRECTION
Students will often be faced with drawings thatrequire them to have an understanding ofdirection.They will also meet problems where they are asked to plot a course by moving up,down, right or left on a grid.They will also meet to use the compass points to direct themselves —north, south, east, west, north-easterly, south-westerly, and so on.
They will also need to become familiar withmeasurement words which may be unfamiliar tothem, such as pace. Opportunities should be givenfor the students to work out how many paces ittakes to cover the length and breadth of theclassroom or to pace out the playground, so theydevelop a means of comparison.
Students shoulddevelop the ability to use a map as thefocus of the problemthey are solving.
They should be ableto plot four differentroutes from Byamee toGumpy without passing through any town twice.
SHOWING THE RELATIONSHIPSBETWEEN THINGS
Students will find it helpful to draw diagrams anduse symbols in order to visualise the relationshipsbetween things.For example:
John HorseJack RabbitFred Fish
DRAWING A PICTURE
Drawing a picture can help students organise their thoughts and so simplify a problem.
These four domino pieces have to be organised ina square shape with each side of the square addingup to a total of ten.
© Blake Education—Problem Solving: Drawing a Diagram
Teaching Notes Drawing a Diagram
2
For all your teaching needs visit www.blake.com.au

EXAMPLE 1
The children built a log playhouse in a squareshape.They used eight vertical posts on each sideof the house. How many posts did they usealtogether?
Understanding the problem
WHAT DO WE KNOW?
We know the playhouse was a square.We know how many posts were on each side.
WHAT DO WE NEED TO FIND OUT?
Questioning:Do we understand the meaning of vertical posts?How many posts were used altogether?
Planning and communicating a solution
WHAT WE DID
It is important that students develop their abilitiesto logically explain their strategy.They should usesome mathematical language and drawings such asgraphs, charts and diagrams in their explanation orduring the problem solving process.
Students may suggest that the solution is easybecause there are four sides and so eight poststimes four sides will equal 32 posts.This isincorrect. Students should be encouraged to drawa picture so that the problem is clarified.They willthen be able to see and count the posts.
Step-by-step explanation
Here is a step-by-step explanation of the process.
Let . stand for one post.Ask students to drawone side of the playhouse first.
They should then continuewith the second side.This isa perfect time to discusswhether the corner postsare used once or twice oneach side.
Students will see that,because the same cornerpost is used for both thehorizontal and verticalsides, only seven posts areadded.The third line willagain reuse the corner postso only seven posts areadded.
When students draw thefinal side it is importantthat they count the postscarefully to ensure thatonly eight posts are used.Because they are reusingboth corner posts only sixothers need to be added.
When the posts are carefully counted we see that28 posts were used.
Reflecting and generalising
Once students have reflected on the solution, theycan generalise about problems of this type and seehow this solution can be applied to similarproblems.They should consider the method usedto see if it can be improved.They should thinkabout the accuracy of the method.They shouldquestion if there is a shorter or different methodthey could have chosen? Suitable technology suchas blocks can be used to assist with theinvestigation by replacing pen and paper or can beused to double-check the answer.
Extension
What if the square playhouse was a rectangle, howwould this affect the answer? What if 12 verticalposts were used? What if the shape was arectangle but 26 posts were used and the lengthand breadth weren’t specified? How many differentways could the posts be placed? What if therewere 36 posts altogether?
© Blake Education—Problem Solving: Drawing a Diagram
Teaching Examples Drawing a Diagram
3
For all your teaching needs visit www.blake.com.au

EXAMPLE 2
A thick dowel stick has to be cut into eight pieces.Each cut takes you 30 seconds. How long will ittake to cut the dowel stick into pieces?
Understanding the problem
WHAT DO WE KNOW?
We know we need eight pieces of dowel.We know each cut takes 30 seconds.
WHAT DO WE NEED TO FIND OUT?
Questioning:How many cuts will we make? How long will thecuts take? Is this simply a numerical problem ormust a diagram be drawn?
Planning and communicating a solution
WHAT WE DID
A line was drawn to symbolise the stick.
In order to make the eight pieces we cut thedowel in seven places.
Seven cuts multiplied by 30 seconds per cut equals,7 x 30 = 210 seconds. It will take 210 seconds or 3minutes and 30 seconds to make the cuts.
Reflecting and generalising
Students who simply multiplied the eight pieces by30 seconds were working inaccurately and had notvisualised the problem.They needed a concreteitem such as a strip of paper or piece of plasticinethat can be cut into pieces.We are able togeneralise that in future if a larger piece is cut intosmaller pieces, the end pieces are not cut and adrawing will clarify this idea.
Extension
What if the students were building a cubby houseand it took three minutes to join each planksecurely to the others. How long would it takethem to build the walls if they have six verticalplanks on each side?
© Blake Education—Problem Solving: Drawing a Diagram
Teaching Examples Drawing a Diagram
4
For all your teaching needs visit www.blake.com.au

EXAMPLE 3
A frog fell down an abandoned well which was 21metres deep. He found it difficult to jump up themud coated walls. He started his long jump up thewell at six a.m. It took him 15 minutes to jumpthree metres because the walls were so slippery.At the end of every 15 minute period he restedfor five minutes while he sadly slipped down onemetre. He continued on at the same rate.At whattime did he finally reach the top of the well?
Understanding the problem
WHAT DO WE KNOW?
The well was 21 metres deep.The frog started jumping at six a.m.He jumped three metres in fifteen minutes.He slipped down one metre at the end of everyfifteen minute period.
WHAT DO WE NEED TO FIND OUT?
Questioning:What time did the frog finally reach the top of the well?
Planning and communicating a solution
This problem can be approached in a number ofways. Students can use 25 squares of one centimetregrid paper or they can draw a time line with onecentimetre marks. One centimetre would representone metre the frog jumps or slips. Drawing the linewill help students to visualise the problem.
It would take the frog 195 minutes to cover thedistance. He would reach the top of the well at9:15 a.m.
Reflecting and generalising
It is important that students realise that there ismore than one way to approach a problem.Thetime line or grid paper will assist them to visualisethe problem but an alternative way to solve theproblem could have been drawing a table.
Extension
What if it hailed for an hour and fifteen minutesand the frog was forced to retreat to the bottomof the well after covering eighteen metres.The frogwould have to start its jump once more. How longwould the trip take now?
© Blake Education—Problem Solving: Drawing a Diagram
Teaching Examples Drawing a Diagram
5
For all your teaching needs visit www.blake.com.au

BLM Drawing a Diagram
6
★
Understanding the problemList what you know from reading the problem
What do you need to find out?What questions do you have? What are you uncertain about? Is there any unfamiliar or unclear language?
★
Planning and communicating a solutionWhich solution will you try?Will you draw a line to symbolise the objects? Draw a time line to showpassing time or distance covered? Draw a picture to stand for objects?Trace a journey on a map? Usedirections on a compass? Use a scaledrawing? Show the relationship betweenthings using a diagram or symbols?
★
Reflecting and generalisingWhat did you find?How accurate is your answer? How can the strategy you used be appliedto other situations? Could another more effective method have beenused? Is there a shorter or different method?
★
ExtensionHow can this problem be extended? What factors can be added as part of a ‘what if’ question?
© Blake Education—Problem Solving: Drawing a DiagramThis page may be reproduced by the original purchaser for non-commercial classroom use.
For all your teaching needs visit www.blake.com.au
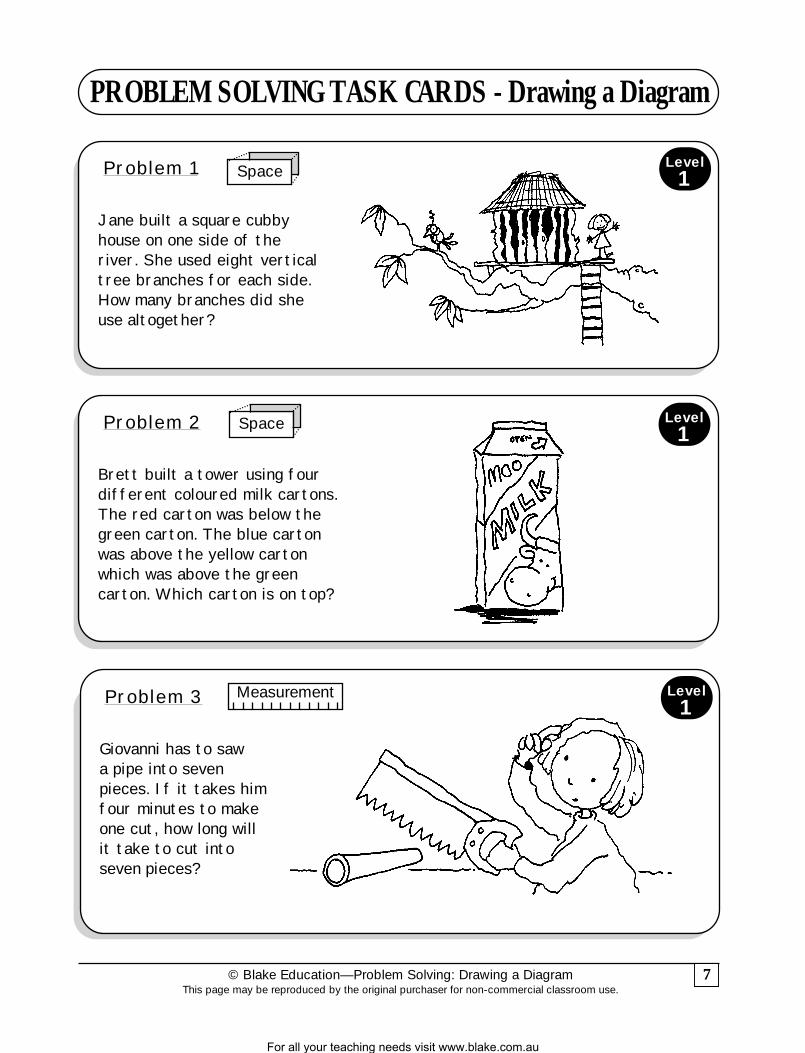
PROBLEM SOLVING TASK CARDS - Drawing a Diagram
Problem 1
Jane built a square cubbyhouse on one side of theriver. She used eight verticaltree branches for each side.How many branches did sheuse altogether?
Problem 2
Brett built a tower using fourdifferent coloured milk cartons.The red carton was below thegreen carton. The blue cartonwas above the yellow cartonwhich was above the greencarton. Which carton is on top?
Problem 3
Giovanni has to saw a pipe into sevenpieces. If it takes himfour minutes to makeone cut, how long willit take to cut intoseven pieces?
© Blake Education—Problem Solving: Drawing a DiagramThis page may be reproduced by the original purchaser for non-commercial classroom use.
7
Space
Measurement
Space
Level1
Level1
Level1
For all your teaching needs visit www.blake.com.au

PROBLEM SOLVING TASK CARDS - Drawing a Diagram
Problem 4
A spider is climbing up a30 metre building. Eachday it climbs five metresand slides back one metre.How many days will it taketo reach the top?
Problem 5
Jacob is building a Legofigure. It takes him oneand a half seconds tojoin two pieces. How longwill it take him to joinnine pieces into one longstrip?
Problem 6
Jeremy’s birthday cake wasbaked in the shape of acube and was covered onevery side with deliciouspink icing. If it was cut into27 cubes, how many pieceswould have icing on no, one,two or three sides?
© Blake Education—Problem Solving: Drawing a DiagramThis page may be reproduced by the original purchaser for non-commercial classroom use.
8
Level1
Measurement
Level1
Measurement
Level2
Space
For all your teaching needs visit www.blake.com.au

PROBLEM SOLVING TASK CARDS - Drawing a Diagram
Problem 7
In the Year Four classroom the desks are organisedin equal rows. Jane sits in the desk that is fourthfrom the front and third from the back. There arefour desks on the right but only one to the left ofJane’s desk. How many desks are in the room?
Problem 8
Mrs Williams became terribly lost on the way to an important meeting. She stoppedand asked a farmer the way. He told her that some of the roads were flooded andshe would have to travel a long way round to get to her meeting. The farmer told MrsWilliams to drive for four kilometres north, then to continue on for five kilometres ina westerly direction. She was then to travel south for two kilometres and then turn tothe east for one kilometre and finally to travel north for one kilometre. She wouldthen arrive safely at her meeting.
So she could remember the way, Mrs Williams drew a map on one centimetre gridpaper. Help her draw the map on the grid paper.
Problem 9
For her woodwork project, Angela has to hammerfive nails into a piece of wood. The nails must be in a straight line and 0.75 centimetres apart. Whatis the distance from the first nail to the last?
© Blake Education—Problem Solving: Drawing a DiagramThis page may be reproduced by the original purchaser for non-commercial classroom use.
9
Level2
Level2
Level2
Space
Space Measurement
Measurement
For all your teaching needs visit www.blake.com.au

PROBLEM SOLVING TASK CARDS - Drawing a Diagram
Problem 10
Mrs Harriman decided to enclose an area of hergarden to use as a vegetable patch. She had tomake sure that the rectangular area was fencedon all sides so that the sheep would not wanderin and munch on her vegetables. She used 26posts to make the entire fence but used fivemore posts on the longer sides than the shortersides. How many posts are on each side?
Problem 11
On a camp, the students are lining up to collecttheir breakfast. There are 50 students in frontof Ned. Ned is hungry so he decides to movetowards the front of the line. Each time oneperson is given their tray, Ned slips past twostudents. How many students will be given theirbreakfast before Ned?
Problem 12
Two hundred and twenty sevenstudents were standing atassembly. Every tenth studentwas chosen to collect a newssheet. How many were chosen?
© Blake Education—Problem Solving: Drawing a DiagramThis page may be reproduced by the original purchaser for non-commercial classroom use.
10
Level2
Level2
Level2
Measurement
312
Number
312
Number
For all your teaching needs visit www.blake.com.au

PROBLEM SOLVING TASK CARDS - Drawing a Diagram
Problem 13
Five families are building projecthomes in an isolated area. Roadswill have to be built to connecteach house with all the otherhouses. How many roads have to be built?
Problem 14
A gardener is asked to plantten trees in five rows, witheach row containing fourtrees. How did he do this?
Problem 15
Ten objects must be buried in thegarden for a treasure hunt. To makethis easier the garden has beendivided into an imaginary grid, fivesquares across by five squares down.
To make the treasure hard to find it isimportant to hide the objects in differentareas. You must make sure that no more thantwo objects lie in a line in any direction.
© Blake Education—Problem Solving: Drawing a DiagramThis page may be reproduced by the original purchaser for non-commercial classroom use.
11
Level3
Level3
Space
Space
Space
Level3
For all your teaching needs visit www.blake.com.au

PROBLEM SOLVING TASK CARDS - Drawing a Diagram
Problem 16
A snail finds itself at the bottom of a deepwell. The well is 1530 centimetres deep. Eachday the snail struggles up 180 centimetresand then stops to rest. While it is resting thesnail slides down 30 centimetres. How longbefore it reaches the top of the well?
Problem 17
The streets around the school have beenclosed off for the annual school marathon.During the marathon, the students muststay on the road and pass through all thecheckpoints. Which is the quickest routethey could choose without travelling throughany part of the route more than once?
Problem 18
Eric’s back garden is 10 metres by 14metres in size. Each day Eric rides histricycle down the three metre long pathleading from the back door of his house tothe garden and around the very edge of thegarden four times. Then he rides back upthe path where he leaves his tricycle. Howfar does he ride each day?
© Blake Education—Problem Solving: Drawing a DiagramThis page may be reproduced by the original purchaser for non-commercial classroom use.
12
Level3
Level3
Measurement
Measurement
Measurement
Level3
For all your teaching needs visit www.blake.com.au

Problem 1
Jane used 28 treebranches to buildher square cubbyhouse.
Problem 2
The blue milkcarton is at thetop of Brett’stower.
Problem 3
Giovanni has to make six cuts which take him four minutes each, so 6 x 4 = 24 minutes.
Problem 4
The spider takes eight days to reach the top.
Problem 5
Jacob had to make eight joins to connect his ninepieces of Lego and each one took one and a halfseconds, so 8 x 11–2 = 12 seconds
Problem 6
0 pink 1 pink 2 pink 3 pink sides side sides sides
1 6 12 8
Problem 7
There are six desksin each row fromthe front to theback of the roomand six desks ineach row acrossthe room, so thereare 36 desks in theroom, 6 x 6 = 36.
Problem 8
Here is Mrs Williams’map of herroute to themeeting.
Problem 9
Angela’s line of nails is three centimetres from thefirst nail to the last.
Problem 10
Mrs Harrimanused ten postson the longsides of herfence and fiveposts on theshort sides.
Problem 11
Either 16 or 17 students will be fed before Ned,depending on whether a person is served beforeNed makes his move or whether Ned moves firstbefore anyone has been served.
© Blake Education—Problem Solving: Drawing a DiagramThis page may be reproduced by the original purchaser for non-commercial classroom use.
Answers to Task Cards
13
1km
N
For all your teaching needs visit www.blake.com.au

Problem 12
22 students were chosen to collect a news sheet.
10 students in 100, 20 students in 2002 students in 27equals 22 students in total
Problem 13
Ten roads have to be built to connect each housewith all the others.
Problem 14
Here is howthe gardenerplanted histen trees infive rows.
Problem 15
Problem 16
The snail reached the top of the well on the tenth day.
Day Climbs to Slides to (cms) (cms)
1 180 1502 330 3003 480 4504 630 6005 780 7506 930 9007 1080 10508 1230 12009 1380 135010 1530
Problem 17
The route shown on the diagram below is quickest.
Problem 18
Eric rides 198 metres each day.
1 circuit around the garden, 10 m + 14 m + 10 m+ 14 m = 48 m4 circuits, 48 m x 4 = 192 m
Up and back along the driveway 2 x 3 m = 6 m
Total distance 192 m + 6 m = 198 metres
© Blake Education—Problem Solving: Drawing a DiagramThis page may be reproduced by the original purchaser for non-commercial classroom use.
14
1
3
10
9
5
4
7
6
8
2
For all your teaching needs visit www.blake.com.au