BK0083-051
102
-
Upload
agus-haryanto -
Category
Documents
-
view
30 -
download
2
Transcript of BK0083-051


CARBON STOCKS IN NUNUKAN, EASTKALIMANTAN: A SPATIAL MONITORING
AND MODELLING APPROACH
Report from the Carbon Monitoring Team of the ForestResources Management for Carbon Sequestration
(FORMACS) Project
Edited by
Betha Lusiana, Meine van Noordwijk and Subekti Rahayu
W O R L D A G R O F O R E S T R Y C E N T R E ( I C R A F )

For more information please contact:
World Agroforestry Centre
Transforming Lives and Landscapes ICRAF Southeast Asia Regional Office
Jl. CIFOR, Situ Gede, Sindang Barang, Bogor 16680 PO Box 161, Bogor 16001, Indonesia Tel: +62 251 625415; fax: +62 251 625416;Email: [email protected] ICRAF Southeast Asia website: http://www.icraf.cgiar.org/sea orhttp://www.worldagroforestrycentre.org/sea
Disclaimer and copy right
ICRAF holds the copyright to its publications and web pages but encourages duplication,without alteration, of these materials for non-commercial purposes. Proper citation is required inall instances. Information owned by other providers and requiring permission is marked as such.Website links provided by our site will have their own policies that must be honoured. Theinformation provided by ICRAF is, to the best of our knowledge, accurate although we do notwarranty the information nor are we liable for any damages arising from use of the information.ICRAF maintains a database of users although this information is not distributed and is usedonly to measure the usefulness of our information. Without restriction, please add a link to ourwebsite http://www.worldagroforestrycentre.org on your website or publication.
ISBN 979-3198-23-0
Cover photos:
Front Cover: Left: A farmer of Nunukan conducting a carbon sampling activity (CAREInternational Indonesia); Middle: A monoculture pepper plantation in Lubok Buat Village,Sembakung (Kusuma Wijaya); Right: A jakaw systems during fallow period along the Sembakungriver (Kusuma Wijaya); Background: Forest of Nunukan (CARE International Indonesia)
Back Cover: Left: Logged wood ready for transportation, Sebuku River (Kusuma Wijaya); Middle:Jakaw systems just after slash and burn, Tanjung Harapan Village, Sembakung (Kusuma Wijaya);Right: A rain-fed paddy field (CARE International Indonesia)
Inside Cover: Local children playing with canoe along the Sembakung river, an agroforestrysystem in the background (Kusuma Wijaya)
Lay-out & cover design: Dwiati Novita Rini

TABLE OF CONTENTS
TABLE OF CONTENTS i
PREFACE iii
1. INTRODUCTION: WHY MONITOR CARBON IN NUNUKAN?Betha Lusiana, Garry A. Shea and Meine van Noordwijk 1
Land Use Change as Source of CO2 Emission 1The Forest Resources Management for Carbon Sequestration (FORMACS) Project 2Carbon Monitoring Activities in Nunukan 7
2. LIVELIHOOD OPTIONS AND FARMING SYSTEMS IN THE FOREST MARGINS OF NUNUKAN, EAST KALIMANTANKusuma Wijaya, Nessy Rosdiana and Betha Lusiana 9
Introduction 9Methods 10General Condition of Kabupaten Nunukan 10Household Survey Results 12Discussion 19Conclusion 20
3. ABOVEGROUND CARBON STOCK ASSESMENT FOR VARIOUS LAND USE SYSTEMS IN NUNUKAN, EAST KALIMANTANSubekti Rahayu, Betha Lusiana and Meine van Noordwijk 21
Introduction 21Methods 22Results and Discussions 25Conclusions 31
4. LAND USE CHANGE IN NUNUKAN: ESTIMATING LANDSCAPE LEVEL CARBON-STOCKS THROUGH LAND COVER TYPES AND VEGETATION DENSITYAtiek Widayati, Andree Ekadinata and Ronny Syam 35
Introduction 35Study Site 36Data 36Methods 38Results and Discussions 44Conclusions 53
i

5. SCENARIO STUDIES OF LAND USE IN NUNUKAN, EAST KALIMANTAN (INDONESIA): DRIVERS, LOCAL LIVELIHOODS AND GLOBALLY RELEVANT CARBON STOCKSDesi Ariyadhi Suyamto and Meine van Noordwijk 55
Introduction 55Objectives 57Core of the FALLOW Model 57Methodology 60Results 60Discussion 75Conclusion 77
REFERENCES 79
APPENDIX 83
ii

PREFACE
This report compiles a number of studies conducted by the Carbon Monitoring team under theForest Resources Management for Carbon Sequestration (FORMACS) Project. This project wasfunded by CIDA and implemented by CARE International Indonesia in Nunukan, EastKalimantan. The report describes the process of a Rapid Carbon Stocks Appraisal (RaCSA)approach that is developed by the World Agroforestry Centre (ICRAF).
There are four main activities carried out under the Rapid Carbon Stocks Appraisal approach:
• A household socio-economic survey that describes the livelihood strategies, especially thosepertaining to land use and the key drivers of change
• Carbon stocks measurement of representative land cover units• Remote Sensing imagery and spatial analysis of land-use/land cover change• Modelling of carbon stock dynamics in the landscape in response to plausible 'scenarios' or
changes in the key driver variables
The activities were carried out by three organisations: Hatfindo, World Agroforestry Centre(ICRAF) and CARE International Indonesia. Hatfindo and Buana Khatulistiwa were responsiblefor the land cover and land use change analysis including map production. ICRAF designed thesocio-economic survey, provided the protocol to measure carbon stocks, assisted the land coveranalysis and performed the modelling analysis. CARE International Indonesia conducted thehousehold survey and carbon measurements in the field.
We would like to thank CARE International Indonesia field staffs who took care of the fieldwork, measurements and data collection for this report: Abdul Azis, Ansori, Basuki BudiSantoso, Darmawan Setia Budi, Debit Losong, Dewi Maharani, Eko Sugiharto, Iwantoro, Joned,Jimmy Sukaputra, Nurhayati, Pery, Rico Sukaswanto, Welly Brodus. Special thanks are also dueto Susilo Ady Kuncoro who provided comments on Chapter 1 and Iwan Kurniawan for sharinghis ideas on spatial pattern similarity (Chapter 5).
We greatly appreciate the help from Dwiati Novita Rini in designing this report and thesupport from Tikah Atikah in ensuring that the process progressed smoothly.
The editors
iii

List of contributors
CARE International IndonesiaJl. Patimura No. 33Kebayoran BaruJakarta 12110Telephone: 021 7279 6661Fax: 021 7222552
Garry A. Shea, PhD [[email protected]]Nessy Rosdiana [[email protected]]
Hatfindo Prima Jl. Bango 2-4 Tanah Sareal BogorIndonesia
Ronny Syam [[email protected]]
World Agroforestry Centre (ICRAF)Jl. Cifor, Situ GedeSindang BarangBogor 16608Telephone: 0251 625415Fax: 021 625416
Andree Ekadinata [[email protected]]Atiek Widayati [[email protected]]Betha Lusiana [[email protected]]Desi Ariyadhi Suyamto [[email protected]]Kusuma Wijaya [[email protected]]Meine van Noordwijk [[email protected]]Subekti Rahayu [[email protected]]
iv

Land Use Change as Source ofCO2 Emission
In the last two decades climate change hasbecome a prominent issue for the globalcommunity. During the last century the meantemperature of the earth has increased by 0.6 ºC and the rate of change appears toincrease. An increase of the atmosphericconcentration of the greenhouse gases(GHG), carbon dioxide (CO2), methane (CH4)and nitrous oxide (N2O) are identified as themain factor causing global warming. Duringthe last decade net CO2 emission doubledfrom 1400 million Mg year-1 to 2900 millionMg year-1. Meanwhile, the CO2 concentrationin the atmosphere in 1998 was 360 ppmv, upfrom a value of 280 ppmv a century earlier,with a yearly increment of 1.5 ppmv(Houghton et al., 2001).
The elevated CO2 concentration in theatmosphere is largely caused by humanactivities, particularly land use change and useof fossil fuel for transport, power generationand industrial activities. Accumulatively, theuse of fossil fuel and forest conversion toother land use have both been responsible forabout half of the human-induced CO2
emission to the atmosphere, but the currentimpact is in a ratio of 3:1. Burning fossil fuelmeans returning carbon to the atmospherethat was fixed by plants in the geological past.Forest conversion and land use change implythat carbon stored as plant biomass or in(peat) soils is released to the atmosphere
through burning ('slash and burn') ordecomposition of organic matter above andbelow ground. Logging removes storedcarbon from the landscape, often resulting inrapid return to the atmosphere, depending onthe use of wood. It is estimated that between1990 - 1999, land use change has contributedaround 1.7 Gt year-1 to total CO2 emission(Watson et al., 2000).
Acknowledging this global problem ofhuman-induced ('anthropogenic') climatechange, the Rio de Jainero Conference of1992 identified CO2 emissions to theatmosphere as one of the major globalenvironmental issues of concern. Worldleaders adopted the United NationsFramework Convention on Climate Change(UNFCCC) that sets an overall framework forintergovernmental efforts to tackle thechallenge posed by climate change. The Kyotoprotocol that came into force on February 172005 was developed as the first concrete steptowards implementing efforts to stop thegrowth in emissions and return net emissionsfrom the industrialized countries to below1990 levels. As land use change can be both asource and a sink of atmospheric CO2, therates of deforestation and the regrowth ofwoody vegetation are part of the globaldebate.
Activities and projects that enhanceafforestation and reforestation (AR) or avertdeforestation (ADEF) can both reduce netCO2 emissions, but have a different policycontext from changes in fossil fuel use. AR
1
1. INTRODUCTION: WHY MONITOR CARBONIN NUNUKAN?
Betha Lusiana, Garry A. Shea and Meine van Noordwijk

activities are defined as human-inducedconversion of non-forest land use to forest,through planting seedlings and/or promotionof natural seed sources. ADEF projects aredefined as activities that prevent carbonemission by protecting a forest threatened bydeforestation or degradation. Smith andScherr (2003) provide an in-depth study onrisks and benefits of both projects. TheKyoto protocol makes a distinction betweenindustrialized ('Annex I') countries who areobliged to account for all changes in carbonstocks as well as fossil fuel emissions, anddeveloping countries without currentobligation to reduce net emissions. In thedebate on the global regulatory framework ofnet greenhouse gas emissions the relativemerits of ADEF and AR in developingcountries are still contested, as are the de factoopportunities to influence these processes.Especially for ADEF, there is little experienceof how it can be achieved.
The Forest ResourcesManagement for CarbonSequestration (FORMACS)Project
The Forest Resources Management forCarbon Sequestration (FORMACS)1 Project,funded by CIDA and implemented by CAREInternational Indonesia is an example of anADEF project. FORMACS focuses its workon managing existing forest resource forcarbon sequestration and storage by adoptingsocially acceptable programs of community-based management. Specifically, it promotessustainable livelihoods through sustainableagriculture, agroforestry and sustainable forestmanagement practices for the maintenance ofexisting carbon stocks and for thesequestration of atmospheric carbon.Community based project, such as agroforestry,small-scale plantations, agroforests and
secondary forest fallows have the highestpotential for providing local livelihoodbenefits along with enhanced carbon storageand pose the fewest risks to communities(Smith and Scherr, 2003).
The FORMACS project study area is inKabupaten Nunukan of East KalimantanProvince, Indonesia, specifically in Sebukuand Sembakung sub-district. The Nunukanarea was a suitable and potential area toimplement an ADEF project because of thefollowing factors:
1. Forest conversion
Indonesia is ranked 9th amongst all thecountries worldwide in GHG emissions(Brookfield, Potter and Byron, 1995) and overhalf of its emissions are due to forestconversion for agriculture, plantations, andtimber production. Approximately 2 millionha of forest is currently being logged orconverted each year, releasing an enormousamount of previously bound carbon into theatmosphere and reducing sequestrationcapacity. Although in the KabupatenNunukan forest conversion has not beenextensive (within the project area, it is limitedto transmigration areas), there are proposalsfor forests to be converted for plantations(primarily oil palm), agriculture, shrimp ponds(coastal mangrove) or mining. Proposals forconverting forests to other land use pose arisk to carbon sinks, and may have othernegative environmental impacts. In 1990 thedistrict still had a forest cover of 98%. Themean population density in the district of 5persons km-2 is substantially below theaverage for Kalimantan of 34 persons km-2.
Community Based Natural ResourceManagement (CBNRM) has the potential tolimit forest conversion and maintain theforests for multiple uses, including timberproduction, production of non-timber forestproducts, conservation of biodiversity,providing a corridor between protected areas,
2
Carbon stocks in Nunukan, East Kalimantan: a spatial monitoring and modelling approach
1 See http://www.rcfa-cfan.org/english/profile.19.htm formore information abut this project.

3
Introduction: why monitor carbon in nunukan?
Figu
re 1
.1.
Map
of
Nu
nu
kan
, Ea
st K
alim
anta
n.
Th
e st
ud
y si
te o
f th
e FO
RM
AC
S p
roje
ct

maintaining watershed functions andmaintenance of carbon stocks.
2. Illegal logging
It is estimated that more than 70% of thetimber used in and exported from Indonesiacomes from illegal logging, and that illegallogging is destroying at least 700,000 ha oftropical forests a year. Illegally logged timberis being smuggled to Malaysia where it isprocessed and exported to the US, Japan,Europe and China. Approximately five millioncubic metres of timber flows into Malaysiaeach year (EIA and Telapak Indonesia, 2001).Besides causing loss of biodiversity andecological damage to the ecosystem, illegallogging also leads to economic and healthcosts resulting from fires associated with landuse change and land clearing which oftenfollows illegal logging. A low-end estimate ofroyalties, reforestation fund and export taxespayments that are not being paid to theGovernment of Indonesia (GOI) on timberstolen each year amounts to US$600 millions2.
The situation in the Kabupaten Nunukanmirrors the national problem and reflects thesame issues. The situation is magnified by theDistrict's close proximity to the state of Sabahin East Malaysia. Saw logs continue to flowover the border in spite of the ban on logexports.
The FORMACS Project addressed theissue of illegal logging at the village, sub-district and district level, where it can mostlikely have impacts. At present, forests underconcessions granted to large companies areviewed as open-access resources where peopleare competing to get a share of the resourcesbefore someone else takes the resources. Theway forward is to change this concept to
community-based forest management, wherethe forests are allocated to indigenouscommunities. The resources will then haverecognized local owners, with adat regulationof the use rights of the resources, and thepeople will guard their own resources. Thiswill mean indigenous communities working incooperation with local law enforcement andgovernment agencies.
The forest lands adjacent to most villageshave been logged-over by forest companies,and the availability of timber is on the decline.Once the area has been completely loggedand the most valuable commercial timberremoved, illegal logging becomes less an issue.As the local people know that they can nolonger depend on illegal logging for alivelihood, sustainable agriculture andcommunity-based forestry activities, areperceived as viable alternatives. CBNRM willbe able to provide the people with economicalternatives to illegal logging and to shiftforest management from large-scale industrialforest management, to small-scale multi-purposed management which combinestimber production with the conservation ofbiodiversity, the maintenance of ecosystemfunctions, and carbon sequestration.
3. Fire
Large-scale fires and droughts have devastatedparts of East Kalimantan over the past twodecades. Although fires occur yearly, large-scale fires are related to the ENSO (El NiñoSouthern Oscillation), which currently has athree to five year cycle. During the fire eventin 1997/1998, the amount of carbon releasedto the atmosphere as a result of burning peatand vegetation in Indonesia was estimatedbetween 0.81 and 2.57 Gt (Page et al., 2002).This is equivalent to 13-40% of the meanannual global carbon emissions from fossilfuels, and contributed greatly to the largestannual increase in atmospheric CO2
concentration detected since records began in1957 (Houghton et al., 2001) The majority of
4
Carbon stocks in Nunukan, East Kalimantan: a spatial monitoring and modelling approach
2 Press release from the World Bank on Decalaration ofForest Law Enforcement and Governancehttp://siteresources.worldbank.org/INTINDONESIA/FLEG/20172547/FLEG+Conference+Press+Release.pdf.Accessed on 21 March 2005

these fires occurred in managed or degradedlands: agriculture, logged-over forests, scrubforest and grassland (Tacconi, 2003). Almostall fires were started intentionally to clear landfor planting, primarily for large plantations,but also for slash and burn agriculture. Arsonwas also a factor, as local people used fire as aweapon to resolve conflicts (Tomich et al.,1998).
Generally, few fires are able to invadegood quality forest, due to its higher humiditylevels and low levels of dry undergrowth forfuel, but in the later phase of the 1997/1998fire event in Kalimantan unlogged forests fellvictim as well. Addressing issues related toforest conversion, degradation of forests fromlegal and illegal logging and preserving areasof natural forests as natural fire breaks areimportant for the maintenance of carbonstocks within existing sinks and increasingcarbon sequestration in logged-over forests.
4. Land tenure and local institutionalcapacity
Land tenure, especially in relation to forestlands, is not clearly defined in the KabupatenNunukan, and this threatens the existence offorests as carbon sinks. This situation issimilar to the land tenure situation throughoutEast Kalimantan. Security of tenure is a pre-requisite for CBNRM, since it provides theincentive for maintaining the resource and forreforestation. Land use planning andsubsequent regulation of land tenure by thecommunity together with governmentinstitutions provides the basis for land useactivities such as agriculture, agroforestry,reforestation, industrial plantations andnatural forest management. This processresults in the legalizing of participatory landuse plans and adat-based land tenure on state-owned land. Thus, the FORMACS Project isapproaching the land tenure issue throughbuilding the capacity of local government andpeople on land use planning and institutionalcapacity as well as facilitating dialogue
between the two parties. The new paradigmin governance, District Autonomy, provides aconducive condition that enables localgovernment and local people to reach mutualand beneficial understanding.
5. Current agricultural practices
Current farming systems are based mainly onslash and burn agriculture, and the use ofsteep slopes and land adjacent to rivers andstreams. In the past, when natural forests wereextensive and under-utilized, shiftingcultivation was a viable and sustainable landuse system. However, this changed in the1960s when most of the lowland forests inKalimantan (and other parts of Indonesia)were declared 'state forests' and given toforest companies in the form of forestconcessions. Under this system, thegovernment recognized lands underpermanent cultivation (food crops and treecrops) as agricultural lands belonging totraditional communities, but did not recognizelong-term fallows as agricultural landsbelonging to the community. Thus, in theProject area, the best way for traditionalcommunities to gain recognized use rights forland is to plant tree crops along with foodcrops (mixed cropping) and leave the trees togrow once the field is no longer used for foodcrops. This is important since target villagesare located in an area with considerablepotential for agricultural development. Theproposed Trans-Kalimantan Highway willtransect the area, opening it up fordevelopment. If the local people fail to takeadvantage of the economic potential of thearea and establish use rights through theplanting of trees, outside people will.
The FORMACS Project aims to help localpeople establish use rights over theirtraditional lands, and develop the economicpotential of the land, while maintainingcarbon stocks. To achieve this the FORMACSProject, in cooperation with localcommunities, developed agroforestry, tree-
5
Introduction: why monitor carbon in nunukan?

crop agriculture and low external inputsustanable agriculture (LEISA) technologiesthat also complement the effort forcommunity-based forest management. Theuse of these technologies will also reduce theuse of fire as a tool in local land use systems,reducing fire risks.
6. Lack of economic alternatives
According to the Indonesian Bureau ofStatistics, in 1998 mining (31.7%) andmanufacturing (42.8%) are the mostimportant inputs to the Gross DomesticRegional Product of East Kalimantan. Themajority of the medium and large-scalemanufacturing sector is based on wood andpulp products. Although the province isextremely wealthy in natural resources, thelocal population is largely marginalized withlittle access to proper health care, educationand extension services for improvingagricultural production. Cutting timber hasbeen seen as the answer to economicproblems by both local communities and localgovernments. This was the case in theSebuku and Sembakung area where, untilrecently, household incomes were largelydependent on illegal logging, and foodsupplies from small-scale agriculture.However, the supplies of commercial sizetimber are being exhausted at a rapid rate, andit is now difficult for villagers to gain
sufficient income from timber to meet theirfamily's basic needs.
Villagers and district government are awarethat timber can no longer be relied upon asthe sole source of family income. At thispoint in time, agricultural development is themain alternative for generating local resources.However, because of distance andtransportation costs, agricultural options arealso limited.
The FORMACS Project and its partnerscarried out research on local commodities andmarketing that served to identify commoditiesthat are suitable for the project area.Opportunities for ecotourism based onconservation of resources, includingbiodiversity, were also explored throughworkshops and awareness campaigns. Districtgovernment and local people are becomingmore aware of the potential benefits that cancome from the conservation of naturalecosystems.
Figure 1.2 described schematicaly theframework of FORMACS activities. Simplyput, FORMACS activities are based onproviding the local people with betterlivelihood options that can suppress drivers offorest conversion and will lead to povertyreduction as well as carbon stocks increment.
6
Carbon stocks in Nunukan, East Kalimantan: a spatial monitoring and modelling approach
Figure 1.2. Schematicdiagram of theFORMACS projectframework

Carbon Monitoring Activities inNunukan
FORMACS recommended agroforestry, tree-crop agriculture and low external inputsustainable agriculture (LEISA) technologiesas options to the farmers in managing theirland. The rationale of this recommendationis that these options would providesustainable livelihood for the farmers as wellas increase or maintain carbon sequestration.
The performance of these recommendedland use systems that are expected to functionas carbon sinks need to be asssesed andmonitored. This process is dealt with in carbonmonitoring activities. As the project intervent-ions were targeting the district as a whole andthere are many interactions in land use changelinked to the opportunities for the localcommunity to obtain returns to their labour,the assessment of net effects of project inter-ventions has to be done at (sub) district scale.
Ponce-Hernandez et al. (2004), developedmethods, models and software tools to assesscarbon stocks and design scenarios usingprojects in Mexico and Cuba as an example.Their methods integrate the use of biophysicalassesment and land use change models.
The FORMACS project implemented theRapid Carbon Stocks Appraisal (RaCSA)3
approach to monitor carbon stocks in Nunu-kan. The carbon monitoring activity using theRaCSA approach has three main objectives:
1. To estimate carbon stocks in Nunukan forthe main land use practices at plot level aswell as their integration at landscape level.
2. To assess the performance of existing landuse systems managed by farmers inNunukan as carbon sinks.
3. To appraise landscape carbon stocksdynamics in Nunukan in relation to'drivers' of change, as a basis for selectinginterventions that enhance people’s welfareas well as the carbon stocks of the area.
To achieve these objectives four activitieswere carried out:
1. Socio-economic survey at household level.This was conducted in Sebuku andSembakung sub-district, to explore the landuse systems managed by farmers in thearea as well as their productivity andprofitability. The productivity andprofitability of a land use system areconsidered as part of the main factors thatdrives farmers to practice it in his land.Thus, these factors also determine theamount of carbon sequestered ormaintained over time.
2. Carbon stocks measurement at plot level.Samples plot were set up at each existingland use systems in the study area. Carbonstocks were measured and will become thebasis for assessing the performance of eachland use systems to function as carbon sinks.
3. Land use/land cover change using remotesensing analysis.Satellite images were obtained and analyzedto produce land cover maps of Nunukan.Land cover change are estimated using landcover maps from two different periods.Using the result from plot level study ofcarbon stocks (activity 2), landscape levelcarbon stocks and its changes over a periodof time can be estimated.
4. Landscape simulation modelling.To predict the dynamics of landscapecarbon stocks, a landscape simulationmodel FALLOW4 was applied. This model
7
Introduction: why monitor carbon in nunukan?
3 Rapid Carbon Stocks Appraisal (RaCSA) is developed byICRAF to assess carbon stocks in a landscape. ICRAF hasalso developed Rapid Hydrological Appraisal (RHA) toasses hydrological function of a watershed and theimpacts of land use change on key functions. Currentlybeing tested and developed is a Rapid (Agro)BiodiversiyAppraisal (RaBA) method to asses biodiversity of alandscape from local well as external perspectives. Theseare three basic tools that can be used to assessenvironmental services of a given area.
4 FALLOW (Forest, Agroforest, Low-value Land OrWaste-land?) is a landscape dynamic model developed byICRAF. For more information seehttp://www.worldagrofrestrycentre.org/sea/products/models

simulates the impact of farmers decision inmanaging their land to the landscapecarbon stocks dynamics. A range ofpossible pathways that farmers may decideto act in response to existing opportunitywere evaluated.
The four activities within the RaCSAactivity are compiled in this report. Figure 1.3shows how the various activities and chaptersin this report are linked together.
Chapter 2 provides a background onNunukan as the study site for this project anddescribes the main land use systems that existand managed by farmers. Carbon stocksmeasured in the various land use systems isreported in Chapter 3. This chapter alsoanalyzed the performance of each land usesystems in sequestering carbon over time. Inaddition to that, the chapter documented treespecies found in each land use systems.
Chapter 4 describes carbon stocksassesment at landscape level using remotesensing analysis. A simulation modellingactivity that integrates all the results obtainedfrom Chapter 2, 3 and 4 is reported inChapter 5. The activity simulates the carbonstock dynamics as the landscape changes overtime due to farmers behaviour in adjustingtheir options to manage their land.
The studies reported here is an example ofan integrated approach to carbon monitoringbeing applied in the field. The outcomes ofthis activity, that is estimation carbon stocksdynamics over a range of possible pathways,are expected to provide a starting point fordialogue with farmers on the range of optionsthat are beneficial for their livelihood andenvironment. It is also a starting point fordialogue with policy makers at local as well asnational level, on providing the local peoplewith policies that enable them to manage theirland and its surroundings in sustainable ways.
8
Carbon stocks in Nunukan, East Kalimantan: a spatial monitoring and modelling approach
Figure 1.3. Link between the various chapters in this report (number in the figure refers to chapter number inthis report).

Introduction
The relationship between peoples' livelihoodand their management of natural resourceshas been the main focus of organizationsdealing with conservation and sustainable useof natural resources. Agriculture and forestsprovide an essential contribution to theresilience of many indigenous resource usesystems. Forest products constitute a sourceof emergency food for people living in theforest margins, while economic valuable forestproducts provided cash through the sale oftheir products. In the past, natural resourceextraction was aimed only to fulfill peoples'basic needs in subsistence economy, althoughexchange and market are older than whatoften presumed (Levang et al., 2005).However, population pressure, process ofcommercialization (as consequence ofeconomic growth) and political-economicconditions are drivers that have changed theway people managing their natural resource(Bilsborrow and Okoth-Ogendo, 1992).
Levang et al. (2005) discussed theimportance of forest for the local community,the Punan hunter gatherers, living in EastKalimantan. Using the Punan case as anexample, the paper critically questioned thewidely accepted belief that forest peopledepend on forests for their livelihoods andrapid pace of deforestation will lead them topoverty.
Protection of the environment is crucial todeal with global concern such as globalwarming. At the regional and local level,concern is raised about improving livelihoodsof local communities as a result of on-goingchanges within society at local and globallevels. The FORMACS (Forest ResourceManagement for Carbon Sequestration)Project in Kabupaten Nunukan, EastKalimantan is aimed to bridge both globaland local concerns. It focuses on providingthe indigenous people with sustainablelivelihood options at the same time sustainingthe function of forest ecosystems inmaintaining the carbon stocks, as one of theway to mitigate global warming problem.Consequently, an understanding of forest landuse decisions by the local people is animportant part of the project.
This paper described the result of a rapidhousehold socio-economic survey conductedin the forest margin villages of KabupatenNunukan. The objective of the survey is togain information on the socio-economicbackground of farmers and the systems theymanaged in their landscape. Combined withsecondary data, this study will be able toprovide information on:
1. Profile of farmers 2. Farmers activities to sustain their livelihood3. The land use systems managed by farmers
and the products and income derived.
9
2. LIVELIHOOD OPTIONS AND FARMINGSYSTEMS IN THE FOREST MARGINS OF
NUNUKAN, EAST KALIMANTAN
Kusuma Wijaya, Nessy Rosdiana and Betha Lusiana

This information will be used to simulatethe dynamics of the landscape over time as aresult of changes in the way people managetheir natural resources, with implications forfarmers livelihood in Chapter 5 of this report.
Methods
A rapid socio-economic survey was conductedin the FORMACS study area, KecamatanSebuku and Sembakung of KabupatenNunukan. The respondents were 51households from 10 villages within the area:Kalun Sayan, Sekikilan, Sujau and Tau Baruvillage in Sebuku and Atap, Katul, LubokBuat, Manuk Bungkul, Tanjung Harapan, andTujung village in Sembakung. The survey usedpurposive sampling aimed at obtaininginformation from farmers that manage themain land use systems existing in the area.
General Condition ofKabupaten Nunukan
Geographic position and area
Kabupaten Nunukan is located in EastKalimantan, strategically positioned asbordering area to Malaysia, in the north toSabah and in the west to Sarawak (Table 2.1).
When it split from the large Bulungandistrict, Kabupaten Nunukan was divided intofive Kecamatan (District): Kecamatan Krayan,Lumbis, Sembakung, Nunukan dan Sebatik,
comprising of 212 villages. In 2003, thePembeliangan became Kecamatan Sebuku.The total area of Kabupaten Nunukan isaround 14243 km2. The FORMACS studyareas of Sebuku and Sembakung districs are3778 km-2 and 2263 km-2, respectively,representing around 42% of the area ofKabupaten Nunukan.
Population dynamics
The population of Kabupaten Nunukan in20021 was 84 786 persons with an annualpopulation growth of 3.24%. Based on thesedata, the population density of KabupatenNunukan is about 6 person km-2. KecamatanSebatik and Nunukan are the most populateddistricts, providing place for 72% of Nunukanpopulation (BPS Kabupaten Nunukan, 2002)with population density of 6.81 and 26.87person km-2, respectively (KabupatenNunukan Dalam Angka, 2001).
A recent survey conducted by CAREInternational observed that Sebuku districtcomprise of 21 villages with a totalpopulation of 4064 persons in which 54% aremale and 46% are female. Sembukung districtcover 18 villages with total population of6010 persons, with similar proportion of maleand female as Sebuku.
10
Carbon stocks in Nunukan, East Kalimantan: a spatial monitoring and modelling approach
Table 2.2. Area of districs in Kabupaten Nunukan(values in brackets refer to percetage of area)
No. Districts Area (ha)
1. Nunukan 144 265 (10.1)
2. Sebatik 24 341 (1.7)
3. Sebuku 377 774 (26.5)
4. Sembakung 226 294 (15.9)
5. Lumbis 291 615 (20.5)
6. Krayan 360 044 (25.3)
TOTAL 1 424 334
Source: Hatfindo Prima (2004)
1 Result of a socio-economic survey conducted byRegional Planning Agency (BAPPEDA) and CentralStatictics Bureau (BPS) Kabupaten Nunukan in August2002
Table 2.1. Geographic position of KabupatenNunukan
Geographic Position:
Latitude : 3° 30’ 00” – 4 °24’55” East
Longitude : 115° 22’ 30” – 118° 44’ 54” North Borders of region: - North : Sabah, Malaysia - East : Celebes Sea - South : Kabupaten Bulungan and Kabupaten Malinau - West : Sarawak, Malaysia
Source: http://www.nunukankaltim.go.id/

Livelihood options and farming systems in the forest margins of Nunukan, East Kalimantan
11
Climate and topography
Temperature measured in Nunukan (thecapital of Kabupaten Nunukan) on average is 27.4OC. The lowest temperature is recordedfor June, with average of 23OC and thehighest for April and September of 32.2OC.
Average total yearly rainfall is 2326.7 mmyear-1 and the average total monthly rainfall is194 mm month-1. The highest monthly rainfallis in May with an average of 367 mm and thelowest monthly rainfall in July with 88 mm.Humidity ranges between 82% to 87%, withaverage wind velocity at 2.5 m s-1.
The terrain in Kabupaten Nunukan isdominated by a mountain range in the westand lowland peneplain in the east. Steepmountain terrain lies to the north-west, a partof the mountain range, that form the mainwatershed of the island of Borneo withaltitude ranging from 1500 m to 3000 mabove sea level. The middle part of Nunukanis hilly with undulating to flat landformtowards the east. The hilly area in the southhas elevation between 500 - 1500 above sealevel. The slopes of mountainous area arearound 30%, while in hilly area they rangefrom 8 - 15%.
Soil
Soils in the western part of Nunukan and partof Nunukan and Sebatik islands are red-yellow Pdodzolics with low fertility status andshallow top soil. The peneplain along the riverand coast consists of grey sedimentary soil ofGleysols.
The dominant soil structure in Nunukanconsists of sub angular block with rigid tovery rigid soil consistency and few poresdistributed only at top soil. Effective soildepth is from shallow to very shalow withacidity ranging from 3.5 - 4.5. Soil drainage ispoor, especially in the peneplain along theriver. The soils generally have low suitabilityfor oil palm.
The mountain range area is prone to soilerosion, especially in areas without vegetation.The swamps areas are wet almost throughoutthe year.
Watersheds
There are two main watersheds in KabupatenNunukan: (i) Sebuku watershed which islocated in Sebuku district and (ii) Sembakungdistrict which is located in Sembakung andLumbis districts. Both Sebuku andSembakung rivers have high debit of water allyear through. Rivers located in KabupatenNunukan are listed in Table 2.3.
Land use
Land use in Nunukan can be classified intofour main types:
1. Settlement areaMost people live in the peneplain area, 2 -10 m above sea level, and only a few live inupland/highland area. Most settlements arealong the coast, rivers or existing roads.
2. Paddy rice areaPaddy rice area mostly located behind thesettlement, in a zone about 100 - 500 mwide in the mainland area or 50 - 150 mfrom the river or coastline. Nunukan stillhas vast area that has potential for ricefields.
Tabel 2.3. Rivers in Kabupaten Nunukan
No. River Length (km)
1
2
3
4
5
6
7
8
9
10
Sembakung
Sulanan
Sumalungun
Sepadaan
Itay
Sebuku
Agisan
Tikung
Tabut
Simenggaris
278
52
42
32
146
115
62
50
30
36
Source: BAPPEDA Propinsi Kalimantan Timur

12
Carbon stocks in Nunukan, East Kalimantan: a spatial monitoring and modelling approach
3. Upland/dryland agriculture systems (Ladang)Upland rice and other food crops are moreinland in the upper part of paddy field area.
4. Plantation (cash crop) areaThe main cash crop area is located inSungai Pancang, around KecamatanSebatik. Cacao, coffee, clove, coconut andbanana can grow well in this area. Anotherpotential area for coffe and clove is aroundthe Sebuku river.
Household Survey Results
Demographic patterns
The household respondents were mostly headof the family (father/husband), except fortwo households in Sembakung that wererepresented by a member of the family(mother/wife). Table 2.4 and 2.5 describes thedemographic profile of respondents and the
ethnical background. The total number ofpersons surveyed (respondents and theirextended family) in both villages are 275persons, all under 64 years old with ratio ofmale to female respondent is around 1:1.From 51 households surveyed, 42 are nuclei2
families and the rest include extended family.The average family size is 5 person per family.Fifity-six percent of the people surveyed arein their productive age (15 - 64 years old). Thedependency ratio3 in Sebuku is 0.63, slightlylower than 0.87 of Sembakung.
The distribution of ethnical group inSebuku and Sembakung hardly differs. Themain ethnics group are Dayak Agabag andTidung, respectively composing 85% and 10%of total persons surveyed. The rest are fromethnics group of Flores, Bugis, Timorese,Javanese and Chinese (Table 2.5). Around50% of the family-heads have stayed in thearea longer than 20 years and only 10% havestayed less than or equal to 10 years. TheChinese were born in the area (local people),
Table 2.4. Demographic profile of respondents and its extended family in Sebuku and SembakungSub-districts
Sebuku Sembakung Total
1 Number of households (persons) 26 25 51
Total member of households (persons) 134 141 275
1 – 4 person 0.50 0.36 0.43
5 – 8 person 0.39 0.56 0.47 2
Distribution of respondents by family size
> 9 person 0.11 0.8 0.10
Average family size 5 6 5
< 15 years 0.43 0.45 0.44
15 – 64 years 0.57 0.55 0.56 3
Distribution of respondents by age
> 64 years 0 0 0
4 Dependency ratio3 0. 63 0.83 0.80
Source: BAPPEDA Propinsi Kalimantan Timur
2 Nucleus family refers to family with parents (motherand/or father) and children. Extended family includesother member in the family such as relatives or househelpers.3 The dependency ratio indicates the number ofindividuals of working age in relation to the non-workingage population (children and the elderly).

Livelihood options and farming systems in the forest margins of Nunukan, East Kalimantan
13
while people from Flores, Bugis and Timorare migrants who stayed in the area to findbetter living conditions; some used to work inMalaysia.
The level of formal education ofrespondents are relatively low. Around 35% ofrespondents never received schooling, only4% received high school education and noneabove high school education.
Livelihood options
Agriculture activities are the main source ofincome for people living in the rural area ofNunukan. Especially those who live aroundthe river where the soil is fertile. Activitiesthat involve extracting non-timber-forest-product (NTFP) extraction are the next mainsource of income (Table 2.6).
Table 2.5. Distribution of ethnics in Subuku and Sembakung
Family Head Family members Ethnics
Sebuku Sembakung Sebuku Sembakung
Dayak agabag 25(0.49)* 20(0.39) 101(0.45) 88 (0.39)
Tidung 1(0.02) 5(0.09) 21 (0.09)
Chinese 1(0.004) 3 (0.01)
Flores 1(0.004) 1 (0.004)
Bugis 5(0.02)
Timoresse 1 (0.04)
Javanesse 2 (0.09)
Total 26 25 108 116
* For Family-head, number in brackets refer to proportion to the number of households. For Family-Members, they refer to proportion tom the number of family members.
Figure 2.2. Distribution of ethnicsin FORMACS study area
Table 2.6. Level of education of respondents (in years of schooling)
Proportion of respondents Year of school
Sebuku Sembakung All
≤ 6 years 0.85 0.64 0.75
> 6 years 0.15 0.12 0.37

14
Carbon stocks in Nunukan, East Kalimantan: a spatial monitoring and modelling approach
Results of the household survey showsthat only one respondent has non-agriculturalactivities as his main occupation (Table 2.8).Around 27% of respondents have off-farmactivities as additional source of income, suchas making boat, logging, opening a shop or asvillage official. Farming is still the main sourceof income for people in the study area.
Only few respondents (4%) recognizedlogging activities as their secondaryoccupation. Nevertheless, around 55% ofrespondents acknowledge that theyoccasionally conduct logging activities andreceive income from it. This information wasderived when they were asked how muchincome they have received from selling timberfrom the forest (see section on Income).
A study by Kamelarczyk (2004) in MalinauDistrict5, East Kalimantan focus on theimpacts of small-scale forest licenses, knownas Timber Extraction and Utilisation Permits(IPPK = Ijin Pemungutan dan PemanfaatanKayu), on rural livelihood of three forestdwelling communities. The study revealedthat the average estimate of householdsengaged in forest product harvesting are 46%timber harvesting, 70% for hunting, fishing85%, gaharu collection 20%, rattan collection35% and for fruits collection 47%.
Land tenure and ownership
In Nunukan, land is owned individually orthrough community (as communal land).Table 2.9 decribes the tenure systems ofDayak Agabag ethnic groups, that composed
Table 2.6. The main economic activities invillages of Nunukan
Activities Products Type of activities
1. Farming: crops 2. Fishing 3. Farming: livestock 4. Gathering 5. Hunting
Cassava, banana, vegetables Fish (lampan, jelawat, pait, gedawang dan saluang), shrimps dan freshwater crabs. Chicken and pigs Durian (Durio zibethinus), rambutan (Nephelium lappaceum), cempedak (Artocarpus integer), honey, gaharu4 dan timber logging Deer and birds
Subsistence Subsistence Subsistence Subsistence and commercial Subsistence
Source: Monografi Desa-desa Kabupaten Nunukan(2001)
Table 2.7. Jobs carried out by respondents andtheir extended family
Job Categories Specific activities
Farmer planting crop based systems, tree-based systems or livestock
Teacher -
Business Entrepreneur
opening small shops, selling timber
Village official health worker, village office staff
Services carpenter, swiftlet nests guard,
Logging activities harvesting timber
4 Gaharu is a fragrant resin that is produced by Aquilariaspp. (Thymelaeaceae) when subjected to fungal attack.Gaharu is also known as agarwood, eaglewood oraloeswood.
Table 2.8. Occupation of the head of family inthe households surveyed
Number of respondents Job Type
Sebuku Sembakung Total
Main Occupation
Farmer 25 (98) 25 (100) 50 (99)
Teacher 1 (2) 1 (1)
Secondary occupation
Trade 1 (2) 1 (2) 2 (4)
Village official 2 (4) 1 (2) 3 (6)
Services 1 (2) 4 (8) 5 (10)
Logging activities 2 (4) 2 (4) 6 (12)
* Number in brackets refer to percentage of respondentswithin each area
5 Before 1999, Malinau and Nunukan area belonged to thesame district called Bulungan.

Livelihood options and farming systems in the forest margins of Nunukan, East Kalimantan
15
around 85% of the people surveyed. Thehousehold study, only focussed on the landowned individually by farmers.
Every household in the survey owned atleast one plot. The highest number of plotsowned by a household is 4 plots (2 respond-ents; Table 2.9). Sixty-three percent ofrespondents owned only one plot. The totalnumber of plot surveyed is 75 plots.
Most of the plots were obtained byinheritance (Table 2.10), reflecting that mostrespondents are not new to the area (at leastsecond generation). Opening land from forestis the next methods of obtaining the land.
Farming systems
Overall there are four main farming systemsin the survey: rain-fed paddy, smallholderplantation, jakaw and agroforestry systems.Rain-fed paddy is the only crop-based systemsfound in the area, the rest of the systems aretree-based systems. Table 2.10 provides thegeneral description of the tree-based systems.
There are two types of smallholderplantation: monoculture pepper and oilpalm.Oilpalm has only recently been introduced tothe area and the trees are still in their earlystage. The oil palm is mixed with upland rice.
Around 35% of the plots originated fromforest, mostly opened into tree-fruit basedagroforestry systems. This systems is also themain system that is currently found in thearea, around 83% of total plots (Table 2.13),managed by 98% of households. Theagroforestry systems combined coffee trees orfruit trees such as rambutan and langsat withannual crops such as long bean, maize andgroundnut. The agrofrestry systems covered63.1 ha or 71% of the total area of farmingsystems owned by respondents (Figure 2.3).
Most of the plots (69%) have semi-commercial purpose, serving household needsfor own consumption as well as for providingincome. Only less than 3% of farmingsystems have exclusively commercial purpose.
Average plot size in Sebuku is 1 ha whilein Sembakung it is slightly higher at 1.4 ha.Land-holding size in Sebuku is 1.3 ha while inSembakung is 2.16 ha.
Table 2.9. Tenure systems and land allocation of Dayak Agabag community
Land Ownership
Individual Communal
Land Use Type Settlement, Kebun and Ladang Swiftlet (Coccalia sp.) caves, river and forest
Methods of obtaining rights Opening forest, inheritance Adat, community agreement
Land size 0.5 – 1.5 ha per household 10 – 10 000 hectares
Boundary Mark Trees/plants Natural boundary (river, hill mountain)
Source: Dokumen Amdal Kabupaten Nunukan, 2002
Table 2.11. Methods in obtaining land
Tabel 2.10. Distribution of plots owned byhousehold
Number of Households Number of plots Sebuku Sembakung Total
1 19 (37) 13 (25) 32 (63)
2 6 (12) 10 (20) 16 (31)
3 1 (2) 1 (2)
4 1 (2) 1 (2) 2 (4)
Total Plots 35 (51) 40 (49) 75 (100)
* Number in brackets refer to percentage of plots.
Percentage of plots within each village
Sebuku Sembakung Total
Inheritance 49 45 47
Opening land 25 42 35
Purchase 3 - 1
Bequested 23 10 16
Sharecropping - 3 1

16
Carbon stocks in Nunukan, East Kalimantan: a spatial monitoring and modelling approach
Input and revenue
Input for farming systems are categorized intotwo components: labour and non-labour. Nonlabour includes fertilizer, pesticides andherbicides. In the study area, non-labourinputs are hardly used by farmers, except insmalholder plantations and several plots ofagroforestry systems.
The total labour input for the farmingsystems in the study area ranges from 113 to
149 persons days year- 1hectare-1. For tree-based systems, land preparation activities arerequired only at the beginning of the systems.Thus, the total labour input for these systemsafter the first year will be reduced by 23 - 36%.In tree-based systems, plot maintenance is themain component of labour input, rangingfrom 47 - 61% of the total labour input.
The labour requirement for harvesting andpost-harvest activities in monoculture peppersystems seems to be under-reported. Pepper is
Figure 2.3. Distribution of farmingsystems by area (in percentage)
Table 2.13. Number of plots and average size of farming systems in Sebuku and Sembakung.
Number of plots Average plot size (ha) Farming Systems
Sebuku Sembakung Total Sebuku Sembakung Total
Rain-fed paddy field - 3 (4) 3 (4) - 1.3 1.3
Smallholder plantation 1 (1) 2 (3) 3 (4) 2 1.5 1.7
Jakaw 1 (1) 6 (8) 7 (9) 1 0.6 0.6
Agroforestry systems 33 (44) 29 (39) 62 (83) 1 1.4 1.2
Total plots 35 (46) 40 (54) 75 (100) 1 1.4 1.2
* Number in brackets refer to percentage of plots.
Table 2.12. Characteristics of tree-based systems
Farming systems Description
Smallholder plantation Oil palm plantation, pepper (Piper nigrum) monoculture
Jakaw A fallow rotation systems where farmers slash and burn logged-over-forest then plant upland rice for several seasons. When the yield are no longer acceptable, farmers will leave the plot to fallow.
Agroforestry Systems
A fruit-based systems, where farmers plant fruit trees in logged-over-forest between remnant trees of low-commercial values. During its early stage, farmers plant cassava or vegetables, such as long bean (Vigna unguinculata), chili (Capsicum frustescens and Capsicum annum), groundnut (Arachis hypogaea), melon (Cucumis melo), watermelon (Citrullus lanatus), Brassica rapa, eggplant (Solanum melongena).

Livelihood options and farming systems in the forest margins of Nunukan, East Kalimantan
17
a plant that once mature will bear fruitcontinously. Thus, it is likely that harvestingactivities are included as part of plotmaintanance activities.
The oil palm systems, being in their theearly stage, are planted together with uplandrice. The amount of labour required forharvesting shown in Table 2.14 is forharvesting upland rice (see revenue derivedfrom each systems in Table 2.15).
Table 2.15 shows a rough estimate ofrevenue derived from each systems and thefraction of marketable otput that will actuallybecome hard cash earned by households.Only 3% of the plots in the study area haspurely commercial purpose and around 46%has semi commercial pupose. Products likecassava and rice are mainly for ownconsumption.
Household income and expenditure
The main source of household income inSembakung area is from on-farm activities(Table 2.16). The on-farm income is derivedfrom marketable products only. Products thatwere consumed by households are notincluded.
For respondents in Sebuku, the sources ofincome are from on-farm activities as well asfrom forest. In Sebuku, income from forestcontribute to around 56% of total householdincome, in contrast to 7% in Sembakung. Thisdifference occurs because the quality offorests that exist in Sembakung is very low.Most of Sembakung forest has been exploitedby a timber-concession or is being convertedto oil-palm or industrial timber plantation,planted with Acacia mangium (CARE, 2005).
Tabel 2.14. Labour input for each land use systems (in person days ha-1 year-1)
Farming Systems Plot
Preparation Plot
Maintenance Harvesting and Post-
Harvest activities Total
Rain-fed paddy field 33 24 56 113
Jakaw (cropping phase) 36 77 24 136
Smallholder plantation
Monoculture pepper 50 87 5 142
Oil palm 55 70 24 149
Agroforestry systems 27 70 17 114
* Number in brackets refer to percentage of plots.
Tabel 2.15. Revenue derived from farming systems
Farming Systems Products Revenue*)
(Rupiah6 year-1 ha-1) Fraction of
marketable output
Rain-fed paddy field Upland rice 2,640,000 0
Jakaw (cropping phase) Upland rice, timber for own use 1,091,000 0
Smallholder plantation
Monoculture pepper Pepper 750,000 1
Oil palm (immature phase) Upland rice, banana 505,000 0.88
Agroforestry systems Upland rice, cassava, coffee, fruits, vegetables
1,964,000 0.75
* Revenue is defined as average yield of products derived from each farming systems, multiplied by estimated price.Products consumed by households are also included in the calculation.
6 The exchange rate at the time when the survey was conducted was approximately Rp 8,900 per US$.

18
Carbon stocks in Nunukan, East Kalimantan: a spatial monitoring and modelling approach
On the other hand, non-agriculturalactivities in Sembakung on average generatedincome 88% higher compared to activities inSebuku. This shows different strategiesbetween the two village in meeting theirneeds, influenced by existing resources.
The different livelihood options that existin the two sub-districts studied influence theincome per capita and income per household(Table 2.17). Sebuku has a higher householdincome and income per capita compared torespondents in Sembakung.
In Sebuku, two respondents receivedincome from timber-IPPK fee; on average Rp. 1,250,000 per month or Rp. 15,000,000per year. In Malinau (Kamelarczyk, 2004), acommunity living in a forest dwelling ofTanjung Nanga in 2001 received Rp 100million in compensation for the timberextracted until 2000. The timber fee receivedby each households there ranged from Rp.1,950,000 to Rp. 6,282,000.
The national indicator of poverty for ruralarea for Indonesia is Rp. 105,888 per personper month (BPS, 2003). While the regionalindicator for East Kalimantan is Rp. 145,460per person per month. On average, theincome per capita for Sebuku and Sembakungvillage is above this level. But, looking atindividual household, 4% of households inSebuku is below the regional poverty indicatorand 1% below the national poverty indicator.For Sembakung repondents, the percentage ofhouseholds below the poverty indicator ishigher, 44% below the regional indicator and28% below the national indicator.
Around 46% of household expenditure isallocated for food. Transportation seems to bequite an important component of expenditurereaching 16% of the overall expenditure.Proportion of expenditure allocated to healthis around 8%, unfortunately, similart to theproportion allocated to smoking. In terms ofratio of expenditure to income, around 33%of income is used for household expenses(Table 2.18). Despite the difference in average
Table 2.16. Household income by its source
Sebuku Sembakung All
Source Fraction of households
(%)
Average Income *) (Rp/month)
Fraction of households
(%)
Average Income
(Rp/month)
Fraction of households
(%)
Average Income
(Rp/month)
On-farm activities 100 722,000 100 468,000 100 598,000
Forest Timber Timber fee (IPKK) NTFP
92 76 8 60
1,466,000 1,018,000 1,250,000
791,000
16 12 - 8
580,000 700,000
- 110,000
54 44 4 34
1,334,000 975,000
1,250,000 711,000
Fishing and Hunting 4 150,000 20 103,000 12 111,000
Other non-agricultural activities
32 681,000 64 1,282,000 48 1,064,000
* The average income is rounded off to the nearest thousands rupiah.
Tabel 2.17. Household income of respondents
Sebuku Sembakung Total
Average household income (Rp/month) 2,299,000 1,288,000 1,804,000
Income per capita (Rp/person/month) 446,000 228,000 334,000
* Income is rounded off to the nearest thousands rupiah.

Livelihood options and farming systems in the forest margins of Nunukan, East Kalimantan
19
income between the two subdistricts therelative allocation or expenditure categories isthe the same
Discussion
The household survey was intended tounderstand the livelihood options that exist inthe forest margin of Nunukan. Thisunderstanding is crucial to recognize andcomprehend the decision that farmers maketo manage their landscape.
The result from two sub-districts inNunukan clearly show differences inlivelihood options, especially the quality of theremaining forest. Income of farmers inSebuku is derived from on-farm activities andforest products, while for farmers inSembakung the income is derived mostlyfrom on-farm activities. Our current rapidstudy in two sub-district in Nunukan revealedthat in an area where forest of good quality is
still abundant, income generated from forestcan contribute to 56% of household income.
Timber is certainly the most attractiveforest product in the areas and logging is themost attractive off-farm activity. Loggingactivities also produced a higher revenuecompare to on-farm activities. Existingliterature provides hardly any information onthe household economics of timber loggingactivities, although most literature doesacknowledge logging activity (legal or illegal) a part of livelihood options for people livingin the forest margin of Kalimantan (Levang,2002). It is difficult to obtain an estimate onhow much logging contributes to income athousehold level. Most existing literaturesdiscuss the economics of timber logging,illegal or legal, at timber concession, regionalor national levels (Casson and Obidzinsky,2002; Resosudarmo and Dermawan, 2002 andSmith et al. 2003). The main discussion onlegal logging is on management issueshighlighting the importance of sustainable
Table 2.18. Percentage of expenditure to income at household level.
Sebuku Sembakung Total
% % %
Percentage of food expenditure to income 14 17 15
Percentage of non-food expenditure to income 19 16 18
Percentage of total expenditure to income 33 33 33
Figure 2.4. Householdexpenditure allocation inSebuku and Sembakung

20
Carbon stocks in Nunukan, East Kalimantan: a spatial monitoring and modelling approach
methods for harvesting forest timber (Barr,2002 and Sist et al., 2003). The debate onillegal logging mostly addresses governanceand policy issues, stressing the need of a betterway to monitor illegal logging in order torecover the loss of local and national incomethat could be gained through taxes (Taconi,2004). A careful study on householdperspectives of logging and its economiccontributions to household economy isrequired to develop alternative activities forincome generation, as part of finding solutionto maintain existing forest and reducedeforestation.
Conclusion
• The main farming systems in Sebuku andSembakung sub-districts of Nunukan arefruit tree -based agroforestry systems,comprising 83% of farmers plots covering71% of farming land and managed by 98%of respondents.
• Other farming systems found in the areaare jakaw (fallow rotation systems with
upland rice as crop), rain-fed paddysystems and smallholder plantation (oil-palm and monoculture pepper), in totalmanaged by 29% of respondents.
• The return to land of agroforestry systemson average is Rp. 1,964,000 per ha, lowerthan rain-fed paddy systems. But given thatagroforestry systems is the main systemmanaged by farmers and 75% ofagroforestry products are marketed, thissystems is the main source of income fromon-farm activities.
• Income per capita in Sebuku andSembakung is Rp. 446,000 and Rp.228,000, respectively per month and theaverage income per household is Rp.2,299,000 and Rp. 1,288,000 respectively.
• In Sebuku, forest products contribute 56%of household income, in contrast to 7% inSembakung. The additional incomegenerated by forest products in Sebukuincreased average household income by78% and increase income per capita by96%.

Introduction
The role of terresterial ecosystems in theglobal carbon cycle has raised considerableinterest among researchers and policy makers.Exchange between atmosphere and vegetationinvolves large two-way fluxes, with fixation ofCO2 into biomass through photosynthesisapproximetaly balanced by the release of CO2
through processes of decomposition andburning. It is estimated about 60 Pg1 carbonis exchanged (in both directions) betweenterresterial ecosystems and the atmosphereevery year, with a net terresterial uptake of 0.7± 1.0 Pg1 C (Lasco, 2004). However, relativeto the size of the atmospheric pool of CO2,land use change and forest conversion aresignificant source of CO2 contributing toaround 1.7 ± 0.6 Pg C year (Watson et al.2000). In geological history the process ofCO2 fixation has dominated over that of CO2
release, contributing to the large reserves of'fossil fuels'. At the current rate of global fuelconsumption and economic growth, it ispredicted that within 100 years global meantemperature will increase by 1.7 - 4.5ºC(Houghton et al., 2001).
Forest conversion to agricultural landreleases substantial quantitities of storedcarbon to the atmosphere, but may haverelatively little effect on current CO2
absorption by terresterial ecosystems, unlessthe conversion process leads to degraded soilslacking green vegetation, or to jungles ofconcrete and asphalt without active photo-synthesis. Despite rates of photosynthesis thatcan be similar to that of forest, the carbonstocks stored in agricultural systems are muchsmaller, as the annual gains in fixed CO2
tends to be rapidly released back into theatmosphere. This can occur on-site, throughburning or decomposition of crop residues,or off-site after removal through harvesting.The main issue in land use change, however,is the change in stored carbon. Release to theatmosphere upon forest conversion can berapid, with C stocks of up to 250 Mg C ha-1
lost in slash and burn clearing, while the re-accumulation in wood is relatively slow, of theorder of 5 Mg C ha-1 year-1.
Current efforts to mitigate the impact ofclimate change are through ways of increasingcarbon sequestration (Sedjo and Salomon,1988) and/or mitigating carbon emission(Lasco et al., 2004). Mitigating C emission canbe accomplished through: (a) conservation ofexisting C stocks by protecting forest reserves,controlling deforestation, the use ofsilviculture practices, reversing the drainageand degradation of peat lands with their largecarbon stocks and improved management ofsoil organic mater stocks, (b) increase incarbon stocks by enhancing woody vegetationand (c) subtitution of fossil fuels-basedproducts by renewable energy sources derived
21
3. ABOVEGROUND CARBON STOCKASSESMENT FOR VARIOUS LAND USE SYSTEMS
IN NUNUKAN, EAST KALIMANTAN
Subekti Rahayu, Betha Lusiana and Meine van Noordwijk
1 1 Pg = 1015 g = 109 Mg = 1 Gt

22
Carbon stocks in Nunukan, East Kalimantan: a spatial monitoring and modelling approach
directly or indirectly (wind, biomass, waterflows) from solar radiation, tidal action orgeothermal processes.
Increased carbon stocks (carbonsequestration) can be achieved by (a) naturalincreases in forest growth and biomass, (b)increasing tree stocks in existing forest eitherthrough increasing growth or decreasingharvest and (c) establishing fast growing treeplantation (Sedjo and Salomon, 1988).Carbon sequestered is stored in the form ofwoody biomass, thus the simple way toincrease carbon stocks is to plant and managetrees (Lasco et al., 2004).
Terrestial carbon stocks consist of aboveand below ground carbon. Above groundcarbon stocks component includes biomass(stems, twigs, leaves, vines, epiphytes andunderstorey) and necromass (dead trunks,standing dead trees, litter in form of leaves,stem, twigs, flowers, fruits and fire residues).Below ground carbon stocks components areroots of live or dead plants, soil organismsand soil organic matter (Hairiah andMurdiyarso, in press). Harvesting tree productssuch as timber (for lumber, pulp and paper orcharcoal production or for use as firewood),resin and fruits or leafy biomass as fodder,removes carbon stocks when considered atplot scale, but is not necessarily a loss whenviewed at global scale. The same may apply toloss of soil organic matter by erosion. Someof the global carbon accounting systemsinclude the carbon flows (especially those inwood) and their subsequent decomposition,but it is difficult to obtain consistency withsuch methods if they do not relate toassessments of existing stocks (mostly inurban areas). According to Canadell (2002), inthe humid tropics maximum potential incarbon sequestration will be achieved byfocussing on increasing aboveground biomassin woody vegetation rather than as soil carbon,given the smaller pool size of soil organicmatter and short mean residence time. Peatsoils are an obvious exception to this (vanNoordwijk et al., 1997; Paustian et al., 1997).
This paper describes the study conductedin Nunukan, East Kalimantan to measurecarbon stocks in various land use systems.The study is carried out under FORMACS(Forest Resources Management for CarbonSequestration) project with the followingobjectives:
1. to estimate carbon stocks in representativeland cover classes of the main land usepractices in Kabupaten Nunukan
2. to identify land use systems that can bestmaintain carbon stocks.
Methods
Plot level C-stocks
Prior to measurement, a quick survey wasconducted in Sebuku and Sembakung Districto identify existing land-use systems and theland cover classes that are associated with atypical cycle of each land use system (seeChapter 2). This survey established the 'strata'that had to be considered in a stratifiedsampling scheme.
During December 2003 - March 2004, 54plots were sampled (Appendix 1) includingprimary forest, logged-over forest (3, 10, 30and 50 years after the 1st logging), upland rice,fallow (jakaw) (1, 2, 3, 4, 5, 7, 15 years afterslash-and-burn clearing and agroforestrysystems (9, 11-20 and 21- 30 years old)2. Ineach plot, the diameter and height of live anddead trees were measured in 30 x 10 m2 plotswith litter and understorey samples insubplots (for full protocol see Hairiah et al.,2001). Soil carbon was not measured in thisstudy, as there are no major areas of peat withhigh belowground carbon stocks, and the land-use change induced changes in soil carbonwere therefore expected to be less than theexisting spatial variation.
2 Although result in chapter 2 shows the existence ofsmallholder plantations, these were not sampled. Thereasons are: (1) oil palm plantation is still in its early phaseand (2) only few plot of both systems exist in the sample

Aboveground carbon stock assesment for various land use systems in Nunukan, East Kalimantan
23
Figu
re 3
.1 M
ap o
f p
lots
wh
ere
carb
on
was
mea
sure
d.

24
Carbon stocks in Nunukan, East Kalimantan: a spatial monitoring and modelling approach
Trees
Carbon stock of a land-use system isinfluenced by its vegetation. A land usesystem consisting of tree species with highwood density will have a higher biomasscarbon compared to that with a low wooddensity and similar tree diameter.
Tree biomass (in dry weight) was estimatedusing allometric equation on the basis of stemdiameter (in cm) at 1.3 m above the ground3.Table 3.2 listed the allometric equations usedin this study to estimate different vegetation.For wood density, values from literaturereview are used4.
Total C content (carbon biomass) wasestimated using the following equation:
Carbon biomass (Mg ha-1) = Total biomass(Mg ha-1) x 0.45, that assumes C content of biomass (in dry weight) is 0.45.
Time-averaged carbon stocks
To compare the carbon sequestrationpotential of a land-use system, it is necessaryto assess the systems across their life cycle,
between the minimum and maximum valuethat can be expected to be present in thelandscape. If there is no active process ofintensification or adoption of new practices,we can assume that all phases of the life cycleare represented spatially in accordance withtheir proportion in the total life cycle. Thetime-averaged carbon stock is defined as theintegral over time of the carbon stocks ineach phase of the systems cycle, divided bythe duration of the 'cycle'. For rotational landuse systems, time-averaged carbon stocks canbe used for landscape assessments (Palm,1995). In Nunukan, the Jakaw-Rice System is arotational one. Assumning a time-independentrate of C sequestration during the fallow, thetime averaged carbon stock is derived as:
C [Mg ha-1] = fcrop Ccrop + ffallow Cfallow = fcrop Ccrop + ffallow (Tfallow Cincr,fallow/2) (1)
Where fcrop and ffallow refer to the fraction of timethat the system is cropped or fallowed, respectively,Ccrop and Cfallow are the C stocks (Mg ha-1] of thecrop and fallow phase, Tfallow is the length of a singlefallow cycle [year] and Cincr,fallow is the rate of Csequestration [Mg ha-1 year-1] during the fallow phase.
Table 3.2. List of allometric equations used to estimate biomass of various vegetations
3 Australian Greenhouse Office (2002) recommendedthree methods for biomass modelling: (i) allometricequtions between diameter and/or height to above groundbiomass, (ii) stem volume models and conversion toabove-ground biomass using an expansion factor and (iii)Stand basal area to biomass relationships http://www.greenhouse.gov.au/land/bush_workbook_a3/index.html
4 A database compiling wood density of 2800 tree speciesis currently available at http://www.worldagroforestry.org/sea/Products/AFModels/treenwood/treenwood.htm
Biomass Category Allometric equation Source
Branching trees B = 0.11ρ D2.62 Ketterings, 2001
Non-branching trees B = (π/40) ρ H D2 Hairiah, 2002
Necromass (dead trees) B = (π/40) ρ H D2 Hairiah, 2002
Coffee (pruned) B = 0.281 D2.06 Arifin, 2001; Van Noordwijk, 2002
Banana B = 0.030 D2.13 Arifin, 2001; Van Noordwijk, 2002
Paraserienthes falcataria B = 0.0272 D2.831 Sugiarto, 2002; Van Noordwijk, 2002
Palm B = BA* H*ρ Hairiah, 2000
NOTE:B = biomass (dry weight, kg tree-1)D = diameter (cm) at breast height (1.3 m)H = tree height (cm)BA = basal area (cm2)ρ = wood density (Mg m-3, kg dm-3 or g cm-3)

Aboveground carbon stock assesment for various land use systems in Nunukan, East Kalimantan
25
Results and Discussions
Tree diversity
Wood density composition
The wood density of trees can be categorizedinto four types: light, medium, heavy and veryheavy (Pendidikan Indutri Kayu Atas, 1979).A summary of the wood density (derivedfrom a literature database) for tree speciesfound in the various land use systems inNunukan is listed in Table 3.3. Primary foresthas the highest median wood density andjakaw has the lowest value. In terms of thedistribution of tree species densitycharacteristics, jakaw and agroforestry aremostly dominated (more than 80%) by lightand medium tree species.
In primary forest 42% of the trees areheavy and very heavy species, reflecting theprominence of late-successional species.Figure 3.1 shows the cumulative frequency ofwood density in four land use systems inNunukan.
Species composition
In the primary forest plots sampled, 40% ofthe vegetation consisted of commerciallyvaluable tree species (Appendix 2A), such askeruing (Dipterocarpus sp.), meranti (Shorea sp.)and kayu kapur (Dryobalanops sp.). The rest of
the vegetation is composed of Sapotaceae(Palaquium sp.), Anarcardiaceae (Buchanania sp.,Gluta sp.), Ebenaceae (Diospyros sp.), Meliaceae(Aglaia sp.), Myriasticaceae (Horsfieldia sp.) andLauraceae (Beilschmiedia sp.). In logged overforest aged less than 30 years, theDipterocarpacea species have decreased to30% of the remaining trees due to timberharvesting (Figure 3.2).
In the jakaw systems, forest is openedthrough slash and burn methods after whichfarmers planted food crops such as rice, maizeand groundnut. When the food cropproduction has decreased and no longerprovides sufficient return to labour (as yieldsdecline and labour requirement for weedinggo up), farmers leave the plot. After 1 year offallow, the common vegetation found is wildbanana. After 2 - 6 years, pioneer trees start togrow in the plot, such as sedaman (Macarangasp.) from the Euphorbiaceae familly.
The abundance of species found in jakaw(fallow) and logged over forest 0 - 10 yearsare influenced by the establishment ofpioneer vegetation on disturbed forest.Disturbed forest (either by fire or logging) willgo through natural succession. During thefirst five years after disturbance vegetation willbe dominated by shrubs ('semak') that requirefull light. For the next five years, it will bedominated by trees ('belukar') that requiresfull light to grow, such as Macaranga sp. and
Distribution of species*** (%) Land Use Systems
Median Mid-range* Wood Density** (Mg.m-3)
Light <0.6 Mg m-3
Medium 0.6 – 0.75
Heavy 0.75 – 0.9
Very Heavy > 0.9 Mg m-3
Primary Forest 0.68 34.2 23.4 11.7 30.6
Logged-over Forest 0.61 25.9 41.3 17.6 15.2
Agroforestry 0.60 50.1 38.1 7.0 4.7
Jakaw 0.59 61.7 18.8 12.5 7.0
* Wood density value of a certain tree species resulted from literature review is expressed as a range of values. Forexample: Tengkawang (Shorea stenoptera Burck.) has wood density value of 0.31 - 0.57 Mg m-3. Thus mid-range wooddensity value for Tengkawang is 0.42 Mg m-3.
** Mg = 106 g = 1 ton. In this study, we use the unit of Mg m-3 instead of kg m-3, for reason that it is in Internationalunit and has a value equal to g cm-3 (while kg m-3 = 1000 g cm-3).
Table 3.3. Wood density of trees in the various land use systems

26
Carbon stocks in Nunukan, East Kalimantan: a spatial monitoring and modelling approach
Mallotus sp.. When fallows reach more thanten years of age and in forests logged 11-50years ago the total number of species maydecline after full canopy closure and reducedopportunities for light-demanding understorey,but the number of late-successional speciesincreases (Van Nieuwstadt, 2002).
Agroforestry systems that are commonlymanaged by farmers in Nunukan are fruit-treebased. In systems aged 0-10 years, besidesfruit trees, low commercial trees that stillremain after logging are commonly foundsuch as terap (Artocarpus sp.) dan sedaman(Macaranga sp.). Under systems aged more
Figure 3.3. Dipterocarps and non-Dipterocarps (in %) found invarious land use system of Sebuku-Sembakung, Nunukan (seeAppendix1 for definition of landuse systems code).
Figure 3.2. Cumulative frequency of wood density estimates for tree species found in: (a) the primary forest, (b)logged-over forest, (c) agroforestry and (d) jakaw.

Aboveground carbon stock assesment for various land use systems in Nunukan, East Kalimantan
27
than 10 years, the fruit species are moreabundant. Timber species also haveestablished by this time. The fruit speciescommonly planted are durian (Duriozibethinus), mangga (Mangifera indica), langsat(Lansium domesticum), cempedak (Artocarpusinteger), rambutan (Nephelium lappaceum) dankelapa (Cocos nucifera). Many of the gardensalso include coffee (Coffea sp.) and cacao(Theobroma caccao) as component. In thissystems the number of species is almost equal
to that of forest systems but has a differentcomposition (Figure 3.4).
Size composition
The existence of trees with diameter morethan 30 cm in a certain land use systemsmakes a large contribution to the total carbonstocks. In primary forest, 70% of the totalcarbon biomass comes from trees withdiameter > 30 cm. In natural forest, trees with
Figure 3.5. Schematic relationshipbetween species composition andbiomass composition of variousforms of forest and derived landuses in Nunukan.
Figure 3.4. Number of woody species found in a 40*5 m2 plot in various land use system of Sebuku-Sembakung, Nunukan (see Appendix 1 for definition of the land use systems code).

28
Carbon stocks in Nunukan, East Kalimantan: a spatial monitoring and modelling approach
diameter 5-30 cm mainly occur where gapswere created in the past by big trees dieingand falling (Hairiah and Murdiyarso, in press).
In logged-over forest, the total carbonstocks contributed by trees with diameter >30cm increased as the length of time afterlogging increased. For logged over forest aged0-10, 11-30 and 31-50 years, the contributionof carbon stocks from trees with diameter >30 cm are 75%, 78% dan 83% respectedly.
In agroforestry systems, trees withdiameter >30 cm only contribute to 30% oftotal carbon for agroforestry aged 0 - 10 yearsand 15% for agroforestry age 11-30 years.This low contribution is due to the history ofthe systems itself. Agroforestry plots areestablished from logged over forest that mostlyhave light wood density species as remnanttrees. Thus, they have a relatively low biomass.
In jakaw systems aged 0-10 years hardlyany trees with diameter > 30 cm exist. In thissystem, farmers slash and burn all vegetationprior to planting upland rice. Occasionally,however, one or a few large trees are spared inthe land clearing and cultivation phase,accounting for the few large trees in fallowvegetation. Apart from these, all vegetationstarts to establish around the same time. Injakaw aged more than 10 years, trees withdiameter > 30 cm contribute almost 80% oftotal carbon stocks, similar to that of logged-
over forest aged 11 - 30 years. Jakaw isdominated by pioneer trees (of low wooddensity) that grow fast, thus within 15 years italready has many trees with diameter > 30 cm.
Carbon stocks
Total carbon biomass
The estimated aboveground carbon stocks ofland use systems in Nunukan are estimated torange from 4.2 - 230 Mg ha-1 (Table 3.4). Theaboveground carbon stock in in primaryforest in Sebuku-Sembakung, Nunukan is wellin the range of previous studies, with its 230Mg ha-1. The ASB studies in Sumatra derivedestimates up to 300 Mg C ha-1 (Hairiah danMurdiyarso, in press). Indonesian forest havebeen estimated to carbon stocks ranging from161 - 300 Mg ha-1 (Murdiyarso et al., 1995).Lasco (2002) reviewed various studies offorest carbon stocks in South East Asia. Thecarbon stocks of forests in tropical Asia arebetween 40 - 250 Mg ha-1 for vegetation and50 - 120 Mg ha-1 for soil. For national greenhouse gas inventory studies, IPCC recommendsa default value of 138 Mg ha-1 of carbon (or275 Mg ha-1 of biomass in dry weight) forhumid forests in Asia (Lasco, 2002).
The carbon stocks in primary forest arethe point of reference for this study. Themeasurements in logged-over-forest yieldedvalues of 80 - 92% of this value, but without
Tabel 3.4. Mean aboveground carbon stocks of land use systems sampled in Nunukan
Land Use Systems Carbon stock (Mg ha-1) Percentage (%)
Primary forest 230.1 100
Logged-over-forest aged 0-10 years 206.8 90
Logged-over-forest aged 11-30 years 212.9 92
Logged-over-forest aged 31-50 years 184.2 80
Jakaw aged 0-10 years 19.4 8
Jakaw aged more than 10 years 58.0 25
Agroforestry aged 0-10 years 37.7 16
Agroforestry aged 11-30 years 72.6 31
Imperata 4.2 2
Upland Rice 4.8 2
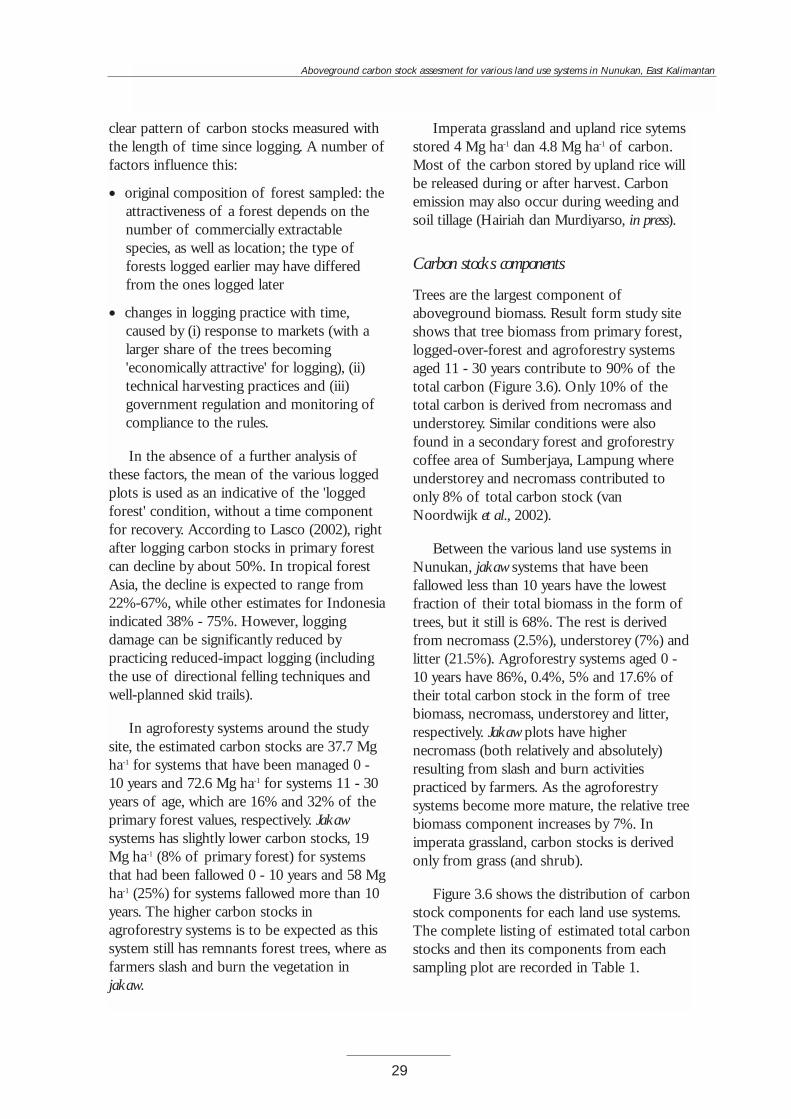
Aboveground carbon stock assesment for various land use systems in Nunukan, East Kalimantan
29
clear pattern of carbon stocks measured withthe length of time since logging. A number offactors influence this:
• original composition of forest sampled: theattractiveness of a forest depends on thenumber of commercially extractablespecies, as well as location; the type offorests logged earlier may have differedfrom the ones logged later
• changes in logging practice with time,caused by (i) response to markets (with alarger share of the trees becoming'economically attractive' for logging), (ii)technical harvesting practices and (iii)government regulation and monitoring ofcompliance to the rules.
In the absence of a further analysis ofthese factors, the mean of the various loggedplots is used as an indicative of the 'loggedforest' condition, without a time componentfor recovery. According to Lasco (2002), rightafter logging carbon stocks in primary forestcan decline by about 50%. In tropical forestAsia, the decline is expected to range from22%-67%, while other estimates for Indonesiaindicated 38% - 75%. However, loggingdamage can be significantly reduced bypracticing reduced-impact logging (includingthe use of directional felling techniques andwell-planned skid trails).
In agroforesty systems around the studysite, the estimated carbon stocks are 37.7 Mgha-1 for systems that have been managed 0 -10 years and 72.6 Mg ha-1 for systems 11 - 30years of age, which are 16% and 32% of theprimary forest values, respectively. Jakawsystems has slightly lower carbon stocks, 19Mg ha-1 (8% of primary forest) for systemsthat had been fallowed 0 - 10 years and 58 Mgha-1 (25%) for systems fallowed more than 10years. The higher carbon stocks inagroforestry systems is to be expected as thissystem still has remnants forest trees, where asfarmers slash and burn the vegetation injakaw.
Imperata grassland and upland rice sytemsstored 4 Mg ha-1 dan 4.8 Mg ha-1 of carbon.Most of the carbon stored by upland rice willbe released during or after harvest. Carbonemission may also occur during weeding andsoil tillage (Hairiah dan Murdiyarso, in press).
Carbon stocks components
Trees are the largest component ofaboveground biomass. Result form study siteshows that tree biomass from primary forest,logged-over-forest and agroforestry systemsaged 11 - 30 years contribute to 90% of thetotal carbon (Figure 3.6). Only 10% of thetotal carbon is derived from necromass andunderstorey. Similar conditions were alsofound in a secondary forest and groforestrycoffee area of Sumberjaya, Lampung whereunderstorey and necromass contributed toonly 8% of total carbon stock (vanNoordwijk et al., 2002).
Between the various land use systems inNunukan, jakaw systems that have beenfallowed less than 10 years have the lowestfraction of their total biomass in the form oftrees, but it still is 68%. The rest is derivedfrom necromass (2.5%), understorey (7%) andlitter (21.5%). Agroforestry systems aged 0 -10 years have 86%, 0.4%, 5% and 17.6% oftheir total carbon stock in the form of treebiomass, necromass, understorey and litter,respectively. Jakaw plots have highernecromass (both relatively and absolutely)resulting from slash and burn activitiespracticed by farmers. As the agroforestrysystems become more mature, the relative treebiomass component increases by 7%. Inimperata grassland, carbon stocks is derivedonly from grass (and shrub).
Figure 3.6 shows the distribution of carbonstock components for each land use systems.The complete listing of estimated total carbonstocks and then its components from eachsampling plot are recorded in Table 1.

30
Carbon stocks in Nunukan, East Kalimantan: a spatial monitoring and modelling approach
Figure 3.6. Aboveground carbon stocks and their relative composition in Nunukan (upper panel absolute valuesin Mg ha-1, lower panel expressed as %)
Time-averaged carbon stocks
Time-averaged carbon stocks reflect thedynamics of carbon that is present in acertain land use systems over its life span. Itdepends on the rate of carbon accumulation,the minimum and maximum value of carbonstored by the systems, the length of timerequired to reach its maximum value and therotation period (Palm et al, 1999).
For natural forest, it is assumed that thesamples directly represent the 'time-averaged'carbon stock, reflecting the fine-scale mosaicof the patch regeneration cycle.
The expected pattern of logged-overforest over time is a direct decrease (due to
biomass removal), followed by an induced-tree mortality phase with declining C stocksand a recovery of the vegetation (the dottedline in the upper panel of Fig. 3.6). The dataderived from the field not really match theexpected pattaren. The unexpected patternespecially noticeable in the plots logged 30-50years ago. In the absence of an interpretabletime pattern, the spatial average over thevarious logged-over forest plots is used as anestimate of the 'time-averaged' C stock.
For the agroforestry and the Jakaw-Riceland use systems a plot of total carbon stockversus time does match the expected increase(Fig. 3.7). A linear increase with a very smallintercept characterizes the Jakaw data, while

Aboveground carbon stock assesment for various land use systems in Nunukan, East Kalimantan
31
the agroforestry systems data indicate asubstantially higher intercept (remnant foresttrees), as well as lower rate of increase.
The estimated rate of carbon sequestrationfor jakaw: 3.66 Mg ha-1 year-1 and foragrofrestry systems: 2.00 Mg ha-1 year-1 (Figure3.7) are comparable to the fallow systemsobserved in Sumberjaya, Lampung with a rateof 3.44 Mg ha-1 year-1 (van Noordwijk et al,2002). On the basis of this linear increase oftotal aboveground carbon stock with time, thetime-averaged carbon stock as a function ofrotation length for the Jakaw-Rice system canbe derived using potrayed in Figure 3.7.
For the agroforestry system, two situationscan be distinguished: (i) the system isrejuvenated at gap level ('sisipan') and olderforest trees are selectively maintained. In thiscase the time-averaged C stock depends onthe mean 'successional age' of the system; and(ii) the agroforestry sytems isrenewed at fieldlevel by clear felling and starts to build upfrom a near zero value in each cycle. Theexisting agroforests in Nunukan are mostly ofthe 'sisipan' type. More intensive tree cropproduction systems tend to be of therotational type.
The impacts of land use change can bedirectly derived from a comparison of thetime-averaged carbon stocks: a transition fromnatural forest to logging (at the historicalintensities) costs 12% of the original carbonstock, a further shift of logged-over forest toagroforest costs a further 58% of the originalcarbon stock, while a change of logged forestto the Jakaw-Rice system costs 76 % of theoriginal carbon stock, and degradation of theJakaw-Rice to annually burned Imperatagrasslands cost 10%. Vice versa, reclamationof Imperata grasslands to (rotational)agroforest can be expected to lead to a gain of15-20% of the original forest carbon, while amodofication from the relatively mature Jakawsystems to agroforest can lead to a gain ofabout 25% of the original forest carbon stock.
Conclusions
• The natural forest of Kabupaten Nunukanhas carbon stocks of abour 230 Mg ha-1
and is in line with existing estimates forforests of Sumatra and elsewhere inKalimantan. The impact of historicallogging practices on the carbon stocks havebeen relatively small (a 12% reduction inexisting stocks), but it is possible that the
Figure 3.7. Rate of carbon sequestration in agroforestry and jakaw systems in Nunukan

32
Carbon stocks in Nunukan, East Kalimantan: a spatial monitoring and modelling approach
original C stock of natural forest washigher and the losses due to logging havebeen higher if we assume that the bestforests have been logged first and theremnant forest is not representative of theoriginal condition.
• There are two main systems practiced byfarmers in Sebuku-Sembakung area: (i)Jakaw-Rice systems, where farmers slashand burn logged-over-forest plots andplant upland rice for 1 or more years ofcropping before farmers leave the land to afallow egrowth phase and (ii) agroforestrysystems, where farmers plant fruit trees inbetween remnant trees left from loggingactivities.
• Plot level measurement found thatestimated carbon stocks of agroforestrysystems is higher than that of the jakawsystems, with values between 19 and 58 Mgha -1 for fallowed-jakaw of 0 - 10 years and
more than 10 years and 38 and 73 Mg ha-1
for agroforestry systems managed 0 - 10years and 11 - 30 years, respectively. Theestimated carbon stocks of agrofrestryfruit-tree based systems found in the studyarea seems to be low compare to otheragrofrestry systems in other areas, such ascoffee based systems in Lampung andrubber agroforestry systems in Jambi. Thiscould be due to the type of trees that existin the tree-fruit based systems are of lowwood density type (mostly are remnantstrees of low commercial value).
• The annual rates of C sequestration afterclear felling or in agroforests that representrelatively young succesional stages is of theorder of 2 - 4 Mg C ha-1 year-1, lower thanthe 5-7 Mg C ha-1 year-1 that are possible inwell managed tree plantations. For anappraisal of the land use system level,however, the annual rates of C
Table 3.4 Time-averaged carbon stock values for the four major land cover/land use systems of theuplands of Kabupaten Nunukan; for the agroforestry system two variants are described with differenttree rejuvenation strategies (rotational or based on gap rejuvenation ('sisipan')); the currently dominantvariants of the various land use systems are indicated in bold.
Cycle length [years] Time-averaged C stock
[Mg ha-1] Relative to forest
Natural forest 230.1 100.0
(remaining)
Logged forest 202.7 88.1
(at historical logging intensity)
Agroforest 15 25.5 11.1
(rotational) 25 35.5 15.4
(sisipan)
mean age 25 70.9 30.8
mean age 40 100.9 43.8
Jakaw-rice 4 7.1 3.1
1 year crop 6 10.6 4.6
X-1 year fallow 8 14.2 6.2
10 17.8 7.7
15 26.9 11.7
20 36.0 15.7
Imperata 4.2 1.8
(yearly fire)

Aboveground carbon stock assesment for various land use systems in Nunukan, East Kalimantan
33
sequestration do not need to beconsidered, as a comparison of 'time-averaged' C stocks allows a directcomparison.
• Conversion of forest to agricultural landfor an upland rice - fallow growth cycle willreduce carbon stocks by more than 85%,depending on the length of the fallowcycle. The agroforest land use optionswhere intensively managed trees provideincome is an 'intermediate' land use system,which can be expected to function at about31% of the original forest carbon stocks.
• The data suggest that well-managed formsof logging that avoid forest degradationmay provide the best opportunity formaintaining high C stocks in the Nunukanlandscape, while providing income to thelocal community. In practice, however,logging may be the start of a process of
further degradation. To mitigate the loss ofcarbon stocks, a sustainable way ofmanaging land in the more intensivelymanaged agricultural domain is necessary.Agroforestry and other tree-based systemsallow the generation of income withcarbon stocks of 20-40% of the originalforest, depending on the managementregime chosen.
• Overall, management of logging activcitiesshould be the highest priority in efforts toreduce the on going loss of carbon stocks,while enhancement of the agroforest landuse form can provide a partial mitigatingeffect on the overall rate of carbon loss.For a further discussion of such options,however, the C stock data need to becombined with data on profitability,employment opportunity and returns tolabour, as is discussed in Chapter 5.


Introduction
Background
Forests harbour large carbon stocks.Undoubtedly, Kalimantan as one of thelargest islands in Indonesia and with vast areasof forest left but a rapid rate of decline inforest cover as well as forest quality, hasbecome a major focus in discussions on thedynamics of forest cover and the impacts oncarbon stocks and carbon sequestration.
The FORMACS project of CAREIndonesia in Kabupaten Nunukan wasestablished to test community based forestmanagement as an approach to enhance locallivelihoods and reduce negative current trendsof forest cover change. Carbon-stockmonitoring is needed to evaluate theeffectiveness of the project approach towardsthe goals and to establish a baseline of therate of change before the project became fullyeffective.
Remote sensing approaches are aneffective way to monitor landscape changesover time. By integrating the changes invegetation cover with carbon stocksmeasurements at plot level, changes in carbonstocks at a landscape level can be estimated.Two methods used for such studies: (i)approaches that relate quantitative pixel-levelinformation to carbon stocks as a basis for
spatial extrapolation, and (ii) approaches thatfirst classify the land cover according to landuse units and then convert to carbon stocks onthe basis of properties of the land use units.
Both methods have strengths andweaknesses, and mixed approaches arepossible. This study applied both approachesand assessed the level of uncertainty in both.
Objectives
The objectives of this study are:
• Analyze land cover changes from 1996 to2003 for Kabupaten Nunukan by comparingtwo independent remotely-sensed-derivedland cover maps for the respective years.
• Produce vegetation density maps throughthe analysis of a Normalised-DifferenceVegetation Index (NDVI) of the remotelysensed data.
• Relate the observation points of carbon-stock measurement to the NDVI at pixellevel as a basis for spatial extrapolation tothe whole landscape.
• Relate mean carbon stock estimates perland cover class to the changes in landcover for an alternative assessment oflandscape level carbon stocks
• Assess the strengths and weaknesses ofboth approaches on the basis of thencertainty in the underlying relationships,
35
4. LAND USE CHANGE IN NUNUKAN:ESTIMATING LANDSCAPE LEVEL CARBON-
STOCKS THROUGH LAND COVER TYPES ANDVEGETATION DENSITY
Atiek Widayati, Andree Ekadinata and Ronny Syam

36
Carbon stocks in Nunukan, East Kalimantan: a spatial monitoring and modelling approach
to advise on the method to be used infuture work.
Study Site
Kabupaten Nunukan is located at thenortheastern-most part of East Kalimantanprovince, covering six subdistricts (kecamatan),i.e Krayan, Lumbis, Sebuku, Sembakung,Nunukan and Sebatik (Figure 1.1). Most ofKabupaten Nunukan consists of theSembakung and Sebuku river basins (eachwith an 'upland' and 'lowland/coastal'Kecamatan Lumbis-Sembakung and Sebuku-Nunukan, respectively). The western mostsubdistrict, Krayan, drains to Malinau districtand is not accessible from the two main riversof Nunukan (Figure 4.1). It has a differentdynamic of forest cover change. For the moredetailed discussion of carbon stocks we willfocus on the Sembakung and Sebuku riverbasins.
Data
Image data used
Multitemporal Landsat images were used toproduce land cover maps of KabupatenNunu-kan. Acquisition date of each image isshown in table 4.1. Satellite image coverageover Kabupaten Nunukan area is shown infigure 4.2.
Spatial and spectral characters
Spatial resolution of Landsat images is 30 mwith 7 spectral channels, ranging from 0.45-0.69 m in the visible spectrum and 0.76-2.35m in the infrared spectrum. Each bandrepresents different characteristics ofwavelengths used to capture features on theearth surface (Table 4.2.).
Table 4.1 Image acquisition dates
Image path/row Series 1: Landsat 5/ETM Series 1: Landsat 7/ETM
117/057 December 29th, 1996 January 23rd , 2003
118/057 July 13th, 1996 May 22nd, 2003
118/058 August 17th, 1997 May 22nd, 2003
Table 4.2 Landsat image spectral characteristics (Lillesand and Kiefer, 1994)
Channels Wavelength (μμm) Characteristics and possible application
1 0.45-0.52 Provides increased penetration of water bodies Supports analyses of land use, soil, and vegetation characteristics
2 0.53-0.6 Corresponds to the green reflectance of healthy vegetation Sensitive in the region between the blue and red chlorophyll absorption bands.
3 0.63-0.69 Sensitive to red chlorophyll absorption of healthy green vegetation, therefore it is important bands for vegetation discrimination. Useful for soil-boundary and geological boundary mapping
4 0.76-0.9 Responsive to the amount of vegetation biomass Useful for identification of vegetation types, Emphasizes soil-crop and land-water contrasts
5 1.55-1.75 Sensitive to turgidity - the amount of water in plants. Discriminate between clouds, snow, and ice Able to remove the effects of thin clouds and smoke
6 10.4-12.5 Measures the amount of infrared radiant flux (heat) emitted from surfaces. Used in locating geothermal activity,
7 2.08-2.35 Discriminate between geological rock formations. Effective in identifying zones of hydrothermal alteration in rocks.

Land use change in Nunukan: estimating landscape level carbon-stocks through land cover types and vegetation density
37
Figure 4.1 Elevation map of Kabupaten Nunukan, East Kalimantan
Figure 4.2 Landsat images coverage

38
Carbon stocks in Nunukan, East Kalimantan: a spatial monitoring and modelling approach
Auxiliary Geospatial data (Maps)
Auxiliary geospatial data was required tosupport the analyses conducted in KabupatenNunukan. Four main types of informationneeded are topography, administrativedivisions, geology and land system. Table 4.3shows the list of maps used in this study.
Methods
Land cover classification and landcover change
Land cover change analysis was conducted onLandsat images using post classificationcomparison methods where information ofchanges is derived from multitemporal landcover maps. The flowchart of land coverclassification and change detection is shownin figure 4.3.
Image corrections
Radiometric correction
Raw, remotely sensed data captured by asatellite, provide information about object'sreflectance at the surface of the earth, whichare scaled to a range of number called DigitalCounts (DC) or Digital Numbers (DN).Along with the scaling process, somedistortion is caused by atmospheric scattering,variation in viewing angle, scene illumination,and instrument response characteristic(Lillesand and Kiefer, 1994 and Chavez,1996). Practically, the objective of a
radiometric correction is to remove theradiometric noises mentioned above.
Geometric correction
Satellite images usually contain geometricdistortion caused by several factor rangingfrom variations in altitude, satellite attitude,and velocity of the sensor platforms, tofactors such as panoramic distortion, earthcurvature, atmospheric refraction, reliefdisplacement and non-linearities in the sweepof a sensor's IFOV (Instantaneous Field ofView) (Lillesand and Kiefer, 1994). To correctthe distortion, a geometric correction has tobe conducted. Assuming that geometricdistortion on images used in this research arenon-systematic distortions, geometriccorrection was carried out by establishingmathematical relationship between pixels inthe image and the corresponding coordinatesof those pixels on the ground. Themathematical relationship was establishedbased on a set of Ground Control Point(GCP) derived from the topographic map.
Land cover classification
Land cover classification was conducted usingsupervised classification methods. Insupervised classification, training areas areused to define spectral patterns/signature fora specific land cover feature. The signaturewill then be used by a set of classifiers toidentify similar patterns of characteristics overall the area of interest. The result will be animage categorized into a number of landcover types.
Table 4.3 List of maps used in Nunukan study.
No Title Scale Source
1 Topographic map 1:50,000 Dit Top Angkatan Darat
2 Nunukan Spatial Planning Map - BAPPEDA Nunukan
3 Geology map 1:250,000 Pusat Penelitian dan Pengembangan Geologi
4 Land System Map 1:250,000 Transmigration Department

Land use change in Nunukan: estimating landscape level carbon-stocks through land cover types and vegetation density
39
Figure 4.3 Flowchart on land cover productionand change methods.
Training samples
Training samples for image classification wereobtained during field verification. GlobalPositioning System (GPS) was used to recordthe position of training samples. A total of 14land cover classes were identified during fielddata collection. The classes are shown in table4.4.
Classification procedures
Classification process to produce land covermap of Nunukan followed a hierarchicalclassification structure as shown in figure 4.5.The structure divided the classificationprocess into 3 levels where each level utilizeda different source of information combiningtraining sample's spectral signature from
Table 4.4. Land cover classes
No Land cover Class
1 Mangrove
2 Primary forest
3 Industrial timber plantation
4 Logged-over forest
5 Secondary forest
6 Old mixed garden (agroforest)
7 Young mixed garden (agroforest)
8 Young oil palm plantation
9 Shrub land
10 Cleared land
11 Settlement
12 Fish ponds
13 Water body

40
Carbon stocks in Nunukan, East Kalimantan: a spatial monitoring and modelling approach
satellite image and supporting informationderived from thematic maps.
The first level of the hierarchy aimed toclassify land cover classes based only onspectral characters derived from trainingsamples. Two of the classes, however, werelumped and needed to be separated on thesecond and third level using otherinformation. On the second level the twocomponents of the class "mangrove andprimary forest" were separated using thematicinformation from land system, geological andtopographic maps. In the broad group of"secondary forest" a number of distinctionswere made: Industrial plantations wereidentified using industrial concession maps ofKabupaten Nunukan, while old mixed gardenwas identified using its association withsettlement, road and river. Logged-over forestwas classified using thematic information
from forest concession map of KabupatenNunukan and the presence of logging tracks,which are clearly seen in Landsat images. Aremnant category of 'secondary forest' wasretained. Level 3 of the hierarchy split thelogged over forest category into classes, usingadditional information derived from monitoringsample plots in Kabupaten Nunukan.
Land cover change detection
Land cover change was detected by using thepost classification comparison method (Sunar,1998). The 1996 and 2003 classified images ofKabupaten Nunukan were overlaid andcompared to be able to quantify the changes.
Vegetation density mapping
In satellite images, the spectral response isprimarily sensitive to vegetation density (leaf
Figure 4.4. Land cover types in Nunukan; shrub land (upper left), young oil palm plantation (upper right),fishpond (lower left) and secondary forest (lower right). (Foto: PT Hatfindo Prima)

Land use change in Nunukan: estimating landscape level carbon-stocks through land cover types and vegetation density
41
Figure 4.5. Hierarchical classification structure
area index), as well as canopy shading and leafmoisture. As a vegetation develops from openland through various successional stages,visible reflectance decreases in the visiblespectrum due to the increased of leaf areaand absorption as well as through shadowingboth by and within the canopy. The maximumleaf area index is, however, reached muchearlier in succession than the maximum treebasal area and tree biomass. On the samecircumstances, near infrared reflectanceincreases due to reflectance from the canopy,transmission throughout the canopy andreflectance of the soil. (Coops, 1996).The dynamics of visible-infra red spectralresponse against vegetation density can bewell represented by a 'vegetation index'(Huete, 1998). This simple mathematicalcombination of the Red band and NIR band
has been found to be a sensitive indicator ofthe presence and condition of greenvegetation (Lillesand and Kiefer, 1994). Whilethere are several versions of such vegetationindices, the one that was used in this study isthe Normalized Differences Vegetation Index(NDVI).
NDVI calculation
The NDVI basically measures the slope ofthe line between the origin of red-NIR spaceand the red-NIR value of the image pixel.NDVI is calculated using the formula:
where NIR=value of near infra red channels;red=value of visible-red channel
NDVI = NIR - RedNIR + Red

The range of NDVI values are -1 to 1.Value of -1 to 0 is usually assumed as non-vegetation.
For this study, NDVI is presented aspercentage with the lowest original value (-1)presented as 0 and the highest (1) as 100.
Estimation of land cover under thecloud cover
High cloud cover in the images (up to 40 %)leaves the resulting land cover map with a"No data" value, which made it difficult toobtain land cover areas accurately and whichespecially created large gaps in the land coverchange analysis (as clouds covered differentareas in the subsequent images) as needed forlandscape level carbon-stock estimation. Anapproach with GIS techniques was tried toestimate the fraction and area of land coverunder the cloud-covered area using Landcoverinformation from the cloud-free area incombination with the other layers ofLandsystem and especially Elevation. Theflow diagram of the method is presented inFigure 4.6.
Landscape C-stock estimation
Two methods were used for estimating totalcarbon stocks on the basis of the spatial data.Method one used the land cover informationobtained as well as estimated from theprocedures above and multiplied the area ineach class with the typical abovegroundcarbon stock density [Mg C ha-1] obtainedfrom Chapter 2 (Rahayu et al., this volume;with a number of additions from the literaturefor land cover types not sampled locally).Method two established a relationshipbetween pixel level carbon stock and pixellevel NDVI as a basis for spatialextrapolation.
Method 1: extrapolation based on land covermap
The two-time snapshot landscape level carbonstock was basically done by re attributing theland cover map of the particular year withcorresponding plot-level carbon stock. Theexpected output was a carbon-stockestimation based on land cover.
The stepwise procedure was:
1. Re-interpretation of the land cover types inthe map to the land cover type definedfrom plot measurement, to find thecorresponding definition.
2. Re-attribute the land cover type with thecarbon density1 per land cover type fromthe plot measurements (table 4.5).
3. Area calculation of each land cover type, toachieve carbon budget for the theSembakung and Sebuku river basins inNunukan, for 1996 and for 2003.
Method 2: extrapolation of plots C-stockthrough vegetation density
To date, there is no method to measure tonsof carbon on the ground in landscape level.Correlation between NDVI and ground baseddata has yielded information about standingbiomass and is typically the approach toestimate carbon (Brown, 1996). Studies havebeen done to estimate biomass or othertree/vegetation biophysical characters usingspectral characteristics or transformations ofremotely-sensed data. Empirical approacheshave found strong relationship betweenspectral transformations and basal area and(log) tree density (Coops, 1996). Relationshipof spectral characters and biomass will reachsaturation as canopy closes. Gemmel &Goodenough (1992) in Coops (1996), saidthat stand basal area continues
42
Carbon stocks in Nunukan, East Kalimantan: a spatial monitoring and modelling approach
1 Throughout this paper, carbon density is used todescribe carbon stocks at plot level, while carbon stoclsrefer to carbon at landscape level

Land use change in Nunukan: estimating landscape level carbon-stocks through land cover types and vegetation density
43
Figure 4.6. Estimation of land cover types under cloud-covered areas
Table 4.5. Re-classification result of carbon stock estimation process (Rahayu et al., this volume)
No. Land cover type from image classification
Corresponding land cover type at plot measurement Carbon density (Mg ha-1)
1 Primary forest Primary forest 230.1
2 Logged over forest Logged over forest 201.3
3 Shrub Jakaw 0-10 yrs (logged, padi+secondary growth) 19.4
4 Secondary forest Jakaw >10 yrs (logged, padi+secondary grwoth) 58
5 Young mixed garden Agroforestry 0-10 tahun 37.7
6 Old mixed garden Agroforestry 11-30 tahun 72.6
7 - Imperata 4.2
8 Industrial plantation Acacia (Lasco et al., 1999) 88.1
9 Mangrove Mangrove (Lasco et al., 2000) 176.8
10 Young plantation Oil palm (Tomich et al., 1998) 91
11 Ricefield -
12 Fishpond -
13 Cleared land -
14 No data -
15 Settlement -
16 Water body -

to increase as the stand grows older but theremotely sensed signal is not affected by thisincrease because it is most effective to thedegree of crown closure which reaches 100%at an early age. As for LAI, relationshipbetween NDVI and LAI is curvilinear andreaches plateau at an LAI of ~6 forconiferous forest ( Spanner, Pierce et al., 1996,in Brown, 1996).
The emphasis of this method was to finda relationship between plot level C-stock withthe parameter(s) of remotely-sensed data,which is in this case NDVI representingvegetation density. Plot level data onaboveground C stocks are based on fourcomponents: tree biomass, understoreyvegetation, necromass and litter. NDVIessentially measures the greenness level ofvegetation, i.e the leaf components of treebiomass and understorey vegetation. The largefraction of the area with cloud cover and thusabsence of NDVI data, restricted the use ofmethod 2 to the cloud-free areas.
The stepwise procedure was:
1. Obtain NDVI values at the positions ofthe sample plots.
2. Analyze the statistical regression of plotlevel C stock on NDVI of the associatedpixel.
3. Apply the selected regression equation toestimate C stocks in all cloud-free pixelsand summarize the results for the theSembakung and Sebuku river basins inNunukan, for 1996 and for 2003.
Results and Discussions
Land cover
Land cover 1996
Image classification result of Landsat TM1996/1997 (figure 4.7) shows that forest wasstill a dominant land cover type in Kabupaten
Nunukan at that time. Classes of primary andsecondary forest comprise a total area ofalmost 9000 km2 or more than 55% of totalarea of Kabupaten Nunukan. The total areashould be considered as an underestimation asseveral areas is classified as "no data" due tocloud cover on the satellite image. Mangrovecovered more than 5% of the total study area,near the coastline and of Nunukan andSembakung Sub-districts. The area of "Nodata" covered almost 28% of total Nunukan'sarea in the 1996/7 image (table 4.6).
Land cover 2003
Figure 4.8 shows the classification result ofLandsat ETM 2003. Cloud cover on the 2003image was almost 42%, higher than the one in1996. Primary and secondary forest decreasedto about 44% of the district although they arestill the dominant land cover types in the area,while shrub increases to 320 km2 or almost2% of Nunukan.
Land cover estimation for cloud covered areas
The result of land cover estimation of cloud-covered area using land system and elevationmap in 1996 and 2003 is shown in table 4.8,respectively, for the Sembakung and Sebukuriver basins, covering approximately 1.1million ha out of the 1.6 million ha ofKabupaten Nunukan. With cloud-coveredremoval, in 1996, the area estimation ofprimary forest increased from 55.6% to 84%;for 2003, the estimated primary forestincreased from 28.9% to about 64%.
Land cover changes
Land cover change in the Sembakung andSebuku river basins in Nunukan over the1996-2003 period first of all indicates forestconversion. Primary forest decreased from915,183 ha in 1996 to 697,695 ha in 2003,which means about 24 % of the remainingprimary forest disappeared in 7 years (figure4.9); the equivalent yearly relative conversion
44
Carbon stocks in Nunukan, East Kalimantan: a spatial monitoring and modelling approach

Land use change in Nunukan: estimating landscape level carbon-stocks through land cover types and vegetation density
45
Table 4.6. Area summary of 1996 classified image
Table 4.7. Area summary of 2003 classified image
rate is 3.85%. A map (figure 4.10) of forestconversion maps suggests that most of theconversion took place close to the mainrivers. The mangrove zone was quite stable,covering 6% of the Sembakung and Sebukuriver basins along the coastline. The main
land cover class that replaced primary forestwas the generic 'secondary forest' class, withrelatively small increments for industrialtimber plantations, shrub and fishponds.

46
Carbon stocks in Nunukan, East Kalimantan: a spatial monitoring and modelling approach
Figure 4.7. Classified image of Landsat 1996/1997
Figure 4.8. Classified image of Landsat 2003

Land use change in Nunukan: estimating landscape level carbon-stocks through land cover types and vegetation density
47
Table 4.8A. Land cover 1996 of Nunukan after cloud removal
Table 4.8B. Land cover 2003 of Nunukan after cloud removal
Figure 4.9. Land cover change of Sembakung and Sebuku river basins in Nunukan in 1996-2003

48
Carbon stocks in Nunukan, East Kalimantan: a spatial monitoring and modelling approach
Vegetation density
From the NDVI calculation, two NDVI mapsare obtained and are shown in Figure 4.11.NDVI varied between 50 and 99, with onlyvery few pixels with NDVI of less than 50(non-vegetated).
The uneven cloud cover areas of 1996 and2003 make it difficult to compare thedistribution precisely, but large areas inSebuku with NDVI values in the 70-99 rangein 1996 shifted to the 60-70 range in 2003.
Images were not calibrated to variousatmospheric and seasonal factors (the eastimage and west image were from differentseasons) and therefore, the range of NDVIresulted was affected.
Difference in season caused a discrepancyin the NDVI calculation, due to differentwater content of the vegetation, although landcover did not change. Another factor washaze, which caused imperfect NDVI calculation
(lower NDVI resulted). This case is clearlyseen in west Lumbis with low NDVI (40-50),while most of those areas are still forest.
Landscape C-stock estimation
Land-cover-derived carbon stock estimation
The carbon density map (Figure 4.12) derivedfrom the land cover classes and the typical Cdensities (Table 4.5) indicates a substantialdecrease over the 1996-2003 period, especiallyalong the rivers in the central part ofKecamatan Sebuku.
The total carbon budget estimated fromland cover was obtained from the total areasof each land cover types, which include theones estimated under the cloud cover. In theSembakung and Sebuku river basins inNunukan the total carbon stock wasapproximately 228 Tg2 in 1996 and 189 Tg in2003, which means a 17% decrease in seven
Figure 4.10. Forest change map of Sembakung and Sebuku river basins in Nunukan
2 1 Tg= 1012 g

Land use change in Nunukan: estimating landscape level carbon-stocks through land cover types and vegetation density
49
Figure 4.11. Vegetation density (NDVI) in of Sembakung and Sebuku river basins in Nunukan in 1996/7 (upperpanel) and 2003 (lower panel) and the distribution of carbon-stock measurement plots.
years. Mean carbon stock density decreasedfrom 209 to 174 Mg ha-1, mostly due to theconversion of 217,000 ha of primary forest toother uses. The loss of C stock (17%) is lessthan the loss of primary forest (24%).
The geographic distribution of forestconversion, and thus carbon-stock decrease, ishard to be precisely described due to thecloud cover, but in general it can be seen that
Kecamatan Sebuku has been experiencingforest loss substantially into jakaw, loggingand new plantations. In Kabupaten Nunukan,the coastal areas are more or less stable withthe existence of mangrove. However, thenorthern part also shows forest degradationand opening to other uses. These conversionsexplain the subdistrict's contribution to thedecrease of carbon stock.

50
Carbon stocks in Nunukan, East Kalimantan: a spatial monitoring and modelling approach
Vegetation density-derived carbon-stockestimation
Reference carbon density from plot measurements
Only 26 plots in cloud-free areas of theLandsat image could be used for theregression of NDVI on aboveground carbonstock (Appendix 1). The plots with the
highest NDVI were agroforest and Jakaw leftfor fallow for > 6 years ( NDVI >=69).These high values are expected and comefrom relatively dense canopy cover from thegrowing trees in the plot. Logged over forestalso had high NDVI (67-69). Jakaw plots witha short fallow period corresponded to a widerange of NDVI values (45 - 67).Unfortunately, all the forest plots are located
Figure 4.12. Distribution of land cover-derived carbon density in of Sembakung and Sebuku river basins inNunukan in 1996/7 (upper panel) and 2003 (lower panel).

Land use change in Nunukan: estimating landscape level carbon-stocks through land cover types and vegetation density
51
under the cloud-covered areas, and no NDVIvalues of those plots can be obtained.Relationship between plot carbon density andNDVI values are presented in Figure 4.13.
The relationship between NDVI andcarbon stock was distinctly curvilinear and alogarithmic transformation of the C stockdata was needed to meet the assumption forstandard regression analysis of uniformvariability. While carbon density keepsincreasing with increments of woody biomassand growth of trees, NDVI values showsaturation at the values of 70 as leaf areaindex reach a maximum. For the data set as awhole only 54% of the variation in thelogarithm of measured carbon density can beattributed to variation of NDVI values. Asthe data suggest two phases on therelationship, a restriction of the NDVI rangeto values above 60 was attempted. Thisrestriction improves the evenness of variation,but reduces the percentage of total varianceaccounted for. For further calculations theregression equation used was:
As the exponential equation relates to thelogarithm of measured C stock, its use forpredicting C stock can be expected to
underestimate the mean value. In fact themean of the 'predicted' value for thecalibration points was only 52.8% of themeasured values (and 59.7% if the restrictionto NDVI > 60 was used). Applying thisequation to estimate landscape level carbonwill result in underestimation of carbon stock.Although the regression was derived for theNDVI values of 2003, it was applied as suchto the 1996/1997 data, ignoring possibledifferences in NDVI due to season andhaziness of the images (Figure 4.14).
Direct comparison with method I ispossible only for the cloud free areas, orapproximately 738,000 ha for 1996 and522,000 ha for 2003. For these areas, NDVI-derived carbon stocks suggest a dramaticdecrease from 1996 to 2003. In 1996, theaverage estimated carbon-density was 222 Mgha-1, while in 2003 it was only 27 Mg ha-1
(Table 4.9).
Figure 4.13. Relationship between NDVI and aboveground carbon-stock (logarithmic scale); left panel for thewhole data set, right panel restricting the values to NDVI >60
Carbon density [Mg ha-1] = 0.0019*e 0.1462*NDVI
Table 4.9. Comparison of C stock estimates for1996 and 2003 based on two methods
Year Land-cover derived average carbon density [Mg ha-1]
NDVI-derived average carbon-density [Mg ha-1]
1996 210 222
2003 166 27

52
Carbon stocks in Nunukan, East Kalimantan: a spatial monitoring and modelling approach
Comparing carbon-stock estimates from landcover maps and from vegetation density
For 1996 the results of the mean C density inthe cloud-free area show only a slightdiscrepancy between two methods, while for2003 a big difference was found. A number offactors may contribute to this difference:
• For NDVI-derived carbon-stockestimation, the results are generally anunderestimation, due to the low correlation
between NDVI and measured carbondensity, and the high variability of carbondensity for the high values of NDVI ( >70%), in which carbon density varies from50 to 250 Mg ha-1. The non-linear aspect ofthe NDVI-C-stock regression line leads toa bias in the C stock results, as discussedbefore.
• For the land cover-derived carbon stock,accuracy of the land cover maps still needto be done using ground truth check (with
Figure 4.14. NDVI-derived carbon density of the Sembakung and Sebuku river basins in Nunukan in 1996(upper panel) and in 2003 (lower panel)

Land use change in Nunukan: estimating landscape level carbon-stocks through land cover types and vegetation density
53
sample points that have not been used fordefining the interpretation key).Verification of the resulted carbon densitymight also be conducted using independentC-stock measurements.
• The NDVI values for 1996 wereconsiderably higher than those for 2003due to a difference in season (watercontent of the vegetation) and generalimage quality (haziness), also for the forestland cover types that must have been in thesame category in 1996 as they were in2003. Yet, the NDVI regression line wasestablished on 2003 data only and in factmost pixels in the 1996 data series wereoutside of the calibration domain,requiring extrapolation (with a weaklydefined regression line). The similarity inresults for 1996 may thus be based on acoincidence, with two types of errorcanceling each other, rather than ongenuine agreement between the methods.
Conclusions
The main conclusions of this study are:
1. Land cover change from 1996 to 2003 inKabupaten Nunukan has been substantial,with an estimated 3.85% year-1 ofconversion to other land cover types of theremaining primary forest.
2. Maps of vegetation density based on theNormalised-Difference Vegetation Index(NDVI) suggest an even more drasticchange between the two observation times,but a number of technical difficulties withthe method (differences in season andhaziness of the images) are at least partiallyresponsible for this difference.
3. Carbon-stock estimates based on NDVI atpixel level and a regression line of carbonstock on NDVI differ essentially fromthose based on spatial extrapolation of theland cover type of sample points to thewhole landscape.
4. Using corrections for cloud-covered partsof the landscape, mean carbon stockdensity in the Sembakung and Sebuku riverbasins in Nunukan (i.e. the whole districtminus the western most subdistrict)decreased between 1996 and 2003 from211 to 175 Mg ha-1, mostly due to theconversion of 217,000 ha of primary forestto other uses. The loss of C stock (17%) isless than the loss of primary forest (24%),as the resultant land cover types still retainpart of the carbon stocks.
5. The main uncertainties in the overallestimates based on land cover types derivefrom the uncertain nature (and probablylarge internal variability) of the 'secondaryforest' category in the land coverclassification, as well as from the possibilityof changes with time in typical carbonstock density within the main land covertypes (esp. for categories such as 'logged-over' forest or agroforest), linked tochanges in the intensity of land use withineach of the categories.
6. Although a direct derivation of C stockfrom the remotely sensed images hastheoretical advantages over estimationbased on land cover classes, the nature ofthe relationship between leaf-area basedindices such as NDVI and the largelywood-based C stock, make the methodvery vulnerable in practical application aswell as subject to a bias that will requirefurther statistical techniques to beovercome.


Introduction
Global warming is caused by the rapidincrease of green-house-gasses in theatmosphere, especially through carbon dioxideemission from the use of fossil fuels as well asforest and peatland conversion. Net emissionsof carbon dioxide to the atmosphere can bereduced through effective protection ofremaining terrestrial C stocks, and bysequestration in regrowing vegetation, wherecarbon is stored as biomass, necromass or soilorganik matter and peat. The globalatmospheric circulation system is a 'publicgood', and global impacts of local carbonemissions or its net storage are the basis ofthe current discussion on emission controland on the Clean Development Mechanism.Tropical forests are a major store of carbon,which is under threat as the conversion ofnatural to financial capital is the mostrewarding livelihood option, in the form oflogging and its subsequent degradation.Externally driven processes to 'cream off' localresources, coupled to a lack of tenure securityfor local people are thought to be the mainfactors in forest depletion - but legal or illegallogging provides jobs and local employmentthat is at risk with logging bans (Casson andObidzinski, 2002). Alternative livelihoods thatare compatible with protection or enhancingof carbon stocks require a long term visionon, supported by security of access to, the
landscape level resources, but they need to bebased on sufficiently rewarding (self)employment at any point in time.
Carbon extraction is an externality (aconsequence not taken into account by thedecision makers) of human activities that arepart of livelihood strategies and itsconsequences can only be sensed at blurredglobal resolution as a "creeping normalcy"1,resulting in a "consequences amnesia" insociety. Thus, when feedback loops are put inplace through initiatives to maintain carbonstocks through incentives to people on theground, it is important that we firstunderstand people's livelihoods, as they reflecttheir knowledge on survival and theirperception about risk and benefit.
When existing options are dominated bycarbon-harvesting-based livelihoods, effortsare needed to find carbon-saving livelihoodsthat still benefit local people. The FORMACSProject aimed to achieve both benefits:improving people's well-being while increasingcarbon sequestration in an ex-logging area ofNunukan, East Kalimantan, by promotingtwo main alternatives: Community BasedNatural Resource Management (CBNRM) andLow External Input Sustainable Agriculture(LEISA), see Chapter 1.
55
5. SCENARIO STUDIES OF LAND USE INNUNUKAN, EAST KALIMANTAN (INDONESIA):
DRIVERS, LOCAL LIVELIHOODS ANDGLOBALLY RELEVANT CARBON STOCKS
Desi Ariyadhi Suyamto and Meine van Noordwijk
1 Slow trends concealed within noisy fluctuations(Diamond, 2005)

56
Carbon stocks in Nunukan, East Kalimantan: a spatial monitoring and modelling approach
The basic requirements of offering (self)employment at attractive returns to labour forthe existing population density, while meetingsubsistence needs for food, clean water andother services can be met in multiple ways. Aconsistent way of comparing scenarios ofchange and their predicted impacts on carbonstocks and income is needed.
According to Peterson et al. (2003),scenario planning is a systematic methods forthinking creatively about possible complexand uncertain futures. The central idea is toconsider a variety of possible futures thatinclude many of the important uncertaintiesin the system rather than to focus on theaccurate prediction of a single outcome. Itbegins with identification of a central issue orproblem. This problem is then used as afocusing device for assessment of the system;assessment is combined with the key problemto identify key alternatives.
In assessing the accomplishment of theproject in meeting its main goal, threeimportant questions were raised:
1. can the project alleviate people's povertywhile increasing carbon stocks in the area?,
2. can people adopt CBNRM and LEISA andperceive them as their new profitablelivelihoods?,
3. are there tradeoffs between globalenvironmental benefits and localobjectives? (Tomich, et al., 2001).
Certainly, these questions cannot beanswered within the time frame of theproject, since they deal with larger scales andlonger time frames. They require a systematicapproach that is able to extrapolate theassessment results from plot to landscape,from household to community, and from thepresent to an uncertain future.
Models can be used as a tool to do ex ante(prospective) analysis (Fig. 5.1). Modelsrepresent a conceptualisation of our currentunderstanding of the interactions in a system,based on hypotheses on the underlyingprocesses. Responsible use of models insocietal negotiation processes requires thatmodels are evaluated through confronting thedata patterns resulting from simulation withthe data patterns from direct observation.While the basic scheme of 'drivers','responses' and 'consequences' applies tomany types of model, including the ones thatare essentially regression equation (in Y = a +b X, X is the driver, b is the response and Ythe consequence). Here we are particularlyinterested in models where the responsesinclude feedback loops themselves and
Figure 5.1. Generic structure of a model that translates 'driver' or exogenous variables to the time boundresponses in a landscape, which has consequences ('externalities' in as far as they are not part of the feedbackloops in the dynamic section) for criteria and indicators of system performance; scenarios refer to specificcombinations of driver variables that represent changes in higher level systems.

Scenario studies of land use in Nunukan, East Kalimantan (Indonesia): Drivers, local livelihoods and globally relevant carbon stocks
57
represent levels of 'endogenous' structure.Such models can degenerate to essentiallyregression models if the validation stepinvolves extensive curve fitting on the overallmodel. Such curve fitting may enhance theprecision of the model in interpolation mode,but will reduce the confidence we have in useof the model for extrapolation to newcircumstances.
This paper describes an application of theFALLOW Model (van Noordwijk, 2002) inexploring possible patterns of tradeoffsbetween local benefits (income per capita) andglobal risks (carbon stocks) for theFORMACS project case in East Kalimantan.Prior to that, the model's validity is testedusing data from the study site.
Objectives
1. Exploration of scenarios for the drivers ofland use change, their plausible impact on localland use decisions and income per capitaand logical consequences for carbon stocks.
2. Test of the suitability of the FALLOWmodel for this purpose.
Core of the FALLOW Model
The FALLOW Model is a spatially explicitmodel of landscape dynamics (Figure 5.2). Itis expected to capture annual dynamics ofpeople's livelihoods on a landscape bysimulating: (i) how those livelihoods extractnatural stocks, (ii) how the natural stocksreplenish, (iii) how people learn about the
Figure 5.2. Key relationships considered in the main dynamic loop of the FALLOW model (land utility, localeconomy and land use decision) that determine the spatial pattern of land cover, and the modules that translatethis pattern into consequences for environmental service functions such as C storage. External 'drivers' (smallloops) may take a role in the dynamics by affecting local response through trading (e.g. market policy made bydistant agents), knowledge (e.g. extension conducted by distant agents), decision-making process (e.g. land usepolicy made by distant agents) or land utility (e.g. weather variability as results of global climatic processes).

benefits of existing livelihood options, (iv) howthey make deliberate decisions regardingutilization of human and natural capitals, and(v) what are the consequences on suchlandscape dynamics processes.
Extraction of natural stocks and theirrenewal
Livelihood strategies are ultimately tested bythe long-term survival of the decision makers(Diamond, 2005). Where the decision makershave the opportunity to move to otherlocations or activities after local exhaustion ofresources, we need to expand the boundariesof the system under consideration.
Sustainable use of natural stocks(including carbon) depends on achieving abalance between the rate of renewal and therate of harvest after an initial phase ofbenefiting from the accumulated stockscurrently in the system. However, depletion ofnatural stocks below the level where renewalis efficient has been part of human legacy inmany parts of the world. Overexploitationcan be based on lack of awareness (a true'externality' in the decision making) or lack ofcare (too low weighting in the decisionmaking) for the known consequences.
With regards to the degree of harvestingcarbon, we may have livelihood options thatextract carbon stocks in relatively big amount(e.g. logging and land clearing for agriculture),in medium amount (e.g. agroforestry,monoculture plantation), in small amount (e.g.NTFP), and in almost zero amount (e.g. offfarm jobs). Logging extracts large amount offorests' carbon through tree extraction andinduced mortality of damaged trees.Agriculture not only depletes abovegroundcarbon stock through land clearing, but alsoreduces belowground carbon stocks, as thereturn of organic residues to the soil is lessthan the rate of decomposition.
In the Trenbath Model that forms thebuilding foundation of FALLOW (van
Noordwijk, 2002), it is assumed that soilfertility is rapidly depleted during croppingperiods and can be restored slowly duringfallow periods. Agroforestry and monocultureplantations extract small amount of carbonduring production/development periods, butthe extraction is relatively big during land-clearing/regeneration periods.
Replenishment of aboveground carbonstock depends on vegetation processes ofgrowth and succession, which is constrainedby (i) access of the vegetation to resourcessuch as light, nutrients or water, (ii) by thespecies composition of the vegetation and (iii)by developmental processes (e.g. aging). Inman-made ecosystems (e.g. monocultureplantations, agroforests), some of theselimiting factors can be controlled throughmanagement (e.g. pruning, weeding, spacearrangement, etc.).
Belowground carbon stocks (i.e. soilorganic matter) are replenished throughcarbon organic inputs from litter produced byaboveground stocks, depending on residencetime in the litter layer that defines the chancefor decomposition. Most agriculture practiceshave no chance to self-recover their inherentsoil fertility. In modern agricultures, fertilizerapplication is the preferred but costly solutionin maintaining soil fertility. Conclusively,replenishment of natural stocks depends onland management or people's decision tofallow their lands.
Perception on livelihood benefits andlearning styles
The model assumes there are two payofftypes used by people in measuring livelihoods'benefits: (i) expected returns to labour($/person.day) and (ii) expected returns toland ($/ha). People's measures of livelihoods'benefits are expressed as expectation,expressing their knowledge on perceived riskand perceived benefit as they learnt from theirown experience (experiential learning). Thus,perceptions of risk and benefit are not always
58
Carbon stocks in Nunukan, East Kalimantan: a spatial monitoring and modelling approach

Scenario studies of land use in Nunukan, East Kalimantan (Indonesia): Drivers, local livelihoods and globally relevant carbon stocks
measured using a bank interest rate as thestandard to measure future uncertainty.
In their autonomous-learning, people maydiffer in their learning styles. In FALLOWmodel, this is reflected in "knowledge-updating fractions", which express thefraction of new information that will beconsidered to update their current knowledge− or alternatively, in the amount of pastknowledge that is retained. Some people maytend to rely on the most recent informationmore than on previous experience, but othersmay behave in the opposite way. A village maybe composed of relatively conservative peoplewho tend to conserve their existingknowledge and some fraction of relativelyprogressive people who tend to quickly trustthe most recent information as the futurebelief (almanac) and forgetting the past.
When the success rate of all peoplesdecisions is visible within the community, itgives a chance for others to learn fromcommon experience. Thus, knowledgeevolution at village scale is formed by twocontrasting type of learning people:conservatives and experimenters. Knowledgemay also be updated by audio-visualinformation through education and extension.At a larger scale, people's knowledge in oneplace can be influenced by people'sknowledge elsewhere. Especially where tree-based production systems are involved, withtheir long lag times between planting andproduction, the rate of diffusion ofinnovations within and among localcommunities is an important determinant ofthe overall impact.
Having an explicit role for 'extension' inthis modelling approach allows us to makeprogress on the complex domain of'attribution' of the change in complex systemsto specific actors - as is often needed inimpact assessment. In innovation diffusiontheory, experimenters are termed as earlyadopters, occupying relatively small fraction ofpopulation in a community, while
conservatives are termed as early majority, latemajority or laggards, dominating thecommunity (Gladwell, 2000). The term'innovator' in this theory is considered asextension agent in FALLOW model.
Allocation of land and labour overland use options
Selecting land use practices from availableoptions is a matter of deliberation on the risk-benefit balance of each option. Thus, it ismuch influenced by people's knowledge andtheir learning style. The model distinguishedbetween strategic decisions (multi-yearconsequences) on 'land use systems' and tacticaldecisions on labour allocation across the landuses actually present in the farmed landscape.
Land will be allocated for each land useoption in relation to expected returns to land($/ha). At higher expected returns to land($/ha), people tend to allocate a higherfraction of their available space for this typeof practice. When expected returns to land($/ha) exceed the actual returns to land of theexisting plots ($/ha), people will expand theland to satisfy their expectation. In somecases, land expansion is not driven by market,e.g. expansion of food crop agriculture isdetermined by food requirement. Moreover,decisions to fallow or to renew the plot isaffected by people's measure in definingmarginal land, when the actual returns to landon a plot ($/ha) is less than the expectation.
In the FALLOW model, the allocation ofthe available labour resource in any time stepis linked to the currently expected returns tolabour ($/person.day) for all optionsconsidered. At higher expected returns tolabour ($/person.day), people tend to allocatehigher fraction of their available labour forthis type of survival. A simple proportionalitybetween expected returns and resourceallocation can be used, as well as decisionschemes that are skewed towards the 'best bet'(as currently conceived) option. In the modellabour allocation to local food production can
59

60
Carbon stocks in Nunukan, East Kalimantan: a spatial monitoring and modelling approach
exceed the 'rational choice' based on expectedrelative returns to labour, reflecting risk avoid-ance behaviour aimed at avoiding food-crises.
In selecting a plot for expanding their lands,people will consider some spatial determinantsthat depend on the plot's attractiveness. It isrelated to the current plot's utility values (e.g.soil fertility, yields), expansion-costs (e.g.travelling-related distance, slope, and easinessfor land-clearing), land control (e.g. distancefrom settlement and distance from existingplots) and land tenure (private or public lands).
Methodology
To use FALLOW Model as a tool to simulatethe dynamics of landscape people's livelihood
in Nunukan, the following steps were carriedout:
• selecting a validation site;• parameterising the model;• validating the model; and• performing simulations based on plausible
scenarios.
Results
Validation site
Before applying the model, validation wasconducted to evaluate model performance incapturing land use change dynamics. A subsetof the area in Sebuku with a size of 24,656 hawas used as a site to validate and apply the
Figure 5.3. Validation site for modelling exercise within the study area of Sebuku-Sembakung, Nunukan. The sitecovers the area of 24,656 ha in Sebuku.

Scenario studies of land use in Nunukan, East Kalimantan (Indonesia): Drivers, local livelihoods and globally relevant carbon stocks
61
model (Figure 5.3). This site was chosenbecause of its relatively cloud-free conditionas captured by the Landsat images in 1996and in 2003 (see Widayati et al. in Chapter 4).The land cover map of the site in 1996 wasused for model initialisation. Eight-yearsimulation result was then compared to theland cover map in 2003. Logging, agricultureand agroforestry are the dominant land useoptions in this area.
Model parameterization
Most parameters were derived from field andhousehold surveys conducted by the project
(see Chapter 2 by Wijaya et al. for detail onsocio-economic survey results and Chapter 3by Rahayu et al. for biophysical survey results).Other parameters were estimated fromsecondary data.
Forests dynamics
Average of total above ground biomass fromfallowed plots at 1, 2, 3, 4, 5, 6-10, and >10years old, as well as from primary forests wasused to determine time bounds of naturalforests succession. The assumed age forprimary forests is 325 years old (estimated
Figure 5.4. Total aboveground biomass as afunction of age to derive parameters relatedto vegetation succession in natural forests.
Table 5.1. Length of time (in years) for different stages of logged-over-forest and statistic of its abovegroundbiomass
State Time Bound (yrs after the first logging)
min (t/ha)
max (t/ha)
mean (t/ha)
sd (t/ha)
Logged-over 1 2 406.1 644.7 528.6 119.5
Logged-over 2 7 248.9 654.6 390.5 228.9
Logged-over 3 21 411.4 523.4 467.4 79.2
Logged-over 4 41 256.7 575.0 438.8 164.1
Table 5.2. Parameters describing natural forest succession and statistic of its aboveground biomass
State Time Bound
(yrs) min
(t/ha) max (t/ha)
mean (t/ha)
sd (t/ha)
Pioneer 1 17.3 96.7 59.71 26.94
Young Secondary 10 104.8 316.6 224.03 62.85
Old Secondary 51 320.1 487.5 429.05 47.86
Climax 159 488.0 510.8 505.00 6.16

62
Carbon stocks in Nunukan, East Kalimantan: a spatial monitoring and modelling approach
from Mackinnon et al., 2000) at this age gaplevel rejuvenation reaches an equilibrium.Figure 5.4 shows measured biomass (triangles)and its fitting model (dotted line), estimatedusing general asymptotic function y=ymax(1-exp[-β xγ])η (Vanclay, 1994). The best fittingcurve was obtained for ymax= 511.394, β=0.006, γ= 1.220, η= 0.650, withRMSE=12.40. Time bounds for logged-overforests were parameterised using data fromfield survey (Table 5.1). Table 5.2 summarizesthe statistic (min, max, mean and sd) of totalaboveground biomass in natural forest. Forthe initialization at pixel level we used anormal distribution with the mean andstandard deviation as indicated, truncated atobserved minimum and maximum.
As shown by Table 5.1, time after the firstlogging (years) didn't correspond directly toaboveground biomass' increment in logged-over forests. Thus, the increment ofaboveground biomass in forests was notestimated based on succession age (as
dAGBiomass/dt), but based on current stateof its aboveground biomass relative tomaximum aboveground biomass in primaryforests (AGBiomass/AGBiomassRef). Anasymptotic curve was applied to construct a relational graph between abovegroundbiomass increment and AGBiomass/AGBiomassRef, with ymax=0.003, β=1, γ=1.6,η=-1.2, and RMSE=0.02 (Figure 5.5). Theaboveground biomass increment is defined as[AGBiomasst-AGBiomasst-1]/ AGBiomasst-1.
The fraction of tree-biomass wasestimated from its correlation to totalaboveground biomass, based on an asymptoticcurve with ymax=0.90, β=0.001, γ=2.27, η=1,and RMSE=0.13 (Figure 5.6). Tree-standingstocks (m3/ha) is estimated as 1.48 times fromits tree-biomass (t/ha), based on thecorrelation shown in Figure 5.7. In this case,tree-standing stocks (m3/ha) was estimatedusing a cylindrical factor (cf) of 1. Treestanding stocks are defined as the componentof tree (mostly timber) that is harvestable.
Figure 5.5. Annual increment of aboveground biomass in natural and logged-over forests was estimated from itscurrent state relative to maximum aboveground biomass in primary forests (510.8 t/ha, see Table 5.2).

Scenario studies of land use in Nunukan, East Kalimantan (Indonesia): Drivers, local livelihoods and globally relevant carbon stocks
63
Figure 5.6. Curve fitting toestimate the tree componentsof forests' total biomass.
Figure 5.7. Tree standingstocks (harvestable wood) inforests as a function of treebiomass.
Figure 5.8. Fraction ofharvestable trees (large tree)that exist in the forest as afunction of standing stock.

64
Carbon stocks in Nunukan, East Kalimantan: a spatial monitoring and modelling approach
Figure 5.9. Total abovegroundbiomass as a function of age inagroforestry systems.
Table 5.3 Parameters describing agroforestry development and statistics of its aboveground biomass
State Time Bound
(yrs) min
(t/ha) max (t/ha)
mean (t/ha)
sd (t/ha)
Pioneer 0 0.0 49.4 25.29 24.74 Early production 3 68.9 120.3 96.81 20.36 Late Production 8 128.5 166.8 153.21 12.27 Post Production 21 167.7 171.7 170.11 1.32
Logging is assumed to extract large trees.Fraction of large trees (dbh > 30 cm) wasestimated from its standing stocks (m3/ha),based on asymptotic curve with ymax=0.83,β=0.005, γ=1.05, η=15, and RMSE=0.25(Figure 5.8). Measured data were the replicate-average from primary forests, fallowed plotsand logged-forests. A clear outlier was givenby the measured data from fallowed plots at6-10 years old. It probably reflects remnantlarge trees that have survived during the landclearing and cropping stage and are found atlow density in the fallow system with a treediameter that differs substantially from thesurrounding vegetation.
Agroforesty systems dynamics
Average total above ground biomass fromagroforestry plots at 0-10, 11-20, 21-30 yearsold was used to determine the time boundson agroforestry development. Figure 5.9shows measured biomass (triangles) and itsfitting model (dotted line), based on asymptoticcurve with ymax=172.87, β=0.2, γ=0.95,η=1.1, and RMSE=7.68. Table 5.3 summarizesthe statistic (min, max, mean and sd) ofagroforestry systems biomass in each develop-ment stage. For the initialization at pixel levelwe used a normal distribution with the meanand standard deviation as indicated, truncatedat observed minimum and maximum.

Scenario studies of land use in Nunukan, East Kalimantan (Indonesia): Drivers, local livelihoods and globally relevant carbon stocks
65
Figure 5.10. Annual increment ofaboveground biomass inagroforestry system was estimatedfrom its current state relative tomaximum aboveground biomass inthe oldest agroforesty system(171.7 t/ha, see Table 5.3).
The annual increment of abovegroundbiomass in agroforests was estimated basedon current state of its aboveground biomassrelative to maximum aboveground biomass inold agroforests (AGBiomass/AGBiomassRef).An asymptotic curve was applied to constructrelational graph between abovegroundbiomass increment and AGBiomass/AGBiomassRef, with ymax= 0.0014, β=0.09,γ=2.7, η=1.11, and RMSE=0.09 (Figure 5.10).The aboveground biomass increment isdefined as [AGBiomasst-AGBiomasst-
1]/AGBiomasst-1.
Yields from agroforestry systems dependon tree-biomass and age. The fraction of tree-biomass was estimated from its correlation to
Figure 5.11. Curve fitting to estimatethe tree components of agroforestrysystems' total biomass.
Table 5.4. Six dominant species that composedagroforestry (mixed-fruit garden) in Sebuku.
Sebuku Rank
Species Occurrence Probability
1 Coffe 0.37 2 Rambutan 0.31 3 Langsat 0.31 4 Elai 0.29 5 Banana 0.11 6 Durian 0.11

66
Carbon stocks in Nunukan, East Kalimantan: a spatial monitoring and modelling approach
total aboveground biomass, based onasymptotic curve with ymax=0.91, β=0.0055,γ=2, η=2.1, and RMSE=0.04 (Figure 5.11).
The main type of agroforestry systemsfound in Nunukan is mixed-fruits garden. Inparameterizing agroforestry yields, sixpredominant species, i.e. rambutan, banana, elai(wild durian), langsat, coffee and durian, wereselected based on their probabilities ofoccurrence, summarized from householdsurvey results (Table 5.4).
Annual yield from each species (t/ha/year)was estimated as fraction relative to itsaboveground biomass. Yield fractions of treespecies (rambutan, elai, langsat, coffee anddurian) were estimated based on tree-biomass,while banana is estimated from non-treeaboveground biomass (Table 5.5). Agingfactors were added as modifiers at eachdevelopment stage. In this study, aging factorsof 0.1, 1, 0.75, 0.2 are used as yields modifiersat pioneer, early production, late productionand post production stages respectively.
Table 5.5. Agroforestry systems' yields were estimated from tree-biomass and non-tree abovegroundbiomass.
Species Rambutan Banana Elai Langsat Coffee Durian
Biomass (t/ha) 15.25 (tree)
1.26 (non tree biomass)
8.60 (tree)
12.22 (tree)
2.66 (tree)
24.96 (tree)
Yield (kg/ha) 318 303 1321 222 38 895
Yield fraction 0.0209 0.2397 0.1536 0.0182 0.0145 0.0358
Table 5.6. Statistic of initial soil organic matter (t/ha) at various land cover types.
Soil organic matter (t/ha) Land cover type
min max mean sd
Pioneer forests 0.00 38.30 22.42 14.58
Young secondary forests 40.23 57.95 53.20 4.81
Old secondary forests 58.02 59.65 59.27 0.42
Primary forests 59.65 59.73 59.71 0.02
Logged-over forests 1 59.22 59.93 59.65 0.37
Logged-over forests 2 56.23 59.94 57.68 1.98
Logged-over forests 3 59.26 59.76 59.51 0.35
Logged-over forests 4 56.51 59.86 58.67 1.87
Pioneer agroforests 0.00 29.62 16.56 15.12
Early production agroforests 35.56 45.90 41.55 4.11
Late production agroforests 47.06 51.29 49.91 1.34
Post production agroforests 51.38 51.72 51.58 0.11
Table 5.7. Annual depletion rate and conversion efficiency of rice fields.
Fallow age (yr)
Total biomass (t/ha)
Estimated SOMC Stock
Depleted SOMC
Rice yield (t/ha)
Depletion Rate
Conversion Efficiency
1 2.44 3.67 0.47 0.80 0.41 1.68
2 5.05 6.27 0.81 2.43 0.04 2.99
3 5.32 6.52 0.84 3.14 0.02 3.73
4 5.50 6.67 0.86 2.96 0.04 3.43
5 5.83 6.96 0.90 3.06 - 3.40
Average crop conversion efficiency 3.04
Average depletion rate 0.13

Scenario studies of land use in Nunukan, East Kalimantan (Indonesia): Drivers, local livelihoods and globally relevant carbon stocks
67
Soil fertility and agriculture productivity
Assumptions underlying the estimate ofannual organic matter input to the soil invarious land cover types in Jambi, Sumatera(Susilo et al, 2004) are used to estimate soilorganic matter input from abovegroundbiomass (Figure 5.12). Belowground stockswere initialised using this relational curve, assummarized in Tabel 5.6. Food crop (rice)productivity was estimated from fallow plots(jakaw) as summarized in Table 5.7.
People's knowledge and deliberation
Not all parameters to initialize people'sperception on livelihoods' benefits werederived directly from the socio-economicsurvey data. Some of the parameters wereestimated by combining available informationwith secondary data (summarized in Table5.8). Expected return to labour on food-cropagriculture was estimated from data on food-crop agriculture area as captured by landcover map in 1996 (6 ha), and socio-economicdata from household survey: annual labourinput per ha (person.day ha-1 yr-1 ), rice yieldaverage per ha (317 kg/ha) and rice price (Rp.4,250/kg). The last two values were also usedto estimate expected returns to land on food-
crop agriculture. The same methods wasapplied to estimate expected returns to labourand expected returns to land on agroforestry.Expected return to labour on logging wasdirectly assessed from household survey data.Expected return to land on logging wasestimated from data on logged-over area in1996 (47 ha), average timber yields in newlogged-over plots (772 m3/ha), timber price(Rp. 99,276/m3) and possible labour involvedin logging activity (with estimated fractionequals to 0.35). It is assumed that 1% ofhuman population have knowledge updatingrate equals to 0.75, while the rest is 0.25. Theinitial strategy between those two agents isassumed to be at Nash-equilibrium state, thusboth agents have the same knowledge at theinitial state.
Figure 5.12. Relational curvebetween total aboveground biomassand soil organic matter input. Thispattern was summarized frombelowground biomass assessment invarious land use systems in Jambi,Sumatera by Susilo, et al. (2004).
Table 5.8. People's perception on livelihoods'benefits in Sebuku.
Livelihood Expected Return To Labour
(IDR/person.day)
Expected Return to Land (IDR/ha)
Food-crop Agriculture
18,380 1,348,194
Agroforestry (mix-fruit garden)
41,127 4,574,014
NTFP (gaharu) 3,968 N.A.
Logging 34,673 61,311,413
Off Farm 13,292

68
Carbon stocks in Nunukan, East Kalimantan: a spatial monitoring and modelling approach
Figure 5.13. Spatialproperties, determiningpeople's deliberation inland expansion. Calculationprocedure adopted fromCostanza (1989) was usedto calculate the strength ofeach spatial determinant,which is reflected byexponentially weightedaverage over alldeterminants' values: (a) inagriculture land expansion,effect of traveling-cost was0.0122, slope-related costwas 0.5243, land-clearing-related cost was 0.4812,and land control-relatedcost was 0.0685; (b) inlogging expansion, effect oftraveling-cost was 0.0130,slope-related cost was0.5240, land-clearing-related cost was 0.4695,and land control-relatedcost was 0.0717; and (c) inagroforestry expansion,effect of traveling-cost was0.0246, slope-related costwas 0.8006, land-clearing-related cost was 0.7535,and land control-relatedcost was 0.9319.
(a) Agriculture
(b) Logging
(c) Agroforestry

Scenario studies of land use in Nunukan, East Kalimantan (Indonesia): Drivers, local livelihoods and globally relevant carbon stocks
69
Spatial analyses were carried out using landcover maps, slope map and distances maps(i.e. road, river, settlement), to estimate theeffects of spatial properties in determiningpeople's deliberation in selecting plots forexpansion, which summary is presented inFigure 5.13.
Model validation
Validation was conducted to measuresimilarity of landscape pattern in 2003between simulation result and the reference(landcover map, derived from Landsat TM −see chapter 4). The model was validated atthree different levels: (1) at detailed nominallevel, by measuring similarity of landcover
Actual land cover (from Landsat TM). Black areasare missing data due to cloud cover.
Simulated land cover
Figure 5.14. Actual land cover map of Sebuku area in 2003 (left), compared to the simulated (right). At detailnominal level, spatial fit of simulated data to the actual was only 37% (see Figure 5.17).
Actual land use (aggregate land cover). Black areasare missing data due to cloud cover.
Simulated land use (aggregate land cover)
Figure 5.15. Actual land use map of Sebuku area in 2003 (left), compared to the simulated (right). These mapswere resulted by aggregating land cover maps, where pioneer forests was separated from forests and reclassifyinto fallowed lands. At aggregate nominal level, spatial fit of simulated data to the actual increased to 70% (seeFigure 5.17).

70
Carbon stocks in Nunukan, East Kalimantan: a spatial monitoring and modelling approach
maps; (2) at aggregate nominal level, bymeasuring similarity of land use maps; and (3)at detail quantitative level by measuring thesimilarity of C/CRef. Maps used for validationare shown in Figure 5.14-5.16. Validation'sprocedure was adopted from Costanza (1989),by measuring the similarity of spatial patternsat multiple resolutions. The results arepresented in Figure 5.17. At detail nominallevel (land cover comparison, Figure 5.14), thefit of the model was 37% (Figure 5.17). Whenvalidation was done at aggregate level (land
use comparison, Figure 5.15), the model's fitincreased to 70% (Figure 5.17). The modelachieved 80% fit (Figure 5.17) when validationwas done at detail quantitative level (Figure5.16).
Baseline and effects of populationincrease
This section discussed the predicted change insystems characteristics if current trendscontinue acts as a dynamic baseline. Extra-
Actual C/CRef. Black areas are missing data due tocloud cover.
Simulated C/CRef
Figure 5.16. Estimated actual C/CRef based on land cover map and statistic from carbon field survey (left),
compared to simulated C/CRef (right). In this case C/CRef was aboveground carbon stocks relative to the reference
(primary forests). At detail quantitative level, spatial fit of simulated data to the actual was 80% (see Figure 5.17).
Figure 5.17. Fit between simulated andactual maps, measured at multipleresolution, ranging from 100 m to 10 kmsampling windows' sizes (the procedurewas adopted from Costanza, 1989). Atdetail nominal level (land covercomparison), overall fit was 37%. Ataggregate nominal level (land usecomparison), overall fit increased to70%. At detail quantitative level (C/CRef
comparison), overall fit reached 80%.

Scenario studies of land use in Nunukan, East Kalimantan (Indonesia): Drivers, local livelihoods and globally relevant carbon stocks
71
polation in time with the parameters thatappear top provide an acceptable fit for thechanges over the last 10 years, suggest thatlogging will remain to be perceived as themost profitable livelihood option over thenext 25-year period (Figure 5.18). Thus, themodel expects a 'baseline' of further depletionof timber and associated carbon stocks, incombination with a decline in income as the
best opportunities for logging becomedepleted (Figure 5.19).
The decline in income will be faster if weassume an increase in the human population(Figure 5.20 A2), but growing population willnot substantially increase logging intensity,resulting in similar patterns of carbon stockdecline compared to the baseline scenario(Figure 5.20 A1).
Figure 5.18. Simulated landscape dynamics in Sebuku from 2003 to the next 25 years using the currentparameters setting, where logging is perceived as the most lucrative livelihood, depleting forests' carbon stocks.
Figure 5.19. Using the current parameters setting, possible trend of landscape dynamics in Sebuku area for 25-year simulation period (initialised using land cover map 2003), resulted declining curves on both benefitindicators: income per capita (million IDR/person) and above ground carbon stocks (t/ha).

72
Carbon stocks in Nunukan, East Kalimantan: a spatial monitoring and modelling approach
Table 5.9. Scenarios used for simulations to explore all patterns of trade off between income per capitaand plot average carbon stocks.
No. Scenario Key Parameters
1 Agroforestry yield improvement Agroforest’s yield per ha was 25%-100% increased from the current setting
2 Agroforestry market improvement Price of agroforest products was 25%-100% increased from the current setting
3 Reducing timber market Accessibility to timber market was 25%-100% reduced from the current setting
A1 A2
B1 B2
Figure 5.20. As simulated by the model, increase on human population reduced livelihood's benefit (A2), whilecarbon stocks remained the same as current trend (A1). Efforts to improve agroforestry profitability by increasingthe yield and through better market development did not correspond to adoptability of agroforestry, whennatural capital for logging activities was still promising to earn better payoffs, thus both income per capita (B1,C1) and carbon stocks (B2, C2) remained the same as current trend. Reducing timber market by 25%-50% fromthe current setting (full capacity) reduced people's main income (D2) without changing the current trend oncarbon stocks' depletion (D1). When timber market reduction was increased by 75%-100%, people adoptedagriculture and agroforestry to compensate income lost from logging, thus increasing carbon depletion (D1) andcreating better income level (D2).

Scenario studies of land use in Nunukan, East Kalimantan (Indonesia): Drivers, local livelihoods and globally relevant carbon stocks
73
Scenario-based simulations
The actual landscape pattern in 2003 was usedas a base for simulating the next 25 yearsbased on scenarios described in Table 5.9.Scenario 1 and 2 were intended to exploreadoptability of agroforestry on the landscapewhen its profitability was improved. The lastscenario was aimed at exploring people'sadaptive behaviour, when timber marketdisappeared from the landscape.
Efforts to improve agroforestryprofitability by increasing its yields andimproving its market (increasing the price) didnot substantively change its adoptability onthe landscape, resulting the same tradeoffpatterns, compared to current setting (Figure5.20 B1,B2,C1,C2).
Reducing the timber market by 75%-100%apparently influenced people's incomesignificantly, enforcing people to adoptagroforestry and agriculture as alternative
C1 C2
D1 D2
Figure 5.20. As simulated by the model, increase on human population reduced livelihood's benefit (A2), whilecarbon stocks remained the same as current trend (A1). Efforts to improve agroforestry profitability by increasingthe yield and through better market development did not correspond to adoptability of agroforestry, whennatural capital for logging activities was still promising to earn better payoffs, thus both income per capita (B1,C1) and carbon stocks (B2, C2) remained the same as current trend. Reducing timber market by 25%-50% fromthe current setting (full capacity) reduced people's main income (D2) without changing the current trend oncarbon stocks' depletion (D1). When timber market reduction was increased by 75%-100%, people adoptedagriculture and agroforestry to compensate income lost from logging, thus increasing carbon depletion (D1) andcreating better income level (D2).

74
Carbon stocks in Nunukan, East Kalimantan: a spatial monitoring and modelling approach
(A) timber market 25% reduced (B) timber market 50% reduced
(C) timber market 75% reduced (D) no timber market
Figure 5.21. People still expected logging to give good earning for them, although timber market was reducedby 25%-50% from the current setting (A and B). When timber market reduction was increased by 75%-100%,people adopted agriculture and agroforestry to compensate benefit lost from logging activities.
A B
Figure 5.22. At current human population (4,046 inhabitants), when agroforestry was improved by 100%increasing its yield and its price from current setting, it could maintain carbon stocks when timber market wasreduced at least by 75% (A), at the same income reduction risk as the current trend (B).
Combined effect when agroforestry was improved and timber market was reduced

Scenario studies of land use in Nunukan, East Kalimantan (Indonesia): Drivers, local livelihoods and globally relevant carbon stocks
75
options that increased earning (Figure 5.21),increasing income by 58%-83% (Figure 5.20D2) and depleting carbon stock by only 18%from the current setting (Figure 5.20 D1).
When scenario 1 and scenario 2 werecombined with scenario 3, where agroforestryyield and agroforestry price were increased by100% at various timber market reductionlevels, carbon stocks was maintained whentimber market was reduced at least by 75%(Figure 22 A) at the same income reductionrisk as the current trend (Figure 22 B).
Discussion
In line with the objectives, we will review thesuitability and weaknesses of the FALLOWmodel for the current purpose, and willformulate tentative conclusions regarding theplausible impact of scenarios for the driversof land use change on income and carbonstocks in Nunukan.
How "model goodness of fit" can bebetter measured?
In carbon monitoring context, landscapedynamics model like FALLOW can be used asassessment tool with relatively low transactioncosts. When its goodness of fit is well tested,it can be used as a tool to develop scenario-based planning. This study shows that at detaillevel of validation to compare landscapepattern similarity using nominal values,FALLOW Model gave relatively low goodness
of fit (37%), but its fit increased as thevalidation level was scaled-up at coarseraggregate or it was done using quantitativeindicators (giving the fits of 70% and 80%respectively).
If we compare simulated and actual datain term of area proximity (not spatial patternsimilarity) at aggregate level (land usecomparison), we will have relative areadifference of simulated data to the actual withthe average equals 11.15%, ranging from+2.45% at forested area to +28.6% atagroforestry plots (Table 5.10). Thus, themodel gives "acceptable" estimation in termof area proximity. In this case, area proximitycan be considered to overpower spatialpattern similarity, since consequences oncarbon stocks are additive.
In validating the model, in term of spatialpattern similarity of its simulated data, landcover maps derived from Landsat TMimageries were used as the reference torepresent direct observed data. In fact, usingLandsat TM, detail age stratification of landcover (eg. secondary forests is stratifiedfurther into young and old) could not be doneat its resolution (30-m). Thus, incorrectassumption on land cover's age estimationresulted in low spatial pattern fit. Although"ecological distance" between two nominalvalues is relatively close (say between oldsecondary forest and primary forest), it wasnot considered in the fit calculationprocedure. When error on age estimation wasreduced through land cover reclassification
Table 5.10. Goodness of fit in term of area at aggregate nominal level (land use comparison).
Land use type Actual area in 2003
(ha) Simulated area in 2003
(ha)
Area difference of simulated data relative
to the actual (%)
Agriculture 2269 2397 5.64
Fallow 211 217 2.84
Forests 19481 19959 2.45
Logged Forests 1297 1507 16.19
Agroforests 430 553 28.60

76
Carbon stocks in Nunukan, East Kalimantan: a spatial monitoring and modelling approach
into more aggregate level (land use), a betterfit could be achieved. High-fit achievementwhen validation was done using quantitativevalue (C/CRef) suggests that quantitative valuesare better than nominal values in explaining"ecological distance".
Low spatial pattern similarity of simulatedland cover maps can also be affected by lackof spatial determinants considered in thestudy. Figure 5.23 clearly shows that actual
spatial patterns of agricultural land in 2003apparently do not really follow the spatialpatterns of road and river. But since road andriver maps at relatively coarse resolution arethe only spatial information available toparameterize the model, it is obvious thatspatial patterns of agricultural land assimulated by the model have relatively highspatial dependence on road and river (Figure5.24). Probably, the "real" spatial determinantsaffecting land expansion appeared at very high
A. Distance to river B. Distance to road
Figure 5.23. Cropped fields in Sebuku as observed by Landsat TM in 2003 (black pixels), overlaid with distanceto river map (A) and distance to road map (B). Spatial patterns of cropped fields didn't follow the patterns ofeither river or road.
A. Distance to river B. Distance to road
Figure 5.24. Simulated cropped fields in Sebuku in 2003 (black pixels), overlaid with distance to river map (A)and distance to road map (B). Spatial patterns of simulated cropped fields were agglomerated surrounding riveror road.

Scenario studies of land use in Nunukan, East Kalimantan (Indonesia): Drivers, local livelihoods and globally relevant carbon stocks
77
resolution, e.g. the form of foot paths. Thus,for future works, we suggest to initialize andvalidate the model by ground truthing or byusing high-resolution satellite imageries (e.g.QuickBird), instead of initializing andcomparing it with other low-resolutionmodels (i.e. land cover maps interpreted fromLandsat TM).
Carbon-income tradeoffs in a forestedlandscape
When a landscape is still dominated byforests, like in Sebuku, livelihoods of localpeople are very dependent on forest resource.From all individual scenarios (scenario 1-scenario 3), depletion of carbon stocks couldnot be avoided. When the timber market isreduced, people will move to agriculture andagroforestry, which means other types ofdeforestation with worse consequences oncarbon sequestration. But on a limited areawhen timber market reduction occuredsimultaneously with agroforestry improve-ment, carbon stocks could be maintainedwhile income was not reduced too much.Thus, reducing land-use-change carbonemission while increasing local benefit on thisarea should be done by means of promotingCBNRM (by adopting e.g. reduced impactlogging) while improving agroforestrysimultaneously.
Conclusion
The model's goodness of fit is only 37% atdetailed nominal level (pixel-level land cover
comparison), but it is 70% at the moreaggregate nominal level (land cover fractionscomparison), and 80% at detailed quantitativelevel (C/CRef difference) directly relevant forthe C-stock scenarios.
The model gives "acceptable" estimationin term of area proximity at aggregatenominal level.
Spatially explicit landscape dynamicsmodels, like FALLOW, should be initializedand validated through ground truthing or byusing higher-resolution of maps, instead ofconfronting them with other low resolutionmodels.
The dynamic baseline for Nunukansuggests that both income and landscape levelcarbon stocks are decreasing, as non-sustainable logging remains the mostprofitable land use option
To simultaneously achieve global and localbenefits, CBNRM and LEISA should workhand in hand: a substantial increase inprofitability of agroforestry options will beneeded before this practice can be an‘alternative to illegal logging’ and competewith the attractiveness of logging, along withan effective way of reducing lumber sales; thetime lag involved in the profitability ofagroforestry suggests that active promotionand extension are important in the raceagainst time, but only if in fact there are landuse options to be promoted that will actuallybenefit the farmers.


79
Anonim. 2001. Kabupaten Nunukan dalamAngka (Nunukan in Numbers). BadanPerencanaan, Pembangunan DaerahKabupaten Nunukan dan Badan PusatStatistik Kabupaten Nunukan, Nunukan.
Arifin J 2001. Estimasi cadangan karbon padaberbagai sistem penggunaan lahan diKecamatan Ngantang, Malang, JurusanTanah, Fakultas Pertanian, UniversitasBrawijaya, Malang, 61pp.
Australian Greenhouse Office. 2002. FieldMeasurement Procedures for CarbonAccountin. Bush for Greenhouse ReportNo.2 Version 1.http://www.greenhouse.gov.au/land/bush_workbook_a3/index.htmlAccessed: 24 February 2005
Barr C. 2002. Timber concession reform :questioning the "sustainable logging"paradigm: in Pierce, CJ. andResosudarmo, IAP. (eds). Which WayForward? People, Forest andPolicymaking in Indonesia. Resources forthe Future, Washington DC. Pp. 191:220.
Biro Pusat Statistik. 2003. Statistik Indonesia(Statistical Yearbook of Indonesia).Central Bureau of Statistics. Jakarta,Indonesia.
Billsborrow RE and Okoth-Ogendo HWO.1992. Population-driven changes in landuse in developing countries. AMBIO21(1): 37-45.
Brookfield H, Potter L and Byron L. 1995. InPlace of the Forest: Environmental andSocio-Economic Transformation inBorneo and the Eastern Malay Peninsula.United Nations University Press, Tokyo.310 pp.
Brown K. 1996. The Utility of RemoteSensing Technology in MonitoringCarbon Sequestration AgroforestryProjects, College of Forest Resources,University of Washington.http://www.ghgprotocol.org/docs/winrock_remote_sensing.pdf (viewed, 21March 2005)
Canadell JG. 2002. Land use effects onterrestrial carbon sources and sinks.Science in China Vol. 45: 1-9.
Casson A and Obidzinski K. 2002. From neworder to regional autonomy: shiftingdynamics of ''illegal'' logging inKalimantan,Indonesia. World Development30 (12): 2133-2151.
Chavez PS. 1996. Image based atmosphericcorrections revisited and improved.Photogrametric Engineering and Remote Sensing62:9, 1025-1036.
Coops N. 1996. Estimating eucalypt forestvolume and density using textural,spectral and environmental variables.Proceeedings 8th Australasian RemoteSrnsing Conference. Canberra, Australia.
Costanza R. 1989. Model goodness of fit: amultiple resolution procedure. EcologicalModelling 47:199-215.
Diamond J. 2005. Collapse: How SocietiesChoose to Fail or Survive. PenguinBooks. 592 pp.
EIA and Telapak Indonesia. 2001. TimberTrafficking:Illegal Logging in Indonesia,South East Asia and InternationalConsumption of Illegally SourcedTimber http://www.eia-international.org/ accessed: 21 March 2005
Gladwell M. 2000. The Tipping Point: HowLittle Things Can Make a Big Difference.
REFERENCES

Little, Brown and Company. 285 pp.
Hairiah K and Murdiyarso D. 2005. Alih gunalahan dan neraca karbon terestrial. BahanAjaran ASB 3, World AgroforestryCentre (ICRAF SEA) (in press)
Hairiah K, Sitompul SM, van Noordwijk Mand Palm C. 2001a. Carbon stocks oftropical landuse systems as part of theglobal C balance: effects of forestconversion and option for cleandevelopment activities. ASB LectureNote 4A. ICRAF, Bogor, 49pp.http://www.worldagroforestry.org/sea/Products/Training/Materials/lecture%20notes/ASB-LecNotes/ASBLecNote%204A.pdf Accessed 18February 2005.
Hairiah K, Sitompul SM, van Noordwijk Mand Palm C. 2001b. Methods forsampling carbon stocks above and belowground. ASB Lecture Note 4B. ICRAF,Bogor, 23pp.http://www.worldagroforestry.org/sea/Products/Training/Materials/lecture%20notes/ASB-LecNotes/ASBLecNote%204B.pdf Accessed 18February 2005.
Hairiah K, Suprayogo D, Widianto, Berlian,Suhara E, Mardiastuning A, Widodo RH,Prayogo C dan Rahayu S. 2004. Alihguna lahan hutan menjadi lahanagroforestri berbasis kopi: ketebalanseresah, populasi cacing tanah danmakroporositas tanah. Agrivita 26(1): 68-80
Hatfindo Prima. 2004. Laporan ProyekAnalisis Perubahan Tutupan Hutan,Kabupaten Nunukan PropinsiKalimantan Timur, Indonesia (ProjectReport: Forest Cover Changes inNunukan, east Kalimantan).
Houghton JT, Ding Y, Griggs DJ, Nouger M,et al. Climate Change 2001: The ScientificBasis. Cambridge University Press. 83 pp.http://www.ipcc.ch/ Accessed: 28
January 2005
Huete AR. 1998. Introduction to VegetationIndices. Department of Soil Water andEnvironmental Science. University ofArizona.www.start.or.th/luccdis_98/huete1.htmAccessed: 23 March 2005
Kamelarczyk BBK. 2004. Implications ofSmall-scale Timber Concessions on RuralLivelihood - A Case Study from MalinauDistrict, Indonesia. MSc Thesis. Facultyof Forestry, The Royal Veterinary andAgrocultural University, Denmark.
Ketterings QM, Coe R, van Noordwijk M,Ambagau Y and Palm C. 2001. Reducinguncertainty in the use of allometricbiomass equations for predicting above-ground tree biomass in mixed secondaryforests. Forest Ecology and Management 146:199-209.
Lasco RD, Pulhin FB, Visco RG, Racelis DA,Guillermo IN and Sales RF. 2000.Carbon stocks assessment of Philippineforest ecosystems. Paper presented at theScience-Policy Workshop on TerrestrialCarbon Assessment for Possible CarbonTrading, Bogor, Indonesia.
Lasco RD, Lales JS, Guillermo IQ andArnuevo T. 1999. CO2 Absorption Studyof the Leyte Geothermal Forest Reserve.Final report of a study conducted for thePhilippine National Oil Company(PNOC). UPLB Foundation, Inc. LosBanos, Laguna
Lasco RD. 2002. Forest carbon budgets inSoutheast Asia following harvesting andland cover change. In: Impacts of landuse Change on the Terrestrial CarbonCycle in the Asian Pacific Region'. Sciencein China Vol. 45, 76-86.
Levang P. 2002. Peoples Dependencies onForests. Pp 109-130 in Forest, Scienceand Sustainability: The Bulungan ModelForest. Technical Report Phase I 1997-
80
Carbon stocks in Nunukan, East Kalimantan: a spatial monitoring and modelling approach

References
81
2001, ITTO Projects PD 12/1997 Rev.1(F), CIFOR, Indonesia.
Levang P, Dounias E and Sitorus S. 2005. Outof forest, out of poverty? Forest, Trees andLivelihoods 15(2): 221- 235
Lillesand TM and Kiefer RW. 1994. RemoteSensing and Image Interpretation. JohnWiley and Sons.Inc, New York. 750pp.
Mackinnon K, Hatta G, Halim H andMangalik A. 2000. Seri EkologiIndonesia, Buku III: EkologiKalimantan. Prenhallindo, Jakarta.pp: 189 (Kotak 4.1).
Page SE, Siegert F, Rieley JO, Boehm HD etal. 2002. The amount of carbon releasedfrom peat and forest fires in Indonesiaduring 1997. Nature 420(6911):61-5.
Palm CA, Woomer PL, Allegre J et al. 1999.Carbon sequestration and trace gasemissions in slash and burn andalternative land uses in the humidtropics. ASB Climate Change WorkingGroup Final Report, Phase II, ICRAF,Nairobi. 36 pp
Paustian K, Andrén O, Janzen HH, Lal R, etal. 1997. Agricultural soils as a sink tomitigate CO2 emissions. Soil Use andManagement 13: 230-244
Pendidikan Ilmu Kayu Atas. 1979. MengenalSifat-Sifat Kayu Indonesia danPenggunaannya. Penerbit Kanisius. 36 pp
Peterson GD, Cumming GS and CarpenterSR. 2003. Scenario planning: a tool forconservation in an uncertain world.Conservation Biology 17(2): pp. 358-366.
Priyadarsini R. 1999. Estimasi Modal C(Karbon-stock), Masukan BahanOrganik, dan Hubungannya denganPopulasi Cacing Tanah pada SistemWanatani. Program Pascasarjana,Universitas Brawijaya, Malang. 76pp.
Ray TW. 1994. A FAQ on Vegetation in
Remote Sensing. Division of Geologicaland Planetary Sciences, CaliforniaInstitute of Technology.www.yale.edu/ceo/Documentation/rsvegfaq.html Accessed: 18 March 2005
Ray TW. 1994. A FAQ on Vegetation inRemote Sensing. Division of Geologicaland Planetary Sciences, CaliforniaInstitute of Technology.www.yale.edu/ceo/Documentation/rsvegfaq.html
Resosudarmo IAP and Dermawan A. 2002.Forests and regional autonomy: thechallenge of sharing the profits andpains: in Pierce, CJ. and Resosudarmo,IAP. (eds). Which Way Forward? People,Forest and Policymaking in Indonesia.Resources for the Future, WashingtonDC. Pp 325-357.
Sist P, Sheil D, Kartawinata K, Priyadi H.2003. Reduced-impact logging inIndonesian Borneo: some resultsconfirming the need for new silviculturalprescriptions. Forest Ecology andManagement 179: 415-427.
Smith J, Obidzinski K, Subarudi,Suramenggala I. 2003. Illegal logging,collusive corruption and fragmentedgovernments in Kalimantan, Indonesia.International Forestry Review 5 (3) :293-302.
Smith J and Scherr SJ. 2003. Capturing thevalue of Forest Carbon for LocalLivelihoods. World Development 31(12):2143-2160.
Sugiarto C. 2002. Kajian Aluminium sebagaiFaktor Pembatas Pertumbuhan AkarSengon (Paraserianthes falcataria L.Nielsen), Jurusan Tanah, FakultasPertanian, Universitas Brawijaya, Malang,64pp.
Sunar F. 1998. An analysis of changes in amulti date dataset: a case study in Ikitelliarea, Istanbul Turkey. International Journalof Remote Sensing 19:2, 225-235.

Susilo FX, Neutel AM, van Noordwijk M,Hairiah K, Brown G and Swift MJ. 2004.Soil biodiversity and food webs. In: vanNoordwijk, M, Cadisch, G and Ong, CK(Eds): Below-ground Interactions inTropical Agroecosystems: Concepts andModels with Multiple Plant Components.CABI Publishing. pp: 300
Tacconi L. 2003, Fires in Indonesia: Causes,Costs and Policy Implications.Occasional Paper No. 38. Bogor, Centerfor International Forestry Research.
Ponce-Hernandez R with contributions fromKoohafkan P and Antoine J. 2004.Assessing Carbon Stocks and ModellingWin-Win Scenarios of CarbonSequestration through Land-UseChanges. Food and AgricultureOrganizations of the United Nations.156 pp.
Tacconi L, Obidzinski K, Smith J, Subarudi,Suramenggala I. 2004. Can 'legalization'of illegal forest activities reduce illegallogging?: lessons from East Kalimantan.Jurnal of Sustainable Forestry 19:137-151.
Tomich TP, Fagi AM, de Foresta H, et al.1998. Indonesia's fire : smoke as a problem, smoke as a symptom.Agroforestry Today January - March: 4 - 7.
Tomich TP, van Noordwijk M, Budidarsono S,Gillison A, Kusumanto T, Murdiyarso D,Stolle F and Fagi AM. 1998. Alternativesto Slash-and-Burn in Indonesia:Summary Report and Synthesis of PhaseII. ASB-Indonesia Report No. 8. ICRAFS.E. Asia. Bogor. Indonesia.
Tomich TP, van Noordwijk M, Budidarsono S,Gillison A, Kusumato T, Murdiyarso D,Stolle F and Fagi AM. 2001. Agriculturalintensification, deforestation and theenvironment: assessing tradeoffs inSumatra, Indonesia. In: Lee DR andBarrett CB (Eds): Tradeoffs Or
Synergies? Agricultural Intensification,Economic Development and theEnvironment. CABI Publishing.
Vanclay JK. 1994. Modelling Forest Growthand Yield: Applications to MixedTropical Forests. CAB International.
van Noordwijk M, Subekti R, Kurniatun H,Wulan YC, et al. Carbon stockassessment for a forest-to-coffeeconversion landscape in Sumber-Jaya(Lampung, Indonesia): from allometricequations to land use change analysis. In:Impacts of land use Change on theTerrestrial Carbon Cycle in the AsianPacific Region'. Science in China Vol. 45,76-86.
van Noordwijk M., Woomer P, Cerri C,Bernoux M and Nugroho K. 1997. Soilcarbon in the humid tropical forest zone.Geoderma 79: 187-225
van Noordwijk M. 2002. Scaling trade-offsbetween crop productivity, carbon stocksand biodiversity in shifting cultivationlandscape mosaics: the FALLOW model.Ecological Modelling 149: 113-126.
Watson RT, Noble IR, Bolin B, RavindranathNH, Verado DJ and Dokken DJ (eds.).2000. Land Use and Land-Use Changeand Forestry: A special report of theIPCC. Cambridge, UK. CambridgeUniversity Press. 377 pp.
82
Carbon stocks in Nunukan, East Kalimantan: a spatial monitoring and modelling approach

APPENDIX

84
Carbon stocks in Nunukan, East Kalimantan: a spatial monitoring and modelling approach
Ap
pen
dix
1.
Car
bo
n s
tock
s m
easu
red
an
d t
imb
er s
tock
s es
tim
ated
in
sam
ple
plo
ts a
t Se
bu
ku a
nd
Sem
bak
un
g d
istr
ict, N
un
uka
n,
East
Kal
iman
tan
.
Posi
tio
n
Sam
pli
ng
Dat
e V
illa
ge
50 N
U
TM
La
nd U
se T
ype
Age
(y
ear
s)
Tre
e bio
mas
s (M
g h
a-1)
Nec
rom
ass
(Mg h
a-1)
Under
store
y (M
g ha-1
) Li
tter
(M
g h
a-1)
Tim
ber
st
ocks
1
(m3/h
a)
20-Jan-0
4
Suja
u
479
47
5
436
48
0
Logg
ed-o
ver
fore
st
0-3
515
.4
1.3
1.3
17.1
720
.23
20-Jan-0
4
Suja
u
479
50
9
436
62
6
Logg
ed-o
ver
fore
st
0-3
484
.5
1.4
9.4
149
.5
793
.17
20-Jan-0
4
Suja
u
479
82
0
436
79
3
Logg
ed-o
ver
fore
st
0-3
390
.7
1.7
2.0
11.7
489
.05
12-D
ec-0
3
Seki
kila
n
498
60
3
451
24
6
Logg
ed-o
ver
fore
st
4-1
0
229
.8
3.0
3.0
13.0
379
.82
12-D
ec-0
3
Seki
kila
n
unre
cord
ed
unre
cord
ed
Logg
ed-o
ver
fore
st
4-1
0
245
.5
2.2
4.7
15.5
284
.90
12-D
ec-0
3
Seki
kila
n
498
66
8
451
22
1
Logg
ed-o
ver
fore
st
4-1
0
640
.6
1.1
1.6
11.2
703
.01
19-D
ec-0
3
Ata
p
503
63
2
427
74
1
Logg
ed-o
ver
fore
st
11-3
0
453
.5
10.8
2.3
18.2
na
12-D
ec-0
3
Ata
p
503
59
4
427
66
9
Logg
ed-o
ver
fore
st
11-3
0
505
.3
9.0
1.1
8.0
777
.94
19-D
ec-0
3
Ata
p
503
62
5
427
65
4
Logg
ed-o
ver
fore
st
11-3
0
391
.6
3.0
1.2
15.6
608
.56
25-Jan-0
4
Lub
ok
483
28
6
419
55
1
Logg
ed-o
ver
fore
st
31-5
0
378
.3
5.1
2.1
11.0
826
.80
25-Jan-0
4
Lub
ok
unre
cord
ed
unre
cord
ed
Logg
ed-o
ver
fore
st
31-5
0
235
.0
8.5
1.1
12.1
584
.08
25-Jan-0
4
Lub
ok
unre
cord
ed
unre
cord
ed
Logg
ed-o
ver
fore
st
31-5
0
558
.1
2.5
0.7
13.6
910
.82
Feb-0
4
Tau
Bar
u
484
84
3
457
50
0
Pri
mar
y Fo
rest
-
723
.3
0.9
0.2
10.7
100
9.5
4
Feb-0
4
Tau
Bar
u
484
79
3
457
80
9
Pri
mar
y Fo
rest
-
417
.9
0.5
0.0
9.2
682
.60
Feb-0
4
Tau
Bar
u
484
81
7
457
68
4
Pri
mar
y Fo
rest
-
363
.1
0.4
0.2
7.9
524
.47
Feb-0
4
Seki
kila
n
498
67
0
457
07
1
Imp
erat
a -
0.0
0.0
4.6
5.6
na
Feb-0
4
Seki
kila
n
498
61
7
457
12
0
Imp
erat
a -
0.0
0.0
4.2
4.4
na
Feb-0
4
Seki
kila
n
498
47
2
451
98
9
Imp
erat
a -
0.0
0.0
4.6
4.5
na
Feb-0
4
Seki
kila
n
498
50
3
451
96
8
Jaka
w
1
0.2
1.5
5.8
11.4
na
Feb-0
4
Seki
kila
n
498
52
7
451
99
7
Jaka
w
1
7.7
1.9
1.6
5.5
5.1
5
Feb-0
4
Seki
kila
n
498
47
2
451
98
9
Jaka
w
1
16.0
0.3
2.6
9.1
27.2
0
25-D
ec-0
3
Man
uk
Bun
gku
l 497
44
7
422
65
2
Jaka
w
2
3.7
0.8
1.5
5.0
6.1
0
25-D
ec-0
3
Man
uk
Bun
gku
l 497
43
6
422
66
2
Jaka
w
2
3.2
0.6
2.0
1.8
3.4
5
25-D
ec-0
3
Man
uk
Bun
gku
l 497
41
9
422
64
9
Jaka
w
2
18.1
0.9
1.5
3.2
23.7
0
07-M
ar-0
4
Man
uk
Bun
gku
l 497
23
5
422
04
1
Jaka
w
3
26.0
0.2
0.8
7.5
49.9
8
07-M
ar-0
4
Man
uk
Bun
gku
l 496
95
7
421
93
6
Jaka
w
3
16.9
0.0
1.0
6.0
27.6
7
07-M
ar-0
4
Man
uk
Bun
gku
l 496
95
7
421
85
4
Jaka
w
3
21.6
0.1
1.0
7.8
38.8
1
14-D
ec-0
3
Tan
jun
g H
arap
an
479
47
4
417
05
1
Jaka
w
4
31.9
1.1
1.9
7.4
110
.03
14-D
ec-0
3
Tan
jun
g H
arap
an
479
52
2
416
98
3
Jaka
w
4
43.7
0.7
1.0
9.8
na
14-D
ec-0
3
Tan
jun
g H
arap
an
479
36
5
416
98
3
Jaka
w
4
33.5
1.2
0.8
6.4
78.7
8
1T
imb
er s
tock
s is
est
imat
ed f
rom
th
e n
um
ber
of
tree
s fo
un
d i
n e
ach
plo
t. n
am
ean
s n
o t
rees
wer
e fo
un
d i
n t
he
sam
ple
plo
t

Appendix
85
Ap
pen
dix
1.
(Co
ntin
ued
)
Posi
tio
n
Sam
pli
ng
Dat
e V
illa
ge
50 N
U
TM
La
nd U
se T
ype
Age
(y
ear
s)
Tre
e bio
mas
s (M
g h
a-1)
Nec
rom
ass
(Mg h
a-1)
Under
store
y (M
g ha-1
) Li
tter
(M
g h
a-1)
Tim
ber
st
ocks
1
(m3/h
a)
Tan
jun
g H
arap
an
480
50
5
417
49
0
Jaka
w
5
34.7
0.2
1.4
5.0
82.7
3
Tan
jun
g H
arap
an
480
41
4
417
59
0
Jaka
w
5
35.8
0.0
1.4
4.9
82.1
0
Tan
jun
g H
arap
an
480
29
5
417
69
3
Jaka
w
5
40.1
0.2
1.1
6.5
91.5
8
26-F
eb-0
4
Lub
ok
486
09
1
419
35
0
Jaka
w
7
67.6
0.0
0.9
6.2
101
.91
26-F
eb-0
4
Lub
ok
485
99
3
419
54
5
Jaka
w
7
93.2
0.0
0.2
6.2
142
.49
26-F
eb-0
4
Lub
ok
485
76
0
419
37
0
Jaka
w
7
129
.7
0.6
0.9
5.6
259
.08
Feb-0
4
Seki
kila
n
499
39
0
451
86
3
Jaka
w
15
168
.7
0.0
3.2
11.4
231
.55
Feb-0
4
Seki
kila
n
499
46
3
451
89
7
Jaka
w
15
101
.3
1.1
5.4
8.7
230
.05
Feb-0
4
Seki
kila
n
499
39
0
451
86
3
Jaka
w
15
69.2
1.7
8.4
7.5
114
.53
04-M
ar-0
4
Pag
aluyon
480
92
1
418
03
1
Agr
ofo
rest
9
3.7
0.0
1.6
6.9
na
04-M
ar-0
4
Pag
aluyon
480
89
7
418
10
2
Agr
ofo
rest
9
192
.4
2.9
1.4
4.7
na
04-M
ar-0
4
Pag
aluyon
480
75
4
418
09
9
Agr
ofo
rest
9
28.3
0.0
2.9
6.8
na
08-M
ar-0
4
Man
uk
Bun
gku
l 497
69
4
423
05
5
Agr
ofo
rest
10-2
0
192
.7
0.0
1.1
10.1
na
08-M
ar-0
4
Man
uk
Bun
gku
l 497
68
6
423
02
1
Agr
ofo
rest
10-2
0
75.0
0.6
1.5
11.5
na
08-M
ar-0
4
Man
uk
Bun
gku
l 497
72
5
422
99
3
Agr
ofo
rest
10-2
0
138
.5
0.0
1.1
16.8
na
28-F
eb-0
4
Suja
u L
am
a 479
97
8
439
22
8
Agr
ofo
rest
21-3
0
351
.4
0.0
1.1
5.2
na
28-F
eb-0
4
Suja
u L
am
a 479
98
4
439
23
6
Agr
ofo
rest
21-3
0
48.5
0.0
1.1
4.8
na
28-F
eb-0
4
Suja
u L
am
a 480
02
5
439
25
7
Agr
ofo
rest
21-3
0
100
.0
0.0
1.3
5.3
na
25-F
eb-0
4
Apas
499
88
4
440
09
8
Pad
i -
Jaka
w
1
0.0
0.0
2.4
0.0
na
02-M
ar-0
4
Kun
yit
496
30
4
436
17
9
Pad
i -
Jaka
w
2
0.0
0.0
5.1
0.0
na
06-M
ar-0
4
Man
uk
Bun
gku
l 498
19
1
422
69
4
Pad
i -
Jaka
w
3
0.0
0.0
5.3
0.0
na
02-M
ar-0
4
Lub
ok
Buat
483
99
7
418
86
2
Pad
i -
Jaka
w
4
0.0
0.0
5.5
0.0
na
01-M
ar-0
4
Lub
ok
Buat
485
46
9
418
43
6
Pad
i -
Jaka
w
5
0.0
0.0
5.8
0.0
na
09-F
eb-0
4
Pag
aluyon
480
98
5
418
71
0
Pad
i -
Jaka
w
6
0.0
0.0
12.0
0.0
na

86
Carbon stocks in Nunukan, East Kalimantan: a spatial monitoring and modelling approach
Appendix 2. Tree species found in sample plots
A. Primary forest
No Local Name Latin name Familly
1 Adau (medang perupuk) Lophopetalum sp. Celastraceae
2 Balingkudung (Salingkawang) Buchanania sp. Anacardiaceae
3 Banggeris Koompassia sp. Leguminosae
4 Bayur Pterospermum sp. Sterculiaceae
5 Bengkirai Shorea laevis Dipterocarpaceae
6 Bintangal (bintangur) Calophyllum sp. Guttiferae
7 Dara-dara (mendarahan) Knema sp. Myristicaceae
8 Gading-gading (kayu gading) Muraya paniculata Rutaceae
9 Gimpango (limpato) Prainea limpato Moraceae
10 Ipil Intsia sp. Leguminosae
11 Jambu-jambu Syzigium sp. Myrtaceae
12 Kapur Dryobalanops sumatrensis Dipterocarpaceae
13 Kayu hitam Diospyros transitoria Ebenaceae
14 Keruing Dipterocarpus alatus Dipterocarpaceae
15 Kulit (medang wangi) Beilschmiedia micrantha Lauraceae
16 Lapak (kayu lilin) Aglaia leptantha Meliaceae
17 Meranti kuning Shorea sp. Dipterocarpaceae
18 Meranti merah ( Adat ) Shorea sp. Dipterocarpaceae
19 Meranti merah (tua) Shorea sp. Dipterocarpaceae
20 Meranti Putih Shorea sp. Dipterocarpaceae
21 Nyantuh (nyatoh) Chrysophyllum spp. Sapotaceae
22 Pala bukit Myristica crassa Mytisticaceae
23 Pampalang (empilung) unknown unknown
24 Rengas Gluta curtisii Anacardiaceae
25 Serangan batu (seranggap) Hopea sp. Dipterocarpaceae
26 Talisoy (talisei) Terminalia subspathulata Combretaceae
27 Talutu (taluto) unknown unknown
28 Tengkawang (biasa) Shorea pinanga Dipterocarpaceae
29 Ulin Eusideroxylon zwageri Lauraceae

Appendix
87
B1. Logged-Over-Forest aged 0 - 10 years
No Local Name Latin name Familly
1 Adau (medang perupuk) Lophopetalum sp. Celastraceae
2 Alag-alag (alanagni) Myristica guatteriifolia Myristicaceae
3 Bab unknown unknown
4 Bak (mersawa terbak) Anisoptera costata Dipterocarpaceae
5 Balingkudung (Salingkawang) Buchanania sp. Anacardiaceae
6 Balinsakat (balindakat) Artocarpus atilis Moraceae
7 Banggeris Koompassia sp. Leguminosae
8 Bangunyung (kayu melati) Teijsmanniodendron ahernianum Verbenaceae
9 Bengkirai Shorea laevis Dipterocarpaceae
10 Bidang (medang mata buaya) Cryptocarya griffithiana Lauraceae
11 Binatol (Binatoh) Shore argentifolia Dipterocarpaceae
12 Bintangal (bintangur) Calophyllum sp. Guttiferae
13 Dara-dara (mendarahan) Knema sp. Myristicaceae
14 Durian Durio zibethinus Bombacaceae
15 Gading-gading (ky. Gading) Muraya paniculata Rutaceae
16 Gimpango (limpato) Prainea limpato Moraceae
17 Intut Palaquium quercifolium Sapotaceae
18 Jambu-jambu (jambu hutan) Syzygium sp. Myrtaceae
19 Jarum Dysoxylum sp. Rubiaceae
20 Jelutung Dyera costulata Apocynaceae
21 Juangi (juani) unknown unknown
22 Kabuton unknown unknown
23 Kapur Dryobalanops sumatrensis Dipterocarpaceae
24 Kayu hitam Diospyros transitoria Ebenaceae
25 Keruing Dipterocarpus alatus Dipterocarpaceae
26 Kulit (medang wangi) Beilschmiedia micrantha Lauraceae
27 Lapak (kayu lapan) Astronia macrophylla Melastomataceae
28 Lapak (kayu lilin) Aglaia leptantha Meliaceae
29 Lobo (lomo) Atuna racemosa Chrysobalanaceae
30 Majau (meranti majau) Shorea johorensis Dipterocarpaceae
31 Mengkuom (mengkuang) Dysoxylum densiflorum Meliaceae
32 Meranti merah (tua) Shorea sp. Dipterocarpaceae
33 Meranti Putih Shorea sp. Dipterocarpaceae
34 Nyantu (jelutung paya) Dyera polyphylla Apocynaceae
35 Pilipikan (lilipga) Hopea iriana Dipterocarpaceae
36 Pisang-pisang Alphonsea sp. Annonaceae
37 Plaju (Pilajau) Myristica crassa Anacardiaceae
38 Rengas Gluta curtisii Anacardiaceae
39 Sedaman Macaranga sp. Euphorbiaceae
40 Selangan batu (seranggap) Hopea sp. Dipterocarpaceae
41 Sepetir Copaifera palustris Leguminosae
42 Telantang (terentang) Campnosperma sp. Anacardiaceae
43 Tengkawang biasa Shorea pinanga Dipterocarpaceae
44 Terap hutan Artocarpus sp. Moraceae
45 Tigalangan unknown unknown
46 Tipulu Artocarpus teysmannii Moraceae
47 Ulin Eusideroxylon zwageri Lauraceae

88
Carbon stocks in Nunukan, East Kalimantan: a spatial monitoring and modelling approach
B2. Logged-over-forest aged 11-30 years
No Local Name Latin name Familly
1 Bayur Pterospermum sp. Sterculiaceae
2 Bengkirai Shorea laevis Dipterocarpaceae
3 Dara-dara Knema sp. Myristicaceae
4 Ipil Intsia sp. Leguminosae
5 Kapur Dryobalanops sumatrensis Dipterocarpaceae
6 Keruing Dipterocarpus alatus Dipterocarpaceae
7 Meranti merah Shorea sp. Dipterocarpaceae
8 Pala-pala Myristica crassa Myristicacea
9 Rambutan Nephelium lappaceum Sapindaceae
10 Resak Shorea maxima Dipterocarpaceae
11 Resak bukit Cotylelobium lanceolatum Dipterocarpaceae
12 Sedaman Macaranga sp. Euphorbiaceae
13 Tailan (Jabon) Anthocephalus chinensis Rubiaceae
14 Ulin Eusideroxylon zwageri Lauraceae
B3. Logged-over-forest aged 31-50 years
No Local Name Latin name Familly
1 Dara-dara (mendarahan) Knema sp. Myristicaceae
2 Gaharu (gaharu buaya) Gonystylus bancanus Thymelaceae
3 Kapur Dryobalanops sumatrensis Dipterocarpaceae
4 Meranti Kuning Shorea sp. Dipterpcarpaceae
5 Meranti Merah Shorea sp. Dipterpcarpaceae
6 Meranti merah (tua) Shorea curtisii Dipterpcarpaceae
7 Meranti Putih Shorea sp. Dipterpcarpaceae
8 Meranti rawa Shorea hemsleyana Lauraceae
9 Nyatoh Chrysophyllum spp. Sapotaceae
10 Pala Myristica crassa Myristicacea
11 Patag ( petai hutan ) Parkia sp. Fagaceae
12 Sadaman Macaranga sp. Dipterpcarpaceae
13 Tengkawang biasa Shorea pinanga Dipterpcarpaceae
14 Ulin Eusideroxylon zwageri Lauraceae
C1. Agroforestry syestems aged 0-10 years
No Local Name Latin name Familly
1 Durian Durio zibethinus Bombacaceae
2 Gmelina Gmelina arborea Verbenaceae
3 Kemiri Aleurites moluccana Euphorbiaceae
4 Langsat Lansium domesticum Meliaceae
5 Mangga Mangifera indica Anacardiaceae
6 Nangka Artocarpus heterophyllus Moraceae
7 Rambutan Nephelium lappaceum Sapindaceae

Appendix
89
C2. Agroforestry syestems aged 11-30 years
No Local Name Latin name Familly
1 Baling Kudung Buchanania sp. Anacardiaceae
2 Bayur Pterospermum sp. Sterculiaceae
3 Bunyu Mangifera sp. Anacardiaceae
4 Cempedak Artocarpus integer Moraceae
5 Kutang unknown unknown
6 Durian Durio zibethinus Bombacaceae
7 Elai Durio malacensis Bombacaceae
8 Gamal Gliricidia sepium Leguminosae
9 Gambil (siri-sirian) Pternandra azurea Melastomataceae
10 Gambiran Glochidion rubrum Euphorbiaceae
11 Jambu-jambuan Syzygium sp. Myrtaceae
12 Kelapa Cocos nucifera Palmae
13 Klamuku (rambutan hutan) Nephelium cuspidatum Sapindaceae
14 Kopi Coffea sp. Rubiaceae
15 Langsat Lansium domesticum Meliaceae
16 Lindungu Bruguiera sp. Rhizophoraceae
17 Lepeu Bauhinia semibifida Leguminosae
18 Mangga Mangifera indica Anacardiaceae
19 Perupuk Lophopetalum sp. Celastraceae
20 Pinang Areca catechu Palmae
21 Polod (aren) Arenga pinata Palmae
22 Rambutan Nephelium lappaceum Sapindaceae
23 Sedaman Macaranga sp. Euphorbiaceae
24 Talisei Terminalia subspathulata Combretaceae
25 Tato unknown unknown
26 Terap Artocarpus sp. Moraceae
27 Tibangu unknown unknown
28 Tinggegayang unknown unknown
29 Tolonsob Pterocymbium tinctorium Sterculiaceae
30 Tontianak unknown unknown
D1. Jakaw systems aged 0 - 10 years.
No Local Name Latin name Familly
1 Ambalu logon Anthocephalus sp. Rubiaceae 2 Abung Ficus sp. Moraceae 3 Apas-apas unknown unknown 4 Bayur Pterospermum sp. Sterculiaceae 5 Benua Macaranga triloba Euphorbiaceae 6 Bintangur Calophyllum sp. Guttiferae 7 Bolo Alphonsea sp. Annonaceae 8 Bumbungalin unknown unknown 9 Dara - dara Knema sp. Myristicaceae 10 Emas unknown unknown 11 Gita Ficus glomerata Moraceae 12 Gadigading Muraya paniculata Rutaceae 13 Pulai Alstonia sp. Apocynaceae 14 Intut Palaquium quercifolium Sapotaceae 15 Ipil Intsia sp. Leguminosae

90
Carbon stocks in Nunukan, East Kalimantan: a spatial monitoring and modelling approach
D1. Jakaw systems aged 0 - 10 years. (Lanjutan)
No Local Name Latin name Familly
16 Jabon Anthocephalus chinensis Rubiaceae
17 Jambu-jambu Syzigium sp. Myrtaceae
18 Junod Aniba sp. Lauraceae
19 Kapur Dryobalanops sumatrensis Dipterocarpaceae
20 Kekatung (MM) Shorea curtisii Dipterocarpaceae
21 Keling Artocarpus ovatus Moraceae
22 Kibalow Shorea argentifolia Dipterocarpaceae
23 Kucing (MM) Cratoxyllum sp. Guttiferae
24 Kutang unknown unknown
25 Kusiak unknown unknown
26 Lai Durio malacensis Bombacaceae
27 Lindungu Bruguiera sp. Rhizophoraceae
28 Manik -Manik unknown unknown
29 Ogot unknown unknown
30 Sedaman Macaranga sp. Euphorbiaceae
31 Susunod unknown unknown
32 Tali/Balinsakad Artocarpus atilis Moraceae
33 Talisei Terminalia subspathulata Combretaceae
34 Talutu unknown unknown
35 Tambalogon Bombax ceiba Bombacaceae
36 Tanakal unknown unknown
37 Tatalad unknown unknown
38 Tindaka unknown unknown
39 Tinggegayang unknown unknown
40 Togop unknown unknown
41 Tolonsop Pterocymbium tinctorium Sterculiaceae
42 Ulin Eusideroxylon zwageri Lauraceae
43 Pisang hutan Musa sp. Musaceaea
D2. Jakaw systems aged more than 10 years.
No Local Name Latin name Familly
1 Abung Ficus sp. Moraceae
2 Apulakit unknown unknown
3 Bayur Pterospermum sp. Sterculiaceae
4 Bintangur Calophyllum sp. Guttiferae
5 Bislang unknown unknown
6 Bubuanak unknown unknown
7 Bulinti unknown unknown
8 Kaputan unknown unknown
9 Kubi unknown unknown
10 Langsat Lansium domesticum Meliaceae
11 Lepeu Bauhinia semibifida Leguminosae
12 Pisang-pisang Alphonsea sp. Annonaceae
13 Rambutan Nephelium lappaceum Sapindaceae
14 Sadaman Macaranga sp. Euphorbiaceae
15 Tanakal unknown unknown
16 Terap Artocarpus sp. Moraceae
17 Tibangu unknown unknown
18 Tolonsop Pterocymbium tinctorium Sterculiaceae
19 Ulin Eusideroxylon zwageri Lauraceae

Appendix
91
Appendix 3. Listing of sample points for the regression of aboveground C stock on NDVI
No. Easting Northing Location Landcover
Carbon density measured (Mg ha-1)*
NDVI03
1 498670 457071 Kalun Sayan Imperata 2.06 44
2 497447 422652 Manuk Bungkul 2-yr-old abandoned jakaw 2.32 45
3 497436 422662 Manuk Bungkul 2-yr-old abandoned jakaw 2.32 45
4 496304 436179 Kunyit 2-yr cropped jakaw, rice 2.27 52
5 498191 422694 Manuk Bungkul 3-yr cropped jakaw, rice 2.40 59
6 497419 422649 Manuk Bungkul 2-yr-old abandoned jakaw 8.82 64
7 485760 419370 Tanjung Harapan 6-10-yr old abandoned jakaw 58.75 65
8 496957 421936 Manuk Bungkul 3-yr-old abandoned jakaw 8.02 66
9 496957 421854 Manuk Bungkul 3-yr-old abandoned jakaw 8.02 66
10 480505 417490 Tanjung Harapan 5-yr-old abandoned jakaw 16.28 66
11 480414 417590 Tanjung Harapan 5-yr-old abandoned jakaw 16.78 66
12 498527 451997 Sekikilan 1-yr-old abandoned jakaw 4.18 67
13 480985 418710 Tanjung Harapan 6-10-yr cropped jakaw 5.41 67
14 497235 422041 Manuk Bungkul 3-yr-old abandoned jakaw 12.06 67
15 498603 451246 Sekikilan 4-10-yr logged over area 104.78 67
16 503632 427741 Atap 11-30-yr logged over area 205.12 68
17 499463 451897 Sekikilan >10-yr old abandoned jakaw 48.03 69
18 499390 451863 Sekikilan >10-yr old abandoned jakaw 77.38 69
19 503625 427654 Atap 11-30-yr logged over area 176.78 69
20 479509 436626 Sujau 0-3-yr logged over area 222.25 69
21 503594 427669 Atap 11-30-yr logged over area 227.89 69
22 479475 436480 Sujau 0-3-yr logged over area 232.49 70
23 497686 423021 Manuk Bungkul Agroforest 11 - 20 yrs 34.45 71
24 497725 422993 Manuk Bungkul Agroforest 11 - 20 yrs 62.83 71
25 497694 423055 Manuk Bungkul Agroforest 11 - 20 yrs 87.21 71
26 485993 419545 Tanjung Harapan 6-10-yr old abandoned jakaw 42.05 72
* c-stock measured from tree biomass and understorey