Bivariate Regression (Part 1) Chapter1212 Visual Displays and Correlation Analysis Bivariate...
36
Bivariate Regression Bivariate Regression (Part 1) (Part 1) C h a p t e r 12 12 Visual Displays and Correlation Analysis Bivariate Regression Regression Terminology Ordinary Least Squares Formulas Tests for Significance McGraw-Hill/Irwin Copyright © 2009 by The McGraw-Hill Companies, Inc. All rights reserved.
-
Upload
neil-jenkins -
Category
Documents
-
view
244 -
download
1
Transcript of Bivariate Regression (Part 1) Chapter1212 Visual Displays and Correlation Analysis Bivariate...

Bivariate RegressionBivariate Regression(Part 1)(Part 1)
Chapter12121212
Visual Displays and Correlation Analysis
Bivariate RegressionRegression TerminologyOrdinary Least Squares
FormulasTests for Significance
McGraw-Hill/Irwin Copyright © 2009 by The McGraw-Hill Companies, Inc. All rights reserved.
12A-2
Visual Displays and Visual Displays and Correlation AnalysisCorrelation Analysis
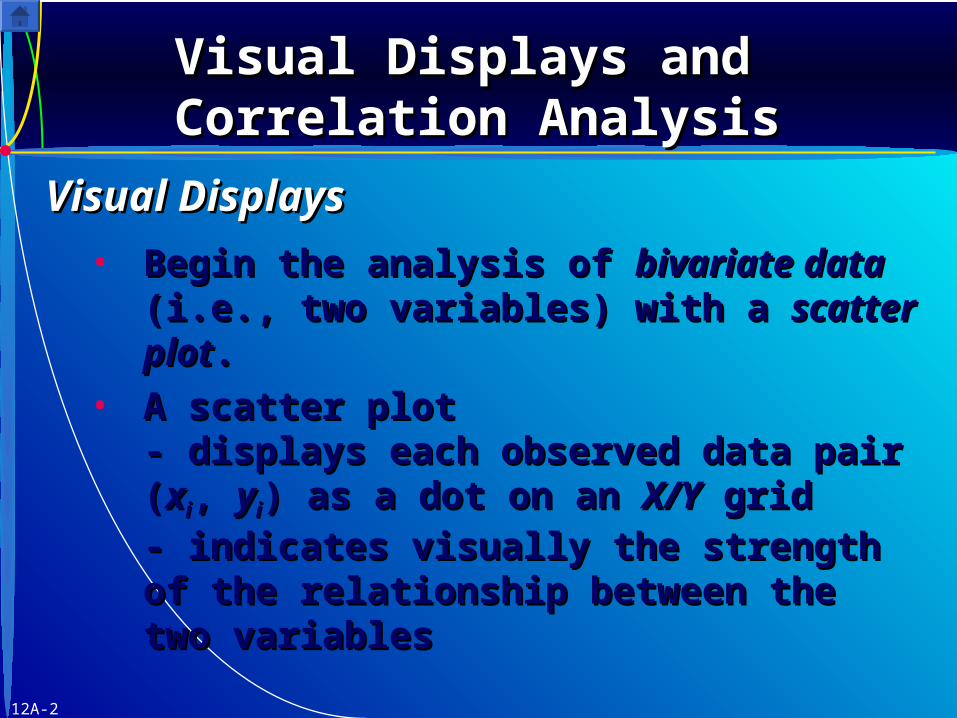
• Begin the analysis of Begin the analysis of bivariate databivariate data (i.e., (i.e., two variables) with a two variables) with a scatter plotscatter plot..
• A scatter plot A scatter plot - displays each observed data pair (- displays each observed data pair (xxii, , yyii) as ) as
a dot on an a dot on an X/YX/Y grid grid- indicates visually the strength of the - indicates visually the strength of the relationship between the two variablesrelationship between the two variables
Visual DisplaysVisual Displays

12A-3
Visual Displays and Visual Displays and Correlation AnalysisCorrelation Analysis
Visual DisplaysVisual Displays
Figure 12.1

12A-4
Visual Displays and Visual Displays and Correlation AnalysisCorrelation Analysis
• The The sample correlation coefficientsample correlation coefficient ( (rr) ) measures the degree of linearity in the measures the degree of linearity in the relationship between relationship between XX and and YY..
-1 -1 << rr << +1 +1
• rr = 0 indicates no linear relationship = 0 indicates no linear relationship• In Excel, use =CORREL(array1,array2), In Excel, use =CORREL(array1,array2),
where array1 is the range for where array1 is the range for XX and array2 and array2 is the range for is the range for YY..
Correlation AnalysisCorrelation Analysis
Strong negative relationshipStrong negative relationship Strong positive relationshipStrong positive relationship

12A-5
Visual Displays and Visual Displays and Correlation AnalysisCorrelation Analysis
Correlation AnalysisCorrelation Analysis

12A-6
Visual Displays and Visual Displays and Correlation AnalysisCorrelation Analysis
Correlation AnalysisCorrelation Analysis
Strong Positive Strong Positive CorrelationCorrelation
Weak Positive Weak Positive CorrelationCorrelation
12A-7
Visual Displays and Visual Displays and Correlation AnalysisCorrelation Analysis
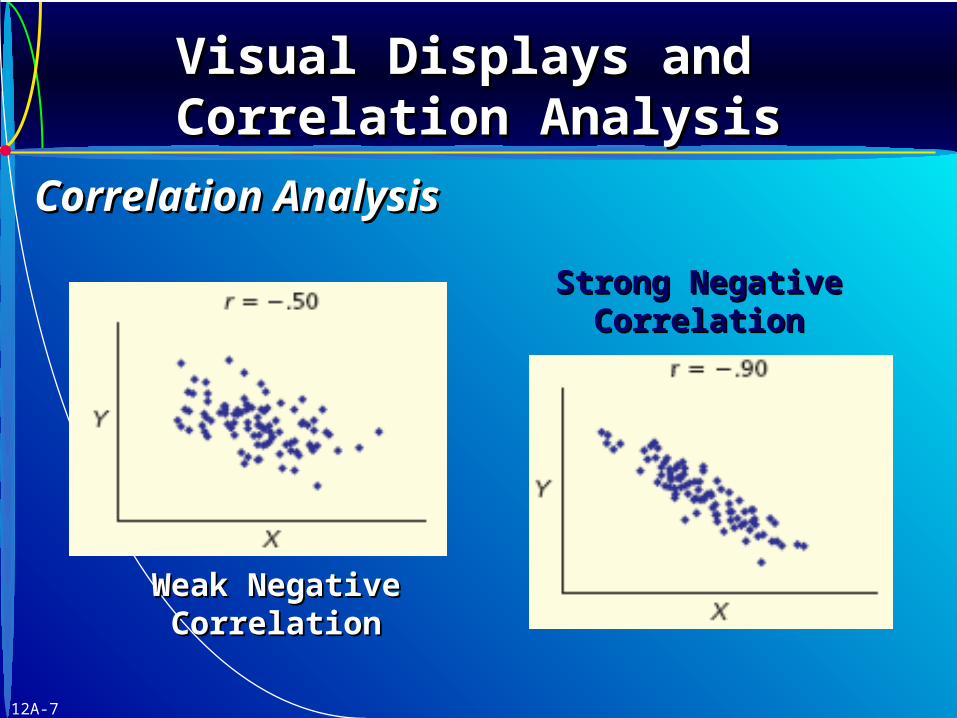
Correlation AnalysisCorrelation Analysis
Weak Negative Weak Negative CorrelationCorrelation
Strong Negative Strong Negative CorrelationCorrelation

12A-8
Visual Displays and Visual Displays and Correlation AnalysisCorrelation Analysis
Correlation AnalysisCorrelation Analysis
No CorrelationNo Correlation
Nonlinear RelationNonlinear Relation

12A-9
Visual Displays and Visual Displays and Correlation AnalysisCorrelation Analysis
• r r is an estimate of the population correlation is an estimate of the population correlation coefficient coefficient (rho). (rho).
• To test the hypothesis To test the hypothesis HH00: : = 0, the test = 0, the test statistic is:statistic is:
• The critical value The critical value tt is obtained from Appendix is obtained from Appendix D using D using = = nn – 2 degrees of freedom for any – 2 degrees of freedom for any ..
• Find the Find the pp-value using Excel’s function -value using Excel’s function =TDIST(t,deg_freedom,tails) or MINITAB.=TDIST(t,deg_freedom,tails) or MINITAB.
Tests for SignificanceTests for Significance
calc
12A-10
Visual Displays and Visual Displays and Correlation AnalysisCorrelation Analysis
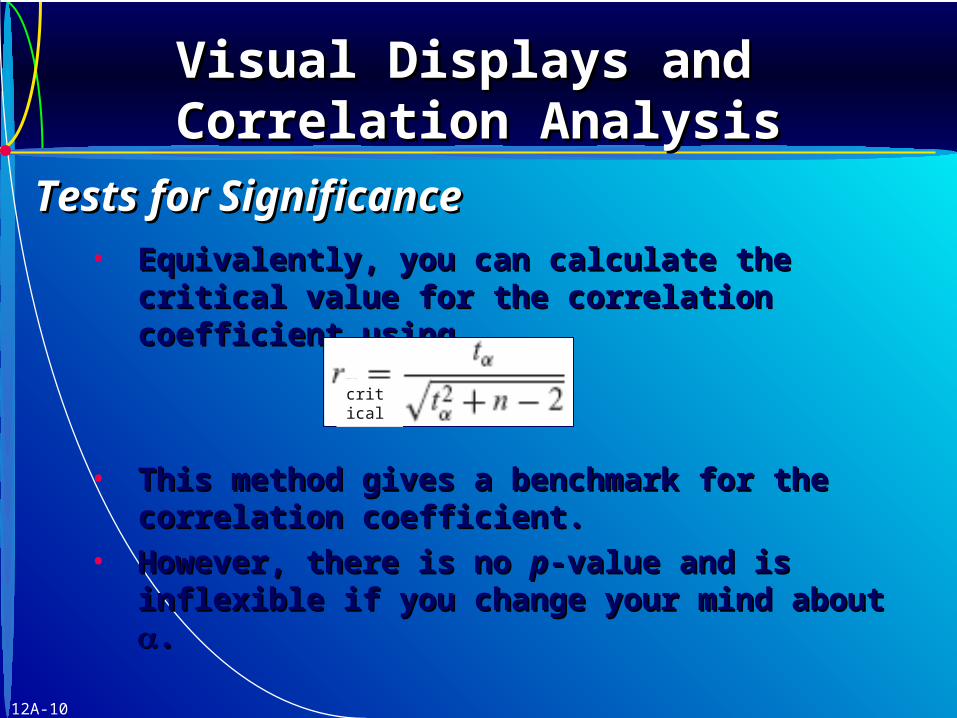
• Equivalently, you can calculate the critical Equivalently, you can calculate the critical value for the correlation coefficient usingvalue for the correlation coefficient using
• This method gives a benchmark for the This method gives a benchmark for the correlation coefficient.correlation coefficient.
• However, there is no However, there is no pp-value and is inflexible if -value and is inflexible if you change your mind about you change your mind about ..
Tests for SignificanceTests for Significance
critical

12A-11
Visual Displays and Visual Displays and Correlation AnalysisCorrelation Analysis
• Step 1: State the HypothesesStep 1: State the HypothesesDetermine whether you are using a one or two-Determine whether you are using a one or two-tailed test and the level of significance (tailed test and the level of significance ().).
HH00: : = 0 = 0
HH11: : ≠≠ 0 0
• Step 2: Specify the Decision RuleStep 2: Specify the Decision RuleFor degrees of freedom For degrees of freedom = = nn -2, look up the -2, look up the critical value critical value tt in Appendix D, then calculate in Appendix D, then calculate
Steps in Testing if Steps in Testing if = 0= 0

12A-12
Visual Displays and Visual Displays and Correlation AnalysisCorrelation Analysis
• Step 3: Calculate the Test StatisticStep 3: Calculate the Test Statistic
• Step 4: Make the DecisionStep 4: Make the DecisionIf the sample correlation coefficient If the sample correlation coefficient rr exceeds the critical value exceeds the critical value rr, then reject , then reject HH00..
If using the If using the tt statistic method, reject statistic method, reject HH00 if if tt > >
tt or if the or if the pp-value -value << ..
Steps in Testing if Steps in Testing if = 0= 0
calc

12A-13
Visual Displays and Visual Displays and Correlation AnalysisCorrelation Analysis
• A quick test for significance of a correlation A quick test for significance of a correlation at at = .05 is | = .05 is |rr| > 2/ n| > 2/ n
Quick Rule for SignificanceQuick Rule for Significance
Table 12.1

12A-14
Visual Displays and Visual Displays and Correlation AnalysisCorrelation Analysis
• AutocorrelationAutocorrelation is a special type of is a special type of correlation analysis useful in business for correlation analysis useful in business for time series data.time series data.
• The The autocorrelation coefficient autocorrelation coefficient is the is the simple correlation between ysimple correlation between ytt and y and yt-kt-k
where k is any lagwhere k is any lag
AutocorrelationAutocorrelation

12A-15
Bivariate RegressionBivariate Regression
• Bivariate Regression Bivariate Regression analyzes the analyzes the relationship between two variables.relationship between two variables.
• It specifies one It specifies one dependentdependent ( (responseresponse) ) variable and one variable and one independentindependent ( (predictorpredictor) ) variable.variable.
• This hypothesized relationship may be This hypothesized relationship may be linear, quadratic, or whatever.linear, quadratic, or whatever.
What is Bivariate Regression?What is Bivariate Regression?

12A-16
Bivariate RegressionBivariate Regression
Model FormModel Form
Figure 12.6
12A-17
Regression TerminologyRegression Terminology
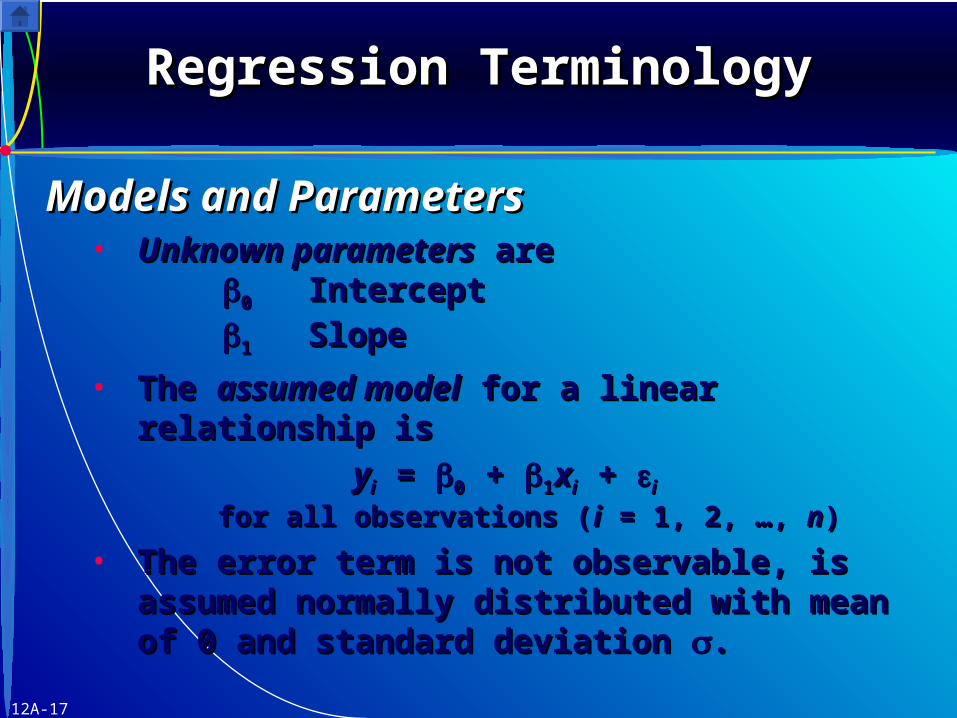
• Unknown parametersUnknown parameters are are00 InterceptIntercept
11 SlopeSlope
• The The assumed modelassumed model for a linear relationship is for a linear relationship is
yyii = = 00 + + 11xxii + + ii
for all observations (for all observations (ii = 1, 2, …, = 1, 2, …, nn))
• The error term is not observable, is assumed The error term is not observable, is assumed normally distributed with mean of 0 and normally distributed with mean of 0 and standard deviation standard deviation ..
Models and ParametersModels and Parameters

12A-18
Regression TerminologyRegression Terminology
• The The fitted modelfitted model used to predict the used to predict the expectedexpected value of value of YY for a given value of for a given value of XX is is
yyii = = bb00 + + bb11xxii
Models and ParametersModels and Parameters
• The The fitted coefficientsfitted coefficients are areb0 the estimated interceptb1 the estimated slope
• Residual is Residual is eeii = = yyii - - yyii..
• Residuals may be used to estimate Residuals may be used to estimate , the , the standard deviation of the errors.standard deviation of the errors.
^̂
^̂

12A-19
Regression TerminologyRegression Terminology
• Step 1: Step 1: - Highlight the data columns.- Highlight the data columns.- Click on the Chart Wizard and choose - Click on the Chart Wizard and choose Scatter PlotScatter Plot- In the completed graph, click once on the - In the completed graph, click once on the points in the scatter plot to select the datapoints in the scatter plot to select the data- Right-click and choose Add Trend line- Right-click and choose Add Trend line- Choose Options and check Display - Choose Options and check Display EquationEquation
Fitting a Regression on a Scatter Plot in Fitting a Regression on a Scatter Plot in ExcelExcel

12A-20
Regression TerminologyRegression Terminology
Fitting a Regression on a Scatter Plot in Fitting a Regression on a Scatter Plot in ExcelExcel
Figure 12.8
12A-21
Regression TerminologyRegression Terminology
12A-22
Ordinary Least Squares FormulasOrdinary Least Squares Formulas
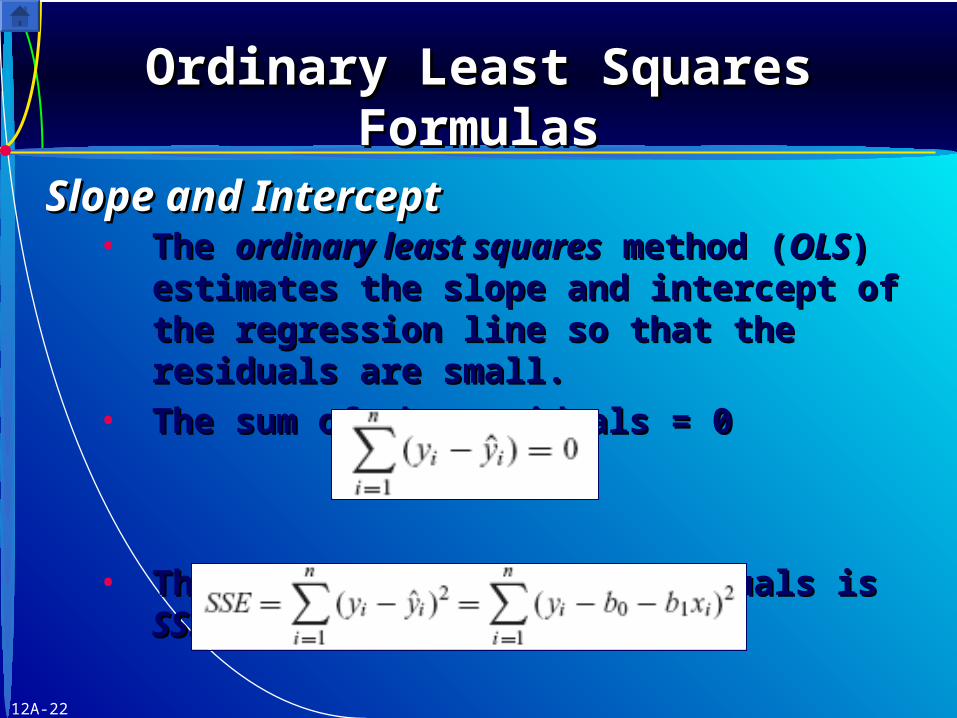
• The The ordinary least squaresordinary least squares method ( method (OLSOLS) ) estimates the slope and intercept of the estimates the slope and intercept of the regression line so that the residuals are small.regression line so that the residuals are small.
• The sum of the residuals = 0The sum of the residuals = 0
• The sum of the squared residuals is The sum of the squared residuals is SSESSE
Slope and InterceptSlope and Intercept
12A-23
Ordinary Least Squares FormulasOrdinary Least Squares Formulas
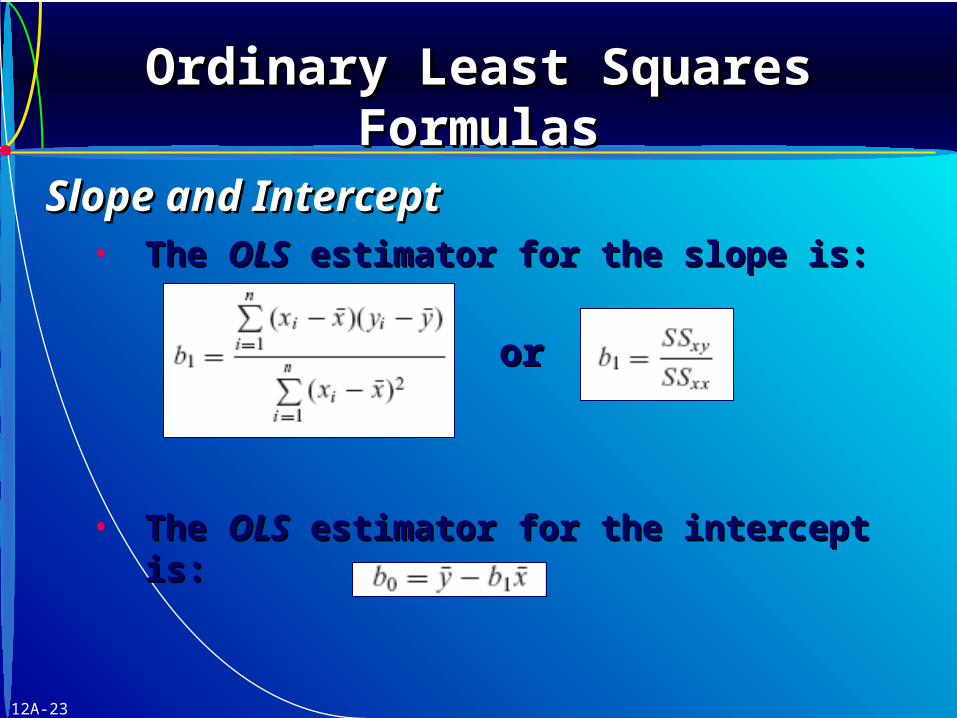
• The The OLSOLS estimator for the slope is: estimator for the slope is:
• The The OLSOLS estimator for the intercept is: estimator for the intercept is:
Slope and InterceptSlope and Intercept
oror

12A-24
Ordinary Least Squares FormulasOrdinary Least Squares Formulas
• We want to explain the total variation in We want to explain the total variation in YY around its mean (around its mean (SSTSST for for Total Sums of Total Sums of SquaresSquares))
• The regression sum of squares (The regression sum of squares (SSRSSR) is the ) is the explained variation explained variation in in YY
Assessing FitAssessing Fit
12A-25
Ordinary Least Squares FormulasOrdinary Least Squares Formulas
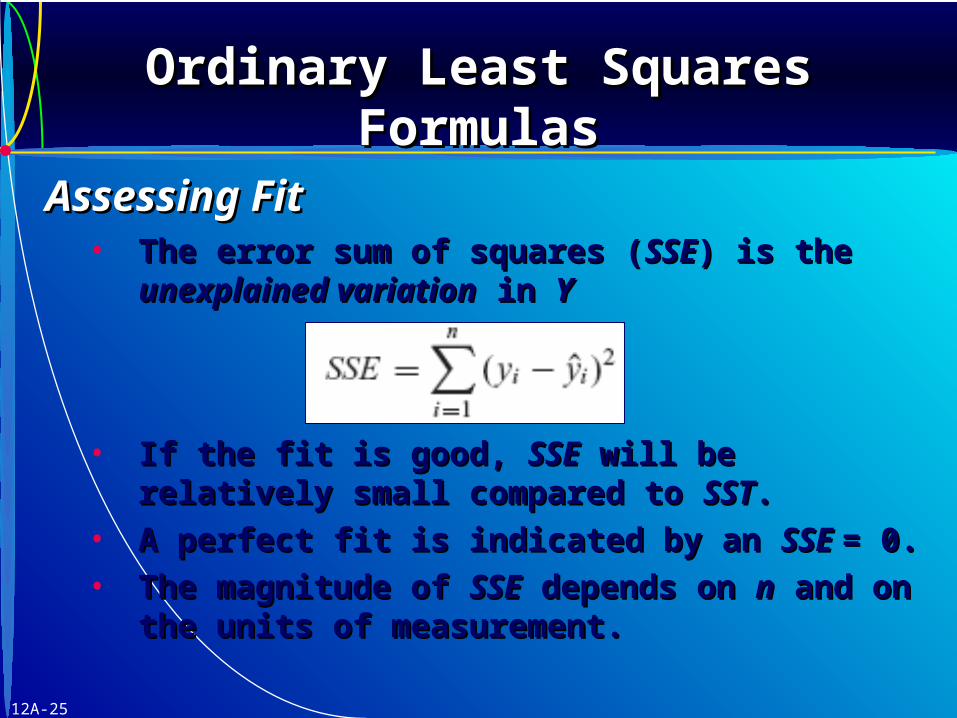
• The error sum of squares (The error sum of squares (SSESSE) is the ) is the unexplained variationunexplained variation in in YY
• If the fit is good, If the fit is good, SSESSE will be relatively small will be relatively small compared to compared to SSTSST..
• A perfect fit is indicated by an A perfect fit is indicated by an SSE SSE = 0.= 0.
• The magnitude of The magnitude of SSESSE depends on depends on nn and on and on the units of measurement.the units of measurement.
Assessing FitAssessing Fit

12A-26
Ordinary Least Squares FormulasOrdinary Least Squares Formulas
Coefficient of DeterminationCoefficient of Determination
0 0 << RR22 << 1 1
• Often expressed as a percent, an Often expressed as a percent, an RR22 = 1 = 1 (i.e., 100%) indicates perfect fit.(i.e., 100%) indicates perfect fit.
• In a bivariate regression, In a bivariate regression, RR2 2 = (= (rr))22
• RR22 is a measure of is a measure of relative fitrelative fit based on a based on a comparison of comparison of SSR SSR and and SSTSST..
12A-27
Tests for SignificanceTests for Significance
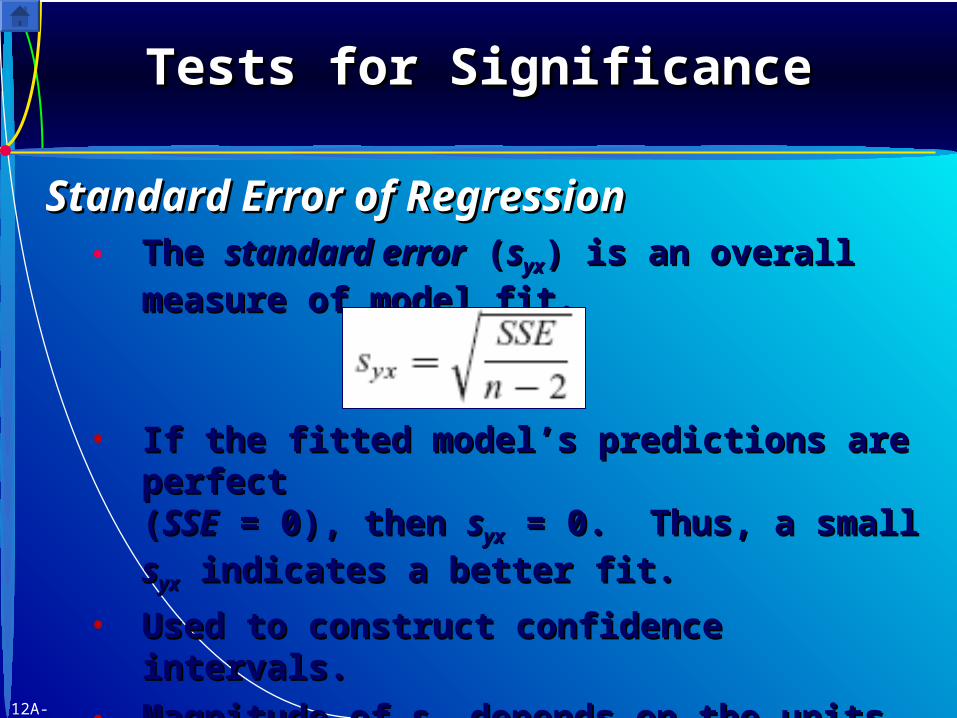
• The The standard errorstandard error ( (ssyxyx) is an overall measure ) is an overall measure
of model fit.of model fit.
Standard Error of RegressionStandard Error of Regression
• If the fitted model’s predictions are perfect If the fitted model’s predictions are perfect ((SSESSE = 0), then = 0), then ssyxyx = 0. Thus, a small = 0. Thus, a small ssyxyx
indicates a better fit.indicates a better fit.• Used to construct confidence intervals. Used to construct confidence intervals.
• Magnitude of Magnitude of ssyxyx depends on the units of depends on the units of
measurement of measurement of YY and on data magnitude. and on data magnitude.

12A-28
Tests for SignificanceTests for Significance
• Standard error of the slope:Standard error of the slope: Confidence Intervals for Slope and InterceptConfidence Intervals for Slope and Intercept
• Standard error of the intercept:Standard error of the intercept:
12A-29
Tests for SignificanceTests for Significance
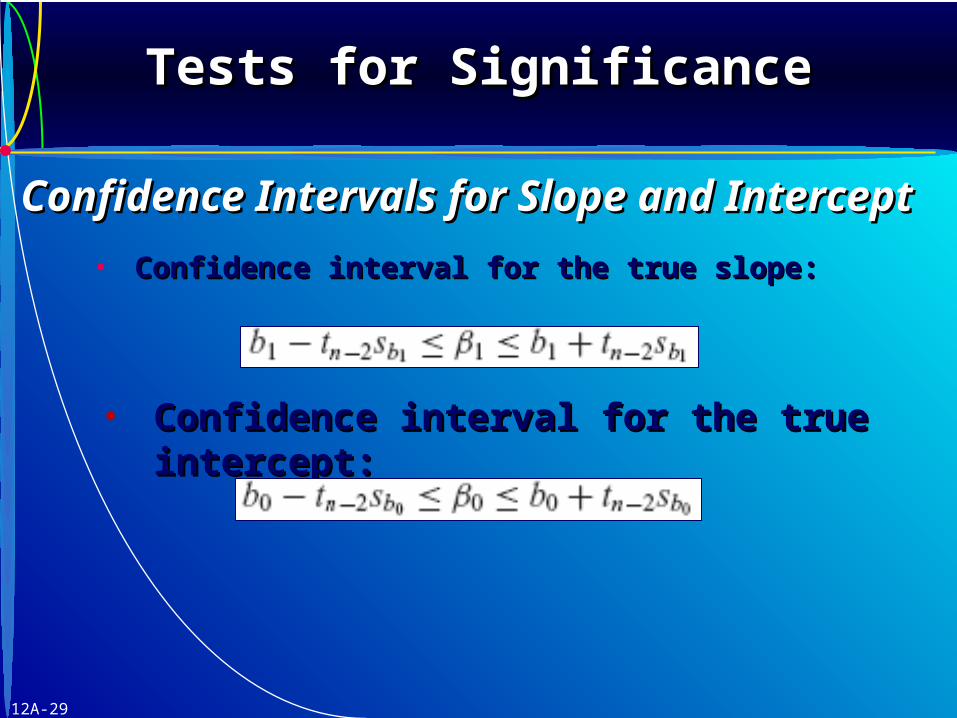
• Confidence interval for the true slope:Confidence interval for the true slope:
Confidence Intervals for Slope and InterceptConfidence Intervals for Slope and Intercept
• Confidence interval for the true intercept:Confidence interval for the true intercept:

12A-30
Tests for SignificanceTests for Significance
• If If 11 = 0, then = 0, then XX cannot influence cannot influence YY and the and the
regression model collapses to a constant regression model collapses to a constant 00
plus random error.plus random error.
• The hypotheses to be tested are:The hypotheses to be tested are:
Hypothesis TestsHypothesis Tests

12A-31
Tests for SignificanceTests for Significance
• A A tt test is used with test is used with = = nn – 2 degrees of freedom – 2 degrees of freedomThe test statistics for the slope and intercept are:The test statistics for the slope and intercept are:
Hypothesis TestsHypothesis Tests
• ttnn-2-2 is obtained from Appendix D or Excel for a is obtained from Appendix D or Excel for a
given given . .
• Reject Reject HH00 if if tt > > tt or if or if pp-value -value << . .
Slope:Slope:
Intercept:Intercept:
calc
calc
12A-32
Tests for SignificanceTests for Significance
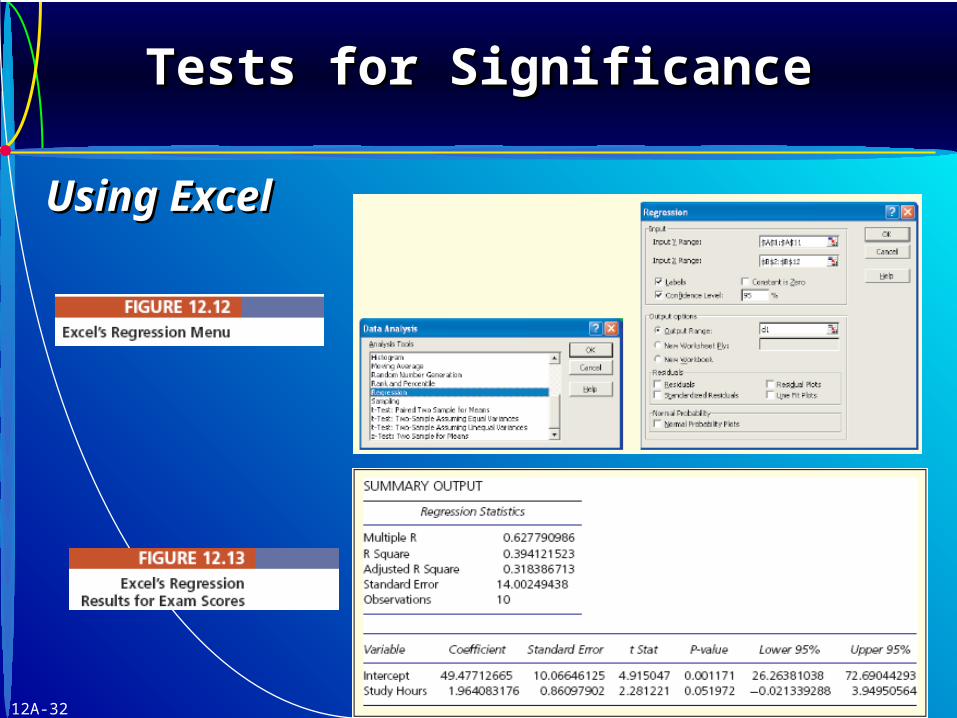
Using ExcelUsing Excel
12A-33
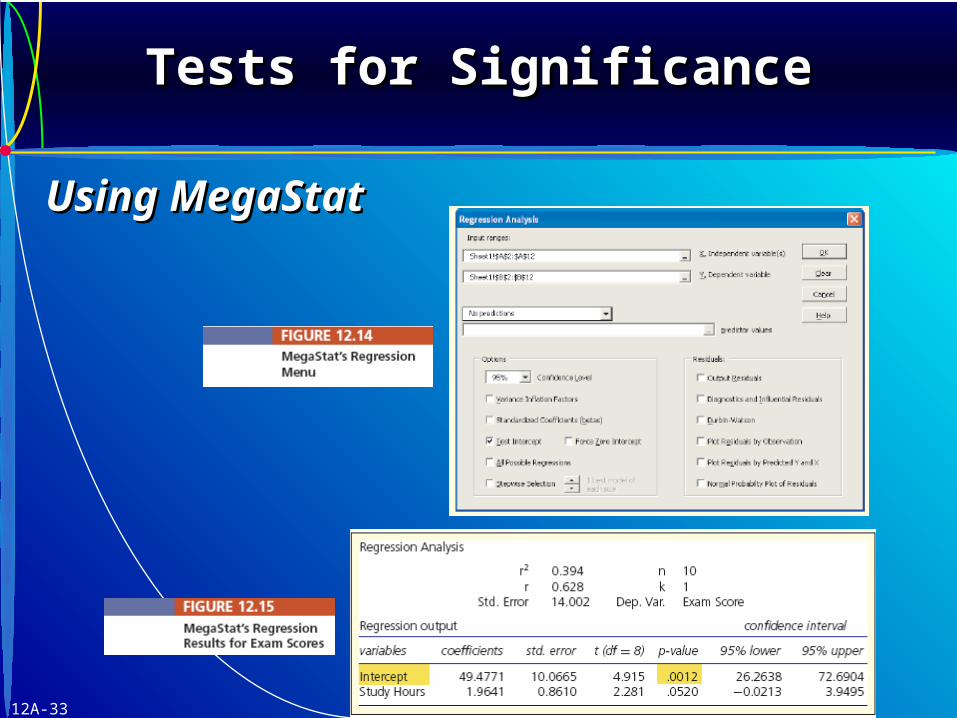
Tests for SignificanceTests for Significance
Using MegaStatUsing MegaStat
12A-34
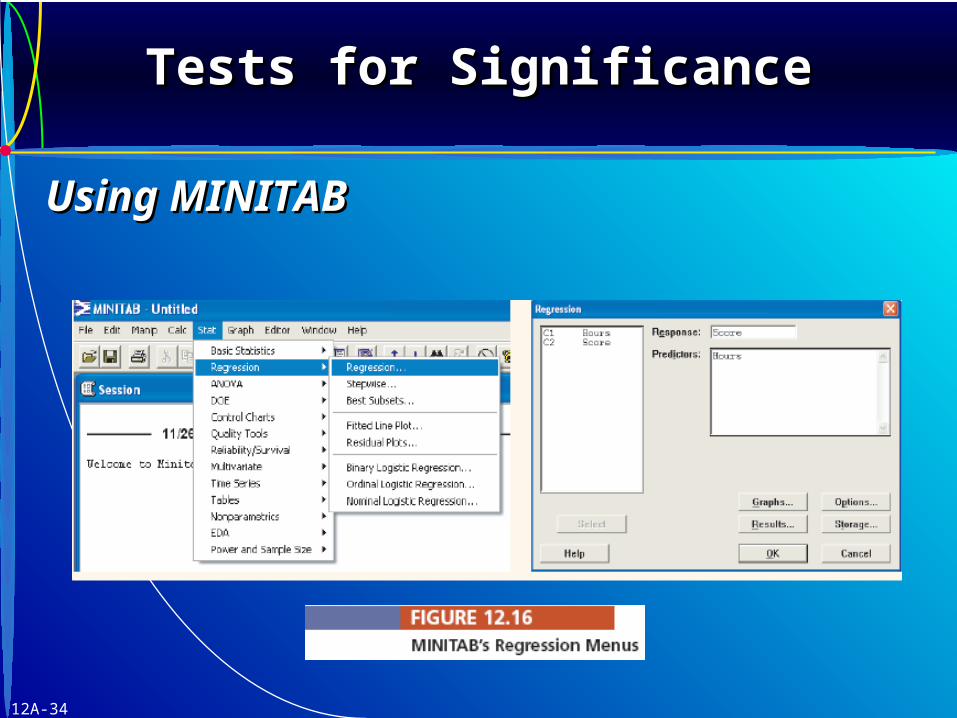
Tests for SignificanceTests for Significance
Using MINITABUsing MINITAB
12A-35
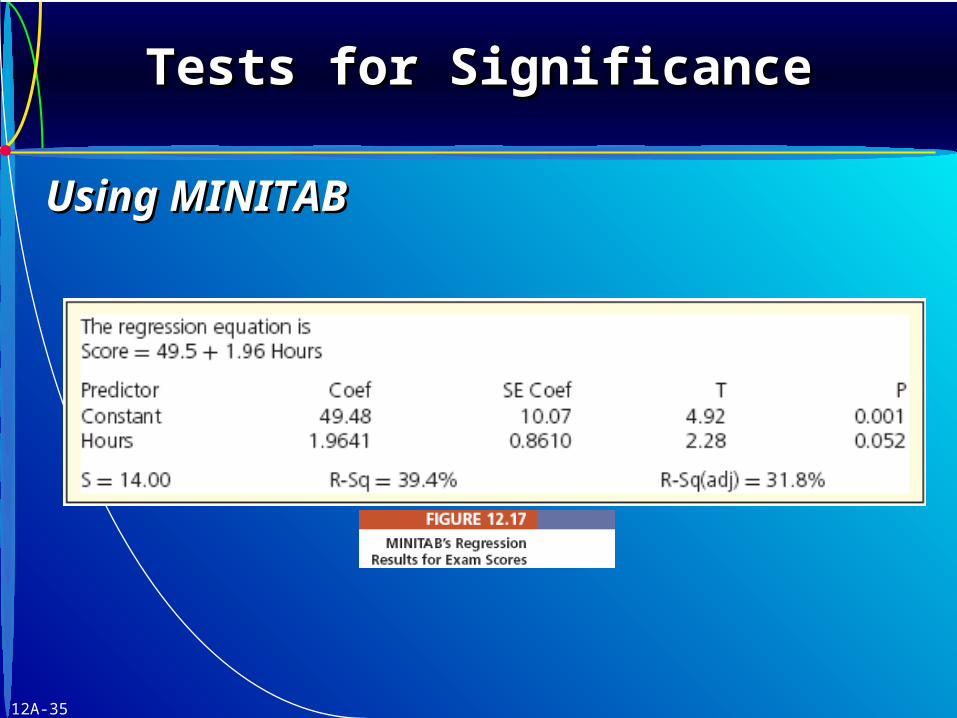
Tests for SignificanceTests for Significance
Using MINITABUsing MINITAB

Applied Statistics in Applied Statistics in Business & EconomicsBusiness & Economics
End of Chapter End of Chapter 12A12A
12A-36