Bivariate Description Heibatollah Baghi, and Mastee Badii.
31
Bivariate Description Bivariate Description Heibatollah Baghi, and Mastee Badii
-
Upload
candice-bond -
Category
Documents
-
view
224 -
download
0
Transcript of Bivariate Description Heibatollah Baghi, and Mastee Badii.

Bivariate DescriptionBivariate Description
Heibatollah Baghi, and
Mastee Badii

2
OBJECTI VESOBJECTI VES
Define bivariate and univariate statistical tests.
Explain when to use correlational techniques to answer research questions.
Understand measure of Pearson Product Moment Correlation Coefficient (Pearson’s r).

3
DefinitionsDefinitions
Univariate: examination of variable’s frequency distribution, central tendency, and variability.
Bivariate: examination of two variables simultaneously. – Is SES related to intelligence? – Do SAT scores have anything to do with how
well one does in college? • The question is: do these variables correlate or
covary?
4
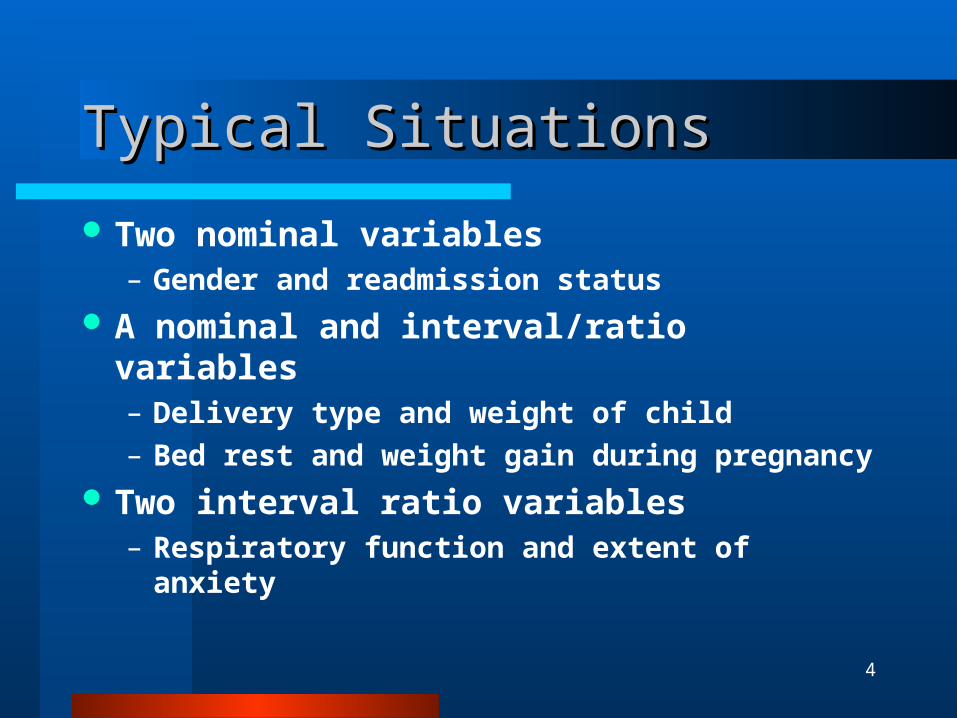
Typical SituationsTypical Situations
Two nominal variables– Gender and readmission status
A nominal and interval/ratio variables– Delivery type and weight of child– Bed rest and weight gain during pregnancy
Two interval ratio variables– Respiratory function and extent of anxiety

5
Cross TabulationCross Tabulation
Describes relationship between two nominal variables
Two dimensional frequency distribution
Male Female TotalReadmitted 15 (30%) 10 (20%) 25Not readmitted 35 (70%) 40 (80%) 75Total 50 50 100
Readmission statusGender
Also appropriate if either or both variables are ordinal-level with a small number of categories

6
Elements of Cross TabulationElements of Cross Tabulation
Colum
n
Row

7
Elements of Cross TabulationElements of Cross Tabulation
Cell countRow %
Column %Total %

8
Elements of Cross Tabulation Elements of Cross Tabulation
Marginal
Marginal
Joint distribution

9
Group Mean ComparisonGroup Mean Comparison
Describes a nominal variable and an interval/ratio variable

10
The correlation coefficient is a bivariate statistic that measures the degree of linear association between two interval/ratio level variables. (Pearson Product Moment Correlation Coefficient)
Linear AssociationLinear Association

11
Reveals the presence of association between two variables. The stronger the relationship, the more the data points cluster along an imaginary line.
Indicates the direction of the relationship.
Reveals the presence of outliers.
Scatter plotScatter plot

12
Scatter Plot of Positively Correlated DataScatter Plot of Positively Correlated Data

13
Scatter Plot of Negatively Correlated DataScatter Plot of Negatively Correlated Data

14
Scatter Plot of Non Linear DataScatter Plot of Non Linear Data

15
Scatter Plot of Uncorrelated DataScatter Plot of Uncorrelated Data

16
Covariance FormulaCovariance Formula

17
Correlation FormulaCorrelation Formula
Covariance of X & Y
StandardDeviation of
X
StandardDeviation of
Y

18
Sum 30.80 6550.0
Mean 2.57 545.80
S.D. 0.54 128.73
GPA SAT
ID Y X
A 1.6 400
B 2 350
C 2.2 500
D 2.8 400
E 2.8 450
F 2.6 550
G 3.2 550
H 2 600
I 2.4 650
J 3.4 650
K 2.8 700
L 3 750
Example DataExample Data

19
STUDENTS Y(GPA) X(SAT)
A 1.6 400
B 2.0 350
C 2.2 500
D 2.8 400
E 2.8 450
F 2.6 550
G 3.2 550
H 2.0 600
I 2.4 650
J 3.4 650
K 2.8 700
L 3.0 750
Sum 30.80 6550.0
Mean 2.57 545.80
S.D. 0.54 128.73
)X - (X)Y - (Y )X - (X )Y - (Y

20
STUDENTS Y(GPA) X(SAT)
A 1.6 400 -0.97
B 2.0 350 -0.57
C 2.2 500 -0.37
D 2.8 400 0.23
E 2.8 450 0.23
F 2.6 550 0.03
G 3.2 550 0.63
H 2.0 600 -0.57
I 2.4 650 -0.17
J 3.4 650 0.83
K 2.8 700 0.23
L 3.0 750 0.43
Sum 30.80 6550.0
Mean 2.57 545.80
S.D. 0.54 128.73
)X - (X)Y - (Y )X - (X )Y - (Y

21
STUDENTS Y(GPA) X(SAT)
A 1.6 400 -0.97 -145.80
B 2.0 350 -0.57 -195.80
C 2.2 500 -0.37 -45.80
D 2.8 400 0.23 -145.80
E 2.8 450 0.23 -95.80
F 2.6 550 0.03 4.20
G 3.2 550 0.63 4.20
H 2.0 600 -0.57 54.20
I 2.4 650 -0.17 104.20
J 3.4 650 0.83 104.20
K 2.8 700 0.23 154.20
L 3.0 750 0.43 204.20
Sum 30.80 6550.0
Mean 2.57 545.80
S.D. 0.54 128.73
)X - (X)Y - (Y )X - (X )Y - (Y

22
STUDENTS Y(GPA) X(SAT)
A 1.6 400 -0.97 -145.80 141.43
B 2.0 350 -0.57 -195.80 111.61
C 2.2 500 -0.37 -45.80 16.95
D 2.8 400 0.23 -145.80 -33.53
E 2.8 450 0.23 -95.80 -22.03
F 2.6 550 0.03 4.20 0.13
G 3.2 550 0.63 4.20 2.65
H 2.0 600 -0.57 54.20 -30.89
I 2.4 650 -0.17 104.20 -17.71
J 3.4 650 0.83 104.20 86.49
K 2.8 700 0.23 154.20 35.47
L 3.0 750 0.43 204.20 87.81
Sum 30.80 6550.0 378.33
Mean 2.57 545.80
S.D. 0.54 128.73
)X - (X)Y - (Y )X - (X )Y - (Y

23
Calculation of Covariance & Calculation of Covariance & CorrelationCorrelation

24
Correlations in SPSSCorrelations in SPSS

Limitation of the CovarianceLimitation of the Covariance
It is metric-dependent

26
Properties of Pearson rProperties of Pearson r
r is metric-independent r reflects the direction of the
relationship r reflects the magnitude of the
relationship

27
What does positive correlation mean?What does positive correlation mean?
Scores above the mean on X tend to be associated with scores above the mean on Y
Scores below the mean on X tend to be accompanied by scores below the mean of Y
Note for this reason deviation score is an important part of Covariance

28
What does negative correlation mean?What does negative correlation mean?
Scores above the mean on X tend to be associated with scores below the mean on Y
Scores below the mean on X tend to be accompanied by scores above the mean of Y.

29
Strength of associationStrength of association
r2 = Coefficient of determination
1 – r2 = Coefficient of non-determination

30
Analysis of RelationshipsAnalysis of Relationships

31
Take Home LessonsTake Home Lessons Always make a scatter plot
See the data first Examining the scatter plot is not enough A single number can represent the degree
and direction of the linear relation between two variables


![Smart City Control Room Dashboards Exploiting Big Data ...ksiresearchorg.ipage.com/seke/dms18paper/dms18paper_20.pdfHttp:// [Badii et al., 2017], [Bellini et al., 2014]. Please note](https://static.fdocuments.in/doc/165x107/5e67acfb4de32910f55c7922/smart-city-control-room-dashboards-exploiting-big-data-http-badii-et-al.jpg)