Bis
115
88 BIS 82nd Annual Report * The Compliance and Operational Risk Unit has direct access to the Audit Committee on compliance matters. Finance General Manager Deputy General Manager Board of Directors Chairman of the Board Internal Audit Committee on Payment and Settlement Systems Markets Committee Central Bank Governance Group Representative Office for Asia and the Pacific Financial Stability Board Secretariat International Association of Insurance Supervisors International Association of Deposit Insurers Administrative Committee Financial Stability Institute Legal Service Banking Department Treasury Asset Management Banking Operational Services Financial Analysis General Secretariat Building, Security and Logistics Communications Human Resources Information Management Services Meeting Services Monetary and Economic Department Policy, Coordination & Administration Research & Statistics Committee on the Global Financial System Basel Committee on Banking Supervision Banking and Risk Management Committee Audit Committee Nomination Committee Risk Control Board Secretariat Irving Fisher Committee Representative Office for the Americas Compliance & Operational Risk* Organisation of the BIS as at 31 March 2012
-
Upload
dominic-a-ienco -
Category
Documents
-
view
3.276 -
download
1
description
BANK FOR INTERNATIONAL SETTLEMENTS
Transcript of Bis

88 BIS 82nd Annual Report
* The Compliance and Operational Risk Unit has direct access to the Audit Committee on compliance matters.
Finance
General Manager
Deputy General Manager
Board of Directors
Chairman of the Board
Internal Audit
Committee on Payment and
Settlement Systems
Markets Committee
Central Bank Governance
Group
Representative Office for Asia and the Pacific
Financial Stability Board
Secretariat
International Association of
Insurance Supervisors
International Association of Deposit Insurers
AdministrativeCommittee
FinancialStability Institute
Legal Service
Banking Department
Treasury
Asset Management
Banking Operational
Services
Financial Analysis
General Secretariat
Building, Security and Logistics
Communications
Human Resources
Information Management
Services
Meeting Services
Monetary and Economic
Department
Policy, Coordination & Administration
Research & Statistics
Committee on the Global Financial
System
Basel Committee on Banking Supervision
Banking and Risk
ManagementCommittee
AuditCommittee
NominationCommittee
Risk Control
Board Secretariat
Irving Fisher Committee
Representative Office for the
Americas
Compliance &
Operational Risk*
Organisation of the BIS as at 31 March 2012
* Direct access to the Audit Committee on compliance matters
Organisation of the BIS as at 31 March 2012

89BIS 82nd Annual Report
The BIS: mission, activities, governance and financial results
The mission of the Bank for International Settlements (BIS) is to serve central banks in their pursuit of monetary and financial stability, to foster international cooperation in those areas and to act as a bank for central banks.
In the light of the Bank’s mission, this chapter reviews the activities of the BIS, and of the groups it hosts, for the financial year 2011/12; describes the institutional framework that supports their work; and presents the year’s financial results.
In broad outline, the BIS pursues its mission by:• promotingdiscussionandfacilitatingcollaborationamongcentralbanks;• supporting dialogue with other authorities that are responsible for
promoting financial stability;• conducting research on policy issues confronting central banks and
financial supervisory authorities;• acting as a prime counterparty for central banks in their financial
transactions; and• servingasanagentor trustee inconnectionwith international financial
operations.The BIS promotes international cooperation on monetary and financial
policy through its meetings programmes for officials from central banks and financial sector supervisory authorities and through the Basel Process – hosting international committees and standard-setting bodies and facilitating their interaction in an efficient and cost-effective way.
In particular, the BIS hosts the Financial Stability Board (FSB). The BIS supports the FSB’s objectives, which are to coordinate at the international level the work of national financial authorities and international standard-setting bodies in order to develop and promote the implementation of effective regulatory, supervisory and other financial sector policies and, in collaboration with the international financial institutions, to address vulnerabilities affecting financial systems in the interest of global financial stability.
The BIS research and statistics function addresses the needs of monetary and supervisory authorities for data and policy insight.
The BIS banking function provides prime counterparty, agent and trustee services appropriate to the BIS mission.
The meetings programmes and the Basel Process
The BIS promotes international financial and monetary cooperation in two major ways: • through hosting bimonthly and other meetings of central bank officials; and • through the Basel Process, which facilitates cooperation among the
committees and standard-setting bodies hosted by the BIS in Basel.

90 BIS 82nd Annual Report
Bimonthly meetings and other regular consultations
At bimonthly meetings, normally held in Basel, Governors and other senior officials of BIS member central banks discuss current developments and the outlook for the world economy and financial markets. They also exchange views and experiences on issues of special and topical interest to central banks. In addition to the bimonthly meetings, the Bank regularly hosts gatherings that variously include public and private sector representatives and the academic community.
The two principal bimonthly meetings are the Global Economy Meeting and the All Governors’ Meeting.
Global Economy Meeting
The Global Economy Meeting (GEM) comprises the Governors from 30 BIS member central banks in major advanced and emerging market economies that account for about four fifths of global GDP. Governors from another 19 central banks attend the GEM as observers.1 The GEM has two main roles: (i) monitoring and assessing developments, risks and opportunities in the world economy and the global financial system; and (ii) providing guidance to three Basel-based central bank committees – the Committee on the Global Financial System, the Committee on Payment and Settlement Systems and the Markets Committee. The GEM also receives reports from the chairs of those committees and decides on publication.
As the Global Economy Meeting is quite large, it is supported by an informal group called the Economic Consultative Committee (ECC). Limited to 18 participants, the ECC includes all BIS Board member Governors, the central bank Governors from India and Brazil, and the BIS General Manager. The ECC assembles proposals for consideration by the GEM. In addition, the ECC Chairman initiates recommendations to the GEM on the appointment of chairs of the three central bank committees mentioned above and on the composition and organisation of those committees.
Mervyn King, Governor of the Bank of England, was elected by the BIS Board as Chairman of both the GEM and the ECC with effect from 1 November 2011. He replaced Jean-Claude Trichet, who retired from his post as President of the ECB with effect from the same date.
All Governors’ Meeting
The All Governors’ Meeting comprises the Governors of the BIS’s 60 member central banks and is chaired by the BIS Chairman. It convenes during the bimonthly meetings to discuss selected topics of general interest to its members. In 2011/12, the topics discussed were:
1 The members of the GEM are the central bank Governors of Argentina, Australia, Belgium, Brazil, Canada, China, France, Germany, Hong Kong SAR, India, Indonesia, Italy, Japan, Korea, Malaysia, Mexico, the Netherlands, Poland, Russia, Saudi Arabia, Singapore, South Africa, Spain, Sweden, Switzerland, Thailand, Turkey, the United Kingdom and the United States and also the President of the European Central Bank and the President of the Federal Reserve Bank of New York. The Governors attending as observers are from Algeria, Austria, Chile, Colombia, the Czech Republic, Denmark, Finland, Greece, Hungary, Ireland, Israel, Luxembourg, New Zealand, Norway, Peru, the Philippines, Portugal, Romania and the United Arab Emirates.

91BIS 82nd Annual Report
• increased investment in commodity-related financial products and howthis affects commodity markets;
• currentissuesingloballiquidity;• indebtedness,risksandgrowth;• theeconomiceffectsofcentralbankbondpurchaseprogrammes;• thepolicyrelevanceofcentralbankfinances;and• internet-basedeconomicindicators:implicationsforcentralbanks.
The membership of two other groups – the Central Bank Governance Group, which also meets during the bimonthly meetings, and the Irving Fisher Committee on Central Bank Statistics – goes beyond that of the GEM, and hence, by agreement with the GEM and the BIS Board, the All Governors’ Meeting is responsible for overseeing the work of those two groups.
Other regular consultations
During the bimonthly meetings, Governors of central banks in (i) major emerging markets and (ii) small open economies gather to discuss themes of special relevance to their economies.
The Bank hosts regular meetings of the Group of Central Bank Governors and Heads of Supervision (GHOS), which oversees the work of the Basel Committee on Banking Supervision. The GHOS met twice during the year to consider the Basel Committee’s proposed measures for global systemically important banks (G-SIBs) and for assessing implementation of the Basel regulatory framework. At its June meeting, the GHOS agreed on a set of G-SIB proposals, including a methodology for assessing systemic importance, the additional capital G-SIBs will be required to maintain and the arrangements by which the requirements will be phased in. At its January meeting, the GHOS endorsed the Basel Committee’s strategy for identifying differences in member countries’ approaches that could raise prudential or level playing field concerns. The strategy is to monitor each member country’s adoption of the globally agreed rules and review members’ compliance with the international minimum standards.
The Bank regularly arranges informal discussions among public and private sector representatives that focus on their shared interests in promoting a sound and well functioning international financial system. In addition, for senior central bank officials, the Bank organises various meetings to which other financial authorities, the private financial sector and the academic community are invited to contribute. These meetings include:• themeetingsoftheworkingpartiesondomesticmonetarypolicy,heldin
Basel but also hosted at a regional level by a number of central banks in Asia, central and eastern Europe, and Latin America;
• themeetingofDeputyGovernorsofemergingmarketeconomies;and• the high-levelmeetings organised by the Financial Stability Institute in
various regions of the world for Governors and Deputy Governors and heads of supervisory authorities.Other meetings this year included two that are organised for senior
central bankers on a less frequent basis:• a special BIS meeting for Caribbean and Latin American central bank

92 BIS 82nd Annual Report
Governors held in Basel on the occasion of the BIS Annual General Meeting in June 2011; and
• aMay2011BISmeetingofGovernorsandseniorofficialsfromAfricaandother regions to discuss the monetary and financial stability issues facing Africa in the wake of the global financial crisis.
The Basel Process
The Basel Process refers to the facilitative role of the BIS in hosting and supporting the work of the international secretariats engaged in standard setting and the pursuit of financial stability. A key example of the Basel Process is the support the BIS provides to the Financial Stability Board, which coordinates the work of national financial authorities and international standard-setting bodies and whose work programme has been endorsed by the G20 heads of state and government. Another aspect of the Basel Process is the mandate given by the BIS to its own Financial Stability Institute (FSI) to assist financial sector supervisory authorities worldwide in strengthening oversight of their financial systems.
Features of the Basel Process
The Basel Process is based on four key features: (i) the synergies of co-location; (ii) flexibility and openness in the exchange of information; (iii) support from the economic research expertise and banking experience of the BIS; and (iv) the dissemination of work.
Synergies. The BIS hosts the secretariats of nine groups, including the FSB, that contribute to the pursuit of financial stability. These groups have their own governance arrangements and reporting lines.
Various groupings of central banks and supervisory authorities set the agendas of the following six:• the Basel Committee on Banking Supervision (BCBS): develops global
regulatory standards for banks and addresses supervision at the level of individual institutions and as it relates to macroprudential supervision;
• the Committee on the Global Financial System (CGFS): monitors andanalyses the broad issues relating to financial markets and systems;
• the Committee on Payment and Settlement Systems (CPSS): analysesand sets standards for payment, clearing and settlement infrastructures;
• theMarketsCommittee:examinesthefunctioningoffinancialmarkets;• the Central Bank Governance Group: examines issues related to the
design and operation of central banks; and• the Irving Fisher Committee on Central Bank Statistics (IFC): addresses
statistical issues of concern to central banks, including those relating to economic, monetary and financial stability.
The remaining three groups hosted at the BIS are:• theFSB;• theInternationalAssociationofDepositInsurers(IADI);and• theInternationalAssociationofInsuranceSupervisors(IAIS).

93BIS 82nd Annual Report
The physical proximity of these nine groups at the BIS creates synergies that, regardless of the variation in governance arrangements, produce a broad and fruitful exchange of ideas. In addition, by limiting costs through economies of scale, the Basel Process represents a prudent use of public funds.
Flexibility. The limited size of these groups leads to flexibility and openness in the exchange of information, thereby enhancing the coordination of their work on financial stability issues and avoiding overlaps and gaps in their work programmes. At the same time, their output is much larger than their limited size would suggest, as they are able to leverage the expertise of the international community of central bankers, financial regulators and supervisors, and other international and national public authorities.
Supportive BIS expertise and experience. The work of the Basel-based committees is informed by the BIS’s economic research as well as its banking experience. The latter is derived from the BIS Banking Department’s working relationships with market participants and its implementation of regulatory standards and financial controls for the conduct of its banking operations.
Dissemination. The FSI facilitates the dissemination of the standard-setting bodies’ work to official organisations.
Activities of BIS-hosted groups in 2011/12
The following pages review the year’s principal activities of the nine groups hosted at the BIS.
Financial Stability Board
The Financial Stability Board (FSB) coordinates the work of national financial authorities and international standard-setting bodies and develops policies to enhance global financial stability. It closely monitors whether these policies are implemented fully and consistently.
More specifically, under its mandate from the G20, the FSB:• assessesvulnerabilitiesaffectingtheglobalfinancialsystemandidentifies
and reviews the regulatory, supervisory and related actions needed to address them, including the outcomes of those actions;
• promotes coordination and information exchange among authoritiesresponsible for financial stability;
• monitorsandadvisesonmarketdevelopmentsandtheirimplicationsforregulatory policy;
• monitorsandadvisesonbestpracticeinmeetingregulatorystandards;• undertakes joint strategic reviews of the international standard-setting
bodies to ensure that their policy development work is timely, coordinated and focused on priorities and that it addresses gaps;
• supports the establishment of supervisory colleges and sets guidelinesfor them;

94 BIS 82nd Annual Report
• supports contingency planning for cross-border crisis management,particularly with respect to systemically important firms; and
• collaborateswiththeIMFtoconductearlywarningexercises.The membership of the FSB consists of senior officials from finance
ministries, central banks and financial regulators and supervisors of 24 countries and territories2 as well as from the ECB and the European Commission. It also includes representatives of international financial institutions and of international standard-setting and central bank bodies.3
The FSB was chaired by Mario Draghi, Governor of the Bank of Italy, until November 2011, when he became President of the ECB. He was succeeded as Chair of the FSB by Mark Carney, Governor of the Bank of Canada. The FSB also named a Vice-Chair, Philipp Hildebrand, Chairman of the Swiss National Bank.4
The FSB operates through Plenary meetings of its membership; the Plenary names the Chair of the FSB and appoints a Steering Committee. The FSB also has three standing committees:• a Standing Committee on Assessment of Vulnerabilities, chaired by
Jaime Caruana, General Manager of the BIS;• a Standing Committee on Supervisory and Regulatory Cooperation,
chaired by Adair Turner, Chairman of the UK Financial Services Authority; and
• a Standing Committee on Standards Implementation, chaired byTiff Macklem, Senior Deputy Governor of the Bank of Canada.The Plenary has also established various working groups, which currently
cover a number of technical areas. The work of the FSB is supported by a Secretariat, located at the BIS, comprising a staff of 24.
Plenary meetings were held in April, July and October 2011 and in January 2012. As detailed below, the FSB was active in a wide range of areas during the year, and several policy initiatives approved at the Plenary meetings were endorsed in November at the Cannes Summit of the G20 Leaders.
Early warning exercises
As part of its regular activities, the FSB conducted two early warning exercises in April and September in collaboration with the IMF. The IMF’s International Monetary and Financial Committee and the G20 finance ministers and central bank Governors received a confidential presentation of results and recommended actions; the FSB focused on vulnerabilities and regulatory challenges in the financial sector, and the IMF covered macroeconomic and macro-financial vulnerabilities.
2 The country members of the G20 plus Hong Kong SAR, the Netherlands, Singapore, Spain and Switzerland.
3 The international financial institutions are the BIS, IMF, OECD and World Bank. The international standard-setting and central bank bodies are the BCBS, CGFS, CPSS, International Accounting Standards Board (IASB), IAIS and International Organization of Securities Commissions (IOSCO).
4 Mr Hildebrand resigned as Vice-Chair in January 2012 following his resignation from the Swiss National Bank. A new Vice-Chair has not been appointed.

95BIS 82nd Annual Report
Reducing the moral hazard posed by systemically important financial institutions (SIFIs)
At their 2010 Seoul Summit, the G20 Leaders endorsed the FSB’s framework to address the systemic and moral hazard risks associated with SIFIs. During 2011, critical policy measures were developed to implement this framework, and timelines and processes were established to put them into effect.
These key measures include: • a new international standard to guide consistent reform of national
resolution regimes so that any failing financial institution can be resolved without disruptions to the financial system and without exposing the taxpayer to the risk of loss (the standard was announced by the FSB on 4 November and published as Key attributes of effective resolution regimes for financial institutions);
• amandatoryresolvabilityassessmentandarecoveryandresolutionplanfor each global SIFI (G-SIFI, an institution that is clearly systemic in a global context) as well as a cross-border cooperation agreement between relevant authorities for each G-SIFI;
• requirements, developed through the BCBS, for global systemicallyimportant banks (G-SIBs) to hold additional common equity capital above the Basel III minimum standards; and
• more intensive and effective supervision, including through strongermandates, resources and powers, and higher supervisory expectations for firms’ risk management and data aggregation capabilities. The international standard set out in Key attributes of effective resolution
regimes addresses deficiencies in existing tools and national legal frameworks that hinder the resolution of failing systemic firms – including G-SIFIs, which require cross-border resolution. Implementation will require legislative changes in many jurisdictions.
On 4 November, in its Policy measures to address systemically important financial institutions, the FSB published the names of an initial group of 29 G-SIFIs to which the resolution planning requirements will apply beginning in 2012. The group of G-SIFIs will be updated annually and published each November.
Improving the OTC and commodity derivatives markets
The G20 has made commitments to improve the functioning, transparency and oversight of the over-the-counter (OTC) derivatives market by end-2012 by means of increased standardisation, central clearing, organised platform trading, and reporting of all trades to trade repositories. The FSB has established two groups to monitor and advance these reforms: the OTC Derivatives Working Group (ODWG) and the OTC Derivatives Coordination Group (ODCG). The ODWG issued reports in April and October 2011 on the progress of implementation. The FSB has continued to press member jurisdictions to meet the end-2012 deadline and to ensure the consistency of implementation across jurisdictions. The FSB established the ODCG in November 2011 to improve the coordination and consistency of the various international reform workstreams; it is composed of the chairs of the BCBS, CGFS, CPSS, FSB and IOSCO.

96 BIS 82nd Annual Report
Strengthening the oversight and regulation of shadow banking
The “shadow banking system” – credit intermediation involving entities and activities outside the regulated banking system – can be a source of systemic risk both directly and through its interconnectedness with the regular banking system. Shadow banking can also create opportunities for arbitrage that might undermine stricter bank regulation and lead to a build-up of additional leverage and risks in the financial system as a whole.
In 2011, the FSB conducted the first in a projected series of regular comprehensive monitoring exercises to assess risks from the shadow banking system. In addition, work was set in train to develop, as needed, regulatory policy recommendations by end-2012 for five key aspects of shadow banking oversight: • banks’interactionswithshadowbankingentities(includingconsolidated
supervision, risk-based capital for bank exposures and implicit support);• moneymarket fundsand theirsusceptibility to runsandothersystemic
risks;• theregulationofothershadowbankingentities;• securitisation,includingretentionrequirementsandtransparency;and• securities lending and repurchase agreements (possibly including
measures on margins and haircuts).
Monitoring exchange-traded funds
In April 2011, the FSB published a note on the potential risks to financial stability arising from the recent rapid growth and innovation in the market for exchange-traded funds (ETFs). The note encouraged the financial industry to adapt its risk management practices, disclosure and transparency to the pace of innovation in the ETF market. The FSB will continue to closely monitor developments in the ETF market and will consider policy actions as necessary.
Developing macroprudential frameworks and tools
Responding to a request at the November 2010 G20 Summit, the FSB, IMF and BIS published a joint progress report in October 2011 on macroprudential policy frameworks and tools. The main message of the report was that effective macroprudential frameworks require institutional arrangements that can: (i) ensure an open and frank dialogue among policymakers on policy choices that have an impact on systemic risk; (ii) resolve conflicts between policy objectives and instruments; and (iii) mobilise the right tools to limit systemic risk.
Addressing data gaps
The data gaps initiative is part of the 20 recommendations set out by the IMF and FSB in their November 2009 report, The financial crisis and information gaps. In 2010, the FSB set up a group to develop ways to monitor financial linkages among G-SIFIs and the concentration of exposures in the financial system.
In an October consultation paper, Understanding financial linkages: a common data template for global systemically important banks, the FSB

97BIS 82nd Annual Report
proposed a new data template for G-SIBs that would substantially strengthen the information on linkages among them by detailing their exposures and funding dependencies by counterparty as well as by market, sector and instrument. The new template would be introduced in stages.
Substantive progress has been made in addressing the legal and policy issues associated with sharing commercially sensitive data. The project’s initial implementation phase will share data among supervisors only.
Advancing transparency through the legal entity identifier
At their November 2011 Cannes Summit, the G20 Leaders asked the FSB to recommend a global legal entity identifier (LEI) system for uniquely identifying parties to financial transactions. The FSB is working towards a recommendation in time for the G20 Leaders summit in June 2012.
Strengthening accounting standards
The G20 and FSB support the development of a single set of high-quality global accounting standards. To that end, the FSB continues to encourage the IASB and the United States’ Financial Accounting Standards Board to complete their convergence project and is monitoring their progress in implementing specific G20 and FSB accounting recommendations. The two accounting boards made progress in 2011, but work remains ongoing in other areas of convergence.
Monitoring implementation and strengthening adherence to international standards
To enhance its monitoring of agreed G20 and FSB financial reforms, the FSB in collaboration with the relevant standard-setting bodies established a Coordination Framework for Implementation Monitoring (CFIM), which was announced in October and endorsed at the Cannes Summit.
The CFIM agenda is derived from the FSB Plenary, which determines areas in which implementation of reforms is particularly important for global financial stability. The CFIM ensures that these areas are subjected to more-intensive monitoring and detailed reporting. Current priority areas are the Basel II, Basel 2.5 and Basel III frameworks; OTC derivatives market reforms; compensation practices; policy measures for G-SIFIs; resolution frameworks; and shadow banking.
The FSB’s most intensive monitoring mechanism is the peer review programme, undertaken through its Standing Committee on Standards Implementation, to evaluate member jurisdictions’ adoption of international financial standards and FSB policies. The FSB previously completed country peer reviews of Australia, Italy, Mexico and Spain, and in early 2012 it concluded them for Canada and Switzerland.
The FSB completed a thematic peer review of deposit insurance systems. The FSB also conducted a follow-up review of compensation practices, after which the G20 Leaders asked the FSB for: (i) ongoing monitoring and public reporting on compensation practices; and (ii) a bilateral complaint handling process among national authorities to address firms’ concerns regarding competitive fairness.

98 BIS 82nd Annual Report
In March 2010, the FSB began evaluating and encouraging jurisdictions’ adherence to standards for international supervisory and regulatory cooperation and information exchange. In November 2011, the FSB published the list of all jurisdictions evaluated, including those identified as non-cooperative.
Mortgage underwriting principles
In October, following up on the recommendations of a peer review the previous March, the FSB issued a consultation paper setting out principles for sound mortgage underwriting. The final version was scheduled to be published in April 2012.
Advancing consumer finance protection
An October 2011 FSB report, written in collaboration with the OECD and other international organisations, covers policy initiatives, new institutional arrangements and the work of regulators and supervisors in various areas of consumer finance protection. The report identifies gaps where additional international work could help advance consumer protection and financial stability.
Financial stability issues in emerging market and developing economies
In response to a request by the G20, an FSB task force prepared a report on financial stability issues of particular interest to emerging market and developing economies. Working with staff members of the IMF and World Bank and senior policymakers from some of the economies that are not members of the FSB, the task force set out key issues, which included guidance in the application of international standards; cross-border supervisory cooperation; regulating and supervising small-scale non-bank lending and deposit-taking institutions; managing foreign exchange risks; and developing domestic capital markets. Endorsed by the G20 Leaders at the Cannes Summit, the report recommends ways in which national authorities can address these issues and supportive steps that the international community can take. The FSB will monitor progress in implementing the recommendations.
Regional consultative groups
To facilitate its interaction with a wider group of countries, the FSB established six regional consultative groups that bring together FSB members with 64 other jurisdictions in the Americas, Asia, the Commonwealth of Independent States, Europe, the Middle East and North Africa, and sub-Saharan Africa. The regional groups discuss vulnerabilities affecting regional and global financial systems and the financial stability initiatives of the FSB and of the various jurisdictions. The first meetings of these groups took place in late 2011 and early 2012.
FSB capacity, resources and governance
The FSB has made improvements to its transparency, public accountability and internal processes by expanding the information on its website, including

99BIS 82nd Annual Report
the composition of the Plenary and the Steering and Standing Committees; by increasing its use of public consultation; and by improving the geographical and institutional balance in the membership of the Steering Committee. Addressing a request from the G20 Cannes Summit, the FSB will deliver proposals at the June 2012 Los Cabos Summit to further strengthen the FSB’s capacity, resources and governance while maintaining strong links with the BIS.
FSB: www.financialstabilityboard.org
Basel Committee on Banking Supervision
The Basel Committee on Banking Supervision (BCBS) seeks to enhance supervisory cooperation and improve the quality of banking supervision worldwide. It supports supervisors by providing a forum for exchanging information on national supervisory arrangements, improving the effectiveness of techniques for supervising international banks and setting minimum supervisory standards.
The Committee, which generally meets four times a year, consists of senior representatives of bank supervisory authorities and central banks responsible for banking supervision or financial stability issues in the Committee’s member countries. The Group of Governors and Heads of Supervision (GHOS) is the Basel Committee’s governing body and consists of central bank Governors and non-central bank heads of supervision from member countries.
The leadership of the GHOS and the Committee changed during 2011. In November, Mervyn King, Governor of the Bank of England, succeeded Jean-Claude Trichet as the Chairman of the GHOS; and in July, Stefan Ingves, Governor of Sveriges Riksbank, succeeded Nout Wellink as Chairman of the Committee.
Basel regulatory framework and supervisory issues
The Basel III framework, published by the Committee in December 2010, comprehensively reforms the regulation, supervision and risk management of the banking sector. The measures strengthen microprudential (bank-level) regulation, which will help make individual banking institutions more resilient to periods of stress; and they strengthen oversight of macroprudential (system-wide) risks, which can build up across the banking sector and become amplified by each phase of the business cycle. These two approaches to supervision are complementary, as greater resilience at the bank level reduces the risk of system-wide shocks. Since its publication of Basel III, the Committee has focused on implementation of the framework and the further development of regulatory standards and guidance.
Global systemically important banks
Addressing the dangers posed by global systemically important banks is part of the broader effort by the G20 Leaders to respond to the financial crisis. The Basel Committee’s work on G-SIBs, together with related efforts by the FSB and others, is meant to reduce the “too big to fail” problem associated with

100 BIS 82nd Annual Report
systemically important financial institutions (SIFIs). In November, after a careful review of public comments, the Committee published final rules that set out its regulatory framework for G-SIBs. The framework addresses the methodology for assessing global systemic importance; the magnitude of additional loss absorbency that G-SIBs should have; and the arrangements by which the additional loss absorbency will be phased in. The motivation for the rules was the recognition that cross-border negative externalities created by G-SIBs needed measures beyond those contained in the Basel III framework. The rules will enhance the going-concern loss absorbency of G-SIBs and reduce the probability of their failure.
The assessment methodology for G-SIBs comprises five broad categories: size, interconnectedness, lack of readily available substitutes or financial institution infrastructure, global (cross-jurisdictional) activity and complexity.
Under the requirement for additional loss absorbency, G-SIBs must hold common equity in excess of the minimum amount required under Basel III. Depending on the assessment of a G-SIB’s systemic importance, it must hold additional Common Equity Tier 1 capital (CET1) in the range of 1 to 2.5% of its risk-weighted assets (in shorthand, 1 to 2.5% CET1). To discourage G-SIBs from becoming even more systemically important, the rules specify the imposition of a capital surcharge of up to 3.5% CET1 should the assessment of their systemic importance grow materially beyond current levels.
The requirements for higher loss absorbency will be introduced between 1 January 2016 and end-2018, becoming fully effective on 1 January 2019, a schedule that matches the timeline for introduction of the Basel III capital conservation and countercyclical buffers.
In October, the joint FSB-BCBS Macroeconomic Assessment Group (MAG) issued the report Assessment of the macroeconomic impact of higher loss absorbency for global systemically important banks. It concluded that a stronger capital standard for G-SIBs had a decidedly favourable cost-benefit trade-off. The standard is likely to have at most a modest, temporary negative impact on aggregate output during the transition period, whereas it confers a much larger permanent net benefit by reducing the risk of financial crises, which can have long-lasting effects on the economy. The MAG estimated that the Basel III and G-SIB proposals together contribute a permanent annual benefit of up to 2.5% of GDP – many times the cost of the temporarily slower annual growth resulting from the reforms.
Liquidity
The central principle of the Basel III liquidity coverage ratio (LCR) is that banks must have a stock of high-quality liquid assets available to meet their liquidity needs in times of stress. In January, the GHOS reaffirmed its commitment to introduce the LCR as a minimum standard in 2015. It also clarified the LCR rules to emphasise that liquid assets accumulated in normal times are indeed intended for use in times of stress, and the Committee will develop additional guidance on the circumstances that would justify the use of those assets.
The GHOS endorsed the Committee’s approach to addressing specific concerns regarding the assets qualified to meet the LCR and its investigation

101BIS 82nd Annual Report
of some issues in the calibration of net cash outflows. The Committee will also further examine the interaction of central banks with banks during periods of stress to ensure that the workings of the LCR do not interfere with central bank objectives. Any modifications to address the issues will not materially change the framework’s underlying approach. The GHOS directed the Committee to publish its final package by the end of 2012.
Upon the completion of its LCR review, the Committee will turn its attention to the net stable funding ratio (NSFR). Due to be introduced in 2018 as a minimum standard, the NSFR is intended to limit banks’ overreliance on short-term wholesale funding and to promote a sustainable maturity structure for assets and liabilities.
Derivatives
During the year, the Committee addressed bank exposures to central counterparties (CCPs) and to counterparty credit risk in bilateral trades.
CCP exposures. On 2 November, the Committee proposed capital requirements for banks’ exposures to CCPs. The objective is to promote greater use of CCPs for derivatives trades while ensuring that banks are appropriately capitalised against the exposures they face. In considering public comments on the draft, the Committee will also consider the broader set of reforms being proposed by other standard setters to ensure that the collective impact provides incentives for banks to use CCPs in preference to bilateral trades.
Bilateral counterparty credit risk. Basel II addressed the risk of counterparty default and credit migration risk but not mark-to-market losses due to the credit valuation adjustment (CVA). During the financial crisis, however, roughly two thirds of losses attributed to counterparty credit risk were due to CVA and only about one third were due to actual defaults. Therefore, in June the Committee finalised the Basel III capital treatment for counterparty credit risk in bilateral trades. The revised treatment slightly modifies the CVA, which is the risk of loss caused by changes in the credit quality of a counterparty (also referred to as the market value of counterparty credit risk).
The Committee estimates that, with the addition of the CVA risk capital charge, the capital requirements for counterparty credit risk under Basel III will approximately double the level required under Basel II (when counterparty credit risk was capitalised for default risk only).
Own credit risk
The Committee issued a consultative document in December on the application of own credit risk adjustments to derivatives. The Basel III rules seek to ensure that deterioration in a bank’s own creditworthiness does not at the same time lead to an increase in its common equity as a result of a reduction in the value of the bank’s liabilities. The consultative paper proposed that debit valuation adjustments (DVAs) for over-the-counter derivatives transactions and securities financing should be fully deducted in the calculation of CET1.

102 BIS 82nd Annual Report
Basel III FAQ
After the December 2010 release of Basel III, the Committee issued a set of frequently asked questions (FAQ) and responses to them. To promote consistent global implementation of Basel III, the Committee will periodically update the FAQ and include any necessary technical elaboration and interpretative guidance in the answers.
Monitoring implementation and international consistency
Through its Standards Implementation Group, the Committee has set up review systems for the implementation of capital standards for international consistency and will regularly publish the results. A peer review system will monitor the timetable for members’ implementation of the Basel regulatory capital framework, which includes Basel II, Basel 2.5 (related substantially to trading book exposures) and Basel III. The consistency review will monitor whether members’ legislation and regulations are consistent with international minimum standards. Likewise, the Committee will examine the measurement of risk-weighted assets in both the banking book and the trading book to ensure that the outcomes of the new rules are consistent in practice across banks and jurisdictions.
The Committee’s October 2011 Progress report on Basel III implementation was updated in April 2012, and regular updates will continue. The status reports reflect the Committee’s intention that member countries fully and consistently implement Basel II, Basel 2.5 and Basel III within the agreed timelines.
Core principles
In December, the Committee issued for consultation a revision of its 2006 Core principles for effective banking supervision and the associated assessment methodology. The revisions address many of the significant risk management weaknesses and other vulnerabilities highlighted by the global financial crisis. They also take account of several key trends and developments in the past few years of market turmoil: the heightened prominence of systemically important banks and the greater demand they place on supervisory resources; the need for a system-wide perspective to address systemic risk; and the increasing attention to measures for crisis management, recovery and resolution that will reduce both the probability and consequences of a bank failure.
The proposed revision merges the core principles and the assessment methodology into a single document. The new document sets the principles in a more logical structure that highlights the difference between what is expected of supervisors and what supervisors expect of banks. The Committee expects to publish the final version in 2012.
Trading book review
The Basel Committee is conducting a fundamental review of the regulatory capital treatment for trading exposures. Such exposures consist of positions in financial instruments and commodities held either for trading or to hedge

103BIS 82nd Annual Report
other trading activities. Through the Committee’s market risk framework, positions in the trading book are subject to capital charges against interest rate risk, foreign exchange risk, equity position risk and commodities risk. The Committee expects to conduct a public consultation on its proposals to revise the market risk framework in 2012.
Disclosure
Definition of capital. During the financial crisis, deficiencies in the disclosure of banks’ capital positions worsened uncertainties by hampering market participants and supervisors in their assessments and cross-jurisdictional comparisons of capital positions. In a consultative paper issued on 19 December, the Basel Committee proposed disclosure rules to improve the transparency and comparability of a bank’s capital base and thereby enhance market discipline.
Remuneration. Ensuring that remuneration is effectively aligned with risk and performance is an essential element of preventing excessive risk-taking. In practice, making employee compensation account for the risks that employees take on behalf of their organisation has proved to be challenging. Additional Pillar 3 requirements on remuneration were issued on 1 July to promote market discipline by allowing market participants to assess the quality of a bank’s compensation practices. These requirements should contribute to greater consistency of disclosures on remuneration. They update the material in the supplemental Pillar 2 guidance issued by the Committee in July 2009 and take account of the 2009 FSB statement of compensation principles and related implementation standards.
In other action on remuneration, the Committee in May 2011 published Range of methodologies for risk and performance alignment of remuneration, which focuses on practical and technical issues regarding bonus pools and compensation schemes. It clarifies the design of risk-adjusted remuneration and highlights issues that may limit the effectiveness of the risk adjustment methodologies. Through examples of bank practices and supervisory experience to date, the report also offers an anecdotal picture of current remuneration practices in the industry.
Operational risk
The regulatory capital adequacy framework envisages that the operational risk discipline will continue to mature over time and converge towards a narrower band of practices for the effective measurement and management of risk. Towards that end, the Committee in June released two papers. The first, Principles for the sound management of operational risk, covers three overarching themes: governance, risk management and disclosure. It highlights the evolution of industry practice and supervisory experience in those areas since the release of an earlier version in 2003.
The second paper, Operational risk – supervisory guidelines for the advanced measurement approaches, sets out supervisory guidelines relating to governance, data and modelling.

104 BIS 82nd Annual Report
Trade finance
After evaluating the impact of Basel II and Basel III on trade finance involving low-income countries, the Committee in October adopted two technical changes to the Basel regulatory capital adequacy framework. The modifications are intended to facilitate trade with low-income countries by improving their access to trade finance and by lowering the cost of trade finance instruments. The Committee conducted its evaluation in consultation with the World Bank, World Trade Organization and International Chamber of Commerce.
Audit
In December, the Committee issued revised supervisory guidance for assessing the effectiveness of the internal audit function in banks. This work forms part of the Committee’s ongoing effort to encourage sound practices within banks. The document updates the 2001 Internal audit in banks and the supervisor’s relationship with auditors, especially in the light of the global financial crisis.
Resolution
The Committee published a report in July on the status of changes to national policies needed to establish effective regimes for the cross-border resolution of SIFIs. The Committee had issued 10 recommendations on the topic in March 2010, and in November 2010 the FSB called for an assessment of progress. The report found that progress is lacking in many jurisdictions, and it stressed the need to accelerate reforms.
High-cost credit protection
Supervisors have become concerned about some recent credit protection transactions and the potential for regulatory capital arbitrage. In December, the Committee issued a statement intended to alert banks that supervisors will be closely scrutinising credit risk transfers. It set out the Committee’s expectation that supervisors will be reviewing those transfers in two contexts: the Basel securitisation framework rules, and the broader framework of the Pillar 2 supervisory review process and assessment of capital adequacy.
Basel Committee: www.bis.org/bcbs
Committee on the Global Financial System
The Committee on the Global Financial System (CGFS) monitors financial market developments and analyses their implications for financial stability. The CGFS is chaired by William C Dudley, President of the Federal Reserve Bank of New York, who succeeded Mark Carney, Governor of the Bank of Canada, on 1 January 2012. Committee members consist of the Deputy Governors and other senior officials from the central banks of 23 advanced and emerging market economies and the Economic Adviser of the BIS.
During the year, assessments of the recent sovereign debt problems in the euro area shaped much of the Committee’s discussions, which included

105BIS 82nd Annual Report
the analysis of policy initiatives that could stop contagion among sovereigns and break the link between sovereign risk and bank funding problems. Committee members also examined the global implications of bank deleveraging in the advanced economies, including the risk of spillovers to emerging market economies. The economic and financial implications of the earthquake disaster in Japan and potential disruptions from the realisation of other risks were additional important topics.
To deepen its understanding of current policy issues and investigate possible policy responses by central banks, the Committee commissioned a number of in-depth analyses carried out by working groups of central bank experts. The topics included:• sovereigncreditriskandbankfundingconditions;• the effects of regulatory and accounting changes on the fixed income
strategies of institutional investors; and• themacro-financial implications of alternative configurations for access
to CCPs in over-the-counter derivatives markets.The Committee also contributed to ongoing discussions in other policy
forums. For example, for the G20 it helped to shape the evolving debate on global liquidity with a report that developed a central bank view on relevant concepts and policy responses. In addition, the CGFS further pursued its plans to close gaps in statistical data with an agreement on major enhancements to the BIS international banking statistics, for which it serves as the governing body. These enhancements will help close the remaining gaps in the data currently reported as well as improve the usefulness of the statistics in several key areas:• monitoringthecreditexposuresofnationalbankingsystems;• tracking developments in the supply of bank credit and banks’ funding
patterns; and• measuringbankfundingrisk.
CGFS: www.bis.org/cgfs
Committee on Payment and Settlement Systems
The Committee on Payment and Settlement Systems (CPSS) contributes to the strengthening of financial market infrastructures by promoting safe and efficient payment, clearing and settlement arrangements. Comprising senior officials from 25 central banks, the CPSS is a recognised international standard setter in this area. The Committee has been chaired by Paul Tucker, the Bank of England’s Deputy Governor, Financial Stability, since March 2012; the previous chairman was William C Dudley, President of the Federal Reserve Bank of New York.
New standards
The CPSS and the International Organization of Securities Commissions (IOSCO) scheduled for April 2012 the joint release of the final version of Principles for financial market infrastructures, which had been issued for public comment in March 2011. The document sets out new

106 BIS 82nd Annual Report
international standards to govern systemically important financial market infrastructures (FMIs) – payment systems, central securities depositories, securities settlement systems, CCPs and trade repositories. The 24 principles reflect the lessons learned from the recent financial crisis as well as the experience gained from applying existing standards during the past decade.
The principles replace the three previous sets of CPSS and CPSS-IOSCO standards, namely the Core principles for systemically important payment systems (2001); the Recommendations for securities settlement systems (2001); and the Recommendations for central counterparties (2004). The CPSS and IOSCO believe that a single set of principles will provide greater consistency in the oversight and regulation of FMIs worldwide.
Compared with the existing standards, the new principles introduce a more demanding regime for FMIs. Perhaps the four most crucial areas where this is the case are the financial resources and risk management procedures that an FMI uses to cope with the default of a participant; the mitigation of operational risk; the links and other interdependencies among FMIs through which operational and financial risks can spread; and the need for participation criteria that are risk-based and permit fair and open access. Moreover, the new principles address issues that are not covered by the existing standards, including segregation and portability, tiered participation and general business risk.
The report also contains a set of five responsibilities for the central banks and other authorities that oversee or regulate the FMIs implementing the principles. These duties include effective cooperation between authorities where more than one has responsibility.
The CPSS and IOSCO have also scheduled two other documents to be released for consultation. One is a framework for public disclosures by an FMI that will give participants and others an accurate understanding of the risks and costs of using it. The other document is an assessment methodology that can be used to judge an FMI’s observance of the principles and a relevant authority’s observance of responsibilities.
Over-the-counter (OTC) derivatives data reporting and aggregation
In January 2012, the CPSS and IOSCO jointly released the final version of OTC derivatives data reporting and aggregation requirements, which had been issued for public comment in August 2011. The report discusses data necessary for monitoring the impact of OTC derivatives markets on financial stability. It specifies minimum requirements for reporting transaction data to trade repositories, including the acceptable types of data formats, and discusses access to data by authorities, reporting entities and the public. The report also addresses tools such as legal entity identifiers (LEIs), which are needed to aggregate data in a meaningful way. Finally, it discusses the collection of certain additional data, such as master agreement details, to help fill data gaps that hinder the assessment of systemic risk.

107BIS 82nd Annual Report
Guidance on foreign exchange settlement risk
The Committee is working with the Basel Committee on Banking Supervision to provide new guidance to supervisors on how banks should manage the risks relating to settling foreign exchange transactions.
Other activities
In September 2011, the Committee published Payment, clearing and settlement systems in the CPSS countries, the first of two volumes of a reference work describing FMIs in member countries. In January 2012, the Committee published the annual statistical update Statistics on payment, clearing and settlement systems in the CPSS countries.
CPSS: www.bis.org/cpss
Markets Committee
The Markets Committee, chaired by Hiroshi Nakaso, Assistant Governor of the Bank of Japan, is a forum for senior central bank officials to jointly monitor developments in financial markets and assess their implications for central banks’ liquidity management operations. Currently, 21 central banks are represented on the Committee.
Mounting concerns over sovereign debt and a weakening global economic outlook shaped the Committee’s discussions during the year. The Committee closely monitored developments in euro area sovereign debt markets and examined their impact on the ability of banks to obtain market funding. A recurring topic was central bank actions to provide liquidity – both in euros and in US dollars – and to broaden the availability of eligible collateral. The deterioration in investor confidence in the third quarter of 2011 drew the Committee’s attention to the heightened volatility in the foreign exchange market and the related policy responses. And as major central banks rolled out another round of quantitative and credit easing, the Committee examined its effects on financial markets and the challenges of communicating policy commitment in an unconventional policy environment.
In addition to its regular meetings, the Committee convened the third meeting of the Working Party on Markets in Latin America in July 2011. Hosted this time by the Bank of Mexico, the meeting brought together senior officials in the market operations area of major central banks in Latin America and their counterparts from outside the region. The agenda covered three broad topics: (i) recent market developments; (ii) trends in capital flows, their impact on markets and perspectives on policy responses; and (iii) technical and policy issues related to the various uses of debt securities in central bank operations.
The Committee undertook two projects during the year. One was a fact-finding study on high-frequency trading to better understand how it has influenced the structure and functioning of the foreign exchange market in recent years. The results were presented to Governors and released as a Markets Committee publication in September 2011. Its second project was part of the preparation of the 2013 BIS Triennial Central Bank Survey of Foreign

108 BIS 82nd Annual Report
Exchange and Derivatives Market Activity. The Committee established a technical experts group to: (i) develop a number of refinements to the survey’s counterparty and execution method categories; and (ii) improve the global coverage of major emerging market currencies, which are increasingly traded offshore.
Markets Committee: www.bis.org/markets
Central Bank Governance
The Central Bank Governance Group, comprising representatives from nine central banks and chaired by Stanley Fischer, Governor of the Bank of Israel, serves as a venue for the exchange of views on the design and operation of central banks as public policy institutions. In addition, it prioritises the work on this topic that is carried out through the BIS and the more than 50 central banks that make up the Central Bank Governance Network. During the past year, the Governance Group addressed the evolving circumstances of central banks in several ways. It completed a report on the implications of their new financial stability responsibilities, it initiated a round of discussions on the challenges arising from changing mandates and circumstances more broadly, and it conducted work on the financial strength that central banks need in order to be effective in the post-crisis world.
Irving Fisher Committee on Central Bank Statistics
The Irving Fisher Committee on Central Bank Statistics (IFC) is a forum for central bank economists and statisticians to address statistical topics related to monetary and financial stability. During the year, the IFC: • conductedaworkshopondata issuesandrelatedpolicy implications in
the real estate sector, in cooperation with the Central Bank of Chile, in April 2011 in Santiago;
• co-sponsoredaseminarwiththeCentralBankofIrelandonbridgingdatagaps, in August 2011 in Dublin;
• organised more than 10 sessions at the 58th World Congress of theInternational Statistical Institute, in August 2011 in Dublin; and
• surveyed the IFC membership in summer 2011 regarding existing andnew data collections by central banks as well as actions taken to improve data collection and dissemination. In its report to the BIS All Governors’ Meeting in November 2011, the
Committee conveyed two key messages: • thereisanurgentneedtoimprovedata-sharingbetweenorganisationsat
the national and international level and to overcome confidentiality constraints and obstacles to the exchange of data; and
• central banks, individually and collectively, are useful as a catalyst forchange in a wide range of economic and financial statistics. Muhammad Ibrahim, Deputy Governor of the Central Bank of Malaysia,
became the Chairman of the IFC in November 2011. During the year, the

109BIS 82nd Annual Report
Committee expanded its membership to 76 central banks and international and regional organisations.
IFC: www.bis.org/ifc
International Association of Deposit Insurers
The International Association of Deposit Insurers (IADI) provides a forum for deposit insurers, central banks and international organisations to enhance the effectiveness of deposit insurance and bank resolution systems and cooperate on related financial stability issues. Currently, 83 organisations, including 64 deposit insurers, are members of IADI or are affiliated with it as participants. IADI provides guidance on the establishment or enhancement of effective deposit insurance systems as well as on training, outreach, educational programmes and research.
Core principles
IADI representatives participated in an FSB peer review of the deposit insurance systems of FSB members to assess their alignment with the IADI-BCBS Core principles for effective deposit insurance systems, which is a document on the FSB list of key standards for sound financial systems. The IADI representatives provided valuable input from the practitioners’ perspective. The IMF and World Bank intend to assess compliance with the core principles in their joint Financial Sector Assessment Program (FSAP) and in their joint Reports on the Observance of Standards and Codes (ROSC). In consultation with the BCBS and other international bodies in this context, IADI will produce a set of papers to update the core principles and develop new guidance as needed to achieve compliance and advance best practices for deposit insurance systems.
Initiatives for enhancing deposit insurance systems worldwide
In collaboration with the IMF, the World Bank and the European Forum of Deposit Insurers (EFDI), IADI presented workshops in Albania and Nigeria during 2011 to train IADI and EFDI members to assess compliance with the core principles.
IADI and the FSI continue to collaborate on the creation of in-person and online training programmes and seminars for deposit insurers, financial sector supervisors, finance ministries and central banks worldwide. This year, IADI held seven in-person programmes, including “Core principles assessment methodology for deposit insurance”, a seminar conducted with the FSI at the BIS. IADI and the FSI also completed a tutorial on the core principles, and a tutorial being developed will cover bank resolutions from a deposit insurer’s perspective. For ease of access to these online training programmes, each IADI member receives a subscription to FSI’s online resource, FSI Connect.
IADI conducts research through its Research and Guidance Committee and jointly with the IMF. IADI work in process covers deposit insurance fund sufficiency, Islamic deposit insurance, the payout process, early detection and timely intervention, and the handling of systemic crises. In addition, IADI has recently completed research papers on deposit insurance mandates and on claims and recoveries.

110 BIS 82nd Annual Report
In 2010, IADI created a Financial Inclusion and Innovation Subcommittee (FIIS) within its Research and Guidance Committee to provide a vehicle for IADI to engage with the G20 and other standard-setting bodies and international entities on issues related to financial inclusion and deposit insurance. The FIIS is currently studying ways that issues related to financial inclusion may interact with IADI’s mandate, and it is documenting IADI members’ financial inclusion practices.
Meetings, seminars and conferences
IADI’s October 2011 Annual General Meeting and Conference and an Executive Council Meeting were hosted in Warsaw by the Bank Guarantee Fund of Poland. More than 200 participants from over 50 countries attended the conference, which focused on the issue of strengthening financial stability frameworks. Executive Council meetings and Standing Committee meetings were also hosted by the BIS, in June 2011 in Basel; and by the Savings Deposit Insurance Fund of Turkey, in February 2012 in Istanbul.
In addition, IADI’s eight regional committees and 12 partner organisations sponsored regional events throughout the year relating to deposit insurance as a safety net during financial crises. Topics included compliance with, and assessment of, the core principles; public awareness training; integrated deposit insurance systems; Islamic deposit insurance; resolution of problem banks; and purchase-and-assumption arrangements.
IADI: www.iadi.org
International Association of Insurance Supervisors
The International Association of Insurance Supervisors (IAIS) is the international standard-setting body for prudential supervision of the insurance industry. The mission of the IAIS is to promote effective and globally consistent regulation and supervision of the insurance industry in order to develop and maintain fair, safe and stable insurance markets for the benefit of policyholders; and to contribute to global financial stability.
Financial stability
The IAIS is actively assessing the regulatory reforms recommended by the FSB, including the development of indicators for assessing the systemic importance of insurers and devising potential related policy measures. The IAIS made a proposal to the FSB on an assessment methodology for systemically important insurers, and public consultations have been scheduled. In addition, the IAIS now monitors the insurance sector’s macroeconomic and financial market environment. It is developing a framework for macroprudential surveillance of the insurance sector that differentiates the scope for potential supervisory action from the powers of central banks. The framework may include macroeconomic stress testing in the insurance sector.
On 15 November 2011, the IAIS published a paper, Insurance and financial stability, showing that insurance underwriting risks are in most cases not correlated with the business cycle or with financial market

111BIS 82nd Annual Report
risks. The paper also explains that the magnitude of insurance liabilities is, in very broad terms, not affected by financial market losses. For example, although the financial crisis affected insurers, those engaged in traditional insurance activities were not a concern in terms of systemic risk. The main concern relates to those insurers engaged in significant non-traditional and non-insurance activities that in a crisis could generate systemic effects.
Insurance core principles
At its general meeting on 1 October 2011, the IAIS adopted revisions to its Insurance core principles, standards, guidance and assessment methodology. The revised insurance core principles (ICPs) incorporate lessons of the financial crisis, address FSB recommendations and reflect the evolution of supervisory and industry practices. The revised document organises the supervisory material into a hierarchy, with ICPs at the top, standards for implementation of the ICPs at the next level, and guidance at the third level.
Accounting
The IAIS has a strong interest in ensuring high-quality financial reporting that offers a meaningful and economically sound portrayal of insurers’ financial health. It closely monitors the international financial reporting developments that will most influence the overall accounting model for regulated insurance enterprises. The IAIS regularly meets with the IASB to provide input on the development of rules relating to insurance contracts and other standards of importance to insurers.
Supervisory Forum
In June 2011, the IAIS established the Supervisory Forum to provide a platform for insurance supervisors to exchange information on supervisory practices. The participants, who focus on large insurers and insurance groups, discuss existing and emerging trends and risks; share ideas and experience on supervisory methodologies; and evaluate the potential impact of macroeconomic stress scenarios on large or complex insurers and insurance groups. The Supervisory Forum also collaborates with other IAIS committees and provides practical input to IAIS projects.
Internationally active insurance groups
The IAIS continues to develop the Common Framework for the Supervision of Internationally Active Insurance Groups (ComFrame). ComFrame should lead to more consistency regarding each jurisdiction’s supervision of internationally active insurance groups (IAIG). On 1 July 2011, the IAIS circulated its ComFrame concept paper, inviting comments from IAIS members and observers about the proposed direction. The IAIS will issue a draft ComFrame document for comment in mid-2012. The IAIS plans to conclude its development of ComFrame in 2013, after which it will undertake an impact assessment and a calibration phase.

112 BIS 82nd Annual Report
Reinsurance and IAIS market reports
In December 2011, the IAIS published the last issue of the Global reinsurance market report. The report discussed stress testing in insurance and reinsurance supervision and identified emerging trends, common practices and next steps.
Global reinsurers – firms that, for a fee or premium, agree to indemnify an insurer against losses on one or more insurance contracts – are important for the efficient functioning of sound insurance markets. Reinsurers bolster the ultimate security of insurers, thereby protecting customers and contributing to overall financial stability.
In 2012, the IAIS will introduce the Global insurance market report, which will cover key developments in both reinsurance and global insurance. The unified analysis underscores the fact that insurance and reinsurance are two sides of the same coin.
Multilateral Memorandum of Understanding
The IAIS Multilateral Memorandum of Understanding (MMoU), which became operational in June 2009, is a framework for cooperation and exchange of information that aims to improve the effectiveness of cross-border supervision of insurance companies. It is also expected to contribute to the global efforts to enhance the regulation of systemically important financial institutions. This year, participation in the MMoU grew to 22 signatories, and another 22 applications were being validated.
Standards observance
The IAIS Standards Observance Subcommittee, created in October 2010, is in the process of conducting assessments and coordinating peer reviews on the implementation of the revised ICPs; it is beginning with the ICPs on Mandate and Supervisory Powers and on Group-wide Supervision.
More broadly, the IAIS organises regional seminars and workshops to assist insurance supervisors in implementing IAIS principles, standards and guidance in collaboration with the FSI, national insurance supervisory authorities and other bodies.
IAIS: www.iaisweb.org
Financial Stability Institute
The mandate of the Financial Stability Institute (FSI) is to assist financial sector supervisory authorities worldwide in strengthening oversight of their financial systems. Over the past year, as national authorities began implementing rules recently developed by the global standard setters for supervision of the banking and insurance sectors, the FSI intensified its work in assisting them with the implementation of the new regulatory standards.
Meetings, seminars and conferences
The first main area of FSI outreach is the well established series of high-level meetings, seminars and conferences targeted at banking and insurance sector supervisors and central bank financial stability experts. In 2011, the FSI

113BIS 82nd Annual Report
organised 51 such events at venues around the world, many of which were held in partnership with regional groups of supervisors. The high-level meetings for Governors and Deputy Governors of central banks and heads of supervisory authorities took place in Africa, Asia, central and eastern Europe, Latin America and the Middle East. The meetings focused on financial stability, macroprudential tools and policies, regulatory priorities and other key supervisory issues. As in 2010, the seminars programme focused on financial regulatory reform. Many of the seminars used the extensive case study developed by the FSI that implements a range of supervisory concepts highlighted in Basel III. Approximately 2,000 representatives of central banks and banking and insurance supervisory authorities participated in FSI events during 2011.
FSI Connect
The second main area of FSI outreach is FSI Connect, an online information resource and learning tool for financial sector supervisors at all levels of experience and expertise. It now includes more than 220 tutorials covering a wide range of topics. More than 9,000 users from approximately 230 subscribing central banks and supervisory authorities have access to FSI Connect. In 2011, the FSI expanded to more than 30 the number of tutorials it offers on insurance sector supervision. It also initiated an extensive two-year project to update all tutorials that were affected by Basel III.
Research and statistics
Through its research function, the BIS addresses economic and financial issues important to central banks and financial supervisory authorities. Most of the resulting research and analysis is published through the Bank’s principal outlets – the Annual Report, the BIS Quarterly Review, BIS Papers, BIS Working Papers and the Bank’s website (www.bis.org) – as well as in external professional publications. In addition, the research function collects, analyses and disseminates statistical information for central banks and the general public on key elements of the international financial system. The research function also supports the BIS mission by developing background material for meetings of senior central bankers, and it provides secretariat and analytical services to the various groups hosted by the BIS in Basel.
Research focus
In line with the Bank’s mission, the focus of BIS research is on monetary and financial stability. As in previous years, a principal theme of the work was the policy implications of the morphing global financial crisis.
One strand of work explored the nexus between the international monetary and financial system and the performance of the global economy. At issue were the concept, measurement and policy implications of global liquidity and its relationship with imbalances in the current account. Making extensive use of the BIS’s unique international financial statistics, the research

114 BIS 82nd Annual Report
included detailed studies on international banking and on segments of the foreign exchange market.
A second element of work examined the link between the macroeconomy and public and private balance sheets. The investigation included in-depth analysis of the financial cycle and its relationship with the business cycle, and it explored the interplay between the financial health of the sovereign and that of the banking sector.
A third component focused on prudential and structural policies designed to make the financial system more resilient. The analysis examined strengths and weaknesses of macroprudential policy instruments such as countercyclical capital buffers and macro stress tests, and it considered key aspects of the financial infrastructure, including the architecture of central counterparties.
The fourth component studied the evolution of monetary policy in the wake of the global financial crisis. It analysed the effectiveness and limitations of balance sheet policies at central banks, such as large-scale asset purchases and the accumulation of foreign exchange reserves, and it assessed changes in the transmission mechanism of policy.
The BIS research function annually organises a number of conferences and workshops in which participation bridges the worlds of policy, research and business. The leading event is the BIS Annual Conference. In June 2011, the 10th BIS Annual Conference addressed the implications of fiscal policy for macroeconomic, monetary and financial stability. In February 2012, the BIS and the ECB jointly organised a workshop on global liquidity in the international monetary and financial system.
International statistical initiatives
The BIS has been collecting and disseminating data on cross-border claims and liabilities of internationally active banks for several decades. This year, it focused on a multistage process of improving these data according to the recommendations of a CGFS task force. In the first stage of the process, central banks will enhance the reporting of residency-based cross-border data by providing more currency detail, decomposing counterparty data by nationality of the reporting bank, and introducing positions on residents in domestic currency. The BIS expects the new data to be initially reported as of the second quarter of 2012. In the second stage, central banks will report a more detailed sectoral breakdown in both the locational and consolidated banking statistics. The latter will also be extended to include the liability positions of banks, including capital. The target for the second stage of data is as of the fourth quarter of 2013.
In June 2011, the BIS began publishing its international banking statistics via its Webstats online search and retrieval facility. Users can now interactively search for data and download them in various formats, including SDMX. The BIS co-sponsors the SDMX (Statistical Data and Metadata Exchange) programme, which produces and maintains technical standards and content-oriented guidelines for the exchange of statistical information. Webstats: http://stats.bis.org; SDMX: www.sdmx.org

115BIS 82nd Annual Report
Through its public website, the BIS continued to improve the dissemination of residential and commercial property price indices that it collects in its Data Bank from national sources. The Data Bank contains key economic indicators reported by almost all BIS shareholding central banks, additional detailed macroeconomic series from major advanced and emerging economies, and data collected by various BIS-hosted groups. More thought is being given to using the Data Bank for calculating long series of important economic variables.
The BIS is represented in a number of other international committees focused on statistics, including the Inter-Agency Group on Economic and Financial Statistics (IAG).5 During the year, these committees addressed the information gaps revealed by the financial crisis, with much of the effort concentrated on the recommendations to the G20 made by the FSB and the IMF. Also, the Working Group on Securities Databases, which consists of the BIS, ECB and IMF, developed the third part of the Handbook on securities statistics, covering the issuance and holdings of equity securities.
A long-term BIS project to improve the compilation of international and domestic statistics on debt securities is nearing completion. The project envisages three changes: (i) define an “international issue” as a debt security issued outside the market in which the borrower resides; (ii) align published breakdowns with the recommendations in the Handbook on securities statistics; and (iii) make greater use of statistics reported by central banks to compile data on domestic and total debt securities. The BIS intends to disseminate improved data on securities issues on its website and to facilitate the release of additional data from national sources as they become available.
Other central bank initiatives to which the BIS lends support
The BIS contributes to the activities of regional central banks. During the past year, it supported the events sponsored by the following organisations:• CEMLA (Center for Latin American Monetary Studies) – banking,
macroprudential policy, monetary policy, payment and settlement systems;
• the South East Asian Central Banks (SEACEN) Research and TrainingCentre – central bank communications, financial stability and supervision, monetary policy, payment and settlement systems;
• the Macroeconomic and Financial Management Institute of Eastern and Southern Africa – payment and settlement systems, portfolio management, risk management. BIS experts also contributed to events organised by the Bank of France’s
International Banking and Finance Institute, the Bank of England’s Centre for Central Banking Studies and the Bank of Japan.
5 In addition to the BIS, the IAG comprises the ECB, Eurostat, IMF, OECD, United Nations and World Bank.

116 BIS 82nd Annual Report
Financial services of the Bank
The BIS offers a wide range of financial services designed specifically to assist central banks and other official monetary authorities in the management of their foreign reserves. Some 140 such institutions, as well as a number of international organisations, make active use of these services.
Safety and liquidity are the key features of the BIS’s credit intermediation services, which are supported by a rigorous internal risk management framework. Independent control units reporting directly to the BIS Deputy General Manager monitor and control the related risks. A compliance and operational risk unit monitors operational risk, while a risk control unit controls the Bank’s financial risks, ie credit, liquidity and market risks. The risk control unit is also responsible for coordinating activities in order to provide an integrated approach to risk management.
BIS financial services are provided from two linked trading rooms: one in Basel, at the Bank’s head office; and one in Hong Kong SAR, at its Asian Office.
Scope of services
In response to the diverse and constantly evolving needs of central banks, the BIS offers an extensive array of investment possibilities in terms of currency denomination, maturity and liquidity. The Bank offers tradable instruments in maturities ranging from one week to five years – Fixed-Rate Investments at the BIS (FIXBIS) and Medium-Term Instruments (MTIs); structured products with embedded optionality; and traditional money market placements, such as sight/notice accounts and fixed-term deposits. In addition, the Bank provides short-term liquidity facilities and extends credit to central banks, usually on a collateralised basis. The Bank also acts as trustee and collateral agent.
The Bank transacts foreign exchange and gold on behalf of its customers, providing access to a large liquidity base in the context of, for example, regular rebalancing of reserve portfolios or major changes in reserve currency allocation. The foreign exchange services of the Bank encompass spot transactions in major currencies and Special Drawing Rights (SDR) as well as swaps, outright forwards, options and dual currency deposits (DCDs). In addition, the Bank provides gold services such as sight accounts, fixed-term deposits, earmarked accounts, upgrading and refining, and location exchanges.
The BIS provides asset management services in sovereign securities and high-grade credit fixed income instruments. These may take the form of a dedicated portfolio mandate negotiated between the BIS and a customer; or the services may be supplied through an open-end fund structure – the BIS Investment Pool (BISIP) – that allows customers to invest in a common pool of assets. Both investment structures are offered as either single currency or multicurrency mandates in the world’s major reserve currencies: the US dollar, euro, sterling and yen. For multicurrency mandates, the investor can choose from portfolios that are either hedged back into the base currency or left unhedged.
Dedicated mandates are designed according to each customer’s preferences with regard to investment guidelines and benchmarks. In contrast, BISIPs are similar to mutual funds or unit funds but specifically cater to the

117BIS 82nd Annual Report
investment criteria typical of central banks and international institutions. Separately, EMEAP (Executives’ Meeting of East Asia-Pacific Central Banks) has mandated the BIS to administer the two Asian Bond Funds, ABF1 and ABF2, under the BISIP umbrella: ABF1 is managed by the BIS and ABF2 by a group of external fund managers.
The BIS, in cooperation with a group of advising central banks, has established a BISIP in US inflation-protected government securities. The management of this pool of assets is conducted by a group of external investment firms, while the administration is performed by the BIS.
The BIS Banking Department also hosts global and regional meetings, seminars and workshops on reserve management issues. These meetings facilitate the exchange of knowledge and experience among reserve managers and promote the development of investment and risk management capabilities in central banks and international organisations.
Financial operations in 2011/12
In 2011/12, financial markets were largely driven by the evolution of the euro area sovereign debt crisis, tighter funding conditions in credit markets and periods of high volatility. Against this background, the Bank’s balance sheet total fluctuated between SDR 280 billion and SDR 230 billion. For the year, it decreased by SDR 5.4 billion, following a marginal increase of SDR 2.2 billion in the previous year. As a result, the balance sheet total at 31 March 2012 was SDR 255.7 billion.
Liabilities
Customer placements constitute the largest share of total liabilities (see graph). On 31 March 2012, customer placements (excluding repurchase agreements) amounted to SDR 215.4 billion, compared with SDR 228.4 billion at the end of 2010/11. This net decrease resulted from the contraction of both customer currency and gold placements.
About 91% of customer placements are denominated in currencies, with the remainder in gold. Currency deposits decreased from SDR 207.1 billion a year ago to SDR 195.8 billion at end-March 2012. That balance represents some 2.7% of the world’s total foreign exchange reserves – which totalled nearly SDR 6.6 trillion at end-March 2012, up from SDR 6.4 trillion at end-March 2011.6 The share of currency placements denominated in US dollars was 70%, while euro- and sterling-denominated funds accounted for 14% and 7% respectively.
The net decrease in customer currency placements resulted mainly from a contraction of 26% in fixed-term deposits, which was partially offset by an increase of 41% in sight and notice deposit accounts and of 6% in MTIs.
Gold deposits amounted to SDR 19.6 billion at end-March 2012, a decrease of SDR 1.6 billion for the financial year.
6 Funds placed by institutions for which foreign exchange reserves data are not available are excluded from the calculation.

118 BIS 82nd Annual Report
Assets
As in the previous financial year, most of the assets held by the BIS consist of government and quasi-government securities plus investments (including reverse repurchase agreements) with highly rated commercial banks of international standing. In addition, the Bank owned 116 tonnes of fine gold at 31 March 2012. The Bank’s credit exposure is managed in a conservative manner, with almost all of it rated no lower than A– at 31 March 2012 (see note 3, “Credit risk”, in the “Risk management” section of the financial statements).
The Bank’s holdings of currency assets totalled SDR 200.2 billion on 31 March 2012, down from SDR 209.3 billion at the end of the previous financial year (see note 5, “Currency assets”, in “Notes to the financial statements”).
The Bank uses various derivative instruments to manage its assets and liabilities efficiently (see note 7, “Derivative financial instruments”, in “Notes to the financial statements”).
Representative Offices
The BIS has a Representative Office for Asia and the Pacific (the Asian Office), located in the Hong Kong Special Administrative Region of the People’s Republic of China; and a Representative Office for the Americas (the Americas Office), located in Mexico City. The Representative Offices promote cooperation within each region by organising meetings, conducting policy research and fostering the exchange of information and data. The Asian Office also provides banking services to the region’s monetary authorities.
The Asian Office
With strong support from the BIS shareholding central banks in the Asia-Pacific region, economists in the Asian Office continued to pursue a policy-
The sum of the bars indicates total customer placements.
Balance sheet total and customer placements by product End-quarter figures, in billions of SDR
FIXBISMTIsGold depositsOther instruments
Balance sheet total
0
75
150
225
300
2009 2010 2011 2012
119BIS 82nd Annual Report
oriented research agenda. The Office likewise maintained its programme of helping to organise high-level regional meetings and, through its Regional Treasury, continued to offer specialised banking services.
The Asian Consultative Council
The Asian Consultative Council (ACC), comprising the Governors of the 12 BIS shareholding central banks in the region,7 guides the activities of the Asian Office. ACC chair Masaaki Shirakawa, Governor of the Bank of Japan, presided over the Council’s meetings and reported to the BIS Board on the Office’s activities. At its June 2011 semiannual meeting in Basel, the ACC supported the continuation of the four regular Governor-level meetings organised by the BIS in the region. At its meeting in February in Hong Kong, the ACC endorsed a topic to serve as the new research focus of the monetary group for the next two years: “Globalisation and inflation dynamics in Asia and the Pacific”.
Research
Economists in the Asian Office, along with those in Basel, produced research on two themes – chosen in 2010 – that are highly relevant to ACC central banks: on the monetary side, the role of central bank balance sheets in monetary policy and exchange rate issues; and on the financial side, property prices. A workshop hosted by the Monetary Authority of Singapore in September helped sharpen the focus of the research on property prices. A research conference hosted by the Bank of Thailand in Chiang Mai in December marked the completion of the focus on central bank balance sheets.
The economists continued to engage in collaborative research with most BIS shareholding central banks in the region as well as with regional organisations of central banks. The work has fed into numerous central bank meetings and has yielded several articles in refereed journals and major BIS publications.
The Special Governors’ Meeting and other high-level meetings
The Asian Office helped organise 10 high-level BIS policy meetings in the region during the period. Each meeting was held jointly with a central bank in the region or with a regional body of central banks, such as the Executives’ Meeting of East Asia-Pacific Central Banks (EMEAP) or the South East Asian Central Banks (SEACEN) Research and Training Centre.
The annual Special Governors’ Meeting gathers the Governors of the major central banks in the region together with other Governors from around the world to address issues of common concern. This year’s meeting was organised jointly with the Hong Kong Monetary Authority and held in Hong Kong in February. For the second time, the event included a meeting with the chief executive officers of large financial institutions active in the region to discuss the challenges and threats faced by financial systems in Asia and the Pacific.
7 Those of Australia, China, Hong Kong SAR, India, Indonesia, Japan, Korea, Malaysia, New Zealand, the Philippines, Singapore and Thailand.

120 BIS 82nd Annual Report
Other high-level events were a meeting in June of the Working Party on Monetary Policy in Asia, co-hosted by the Hong Kong Monetary Authority in Hong Kong; in November, the Seventh High-Level Seminar on Financial Markets, co-hosted by the Bank of Japan in Yokohama; and in January, the SEACEN-BIS Exco Seminar, co-hosted by the Central Bank of Sri Lanka in Colombo.
Banking activity and the Asian Bond Funds
Against the background of ongoing concerns about the global economic and financial environment, central banks in the region maintained a rather conservative stance in their reserve portfolio operations with the BIS, relying mainly on short-term liquid instruments. On balance, placements by central banks from the region in the 2011/12 financial year were down slightly from those in 2010/11.
As fund administrator, the BIS continued to support the second Asian Bond Fund (ABF2), an EMEAP initiative to foster the development of local currency bond markets. At the end of March 2012, the combined size of the funds stood at $4.8 billion, an increase of about 21% since the end of March 2011. The total return on the Pan-Asia Bond Index Fund (PAIF) from its inception on 7 July 2005 to end-March 2012 was 59%, which compared favourably with the 44% return on a US Treasury index of similar duration.
The Americas Office
The Americas Office, together with the BIS head office, is currently studying the way capital inflows may be influencing regional monetary policy; also under review are the local effects of recent recommendations to enhance key supervisory standards and strengthen financial stability. Within the region, the Office is disseminating BIS research and analysis on these and related topics and is assisting Basel-based departments and groupings in their outreach efforts and analysis.
The Office’s work with BIS member banks, other central banks, regulatory authorities and the academic community generated several papers on economic topics this year. Most of the papers are available on the Americas Office pages of the BIS website.
The Office supported meetings at regional central banks. These included the October 2011 meeting of the Working Party on Monetary Policy in Latin America, convened at the Central Bank of Argentina, and the July 2011 gathering of the Markets Committee Working Party on Markets in Latin America, hosted by the Bank of Mexico. The Americas Office also supported several training events organised by the FSI in cooperation with regional groupings of supervisors.
The Office provided speakers to, or participated in, various other conferences and meetings convened by regional central banks and international organisations and groupings. For example, it supported the November 2011 annual meeting of the Latin American and Caribbean Economic Association (LACEA). In December 2011, it hosted, together

121BIS 82nd Annual Report
with the Bank of Mexico and CEMLA (Center for Latin American Monetary Studies), a roundtable on external factors and monetary policy. And in March 2012, the Office contributed to a joint meeting on international banking after the crisis, convened at the Central Reserve Bank of Peru in cooperation with CEMLA.
The Consultative Council for the Americas
The Office serves as the secretariat to the Consultative Council for the Americas (CCA). The CCA, which comprises the Governors of the eight BIS member central banks in the Americas,8 was established in May 2008 as an advisory committee to the BIS Board of Directors. CCA members are regularly informed of the work of the BIS and the Americas Office in the region and provide guidance on current and possible future work at the BIS of interest to the Americas. It is currently sponsoring cooperative efforts in economic research among its member central banks, including a series of research conferences. The second such conference was held at the Bank of Canada in May 2011.
José de Gregorio chaired the CCA from January 2011 until December 2011, the end of his term as Governor of the Central Bank of Chile. In January 2012, the BIS Board appointed Agustín Carstens, Governor of the Bank of Mexico, to a two-year term as chair beginning 10 January.
Governance and management of the BIS
The governance and management of the Bank are conducted at three principal levels:• theGeneralMeetingofBISmembercentralbanks;• theBISBoardofDirectors;and• BISManagement.
The BIS has its head office in Basel, Switzerland. At the end of the 2011/12 financial year, the BIS employed 616 staff members from 54 countries.
Membership expansion
With a view to further strengthening central bank cooperation, the Board of Directors decided on 26 June 2011 to invite an additional four central banks to become members of the Bank in accordance with Article 8.3 of the BIS Statutes. The Bank of the Republic (Colombia), the Central Bank of Luxembourg, the Central Reserve Bank of Peru and the Central Bank of the United Arab Emirates were each invited to subscribe 3,000 shares of the third tranche of the capital of the BIS. By the close of the subscription period at end-2011, all four central banks had taken up the Board’s offer to become members of the BIS.
At its meeting in June 2011, the Board fixed the issue price per share at SDR 21,904. As the Bank’s authorised nominal capital of SDR 5,000 per share is
8 Those of Argentina, Brazil, Canada, Chile, Colombia, Mexico, Peru and the United States.

122 BIS 82nd Annual Report
paid up by members to the extent of 25%, or SDR 1,250 per share, the issue price of SDR 21,904 included a premium of SDR 20,654 per share. At 31 March 2012, following the subscription by the four new members totalling 12,000 shares, the number of the Bank’s issued shares rose to 559,125, and the paid-up capital of the Bank in the balance sheet increased by SDR 15 million (at SDR 1,250 per share) to SDR 699 million. The aggregate premium received from the four new central bank members amounted to SDR 247.8 million, of which SDR 1.5 million was allocated to the legal reserve fund and SDR 246.3 million to the general reserve fund.
The General Meeting of BIS member central banks
Sixty central banks and monetary authorities are currently members of the BIS and have rights of voting and representation at General Meetings. The Annual General Meeting (AGM) is held no later than four months after 31 March, the end of the BIS financial year. The AGM decides the distribution of the dividend and profit of the BIS, approves the annual report and the accounts of the Bank, makes adjustments in the allowances paid to Board members and selects the Bank’s external auditor.
The BIS Board of Directors
Consisting of 19 members, the Board of Directors is assisted by four committees of Board members: the Administrative Committee, the Audit Committee, the Banking and Risk Management Committee, and the Nomination Committee. The main responsibilities of the Board are determining the strategic and policy direction of the BIS and supervising the Bank’s Management.
Nout Wellink retired as President of the Netherlands Bank at the end of June 2011 and therefore stepped down as a member of the BIS Board. He had been a member of the Board since 1997 and had served as its Chairman from March 2002 to February 2006. Mr Wellink’s successor as President of the Netherlands Bank, Klaas Knot, was elected by the Board at its meeting in September 2011 to fill the remainder of Mr Wellink’s BIS Board term, which ends on 30 June 2012.
Jean-Claude Trichet retired as President of the ECB, and therefore as a member of the BIS Board, at the end of October 2011. With effect from 1 November 2011, Mario Draghi stepped down as Governor of the Bank of Italy, thereby vacating his seat on the Board, to take up his new position as President of the ECB. Ignazio Visco succeeded Mr Draghi at the Bank of Italy and became an ex officio member of the Board. At its September 2011 meeting, the BIS Board elected Mario Draghi to fill the remainder of Mr Trichet’s BIS Board term, which ends on 30 June 2012.
Paul Tucker, Deputy Governor, Financial Stability, of the Bank of England, stepped down as a member of the Board at the end of December 2011.
With effect from 1 January 2012, Jens Weidmann, President of the Deutsche Bundesbank, appointed Andreas Dombret, of the Executive Board of the Deutsche Bundesbank, to the BIS Board.

123BIS 82nd Annual Report
Following the retirement of Jean-Pierre Landau from the Board, Christian Noyer, Governor of the Bank of France, appointed Anne Le Lorier, First Deputy Governor of the Bank of France, to the BIS Board with effect from 1 January 2012.
On 9 January 2012, Philipp Hildebrand resigned as Chairman of the Governing Board of the Swiss National Bank and therefore also from the BIS Board and as Chairman of its Administrative Committee. His successor at the Swiss National Bank, Thomas Jordan, was elected to the BIS Board of Directors on 7 May 2012 for the remainder of Mr Hildebrand’s term, which ends on 31 March 2013. Agustín Carstens, Governor of the Bank of Mexico, was elected to succeed Mr Hildebrand as Chairman of the Administrative Committee with effect from 5 March 2012.
BIS shareholding institutions and members of the BIS Board of Directors are listed on the following pages.

124 BIS 82nd Annual Report
BIS member central banks
Bank of Algeria
Central Bank of Argentina
Reserve Bank of Australia
Central Bank of the Republic of Austria
National Bank of Belgium
Central Bank of Bosnia and Herzegovina
Central Bank of Brazil
Bulgarian National Bank
Bank of Canada
Central Bank of Chile
People’s Bank of China
Bank of the Republic (Colombia)
Croatian National Bank
Czech National Bank
National Bank of Denmark
Bank of Estonia
European Central Bank
Bank of Finland
Bank of France
Deutsche Bundesbank (Germany)
Bank of Greece
Hong Kong Monetary Authority
Magyar Nemzeti Bank (Hungary)
Central Bank of Iceland
Reserve Bank of India
Bank Indonesia
Central Bank of Ireland
Bank of Israel
Bank of Italy
Bank of Japan
Bank of Korea
Bank of Latvia
Bank of Lithuania
Central Bank of Luxembourg
National Bank of the Republic of Macedonia
Central Bank of Malaysia
Bank of Mexico
Netherlands Bank
Reserve Bank of New Zealand
Central Bank of Norway
Central Reserve Bank of Peru
Bangko Sentral ng Pilipinas (Philippines)
National Bank of Poland
Bank of Portugal
National Bank of Romania
Central Bank of the Russian Federation
Saudi Arabian Monetary Agency
National Bank of Serbia
Monetary Authority of Singapore
National Bank of Slovakia
Bank of Slovenia
South African Reserve Bank
Bank of Spain
Sveriges Riksbank (Sweden)
Swiss National Bank
Bank of Thailand
Central Bank of the Republic of Turkey
Central Bank of the United Arab Emirates
Bank of England
Board of Governors of the Federal Reserve System (United States)

125BIS 82nd Annual Report
Board of Directors
Christian Noyer, Paris Chairman
Masaaki Shirakawa, Tokyo Vice-Chairman
Ben S Bernanke, WashingtonMark Carney, OttawaAgustín Carstens, Mexico CityLuc Coene, BrusselsAndreas Dombret, Frankfurt am MainMario Draghi, Frankfurt am MainWilliam C Dudley, New YorkStefan Ingves, StockholmThomas Jordan, Zurich9
Mervyn King, LondonKlaas Knot, AmsterdamAnne Le Lorier, ParisGuy Quaden, BrusselsFabrizio Saccomanni, RomeIgnazio Visco, RomeJens Weidmann, Frankfurt am MainZhou Xiaochuan, Beijing
Alternates
Mathias Dewatripont or Jan Smets, BrusselsPierre Jaillet or Christian Durand, ParisJoachim Nagel or Karlheinz Bischofberger, Frankfurt am MainFabio Panetta, RomePaul Tucker or Paul Fisher, LondonJanet L Yellen or Steven B Kamin, Washington
Committees of the Board of Directors
Administrative Committee, chaired by Agustín CarstensAudit Committee, chaired by Mark CarneyBanking and Risk Management Committee, chaired by Stefan IngvesNomination Committee, chaired by Christian Noyer
In memoriam
The Board noted with deep regret the death on 15 April 2012 of Yasushi Mieno, former Governor of the Bank of Japan. He was 88. In September 1994, towards the end of his tenure as Governor, the Bank of Japan joined the Board; Mr Mieno thereupon became a member and served for three months.
9 Elected to the BIS Board on 7 May 2012.

126 BIS 82nd Annual Report
BIS Management
BIS Management is under the overall direction of the General Manager, who is responsible to the Board of Directors for the conduct of the Bank. The General Manager is advised by the Executive Committee of the BIS, which consists of six members: the General Manager as chair; the Deputy General Manager; the Heads of the three BIS departments – the General Secretariat, the Monetary and Economic Department and the Banking Department – and the General Counsel.
Other senior officials are the Deputy Heads of the departments and the Chairman of the Financial Stability Institute.
General Manager Jaime Caruana
Deputy General Manager Hervé Hannoun
Secretary General and Head of General Peter Dittus Secretariat
Economic Adviser and Head of Monetary Stephen G Cecchetti and Economic Department
Head of Banking Department Günter Pleines
General Counsel Diego Devos
Deputy Secretary General Jim Etherington
Deputy Head of Banking Department Louis de Montpellier
Deputy Head of Monetary and Economic Claudio Borio Department (Research and Statistics)
Deputy Head of Monetary and Economic Philip Turner Department (Policy, Coordination and Administration)
Chairman, Financial Stability Institute Josef Tošovský
Bank budget policy
The process of formulating the Bank’s expenditure budget for the next financial year starts about six months in advance with the setting by Management of a broad business orientation and financial framework. Within this context, business areas specify their plans and the corresponding resource requirements. The process of reconciling detailed business plans, objectives and overall resource availability culminates in a draft financial budget, which must be approved by the Board before the start of the financial year.
The budget distinguishes between administrative and capital expenditures. In common with organisations similar to the BIS, Management and staff expenditure – including remuneration, pensions, and health and accident insurance – amounts to around 70% of administrative expenditure. The other major expenditure categories, each accounting for about 10% of administrative spending, are information technology (IT), buildings and

127BIS 82nd Annual Report
equipment, and general operational costs. Capital spending, relating mainly to buildings and IT investment, can vary significantly from year to year depending on the projects in progress.
Administrative and capital expenditure for 2011/12 reflected the Bank’s priority of responding to the global financial crisis. Additional staff positions were allocated to the Financial Stability Board (FSB), the Basel Committee on Banking Supervision (BCBS), the Committee on Payment and Settlement Systems (CPSS) and the Financial Stability Institute (FSI). At the same time, IT projects were undertaken to enhance statistical and research systems as well as to improve the dissemination of the Basel III package. In addition, the Banking Department completed work on improving the IT infrastructure for its asset management activities, which involved enhancements to data management, compliance checking, portfolio analysis, order management and trade processing.
For the financial year 2011/12, overall administrative expenditure on the Bank’s budget basis of accounting10 amounted to CHF 255.0 million, or CHF 13.5 million (5.0%) lower than the budget. It was CHF 1.3 million (0.5%) above actual administrative expenditure in 2010/11.
Capital expenditure was CHF 26.2 million, or CHF 0.4 million (1.5%) below the budget. It was CHF 4.5 million (20.7%) above actual capital expenditure in 2010/11.
Total expenditure was CHF 281.2 million, or CHF 13.9 million (4.7%) below budget. It was CHF 5.8 million (2.1%) above the actual expenditure in 2010/11.
For 2012/13, the Bank’s business plan builds on the achievements in 2011/12, continuing to give priority to further enhancing financial stability activities. It allocates additional human and financial resources to deal with the expanding financial stability workload, particularly in the FSB, the BCBS and the statistical and long-term research sections of the Monetary and Economic Department. The additional work includes disseminating the Basel III package to the global community of central banks and financial supervisors and enhancing the Bank’s statistical capacity for the monitoring of financial markets and institutions. Strengthening the resilience of BIS banking activities, based on appropriate levels of profitability and financial risk over the medium term, will continue to be the main priority of the Banking Department and the Risk Control, Finance and Compliance units. Additional resources were also made available in the budget to upgrade the Banking Department’s main IT system.
In March 2012, the Board approved a 3.5% increase in the administrative budget for the financial year 2012/13, to CHF 277.4 million. It also approved a capital budget of CHF 23.3 million. The total budget of CHF 300.7 million is CHF 5.6 million (1.9%) higher than in 2011/12.
10 The Bank’s budget excludes financial accounting adjustments relating to post-employment benefit obligations for pensions and health and accident insurance. The expense for the next financial year depends on the actuarial valuations as at 31 March each year, which are not finalised until April, after the budget has been set by the Board. For similar reasons, certain extraordinary items are also excluded from the budget. These additional factors are included under “Operating expense” in the profit and loss account (see “Net profit and its distribution”).

128 BIS 82nd Annual Report
Bank remuneration policy
The jobs performed by BIS staff members are assessed on the basis of a number of objective criteria, including qualifications, experience and responsibilities, and classified into distinct job grades. The job grades are associated with a structure of salary ranges. Salaries of individual staff members move within the ranges of the salary structure on the basis of performance. Every three years, a comprehensive survey benchmarks BIS salaries (in Swiss francs) against compensation in comparable institutions and market segments. In benchmarking, the Bank focuses on the upper half of market compensation in order to attract highly qualified staff. The analysis takes into account differences in the taxation of compensation at the surveyed institutions. In the most recent survey, which took place in the second half of 2010, the benchmark data reflected the comparator market as of 1 July 2010. As of 1 July 2011, the midpoints of the Bank’s salary ranges were aligned with those observed market benchmarks and with the estimated change in external market salaries in the preceding year. The latter adjustment, based on the rate of inflation in Switzerland and the weighted average change in real wages in advanced economies, amounted to an increase of 1.4%.
Through the Bank, BIS staff members have access to a contributory health insurance plan and a contributory defined benefit pension plan. Non-locally hired, non-Swiss staff members recruited for a position at the Bank’s headquarters, including senior officials, are entitled to an expatriation allowance. The allowance currently amounts to 14% of annual salary for unmarried staff members and 18% for married staff members, subject to a ceiling. Expatriate staff members are also entitled to receive an education allowance for their children, subject to certain conditions. In the Representative Offices, the BIS makes a distinction between staff members on an international assignment from the headquarters and staff members recruited directly for a position in a Representative Office. The employment conditions of the former are determined in accordance with the Bank’s international assignment policy. For staff recruited directly, employment conditions are aligned with those in the market in which the Office is located, but they include access to the same health insurance and pension plans available to staff employed at the Bank’s headquarters.
The salaries of senior officials are regularly benchmarked against compensation in comparable institutions and market segments. As with the survey for other staff, the most recent executive compensation survey took place in the second half of 2010. The results confirmed the appropriateness of the current practice of annually adjusting the salaries of senior officials for the rate of Swiss inflation.
As of 1 July 2011, the annual remuneration of senior officials, before expatriation allowances, is based on the salary structure (in Swiss francs) of 763,930 for the General Manager;11 646,400 for the Deputy General Manager; and 587,640 for Heads of Department.
11 In addition to the basic salary, the General Manager receives an annual representation allowance and enhanced pension rights.

129BIS 82nd Annual Report
The Annual General Meeting approves the remuneration of members of the Board of Directors, with adjustments taking place at regular intervals. The total fixed annual remuneration paid to the Board of Directors was 1,049,520 Swiss francs as of 1 April 2012. In addition, Board members receive an attendance fee for each Board meeting in which they participate. Assuming the full Board is represented in all Board meetings, the annual total of these attendance fees amounts to 973,788 Swiss francs.
Net profit and its distribution
The Bank recorded a net profit of SDR 758.9 million for its 82nd financial year, ended 31 March 2012. This result is 7% lower than the previous year, reflecting a lower average balance sheet as well as the difficult market conditions that prevailed for most of the year.
Principal factors behind the 2011/12 profit
The financial year 2011/12 included periods of rising and falling market tension. The first half of the financial year saw a challenging combination of widening credit spreads, heightened distortions in money markets and risk aversion among investors. Market conditions improved slightly in October before deteriorating sharply in November. The last four months of the financial year then saw narrowing credit spreads together with relative stability in foreign exchange and money markets.
Against this backdrop, net interest income amounted to SDR 1,458.1 million in 2011/12, compared with SDR 1,465.4 million in the preceding financial year. This reflected an almost unchanged average volume of currency deposits from customers.
Net valuation losses amounted to SDR 590.3 million, compared with a loss of SDR 509.2 million in the preceding financial year. These losses were mainly attributable to widening credit spreads on euro area debt instruments held in the Bank’s credit portfolios.
Operating expenses amounted to SDR 226.7 million, 10.6% above the 2010/11 figure of SDR 205.0 million.12
After taking into account the above factors, the Bank’s operating profit amounted to SDR 655.5 million, which was SDR 83 million below the SDR 738.5 million recorded in 2010/11.
The Bank’s available for sale portfolios, one for investment securities and one for gold, hold positions for which valuation gains are recognised in the profit and loss account only on disposal. During 2011/12, the Bank continued to manage its portfolio of available for sale investment securities with a benchmark duration of three years, with disposals in this portfolio realising a net gain of
12 See the earlier section “Bank budget policy” for details on this year’s BIS budget, including the treatment of operating expenses. Because most of the Bank’s administrative and capital expenditure is incurred in Swiss francs, the budget is expressed and controlled in that currency. As the Bank’s financial statements are presented in SDR, they include the effect of the 11% appreciation of the Swiss franc against the SDR during the year.

130 BIS 82nd Annual Report
SDR 24.7 million (2010/11: net gain of SDR 55.7 million). The Bank also realised a gain of SDR 78.7 million on the sale of 3 tonnes of its gold investment assets. This compares with a gain of SDR 21.8 million on the sale of 1 tonne in 2010/11.
As a result of these factors, the net profit for 2011/12 amounted to SDR 758.9 million, SDR 57.1 million below the SDR 816.0 million recorded in 2010/11.
Movements in equity
The unrealised gains on the Bank’s available for sale portfolios, one for investment securities and one for gold, are included in revaluation accounts in the Bank’s equity.
The securities revaluation account increased by SDR 296.5 million from net unrealised gains (2010/11: loss of SDR 197.3 million), mainly the result of falling interest yields over the year. The gold revaluation account increased by SDR 551.8 million (2010/11: gain of SDR 650.4 million), which was attributable primarily to the 18% appreciation of the gold price during the year.
After these gains are taken into account, the Bank’s total comprehensive income for 2011/12 was SDR 1,607.2 million. This represented a return of 9.2% on average equity of SDR 17,562 million. In 2010/11, the total return was SDR 1,269.1 million, or 7.8%, on average equity of SDR 16,238 million. Taking into account the dividend for 2010/11 of SDR 374.1 million that was paid during 2011/12 and the issue of new shares for SDR 262.9 million, the Bank’s equity increased by SDR 1,709.0 million during the year ended 31 March 2012.
Proposed dividend
The Board’s review of the BIS dividend policy in 2009/10 took into consideration the Bank’s capital needs and the interests of BIS shareholders in obtaining a fair and sustainable return on their investments in BIS shares. In framing the dividend policy, the Board adopted a number of governing principles, which are:• First,theneedfortheBanktomaintainastrongcapitalbaseatalltimes,
including during financial stress. • Second,thedividendshouldberelativelystable,setatasustainablelevel
and changing in a predictable manner each year. • Third,while theBank’sdividendpolicyshouldprovideguidance for the
medium term, the dividend should continue to reflect the prevailing financial circumstances of the Bank, and the Board’s proposal to the AGM should remain an annual decision.The dividend policy takes into account the Bank’s capital adequacy and
leverage ratio requirements. The policy, which is due to be reviewed again in 2014/15, incorporates: • a normal sustainable dividend, decided ex ante in conformity with the
medium-term dividend policy, which would increase by SDR 10 per share per annum; and
• a supplementary dividend, which would be decided ex post, whilekeeping leverage and economic capital within desired ranges.

131BIS 82nd Annual Report
The policy ensures that earnings are retained to augment the Bank’s capital at a rate sufficient to support the Bank’s business and maintain its capital position relative to the size of the balance sheet and its economic capital requirements. In normal circumstances, it results in a steady progression in annual dividends while retaining the flexibility to be operable in years of low or high profits. In addition, the final approval of the dividend coincides with the outcome of the annual economic capital allocation process (see note 2 of the capital adequacy section of the financial statements), enabling the Board to set an appropriate dividend while ensuring that the Bank’s capital base remains strong.
Consistent with this dividend policy, the Board proposes for the financial year 2011/12 to declare a normal dividend of SDR 305 per share, SDR 10 per share above the normal dividend for 2010/11. No supplementary dividend is proposed for 2011/12.
At 31 March 2012, there were 559,125 issued and paid-up shares (2011: 547,125); this includes the 1,000 shares of the Albanian issue that are suspended and held in treasury. During 2011/12, 12,000 shares were issued to new members.
A full normal dividend will be paid on 546,125 shares, while the 12,000 shares issued during the year will receive a pro rata amount calculated from the date of subscription. No dividend will be paid on the 1,000 shares held in treasury.
The resulting total proposed dividend of SDR 168.4 million would be paid out on 29 June 2012 in any constituent currency of the SDR, or in Swiss francs, according to the instructions of each shareholder named in the Bank’s share register at 31 March 2012.
Proposed distribution and allocation of net profit for the year
On the basis of Article 51 of the Bank’s Statutes, the Board of Directors recommends to the Annual General Meeting that the net profit for the year of SDR 758.9 million be applied by the General Meeting in the following manner:(a) SDR 168.4 million to be paid as a normal dividend of SDR 305 per share;(b) SDR 29.5 million to be transferred to the general reserve fund;13
(c) SDR 6.0 million to be transferred to the special dividend reserve fund; and(d) SDR 555.0 million, representing the remainder of the available profit, to
be transferred to the free reserve fund.
Report of the auditor
The Bank’s financial statements have been duly audited by Deloitte AG, who have confirmed that they give a true and fair view of the Bank’s financial position at 31 March 2012 and the results of its operations for the year then
13 The general reserve fund exceeded five times the Bank’s paid-up capital at 31 March 2012. As such, under Article 51 of the Statutes, 5% of net profit, after accounting for the proposed dividend, should be allocated to the general reserve fund.

132 BIS 82nd Annual Report
ended. The Deloitte report is to be found immediately following the financial statements.
Auditor rotation
In line with the Board policy on auditor rotation, Deloitte AG will resign as auditor after the year-end, having served for a term of seven years. A selection process involving the Bank’s Management and the Audit Committee having been concluded, it is intended that Ernst & Young will become the Bank’s new auditor; a resolution to appoint them for 2012/13 will be presented to the Annual General Meeting.

133BIS 82nd Annual Report
Financial statements
as at 31 March 2012
The financial statements on pages 134–98 for the financial year ended 31 March 2012 were approved on 7 May 2012 for presentation to the Annual General Meeting on 24 June 2012. They are presented in a form approved by the Board of Directors pursuant to Article 49 of the Bank’s Statutes and are subject to approval by the shareholders at the Annual General Meeting.
Jaime Caruana Hervé Hannoun General Manager Deputy General Manager

134 BIS 82nd Annual Report
Balance sheetAs at 31 March
SDR millions Notes 2012 2011
Assets
Cash and sight accounts with banks 3 4,077.8 329.8
Gold and gold loans 4 35,912.7 36,637.2
Treasury bills 5 53,492.3 76,932.1
Securities purchased under resale agreements 5 46,210.8 51,464.0
Loans and advances 6 22,757.1 24,170.4
Government and other securities 5 77,877.7 56,987.9
Derivative financial instruments 7 7,303.9 5,790.3
Accounts receivable 8 7,845.5 8,616.3
Land, buildings and equipment 9 193.0 190.8
Total assets 255,670.8 261,118.8
Liabilities
Currency deposits 10 195,778.5 207,085.6
Gold deposits 11 19,624.0 21,269.9
Derivative financial instruments 7 4,727.0 6,959.5
Accounts payable 12 16,745.5 8,758.1
Other liabilities 13 416.5 375.4
Total liabilities 237,291.5 244,448.5
Shareholders’ equity
Share capital 14 698.9 683.9
Statutory reserves 15 13,057.2 12,154.4
Profit and loss account 758.9 816.0
Less: shares held in treasury 16 (1.7) (1.7)
Other equity accounts 17 3,866.0 3,017.7
Total equity 18,379.3 16,670.3
Total liabilities and equity 255,670.8 261,118.8

135BIS 82nd Annual Report
Profit and loss accountFor the financial year ended 31 March
SDR millions Notes 2012 2011
Interest income 19 3,091.2 3,324.4
Interest expense 20 (1,633.1) (1,859.0)
Net interest income 1,458.1 1,465.4
Net valuation movement 21 (590.3) (509.2)
Net interest and valuation income 867.8 956.2
Net fee and commission income 22 4.7 3.1
Net foreign exchange gain / (loss) 23 9.7 (15.8)
Total operating income 882.2 943.5
Operating expense 24 (226.7) (205.0)
Operating profit 655.5 738.5
Net gain on sales of securities available for sale 25 24.7 55.7
Net gain on sales of gold investment assets 26 78.7 21.8
Net profit for the financial year 758.9 816.0
Basic and diluted earnings per share (in SDR per share) 27 1,374.6 1,494.2

136 BIS 82nd Annual Report
Statement of comprehensive incomeFor the financial year ended 31 March
SDR millions Notes 2012 2011
Net profit for the financial year 758.9 816.0
Unrealised gain / (loss) on securities available for sale 17A 296.5 (197.3)
Unrealised gain on gold investment assets 17B 551.8 650.4
Total comprehensive income for the financial year 1,607.2 1,269.1

137BIS 82nd Annual Report
Statement of cash flowsFor the financial year ended 31 March
SDR millions Notes 2012 2011
Cash flow from / (used in) operating activities
Interest and similar income received 3,676.2 3,591.1
Interest and similar expenses paid (1,625.4) (1,769.2)
Net fee and commission income 22 4.7 3.1
Net foreign exchange transaction gain 23 14.4 21.5
Operating expenses paid (210.4) (190.8)
Non-cash flow items included in operating profit
Valuation movements on operating assets and liabilities 21 (590.3) (509.2)
Net foreign exchange translation loss 23 (4.7) (37.3)
Release of impairment provision on gold loans 34.7 –
Change in accruals and amortisation (627.4) (356.5)
Change in operating assets and liabilities
Currency deposit liabilities held at fair value through profit and loss (18,980.9) 17,500.9
Currency banking assets 19,630.1 (10,882.2)
Sight and notice deposit account liabilities 7,251.1 (11,022.2)
Gold deposit liabilities (1,645.9) (10,794.2)
Gold and gold loan banking assets 1,291.5 7,042.6
Accounts receivable (2.0) 1.5
Other liabilities / accounts payable 41.1 (332.7)
Net derivative financial instruments (3,746.1) 7,096.5
Net cash flow from / (used in) operating activities 4,510.7 (637.1)
Cash flow from / (used in) investment activities
Net change in currency investment assets available for sale 5B (923.0) (829.8)
Net change in currency investment assets held at fair value through profit and loss (51.7) (82.9)
Net change in gold investment assets 4B 63.5 32.2
Net purchase of land, buildings and equipment 9 (18.9) (15.1)
Net cash flow used in investment activities (930.1) (895.6)

138 BIS 82nd Annual Report
SDR millions Notes 2012 2011
Cash flow from / (used in) financing activities
Issue of shares 262.9 –
Dividends paid (161.1) (374.1)
Net cash flow from / (used in) financing activities 101.8 (374.1)
Total net cash flow 3,682.4 (1,906.8)
Net effect of exchange rate changes on cash and cash equivalents
1.1 178.4
Net movement in cash and cash equivalents 3,681.3 (2,085.2)
Net change in cash and cash equivalents 3,682.4 (1,906.8)
Cash and cash equivalents, beginning of year 28 582.0 2,488.8
Cash and cash equivalents, end of year 28 4,264.4 582.0

139BIS 82nd Annual Report
Movements in the Bank’s equityFor the financial year ended 31 March
SDR millions NotesShare capital
Statutory reserves
Profit and loss
Shares held in
treasury
Other equity
accountsTotal
equity
Equity at 31 March 2010 683.9 10,668.7 1,859.8 (1.7) 2,564.6 15,775.3
Total comprehensive income 17 – – 816.0 – 453.1 1,269.1
Payment of 2009/10 normal dividend – – (155.6) – – (155.6)
Payment of 2009/10 supplementary dividend – – (218.5) – – (218.5)
Allocation of 2009/10 profit – 1,485.7 (1,485.7) – – –
Equity at 31 March 2011 683.9 12,154.4 816.0 (1.7) 3,017.7 16,670.3
Total comprehensive income 17 – – 758.9 – 848.3 1,607.2
Payment of 2010/11 dividend – – (161.1) – – (161.1)
Issue of shares 15.0 247.9 – – – 262.9
Allocation of 2010/11 profit – 654.9 (654.9) – – –
Equity at 31 March 2012 per balance sheet before proposed profit allocation 698.9 13,057.2 758.9 (1.7) 3,866.0 18,379.3
Proposed dividend – – (168.4) – – (168.4)
Proposed transfers to reserves – 590.5 (590.5) – – –
Equity at 31 March 2012 after proposed profit allocation 698.9 13,647.7 – (1.7) 3,866.0 18,210.9
At 31 March 2012 statutory reserves included share premiums of SDR 1,059.6 million (2011: SDR 811.7 million).

140 BIS 82nd Annual Report
Statement of proposed profit allocationFor the financial year ended 31 March
SDR millions Notes 2012
Net profit for the financial year 758.9
Transfer to legal reserve fund 15 –
Proposed dividend:
SDR 305 per share on 546,125 shares (166.6)
On 12,000 newly issued shares (pro rata from the value date of the share subscription) (1.8)
Profit available for allocation 590.5
Proposed transfers to reserves:
General reserve fund 15 (29.5)
Special dividend reserve fund 15 (6.0)
Free reserve fund 15 (555.0)
Balance after allocation to reserves –
The proposed profit allocation is in accordance with Article 51 of the Bank’s Statutes.
Movements in the Bank’s statutory reservesFor the financial year ended 31 March
2012
SDR millions Notes
Legal reserve
fund
General reserve
fund
Special dividend reserve
fund
Free reserve
fund
Total statutory reserves
Balance at 31 March 2011 68.3 3,228.5 166.0 8,691.6 12,154.4
Allocation of 2010/11 profit 15 – 65.5 6.0 583.4 654.9
New shares issued 1.5 246.4 – – 247.9
Balance at 31 March 2012 per balance sheet before proposed profit allocation
69.8 3,540.4 172.0 9,275.0 13,057.2
Proposed transfers to reserves 15 – 29.5 6.0 555.0 590.5
Balance at 31 March 2012 after proposed profit allocation 69.8 3,569.9 178.0 9,830.0 13,647.7

141BIS 82nd Annual Report
The accounting policies set out below have been applied to both of the financial years presented unless otherwise stated.
1. Scope of the financial statements
These financial statements contain all assets and liabilities that are controlled by the Bank and in respect of which the economic benefits as well as the rights and obligations lie with the Bank.
Assets and liabilities in the name of but not controlled by the Bank and in respect of which the economic benefits as well as the rights and obligations do not lie with the Bank are not included in these financial statements. Information on off-balance sheet assets and liabilities is disclosed in note 31.
2. Functional and presentation currency
The functional and presentation currency of the Bank is the Special Drawing Right (SDR) as defined by the International Monetary Fund (IMF).
The SDR is calculated from a basket of major trading currencies according to Rule O–1 as adopted by the Executive Board of the IMF on 30 December 2010 and effective 1 January 2011. As currently calculated, one SDR is equivalent to the sum of USD 0.660, EUR 0.423, JPY 12.1 and GBP 0.111. Prior to 1 January 2011, one SDR was equivalent to the sum of USD 0.632, EUR 0.410, JPY 18.4 and GBP 0.0903. The change in the composition of the SDR basket was such that the values of the SDR under the old and new baskets were equivalent at 31 December 2010 and no significant gains or losses resulted from the change in the weights of the currencies. The composition of the SDR currency basket is subject to review every five years by the IMF; the next review is due to be undertaken in December 2015.
All figures in these financial statements are presented in SDR millions unless otherwise stated.
3. Currency translation
Monetary assets and liabilities are translated into SDR at the exchange rates ruling at the balance sheet date. Other
assets and liabilities are recorded in SDR at the exchange rates ruling at the date of the transaction. Profits and losses are translated into SDR at an average rate. Exchange differences arising from the retranslation of monetary assets and liabilities and from the settlement of transactions are included as net foreign exchange gains or losses in the profit and loss account.
4. Designation of financial instruments
Upon initial recognition the Bank allocates each financial instrument to one of the following categories:
• Loans and receivables
• Financial assets and financial liabilities held at fair value through profit and loss
• Available for sale financial assets
• Financial liabilities measured at amortised cost
The allocation to these categories is dependent on the nature of the financial instrument and the purpose for which it was entered into, as described in Section 5 below.
The resulting designation of each financial instrument determines the accounting methodology that is applied, as described in the accounting policies below. Where the financial instrument is designated as held at fair value through profit and loss, the Bank does not subsequently change this designation.
5. Asset and liability structure
Assets and liabilities are organised into two sets of portfolios:
A. Banking portfolios
These comprise currency and gold deposit liabilities and related banking assets and derivatives.
The Bank operates a banking business in currency and gold on behalf of its customers. In this business the Bank takes limited gold price, interest rate and foreign currency risk.
The Bank designates all currency financial instruments in its banking portfolios (other than cash and sight and notice accounts with banks, and sight and notice deposit account liabilities) as held at fair value through profit and loss. The use of fair values in the currency banking portfolios is described in Section 9 below.
Accounting policies

142 BIS 82nd Annual Report
All gold financial assets in these portfolios are designated as loans and receivables and all gold financial liabilities are designated as financial liabilities measured at amortised cost.
B. Investment portfolios
These comprise assets, liabilities and derivatives relating principally to the investment of the Bank’s equity.
The Bank holds most of its equity in financial instruments denominated in the constituent currencies of the SDR, which are managed using a fixed duration benchmark of bonds.
Except for the currency assets described in the next paragraph, currency assets (other than cash and sight and notice accounts with banks) are designated as available for sale. Related securities sold under repurchase agreements are designated as financial liabilities measured at amortised cost.
In addition, the Bank maintains some of its equity in more actively traded portfolios. The currency investment assets in these portfolios are trading assets and as such are designated as held at fair value through profit and loss.
The remainder of the Bank’s equity is held in gold. The Bank’s own gold holdings are designated as available for sale.
6. Cash and sight accounts with banks
Cash and sight accounts with banks are included in the balance sheet at their principal value plus accrued interest where applicable.
7. Notice accounts
Notice accounts are short-term monetary assets. They typically have notice periods of three days or less and are included under the balance sheet heading “Loans and advances”. They are considered to be cash equivalents for the purposes of the cash flow statement.
Due to their short-term nature, these financial instruments are designated as loans and receivables. They are included in the balance sheet at their principal value plus accrued interest. Interest is included in interest income on an accruals basis.
8. Sight and notice deposit account liabilities
Sight and notice deposit accounts are short-term monetary liabilities. They typically have notice periods of three days or less and are included under the balance sheet heading “Currency deposits”.
Due to their short-term nature, these financial instruments are designated as financial liabilities measured at amortised cost. They are included in the balance sheet at their principal value plus accrued interest. Interest is included in interest expense on an accruals basis.
9. Use of fair values in the currency banking portfolios
In operating its currency banking business, the Bank acts as a market-maker in certain of its currency deposit liabilities. As a result of this activity the Bank incurs realised profits and losses on these liabilities.
In accordance with the Bank’s risk management policies, the market risk inherent in this activity is managed on an overall fair value basis, combining all the relevant assets, liabilities and derivatives in its currency banking portfolios. The realised and unrealised profits or losses on currency deposit liabilities are thus largely offset by realised and unrealised losses or profits on the related currency banking assets and derivatives, or on other currency deposit liabilities.
To reduce the accounting inconsistency that would arise from recognising realised and unrealised gains and losses on different bases, the Bank designates the relevant assets, liabilities and derivatives in its currency banking portfolios as held at fair value through profit and loss.
10. Currency deposit liabilities held at fair value through profit and loss
As described above, all currency deposit liabilities, with the exception of sight and notice deposit account liabilities, are designated as held at fair value through profit and loss.
These currency deposit liabilities are initially included in the balance sheet on a trade date basis at cost. The subsequent accrual of interest to be paid and amortisation of premiums received and discounts paid are included under the profit and loss account heading “Interest expense” on an effective interest rate basis.
After trade date, the currency deposit liabilities are revalued to fair value, with all realised and unrealised movements in fair value included under “Net valuation movement”.

143BIS 82nd Annual Report
11. Currency assets held at fair value through profit and loss
Currency assets include treasury bills, securities purchased under resale agreements, loans and advances, and government and other securities.
As described above, the Bank designates all of the relevant assets in its currency banking portfolios as held at fair value through profit and loss. In addition, the Bank maintains certain actively traded investment portfolios. The currency investment assets in these portfolios are trading assets and as such are designated as held at fair value through profit and loss.
These currency assets are initially included in the balance sheet on a trade date basis at cost. The subsequent accrual of interest and amortisation of premiums paid and discounts received are included in the profit and loss account under “Interest income” on an effective interest rate basis.
After trade date, the currency assets are revalued to fair value, with all realised and unrealised movements in fair value included under “Net valuation movement”.
12. Currency investment assets available for sale
Currency assets include treasury bills, securities purchased under resale agreements, loans and advances, and government and other securities.
As described above, the Bank designates as available for sale all of the relevant assets in its currency investment portfolios, except for those assets in the Bank’s more actively traded investment portfolios.
These currency investment assets are initially included in the balance sheet on a trade date basis at cost. The subsequent accrual of interest and amortisation of premiums paid and discounts received are included in the profit and loss account under “Interest income” on an effective interest rate basis.
After trade date, the currency investment assets are revalued to fair value, with unrealised gains or losses included in the securities revaluation account, which is reported under the balance sheet heading “Other equity accounts”. The movement in fair value is included in the statement of comprehensive income under the heading “Unrealised gain / (loss) on securities available for sale”. Realised profits on disposal are included in the profit and loss account under “Net gain on sales of securities available for sale”.
13. Short positions in currency assets
Short positions in currency assets are included in the balance sheet under the heading “Other liabilities” at fair value on a trade date basis.
14. Gold
Gold comprises gold bar assets held in custody at central banks and sight accounts denominated in gold. Gold is considered by the Bank to be a financial instrument.
Gold is included in the balance sheet at its weight in gold (translated at the gold market price and USD exchange rate into SDR). Purchases and sales of gold are accounted for on a settlement date basis. Forward purchases or sales of gold are treated as derivatives prior to the settlement date.
The treatment of realised and unrealised gains or losses on gold is described in Section 17 below.
15. Gold loans
Gold loans comprise fixed-term gold loans. Gold loans are included in the balance sheet on a trade date basis at their weight in gold (translated at the gold market price and USD exchange rate into SDR) plus accrued interest.
Accrued interest on gold loans is included in the profit and loss account under “Interest income” on an effective interest rate basis.
16. Gold deposits
Gold deposits comprise unallocated sight and fixed-term deposits of gold from central banks.
Unallocated gold deposits provide customers with a general claim on the Bank for delivery of gold of the same weight and quality as that delivered by the customer to the Bank, but do not provide the right to specific gold bars. Unallocated gold deposits are included in the balance sheet on a trade date basis at their weight in gold (translated at the gold market price and USD exchange rate into SDR) plus accrued interest. Accrued interest on gold deposits is included in the profit and loss account under “Interest expense” on an effective interest rate basis.
Allocated (or “earmarked”) gold deposits provide depositors with a claim for delivery of the specific gold bars deposited by the customer with the Bank on a custody basis. Beneficial ownership and risk remain with the customer. As such, allocated gold deposit liabilities

144 BIS 82nd Annual Report
and the related gold bar assets are not included on the Bank’s balance sheet. They are disclosed as off-balance sheet items (see note 31).
17. Realised and unrealised gains or losses on gold
The treatment of realised and unrealised gains or losses on gold depends on the designation as described below:
A. Banking portfolios, comprising gold deposits and related gold banking assets
The Bank designates gold loans in its banking portfolios as loans and receivables and gold deposits as financial liabilities measured at amortised cost. The gold derivatives included in the portfolios are designated as held at fair value through profit and loss.
Gains or losses on these transactions in gold are included in the profit and loss account under “Net foreign exchange gain / (loss)” as net transaction gains or losses.
Gains or losses on the retranslation of the net position in gold in the banking portfolios are included under “Net foreign exchange gain / (loss)” as net translation gains or losses.
B. Investment portfolios, comprising gold investment assets
The Bank’s own holdings of gold are designated and accounted for as available for sale assets.
Unrealised gains or losses on the Bank’s gold investment assets over their deemed cost are taken to the gold revaluation account in equity, which is reported under the balance sheet heading “Other equity accounts”. The movement in fair value is included in the statement of comprehensive income under the heading “Unrealised gain on gold investment assets”.
For gold investment assets held on 31 March 2003 (when the Bank changed its functional and presentation currency from the gold franc to the SDR) the deemed cost is approximately SDR 151 per ounce, based on the value of USD 208 that was applied from 1979 to 2003 following a decision by the Bank’s Board of Directors, translated at the 31 March 2003 exchange rate.
Realised gains or losses on disposal of gold investment assets are included in the profit and loss account as “Net gain on sales of gold investment assets”.
18. Securities sold under repurchase agreements
Where these liabilities are associated with the management of currency assets held at fair value through profit and loss, they are designated as financial instruments held at fair value through profit and loss. Where these liabilities are associated with currency assets available for sale, they are designated as financial liabilities measured at amortised cost.
They are initially included in the balance sheet on a trade date basis at cost. The subsequent accrual of interest is included in the profit and loss account under “Interest expense” on an effective interest rate basis.
After trade date, those liabilities that are designated as held at fair value through profit and loss are revalued to fair value, with unrealised gains or losses included under “Net valuation movement”.
19. Derivatives
Derivatives are used either to manage the Bank’s market risk or for trading purposes. They are designated as financial instruments held at fair value through profit and loss.
Derivatives are initially included in the balance sheet on a trade date basis at cost. The subsequent accrual of interest and amortisation of premiums paid and discounts received are included in the profit and loss account under “Interest income” on an effective interest rate basis.
After trade date, derivatives are revalued to fair value, with all realised and unrealised movements in value included under “Net valuation movement”.
Derivatives are included as either assets or liabilities, depending on whether the contract has a positive or a negative fair value for the Bank.
Where a derivative contract is embedded within a host contract which is not accounted for as held at fair value through profit and loss, it is separated from the host contract for accounting purposes and treated as though it were a standalone derivative as described above.
20. Valuation policy
The Bank’s valuation policy has been approved by the Board of Directors. In this policy the Bank defines how financial instruments are designated, which determines their valuation basis and accounting treatment. This policy is supplemented with detailed valuation procedures.
The majority of the financial instruments on the balance sheet are included at fair value. The Bank defines the fair value of a financial instrument as the amount at which the instrument could be exchanged between knowledgeable, willing parties in an arm’s length transaction.

145BIS 82nd Annual Report
The use of fair values ensures that the financial reporting to the Board and shareholders reflects the way in which the banking business is managed and is consistent with the risk management and economic performance figures reported to Management.
The Bank considers published price quotations in active markets as the best evidence of fair value. Where no published price quotations exist, the Bank determines fair values using a valuation technique appropriate to the particular financial instrument. Such valuation techniques may involve using market prices of recent arm’s length market transactions in similar instruments or may make use of financial models. Where financial models are used, the Bank aims at making maximum use of observable market inputs (eg interest rates and volatilities) as appropriate, and relies as little as possible on its own estimates. Such valuation models comprise discounted cash flow analyses and option pricing models.
Where valuation techniques are used to determine fair values, the valuation models are subject to initial approval and periodic review in line with the requirements of the Bank’s model validation policy.
The Bank has an independent valuation control function which periodically reviews the value of its financial instruments, taking into account both the accuracy of the valuations and the valuation methodologies used. Other valuation controls include the review and analysis of daily profit and loss.
The Bank values its assets at the bid price and its liabilities at the offer price. Derivative financial instruments are valued on a bid-offer basis, with valuation reserves, where necessary, included in derivative financial liabilities. Financial assets and liabilities that are not valued at fair value are included in the balance sheet at amortised cost.
21. Impairment of financial assets
Financial assets, other than those designated as held at fair value through profit and loss, are assessed for indications of impairment at each balance sheet date. A financial asset is impaired when there is objective evidence that the estimated future cash flows of the asset have been reduced as a result of one or more events that occurred after the initial recognition of the asset. Evidence of impairment could include significant financial difficulty, default, or probable bankruptcy / financial reorganisation of the counterparty or issuer.
Impairment losses are recognised to the extent that a decline in fair value below amortised cost is considered other than temporary. Impairment of currency assets is included in the profit and loss account under “Net valuation movement”, with impairment of gold loans included under “Interest income”. If the amount of the impairment loss decreases in a subsequent period, the previously recognised impairment loss is reversed through profit and loss to the extent that the carrying amount of the investment does not exceed that which it would have been had the impairment not been recognised.
22. Accounts receivable and accounts payable
Accounts receivable and accounts payable are principally very short-term amounts relating to the settlement of financial transactions. They are initially recognised at fair value and subsequently included in the balance sheet at amortised cost.
23. Land, buildings and equipment
The cost of the Bank’s buildings and equipment is capitalised and depreciated on a straight line basis over the estimated useful lives of the assets concerned, as follows:
• Buildings – 50 years
• Building installations and machinery – 15 years
• Information technology equipment – up to 4 years
• Other equipment – 4 to 10 years
The Bank’s land is not depreciated. The Bank undertakes an annual review of impairment of land, buildings and equipment. Where the carrying amount of an asset is greater than its estimated recoverable amount, it is written down to that amount.
24. Provisions
Provisions are recognised when the Bank has a present legal or constructive obligation as a result of events arising before the balance sheet date and it is probable that economic resources will be required to settle the obligation, provided that a reliable estimate can be made of the amount of the obligation. Best estimates and assumptions are used when determining the amount to be recognised as a provision.
25. Post-employment benefit obligations
The Bank operates three post-employment benefit arrangements for staff pensions, Directors’ pensions, and health and accident insurance for current and former staff members. An independent actuarial valuation is performed annually for each arrangement.
A. Staff pensions
The Bank provides a final salary defined benefit pension arrangement for its staff, based on a fund without separate legal personality, out of which benefits are paid. The fund

146 BIS 82nd Annual Report
assets are administered by the Bank for the sole benefit of current and former members of staff who participate in the arrangement. The Bank remains ultimately liable for all benefits due under the arrangement.
The liability in respect of the staff pension fund is based on the present value of the defined benefit obligation at the balance sheet date, less the fair value of the fund assets at the balance sheet date, together with adjustments for unrecognised actuarial gains and losses and past service costs. The defined benefit obligation is calculated using the projected unit credit method. The present value of the defined benefit obligation is determined from the estimated future cash outflows. The rate used to discount the cash flows is determined by the Bank based on the market yield of highly rated corporate debt securities in Swiss francs which have terms to maturity approximating the terms of the related liability.
The amount charged to the profit and loss account represents the sum of the current service cost of the benefits accruing for the year under the scheme, and interest at the discount rate on the defined benefit obligation. In addition, actuarial gains and losses arising from experience adjustments (where the actual outcome is different from the actuarial assumptions previously made), changes in actuarial assumptions and amendments to the pension fund regulations are charged to the profit and loss account over the service period of staff concerned in accordance with the “corridor accounting” methodology described below. The resulting liabilities are included under the heading “Other liabilities” in the balance sheet.
B. Directors’ pensions
The Bank provides an unfunded defined benefit arrangement for Directors’ pensions. The liability, defined benefit obligation and amount charged to the profit and loss account in respect of the Directors’ pension arrangement are calculated on a similar basis to that used for the staff pension fund.
C. Post-employment health and accident benefits
The Bank provides an unfunded post-employment health and accident benefit arrangement for its staff. The liability, benefit obligation and amount charged to the profit and loss account in respect of the health and accident benefit arrangement are calculated on a similar basis to that used for the staff pension fund.
D. Corridor accounting
Actuarial gains or losses arise from experience adjustments (where the actual outcome is different from the actuarial assumptions previously made), changes in actuarial assumptions and amendments to the pension fund regulations. Where the cumulative unrecognised actuarial gains or losses exceed the higher of the benefit obligation or any assets used to fund the obligation by more than a corridor of 10%, the resulting excess outside
the corridor is amortised over the expected remaining service period of the staff concerned.
26. Cash flow statement
The Bank’s cash flow statement is prepared using an indirect method. It is based on the movements in the Bank’s balance sheet, adjusted for changes in financial transactions awaiting settlement.
Cash and cash equivalents consist of cash and sight and notice accounts with banks, which are very short-term financial assets that typically have notice periods of three days or less.

147BIS 82nd Annual Report
Notes to the financial statements
1. Introduction
The Bank for International Settlements (BIS, “the Bank”) is an international financial institution which was established pursuant to the Hague Agreements of 20 January 1930, the Bank’s Constituent Charter and its Statutes. The headquarters of the Bank are at Centralbahnplatz 2, 4002 Basel, Switzerland. The Bank maintains representative offices in Hong Kong, Special Administrative Region of the People’s Republic of China (for Asia and the Pacific) and in Mexico City, Mexico (for the Americas).
The objectives of the BIS, as laid down in Article 3 of its Statutes, are to promote cooperation among central banks, to provide additional facilities for international financial operations and to act as trustee or agent for international financial settlements. Sixty central banks are currently members of the Bank. Rights of representation and voting at General Meetings are exercised in proportion to the number of BIS shares issued in the respective countries. The Board of Directors of the BIS is composed of the Governors and appointed Directors from the Bank’s founding central banks, being those of Belgium, France, Germany, Italy, the United Kingdom and the United States of America, as well as the Governors of the central banks of Canada, China, Japan, Mexico, the Netherlands and Sweden, and the President of the European Central Bank.
2. Use of estimates
The preparation of the financial statements requires the Bank’s Management to make some estimates in arriving at the reported amounts of assets and liabilities and disclosure of contingent assets and liabilities at the date of the financial statements, and the reported amounts of income and expenses during the financial year. To arrive at these estimates, Management uses available information, makes assumptions and exercises judgment.
Assumptions include forward-looking estimates, for example relating to the valuation of assets and liabilities, the assessment of post-employment benefit obligations and the assessment of provisions and contingent liabilities.
Judgment is exercised when selecting and applying the Bank’s accounting policies. The judgments relating to the designation and valuation of financial instruments are another key element in the preparation of these financial statements. In particular, the valuation of derivative financial instruments involves a significant amount of judgment over the discount curve to be used and the adjustments necessary to allow for credit risk and collateral.
Subsequent actual results could differ materially from those estimates.
A. The valuation of financial assets and liabilities
There is no active secondary market for certain of the Bank’s financial assets and financial liabilities. Such assets and liabilities are valued using valuation techniques which require judgment to determine appropriate valuation parameters. Changes in assumptions about these parameters could materially affect the reported fair values. The valuation impact of a 1 basis point change in spread assumptions is shown in the table below:
For the financial year ended 31 March
SDR millions 2012 2011
Treasury bills 0.1 0.2
Securities purchased under resale agreements 0.1 0.3
Loans and advances 0.2 0.5
Government and other securities 11.3 10.2
Currency deposits 13.5 14.3
Derivative financial instruments 4.1 4.3

148 BIS 82nd Annual Report
B. Impairment provision on financial assets
The Bank conducts an annual review for impairment at the date of each balance sheet. At 31 March 2012 the Bank did not have any financial assets that were considered to be impaired (31 March 2011: SDR 29.0 million).
C. Actuarial assumptions
The valuation of the Bank’s pension fund and health care arrangements relies on actuarial assumptions which include expectations of inflation, interest rates, medical cost inflation and retirement age and life expectancy of participants. Changes to these assumptions have an impact on the valuation of the Bank’s pension fund liabilities and the amounts recognised in the financial statements.
3. Cash and sight accounts with banks
Cash and sight accounts with banks consist of cash balances with central banks and commercial banks that are available to the Bank on demand.
4. Gold and gold loans
A. Total gold holdings
The composition of the Bank’s total gold holdings was as follows:
As at 31 March
SDR millions 2012 2011
Gold 34,831.9 35,401.7
Gold loans 1,080.8 1,235.5
Total gold and gold loan assets 35,912.7 36,637.2
Comprising:
Gold investment assets 4,018.2 3,451.2
Gold and gold loan banking assets 31,894.5 33,186.0
Included in “Gold” is SDR 12,262.8 million (355 tonnes) of gold (2011: SDR 11,940.5 million; 409 tonnes) that the Bank holds in connection with its gold swap contracts. Under such contracts the Bank exchanges currencies for physical gold, and has an obligation to return the gold at the end of the contract. See note 7 for more details on gold swap transactions.
B. Gold investment assets
The Bank’s gold investment assets are included in the balance sheet at their weight in gold (translated at the gold market price and USD exchange rate into SDR) plus accrued interest. The excess of this value over the deemed cost value is included in the gold revaluation account, which is reported under the balance sheet heading “Other equity accounts”; the movement in this value is included in the statement of comprehensive income under the heading “Unrealised gain on gold investment assets”. Realised gains or losses on the disposal of gold investment assets are recognised in the profit and loss account under the heading “Net gain on sales of gold investment assets”.

149BIS 82nd Annual Report
Note 17B provides further analysis of the gold revaluation account. Note 26 provides further analysis of the net gain on sales of gold investment assets.
The table below analyses the movements in the Bank’s gold investment assets:
For the financial year ended 31 March
SDR millions 2012 2011
Balance at beginning of year 3,451.2 2,811.2
Net change in gold investment assets
Disposals of gold (93.3) (26.7)
Maturities, sight account and other net movements (4.9) (5.5)
Release of impairment provision 34.7 –
(63.5) (32.2)
Gold price movement 630.5 672.2
Balance at end of year 4,018.2 3,451.2
At 31 March 2011 the Bank’s gold and gold loans included an impairment provision of SDR 29.0 million. This provision was released when the related gold loans were repaid in full during the financial year ended 31 March 2012. The gain of SDR 5.7 million between 31 March 2011 and the release date was due to changes in gold prices and exchange rates.
At 31 March 2012 the Bank’s gold investment assets amounted to 116 tonnes of fine gold (2011: 119 tonnes).
5. Currency assets
A. Total holdings
Currency assets comprise treasury bills, securities purchased under resale agreements, fixed-term loans and advances, and government and other securities.
Currency assets held at fair value through profit and loss comprise those currency banking assets that represent the reinvestment of currency deposit liabilities along with currency investment assets that are part of more actively traded portfolios. The remaining part of the Bank’s currency investment assets are categorised as available for sale and, together with the gold investment assets, largely represent the investment of the Bank’s equity.
Treasury bills are short-term debt securities issued by governments on a discount basis.
Securities purchased under resale agreements (“reverse repurchase agreements”) are usually short-term transactions under which the Bank makes a fixed-term loan to a counterparty which provides collateral in the form of securities. The rate on the loan is fixed at the beginning of the transaction, and there is an irrevocable commitment to return the equivalent securities subject to the repayment of the loan. During the term of the agreement the Bank monitors the fair value of the collateral securities and may call for additional collateral or be required to return collateral based on the movement in its market value.
Fixed-term loans are primarily investments made with commercial banks. Also included in this category are investments made with central banks, international institutions and other public sector organisations. This includes advances made as part of committed and uncommitted standby facilities. These loans are recognised in the balance sheet total “Loans and advances”, which also includes notice accounts (see note 6).
Government and other securities are debt securities issued by governments, international institutions, other public sector institutions, commercial banks and corporates. They include commercial paper, certificates of deposit, fixed and floating rate bonds, covered bonds and asset-backed securities.
The tables below analyse the Bank’s holdings of currency assets:

150 BIS 82nd Annual Report
As at 31 March 2012 Banking assets
Investment assets Total currency assets
SDR millions
Held at fair value through profit and loss
Available for sale
Held at fair value through profit and loss
Total
Treasury bills 53,338.3 – 154.0 154.0 53,492.3
Securities purchased under resale agreements 46,210.8 – – – 46,210.8
Fixed-term loans and advances 22,570.5 – – – 22,570.5
Government and other securities
Government 35,885.9 13,181.9 130.9 13,312.8 49,198.7
Financial institutions 15,790.4 201.9 – 201.9 15,992.3
Other 12,099.9 94.8 492.0 586.8 12,686.7
63,776.2 13,478.6 622.9 14,101.5 77,877.7
Total currency assets 185,895.8 13,478.6 776.9 14,255.5 200,151.3
As at 31 March 2011 Banking assets
Investment assets Total currency assets
SDR millions
Held at fair value through profit and loss
Available for sale
Held at fair value through profit and loss
Total
Treasury bills 76,739.3 – 192.8 192.8 76,932.1
Securities purchased under resale agreements 51,464.0 – – – 51,464.0
Fixed-term loans and advances 23,918.2 – – – 23,918.2
Government and other securities
Government 11,498.1 11,083.5 – 11,083.5 22,581.6
Financial institutions 18,933.2 226.9 601.6 828.5 19,761.7
Other 13,808.6 836.0 – 836.0 14,644.6
44,239.9 12,146.4 601.6 12,748.0 56,987.9
Total currency assets 196,361.4 12,146.4 794.4 12,940.8 209,302.2

151BIS 82nd Annual Report
B. Currency investment assets available for sale
The Bank’s currency investment assets relate principally to the investment of its equity. They are designated as available for sale unless they are part of an actively traded portfolio.
The table below analyses the movements in the Bank’s currency investment assets available for sale:
For the financial year ended 31 March
SDR millions 2012 2011
Balance at beginning of year 12,146.4 11,556.2
Net change in currency investment assets available for sale
Additions 4,086.5 5,299.8
Disposals (2,132.0) (2,996.5)
Other net movements (1,031.5) (1,473.5)
923.0 829.8
Net change in transactions awaiting settlement 88.0 (98.0)
Fair value and other movements 321.2 (141.6)
Balance at end of year 13,478.6 12,146.4
6. Loans and advances
Loans and advances comprise fixed-term loans to commercial banks, advances and notice accounts. Advances relate to committed and uncommitted standby facilities which the Bank provides for its customers. Notice accounts are very short-term financial assets, typically having a notice period of three days or less.
Fixed-term loans and advances are designated as held at fair value through profit and loss. Notice accounts are designated as loans and receivables and are included in the balance sheet at amortised cost.
As at 31 March
SDR millions 2012 2011
Fixed-term loans and advances 22,570.5 23,918.2
Notice accounts 186.6 252.2
Total loans and advances 22,757.1 24,170.4
The amount of the change in fair value recognised in the profit and loss account on fixed-term loans and advances is SDR –1.7 million (2011: SDR 12.3 million).
7. Derivative financial instruments
The Bank uses the following types of derivative instruments for economic hedging and trading purposes.
Interest rate and bond futures are contractual agreements to receive or pay a net amount based on changes in interest rates or bond prices on a future date. Futures contracts are settled daily with the exchange. Associated margin payments are settled by cash or marketable securities.
Currency and gold options are contractual agreements under which the seller grants the purchaser the right, but not the obligation, to either buy (call option) or sell (put option), by or on a set date, a specific amount of a currency or gold at a predetermined price. In consideration, the seller receives a premium from the purchaser.

152 BIS 82nd Annual Report
Currency and gold swaps, cross-currency interest rate swaps and interest rate swaps are bilateral contractual agreements to exchange cash flows related to currencies, gold or interest rates (for example, fixed rate for floating rate). Cross-currency interest rate swaps involve the exchange of cash flows related to a combination of interest rates and foreign exchange rates. Except for certain currency and gold swaps and cross-currency interest rate swaps, no exchange of principal takes place.
Currency and gold forwards are bilateral contractual agreements involving the exchange of foreign currencies or gold at a future date. This includes undelivered spot transactions.
Forward rate agreements are bilateral interest rate forward contracts that result in cash settlement at a future date for the difference between a contracted rate of interest and the prevailing market rate.
Swaptions are bilateral options under which the seller grants the purchaser the right, but not the obligation, to enter into a currency or interest rate swap at a predetermined price by or on a set date. In consideration, the seller receives a premium from the purchaser.
In addition, the Bank sells products to its customers which contain embedded derivatives (see note 10). Where the host contract is not accounted for as held at fair value, embedded derivatives are separated from the host contract for accounting purposes and treated as though they are regular derivatives. As such, the gold currency options embedded in gold dual currency deposits are included within derivatives as currency and gold options.
The table below analyses the fair value of derivative financial instruments:
As at 31 March 2012 2011
SDR millions
Notional amounts
Fair values Notional amounts
Fair values
Assets Liabilities Assets Liabilities
Bond futures 1,023.8 0.2 (0.2) 1,095.0 0.5 (0.4)
Cross-currency interest rate swaps 1,456.3 0.1 (275.4) 1,597.0 4.8 (314.8)
Currency and gold forwards 950.2 7.0 (2.6) 2,747.7 13.6 (25.2)
Currency and gold options 115.2 – (0.2) 3,430.0 43.7 (43.8)
Currency and gold swaps 116,556.3 2,381.9 (945.0) 128,060.9 766.9 (3,711.9)
Forward rate agreements 15,881.2 4.1 (4.0) 18,945.7 6.3 (5.1)
Interest rate futures 4,722.1 0.1 – 7,559.2 0.1 –
Interest rate swaps 304,954.9 4,910.5 (3,496.6) 304,357.4 4,954.4 (2,853.3)
Swaptions 1,446.9 – (3.0) 773.4 – (5.0)
Total derivative financial instruments at end of year 447,106.9 7,303.9 (4,727.0) 468,566.3 5,790.3 (6,959.5)
Net derivative financial instruments at end of year
2,576.9 (1,169.2)
8. Accounts receivable
As at 31 March
SDR millions 2012 2011
Financial transactions awaiting settlement 7,833.2 8,606.0
Other assets 12.3 10.3
Total accounts receivable 7,845.5 8,616.3
“Financial transactions awaiting settlement” relates to short-term receivables (typically due in three days or less) where transactions have been effected but cash has not yet been transferred. This includes assets that have been sold and liabilities that have been issued.

153BIS 82nd Annual Report
9. Land, buildings and equipment
For the financial year ended 31 March 2012 2011
SDR millionsLand Buildings IT and other
equipmentTotal Total
Historical cost
Balance at beginning of year 41.2 250.2 92.9 384.3 373.7
Capital expenditure – 7.5 11.4 18.9 15.1
Disposals and retirements – – (1.6) (1.6) (4.5)
Balance at end of year 41.2 257.7 102.7 401.6 384.3
Depreciation
Balance at beginning of year – 123.0 70.5 193.5 183.8
Depreciation – 7.7 9.0 16.7 14.2
Disposals and retirements – – (1.6) (1.6) (4.5)
Balance at end of year – 130.7 77.9 208.6 193.5
Net book value at end of year 41.2 127.0 24.8 193.0 190.8
The depreciation charge for the financial year ended 31 March 2012 includes an additional charge of SDR 1.6 million for IT and other equipment following an impairment review (2011: SDR 1.0 million).

154 BIS 82nd Annual Report
10. Currency deposits
Currency deposits are book entry claims on the Bank. The currency deposit instruments are analysed in the table below:
As at 31 March
SDR millions 2012 2011
Deposit instruments repayable at one to two days’ notice
Medium-Term Instruments (MTIs) 57,867.3 54,453.9
Callable MTIs 2,016.5 1,556.7
Fixed Rate Investments of the BIS (FIXBIS) 43,507.5 42,751.3
103,391.3 98,761.9
Other currency deposits
Floating Rate Investments of the BIS (FRIBIS) 731.8 962.8
Fixed-term deposits 66,560.0 89,550.9
Dual Currency Deposits (DCDs) 119.9 85.7
Sight and notice deposit accounts 24,975.5 17,724.3
92,387.2 108,323.7
Total currency deposits 195,778.5 207,085.6
Comprising:
Designated as held at fair value through profit and loss 170,803.1 189,361.3
Designated as financial liabilities measured at amortised cost 24,975.4 17,724.3
Medium-Term Instruments (MTIs) are fixed rate investments at the BIS for quarterly maturities of up to 10 years.
Callable MTIs are MTIs that are callable at the option of the Bank at an exercise price of par, with call dates between September 2012 and March 2013 (2011: June 2011 and December 2011). The balance sheet total for callable MTIs includes the fair value of the embedded interest rate option.
FIXBIS are fixed rate investments at the Bank for any maturities between one week and one year.
FRIBIS are floating rate investments at the Bank with maturities of one year or longer for which the interest rate is reset in line with prevailing market conditions.
Fixed-term deposits are fixed rate investments at the BIS, typically with a maturity of less than one year.
Dual Currency Deposits (DCDs) are fixed-term deposits that are repayable on the maturity date either in the original currency or at a fixed amount in a different currency at the option of the Bank. The balance sheet total for DCDs includes the fair value of the embedded foreign exchange option. These deposits all mature in April 2012 or May 2012 (2011: in April 2011 or May 2011).
Sight and notice deposit accounts are very short-term financial liabilities, typically having a notice period of three days or less. They are designated as financial liabilities measured at amortised cost.
The Bank acts as the sole market-maker in certain of its currency deposit liabilities and has undertaken to repay some of these financial instruments at fair value, in whole or in part, at one to two business days’ notice.
A. Valuation of currency deposits
Currency deposits (other than sight and notice deposit accounts) are included in the balance sheet at fair value. This value differs from the amount that the Bank is contractually obliged to pay at maturity to the holder of the deposit. The amount the Bank is contractually obliged to pay at maturity in respect of its total currency deposits (including accrued interest to 31 March 2012) is SDR 194,313.6 million (2011: SDR 206,432.4 million).
The Bank uses valuation techniques to estimate the fair value of its currency deposits. These valuation techniques comprise discounted cash flow models and option pricing models. The discounted cash flow models value the expected cash flows of financial instruments using discount factors that are partly derived from quoted interest rates (eg Libor and swap rates) and partly based on assumptions about spreads at which each product is offered to and repurchased from customers.

155BIS 82nd Annual Report
The spread assumptions are based on recent market transactions in each product. Where the product series has been closed to new investors (and thus there are no recent market transactions) the Bank uses the latest quoted spread for the series as the basis for determining the appropriate model inputs.
The option pricing models include assumptions about volatilities that are derived from market quotes.
B. Impact of changes in the Bank’s creditworthiness
The fair value of the Bank’s liabilities would be affected by any change in its creditworthiness. If the Bank’s creditworthiness deteriorated, the value of its liabilities would decrease, and the change in value would be reflected as a valuation movement in the profit and loss account. The Bank regularly assesses its creditworthiness as part of its risk management processes. The Bank’s assessment of its creditworthiness did not indicate a change which could have had an impact on the fair value of the Bank’s liabilities during the period under review.
11. Gold deposits
Gold deposits placed with the Bank originate entirely from central banks. They are all designated as financial liabilities measured at amortised cost.
12. Accounts payable
Accounts payable consist of financial transactions awaiting settlement, relating to short-term payables (typically payable within three days or less) where transactions have been effected but cash has not yet been transferred. This includes assets that have been purchased and liabilities that have been repurchased.
13. Other liabilities
The Bank’s other liabilities consist of:
As at 31 March
SDR millions 2012 2011
Post-employment benefit obligations (see note 18)
Staff pensions 30.0 22.7
Directors’ pensions 6.4 5.9
Health and accident benefits 287.0 258.3
Short positions in currency assets 69.7 65.7
Payable to former shareholders 0.6 0.6
Other 22.8 22.2
Total other liabilities 416.5 375.4

156 BIS 82nd Annual Report
14. Share capital
The Bank’s share capital consists of:
As at 31 March
SDR millions 2012 2011
Authorised capital: 600,000 shares, each of SDR 5,000 par value, of which SDR 1,250 is paid up 3,000.0 3,000.0
Issued capital: 559,125 shares (2011: 547,125) 2,795.6 2,735.6
Paid-up capital (25%) 698.9 683.9
During the financial year ended 31 March 2012 the Bank issued 3,000 shares each to the Bank of the Republic (Colombia), the Central Bank of Luxembourg, the Central Reserve Bank of Peru and the Central Bank of the United Arab Emirates. This increased the number of member central banks to 60 (31 March 2011: 56).
The number of shares eligible for dividend is:
As at 31 March 2012 2011
Issued shares 559,125 547,125
Less: shares held in treasury (1,000) (1,000)
Outstanding shares eligible for dividend 558,125 546,125
Of which:
Eligible for full dividend 546,125 546,125
New shares eligible for dividend pro rata from the value date of subscription 12,000 –
15. Statutory reserves
The Bank’s Statutes provide for application of the Bank’s annual net profit by the Annual General Meeting on the proposal of the Board of Directors to three specific reserve funds: the legal reserve fund, the general reserve fund and the special dividend reserve fund; the remainder of the net profit after payment of any dividend is generally allocated to the free reserve fund.
Legal reserve fund. This fund is currently fully funded at 10% of the Bank’s paid-up capital.
General reserve fund. After payment of any dividend, 5% of the remainder of the Bank’s annual net profit currently must be allocated to the general reserve fund.
Special dividend reserve fund. A portion of the remainder of the annual net profit may be allocated to the special dividend reserve fund, which shall be available, in case of need, for paying the whole or any part of a declared dividend. Dividends are normally paid out of the Bank’s net profit.
Free reserve fund. After the above allocations have been made, any remaining unallocated net profit is generally transferred to the free reserve fund.
Receipts from the subscription of the Bank’s shares are allocated to the legal reserve fund as necessary to keep it fully funded, with the remainder being credited to the general reserve fund.
The free reserve fund, general reserve fund and legal reserve fund are available, in that order, to meet any losses incurred by the Bank. In the event of liquidation of the Bank, the balances of the reserve funds (after the discharge of the liabilities of the Bank and the costs of liquidation) would be divided among the Bank’s shareholders.

157BIS 82nd Annual Report
16. Shares held in treasury
For the financial year ended 31 March 2012 2011
Number of shares at beginning of year 1,000 1,000
Movements during the year – –
Number of shares at end of year 1,000 1,000
The shares held in treasury consist of 1,000 shares of the Albanian issue which were suspended in 1977.
17. Other equity accounts
Other equity accounts represent the revaluation accounts of the currency assets available for sale and gold investment assets, which are further described in notes 4 and 5.
Other equity accounts comprise:
As at 31 March
SDR millions 2012 2011
Securities revaluation account 417.8 121.3
Gold revaluation account 3,448.2 2,896.4
Total other equity accounts 3,866.0 3,017.7
A. Securities revaluation account
This account contains the difference between the fair value and the amortised cost of the Bank’s currency assets available for sale.
The movements in the securities revaluation account were as follows:
For the financial year ended 31 March
SDR millions 2012 2011
Balance at beginning of year 121.3 318.6
Net valuation movement
Net gain on sales (24.7) (55.7)
Fair value and other movements 321.2 (141.6)
296.5 (197.3)
Balance at end of year 417.8 121.3

158 BIS 82nd Annual Report
The table below analyses the balance in the securities revaluation account, which relates to government and other securities:
SDR millions
Fair value of assets
Historical cost Securities revaluation
account
Gross gains Gross losses
As at 31 March 2012 13,478.6 13,060.8 417.8 422.7 (4.9)
As at 31 March 2011 12,146.4 12,025.1 121.3 190.4 (69.1)
B. Gold revaluation account
This account contains the difference between the book value and the deemed cost of the Bank’s gold investment assets. For gold investment assets held on 31 March 2003 (when the Bank changed its functional and presentation currency from the gold franc to the SDR) the deemed cost is approximately SDR 151 per ounce, based on the value of USD 208 that was applied from 1979 to 2003 in accordance with a decision by the Bank’s Board of Directors, translated at the 31 March 2003 exchange rate.
The movements in the gold revaluation account were as follows:
For the financial year ended 31 March
SDR millions 2012 2011
Balance at beginning of year 2,896.4 2,246.0
Net valuation movement
Net gain on sales (78.7) (21.8)
Gold price movement 630.5 672.2
551.8 650.4
Balance at end of year 3,448.2 2,896.4

159BIS 82nd Annual Report
18. Post-employment benefit obligations
The Bank operates three post-employment arrangements:
1. A final salary defined benefit pension arrangement for its staff. The pension arrangement is based on a fund without separate legal personality, out of which benefits are paid. The fund assets are administered by the Bank for the sole benefit of current and former members of staff who participate in the arrangement. The Bank remains ultimately liable for all benefits due under the arrangement.
2. An unfunded defined benefit arrangement for its Directors, whose entitlement is based on a minimum service period of four years.
3. An unfunded post-employment health and accident benefit arrangement for its staff. Entitlement to this arrangement is based in principle on the employee remaining in service up to 50 years of age and the completion of a minimum service period of 10 years.
All arrangements are valued annually by independent actuaries.
A. Amounts recognised in the balance sheet
As at 31 March Staff pensions
SDR millions 2012 2011 2010 2009 2008
Present value of obligation (1,264.5) (1,039.1) (913.1) (747.4) (709.7)
Fair value of fund assets 929.2 881.9 762.4 619.6 714.3
Funded status (335.3) (157.2) (150.7) (127.8) 4.6
Unrecognised actuarial losses 305.3 134.5 138.6 125.4 41.2
Unrecognised past service cost – – – – (45.8)
Liability at end of year (30.0) (22.7) (12.1) (2.4) –
As at 31 March Directors’ pensions
SDR millions 2012 2011 2010 2009 2008
Present value of obligation (8.6) (7.2) (6.5) (5.7) (5.4)
Fair value of fund assets – – – – –
Funded status (8.6) (7.2) (6.5) (5.7) (5.4)
Unrecognised actuarial losses 2.2 1.3 1.3 0.9 0.6
Unrecognised past service cost – – – – –
Liability at end of year (6.4) (5.9) (5.2) (4.8) (4.8)
As at 31 March Post-employment health and accident benefits
SDR millions 2012 2011 2010 2009 2008
Present value of obligation (434.3) (316.7) (284.2) (225.4) (208.0)
Fair value of fund assets – – – – –
Funded status (434.3) (316.7) (284.2) (225.4) (208.0)
Unrecognised actuarial losses 151.2 63.3 72.3 40.1 30.3
Unrecognised past service cost (3.9) (4.9) (5.6) (6.3) (7.7)
Liability at end of year (287.0) (258.3) (217.5) (191.6) (185.4)

160 BIS 82nd Annual Report
B. Present value of defined benefit obligation
The reconciliation of the opening and closing amounts of the present value of the benefit obligation is as follows:
As at 31 March Staff pensions Directors’ pensions Post-employment health and accident benefits
SDR millions 2012 2011 2010 2012 2011 2010 2012 2011 2010
Present value of obligation at beginning of year 1,039.1 913.1 747.4 7.2 6.5 5.7 316.7 284.2 225.4
Current service cost 45.6 40.1 32.0 0.4 0.3 0.2 11.3 9.4 8.5
Employee contributions 6.0 5.2 4.5 – – – – – –
Interest cost 29.5 25.6 24.5 0.2 0.2 0.2 9.0 8.1 7.5
Actuarial loss / (gain) 146.8 (11.8) 84.3 1.0 – – 88.9 (11.9) 30.2
Benefit payments (40.0) (29.0) (28.3) (0.4) (0.4) (0.3) (2.6) (2.5) (2.2)
Exchange differences 37.5 95.9 48.7 0.3 0.6 0.7 11.0 29.4 14.8
Present value of obligation at end of year 1,264.5 1,039.1 913.1 8.7 7.2 6.5 434.3 316.7 284.2
C. Fair value of fund assets for staff pensions
The reconciliation of the opening and closing amounts of the fair value of fund assets for the staff pension arrangement is as follows:
For the financial year ended 31 March
SDR millions 2012 2011 2010
Fair value of fund assets at beginning of year 881.9 762.4 619.6
Expected return on fund assets 46.2 39.4 31.8
Actuarial gain / (loss) (23.9) 0.9 74.4
Employer contributions 25.7 22.0 20.0
Employee contributions 6.0 5.2 4.5
Benefit payments (40.0) (29.0) (28.3)
Exchange differences 33.3 81.0 40.4
Fair value of fund assets at end of year 929.2 881.9 762.4

161BIS 82nd Annual Report
D. Amounts recognised in the profit and loss account
For the financial yearended 31 March
Staff pensions Directors’ pensions Post-employment health and accident benefits
SDR millions 2012 2011 2010 2012 2011 2010 2012 2011 2010
Current service cost 45.6 40.1 32.0 0.4 0.3 0.2 11.3 9.4 8.5
Interest cost 29.5 25.6 24.5 0.2 0.2 0.2 9.0 8.1 7.5
Less: expected return on fund assets
(46.2) (39.4) (31.8) – – – – – –
Less: past service cost – – – – – – (1.3) (1.2) (1.1)
Net actuarial losses recognised in year
2.9 4.2 4.4 0.1 0.1 0.1 2.9 3.5 1.4
Total included in operating expense 31.8 30.5 29.1 0.7 0.6 0.5 21.9 19.8 16.3
The Bank expects to make a contribution to its post-employment arrangements of SDR 28.8 million in 2012/13.
E. Major categories of fund assets as a percentage of total fund assets
As at 31 March
Percentages 2012 2011
European equities 12.7 14.6
Other equities 30.4 32.0
European fixed income 28.8 16.3
Other fixed income 22.3 30.1
Other assets 5.8 7.0
Actual return on fund assets 2.4% 4.9%
The staff pension fund does not invest in financial instruments issued by the Bank.

162 BIS 82nd Annual Report
F. Principal actuarial assumptions used in these financial statements
As at 31 March 2012 2011
Applicable to all three post-employment benefit arrangements
Discount rate – market rate of highly rated Swiss corporate bonds 2.00% 2.75%
Applicable to staff and Directors’ pension arrangements
Assumed increase in pensions payable 1.50% 1.50%
Applicable to staff pension arrangement only
Expected return on fund assets 5.00% 5.00%
Assumed salary increase rate 4.10% 4.10%
Applicable to Directors’ pension arrangement only
Assumed Directors’ pensionable remuneration increase rate 1.50% 1.50%
Applicable to post-employment health and accident benefit arrangement only
Long-term medical cost inflation assumption 5.00% 5.00%
The assumed increases in staff salaries, Directors’ pensionable remuneration and pensions payable incorporate an inflation assumption of 1.5% at 31 March 2012 (2011: 1.5%).
The expected rate of return on fund assets is based on long-term expectations for inflation, interest rates, risk premia and asset allocations. The estimate takes into consideration historical returns and is determined in conjunction with the fund’s independent actuaries.
The assumption for medical inflation has a significant effect on the amounts recognised in the profit and loss account. A 1% change in the assumption for medical inflation compared to that used for the 2011/12 calculation would have the following effects:
For the financial year ended 31 March
SDR millions 2012 2011
Increase / (decrease) of the total service and interest cost
6% medical inflation 7.7 5.6
4% medical inflation (5.4) (4.1)
As at 31 March
SDR millions 2012 2011
Increase / (decrease) of the benefit obligation
6% medical inflation 104.0 70.6
4% medical inflation (77.6) (53.6)

163BIS 82nd Annual Report
19. Interest income
For the financial year ended 31 March
SDR millions 2012 2011
Currency assets available for sale
Government and other securities 288.9 299.9
288.9 299.9
Currency assets held at fair value through profit and loss
Treasury bills 304.6 335.6
Securities purchased under resale agreements 235.8 188.3
Loans and advances 209.0 123.9
Government and other securities 862.9 838.7
1,612.3 1,486.5
Assets designated as loans and receivables
Sight and notice accounts 2.2 2.8
Gold investment assets 1.0 1.2
Gold banking assets 1.6 2.2
Release of impairment provision on repayment in full of related gold banking assets
34.7 –
39.5 6.2
Derivative financial instruments held at fair value through profit and loss 1,150.5 1,531.8
Total interest income 3,091.2 3,324.4
20. Interest expense
For the financial year ended 31 March
SDR millions 2012 2011
Liabilities held at fair value through profit and loss
Currency deposits 1,564.8 1,811.0
Liabilities designated as financial liabilities measured at amortised cost
Sight and notice deposit accounts 67.3 46.6
Gold deposits 1.0 1.4
68.3 48.0
Total interest expense 1,633.1 1,859.0

164 BIS 82nd Annual Report
21. Net valuation movement
The net valuation movement arises entirely on financial instruments designated as held at fair value through profit and loss. Included in the table is a credit loss of SDR 31.9 million (2011: nil) relating to a sovereign debt restructuring.
For the financial year ended 31 March
SDR millions 2012 2011
Currency assets held at fair value through profit and loss
Unrealised valuation movements on currency assets 530.1 (473.7)
Realised gains on currency assets 52.9 108.5
583.0 (365.2)
Currency liabilities held at fair value through profit and loss
Unrealised valuation movements on financial liabilities (258.0) 646.4
Realised losses on financial liabilities (185.1) (292.4)
(443.1) 354.0
Valuation movements on derivative financial instruments (730.2) (498.0)
Net valuation movement (590.3) (509.2)
22. Net fee and commission income
For the financial year ended 31 March
SDR millions 2012 2011
Fee and commission income 14.5 12.1
Fee and commission expense (9.8) (9.0)
Net fee and commission income 4.7 3.1
23. Net foreign exchange gain / (loss)
For the financial year ended 31 March
SDR millions 2012 2011
Net transaction gain 14.4 21.5
Net translation loss (4.7) (37.3)
Net foreign exchange gain / (loss) 9.7 (15.8)

165BIS 82nd Annual Report
24. Operating expense
The following table analyses the Bank’s operating expense in Swiss francs (CHF), the currency in which most expenditure is incurred:
For the financial year ended 31 March
CHF millions 2012 2011
Board of Directors
Directors’ fees 1.9 2.2
Pensions to former Directors 0.9 0.6
Travel, external Board meetings and other costs 1.2 1.2
4.0 4.0
Management and staff
Remuneration 122.2 120.4
Pensions 46.2 50.8
Other personnel-related expense 48.1 48.3
216.5 219.5
Office and other expense 70.0 71.3
Administrative expense in CHF millions 290.5 294.8
Administrative expense in SDR millions 210.0 190.8
Depreciation in SDR millions 16.7 14.2
Operating expense in SDR millions 226.7 205.0
The average number of full-time equivalent employees during the financial year ended 31 March 2012 was 554 (2011: 547).
25. Net gain on sales of securities available for sale
For the financial year ended 31 March
SDR millions 2012 2011
Disposal proceeds 2,132.0 3,038.7
Amortised cost (2,107.3) (2,983.0)
Net gain on sales of securities available for sale 24.7 55.7
Comprising:
Gross realised gains 39.5 69.9
Gross realised losses (14.8) (14.2)

166 BIS 82nd Annual Report
26. Net gain on sales of gold investment assets
For the financial year ended 31 March
SDR millions 2012 2011
Disposal proceeds 93.2 26.7
Deemed cost (see note 17B) (14.5) (4.9)
Net gain on sales of gold investment assets 78.7 21.8
27. Earnings and dividends per share
For the financial year ended 31 March 2012 2011
Net profit for the financial year (SDR millions) 758.9 816.0
Weighted average number of shares entitled to dividend 552,076 546,125
Basic and diluted earnings per share (SDR per share) 1,374.6 1,494.2
Dividends per share (SDR per share)
Normal 305 295
The Bank’s dividend policy incorporates two elements: a normal sustainable dividend that is intended to change in a predictable manner from year to year, and a supplementary dividend that is appropriate when profits are high and the Bank’s capital requirements are met. Only a normal dividend will be paid this financial year.
28. Cash and cash equivalents
The cash and cash equivalents in the cash flow statement comprise:
As at 31 March
SDR millions 2012 2011
Cash and sight accounts with banks 4,077.8 329.8
Notice accounts 186.6 252.2
Total cash and cash equivalents 4,264.4 582.0
29. Taxes
The Bank’s special legal status in Switzerland is set out principally in its Headquarters Agreement with the Swiss Federal Council. Under the terms of this document the Bank is exempted from virtually all direct and indirect taxes at both federal and local government level in Switzerland.
Similar agreements exist with the government of the People’s Republic of China for the Asian Office in Hong Kong SAR and with the Mexican government for the Americas Office.

167BIS 82nd Annual Report
30. Exchange rates
The following table shows the principal rates and prices used to translate balances in foreign currency and gold into SDR:
Spot rate as at 31 March Average rate for the financial year
2012 2011 2012 2011
USD 0.646 0.631 0.636 0.654
EUR 0.861 0.895 0.875 0.864
JPY 0.00784 0.00762 0.00806 0.00764
GBP 1.033 1.013 1.015 1.016
CHF 0.715 0.689 0.723 0.647
Gold (in ounces) 1,074.7 907.5 1,046.3 844.9
31. Off-balance sheet items
Fiduciary transactions are effected in the Bank’s name on behalf of, and at the risk of, the Bank’s customers without recourse to the other assets of the Bank. They are not included in the Bank’s balance sheet and comprise:
As at 31 March
SDR millions 2012 2011
Safe custody arrangements 11,167.9 11,260.6
Collateral pledge agreements 34.7 33.9
Portfolio management mandates 11,341.6 10,507.9
Gold bars held under earmark 11,176.2 8,671.1
Total 33,720.4 30,473.5
The above table includes the nominal value of securities held under safe custody and collateral pledge arrangements, and the net asset value of portfolio management mandates. Portfolio management mandates include BIS Investment Pools (BISIPs), which are collective investment arrangements for central banks, and dedicated mandates for single central bank investors.
Gold bars held under earmark comprise specific gold bars which have been deposited with the Bank on a custody basis. They are included at their weight in gold (translated at the gold market price and the USD exchange rate into SDR). At 31 March 2012 gold bars held under earmark amounted to 323 tonnes of fine gold (2011: 297 tonnes).
The financial instruments listed above are deposited with external custodians, either central banks or commercial institutions.
In addition to the off-balance sheet items listed above, the Bank also manages portfolios of BIS currency deposits on behalf of its customers. These totalled SDR 6,253.2 million at 31 March 2012 (2011: SDR 5,776.7 million). The assets in these portfolios are included in the balance sheet under the heading “Currency deposits”.
32. Commitments
The Bank provides a number of committed standby facilities for its customers on a collateralised or uncollateralised basis. As at 31 March 2012 the outstanding commitments to extend credit under these committed standby facilities amounted to SDR 2,570.6 million (2011: SDR 2,287.7 million), of which SDR 193.8 million was uncollateralised (2011: SDR 189.4 million).

168 BIS 82nd Annual Report
33. The fair value hierarchy
The Bank categorises its financial instrument fair value measurements using a hierarchy that reflects the significance of inputs used in measuring fair value. The valuation is categorised at the lowest level of input that is significant to the fair value measurement in its entirety. The fair value hierarchy used by the Bank comprises the following levels:
Level 1 – inputs are unadjusted quoted prices in active markets for identical financial instruments.
Level 2 – inputs, other than those listed in level 1, are observable for the financial instrument either directly (ie as a price) or indirectly (ie derived from prices for similar financial instruments). This includes observable interest rates, spreads and volatilities.
Level 3 – inputs are not observable in financial markets.
A. Assets measured at fair value
As at 31 March 2012
SDR millions Level 1 Level 2 Level 3 Total
Financial assets held at fair value through profit and loss
Treasury bills 51,306.1 2,186.2 – 53,492.3
Securities purchased under resale agreements – 46,210.8 – 46,210.8
Fixed-term loans – 22,570.5 – 22,570.5
Government and other securities 36,620.2 27,770.6 8.3 64,399.1
Derivative financial instruments 20.9 7,283.0 – 7,303.9
Financial assets designated as available for sale
Government and other securities 13,361.1 117.5 – 13,478.6
Total financial assets accounted for at fair value 101,308.3 106,138.6 8.3 207,455.2
Financial liabilities held at fair value through profit and loss
Currency deposits – (170,803.1) – (170,803.1)
Derivative financial instruments (35.6) (4,691.4) – (4,727.0)
Other liabilities (short positions in currency assets) – (69.7) – (69.7)
Total financial liabilities accounted for at fair value (35.6) (175,564.2) – (175,599.8)

169BIS 82nd Annual Report
As at 31 March 2011
SDR millions Level 1 Level 2 Level 3 Total
Financial assets held at fair value through profit and loss
Treasury bills 71,198.0 5,734.2 – 76,932.1
Securities purchased under resale agreements – 51,464.0 – 51,464.0
Fixed-term loans – 23,918.2 – 23,918.2
Government and other securities 18,401.2 26,376.2 64.1 44,841.5
Derivative financial instruments 5.5 5,784.8 – 5,790.3
Financial assets designated as available for sale
Government and other securities
11,862.1 284.4 – 12,146.4
Total financial assets accounted for at fair value 101,466.7 113,561.7 64.1 215,092.5
Financial liabilities held at fair value through profit and loss
Currency deposits – (189,361.3) – (189,361.3)
Derivative financial instruments (16.5) (6,943.0) – (6,959.5)
Other liabilities (short positions in currency assets) – (65.7) – (65.7)
Total financial liabilities accounted for at fair value (16.5) (196,370.0) – (196,386.5)
The Bank considers published price quotations in active markets as the best evidence of fair value. The financial instruments using active market quote inputs are categorised as level 1.
Where reliable published price quotations are not available for a financial instrument, the Bank determines fair value by using market standard valuation techniques. These valuation techniques include the use of discounted cash flow models as well as other standard market valuation methods. Where financial models are used, the Bank aims at making maximum use of observable market inputs. The financial instruments valued in this manner are categorised as level 2.
A small percentage of the Bank’s financial instruments valuations are produced using valuation techniques that utilise significant unobservable inputs. The financial instruments valued in this manner are categorised as level 3. The financial instruments categorised as level 3 at 31 March 2012 and at 31 March 2011 comprise illiquid bonds.
The accuracy of the Bank’s valuations is ensured through an independent price verification exercise performed by the valuation control function.

170 BIS 82nd Annual Report
B. Reconciliation of assets and liabilities measured at fair value level 3
As at 31 March 2012
SDR millions
Financial assets held at fair value through profit
and loss
Financial assets designated as available
for sale
Total
Balance at beginning of year 64.1 – 64.1
Gains in profit or loss 1.3 – 1.3
Gains in equity – – –
Total gains 1.3 – 1.3
Disposals (27.4) – (27.4)
Transfers out of level 3 (38.0) – (38.0)
Transfers into level 3 8.3 – 8.3
Balance at end of year 8.3 – 8.3
Gains / (losses) in profit or loss for assets and liabilitiesheld at end of year (20.0) – (20.0)
As at 31 March 2011
SDR millions
Financial assets held at fair value through profit
and loss
Financial assets designated as available
for sale
Total
Balance at beginning of year 91.4 – 91.4
Gains in profit or loss 0.7 – 0.7
Total gains 0.7 – 0.7
Disposals (11.4) – (11.4)
Transfers out of level 3 (31.7) – (31.7)
Transfers into level 3 15.1 – 15.1
Balance at end of year 64.1 – 64.1
Gains in profit or loss for assets and liabilitiesheld at end of year 1.0 – 1.0

171BIS 82nd Annual Report
34. Effective interest rates
The effective interest rate is the rate that discounts the expected future cash flows of a financial instrument to the current book value.
The tables below summarise the effective interest rate by major currency for applicable financial instruments:
As at 31 March 2012
PercentagesUSD EUR GBP JPY Other
currencies
Assets
Gold loans – – – – 0.50
Treasury bills 0.12 0.85 0.45 0.09 0.59
Securities purchased under resale agreements 0.07 0.07 0.39 0.05 –
Loans and advances 0.24 0.46 0.71 0.09 0.15
Government and other securities 1.15 1.76 2.00 0.35 4.72
Liabilities
Currency deposits 0.57 0.68 0.72 0.03 0.77
Gold deposits – – – – 0.42
Short positions in currency assets 4.33 – – – –
As at 31 March 2011
PercentagesUSD EUR GBP JPY Other
currencies
Assets
Gold loans – – – – 0.46
Treasury bills 0.26 0.93 0.60 0.11 0.82
Securities purchased under resale agreements 0.08 0.60 0.53 0.04 –
Loans and advances 0.28 0.94 0.68 0.10 0.16
Government and other securities 1.54 2.64 2.08 0.51 5.07
Liabilities
Currency deposits 0.82 1.02 1.06 0.04 0.56
Gold deposits – – – – 0.38
Short positions in currency assets 4.53 – – – –

172 BIS 82nd Annual Report
35. Geographical analysis
A. Total liabilities
As at 31 March
SDR millions 2012 2011
Africa and Europe 80,509.2 76,200.4
Asia-Pacific 99,805.3 105,303.5
Americas 42,594.0 48,847.3
International organisations 14,383.0 14,097.3
Total 237,291.5 244,448.5
B. Off-balance sheet items
As at 31 March
SDR millions 2012 2011
Africa and Europe 7,972.9 7,652.0
Asia-Pacific 20,144.4 18,918.4
Americas 5,603.1 3,903.1
Total 33,720.4 30,473.5
Note 31 provides further analysis of the Bank’s off-balance sheet items. A geographical analysis of the Bank’s assets is provided in the “Risk management” section below (note 3B).
C. Credit commitments
As at 31 March
SDR millions 2012 2011
Africa and Europe – 179.1
Asia-Pacific 2,570.6 2,108.6
Total 2,570.6 2,287.7
Note 32 provides further analysis of the Bank’s credit commitments.

173BIS 82nd Annual Report
36. Related parties
The Bank considers the following to be its related parties:
• the members of the Board of Directors;
• the senior officials of the Bank;
• close family members of the above individuals;
• enterprises which could exert significant influence over a member of the Board of Directors or senior official, and enterprises over which one of these individuals could exert significant influence;
• the Bank’s post-employment benefit arrangements; and
• central banks whose Governor is a member of the Board of Directors and institutions that are connected with these central banks.
A listing of the members of the Board of Directors and senior officials is shown in the sections of the Annual Report entitled “Board of Directors” and “BIS Management”. Note 18 provides details of the Bank’s post-employment benefit arrangements.
A. Related party individuals
The total compensation of the Board of Directors and senior officials recognised in the profit and loss account amounted to:
For the financial year ended 31 March
CHF millions 2012 2011
Salaries, allowances and medical cover 7.7 7.7
Post-employment benefits 2.1 2.2
Total compensation 9.8 9.9
SDR equivalent 7.1 6.8
Note 24 provides details of the total compensation of the Board of Directors.
The Bank offers personal deposit accounts for all staff members and its Directors. The accounts bear interest at a rate determined by the Bank based on the rate offered by the Swiss National Bank on staff accounts. The movements and total balance on personal deposit accounts relating to members of the Board of Directors and the senior officials of the Bank were as follows:
For the financial year ended 31 March
CHF millions 2012 2011
Balance at beginning of year 21.7 19.7
Deposits taken including interest income (net of withholding tax) 4.2 4.2
Withdrawals (1.8) (2.2)
Balance at end of year 24.1 21.7
SDR equivalent 17.2 15.0
Interest expense on deposits in CHF millions 0.5 0.5
SDR equivalent 0.4 0.3
Balances related to individuals who are appointed as members of the Board of Directors or as senior officials of the Bank during the financial year are included in the table above along with other deposits taken. Balances related to individuals who cease to be members of the Board of Directors or senior officials of the Bank during the financial year are included in the table above along with other withdrawals.
In addition, the Bank operates a blocked personal deposit account for certain staff members who were previously members of the Bank’s savings fund, which closed on 1 April 2003. The terms of these blocked accounts are such that staff members cannot make further deposits or withdrawals and the balances are paid out when they leave the Bank. The accounts bear interest at a rate determined by the Bank based on the rate offered by the Swiss National Bank on staff accounts plus 1%. The total balance of blocked accounts at 31 March 2012 was SDR 19.4 million (2011: SDR 20.9 million). They are reported under the balance sheet heading “Currency deposits”.

174 BIS 82nd Annual Report
B. Related party central banks and connected institutions
The BIS provides banking services to its customers, which are predominantly central banks, monetary authorities and international financial institutions. In fulfilling this role, the Bank in the normal course of business enters into transactions with related party central banks and connected institutions. These transactions include making advances, and taking currency and gold deposits.
It is the Bank’s policy to enter into transactions with related party central banks and connected institutions on similar terms and conditions to transactions with other, non-related party customers.
Currency deposits from related party central banks and connected institutions
For the financial year ended 31 March
SDR millions 2012 2011
Balance at beginning of year 47,156.3 57,512.6
Deposits taken 290,890.7 362,877.5
Maturities, repayments and fair value movements (289,823.8) (370,954.6)
Net movement on notice accounts 1,205.6 (2,279.2)
Balance at end of year 49,428.8 47,156.3
Percentage of total currency deposits at end of year 25.2% 22.8%
Gold deposit liabilities from related central banks and connected institutions
For the financial year ended 31 March
SDR millions 2012 2011
Balance at beginning of year 15,536.0 27,688.7
Net movement on gold sight accounts (1,768.9) (12,152.7)
Balance at end of year 13,767.1 15,536.0
Percentage of total gold deposits at end of year 70.2% 73.0%
Securities purchased under resale transactions with related party central banks and connected institutions
For the financial year ended 31 March
SDR millions 2012 2011
Balance at beginning of year 5,947.0 4,942.7
Collateralised deposits placed 1,569,113.8 1,176,076.2
Maturities and fair value movements (1,569,300.2) (1,175,071.9)
Balance at end of year 5,760.6 5,947.0
Percentage of total securities purchased under resale agreements at end of year 12.5% 11.6%
Derivatives transactions with related party central banks and connected institutions
The BIS enters into derivatives transactions with related party central banks and connected institutions, including foreign exchange deals and interest rate swaps. The total nominal value of these transactions with related party central banks and connected institutions during the year ended 31 March 2012 was SDR 16,196.5 million (2011: SDR 22,669.5 million).

175BIS 82nd Annual Report
Other balances and transactions with related party central banks and connected institutions
The Bank maintains sight accounts in currencies with related party central banks and connected institutions, the total balance of which was SDR 4,061.8 million as at 31 March 2012 (2011: SDR 314.6 million). Gold held with related party central banks and connected institutions totalled SDR 34,816.2 million as at 31 March 2012 (2011: SDR 35,383.0 million).
During the year ended 31 March 2012 the Bank acquired SDR 34,276.9 million of securities issued by related party central banks and connected institutions (2011: SDR 6,013.5 million). A total of SDR 36,724.0 million of such securities matured or were sold during the financial year (2011: SDR 2,535.8 million). As at 31 March 2012 the Bank held SDR 1,167.8 million of related party securities (2011: SDR 3,614.8 million).
During the financial year, the Bank purchased third-party securities from central banks and connected institutions amounting to SDR 131.1 million, all of which were subsequently disposed of before the end of the year (2011: nil).
37. Contingent liabilities
In the opinion of the Bank’s Management there were no material contingent liabilities at 31 March 2012.
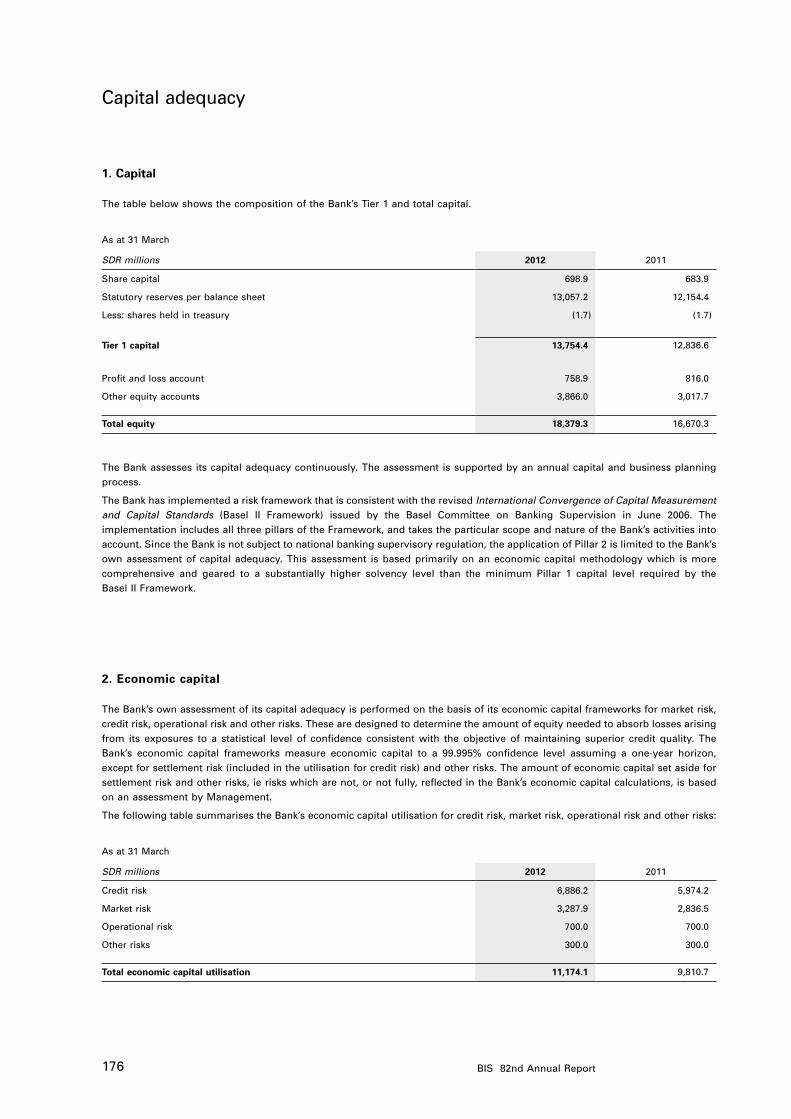
176 BIS 82nd Annual Report
Capital adequacy
1. Capital
The table below shows the composition of the Bank’s Tier 1 and total capital.
As at 31 March
SDR millions 2012 2011
Share capital 698.9 683.9
Statutory reserves per balance sheet 13,057.2 12,154.4
Less: shares held in treasury (1.7) (1.7)
Tier 1 capital 13,754.4 12,836.6
Profit and loss account 758.9 816.0
Other equity accounts 3,866.0 3,017.7
Total equity 18,379.3 16,670.3
The Bank assesses its capital adequacy continuously. The assessment is supported by an annual capital and business planning process.
The Bank has implemented a risk framework that is consistent with the revised International Convergence of Capital Measurement and Capital Standards (Basel II Framework) issued by the Basel Committee on Banking Supervision in June 2006. The implementation includes all three pillars of the Framework, and takes the particular scope and nature of the Bank’s activities into account. Since the Bank is not subject to national banking supervisory regulation, the application of Pillar 2 is limited to the Bank’s own assessment of capital adequacy. This assessment is based primarily on an economic capital methodology which is more comprehensive and geared to a substantially higher solvency level than the minimum Pillar 1 capital level required by the Basel II Framework.
2. Economic capital
The Bank’s own assessment of its capital adequacy is performed on the basis of its economic capital frameworks for market risk, credit risk, operational risk and other risks. These are designed to determine the amount of equity needed to absorb losses arising from its exposures to a statistical level of confidence consistent with the objective of maintaining superior credit quality. The Bank’s economic capital frameworks measure economic capital to a 99.995% confidence level assuming a one-year horizon, except for settlement risk (included in the utilisation for credit risk) and other risks. The amount of economic capital set aside for settlement risk and other risks, ie risks which are not, or not fully, reflected in the Bank’s economic capital calculations, is based on an assessment by Management.
The following table summarises the Bank’s economic capital utilisation for credit risk, market risk, operational risk and other risks:
As at 31 March
SDR millions 2012 2011
Credit risk 6,886.2 5,974.2
Market risk 3,287.9 2,836.5
Operational risk 700.0 700.0
Other risks 300.0 300.0
Total economic capital utilisation 11,174.1 9,810.7

177BIS 82nd Annual Report
3. Risk-weighted assets and minimum capital requirements under the Basel II Framework
The Basel II Framework includes several approaches for calculating risk-weighted assets and the corresponding minimum capital requirements. In principle, the minimum capital requirements are determined by taking 8% of the risk-weighted assets.
The following table summarises the relevant exposure types and approaches as well as the risk-weighted assets and related minimum capital requirements for credit risk, market risk and operational risk.
As at 31 March 2012 2011
SDR millions
Approach used Amount of exposure
Risk- weighted
assets(A)
Minimum capital
requirement (B)
Amount of exposure
Risk- weighted
assets(A)
Minimum capital
requirement (B)
Credit risk
Exposure tosovereigns, banksand corporates
Advanced internal ratings-based approach, where (B) is derived as (A) x 8% 153,430.0 10,041.9 803.4 158,491.3 7,538.3 603.1
Securitisation exposures, externally managed portfolios and other assets
Standardised approach, where (B) is derived as (A) x 8% 1,853.2 1,107.8 88.6 2,256.6 1,190.0 95.2
Market risk
Exposure toforeign exchange riskand gold price risk
Internal models approach, where (A) is derived as (B) / 8% – 16,005.8 1,280.5 – 10,806.2 864.5
Operational risk Advanced measurement approach, where (A) is derived as (B) / 8% – 4,270.3 341.6 – 3,760.4 300.8
Total 31,425.8 2,514.0 23,294.9 1,863.6
For credit risk, the Bank has adopted the advanced internal ratings-based approach for the majority of its exposures. Under this approach, the risk weighting for a transaction is determined by the relevant Basel II risk weight function using the Bank’s own estimates for key inputs. For certain exposures, the Bank has adopted the standardised approach. Under this approach, risk weightings are mapped to exposure types.
Risk-weighted assets for market risk are derived following an internal models approach. For operational risk, the advanced measurement approach is used. Both these approaches rely on value-at-risk (VaR) methodologies. The minimum capital requirements are derived from the VaR figures and are translated into risk-weighted assets taking into account the 8% minimum capital requirement.
More details on the assumptions underlying the calculations are provided in the sections on credit risk, market risk and operational risk.

178 BIS 82nd Annual Report
4. Tier 1 capital ratio
The capital ratio measures capital adequacy by comparing the Bank’s Tier 1 capital with its risk-weighted assets. The table below shows the Bank’s Tier 1 capital ratio, consistent with the Basel II Framework.
As at 31 March
SDR millions 2012 2011
Tier 1 capital 13,754.3 12,836.6
Expected loss (24.3) –
Tier 1 capital net of expected loss (A) 13,730.0 12,836.6
Total risk-weighted assets (B) 31,425.8 23,294.9
Tier 1 capital ratio (A) / (B) 43.7% 55.1%
As required by the Basel II Framework, expected loss is calculated for credit risk exposures subject to the advanced internal ratings-based approach. The expected loss is calculated at the balance sheet date taking into account any impairment provision which is reflected in the Bank’s financial statements. At 31 March 2011 the Bank had an impairment provision of SDR 29.0 million relating to gold loan assets. The Bank had no impaired financial assets at 31 March 2012. Note 2B to the financial statements provides details of the impairment provision that was recorded at 31 March 2011. In accordance with the requirements of the Basel II Framework, the expected loss is compared with the impairment provision and any shortfall is deducted from the Bank’s Tier 1 capital.
The Bank maintains a very high creditworthiness and performs a comprehensive capital assessment considering its specific characteristics. As such, it maintains a capital position substantially in excess of the minimum requirement.

179BIS 82nd Annual Report
Risk management
1. Risks faced by the Bank
The Bank supports its customers, predominantly central banks, monetary authorities and international financial institutions, in the management of their reserves and related financial activities.
Banking activities form an essential element of meeting the Bank’s objectives and ensure its financial strength and independence. The BIS engages in banking activities that are customer-related as well as activities that are related to the investment of its equity, each of which may give rise to financial risk comprising credit risk, market risk and liquidity risk. The Bank is also exposed to operational risk.
Within the risk framework defined by the Board of Directors, the Management of the Bank has established risk management policies designed to ensure that risks are identified, appropriately measured and controlled as well as monitored and reported.
2. Risk management approach and organisation
The Bank maintains superior credit quality and adopts a prudent approach to financial risk-taking, by:
• maintaining an exceptionally strong capital position;
• investing its assets predominantly in high credit quality financial instruments;
• seeking to diversify its assets across a range of sectors;
• adopting a conservative approach to its tactical market risk-taking and carefully managing market risk associated with the Bank’s strategic positions, which include its gold holdings; and
• maintaining a high level of liquidity.
A. Organisation
Under Article 39 of the Bank’s Statutes, the General Manager is responsible to the Board for the management of the Bank, and is assisted by the Deputy General Manager. The Deputy General Manager is responsible for the Bank’s independent risk control and compliance functions. The General Manager and the Deputy General Manager are supported by senior management advisory committees.
The key advisory committees are the Executive Committee, the Finance Committee and the Compliance and Operational Risk Committee. The first two committees are chaired by the General Manager and the third by the Deputy General Manager, and all include other senior members of the Bank’s Management. The Executive Committee advises the General Manager primarily on the Bank’s strategic planning and the allocation of resources, as well as on decisions related to the broad financial objectives for the banking activities and operational risk management. The Finance Committee advises the General Manager on the financial management and policy issues related to the banking business, including the allocation of economic capital to risk categories. The Compliance and Operational Risk Committee acts as an advisory committee to the Deputy General Manager and ensures the coordination of compliance matters and operational risk management throughout the Bank.
The independent risk control function for financial risks is performed by the Risk Control unit. The independent operational risk control function is shared between Risk Control, which maintains the operational risk quantification, and the Compliance and Operational Risk Unit. Both units report directly to the Deputy General Manager.
The Bank’s compliance function is performed by the Compliance and Operational Risk Unit. The objective of this function is to provide reasonable assurance that the activities of the Bank and its staff conform to applicable laws and regulations, the BIS Statutes, the Bank’s Code of Conduct and other internal rules, policies and relevant standards of sound practice.
The Compliance and Operational Risk Unit identifies and assesses compliance risks and guides and educates staff on compliance issues. The Head of the Compliance and Operational Risk Unit also has a direct reporting line to the Audit Committee, which is an advisory committee to the Board of Directors.
The Finance unit and the Legal Service complement the Bank’s risk management. The Finance unit operates an independent valuation control function, produces the Bank’s financial statements and controls the Bank’s expenditure by setting and monitoring the annual budget. The objective of the independent valuation control function is to ensure that the Bank’s valuations comply with its valuation policy and procedures, and that the processes and procedures which influence the Bank’s valuations conform to best practice guidelines. The Finance unit reports to the Deputy General Manager and the Secretary General.

180 BIS 82nd Annual Report
The Legal Service provides legal advice and support covering a wide range of issues relating to the Bank’s activities. The Legal Service has a direct reporting line to the General Manager.
The Internal Audit function reviews internal control procedures and reports on how they comply with internal standards and industry best practices. The scope of internal audit work includes the review of risk management procedures, internal control systems, information systems and governance processes. Internal Audit has a direct reporting line to the Audit Committee and is responsible to the General Manager and the Deputy General Manager.
B. Risk monitoring and reporting
The Bank’s financial and operational risk profile, position and performance are monitored on an ongoing basis by the relevant units. Financial risk and compliance reports aimed at various management levels are regularly provided to enable Management to adequately assess the Bank’s risk profile and financial condition.
Management reports financial and risk information to the Board of Directors on a monthly and a quarterly basis. Furthermore, the Audit Committee receives regular reports from Internal Audit, the Compliance and Operational Risk Unit and the Finance unit. The Banking and Risk Management Committee, another advisory committee to the Board, receives an annual report from the Risk Control unit. The preparation of reports is subject to comprehensive policies and procedures, thus ensuring strong controls.
C. Risk methodologies
The Bank revalues virtually all of its financial assets to fair value on a daily basis and reviews its valuations monthly, taking into account necessary adjustments for impairment. It uses a comprehensive range of quantitative methodologies for valuing financial instruments and for measuring risk to its net profit and equity. The Bank reassesses its quantitative methodologies in the light of its changing risk environment and evolving best practice.
The Bank’s model validation policy defines the roles and responsibilities and processes related to the implementation of new or materially changed risk models.
A key methodology used by the Bank to measure and manage risk is the calculation of economic capital based on value-at-risk (VaR) techniques. VaR expresses the statistical estimate of the maximum potential loss on the current positions of the Bank measured to a specified level of confidence and a specified time horizon.
The Bank’s economic capital calculation is designed to measure the amount of equity needed to absorb losses arising from its exposures to a statistical level of confidence determined by the Bank’s aim to remain of the highest creditworthiness.
The Bank assesses its capital adequacy on the basis of economic capital frameworks for market risk, credit risk, operational risk and other risks, supplemented by sensitivity and risk factor analyses. The Bank’s economic capital frameworks measure economic capital to a 99.995% confidence interval assuming a one-year holding period.
The Bank allocates economic capital to the above risk categories. An additional amount of economic capital is set aside based on Management’s assessment of risks which are not, or not fully, reflected in the economic capital calculations.
A comprehensive stress testing framework complements the Bank’s risk assessment including its VaR and economic capital calculations for financial risk. The Bank’s key market risk factors and credit exposures are stress-tested. The stress testing includes the analysis of severe historical and adverse hypothetical macroeconomic scenarios, as well as sensitivity tests of extreme but still plausible movements of the key risk factors identified. The Bank also performs stress tests related to liquidity risk.

181BIS 82nd Annual Report
3. Credit risk
Credit risk arises because a counterparty may fail to meet its obligations in accordance with the agreed contractual terms and conditions. A financial asset is considered past due when a counterparty fails to make a payment on the contractual due date.
The Bank manages credit risk within a framework and policies set by the Board of Directors and Management. These are complemented by more detailed guidelines and procedures at the level of the independent risk control function.
A. Credit risk assessment
Credit risk is continuously controlled at both a counterparty and an aggregated level. As part of the independent risk control function, individual counterparty credit assessments are performed subject to a well defined internal rating process, involving 18 rating grades. As part of this process, counterparty financial statements and market information are analysed. The rating methodologies depend on the nature of the counterparty. Based on the internal rating and specific counterparty features, the Bank sets a series of credit limits covering individual counterparties and countries. Internal ratings are assigned to all counterparties. In principle, the ratings and related limits are reviewed at least annually. The main assessment criterion in these reviews is the ability of the counterparties to meet interest and principal repayment obligations in a timely manner.
Credit risk limits at the counterparty level are approved by the Bank’s Management and fit within a framework set by the Board of Directors.
On an aggregated level credit risk, including default and country transfer risk, is measured, monitored and controlled based on the Bank’s economic capital calculation for credit risk. To calculate economic capital for credit risk, the Bank uses a portfolio VaR model. Management limits the Bank’s overall exposure to credit risk by allocating an amount of economic capital to credit risk.
B. Default risk
The following tables show the exposure of the Bank to default risk, without taking into account any collateral held or other credit enhancements available to the Bank. Credit risk is further mitigated through the use of collateral and legally enforceable netting or setoff agreements. The corresponding assets and liabilities are not offset on the balance sheet.
The exposures set out in the tables below are based on the carrying value of the assets on the balance sheet as categorised by sector, geographical region and credit quality. The carrying value is the fair value of the financial instruments, including derivatives, except in the case of very short-term financial instruments (sight and notice accounts) and gold, which are shown at amortised cost net of any impairment charge. Commitments are reported at their notional amounts. Gold and gold loans exclude gold bar assets held in custody, and accounts receivable do not include unsettled liability issues, because these items do not represent credit exposures of the Bank.
The vast majority of the Bank’s assets are invested in securities issued by G10 governments and financial institutions rated A– or above by at least one of the major external credit assessment institutions. Limitations on the number of high-quality counterparties in these sectors mean that the Bank is exposed to single-name concentration risk.
The Bank conducts an annual review for impairment at the date of each balance sheet. At 31 March 2012 the Bank did not have any financial assets that were considered to be impaired (31 March 2011: SDR 29.0 million). As at 31 March 2012 no financial assets were considered past due (31 March 2011: nil). During the period under review, the Bank recorded a credit loss of SDR 31.9 million (2011: nil) due to a sovereign debt restructuring.

182 BIS 82nd Annual Report
Default risk by asset class and issuer type
The following tables show the exposure of the Bank to default risk by asset class and issuer type. “Public sector” includes international and other public sector institutions.
As at 31 March 2012
SDR millionsSovereign and central banks
Public sector Banks Corporate Securitisation Total
On-balance sheet exposures
Cash and sight accounts with banks 4,064.5 – 11.9 1.4 – 4,077.8
Gold and gold loans – – 1,096.5 – – 1,096.5
Treasury bills 53,492.3 – – – – 53,492.3
Securities purchased under resale agreements 5,760.6 – 40,450.2 – – 46,210.8
Loans and advances 4,520.6 391.6 17,844.9 – – 22,757.1
Government and other securities 49,198.7 15,588.9 7,617.7 4,467.4 1,005.0 77,877.7
Derivatives 49.1 139.8 7,114.6 0.4 – 7,303.9
Accounts receivable 10.0 337.5 20.6 9.6 – 377.7
Total on-balance sheet exposure 117,095.8 16,457.8 74,156.4 4,478.8 1,005.0 213,193.8
Commitments
Undrawn unsecured facilities 193.8 – – – – 193.8
Undrawn secured facilities 2,376.8 – – – – 2,376.8
Total commitments 2,570.6 – – – – 2,570.6
Total exposure 119,666.4 16,457.8 74,156.4 4,478.8 1,005.0 215,764.4
As at 31 March 2011
SDR millionsSovereign and central banks
Public sector Banks Corporate Securitisation Total
On-balance sheet exposures
Cash and sight accounts with banks 316.7 – 6.8 6.3 – 329.8
Gold and gold loans – – 1,225.1 29.1 – 1,254.2
Treasury bills 76,932.1 – – – – 76,932.1
Securities purchased under resale agreements 5,947.0 – 45,517.0 – – 51,464.0
Loans and advances 1,182.5 424.2 22,563.7 – – 24,170.4
Government and other securities 28,467.5 14,375.1 9,206.9 3,589.2 1,349.2 56,987.9
Derivatives 156.2 31.4 5,602.1 0.6 – 5,790.3
Accounts receivable 2.0 434.9 131.5 8.0 – 576.4
Total on-balance sheet exposure 113,004.0 15,265.6 84,253.1 3,633.2 1,349.2 217,505.1
Commitments
Undrawn unsecured facilities 189.4 – – – – 189.4
Undrawn secured facilities 2,098.3 – – – – 2098.3
Total commitments 2,287.7 – – – – 2,287.7
Total exposure 115,291.7 15,265.6 84,253.1 3,633.2 1,349.2 219,792.8

183BIS 82nd Annual Report
Default risk by geographical region
The following tables represent the exposure of the Bank to default risk by geographical region. The Bank has allocated exposures to regions based on the country of incorporation of each legal entity to which the Bank has exposures.
As at 31 March 2012
SDR millionsAfrica and
EuropeAsia-Pacific Americas International
institutionsTotal
On-balance sheet exposures
Cash and sight accounts with banks 4,063.9 7.7 6.2 – 4,077.8
Gold and gold loans 782.5 68.9 245.1 – 1,096.5
Treasury bills 14,394.7 37,072.8 2,024.8 – 53,492.3
Securities purchased under resale agreements 39,158.3 5,252.6 1,799.9 – 46,210.8
Loans and advances 14,584.2 6,799.0 1,227.8 146.1 22,757.1
Government and other securities 39,858.2 4,411.6 25,233.2 8,374.7 77,877.7
Derivatives 5,613.2 94.8 1,595.8 0.1 7,303.9
Accounts receivable 31.6 0.9 345.2 – 377.7
Total on-balance sheet exposure 118,486.6 53,708.3 32,478.0 8,520.9 213,193.8
Commitments
Undrawn unsecured facilities – 193.8 – – 193.8
Undrawn secured facilities – 2,376.8 – – 2,376.8
Total commitments – 2,570.6 – – 2,570.6
Total exposure 118,486.6 56,278.9 32,478.0 8,520.9 215,764.4
As at 31 March 2011
SDR millionsAfrica and
EuropeAsia-Pacific Americas International
institutionsTotal
On-balance sheet exposures
Cash and sight accounts with banks 315.1 1.2 13.5 – 329.8
Gold and gold loans 901.8 58.3 294.1 – 1,254.2
Treasury bills 37,831.2 36,796.9 2,304.0 – 76,932.1
Securities purchased under resale agreements 45,359.2 5,710.0 394.8 – 51,464.0
Loans and advances 19,224.0 3,429.6 1,345.2 171.6 24,170.4
Government and other securities 31,368.7 3,427.6 13,667.5 8,524.1 56,987.9
Derivatives 4,082.8 175.1 1,532.1 0.3 5,790.3
Accounts receivable 140.6 0.8 435 – 576.4
Total on-balance sheet exposure 139,223.4 49,599.5 19,986.2 8,696.0 217,505.1
Commitments
Undrawn unsecured facilities – 189.4 – – 189.4
Undrawn secured facilities 179.1 1,919.2 – – 2,098.3
Total commitments 179.1 2,108.6 – – 2,287.7
Total exposure 139,402.5 51,708.1 19,986.2 8,696.0 219,792.8

184 BIS 82nd Annual Report
Default risk by counterparty / issuer rating
The following tables show the exposure of the Bank to default risk by class of financial asset. The ratings shown reflect the Bank’s internal ratings expressed as equivalent external ratings.
As at 31 March 2012
SDR millionsAAA AA A BBB BB and
belowUnrated Total
On-balance sheet exposures
Cash and sight accounts with banks 3,969.7 97.8 9.4 0.3 0.3 0.3 4,077.8
Gold and gold loans – 83.3 1,013.2 – – – 1,096.5
Treasury bills 6,160.9 43,461.9 3,310.6 558.9 – – 53,492.3
Securities purchased under resale agreements – 5,760.6 39,287.8 1,162.4 – – 46,210.8
Loans and advances 1,101.0 4,360.9 15,913.0 800.8 581.4 – 22,757.1
Government and other securities 24,965.8 42,492.8 7,471.8 2,029.8 917.5 – 77,877.7
Derivatives 107.9 1,472.0 5,723.0 – 0.6 0.4 7,303.9
Accounts receivable – 345.5 25.0 0.5 0.2 6.5 377.7
Total on-balance sheet exposure 36,305.3 98,074.8 72,753.8 4,552.7 1,500.0 7.2 213,193.8
Percentages 17.0% 46.0% 34.1% 2.1% 0.8% 0.0% 100.0%
Commitments
Undrawn unsecured facilities – – – 193.8 – – 193.8
Undrawn secured facilities – 771.3 784.4 261.4 559.7 – 2,376.8
Total commitments – 771.3 784.4 455.2 559.7 – 2,570.6
Total exposure 36,305.3 98,846.1 73,538.2 5,007.9 2,059.7 7.2 215,764.4

185BIS 82nd Annual Report
As at 31 March 2011
SDR millionsAAA AA A BBB BB and
belowUnrated Total
On-balance sheet exposures
Cash and sight accounts with banks 315.3 11.7 2.1 0.3 0.1 0.3 329.8
Gold and gold loans – 303.8 921.3 29.1 – – 1,254.2
Treasury bills 28,360.2 41,532.1 7,039.8 – – – 76,932.1
Securities purchased under resale agreements 237.0 13,499.4 37,727.6 – – – 51,464.0
Loans and advances 1,543.6 7,498.1 15,128.7 – – – 24,170.4
Government and other securities 36,427.9 12,321.0 7,501.6 686.5 50.9 – 56,987.9
Derivatives 31.3 798.3 4,914.0 0.1 46.0 0.6 5,790.3
Accounts receivable 435.0 0.3 134.9 0.3 1.4 4.5 576.4
Total on-balance sheet exposure 67,350.3 75,964.7 73,370.0 716.3 98.4 5.4 217,505.1
Percentages 31.0% 34.9% 33.7% 0.3% 0.1% 0.0% 100.0%
Commitments
Undrawn unsecured facilities – – – 189.4 – – 189.4
Undrawn secured facilities – 710.0 721.8 419.7 246.8 – 2,098.3
Total commitments – 710.0 721.8 609.1 246.8 – 2,287.7
Total exposure 67,350.3 76,674.7 74,091.8 1,325.4 345.2 5.4 219,792.8
C. Credit risk mitigation
Credit risk is mitigated through the use of collateral and legally enforceable netting or setoff agreements. The corresponding assets and liabilities are not offset on the balance sheet.
The Bank requires counterparties to provide collateral, under reverse repurchase agreements, some derivative financial instrument contracts and certain drawn-down facility agreements, to mitigate counterparty default risk in accordance with the respective policies and procedures. During the term of the agreement, the Bank monitors the fair value of the collateral securities and may call for further collateral or be required to return collateral based on the movement in its market value.
The Bank mitigates settlement risk by using established clearing centres and by settling transactions where possible through a delivery versus payment settlement mechanism. Daily settlement risk limits are monitored on a continuous basis.
The table below shows the collateral obtained by the Bank. It excludes transactions which have yet to settle (on which neither cash nor collateral has been exchanged).
As at 31 March 2012 2011
SDR millionsFair value of
relevant contractsValue of collateral
Fair value of relevant contracts
Value of collateral
Collateral obtained for
Securities purchased under resale agreements 36,567.3 36,960.2 45,703.9 45,858.7
Advances 3,811.0 4,340.4 63.1 67.5
Derivatives 2,754.7 2,938.2 1,639.8 1,743.5
Total collateral obtained 43,133.0 44,238.8 47,406.8 47,669.7
The Bank is allowed to sell or pledge collateral obtained, but must deliver equivalent financial instruments upon expiry of the contract. The Bank accepts sovereign securities and cash as collateral for derivatives. Eligible collateral for reverse repurchase agreements comprises sovereign and supranational debt as well as state agency securities. Eligible collateral for loans and advances includes currency deposits with the Bank as well as units in the BIS Investment Pools (BISIPs) and securities in portfolios managed by the BIS.

186 BIS 82nd Annual Report
As at 31 March 2012 the total amount of undrawn facilities which could be drawn down subject to collateralisation by the counterparty was SDR 2,376.8 million (2011: SDR 2,098.3 million).
The Bank did not provide collateral on any of its financial instrument contracts as at 31 March 2012 (2011: nil).
D. Economic capital for credit risk
The Bank determines economic capital for credit risk using a VaR methodology on the basis of a portfolio VaR model, assuming a one-year time horizon and a 99.995% confidence interval, except for settlement risk (included in the utilisation for credit risk since July 2011). The amount of economic capital set aside for settlement risk reflected in the Bank’s economic capital calculations is based on an assessment by Management.
For the financial year 2012 2011
SDR millions Average High Low At 31 March Average High Low At 31 March
Economic capital utilisation for credit risk 6,504.4 7,131.2 5,602.3 6,886.2 5,807.1 6,315.0 5,345.7 5,974.2
E. Minimum capital requirements for credit risk
Exposure to sovereigns, banks and corporates
For the calculation of risk-weighted assets for exposures to banks, sovereigns and corporates, the Bank has adopted an approach that is consistent with the advanced internal ratings-based approach.
As a general rule, under this approach risk-weighted assets are determined by multiplying the credit risk exposures with risk weights derived from the relevant Basel II risk weight function using the Bank’s own estimates for key inputs. These estimates for key inputs are also relevant to the Bank’s economic capital calculation for credit risk.
The credit risk exposure for a transaction or position is referred to as the exposure at default (EAD). The Bank determines the EAD as the notional amount of all on- and off-balance sheet credit exposures, except derivative contracts and certain collateralised exposures. The EAD for derivatives is calculated using an approach consistent with the internal models method proposed under the Basel II Framework. In line with this methodology, the Bank calculates effective expected positive exposures that are then multiplied by a factor alpha as set out in the Framework.
Key inputs to the risk weight function are a counterparty’s estimated one-year probability of default (PD) as well as the estimated loss-given-default (LGD) and maturity for each transaction.
Due to the high credit quality of the Bank’s investments and the conservative credit risk management process at the BIS, the Bank is not in a position to estimate PDs and LGDs based on its own default experience. The Bank calibrates counterparty PD estimates through a mapping of internal rating grades to external credit assessments taking external default data into account. Similarly, LGD estimates are derived from external data. Where appropriate, these estimates are adjusted to reflect the risk-reducing effects of collateral obtained giving consideration to market price volatility, remargining and revaluation frequency. The recognition of the risk-reducing effects of collateral obtained for derivative contracts, reverse repurchase agreements and collateralised advances is accounted for in calculating the EAD.
The table below details the calculation of risk-weighted assets. The exposures are measured taking netting and collateral benefits into account. The total amount of exposures reported in the table as at 31 March 2012 includes SDR 421.4 million for interest rate contracts (31 March 2011: SDR 463.0 million) and SDR 726.5 million for FX and gold contracts (31 March 2011: SDR 287.5 million).

187BIS 82nd Annual Report
As at 31 March 2012
Internal rating grades expressed as equivalent external rating grades
Amount of exposure
Exposure- weighted
PD
Exposure- weighted average
LGD
Exposure- weighted average
risk weight
Risk-weighted assets
SDR millions / percentages SDR millions % % % SDR millions
AAA 34,310.0 0.002 35.6 1.2 397.8
AA 88,287.5 0.02 37.6 3.9 3,415.5
A 26,344.3 0.07 49.5 15.8 4,158.9
BBB 3,530.3 0.15 42.8 30.1 1,064.2
BB and below 957.9 1.32 48.4 105.0 1,005.5
Total 153,430.0 10,041.9
As at 31 March 2011
Internal rating grades expressed as equivalent external rating grades
Amount of exposure
Exposure- weighted
PD
Exposure- weighted average
LGD
Exposure- weighted average
risk weight
Risk-weighted assets
SDR millions / percentages SDR millions % % % SDR millions
AAA 63,927.4 0.004 37.8 1.9 1,197.8
AA 61,483.3 0.02 40.7 4.1 2,496.1
A 32,008.5 0.05 48.2 10.6 3,399.1
BBB 1,008.2 0.19 41.7 39.5 398.1
BB and below 63.9 1.00 42.3 73.7 47.2
Total 158,491.3 7,538.3
The table below summarises the impact of collateral arrangements on the amount of credit exposure after taking netting into account.
Impact of collateral arrangements
SDR millions
Amount of exposure after taking netting
into account
Benefits from collateral
arrangements
Amount of exposure after taking into account netting and collateral arrangements
As at 31 March 2012 207,533.6 54,103.6 153,430.0
As at 31 March 2011 212,964.8 54,473.5 158,491.3

188 BIS 82nd Annual Report
F. Securitisation exposures
The Bank invests in highly rated securitisation exposures based on traditional, ie non-synthetic, securitisation structures. Given the scope of the Bank’s activities, risk-weighted assets under the Basel II Framework are determined according to the standardised approach for securitisation. Under this approach, external credit assessments of the securities are used to determine the relevant risk weights. External credit assessment institutions used for this purpose are Moody’s Investors Service, Standard & Poor’s and Fitch Ratings. Risk-weighted assets are then derived as the product of the notional amounts of the exposures and the associated risk weights.
The following table shows the Bank’s investments in securitisation analysed by type of securitised assets:
As at 31 March 2012
SDR millionsExternal rating Amount of
exposureRisk weight Risk-weighted
assets
Residential mortgage-backed securities AAA 62.8 20% 12.6
Residential mortgage-backed securities A 39.7 50% 19.9
Securities backed by credit card receivables AAA 78.8 20% 15.8
Securities backed by other receivables (government-sponsored) AAA 765.5 20% 153.1
Total 946.8 201.4
As at 31 March 2011
SDR millionsExternal rating Amount of
exposureRisk weight Risk-weighted
assets
Residential mortgage-backed securities AAA 161.1 20% 32.2
Securities backed by credit card receivables AAA 376.3 20% 75.3
Securities backed by other receivables (government-sponsored) AAA 795.8 20% 159.2
Total 1,333.2 266.7

189BIS 82nd Annual Report
4. Market risk
The Bank is exposed to market risk through adverse movements in market prices. The main components of the Bank’s market risk are gold price risk, interest rate risk and foreign exchange risk. The Bank measures market risk and calculates economic capital based on a VaR methodology using a Monte Carlo simulation technique. Risk factor volatilities and correlations are estimated using a one-year observation period. Furthermore, the Bank computes sensitivities to certain market risk factors.
In line with the Bank’s objective of maintaining its superior credit quality, economic capital is measured at the 99.995% confidence interval assuming a one-year holding period. The Bank’s Management manages market risk economic capital usage within a framework set by the Board of Directors. VaR limits are supplemented by operating limits.
VaR models depend on statistical assumptions and the quality of available market data and, while forward-looking, they extrapolate from past events.
To ensure that models provide a reliable measure of potential losses over the one-year time horizon, the Bank has established a comprehensive regular backtesting framework, comparing daily performance with corresponding VaR estimates. The results are analysed and reported to Management.
The Bank also supplements its market risk measurement based on VaR modelling and related economic capital calculations with a series of stress tests. These include severe historical scenarios, adverse hypothetical macroeconomic scenarios and sensitivity tests of gold price, interest rate and foreign exchange rate movements.
A. Gold price risk
Gold price risk is the exposure of the Bank’s financial condition to adverse movements in the price of gold.
The Bank is exposed to gold price risk principally through its holdings of gold investment assets, which amount to 116 tonnes (2011: 119 tonnes). These gold investment assets are held in custody or placed on deposit with commercial banks. At 31 March 2012 the Bank’s net gold investment assets amounted to SDR 4,018.2 million (2011: SDR 3,451.2 million), approximately 22% of its equity (2011: 21%). The Bank sometimes also has small exposures to gold price risk arising from its banking activities with central and commercial banks. Gold price risk is measured within the Bank’s VaR methodology, including its economic capital framework and stress tests.
B. Interest rate risk
Interest rate risk is the exposure of the Bank’s financial condition to adverse movements in interest rates including credit spreads. The Bank is exposed to interest rate risk through the interest bearing assets relating to the management of its equity held in its investment portfolios and investments relating to its banking portfolios. The investment portfolios are managed using a fixed duration benchmark of bonds.
The Bank measures and monitors interest rate risk using a VaR methodology and sensitivity analyses taking into account movements in relevant money market rates, government bonds, swap rates and credit spreads.
The tables below show the impact on the Bank’s equity of a 1% upward shift in the relevant yield curve per time band:
As at 31 March 2012
SDR millionsUp to 6months
6 to 12months
1 to 2years
2 to 3years
3 to 4years
4 to 5years
Over5 years
Euro (1.2) (13.6) (14.0) (25.6) (32.4) (16.7) (40.0)
Japanese yen 1.1 (2.7) (4.2) (16.3) (7.3) (4.0) (7.2)
Pound sterling 1.4 (3.7) (6.0) (15.2) (18.0) (7.6) 0.1
Swiss franc 6.1 (0.2) (0.4) (0.6) (3.2) (4.6) 8.6
US dollar 17.3 (36.2) (26.9) (31.2) (47.8) (37.9) (12.4)
Other currencies (1.3) 0.4 – (0.9) 0.4 – 0.1
Total 23.4 (56.0) (51.5) (89.8) (108.3) (70.8) (50.8)

190 BIS 82nd Annual Report
As at 31 March 2011
SDR millionsUp to 6 months
6 to 12 months
1 to 2 years
2 to 3 years
3 to 4 years
4 to 5 years
Over 5 years
Euro 2.6 (8.6) (16.9) (11.0) (27.4) (32.1) (29.3)
Japanese yen 0.9 (3.3) (6.1) (5.2) (13.7) (2.8) (3.2)
Pound sterling 1.8 (2.9) (3.5) (12.8) (9.5) (9.1) (19.9)
Swiss franc (1.2) (0.3) (0.4) (0.6) (0.8) (5.7) 7.5
US dollar 19.4 (15.9) (13.5) (47.5) (39.4) (26.7) (7.3)
Other currencies (0.7) (5.6) 0.2 (0.6) 0.4 0.3 –
Total 22.8 (36.6) (40.2) (77.7) (90.4) (76.1) (52.2)
C. Foreign exchange risk
The Bank’s functional currency, the SDR, is a composite currency comprising fixed amounts of USD, EUR, JPY and GBP. Currency risk is the exposure of the Bank’s financial condition to adverse movements in exchange rates. The Bank is exposed to foreign exchange risk primarily through the assets relating to the management of its equity. The Bank is also exposed to foreign exchange risk through managing its customer deposits and through acting as an intermediary in foreign exchange transactions between central and commercial banks. The Bank reduces its foreign exchange exposures by matching the relevant assets to the constituent currencies of the SDR on a regular basis, and by limiting currency exposures arising from customer deposits and foreign exchange transaction intermediation.
Foreign exchange risk is measured and monitored based on the Bank’s VaR methodology and sensitivity analyses considering movements in key foreign exchange rates.
The following tables show the Bank’s assets and liabilities by currency and gold exposure. The net foreign exchange and gold position in these tables therefore includes the Bank’s gold investments. To determine the Bank’s net foreign exchange exposure, the gold amounts need to be removed. The SDR-neutral position is then deducted from the net foreign exchange position excluding gold to arrive at the net currency exposure of the Bank on an SDR-neutral basis.

191BIS 82nd Annual Report
As at 31 March 2012
SDR millionsSDR USD EUR GBP JPY CHF Gold Other
currenciesTotal
Assets
Cash and sight accounts with banks – 6.4 171.6 4.7 0.1 3,883.7 – 11.3 4,077.8
Gold and gold loans – 9.7 – – – – 35,903.0 (0.0) 35,912.7
Treasury bills – 1,960.6 12,504.4 322.6 36,439.9 1,108.8 – 1,156.0 53,492.3
Securities purchased under resale agreements – 2,768.8 27,383.6 10,805.8 5,252.6 – – – 46,210.8
Loans and advances 146.1 11,071.1 8,671.5 679.4 436.4 56.7 – 1,695.9 22,757.1
Government and other securities – 37,283.1 30,273.3 5,329.0 2,421.1 – – 2,571.2 77,877.7
Derivative financial instruments 1,224.8 50,812.8 (8,337.0) 117.1 (28,957.4) (1,093.0) (6,939.9) 476.5 7,303.9
Accounts receivable – 7,662.4 0.7 – – 9.7 – 172.7 7,845.5
Land, buildings and equipment 189.6 – – – – 3.4 – – 193.0
Total assets 1,560.5 111,574.9 70,668.1 17,258.6 15,592.7 3,969.3 28,963.1 6,083.6 255,670.8
Liabilities
Currency deposits (7,840.2) (136,634.5) (27,870.9) (13,147.3) (2,798.4) (514.0) – (6,973.2) (195,778.5)
Gold deposits – (6.4) – – – – (19,617.6) – (19,624.0)
Derivative financial instruments 3,793.5 35,928.0 (25,098.0) (1,185.9) (10,347.6) (3,445.0) (5,324.2) 952.2 (4,727.0)
Accounts payable – (3,387.4) (11,585.7) (925.7) (783.5) – – (63.2) (16,745.5)
Other liabilities – (70.9) – – – (345.3) – (0.3) (416.5)
Total liabilities (4,046.7) (104,171.2) (64,554.6) (15,258.9) (13,929.5) (4,304.3) (24,941.8) (6,084.5) (237,291.5)
Net currency and gold position (2,486.2) 7,403.7 6,113.5 1,999.7 1,663.2 (335.0) 4,021.3 (0.9) 18,379.3
Adjustment for gold investment assets – – – – – – (4,021.3) – (4,021.3)
Net currency position (2,486.2) 7,403.7 6,113.5 1,999.7 1,663.2 (335.0) – (0.9) 14,358.0
SDR-neutral position 2,486.2 (7,019.0) (6,378.0) (1,895.0) (1,552.2) – – – (14,358.0)
Net currency exposure on SDR-neutral basis – 384.7 (264.5) 104.7 111.0 (335.0) – (0.9) –

192 BIS 82nd Annual Report
As at 31 March 2011
SDR millionsSDR USD EUR GBP JPY CHF Gold Other
currenciesTotal
Assets
Cash and sight accounts with banks – 12.6 151.3 8.0 – 151.3 – 6.6 329.8
Gold and gold loans – 9.0 – – – – 36,628.2 – 36,637.2
Treasury bills – 2,304.0 29,737.0 397.2 36,796.9 5,337.0 – 2,360.0 76,932.1
Securities purchased under resale agreements – 394.8 37,559.5 7,799.6 5,710.0 – – 0.1 51,464.0
Loans and advances 171.7 8,460.0 10,937.4 1,368.1 1,062.4 544.4 – 1,626.4 24,170.4
Government and other securities – 29,061.1 21,378.5 3,769.8 1,209.5 35.3 – 1,533.7 56,987.9
Derivative financial instruments (36.5) 23,335.2 8,337.9 (408.9) (26,700.9) 327.2 (247.0) 1,183.3 5,790.3
Accounts receivable 0.1 6,969.2 684.9 426.6 – 8.0 – 527.5 8,616.3
Land, buildings and equipment 189.7 – – – – 1.1 – – 190.8
Total assets 325.0 70,545.9 108,786.5 13,360.4 18,077.9 6,404.3 36,381.2 7,237.6 261,118.8
Liabilities
Currency deposits (7,691.5) (140,478.2) (38,882.7) (10,083.1) (4,667.5) (680.8) – (4,601.8) (207,085.6)
Gold deposits – (5.6) – – – – (21,264.3) – (21,269.9)
Derivative financial instruments 4,221.7 79,073.2 (59,048.3) 126.6 (11,840.3) (5,452.7) (11,666.5) (2,373.2) (6,959.5)
Accounts payable – (1,964.2) (4,761.1) (1,491.8) – (275.6) – (265.4) (8,758.1)
Other liabilities – (66.6) (2.8) – – (305.3) – (0.7) (375.4)
Total liabilities (3,469.8) (63,441.4) (102,694.9) (11,448.3) (16,507.8) (6,714.4) (32,930.8) (7,241.1) (244,448.5)
Net currency and gold position (3,144.8) 7,104.5 6,091.6 1,912.1 1,570.1 (310.1) 3,450.4 (3.5) 16,670.3
Adjustment for gold investment assets – – – – – – (3,450.4) – (3,450.4)
Net currency position (3,144.8) 7,104.5 6,091.6 1,912.1 1,570.1 (310.1) – (3.5) 13,219.9
SDR-neutral position 3,144.8 (6,818.8) (6,196.9) (1,840.6) (1,508.4) – – – (13,219.9)
Net currency exposure on SDR-neutral basis – 285.7 (105.3) 71.5 61.7 (310.1) – (3.5) –

193BIS 82nd Annual Report
D. Economic capital for market risk
The Bank measures market risk based on a VaR methodology using a Monte Carlo simulation technique taking correlations between risk factors into account. Economic capital for market risk is also calculated following this methodology measured to the 99.995% confidence interval and assuming a one-year holding period. The Bank measures its gold price risk relative to changes in the USD value of gold. The foreign exchange risk component, resulting from changes in the USD exchange rate versus the SDR, is included in the measurement of foreign exchange risk. The table below shows the key figures of the Bank’s exposure to market risk in terms of economic capital utilisation over the past two financial years.
For the financial year 2012 2011
SDR millions Average High Low At 31 March Average High Low At 31 March
Economic capital utilisation for market risk 3,232.7 3,716.0 2,734.0 3,287.9 2,884.2 3,069.2 2,684.0 2,836.5
The table below provides further analysis of the Bank's market risk exposure by category of risk.
For the financial year 2012 2011
SDR millions Average High Low At 31 March Average High Low At 31 March
Gold price risk 2,345.6 2,741.6 1,835.5 2,501.3 1,956.7 2,121.0 1,830.6 1,909.8
Interest rate risk 1,565.2 1,660.6 1,463.6 1,560.4 1,617.7 1,760.7 1,456.1 1,542.2
Foreign exchange risk 923.0 1,095.7 788.9 894.2 797.0 874.6 666.3 814.6
Diversification effects (1,601.1) (1,809.2) (1,403.8) (1,668.0) (1,487.1) (1,711.4) (1,352.4) (1,430.1)
E. Minimum capital requirements for market risk
For the calculation of minimum capital requirements for market risk under the Basel II Framework, the Bank has adopted a banking book approach consistent with the scope and nature of its business activities. Consequently, market risk-weighted assets are determined for gold price risk and foreign exchange risk, but not interest rate risk. The related minimum capital requirement is derived using the VaR-based internal models method. Under this method, VaR calculations are performed using the Bank’s VaR methodology, assuming a 99% confidence interval, a 10-day holding period and a one-year historical observation period.
The actual minimum capital requirement is derived as the higher of the VaR on the calculation date and the average of the daily VaR measures on each of the preceding 60 business days (including the calculation date) subject to a multiplication factor of three plus a potential add-on depending on backtesting results. For the period under consideration, the number of backtesting outliers observed remained within the range where no add-on is required. The table below summarises the market risk development relevant to the calculation of minimum capital requirements and the related risk-weighted assets over the reporting period.
As at 31 March 2012 2011
SDR millions
VaR Risk- weighted
assets
Minimum capital
requirement
VaR Risk- weighted
assets
Minimum capital
requirement (A) (B) (A) (B)
Market risk, where (A) is derived as (B) / 8% 426.8 16,005.8 1,280.5 288.2 10,806.2 864.5

194 BIS 82nd Annual Report
5. Liquidity risk
Liquidity risk arises when the Bank may not be able to meet expected or unexpected current or future cash flows and collateral needs without affecting its daily operations or its financial condition.
Outstanding balances in the currency and gold deposits from central banks, international organisations and other public institutions are the key drivers of the size of the Bank’s balance sheet. The Bank has undertaken to repurchase at fair value certain of its currency deposit instruments at one or two business days’ notice. The Bank has developed a liquidity management framework based on a statistical model underpinned by conservative assumptions with regard to cash inflows and the liquidity of liabilities. Within this framework, the Board of Directors has set a limit for the Bank’s liquidity ratio which requires liquid assets to be at least 100% of the potential liquidity requirement. In addition, liquidity stress tests assuming extreme withdrawal scenarios are performed. These stress tests specify additional liquidity requirements to be met by holdings of liquid assets. The Bank’s liquidity has consistently been materially above its minimum liquidity ratio and the requirements of its stress tests.
The Bank’s currency and gold deposits, principally from central banks and international institutions, comprise 91% (2011: 93%) of its total liabilities. At 31 March 2012 currency and gold deposits originated from 172 depositors (2011: 171). Within these deposits, there are significant individual customer concentrations, with five customers each contributing in excess of 5% of the total on a settlement date basis (2011: four customers).
The following tables show the maturity profile of cash flows for assets and liabilities. The amounts disclosed are the undiscounted cash flows to which the Bank is committed.

195BIS 82nd Annual Report
As at 31 March 2012
SDR millionsUp to 1month
1 to 3months
3 to 6months
6 to 12months
1 to 2years
2 to 5years
5 to 10years
Over 10 years
Total
Assets
Cash and sight accounts with banks 4,077.8 – – – – – – – 4,077.8
Gold and gold loans 35,353.6 137.9 139.5 – – 284.4 – – 35,915.4
Treasury bills 10,035.9 30,652.9 8,256.7 3,576.1 – – – – 52,521.6
Securities purchased under resale agreements 27,593.1 4,686.9 – – – – – – 32,280.0
Loans and advances 12,204.2 8,127.7 1,142.4 – – – – – 21,474.3
Government and other securities 3,475.1 8,892.3 9,786.2 20,647.0 10,137.1 22,703.1 3,470.0 983.5 80,094.3
Total assets 92,739.7 52,497.7 19,324.8 24,223.1 10,137.1 22,987.5 3,470.0 983.5 226,363.4
Liabilities
Currency deposits
Deposit instruments repayable at 1–2 days’ notice (3,531.3) (24,460.6) (17,340.6) (15,139.2) (14,964.6) (23,677.2) (202.9) – (99,316.4)
Other currency deposits (56,016.8) (21,657.6) (9,272.2) (2,984.0) – – – – (89,930.6)
Gold deposits (19,204.8) – (138.5) – – (282.9) – – (19,626.2)
Securities sold short 61.2 8.0 (0.8) (1.6) (3.1) (9.3) (15.5) (124.3) (85.4)
Total liabilities (78,691.7) (46,110.2) (26,752.1) (18,124.8) (14,967.7) (23,969.4) (218.4) (124.3) (208,958.6)
Derivatives
Net settled
Interest rate contracts 20.1 179.9 313.3 333.4 391.9 240.9 (31.8) – 1,447.7
Gross settled
Exchange rate and gold price contracts
Inflows 41,207.3 52,261.0 19,830.5 10,073.7 – – – – 123,372.5
Outflows (40,756.6) (51,444.4) (19,642.6) (10,008.9) – – – – (121,852.5)
Subtotal 450.7 816.6 187.9 64.8 – – – – 1,520.0
Interest rate contracts
Inflows 1.1 13.5 2.0 270.7 245.7 788.6 – – 1,321.6
Outflows (0.3) (23.4) (8.5) (361.3) (310.3) (896.0) – – (1,599.8)
Subtotal 0.8 (9.9) (6.5) (90.6) (64.6) (107.4) – – (278.2)
Total derivatives 471.6 986.6 494.7 307.6 327.3 133.5 (31.8) – 2,689.5
Total future undiscounted cash flows 14,519.6 7,374.1 (6,932.6) 6,405.9 (4,503.2) (848.4) 3,219.8 859.2 20,094.3

196 BIS 82nd Annual Report
As at 31 March 2011
SDR millionsUp to 1month
1 to 3months
3 to 6months
6 to 12months
1 to 2years
2 to 5years
5 to 10years
Over 10 years
Total
Assets
Cash and sight accounts with banks 329.8 – – – – – – – 329.8
Gold and gold loans 35,402.2 0.2 116.9 235.6 675.2 241.4 – – 36,671.5
Treasury bills 20,560.7 34,860.3 9,809.3 11,493.0 – – – – 76,723.3
Securities purchased under resale agreements 37,247.3 6,508.0 1,922.6 – – – – – 45,677.9
Loans and advances 10,979.7 11,508.3 1,159.4 – – – – – 23,647.4
Government and other securities 2,714.6 3,182.7 4,433.6 11,945.4 12,101.3 20,634.4 5,019.1 608.1 60,639.2
Total assets 107,234.3 56,059.5 17,441.8 23,674.0 12,776.5 20,875.8 5,019.1 608.1 243,689.1
Liabilities
Currency deposits
Deposit instruments repayable at 1–2 days’ notice (7,108.9) (15,075.9) (17,684.3) (16,343.5) (18,205.4) (21,450.7) (2,331.1) – (98,199.8)
Other currency deposits (63,470.8) (21,510.5) (12,675.9) (7,303.5) (3.2) – – – (104,963.9)
Gold deposits (20,714.5) – – (82.4) (236.3) (239.9) – – (21,273.1)
Securities sold short (0.4) (0.7) (1.1) (2.1) (4.2) (12.7) (21.4) (71.3) (113.9)
Total liabilities (91,294.6) (36,587.1) (30,361.3) (23,731.5) (18,449.1) (21,703.3) (2,352.5) (71.3) (224,550.7)
Derivatives
Net settled
Interest rate contracts 99.2 243.4 410.3 447.1 634.0 318.3 4.5 – 2,156.8
Gross settled
Exchange rate and gold price contracts
Inflows 42,049.4 52,875.9 21,374.8 11,771.3 – – – – 128,071.4
Outflows (42,703.7) (54,108.8) (21,993.1) (12,287.9) – – – – (131,093.5)
Subtotal (654.3) (1,232.9) (618.3) (516.6) – – – – (3,022.1)
Interest rate contracts
Inflows 0.8 50.4 1.4 39.1 289.4 1,023.5 25.1 – 1,429.7
Outflows – (54.5) (9.9) (76.8) (400.7) (1,215.6) (34.7) – (1,792.2)
Subtotal 0.8 (4.1) (8.5) (37.7) (111.3) (192.1) (9.6) – (362.5)
Total derivatives (554.3) (993.6) (216.5) (107.2) 522.7 126.2 (5.1) – (1,227.8)
Total future undiscounted cash flows 15,385.4 18,478.8 (13,136.0) (164.7) (5,149.9) (701.3) 2,661.5 536.8 17,910.6

197BIS 82nd Annual Report
The Bank writes options in the ordinary course of its banking business. The table below discloses the fair value of the written options analysed by exercise date:
Written options
SDR millionsUp to 1month
1 to 3months
3 to 6months
6 to 12months
1 to 2years
2 to 5years
5 to 10years
Over10 years
Total
As at 31 March 2012 (0.2) – – – (0.2) (2.8) – – (3.2)
As at 31 March 2011 (38.6) (0.1) – (5.1) – (5.0) – – (48.8)
The table below shows the contractual expiry date of the credit commitments as at the balance sheet date:
Contractual expiry date
SDR millionsUp to 1month
1 to 3months
3 to 6months
6 to 12months
1 to 2years
2 to 5years
5 to 10years
Maturityundefined
Total
As at 31 March 2012 – – – 193.8 – – – 2,376.8 2,570.6
As at 31 March 2011 – – – 368.4 – – – 1,919.2 2,287.7
6. Operational risk
Operational risk is defined by the Bank as the risk of financial loss, or damage to the Bank’s reputation, or both, resulting from one or more risk causes, as outlined below:
• Human factors: insufficient personnel, lack of requisite knowledge, skills or experience, inadequate training and development, inadequate supervision, loss of key personnel, inadequate succession planning, or lack of integrity or ethical standards.
• Failed or inadequate processes: a process is poorly designed or unsuitable, or is not properly documented, understood, implemented, followed or enforced.
• Failed or inadequate systems: a system is poorly designed, unsuitable or unavailable, or does not operate as intended.
• External events: the occurrence of an event having an adverse impact on the Bank but outside its control.
Operational risk includes legal risk, but excludes strategic risk.
The Bank’s operational risk management framework, policies and procedures comprise the management and measurement of operational risk, including the determination of the relevant key parameters and inputs, business continuity planning and the monitoring of key risk indicators.
The Bank has established a procedure of immediate reporting for operational risk-related incidents. The Compliance and Operational Risk Unit develops action plans with the respective units and follows up on their implementation on a regular basis.
For the measurement of operational risk economic capital and operational risk-weighted assets, the Bank has adopted a VaR approach using a Monte Carlo simulation technique that is consistent with the advanced measurement approach proposed under the Basel II Framework. In line with the assumptions of the Basel II Framework, the quantification of operational risk does not take reputational risk into account. Internal and external loss data, scenario estimates and control self-assessments to reflect changes in the business and control environment of the Bank are key inputs in the calculations. In quantifying its operational risk, the Bank does not take potential protection it may obtain from insurance into account.

198 BIS 82nd Annual Report
A. Economic capital for operational risk
Consistent with the parameters used in the calculation of economic capital for financial risk, the Bank measures economic capital for operational risk to the 99.995% confidence interval assuming a one-year holding period. The table below shows the key figures of the Bank’s exposure to operational risk in terms of economic capital utilisation over the past two financial years.
For the financial year 2012 2011
SDR millions Average High Low At 31 March Average High Low At 31 March
Economic capital utilisation for operational risk 700.0 700.0 700.0 700.0 643.8 700.0 475.0 700.0
B. Minimum capital requirements for operational risk
In line with the key parameters of the Basel II Framework, the calculation of the minimum capital requirement for operational risk is determined assuming a 99.9% confidence interval and a one-year time horizon. The table below shows the minimum capital requirements for operational risk and related risk-weighted assets.
As at 31 March 2012 2011
VaR Risk- weighted
assets
Minimum capital
requirement
VaR Risk- weighted
assets
Minimum capital
requirementSDR millions (A) (B) (A) (B)
Operational risk,where (A) is derived as (B) / 8% 341.6 4,270.3 341.6 300.8 3,760.4 300.8

199BIS 82nd Annual Report
Independent auditor’s report
to the Board of Directors and to the General Meetingof the Bank for International Settlements, Basel
We have audited the accompanying financial statements of the Bank for International Settlements, which comprise the balance sheet as at 31 March 2012, and the profit and loss account, the statement of cash flows for the year then ended, and a summary of significant accounting policies and other explanatory information.
Management’s Responsibility for the Financial Statements
Management is responsible for the preparation and fair presentation of these financial statements in accordance with the Statutes and with the principles of valuation described under significant accounting policies in the notes, and for such internal control as management determines is necessary to enable the preparation of financial statements that are free from material misstatement, whether due to fraud or error.
Auditor’s Responsibility
Our responsibility is to express an opinion on these financial statements based on our audit. We conducted our audit in accordance with International Standards on Auditing. Those Standards require that we comply with ethical requirements and plan and perform the audit to obtain reasonable assurance about whether the financial statements are free from material misstatement. An audit involves performing procedures to obtain audit evidence about the amounts and disclosures in the financial statements. The procedures selected depend on the auditor’s judgment, including the assessment of the risks of material misstatement of the financial statements, whether due to fraud or error. In making those risk assessments, the auditor considers internal control relevant to the entity’s preparation and fair presentation of the financial statements in order to design audit procedures that are appropriate in the circumstances, but not for the purpose of expressing an opinion on the effectiveness of the entity’s internal control. An audit also includes evaluating the appropriateness of accounting policies used and the reasonableness of accounting estimates made by management, as well as evaluating the overall presentation of the financial statements.We believe that the audit evidence we have obtained is sufficient and appropriate to provide a basis for our audit opinion.
Opinion
In our opinion, the financial statements give a true and fair view of the financial position of the Bank for International Settlements as at 31 March 2012 and of its financial performance and its cash flows for the year then ended in accordance with the accounting principles described in the notes to the financial statements and the Statutes of the Bank.
Deloitte AG
Mark D. Ward Erich Schärli
Zurich, 7 May 2012

200 BIS 82nd Annual Report
Five-year graphical summary
Operating profit SDR millions
Net profit SDR millions
Net interest earned on currency investments SDR millions
Average currency deposits (settlement date basis) SDR billions
On investment of the Bank’s equityOn the currency banking book
Average number of employees Full-time equivalent
Operating expense CHF millions
Depreciation and adjustments for post-employment benefits and provisions Office and other expenses – budget basisManagement and staff – budget basis
0
500
1,000
1,500
0
500
1,000
1,500
2007/08 2008/09 2009/10 2010/11 2011/12 2007/08 2008/09 2009/10 2010/11 2011/12
2007/08 2008/09 2009/10 2010/11 2011/12 2007/08 2008/09 2009/10 2010/11 2011/12
2007/08 2008/09 2009/10 2010/11 2011/12 2007/08 2008/09 2009/10 2010/11 2011/12
The financial information in the top four panels has been restated to reflect a change in the accounting policy made in the previous years’ accounts.
–500
0
500
1,000
1,500
0
50
100
150
200
0
100
200
300
400
500
600
0
80
160
240
320
400


Printed in Switzerland Werner Druck AG, Basel


![Tris(ethylenediammonium) bis[(2-aminoethyl)ammonium] bis ...journals.iucr.org/e/issues/2010/05/00/wm2326/wm2326.pdf · Tris(ethylenediammonium) bis[(2-amino-ethyl)ammonium] bis[bis(l](https://static.fdocuments.in/doc/165x107/5e49e7fe0e042522d772f14a/trisethylenediammonium-bis2-aminoethylammonium-bis-trisethylenediammonium.jpg)