Birthplace Diversity and Economic Prosperity - MPC · Birthplace Diversity and Economic Prosperity...
82
Birthplace Diversity and Economic Prosperity Alberto Alesina, Johann Harnoss and Hillel Rapoport June 2013 Alesina, Harnoss and Rapoport () Birthplace Diversity June 2013 1 / 68
Transcript of Birthplace Diversity and Economic Prosperity - MPC · Birthplace Diversity and Economic Prosperity...

Birthplace Diversity and Economic Prosperity
Alberto Alesina, Johann Harnoss and Hillel Rapoport
June 2013
Alesina, Harnoss and Rapoport () Birthplace Diversity June 2013 1 / 68

Plan
1 Introduction2 Skill complementarities and diversity3 An index of birthplace diversity4 Empirical Analysis5 IdentiÖcation6 Conclusion
Alesina, Harnoss and Rapoport () Birthplace Diversity June 2013 2 / 68

Introduction
Foreign-born individuals now represent on average ten percent of theworkforce of the OECD, a twofold increase in twenty years, and athreefold increase for the highly educated and skilled
This growing diversity in terms of birthplaces at the country level mayhave far reaching economic implications as economic theory suggeststhat higher diversity could lead to beneÖcial skill complementarities incertain production processes but also to ine¢ciencies via highertransaction costs due to mistrust and lack of social cohesion.
The empirical literature has so far focused on ethnic, linguistic, andgenetic diversity.
Alesina, Harnoss and Rapoport () Birthplace Diversity June 2013 3 / 68

Introduction
Ethnic and linguistic fractionalization: has been shown to have anegative e§ect on economic growth (Easterly and Levine, 1997,Collier 2001, Alesina et al., 2003) in cross-country comparisons.Interestingly, however, these e§ects tend to converge to zero or eventurn mildly positive in richer countries (Alesina and La Ferrara, 2005).
Genetic and cultural diversity:
- Ashraf and Galor (2013a) Önd an inverted u-shaped relationshipbetween genetic diversity and productivity, indicating the trade-o§between beneÖcial forces of diversity expanding the technologyfrontier and detrimental ones due to communication and coordinationproblems.- Ashraf and Galor (2011) Önd that cultural diversity (based on WorldValues Survey data) is positively correlated with contemporarydevelopment and suggest that cultural diversity facilitated thetransition from agricultural to industrial societies.
Alesina, Harnoss and Rapoport () Birthplace Diversity June 2013 4 / 68
Introduction
We re-address this question using a new measure and a newperspective: birthplace diversity.
Ethnic and birthplace diversity are empirically (perhaps surprisingly)almost completely uncorrelated; same for genetic and birthplacediversity.
Also conceptual di§erences: First-generation immigrants, who grewup in di§erent cultural contexts, are a more diverse group thansecond-generation immigrants, who grew up in the same culturalenvironment, went to the same schools, etc.
Birthplace diversity measures thus have the potential to identify neweconomic e§ects of diversity.
However, the empirical evidence on birthplace diversity anddevelopment is scant and limited to the context of the United States.
Alesina, Harnoss and Rapoport () Birthplace Diversity June 2013 5 / 68

Introduction
Ottaviano and Peri (2006) construct a measure of diversity for1970-90 using migration data on US metropolitan areas; Önd positivee§ects on the productivity of native workers measured by their wages.
Peri (2012) Önds positive e§ects of the diversity coming fromimmigration on the productivity of US states. Interpretation: unskilledmigrants promote e¢cient task-specialization and adoption ofunskilled-e¢cient technologies, more so when immigration is diverse.
Ager and Br¸ckner (2011) study the link between immigration,diversity and growth in US counties in 1870-1920. They Önd thatfractionalization increases output while polarization decreases it.
Finally, a paper by Ortega and Peri (2013) developed independentlyfrom this paper also analyzes the e§ect of openness to and diversity oftrade v. immigration, showing that the latter dominates the former.
Alesina, Harnoss and Rapoport () Birthplace Diversity June 2013 6 / 68

Introduction
Three contributions:
Data: we construct and discuss the properties of a new index ofbirthplace diversity for the workforce of 195 countries in 1990 and2000, disaggregated by skill/education level, and computed both forthe workforce as a whole and for its foreign-born component. Weargue this is a fundamentally di§erent dimension of diversity.
Empirics: we investigate the relationship between birthplace diversityand economic development and Önd that birthplace diversity ofimmigrants is positively related to productivity, this e§ect beingstronger for skilled migrants and in richer countries.
IdentiÖcation: we make progress toward solving endogeneity issues byspecifying a gravity model to predict the diversity of immigration andconÖrm our initial Öndings in a range of 2SLS models.
Alesina, Harnoss and Rapoport () Birthplace Diversity June 2013 7 / 68
Plan
1 Introduction2 Skill complementarities and diversity3 An index of birthplace diversity4 Empirical Analysis5 IdentiÖcation6 Conclusion
Alesina, Harnoss and Rapoport () Birthplace Diversity June 2013 8 / 68

Skill complementarities and diversity
The costs and beneÖts of diversity: theory
People born in di§erent places have di§erent productive skills becausethey have been exposed to di§erent experiences and perspectives thathelp them interpret and solve problems di§erently.These di§erences can be complementary. Alesina et al. (2000)formalize this using a Dixit-Stiglitz production function where outputsincrease in the variety of inputs (e.g., workers).Lazear (1999a,b) includes beneÖts from diversity via productioncomplementarities from relevant disjoint information sets and costsvia barriers to communication that rise in the diversity of workers,suggesting there is an optimal degree of diversity. Also, diverse groupsof immigrants have stronger incentives to assimilate.Hong and Page (2001) emphasize cognitive di§erences betweenpeopleís internal perspectives (interpretation of a complex problem)and heuristics (algorithms to solve these problems), showing diversitycan compensate lower average skills in a group/team.
Alesina, Harnoss and Rapoport () Birthplace Diversity June 2013 9 / 68

Skill complementarities and diversity
The costs and beneÖts of diversity: micro/experimental evidence
Management and organization literature: Önds diversity (in terms ofgender, education, tenure, nationality) being often beneÖcial forperformance but also decreasing team cohesion and increasingcoordination costs (Milliken and Martins, 1996, OíReilly et al., 1989,Hambrick et al., 1996). Recent experimental evidence with businessschool students Hoogendoorn and van Praag (2012).Micro-studies using Örm-level data:ñ Ethnic diversity of workers has negative e§ect on plant performancein Kenya, as inter-ethnic rivalries lead to distortionary misallocation ofresources (Hjort, 2012).ñ Birthplace diversity of workers has strong positive e§ect onplant-level productivity in Germany (Trax, Brunow, Suedekum 2012),particularly strong in innovation-intensive manufacturing andhigh-tech sectors. Similar evidence for Austria (Boheim et al., 2012),Danemark (Parrotta et al., 2012), Holland (Ozgen et al., 2013).
Alesina, Harnoss and Rapoport () Birthplace Diversity June 2013 10 / 68

Skill complementarities and diversity
The costs and beneÖts of diversity: macro evidence
Easterly and Levine (1997) show that ethnic fragmentation isassociated with lower economic growth in Africa. Collier (1999, 2001)adds that this is less so in the presence of democratic institutions.Alesina and La Ferrara (2000, 2002) stress the role of trust, showingthat individuals in racially diverse cities in the US participate lessfrequently in social activities, trust their neighbors less and have lowerpreferences for redistribution. This leads to lower provision ofproductive public goods (Alesina, Baqir and Easterly, 1999).Alesina, Michalopoulos and Papaioannou (2012) stress the inequalitydimension of ethnic diversity (i.e., it is the interplay between ethnicfractionalization and ethnic inequality that leads to conáict). See alsoDesmet, Ortun and Wacziarg (2012) on the role of linguistic distance.Esteban, Mayoral and Ray (2011, 2012) Önd polarization andfractionalization to correlate positively with conáicts over public andprivate goods, respectively.
Alesina, Harnoss and Rapoport () Birthplace Diversity June 2013 11 / 68

Skill complementarities and diversity
Measuring diversity
A populationís diversity is commonly measured by fractionalization(Alesina et al. 2003, Fearon 2003) and polarization indices (Estebanand Ray 1994, Reynal-Querol 2002).
HerÖndahl-type fractionalization indices (which attain their maximumwhen each individual belongs to a di§erent group) have been shownto work better in models of economic growth while polarizationindices (which attain maximum with two equally large groups) havebeen shown to be adequate predictors of civil conáicts.
Ethnic fractionalization measures donít distinguish, for example,between a 1rst and 2nd-generation Italian in the US, or betweenItalians and Germans ("Caucasiansî); linguistic fractionalization moreaccurate in separating language groups but also fails to distinguishbetween 1rst and 2nd-generation.
Alesina, Harnoss and Rapoport () Birthplace Diversity June 2013 12 / 68

Skill complementarities and diversity
Measuring diversity
A dimension of diversity among people that remains largelyunderstudied is the diversity caused by di§erences in peopleís countryof birth. If early pre-working age years are formative for oneís ownvalues, perspectives and skills these di§erences last a lifetime and mayserve as variation to be exploited for economic analysis.
Shaped by di§erent education systems and social values, this type ofdiversity is more likely to result in production functioncomplementarities than deep-seated di§erences in skin color orlanguage spoken at home.
To explore this dimension of diversity, this paper introduces a newdiversity index which is more likely to be closer to the correct onewhen we try to explain skill complementarity: diversity in peopleísbirthplaces.
Alesina, Harnoss and Rapoport () Birthplace Diversity June 2013 13 / 68

Plan
1 Introduction2 Skill complementarities and diversity3 An index of birthplace diversity4 Empirical Analysis5 IdentiÖcation6 Conclusion
Alesina, Harnoss and Rapoport () Birthplace Diversity June 2013 14 / 68

An index of birthplace diversity: data
Our computation of birthplace diversity indices relies on the Docquier,Ozden, Parsons and Artuc (2012) (henceforth DOPA) data set, whichallows for characterising the size, origin-mix, and skill structure of acountryís foreign-born labor force.
It provides bilateral data on immigration by country of birth, skillcategory (skilled = college educated v. unskilled) and gender, for 195receiving countries in 1990 and 2000.
Immigrants are deÖned as foreign-born individuals aged 25 or more atcensus or survey date.
Caveats: illegal immigration, children immigrants, and heterogeneityin skill levels (origin e§ects).
Alesina, Harnoss and Rapoport () Birthplace Diversity June 2013 15 / 68

An index of birthplace diversity: decomposition
We base our birthplace diversity measure on the HerÖndahl diversityindex. This index measures the probability that two individuals drawnrandomly have di§erent countries of birth.
Let si refer to the share in the total population of individuals born incountry i with i = 1, . . . , I . In particular, i = 1 for natives.The fractionalization index Divpop may be expressed as:
Divpop =I
Âi=1si (1 si ) = 1
I
Âi=1(si )
2 (1)
A given level of Divpop may come from a small-diverse or from alarge-homogenous pool of immigrants. It is therefore useful todecompose Divpop to highlight these di§erences.
Alesina, Harnoss and Rapoport () Birthplace Diversity June 2013 16 / 68

An index of birthplace diversity: decomposition
We therefore decompose our diversity index asDivpop = Divbetween +Divwithin, where Divbetween is the diversity fromimmigration (as if all immigrants were from the same country) andDivwithin the additionnal diversity brought by immigrants :
Divbetween = s1 (1 s1) + (1 s1) s1 (2)
Divwithin =I
Âi=2[si ((1 si ) s1)] (3)
However, this separation is not yet fully satisfying, since it does notseparate clearly between size and variety e§ects: Divwithin still dependson s1 - the share of natives since ÂI
i=2 si = (1 s1). We thus proceedto re-scale the Divwithin component so that it does not depend on s1.
Alesina, Harnoss and Rapoport () Birthplace Diversity June 2013 17 / 68

An index of birthplace diversity: decomposition
After transformations, we obtain:
Divpop = Divbetween + (1 s1)2 DivMig (4)
where
DivMig =J
Âj=2
hsj (1 sj )
i(5)
We can then rewrite (4) in terms of sF , the share of immigrants (deÖnedas foreign-born) and deÖne sF = (1 s1):
Divpop = 2 sF (1 sF ) + (sF )2 DivMig (6)
We have thus an expression of Divpop purely as a function of the size (oropenness to) and diversity of immigration, sF and DivMig .
Alesina, Harnoss and Rapoport () Birthplace Diversity June 2013 18 / 68
An index of birthplace diversity: descriptive analysis
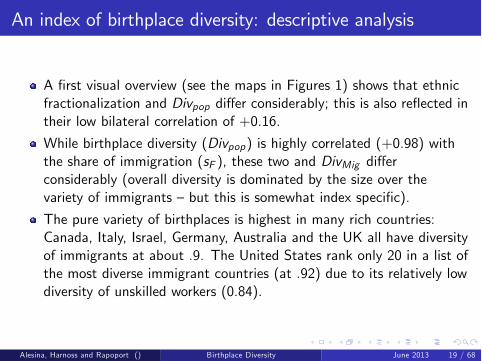
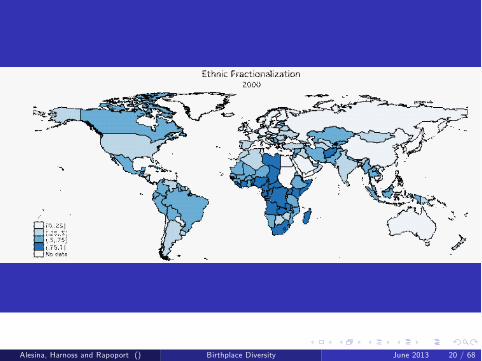
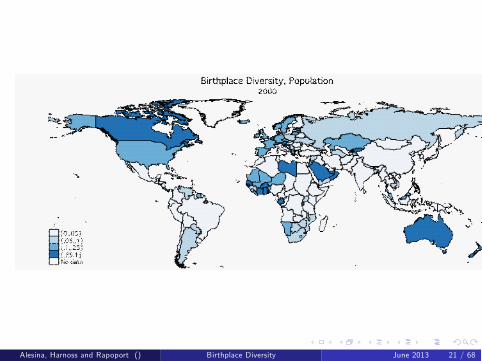
A Örst visual overview (see the maps in Figures 1) shows that ethnicfractionalization and Divpop di§er considerably; this is also reáected intheir low bilateral correlation of +0.16.
While birthplace diversity (Divpop) is highly correlated (+0.98) withthe share of immigration (sF ), these two and DivMig di§erconsiderably (overall diversity is dominated by the size over thevariety of immigrants ñ but this is somewhat index speciÖc).
The pure variety of birthplaces is highest in many rich countries:Canada, Italy, Israel, Germany, Australia and the UK all have diversityof immigrants at about .9. The United States rank only 20 in a list ofthe most diverse immigrant countries (at .92) due to its relatively lowdiversity of unskilled workers (0.84).
Alesina, Harnoss and Rapoport () Birthplace Diversity June 2013 19 / 68
Alesina, Harnoss and Rapoport () Birthplace Diversity June 2013 20 / 68
Alesina, Harnoss and Rapoport () Birthplace Diversity June 2013 21 / 68

Alesina, Harnoss and Rapoport () Birthplace Diversity June 2013 22 / 68

Alesina, Harnoss and Rapoport () Birthplace Diversity June 2013 23 / 68

Alesina, Harnoss and Rapoport () Birthplace Diversity June 2013 24 / 68

!!Birthplace!Diversity!and!Gene3c!Frac3onaliza3on!

Alesina, Harnoss and Rapoport () Birthplace Diversity June 2013 25 / 68

Alesina, Harnoss and Rapoport () Birthplace Diversity June 2013 26 / 68

An index of birthplace diversity: descriptive analysis
Correlation between ethnic fractionalization and birthplace diversity ofimmigrants very low (-.01 overall) and even negative at - .2 (in 2000)for skilled immigrants. Similarly, genetic diversity and birthplacediversity do not relate much (+.08 for diversity overall and -.08 forskilled diversity. Hence the "new dimension" claim.Correlation between sF and DivMig surprisingly low, suggesting thatthe amount of immigration (size) and its composition (variety) arelargely independent (holds irrespective of country size). But positivecorrelation when we look at Örst di§erences: in the 1990s, the varietyof immigrants rose when a country experienced an ináow ofimmigrants (true for skilled (+.22) but not for unskilled immigrants(bilateral correlation +.06). This is most likely due to the role ofdiaspora/immigrant networks.Skilled and unskilled diversity are highly correlated overall, withcorrelation coe¢cient of +0.78 for the year 2000 (see the last panelof Figure 2). There are some interesting deviations (eg, the US).
Alesina, Harnoss and Rapoport () Birthplace Diversity June 2013 27 / 68
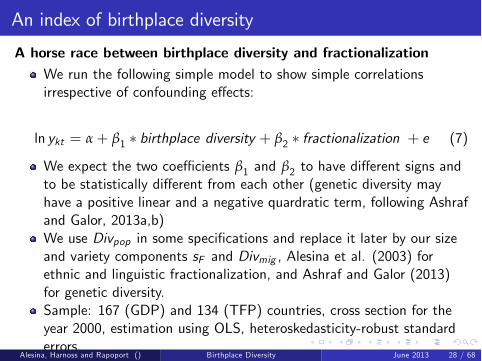
An index of birthplace diversity
A horse race between birthplace diversity and fractionalizationWe run the following simple model to show simple correlationsirrespective of confounding e§ects:
ln ykt = a+ b1 birthplace diversity + b2 fractionalization + e (7)
We expect the two coe¢cients b1 and b2 to have di§erent signs andto be statistically di§erent from each other (genetic diversity mayhave a positive linear and a negative quardratic term, following Ashrafand Galor, 2013a,b)We use Divpop in some speciÖcations and replace it later by our sizeand variety components sF and Divmig , Alesina et al. (2003) forethnic and linguistic fractionalization, and Ashraf and Galor (2013)for genetic diversity.Sample: 167 (GDP) and 134 (TFP) countries, cross section for theyear 2000, estimation using OLS, heteroskedasticity-robust standarderrors.
Alesina, Harnoss and Rapoport () Birthplace Diversity June 2013 28 / 68

An index of birthplace diversity
A horse race between birthplace diversity and fractionalization
We present results for GDP/capita and TFP/capita in Table 4a/b.
The results conÖrm our main hypothesis: both measures of ethnic,linguistic and genetic fractionalization enter negatively (or U-shaped)whereas birthplace diversity (Divpop) enters positively (at 1%signiÖcance level) in all models.
All fractionalization measures turn (signiÖcantly) more negative oncebirthplace diversity is controlled for ñ s4uggesting that otherestablished measures of fractionalization capture some positive e§ectsof birthplace diversity if used in isolation.
Most importantly, our size and variety components both relatepositively to development and remain highly signiÖcant when enteredjointly, a¢rming the relevance of both size and variety of immigration.
Alesina, Harnoss and Rapoport () Birthplace Diversity June 2013 29 / 68
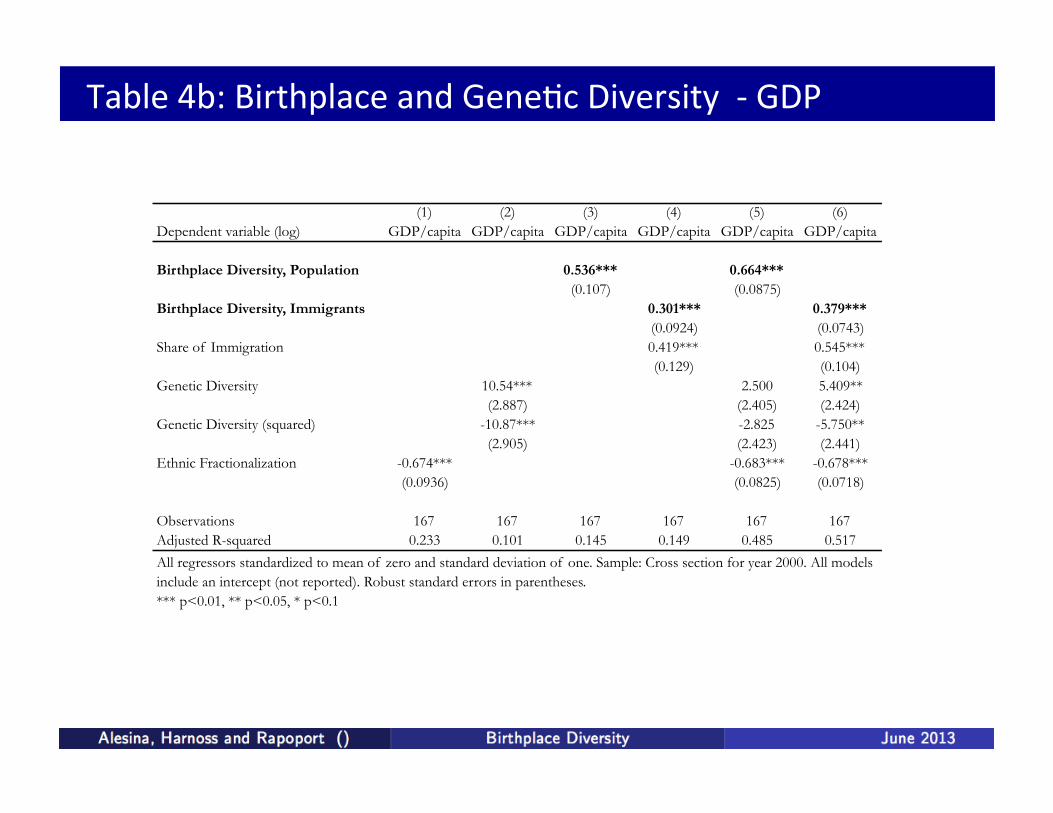
!!Table!4b:!Birthplace!and!Gene3c!Diversity!!8!GDP!
(1) (2) (3) (4) (5) (6)Dependent variable (log) GDP/capita GDP/capita GDP/capita GDP/capita GDP/capita GDP/capita
Birthplace Diversity, Population 0.536*** 0.664***(0.107) (0.0875)
Birthplace Diversity, Immigrants 0.301*** 0.379***(0.0924) (0.0743)
Share of Immigration 0.419*** 0.545***(0.129) (0.104)
Genetic Diversity 10.54*** 2.500 5.409**(2.887) (2.405) (2.424)
Genetic Diversity (squared) -10.87*** -2.825 -5.750**(2.905) (2.423) (2.441)
Ethnic Fractionalization -0.674*** -0.683*** -0.678***(0.0936) (0.0825) (0.0718)
Observations 167 167 167 167 167 167Adjusted R-squared 0.233 0.101 0.145 0.149 0.485 0.517
*** p<0.01, ** p<0.05, * p<0.1
All regressors standardized to mean of zero and standard deviation of one. Sample: Cross section for year 2000. All models include an intercept (not reported). Robust standard errors in parentheses.

(1) (2) (3) (4) (5) (6)Dependent variable (log) TFP/capita TFP/capita TFP/capita TFP/capita TFP/capita TFP/capita
Birthplace Diversity, Population 0.309*** 0.370***(0.0974) (0.0706)
Birthplace Diversity, Immigrants 0.273*** 0.275***(0.0696) (0.0599)
Share of Immigration 0.211* 0.280***(0.107) (0.0762)
Genetic Diversity 8.119*** 2.690 4.398**(2.087) (1.821) (1.844)
Genetic Diversity (squared) -8.393*** -2.931 -4.636**(2.098) (1.838) (1.861)
Ethnic Fractionalization -0.525*** -0.489*** -0.472***(0.0648) (0.0635) (0.0545)
Observations 134 134 134 134 134 134Adjusted R-squared 0.309 0.141 0.078 0.116 0.476 0.520
*** p<0.01, ** p<0.05, * p<0.1
All regressors standardized to mean of zero and standard deviation of one. Sample: Cross section for year 2000. All models include an intercept (not reported). Robust standard errors in parentheses.
!!Table!4b:!Birthplace!and!Gene3c!Diversity!!8!TFP!

Plan
1 Introduction2 Skill complementarities and diversity3 An index of birthplace diversity4 Empirical Analysis5 IdentiÖcation6 Conclusion
Alesina, Harnoss and Rapoport () Birthplace Diversity June 2013 31 / 68

Empirical analysis: model and data
In this section we test whether birthplace diversity is positively relatedto economic development, conditional on a range of confoundingfactors:
ln ykt = a+ b1 diversity migrantsskt+b2 share immigrationskt+b3 origin e§ectsskt+b4 years of schoolingkt+b5 market size controlskt+b6 Gkt + b7 Dk + b8 Fkt + b9 Ykt + ht + e(8)
where Gkt is a vector of geographic characteristics, Dk is a vector offractionalization measures, Fkt is a control for institutional development,Ykt is a vector of controls for trade openness and trade diversity, and ht isa time Öxed-e§ect. We use indices s for skill levels (overall, skilled,unskilled), t for time (1990, 2000) and k for countries.Alesina, Harnoss and Rapoport () Birthplace Diversity June 2013 32 / 68

Empirical analysis: model and data
The results from our decomposition as well as our previous analysispoint to the need to separate the share of foreigners, sF , and thediversity of immigrants, DivMig , to isolate size and variety e§ects.
An alternative speciÖcation with sub-samples for below/above medianshare of immigrants shows consistently higher positive estimates fordiversity ñ see various robustness checks (e.g., Table 10) to ensurethat our results are robust to the exclusion of small countries and ofcountries with very low immigration.
Alesina, Harnoss and Rapoport () Birthplace Diversity June 2013 33 / 68

Empirical analysis: model and data
We control for a very wide range of potential confounding e§ects:standard controls (e.g., education, population and area sizes,landlocked dummy) as well as additional control groups for tradestructure, fractionalization, geography, and institutions.Trade: we use real trade openness from PWT 7.0 and also control forthe structure of trade by constructing a measure of trade diversity(HerÖndahl index of exports and imports based on Feenstra et al.,2005).Fractionalization: both ethnic, linguistic and genetic fractionalization.Institutions: Polity-IV index of institutional qualityGeography: absolute latitude, malaria intensity and share ofpopulation living within 100km of an ice-free coast. We test therobustness of our results to alternative geographical speciÖcations,following Rodriguez and Rodrik (2001).We thus end up with a highly structured model (with our keyvariables and 15 covariates) and a short panel of 93 countries in 1990and 2000.
Alesina, Harnoss and Rapoport () Birthplace Diversity June 2013 34 / 68
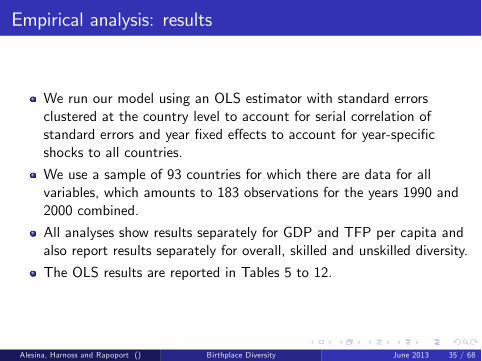
Empirical analysis: results
We run our model using an OLS estimator with standard errorsclustered at the country level to account for serial correlation ofstandard errors and year Öxed e§ects to account for year-speciÖcshocks to all countries.
We use a sample of 93 countries for which there are data for allvariables, which amounts to 183 observations for the years 1990 and2000 combined.
All analyses show results separately for GDP and TFP per capita andalso report results separately for overall, skilled and unskilled diversity.
The OLS results are reported in Tables 5 to 12.
Alesina, Harnoss and Rapoport () Birthplace Diversity June 2013 35 / 68
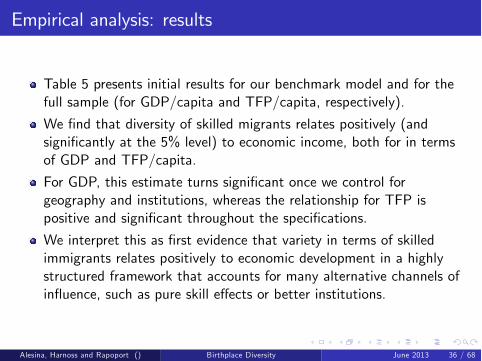
Empirical analysis: results
Table 5 presents initial results for our benchmark model and for thefull sample (for GDP/capita and TFP/capita, respectively).
We Önd that diversity of skilled migrants relates positively (andsigniÖcantly at the 5% level) to economic income, both for in termsof GDP and TFP/capita.
For GDP, this estimate turns signiÖcant once we control forgeography and institutions, whereas the relationship for TFP ispositive and signiÖcant throughout the speciÖcations.
We interpret this as Örst evidence that variety in terms of skilledimmigrants relates positively to economic development in a highlystructured framework that accounts for many alternative channels ofináuence, such as pure skill e§ects or better institutions.
Alesina, Harnoss and Rapoport () Birthplace Diversity June 2013 36 / 68

Empirical analysis: results
We establish that the skill dimension of diversity matters: skilleddiversity seems to exhibit more robust positive e§ects than diversity ofunskilled workers.
The share of immigrants, the other key determinant of overalldiversity, relates positively and signiÖcantly to income for unskilledimmigrants only (which drives the positive relationship for overallimmigrants).
If there were production function e§ects of diversity, we should Öndthat they are stronger in a subset of economies with more advancedproduction processes, which are closer to the technological frontier.We thus separate our sample into countries above and below themedian GDP/TFP per capita in 1970 ñ see Table 6-7.
Alesina, Harnoss and Rapoport () Birthplace Diversity June 2013 37 / 68
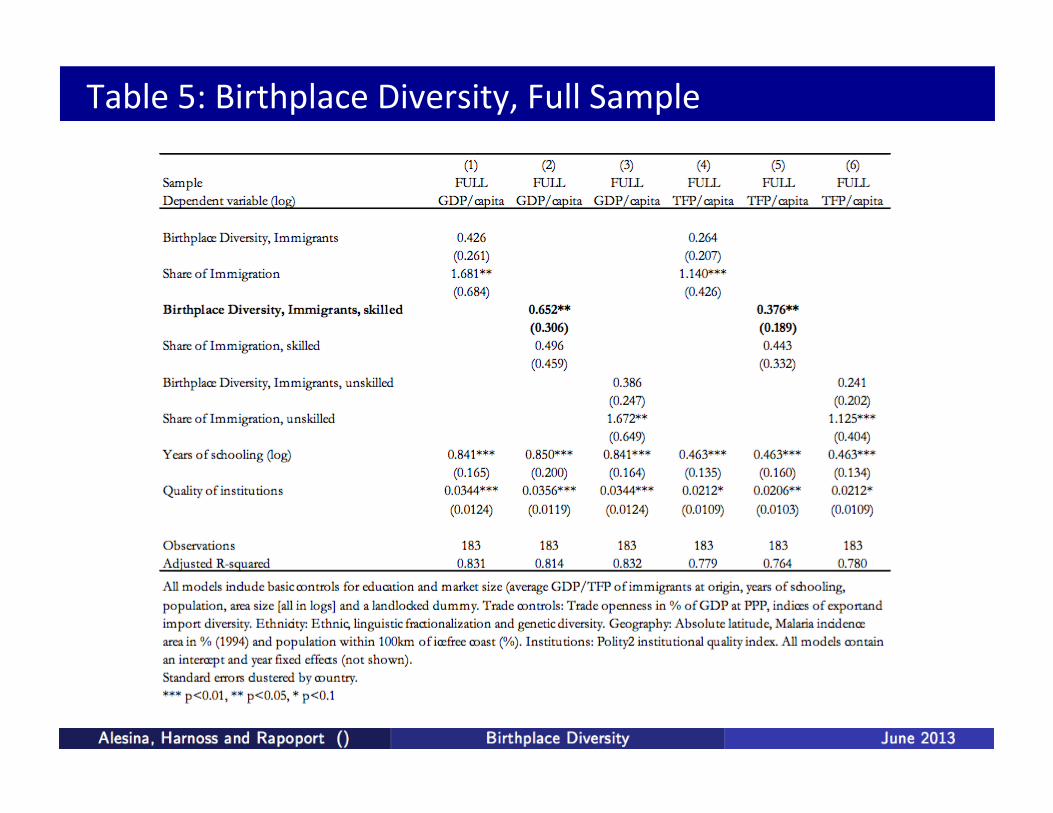
!!Table!5:!Birthplace!Diversity,!Full!Sample!

Empirical analysis: results
In Table 6, we report our results for rich countries only, and for poorcountries only in Table 7
For rich countries we Önd the same results as in our overall sample,but the magnitudes on skilled diversity are a bit higher andsigniÖcance is also higher at the 1% level.
On the contrary, for the poor countries sample we Önd no signiÖcantrelationship whatsoever between variety of immigrants and economicdevelopment.
For robustness, we extend our split sample approach using patentdata (Table 8):
Subsample countries with above-mean patent intensity (2000): Wereplicate our rich country results at 1% signiÖcance level.Patent intensity as dependent variable (2000): Diversity of skilledimmigrants relates positively to patent intensity, while diversity ofunskilled immigrants does not (signiÖcantly).
Alesina, Harnoss and Rapoport () Birthplace Diversity June 2013 39 / 68

!!Table!6:!Birthplace!Diversity,!RICH!countries!

!!Table!7:!Birthplace!Diversity,!POOR!countries!

!!Table!8:!Birthplace!Diversity!and!Patent!Intensity!

Empirical analysis: robustness
Robustness to geography controls: two alternative speciÖcationssuggested by Rodriguez and Rodrik (2001).
Table 9 reports the results for share of tropics (in % of land massarea) as alternative control as well as a set of three regional dummies.
Our main result on skilled diversity of immigrants is very robust: itholds at 10% in the GDP model and at 1% signiÖcance in the TFPmodel. The magnitudes remain very stable.
Interestingly, in both speciÖcations, unskilled diversity tends tobecome positive and more signiÖcant. This is particularly true for thespeciÖcation with regional dummies. We interpret this result as some(limited) evidence for the presence of productive e§ects of diverseunskilled immigrants, e.g. via higher specialization of labor or betterlabor market integration of immigrant groups.
Alesina, Harnoss and Rapoport () Birthplace Diversity June 2013 43 / 68

!!Table!9:!Birthplace!Diversity!–!geography!robustness!
Empirical analysis: robustness
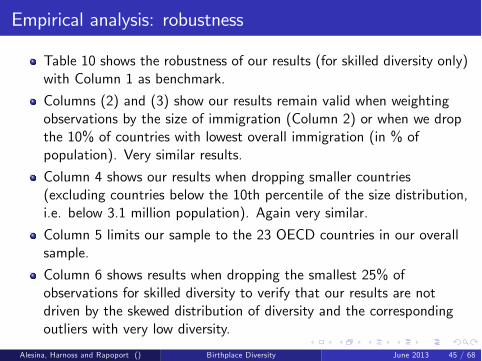
Table 10 shows the robustness of our results (for skilled diversity only)with Column 1 as benchmark.
Columns (2) and (3) show our results remain valid when weightingobservations by the size of immigration (Column 2) or when we dropthe 10% of countries with lowest overall immigration (in % ofpopulation). Very similar results.
Column 4 shows our results when dropping smaller countries(excluding countries below the 10th percentile of the size distribution,i.e. below 3.1 million population). Again very similar.
Column 5 limits our sample to the 23 OECD countries in our overallsample.
Column 6 shows results when dropping the smallest 25% ofobservations for skilled diversity to verify that our results are notdriven by the skewed distribution of diversity and the correspondingoutliers with very low diversity.
Alesina, Harnoss and Rapoport () Birthplace Diversity June 2013 45 / 68

Empirical analysis: robustness
Table 10: Other robustness checks
Alesina, Harnoss and Rapoport () Birthplace Diversity June 2013 46 / 68

Empirical analysis: robustness to borders pre 1989
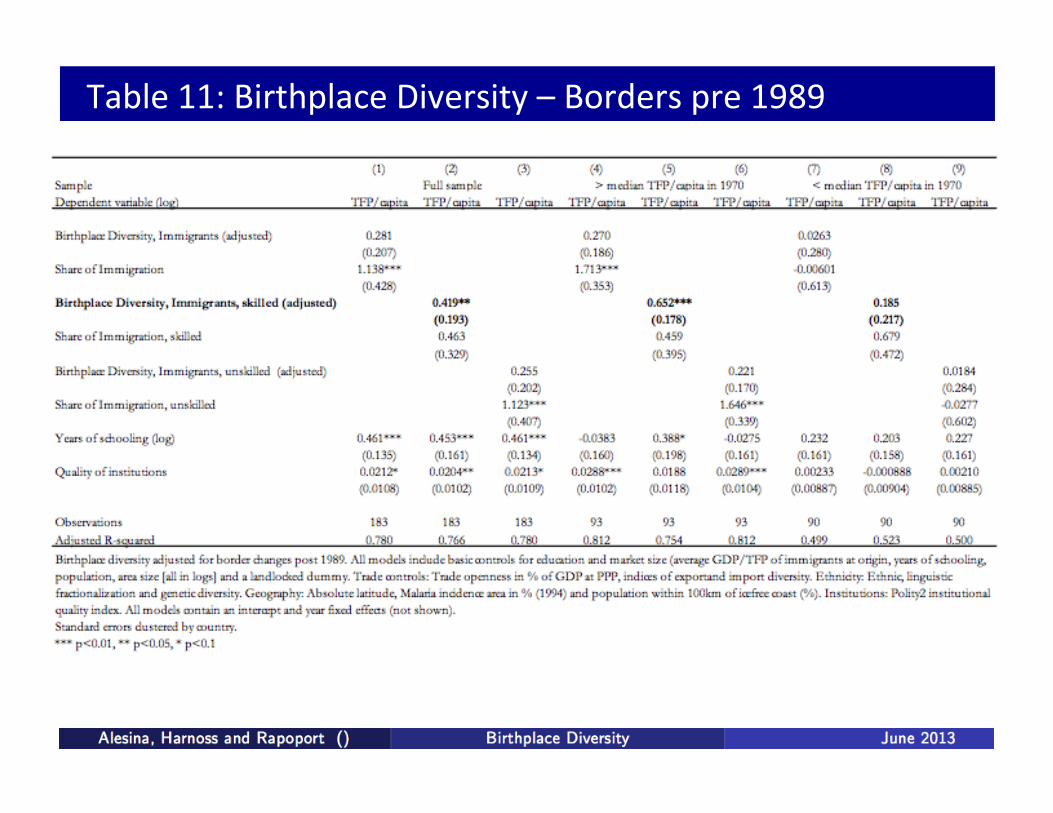
We re-compute our diversity index with country borders pre 1989 -avoids capturing "artiÖcial" diversity from immigrants of countriesthat separated post 1989.
Results: Our initial results for the full sample and rich subsample, forGDP and TFP remain fully robust at same magnitudes andsigniÖcance levels.
Alesina, Harnoss and Rapoport () Birthplace Diversity June 2013 47 / 68
!!Table!11:!Birthplace!Diversity!–!Borders!pre!1989!

Empirical analysis: robustness to migration networks
Finally, we control for migration networks in 1960 via a diversity indexof migrants in 1960 (based on data from Ozden et al., 2011).
Full sample: Results for diversity of skilled migrants in 1990 and 2000lose signiÖcance but remain positive (largely due to the highcorrelation between diversity in 1960 and 1990/2000, at about +.46)- suggests powerful long run e§ects of variety of immigrants.
Rich country subsample: Our measure of diversity in 1990/2000remains fully robust and highly signiÖcant at the 1% level. Thisindicates that lagged diversity - while an important long run e§ect -does not drive our main results.
Alesina, Harnoss and Rapoport () Birthplace Diversity June 2013 49 / 68
Empirical analysis: robustness
Interpretation:
Correlation between diversity today and 1960 lower for skilledimmigrants (likely due to migration network e§ects).
Descriptive analysis reveals that Divmig and sF have increasedbetween 1960 and 2000 but changes do not correlate with changes inGDP per capita (hinting that reverse causality may not be such aconcern) nor do they correlate one with the other (low interaction).
Finally, countries that had a diverse workforce in 1960 are the oneshaving a large and diverse second and third generation of immigrantstoday: compensation e§ects of birthplace and ethnic diversity couldexplain that diversity in 1960 does not a§ect the level of productivitytoday or that it does not wash out the positive productivity e§ects ofcurrent birthplace diversity.
Alesina, Harnoss and Rapoport () Birthplace Diversity June 2013 50 / 68

!!Table!12:!Birthplace!Diversity!–!Migra3on!Networks!1960!

Plan
1 Introduction2 Skill complementarities and diversity3 An index of birthplace diversity4 Empirical Analysis5 IdentiÖcation6 Conclusion
Alesina, Harnoss and Rapoport () Birthplace Diversity June 2013 52 / 68

IdentiÖcation
In this section we discuss and go part of the way towards addressingendogeneity concerns.
A Örst concern is that richer countries could attract a more diverse setof immigrants, especially skilled ones. Reverse causality would seem abigger concern for "size" than for "variety" (.1 v. .02 correlations forchanges between 1990-2000 and income per capita growth).
A second concern is the existence of omitted variables explaining bothdiversity and productivity
We address these concerns by controlling for a very large range offactors and by specifying a gravity model to predict diversity usingexogenous bilateral variables.
Alesina, Harnoss and Rapoport () Birthplace Diversity June 2013 53 / 68

IdentiÖcation: a gravity model
We follow the gravity literature and specify a gravity model togenerate predicted bilateral migration stocks. These stocks then serveas inputs to calculate predicted immigration sizes sF and a HerÖndahlindex of predicted Divmig .
However, we have to rely exclusively on bilateral determinants that donot directly a§ect incomes, and so have to leave out incomedi§erences or di§erences in institutional quality (that could directlya§ect bilateral immigration policy).
We specify the following gravity model for migration, where yikst isthe emigration rate from origin country i to destination country k forimmigrants of skill level s in year t:
yikst = a+ b1 DISTANCEikt + b2 BORDERikt + b3 LANGUAGEik+b4 COLONY +Fi + ck + ht + e
Alesina, Harnoss and Rapoport () Birthplace Diversity June 2013 54 / 68
IdentiÖcation: a gravity model
Note that the model is (purposefully) mis-speciÖed as we excludebilateral determinants of migration that would a§ect income throughother channels. In this context, Head and Mayer (2013) Önd thatOLS performs better than a Poisson estimator (more robust andconsistent).
We therefore use OLS, meaning that we do not include zero-cells, asour main speciÖcation. However, the cost of neglecting them is minorgiven the way our index is computed (requires correctly predicting themain immigration stocks, not whether a given cell will be empty orslightly positive, as this will not a§ect the aggregate index). Still, wealso use PPML as robustness check.
Multilateral resistance e§ects are dealt with by including a set oforigin-year Öxed e§ects to account for any time-varying commonorigin shock to migration which ináuences migrantsí locationsdecisions (Bertoli and Fern·ndez-Huertas, 2013).
Alesina, Harnoss and Rapoport () Birthplace Diversity June 2013 55 / 68

IdentiÖcation: Örst-stage results
Table 13 shows the results for our gravity model estimated with OLSand PPML.
Generally, the models have a very high explanatory power of R2 >.4;all the coe¢cients on the migration determinants have the expectedsign.
Alesina, Harnoss and Rapoport () Birthplace Diversity June 2013 56 / 68

!!Table!13:!Gravity!Model!Results!

IdentiÖcation: Örst-stage results
We turn to assessing the Öt of the predicted values with actual diversity.
The Örst panel of Figure 3 shows actual vs. predicted diversity ofskilled immigrants based on the gravity model. Overall, thecorrelation between actual and predicted diversity is very high (+.6for skilled and unskilled diversity).
Our instrument should plausibly be lower (higher) than actualdiversity in richer (poorer) countries if prosperity and diversity arepositively correlated. The second panel of Figure 3 plots theìprediction errorî as a function of GDP per capita. The di§erencebetween predicted and actual diversity becomes negative asGDP/capita increases (slope -0.05, signiÖcant at 1%), serving asillustrative evidence that our gravity model produces an instrumentthat takes out some diversity-increasing e§ects in richer countries.
Alesina, Harnoss and Rapoport () Birthplace Diversity June 2013 58 / 68

!!Figure:!Actual!vs.!Predicted!Birthplace!Diversity!

!!Table!14a:!2SLS!results!8!GDP!
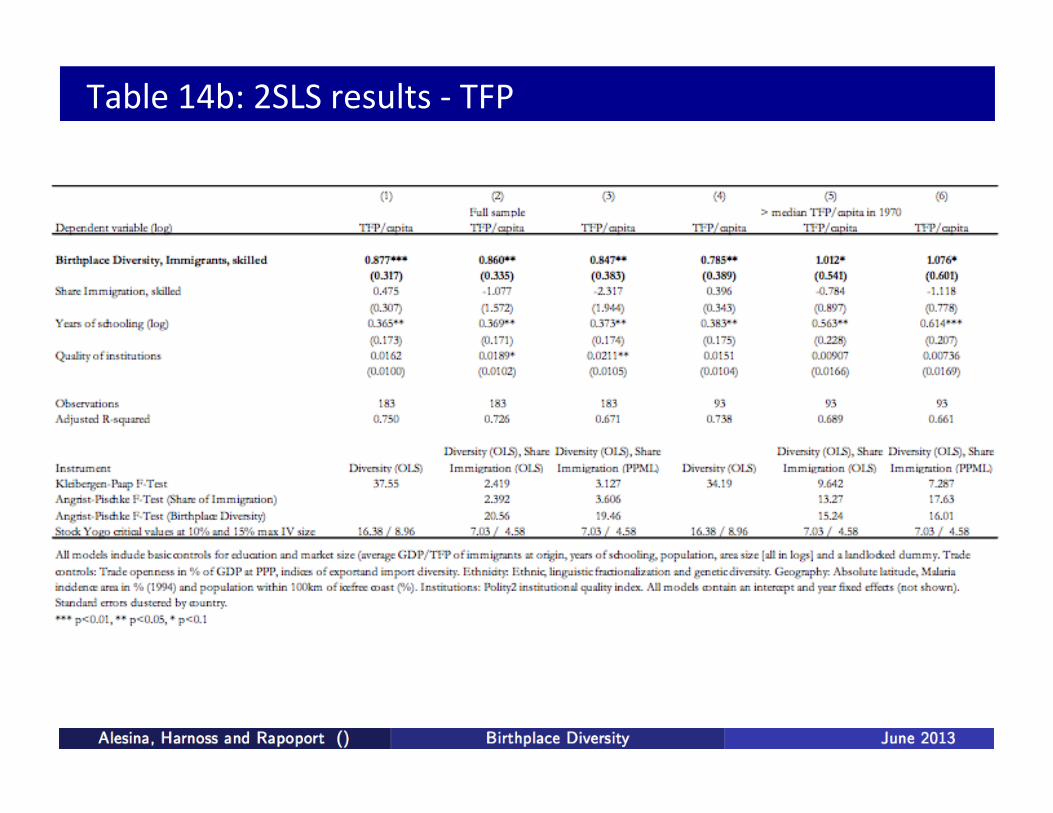
!!Table!14b:!2SLS!results!8!TFP!

IdentiÖcation: 2SLS results
Tables 14a,b show our baseline models with sF and/or Divmiginstrumented by our gravity-model based measures.
We largely conÖrm our prior OLS Öndings: skilled diversity is nowlargely signiÖcant at the 1% level for GDP/capita and TFP/capita(somewhat higher magnitudes suggesting prior attenuation bias).Interstingly, the coe¢cient on birthplace diversity is una§ected bywhether we instrument sF or not, meaning there is no bias ondiversity arising from the endogeneity of the size of immigration.
We also fully conÖrm the split-sample results for rich countries at5-10% statistical signiÖcance for both GDP and TFP per capita andÖnd evidence for positive e§ects of unskilled diversity in richercountries (Table 15).
Alesina, Harnoss and Rapoport () Birthplace Diversity June 2013 60 / 68

!!Table!15a:!2SLS!results!–!GDP!/!low!skilled!immigra3on!

!!Table!15b:!2SLS!results!–!TFP/!low!skilled!immigra3on!

IdentiÖcation: 2SLS results
We also pursue an alternative IV approach using the diversity ofimmigrants in 1960 (based on Ozden et al., 2011) as an additionalinstrument for diversity today.
This approach is valid to the extent that diversity in 1960 is notcorrelated with unobserved factors that also determine diversity andincome today (which is of course questionable) but allows us to testthe exclusion restriction of the joint instruments directly.
Table 16 shows that we replicate our OLS results using su¢cientlystrong instruments (F> 10) at the 5% signiÖcance level. This alsoholds for the split samples. We interpret these results as additionalevidence for our prior OLS and IV model Öndings.
Alesina, Harnoss and Rapoport () Birthplace Diversity June 2013 62 / 68

!!Table!16a:!2SLS!results!–!GDP!/!2!instruments!

!!Table!16b:!2SLS!results!–!TFP/!2!instruments!

The channel: Skill complementarities
E§ect of birthplace diversity on productivity could be driven byorigin-e§ects or skill-complementarities
Origin-e§ects appear unlikely, since we control for immigrants’ level ofincome/TFP at origin in our full modelSkill complementarities appear more likely, since diversity also increasesthe level of patent citations per capita in a given country
Still, we analyze the channel of e§ect more directly
Alesina, Harnoss and Rapoport () Birthplace Diversity June 2013 63 / 75
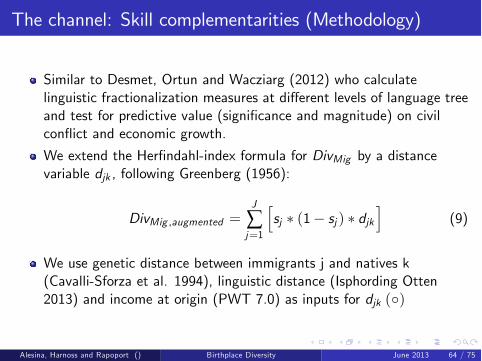
The channel: Skill complementarities (Methodology)
Similar to Desmet, Ortun and Wacziarg (2012) who calculatelinguistic fractionalization measures at di§erent levels of language treeand test for predictive value (significance and magnitude) on civilconflict and economic growth.
We extend the Herfindahl-index formula for DivMig by a distancevariable djk , following Greenberg (1956):
DivMig ,augmented =J
Âj=1
hsj (1 sj ) djk
i(9)
We use genetic distance between immigrants j and natives k(Cavalli-Sforza et al. 1994), linguistic distance (Isphording Otten2013) and income at origin (PWT 7.0) as inputs for djk ()
Alesina, Harnoss and Rapoport () Birthplace Diversity June 2013 64 / 75

The channel: Skill complementarities (Methodology)
We define a standard logistic function to assign a djk between 0 and 2(centered on djk = 1 for the theoretical case that all immigrantgroups are equidistant to natives).
djk =2
1+ e(qx ) (10)
Where q is a parameter that ranges from -10 to +10 and x takes onstandardized values (min=0, max=1) for genetic distance, linguisticdistance and income (GDP at PPP) at origin.Use logistic function largely for convenience, since it includes DivMigas special case at q=0 or when djk = 1 (if all groups equidistant fromnatives at average distance)Varying q so that q > 0 allows us to give more weight to genetically(linguistically) more distant / richer immigrant groups (andvice-cersa)
Alesina, Harnoss and Rapoport () Birthplace Diversity June 2013 65 / 75

The channel: Skill complementarities (Intuition)
Intuition: Running our main model (Table 5) using DivMig ,augmented atdi§erent levels of q allows us to infer on the importance ofgenetics/linguistics/origin e§ects
If results for DivMig ,augmented remain significant at same or highermagnitudes as q ! +10 - genetically distant groups matter for e§ectof birthplace diversity on productivty. If significance drops - they don’t
Same for linguistic distance and GDP p.c. (PPP) at origin
Alesina, Harnoss and Rapoport () Birthplace Diversity June 2013 66 / 75

!!Table!B1:!Gene,c!distance2augmented!diversity!
p-value p-value
α-valuesCoefficient (std error) α-values
Coefficient (std error)
H0: Equality of coefficients α-values
Coefficient (std error) α-values
Coefficient (std error)
H0: Equality of coefficients
0 0.180** 0 0.180** n/a 0 0.378*** 0 0.378*** n/a(0.0847) (0.0847) (0.106) (0.106)
2.5 0.158* -2.5 0.179** 0.6766 2.5 0.269*** -2.5 0.441*** 0.0194(0.0806) (0.0862) (0.0933) (0.114)
5 0.0897 -5 0.182** 0.3136 5 0.185** -5 0.445*** 0.0198(0.0789) (0.0865) (0.0902) (0.114)
7.5 0.0234 -7.5 0.187** 0.1493 7.5 0.146 -7.5 0.416*** 0.0345(0.0787) (0.0867) (0.0905) (0.114)
10 -0.0153 -10 0.192** 0.0919 10 0.135 -10 0.376*** 0.0797(0.0771) (0.0868) (0.0921) (0.113)
Birthplace Diversity (skilled) at different α-values
FULL MODEL > Median GDP/capita in 1970
Birthplace Diversity (skilled) at different α-values
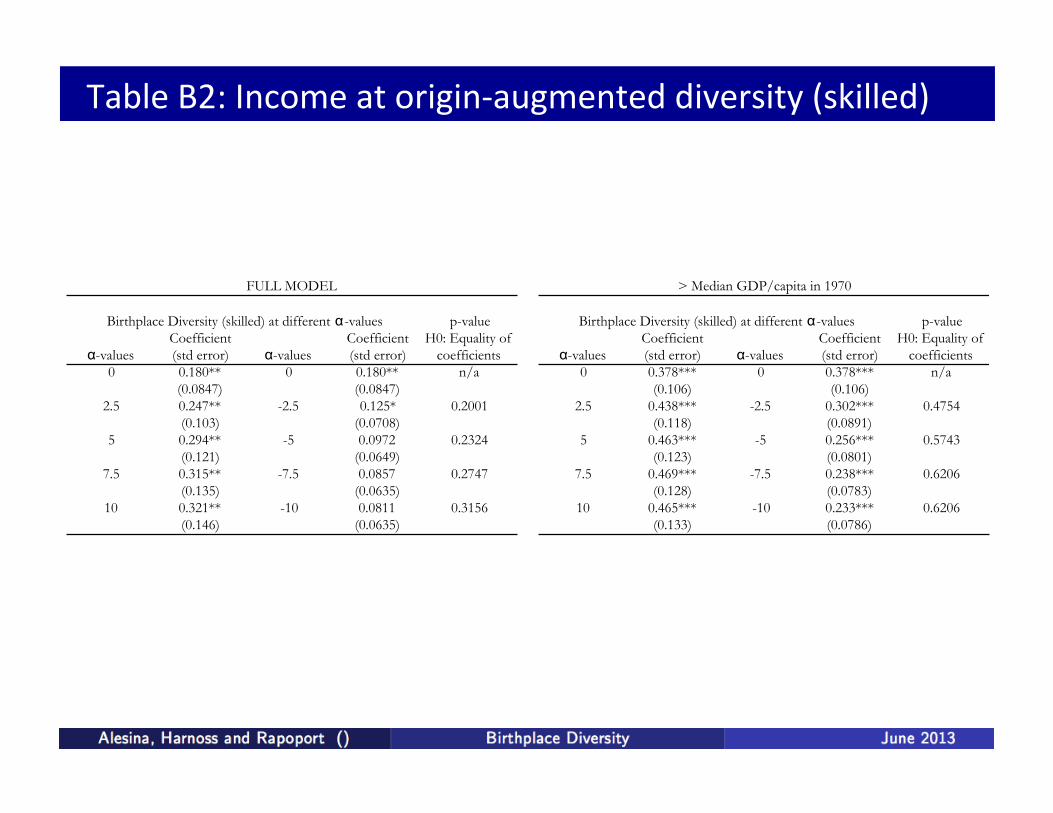
!!Table!B2:!Income!at!origin2augmented!diversity!(skilled)!
p-value p-value
α-valuesCoefficient (std error) α-values
Coefficient (std error)
H0: Equality of coefficients α-values
Coefficient (std error) α-values
Coefficient (std error)
H0: Equality of coefficients
0 0.180** 0 0.180** n/a 0 0.378*** 0 0.378*** n/a(0.0847) (0.0847) (0.106) (0.106)
2.5 0.247** -2.5 0.125* 0.2001 2.5 0.438*** -2.5 0.302*** 0.4754(0.103) (0.0708) (0.118) (0.0891)
5 0.294** -5 0.0972 0.2324 5 0.463*** -5 0.256*** 0.5743(0.121) (0.0649) (0.123) (0.0801)
7.5 0.315** -7.5 0.0857 0.2747 7.5 0.469*** -7.5 0.238*** 0.6206(0.135) (0.0635) (0.128) (0.0783)
10 0.321** -10 0.0811 0.3156 10 0.465*** -10 0.233*** 0.6206(0.146) (0.0635) (0.133) (0.0786)
FULL MODEL > Median GDP/capita in 1970
Birthplace Diversity (skilled) at different α-values Birthplace Diversity (skilled) at different α-values
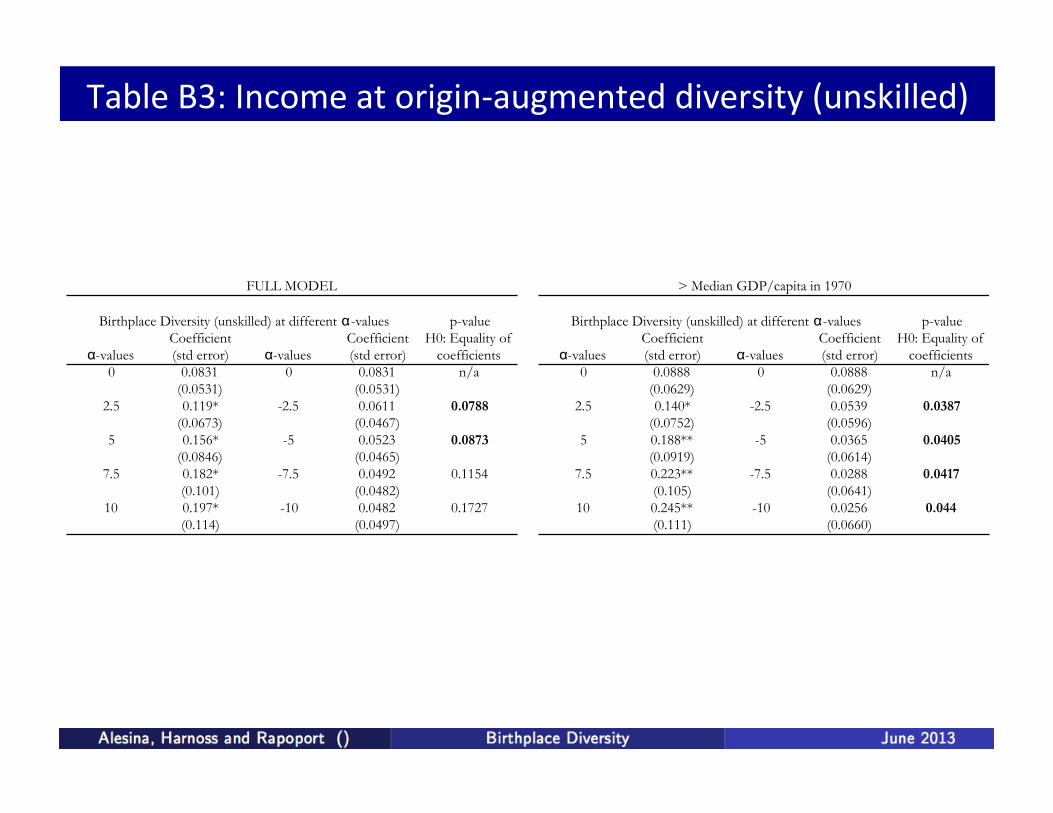
!!Table!B3:!Income!at!origin2augmented!diversity!(unskilled)!
p-value p-value
α-valuesCoefficient (std error) α-values
Coefficient (std error)
H0: Equality of coefficients α-values
Coefficient (std error) α-values
Coefficient (std error)
H0: Equality of coefficients
0 0.0831 0 0.0831 n/a 0 0.0888 0 0.0888 n/a(0.0531) (0.0531) (0.0629) (0.0629)
2.5 0.119* -2.5 0.0611 0.0788 2.5 0.140* -2.5 0.0539 0.0387(0.0673) (0.0467) (0.0752) (0.0596)
5 0.156* -5 0.0523 0.0873 5 0.188** -5 0.0365 0.0405(0.0846) (0.0465) (0.0919) (0.0614)
7.5 0.182* -7.5 0.0492 0.1154 7.5 0.223** -7.5 0.0288 0.0417(0.101) (0.0482) (0.105) (0.0641)
10 0.197* -10 0.0482 0.1727 10 0.245** -10 0.0256 0.044(0.114) (0.0497) (0.111) (0.0660)
Birthplace Diversity (unskilled) at different α-values Birthplace Diversity (unskilled) at different α-values
FULL MODEL > Median GDP/capita in 1970
The channel: Results
Genetic distance: Results become insignificant as as q ! +10, butremain stable as as q ! -10. Hence, culturally closer immigrantgroups matter (Spolaore Wacziarg 2009)
Linguistic distance (correlated with genetic distance +0.16): Resultsremain significant as q ! +10 or as q ! +10, especially in richsubsample - linguistic distances do not matter
Income at origin: Results remain significant as q ! +10 or as q !+10 and statistically - origin-e§ects not a driver of our rich countrysubsample results.
Full sample results may show some (not yet statistically significant)origin-e§ects for poor countries.Also, richer unskilled immigrants matter for e§ect of unskilled diversityin rich countries (likely cause: heterogeneity of skills within category ofunskilled immigrants)
Alesina, Harnoss and Rapoport () Birthplace Diversity June 2013 70 / 75

Plan
1 Introduction2 Skill complementarities and diversity3 An index of birthplace diversity4 Empirical Analysis5 Identification6 Conclusion
Alesina, Harnoss and Rapoport () Birthplace Diversity June 2013 71 / 75
Conclusion
We propose a new concept of "birthplace diversity" that captures thediversity in birthplaces in a country’s work force. The index isdecomposed into a ”size” (share of foreign- born) and a ”variety”(diversity among immigrants) component, available for 195 countriesin 1990 and 2000, and for overall/skilled/unskilled components of thelabor force.We show that birthplace diversity is, maybe surprisingly, largelyuncorrelated with ethnic and linguistic fractionalization and that —unlike fractionalization — it appears to be positively related to acountry’s level of economic development.We then empirically investigate the relationship between birthplacediversity and measures of productivity (GDP or TFP per capita),controlling for a large range of factors such as the share ofimmigration, origin-e§ects, education, institutions, trade opennessand trade diversity as well as geography. We employ OLS and specifya gravity-based 2SLS model to address endogeneity.
Alesina, Harnoss and Rapoport () Birthplace Diversity June 2013 72 / 75

Conclusion
We find a positive and robust correlation between the diversity of acountry’s population in terms of origin countries and productivity (inGDP and TFP per capita).This association is particularly strong for the diversity of immigrants,especially for skilled immigrants in richer countries. Expanding thevariety of origin countries in a country’s immigrant population by onestandard deviation (e.g., from Iran to Ireland, or Ireland to USA)increases long run incomes by a factor of 1.2 to 1.5; or a 10percentage points change increases long-run income by 6.7 percent.These results hold for OLS and 2SLS estimators in a dataset of 93countries and are robust to a wide range of alternative explanations.We interpret these findings as suggestive of production functione§ects of diversity arising from complementarities in skills, values orproblem solving capabilities that emerge from the combination ofworkers with diverse origins in a joint production task, as suggestedby micro and US-based studies.
Alesina, Harnoss and Rapoport () Birthplace Diversity June 2013 73 / 75
Conclusion
Immigration policy debates have so far largely centered onimmigration quotas or on targeting specific labor market skills. Butfew policies explicitly focus on the diversity of immigrants — the USdiversity lottery being a notable exception.
Focusing exclusively on skill levels, but not on diversity ofbackgrounds, would therefore imply missing an important channelthrough which immigration contributes to growth in the receivingcountries.
Is the melting pot melting too much?
Finally, a potential corollary of more diverse immigration is greaterpublic support for more immigration conditional on the additionalmigrants being skilled and coming from a diverse set of origins. Thiscreates the possibility of a virtuous circle between the quantity andquality of immigrants — a more diverse world could also become amore open one.
Alesina, Harnoss and Rapoport () Birthplace Diversity June 2013 74 / 75

Next steps
Research agenda
explore the role of birthplace diversity in the formation of attitudes toimmigration and in the formation of social values (redistribution, trust)explore the role of birthplace diversity (population, migrants,researchers) on innovation (patents)
Alesina, Harnoss and Rapoport () Birthplace Diversity June 2013 75 / 75