Birth-related Statistics - Vital Statistics Agency Annual Report 2011 · 29 1,522 1,035 362 93 43...
28
Birth-related Statistics
Transcript of Birth-related Statistics - Vital Statistics Agency Annual Report 2011 · 29 1,522 1,035 362 93 43...

Birth-related Statistics

Birth Introduction
Statistics based on birth events form a crucial part of the demographic profile of communities, regions, provinces, and countries. They are used to derive important indicators of health status, fertility, infant mortality, and population growth. In turn, those indicators are used for health planning, policy formulation, research, and commerce. The tables in this part of the report present birth statistics categorized by maternal characteristics and other related measures. The tables refer only to live births except Table 7 which also includes stillbirths. The mother’s usual residence is used to identify geographic location.
Births – General Indicators
Certain birth and parental characteristics that are presented in this section have been shown to be related to the infant’s health status or are of general interest. These characteristics include age of mother, age of father, kind of birth (single, twin, or multiple), LHA of usual residence, and mode of delivery.
Table 7 shows the live birth cardinality by mother’s age. About 82.3 percent of live births in 2011 were first or second births. Second, third, and subsequent live births tend to have been delivered to progressively older women.
Table 8 shows the number of live births in BC in 2011 by the age of mother and the age of father. It also shows, for each maternal age range, the number of infants born to couples who were not formally married to each other (Out-of-Wedlock).
Over half of the births (52.6 percent) in 2011 were to mothers 30 to 39 years old and 40.3 percent were to mothers in their 20s. Only 2.7 percent were to mothers less than 20 years and 4.4 percent to those 40 or older. For fathers, over half ( 53.8 percent) were in their 30s, more than a quarter ( 26.1 percent) were in their 20s, 14.5 percent were in their 40s or older, and 0.8 percent were less than 20 years old. In 4.9 percent of births, the father’s age was not indicated.
Less than one percent (0.7 percent) of births (293) were to couples who were both in their teens; births to couples in which at least one person was a teen, made up 2.8 percent (1,242) of births.
While there were only 125 births (0.3 percent) to mothers age 45 years old and over, 4.6 percent (2,022) of all newborns had fathers in that age group.
Table 9 shows the number of births by birth kind (single, twin, triplet+) according to the mother’s age group. In 2011, 5.2 percent of live births to mothers 35 years and older were multiple births, whereas 2.6 percent of such births were to mothers aged 20 to 34. Teenage mothers had the lowest percentage of multiple births.
In recent decades there has been a gradual increase in multiple birth rates in BC (see Figure 8). The proportions of multiple live births increased from 1.9 percent of all live births in 1986 to 3.1 percent in 2011.
Table 11 shows the number and percentage of births in each maternal age group according to their mode of delivery. Generally, the proportion of births that were spontaneous vertex deliveries (which generally require no medical intervention), and to a lesser extent births assisted by vacuum extraction, are higher for younger mothers. On the other hand, deliveries by cesarean section are proportionally higher for older mothers (see also Figure 13).
35

36 b i r t h - r e l a t e d s t a t i s t i c s
Cesarean section deliveries in BC increased from 209.59 per 1,000 live births in 1986 to 313.65 per 1,000 live births in 2011 (see Figure 11).
Table 12 shows live births by the LHA where the mother usually resided and focuses on spontaneous vertex and cesarean section modes of delivery. Spontaneous breech, forceps, and vacuum deliveries are combined into the Other category. The table shows the number and percent of live births that were delivered by cesarean section.
The columns on the right side of the table indicate the total number of live births in 2011 to residents of each LHA and the birth rate per 1,000 population. The LHA with the highest live birth rate was more than four times the rate of the lowest. For more comparisons of cesarean section delivery rates, see also Figures 11, 12, and 13.
In Figure 30, the LHAs are grouped by their ratio of observed number of cesarean live births over expected number of cesarean live births for 2011. The figure shows the LHAs in quintiles from those with the highest cesarean ratios (quintile 5) to those with the lowest such rates (quintile 1).

b i r t h - r e l a t e d s t a t i s t i c s 37
Vital Statistics Information BoxVital Statistics Information Box
area Province/country Birthscanada total 29,106 British Columbia 21,201 Ontario 2,521 Alberta 2,509 Saskatchewan 809 Manitoba 781 Quebec 550 Nova Scotia 269 Newfoundland & Labrador 154 New Brunswick 140 Yukon 80 Northwest Territories 51 Prince Edward Island 38 Nunavut 3 north and central america total 1,256 United States 727 Mexico 233 Other North and 296 Central American Countries South america total 319 europe total 2,068 United Kingdom 531 Germany 197 Russia 185 Romania 143 Poland 131 Ukraine 107 Slovakia 65 France 58 Yugoslavia 56 Scandinavian Countries 53 Netherlands 53 Other European Countries 489 asia and the middle east total 10,027 India 2,853 China 2,351 Philippines 1,534 Korea South 477 Viet Nam 363 Japan 330 Taiwan 444 Iran 265 Hong Kong 240 Pakistan 215 Saudi Arabia 127 Other Asian and 828 Middle Eastern Countries africa total 601 South Africa 156 Other African Countries 445 oceania total 378 Fiji 183 Australia 130 New Zealand 60 Other Oceanic Countries 5 Unknown 236 total 43,991
Note: Births consist of live births only. Non-residents are excluded.
BiRths By mothER’s PlaCE of BiRthbr i t i s h co l u M b i a, 2011

38 b i r t h - r e l a t e d s t a t i s t i c s
table 7BirthS BY aGe of mother anD liVe BirthS BY Birth orDer
br i t i s h co l u M b i a, 2011
Age of Birth Order Total Live TotalMother 1 2 3 4 5 6 7 8 9+ N.S. Births Stillbirths Births
Note: Birth order denotes the number of live births. Total includes unknown gender. Non-residents are excluded. N.S. – Not stated.
<14 - - - - - - - - - - - - -14 6 - - - - - - - - - 6 3 915 40 - - - - - - - - - 40 3 4316 93 3 1 - - - - - - - 97 8 10517 178 19 - - - - - - - - 197 5 20218 307 42 4 - - - - - - - 353 7 36019 391 76 6 - - - - - - - 473 9 48220 536 158 19 3 2 - - - - - 718 9 72721 570 218 39 6 1 - - - - - 834 7 84122 660 343 73 6 1 1 - - - - 1,084 7 1,09123 731 392 95 25 - - - - - - 1,243 13 1,25624 811 486 161 44 8 3 - - - - 1,513 13 1,52625 958 613 176 47 2 1 - - - - 1,797 18 1,81526 1,188 677 238 70 17 2 - 1 - - 2,193 24 2,21727 1,307 791 267 77 19 9 - - - - 2,470 20 2,49028 1,473 919 303 76 27 8 4 1 - - 2,811 27 2,83829 1,522 1,035 362 93 43 11 10 1 1 - 3,078 28 3,10630 1,440 1,170 326 116 29 13 5 1 2 - 3,102 30 3,13231 1,430 1,286 379 117 30 16 5 3 - - 3,266 22 3,28832 1,318 1,213 367 101 31 11 6 3 1 - 3,051 31 3,08233 1,099 1,159 417 114 26 17 5 4 4 - 2,845 23 2,86834 996 1,102 382 112 30 19 8 4 1 - 2,654 21 2,67535 825 991 372 95 38 16 11 - 6 - 2,354 20 2,37436 636 834 328 115 38 15 5 4 1 - 1,976 16 1,99237 490 683 287 75 33 12 8 7 2 - 1,597 18 1,61538 397 561 232 86 24 18 9 3 3 - 1,333 10 1,34339 310 400 165 60 16 8 4 5 1 - 969 10 97940 219 294 130 53 15 7 10 1 3 - 732 17 74941 154 178 74 36 18 1 6 5 2 - 474 6 48042 101 117 51 25 15 5 4 4 6 - 328 6 33443 52 66 43 11 6 1 2 - 1 - 182 7 18944 20 47 12 8 3 1 - 1 2 - 94 1 9545+ 49 42 14 6 7 3 - 2 2 - 125 2 127N.S - - - 2 - - - - - - 2 - 2total 20,307 15,915 5,323 1,579 479 198 102 50 38 - 43,991 441 44,432% 46.2 36.2 12.1 3.6 1.1 0.5 0.2 0.1 0.1 - 100.0

b i r t h - r e l a t e d s t a t i s t i c s 39
table 8total liVe BirthS BY aGe of father,aGe of mother anD oUt-of-WeDlock
br i t i s h co l u M b i a, 2011
Age of Mother (in Years)Age of Father <15 15–19 20–24 25–29 30–34 35–39 40–44 45+ N.S. Total Percent
Note: Total percentage may not add up to 100 due to rounding. Out-of-Wedlock - Indicates mother and father of child were not legally married to each other and excludes 637 cases where marital
status was not stated. Non-residents are excluded. N.S. – Not stated.
< 15 2 2 - - - - - - - 4 0.0 15-19 1 288 72 4 - - - - - 365 0.8 20-24 1 459 1,647 439 78 23 1 - - 2,648 6.0 25-29 - 139 2,065 5,081 1,320 191 18 2 - 8,816 20.0 30-34 - 29 750 4,430 7,136 1,254 95 4 - 13,698 31.1 35-39 - 5 200 1,300 4,325 3,751 366 11 - 9,958 22.6 40-44 - 4 81 371 1,187 1,971 697 29 - 4,340 9.9 45+ - 3 29 163 453 757 549 66 2 2,022 4.6 N.S. 2 231 548 561 419 282 84 13 - 2,140 4.9 total 6 1,160 5,392 12,349 14,918 8,229 1,810 125 2 43,991 Percent 0.0 2.6 12.3 28.1 33.9 18.7 4.1 0.3 0.0 100.0out-of-Wedlock 6 1,058 3,217 3,456 2,664 1,567 415 24 - 12,407
table 9liVe BirthS BY aGe of mother anD kinD of Birth
br i t i s h co l u M b i a, 2011
Age of Kind of BirthMother Single Twin Triplets+ N.S. Total
< 15 6 - - - 6 15-19 1,146 14 - - 1,160 20-24 5,301 91 - - 5,392 25-29 12,055 282 12 - 12,349 30-34 14,460 455 3 - 14,918 35-39 7,821 396 12 - 8,229 40-44 1,710 100 - - 1,810 45 + 107 18 - - 125 N.S. - 2 - - 2 total 42,606 1,358 27 - 43,991
Note: For the multiple births that include stillbirths, only live births are shown. Triplets+: included in this column are the live births from multiple births of three or more. Non-residents are excluded.
N.S.- Not stated.

40 b i r t h - r e l a t e d s t a t i s t i c s
Tab
le
10Vital Statistics Information BoxVital Statistics Information Box
Baby Boys Baby Girls
rank name number name number
1 Liam 261 Emma 255 2 Ethan 246 Olivia 244 3 Mason 238 Sophia 226 4 Lucas 218 Ava 203 5 Benjamin 208 Chloe 184 6 Jacob 199 Emily 180 7 Logan 190 Isabella 177 8 Nathan 188 Ella 144 9 Alexander 184 Abigail 140 10 Owen 184 Sophie 137 11 Noah 175 Hannah 129 12 James 169 Lily 129 13 Jack 165 Madison 124 14 Carter 160 Charlotte 112 15 Matthew 156 Brooklyn 111 16 William 152 Grace 106 17 Ryan 148 Avery 104 18 Samuel 148 Alexis 102 19 Jackson 142 Elizabeth 97 20 Oliver 142 Hailey 97 21 Joshua 133 Mia 93 22 Daniel 131 Amelia 90 23 Evan 127 Maya 90 24 Ryder 127 Claire 84 25 Jayden 124 Zoe 84
toP 25 BaBy namEs in 2011
each year the British columbia Vital Statistics agency produces a list of the most chosen baby names. the table below provides the top 25 names. alternate spellings of names that sound alike (such as catherine, katherine, and katharine) are not combined. the complete 2011 list, as well as lists for several previous years can be found at http://www.vs.gov.bc.ca/babynames. In 2011, 648 boys’ names and 756 girls’ names were chosen for five or more newborns.

b i r t h - r e l a t e d s t a t i s t i c s 41L
IVE
BIR
TH
FE
RT
ILIT
Y R
AT
ES
BY
LO
CA
L H
EA
LT
H A
RE
A,
br
itis
h c
ol
uM
bia
, 20
06–2
010
an
d 2
011
Tab
le
10
2006–2010 Teenage Fertility Rate (15–19 yrs) 2011 ASFR1 TFR2
Local Health Area Observed ASFR1 (p) 15–19 20–24 25–29 30–34 35–39 40–44 Rate (p)
Notes for this table follow the map.
41
001 Fernie 27 11.39 11.26 44.86 128.21 113.49 34.04 4.02 1,679.42 002 Cranbrook 90 21.23 * 11.51 49.45 106.72 88.32 32.30 6.69 1,474.96 003 Kimberley 16 12.94 - 26.72 116.40 92.11 48.69 14.08 1,489.99 004 Windermere 16 9.81 20.41 34.88 55.23 67.25 38.78 5.93 1,112.46 *005 Creston 54 27.04 * 24.79 60.74 133.57 77.74 34.13 5.80 1,683.85 006 Kootenay Lake 2 3.80 - 16.81 64.52 40.82 30.53 7.75 802.13 *007 Nelson 35 8.66 5.22 15.78 110.48 105.05 55.56 14.18 1,531.34 009 Castlegar 8 3.80 * 8.97 46.56 98.90 153.85 28.71 4.08 1,705.34 010 Arrow Lakes 5 7.60 - 41.32 69.44 66.67 - 6.58 920.06 *011 Trail 38 11.50 12.94 42.43 123.97 173.08 61.30 4.88 2,093.01 *012 Grand Forks 16 12.91 8.00 19.46 93.41 84.75 66.30 15.04 1,434.72 013 Kettle Valley 3 7.33 - 27.40 70.18 61.73 21.05 - 901.77 *014 Southern Okanagan 40 16.42 * 10.50 47.95 196.91 70.18 31.96 12.27 1,848.85 *015 Penticton 75 12.72 13.12 39.80 102.90 93.61 41.15 5.15 1,478.66 016 Keremeos 13 17.96 - 40.00 127.27 97.09 52.63 - 1,584.96 017 Princeton 16 23.56 * 29.41 45.98 169.81 115.38 16.26 6.54 1,916.90 018 Golden 9 8.27 4.59 21.46 78.51 104.90 63.64 3.79 1,384.39 019 Revelstoke 19 14.59 16.95 41.38 86.36 133.33 57.61 - 1,678.19 020 Salmon Arm 68 12.26 15.55 50.74 113.45 123.47 32.46 12.31 1,739.90 *021 Armstrong - Spallumcheen 21 12.46 - 64.94 150.00 141.55 29.29 3.62 1,947.00 *022 Vernon 136 12.94 * 14.38 51.03 137.86 93.75 46.28 4.83 1,740.62 *023 Central Okanagan 291 10.51 6.70 33.95 91.06 103.32 40.99 7.57 1,417.90 024 Kamloops 221 12.30 * 10.69 49.47 86.92 105.08 38.91 7.08 1,490.83 025 100 Mile House 28 11.54 8.85 38.94 109.93 60.61 26.47 12.08 1,284.35 026 North Thompson 14 17.70 14.71 48.19 19.42 84.21 16.39 7.30 951.10 *027 Cariboo - Chilcotin 135 28.71 * 21.03 68.62 91.13 89.73 36.27 2.29 1,545.30 028 Quesnel 100 23.76 * 22.97 65.12 112.48 88.92 19.01 2.49 1,554.97 029 Lillooet 28 38.83 * 20.98 64.71 73.77 70.80 41.38 24.19 1,479.12 030 South Cariboo 26 19.94 * 34.33 41.96 97.30 101.91 33.11 4.88 1,567.46 031 Merritt 62 30.33 * 25.58 77.67 151.20 112.21 33.85 2.62 2,015.62 *032 Hope 34 26.25 * 19.08 59.44 96.59 125.71 16.22 12.55 1,647.99 033 Chilliwack 275 19.59 * 19.48 84.10 144.67 94.19 36.54 3.78 1,913.82 *034 Abbotsford 294 12.97 * 9.07 51.06 125.65 97.46 43.31 6.62 1,665.81 *035 Langley 155 6.79 * 6.77 34.05 110.95 128.72 59.73 11.11 1,756.72 *037 Delta 59 3.26 * 2.74 16.81 81.37 143.30 74.30 9.14 1,638.32 *038 Richmond 55 1.74 * 1.25 11.54 48.76 101.05 51.94 11.47 1,130.11 *040 New Westminster 64 7.84 * 4.40 25.24 56.46 92.66 61.83 15.65 1,281.17 *041 Burnaby 122 3.84 * 2.85 16.41 50.03 97.96 65.98 14.06 1,236.51 *042 Maple Ridge 108 6.61 * 7.10 33.48 119.65 106.62 42.59 7.70 1,585.77 *043 Coquitlam 130 3.47 * 3.10 16.28 58.14 112.78 75.25 13.22 1,393.83 044 North Vancouver 49 2.20 * 2.26 8.98 41.55 113.19 90.68 18.03 1,373.45 045 West Vancouver-Bowen Is. 22 2.23 * 1.40 4.23 39.79 150.25 74.71 14.37 1,423.75 046 Sunshine Coast 43 9.70 8.25 43.48 185.98 111.73 52.49 5.05 2,034.95 *047 Powell River 34 11.18 9.97 31.30 114.22 102.30 31.94 10.19 1,499.54 048 Howe Sound 59 12.46 13.53 32.67 62.41 100.29 90.47 14.36 1,568.66 *049 Bella Coola Valley 31 64.85 * 48.78 105.77 117.02 108.11 20.83 10.00 2,052.56 050 Queen Charlotte 13 18.71 7.09 71.43 172.41 119.40 66.23 13.51 2,250.38 *051 Snow Country 2 22.22 - 153.85 62.50 142.86 - - 1,796.02 052 Prince Rupert 107 37.02 * 31.56 56.86 112.98 127.22 41.84 11.83 1,911.45 *053 Upper Skeena 45 37.50 * 42.45 88.11 128.57 121.95 18.63 17.34 2,085.28 *054 Smithers 69 21.40 * 13.22 66.13 119.16 113.95 61.98 12.77 1,936.11 *055 Burns Lake 34 22.30 * 9.84 62.04 169.90 89.55 24.63 8.73 1,823.50 *056 Nechako 103 37.39 * 24.53 122.33 192.41 102.40 41.04 8.85 2,457.77 *057 Prince George 357 21.02 * 19.91 67.02 93.18 88.48 38.11 5.86 1,562.82 *059 Peace River South 129 25.51 * 21.45 89.99 142.53 94.94 26.38 3.19 1,892.47 *060 Peace River North 208 33.41 * 20.85 142.08 148.36 100.72 40.42 8.33 2,303.81 *061 Greater Victoria 218 7.38 * 7.82 17.77 38.41 81.37 58.71 11.00 1,075.46 *062 Sooke 98 9.05 8.06 58.03 131.84 89.18 49.81 9.86 1,733.92 *063 Saanich 73 7.21 * 7.63 18.94 67.82 146.27 61.75 8.61 1,555.10 064 Gulf Islands 12 6.20 * 2.64 16.53 112.97 86.26 43.84 11.82 1,370.28 065 Cowichan 197 18.93 * 13.63 45.55 142.52 102.05 38.08 11.48 1,766.50 *066 Lake Cowichan 14 12.72 4.44 26.43 120.00 83.83 18.63 - 1,266.71 067 Ladysmith 50 18.08 * 18.63 58.05 123.89 119.59 33.49 1.75 1,777.07 *068 Nanaimo 207 12.90 * 12.36 41.70 91.74 97.25 47.67 10.31 1,505.15 069 Qualicum 40 6.93 * 10.23 30.69 96.92 103.40 47.84 9.17 1,491.23 070 Alberni 168 33.60 * 34.09 90.54 110.73 90.61 37.90 5.37 1,846.24 *071 Courtenay 96 9.51 10.46 44.97 133.23 95.09 46.11 6.16 1,680.10 *072 Campbell River 119 16.95 * 18.71 64.54 145.01 94.20 42.60 6.79 1,859.29 *075 Mission 101 13.29 * 9.37 51.69 140.12 106.69 36.91 12.90 1,788.38 *076 Agassiz - Harrison 47 32.44 * 27.68 78.85 140.27 80.97 19.69 11.15 1,793.08 077 Summerland 15 7.49 - 42.02 134.15 147.37 32.92 3.10 1,797.75 078 Enderby 27 20.67 * 12.45 47.24 155.44 139.24 31.25 4.81 1,952.15 *080 Kitimat 44 22.99 * 31.55 60.77 100.84 89.93 27.97 - 1,555.30 081 Fort Nelson 51 52.69 * 32.41 147.37 88.65 58.82 15.15 8.77 1,755.88 083 Central Coast 17 51.99 * 84.75 200.00 90.91 127.66 37.74 27.03 2,840.39 *084 Vancouver Island West 19 48.59 * 69.44 160.71 111.11 162.16 36.36 - 2,698.98 *085 Vancouver Island North 89 40.33 * 28.57 81.02 161.62 101.54 50.15 8.20 2,155.44 *087 Stikine 2 15.75 41.67 - 83.33 31.25 27.78 - 920.14 088 Terrace 120 29.15 * 24.51 77.02 147.47 105.36 38.17 4.04 1,982.88 *092 Nisga'a 38 85.78 * 65.22 119.40 115.38 89.29 13.70 14.93 2,089.57 094 Telegraph Creek 5 32.89 - 52.63 43.48 62.50 111.11 - 1,348.60 161 Vancouver - City Centre 15 2.71 * 0.98 10.60 19.70 47.71 46.33 15.03 701.84 *162 Vancouver - Dwntwn E. side 65 12.24 3.52 24.44 32.72 60.79 57.72 14.31 967.52 *163 Vancouver - North East 84 6.01 * 5.03 18.25 48.33 94.50 66.89 13.44 1,232.19 *164 Vancouver - Westside 21 1.06 * 0.70 3.97 23.81 83.36 68.66 17.01 987.56 *165 Vancouver - Midtown 44 4.72 * 1.80 12.20 39.31 82.98 73.86 18.90 1,145.28 *166 Vancouver - South 94 4.76 * 2.74 16.99 55.80 87.21 60.49 14.39 1,188.13 *201 Surrey 584 9.33 * 7.83 47.37 118.59 117.72 58.75 10.97 1,806.16 *202 South Surrey/White Rock 32 2.57 * 1.70 18.08 85.37 147.55 78.42 13.87 1,724.95 * ProVincial total 7,022 10.21 8.52 34.15 76.77 97.90 55.30 11.05 1,418.44

42 b i r t h - r e l a t e d s t a t i s t i c s
Note:
figure 29liVe Birth teenaGe fertilitY rateS BY local health area
br i t i s h co l u M b i a, 2006-2010
notes for table 101ASFR: Live births per 1,000 women in each specific age group of childbearing age. 2TFR: Sum of age-specific (15 to 44 years) fertility rates multiplied by the number of years in each age group (see Glossary for definition).
*Statistical testing indicates that fertility rate is significantly different from the average rate (p<0.05, two-tailed).
Non-residents are excluded.
see inset 2
see inset 1
Inset 2
Inset 1
Statistically Significant
QUintile (rates)
5 (>25.89)
4 (15.17 - 25.89)
3 (10.21 - 15.17)
3 (6.41 - 10.21)
1 (<6.41)
ASFR - Live births per 1,000 women age 15 to 19 years. Refer to Figure 1 to clarify geographical location of LHAs.

b i r t h - r e l a t e d s t a t i s t i c s 43
table 11liVe BirthS BY moDe of DeliVerY anD aGe of mother
br i t i s h co l u M b i a, 2011
Age of Mother (in Years)Mode of Delivery <15 15–19 20–24 25–29 30–34 35–39 40–44 45+ N.S. Total
Spontaneous vertex 5 812 3,626 7,640 8,553 4,302 826 35 1 25,800 Percent 83.3 70.0 67.2 61.9 57.3 52.3 45.6 28.0 50.0 58.6 Spontaneous breech - 4 14 39 54 29 2 3 1 146 Percent 0.0 0.3 0.3 0.3 0.4 0.4 0.1 2.4 50.0 0.3 Forceps 1 32 133 398 563 263 60 3 - 1,453 Percent 16.7 2.8 2.5 3.2 3.8 3.2 3.3 2.4 3.3 Vacuum - 86 358 821 945 453 93 3 - 2,759 Percent 0.0 7.4 6.6 6.6 6.3 5.5 5.1 2.4 6.3 First cesarean - 208 937 2,321 2,797 1,685 453 52 - 8,453 Percent 0.0 17.9 17.4 18.8 18.7 20.5 25.0 41.6 19.2 Repeat cesarean - 18 324 1,128 2,006 1,496 376 29 - 5,377 Percent 0.0 1.6 6.0 9.1 13.4 18.2 20.8 23.2 12.2 N.S. - - - 2 - 1 - - - 3 total 6 1,160 5,392 12,349 14,918 8,229 1,810 125 2 43,991 Percent 100.0 100.0 100.0 100.0 100.0 100.0 100.0 100.0 100.0 100.0
Note: Breechpresentationsmaybecodedtoforceps,vacuum,firstcesareanorrepeatcesareanmodeofdelivery,aswellasspontaneous breech. Total percentage may not add up to 100 due to rounding. Non-residents are excluded. N.S. - Not stated.

44 b i r t h - r e l a t e d s t a t i s t i c s
Vital Statistics Information BoxVital Statistics Information Box
PlaCE of BiRth foR midwifE assistEd BiRthsbr i t i s h co l u M b i a, 2007-2011
The College of Midwives of British Columbia was established in 1995, and the first midwives were registered to practice in 1998. the Vital Statistics agency implemented procedures to identify births delivered by registered midwives in 1998, and, by 1999, could identify all midwife assisted births. the table below shows the place of birth for midwife assisted births in the province from 2007 to 2011.
Note: *Other and unknown includes birthing clinics.
2007 2008 2009 2010 2011 Place of Birth no. % no. % no. % no. % no. %
Hospital 2053 75.6 2509 76.2 2,944 75.9 3394 77.3 3791 77.0
Home 647 23.8 726 22.1 856 22.1 916 20.9 1057 21.5
Other & unknown* 16 0.6 57 1.7 77 2.0 83 1.9 76 1.5
midwife assisted 2,716 100.0 3,292 100.0 3,877 100.0 4,393 100 4,924 100.0Births 6.2 7.5 8.6 10.1 11.2
Percent of totalBirths Deliveredby registeredmidwives
Tab
leL
IVE
BIR
TH
S B
Y L
OC
AL
HE
AL
TH
AR
EA
AN
D M
OD
E O
F D
EL
IVE
RY
, b
rit
ish
co
lu
Mb
ia,
2011
12

b i r t h - r e l a t e d s t a t i s t i c s 45 Spontaneous Cesarean Total Live BirthsLocal Health Area Vertex First Repeat Total Expected Ratio (p) Percent Other N.S. Number Rate
Tab
leL
IVE
BIR
TH
S B
Y L
OC
AL
HE
AL
TH
AR
EA
AN
D M
OD
E O
F D
EL
IVE
RY
, b
rit
ish
co
lu
Mb
ia,
2011
12
Notes for this table follow the map.
45
001 Fernie 79 30 21 51 48.73 1.05 32.9 25 - 155 10.23 002 Cranbrook 140 51 26 77 70.42 1.09 34.4 7 - 224 8.72 003 Kimberley 46 14 6 20 21.06 0.95 29.9 1 - 67 7.78 004 Windermere 41 21 8 29 24.21 1.20 37.7 7 - 77 7.09 005 Creston 75 18 11 29 34.27 0.85 26.6 5 - 109 8.46 006 Kootenay Lake 11 1 1 2 4.72 0.42 13.3 2 - 15 3.81 007 Nelson 161 30 19 49 72.31 0.68 * 21.3 20 - 230 9.04 009 Castlegar 85 16 15 31 39.93 0.78 24.4 11 - 127 9.30 010 Arrow Lakes 15 2 - 2 5.66 0.35 11.1 1 - 18 3.70 011 Trail 130 40 19 59 64.45 0.92 28.8 16 - 205 10.62 012 Grand Forks 33 14 7 21 17.29 1.21 38.2 1 - 55 6.24 013 Kettle Valley 10 - 3 3 4.09 0.73 23.1 - - 13 3.49 014 Southern Okanagan 72 17 16 33 39.30 0.84 26.4 20 - 125 6.44 015 Penticton 197 40 42 82 101.86 0.81 * 25.3 45 - 324 7.83 016 Keremeos 20 3 4 7 8.80 0.80 25.0 1 - 28 5.34 017 Princeton 18 5 - 5 9.12 0.55 17.2 6 - 29 5.43 018 Golden 36 17 12 29 22.01 1.32 41.4 5 - 70 9.52 019 Revelstoke 48 16 10 26 25.46 1.02 32.1 7 - 81 10.14 020 Salmon Arm 170 45 49 94 89.28 1.05 33.1 20 - 284 8.14 021 Armstrong - Spallumcheen 59 9 13 22 27.98 0.79 24.7 8 - 89 9.29 022 Vernon 380 93 72 165 181.71 0.91 28.5 33 - 578 8.78 023 Central Okanagan 1,001 301 206 507 515.90 0.98 30.9 133 - 1,641 8.77 024 Kamloops 616 182 143 325 321.30 1.01 31.8 81 - 1,022 9.15 025 100 Mile House 56 12 12 24 27.98 0.86 27.0 9 - 89 5.95 026 North Thompson 14 8 2 10 7.55 1.33 41.7 - - 24 5.59 027 Cariboo - Chilcotin 151 51 38 89 81.74 1.09 34.2 20 - 260 9.68 028 Quesnel 130 47 32 79 70.11 1.13 35.4 14 - 223 9.27 029 Lillooet 24 7 8 15 12.58 1.19 37.5 1 - 40 8.78 030 South Cariboo 44 8 7 15 19.18 0.78 24.6 2 - 61 8.15 031 Merritt 85 20 20 40 41.50 0.96 30.3 7 - 132 11.44 032 Hope 46 11 8 19 21.38 0.89 27.9 3 - 68 8.32 033 Chilliwack 622 185 145 330 323.50 1.02 32.1 76 1 1,029 11.75 034 Abbotsford 1,006 355 201 556 544.82 1.02 32.1 170 1 1,733 12.43 035 Langley 912 261 181 442 462.14 0.96 30.1 116 - 1,470 11.09 037 Delta 453 163 143 306 266.91 1.15 * 36.0 90 - 849 8.40 038 Richmond 926 270 206 476 498.30 0.96 30.0 183 - 1,585 8.02 040 New Westminster 415 157 65 222 224.15 0.99 31.1 76 - 713 10.50 041 Burnaby 1,227 547 248 795 715.85 1.11 * 34.9 255 - 2,277 9.92 042 Maple Ridge 513 222 120 342 297.09 1.15 * 36.2 90 - 945 9.83 043 Coquitlam 1,166 427 274 701 658.63 1.06 33.5 227 1 2,095 9.40 044 North Vancouver 716 271 156 427 393.29 1.09 34.1 108 - 1,251 8.77 045 West Vancouver-Bowen Is. 144 55 40 95 81.43 1.17 36.7 20 - 259 4.89 046 Sunshine Coast 122 35 27 62 67.28 0.92 29.0 30 - 214 7.05 047 Powell River 100 14 13 27 43.70 0.62 * 19.4 12 - 139 6.90 048 Howe Sound 271 112 54 166 150.90 1.10 34.6 43 - 480 13.04 049 Bella Coola Valley 26 6 3 9 11.63 0.77 24.3 2 - 37 12.56 050 Queen Charlotte 42 7 7 14 18.23 0.77 24.1 2 - 58 12.55 051 Snow Country 4 - - - 1.26 - - - - 4 7.34 052 Prince Rupert 98 27 25 52 52.19 1.00 31.3 16 - 166 11.59 053 Upper Skeena 51 7 4 11 21.38 0.51 * 16.2 6 - 68 12.52 054 Smithers 127 26 19 45 58.48 0.77 24.2 14 - 186 11.44 055 Burns Lake 60 9 9 18 25.15 0.72 22.5 2 - 80 10.06 056 Nechako 137 29 38 67 68.54 0.98 30.7 14 - 218 14.37 057 Prince George 692 184 121 305 328.53 0.93 29.2 48 - 1,045 10.73 059 Peace River South 205 54 57 111 108.78 1.02 32.1 30 - 346 12.40 060 Peace River North 408 98 81 179 193.97 0.92 29.0 30 - 617 17.17 061 Greater Victoria 1,074 350 213 563 555.51 1.01 31.9 130 - 1,767 7.91 062 Sooke 511 134 118 252 253.71 0.99 31.2 44 - 807 11.36 063 Saanich 275 56 40 96 124.81 0.77 * 24.2 26 - 397 6.21 064 Gulf Islands 60 13 7 20 26.09 0.77 24.1 3 - 83 5.12 065 Cowichan 388 70 48 118 168.19 0.70 * 22.1 29 - 535 9.22 066 Lake Cowichan 29 4 3 7 12.26 0.57 17.9 3 - 39 6.03 067 Ladysmith 99 20 14 34 45.90 0.74 23.3 13 - 146 7.76 068 Nanaimo 626 146 99 245 302.12 0.81 * 25.5 90 - 961 9.09 069 Qualicum 141 42 26 68 74.19 0.92 28.8 27 - 236 5.21 070 Alberni 198 60 47 107 107.52 1.00 31.3 37 - 342 10.80 071 Courtenay 341 90 61 151 165.05 0.91 28.8 33 - 525 8.10 072 Campbell River 224 74 49 123 123.55 1.00 31.3 46 - 393 9.37 075 Mission 297 73 60 133 149.33 0.89 28.0 45 - 475 11.17 076 Agassiz - Harrison 51 16 14 30 27.98 1.07 33.7 8 - 89 9.84 077 Summerland 47 8 5 13 23.26 0.56 * 17.6 14 - 74 6.49 078 Enderby 50 14 6 20 22.95 0.87 27.4 3 - 73 9.54 080 Kitimat 48 19 15 34 27.98 1.22 38.2 7 - 89 8.76 081 Fort Nelson 55 12 13 25 26.72 0.94 29.4 5 - 85 13.22 083 Central Coast 25 3 2 5 9.75 0.51 16.1 1 - 31 20.79 084 Vancouver Island West 22 4 1 5 8.80 0.57 17.9 1 - 28 12.12 085 Vancouver Island North 89 22 15 37 46.53 0.80 25.0 22 - 148 12.04 087 Stikine 5 1 - 1 1.89 0.53 16.7 - - 6 6.28 088 Terrace 191 27 13 40 75.45 0.53 * 16.7 9 - 240 11.62 092 Nisga'a 21 1 3 4 8.49 0.47 14.8 2 - 27 13.80 094 Telegraph Creek 4 2 - 2 1.89 1.06 33.3 - - 6 8.46 161 Vancouver - City Centre 512 301 62 363 327.90 1.11 34.8 168 - 1,043 8.61 162 Vancouver - Dwntwn E.Side 350 132 43 175 192.72 0.91 28.5 88 - 613 8.59 163 Vancouver - North East 537 229 112 341 325.07 1.05 33.0 156 - 1,034 9.72 164 Vancouver - Westside 609 233 125 358 350.22 1.02 32.1 147 - 1,114 8.09 165 Vancouver - Midtown 575 227 93 320 326.96 0.98 30.8 145 - 1,040 10.84 166 Vancouver - South 668 223 155 378 384.80 0.98 30.9 178 - 1,224 8.99 201 Surrey 2,873 1,060 760 1,820 1,680.37 1.08 * 34.1 652 - 5,345 13.21 202 South Surrey/White Rock 369 137 88 225 204.03 1.10 34.7 55 - 649 7.34 ProVincial total 25,800 8,453 5,377 13,830 13,830.00 1.00 31.4 4,358 3 43,991 9.62

46 b i r t h - r e l a t e d s t a t i s t i c s
Note:
notes for table 12Note: Ratio – observed over the expected cesareans in the specified area. Percent based upon live births in the specified area. Rate per 1,000 population in the specified area.
*Statistical testing indicates that observed cesarean births are significantly different from the expected (p<0.05, two-tailed).
+Denotes significance based on less than five births. Other is comprised of spontaneous breech, forceps, and vacuum. Total includes residents with unknown LHA.
N.S. - Not Stated.
figure 30ceSarean DeliVerieS of liVe Born infantS
BY local health areabr i t i s h co l u M b i a, 2011
Statistically Significant
QUintile (ratio)
5 (>1.09)
4 (1.00 - 1.09)
3 (0.91 - 1.00)
3 (0.75 - 0.91)
1 (<0.75)
Inset 2
Inset 1
see inset 2
see inset 1
Ratio - Observed over the expected. Refer toFigure 1 to clarify geographical location of LHAs.

b i r t h - r e l a t e d s t a t i s t i c s 47
Births – Birth Weight
Birth weight is recognized as a primary indicator of newborn health not only in BC and Canada but worldwide. It is also an important predictor of subsequent health and well being, as well as disability and death, among newborn infants. In BC, a baby is weighed (in grams) immediately after birth, and that weight is used as one of the diagnostic indicators of fetal growth.
The following tables show birth weight categorized by other indicators related to birth weight, such as gender, gestational age, and maternal age.
Babies born at term (37 to 41 weeks) and between 2,500 and 4,499 grams have been shown to have the most favourable prospects for good health. Table 13 indicates that 39,088 births or 88.9 percent of all live births in 2011 were in that category. There were 3,188 pre-term births (less than 37 weeks), which accounted for 7.2 percent of all live births.
Table 14 shows the number of live births to residents of BC in 2011 according to maternal age group and infant birth weight category. By far, most of the babies in each age group had healthy weights (from 2,500 to 4,499 grams).
Table 14 shows that mothers in the mid-age categories had the largest proportions of healthy weight babies and the lowest proportions of Low Birth Weight (LBW) babies (weighing less than 2,500 grams).
Table 15 displays the number and percent of LBW babies by gender according to the mother’s age group. Female babies have a higher rate of LBW (59.11 per 1,000 female live births) than males (53.25 per 1,000 male live births).
Figure 31 graphically shows the pattern of LBW by maternal age groups. Women in the middle age groups had the lowest rates of LBW babies in 2011 with increasing rates in subsequent age groups. Older mothers not only have increased rates of LBW babies but the rate among older mothers has shown an increasing trend since 1986 as indicated in Figure 10.
Table 16 shows the incidence of LBW babies in the period 2006 to 2010 and the year 2011, stratified by the LHA of maternal residence for the whole province. As well as the incidence of such births, the 2006 to 2010 portion of the table shows the LBW rate per 1,000 live births and the ratio of the observed and expected number of LBW births in the LHA.
There were 14 LHAs with ratios that were statistically significant. Of these, 6 were high. The 2011 data show the incidence figures broken down by three categories: gestational age of the newborn, the total number of LBW births, and the rate. In some LHAs the number of LBW babies was quite low in 2011, so the rates should be interpreted with caution.
Figure 32 shows BC LHAs displayed in five levels according to the 2006 to 2010 observed versus expected LBW ratio. High ratios (Quintile 5, dark green colour) mean that an LHA had quite a high ratio in the years 2006 to 2010. At the other extreme, the areas shown as dark grey had a relatively low ratio.

48 b i r t h - r e l a t e d s t a t i s t i c s
Note: Non-residents are excluded. N.S. – Not stated.
table 13liVe BirthS BY Birth WeiGht, GenDer, anD GeStational aGe
br i t i s h co l u M b i a, 2011
Birth Weight Gender Gestational Age (in Weeks) (in Grams) Male Female <20 20–27 28–36 37–41 42+ N.S. Total
<500 16 18 5 27 - 2 - - 34 500-749 24 28 - 46 6 - - - 52 750-999 37 37 - 48 26 - - - 74 1,000-1,249 49 44 - 20 70 3 - - 93 1,250-1,499 61 71 - 6 123 3 - - 132 1,500-1,749 92 102 - 2 183 9 - - 194 1,750-1,999 156 166 - - 292 30 - - 322 2,000-2,249 281 267 - - 420 128 - - 548 2,250-2,499 486 533 - - 508 511 - - 1,019 2,500-2,749 964 1,215 - - 550 1,629 - - 2,179 2,750-2,999 1,989 2,525 - - 410 4,094 10 - 4,514 3,000-3,249 3,316 3,946 - - 250 6,991 21 - 7,262 3,250-3,499 4,379 4,458 - - 102 8,701 34 - 8,837 3,500-3,749 4,244 3,690 - - 48 7,842 44 - 7,934 3,750-3,999 3,237 2,334 - - 23 5,488 60 - 5,571 4,000-4,249 1,840 1,247 - - 11 3,032 44 - 3,087 4,250-4,499 883 474 - - 6 1,311 40 - 1,357 4,500-4,749 319 179 - - 2 486 10 - 498 4,750-4,999 120 47 - - 1 163 3 - 167 5,000-5,249 42 12 - - 1 52 1 - 54 5,250-5,499 14 7 - - - 21 - - 21 5,500+ 4 3 - - - 7 - - 7 N.S. 20 15 2 - - - - 33 35 total 22,573 21,418 7 149 3,032 40,503 267 33 43,991

b i r t h - r e l a t e d s t a t i s t i c s 49
table 14liVe BirthS BY Birth WeiGht anD aGe of mother
br i t i s h co l u M b i a, 2011
Birth Weight Age of Mother (in Years) (in Grams) <15 15–19 20–24 25–29 30–34 35–39 40–44 45+ N.S. Total
Note: Low birth weight <2,500 grams. Healthy birth weight 2,500 to 4,499 grams. High birth weight 4,500+ grams. Percent of agecategory in birth weight group. Non-residents are excluded. N.S. - Not stated.
<500 - 2 3 10 14 2 1 2 - 34500-749 - 2 10 12 16 9 3 - - 52750-999 - 3 4 18 16 21 12 - - 741,000-1,249 - 1 13 25 29 22 3 - - 931,250-1,499 - 3 14 31 45 30 9 - - 1321,500-1,749 - 5 17 41 60 56 14 1 - 1941,750-1,999 - 8 34 92 109 64 13 2 - 3222,000-2,249 - 19 55 121 168 146 34 5 - 5482,250-2,499 - 24 121 286 316 215 52 4 1 1,0192,500-2,749 - 58 248 577 771 401 108 16 - 2,1792,750-2,999 1 139 553 1,297 1,490 827 193 14 - 4,5143,000-3,249 3 172 879 2,033 2,506 1,337 314 18 - 7,2623,250-3,499 2 215 1,108 2,499 2,991 1,637 357 27 1 8,8373,500-3,749 - 215 970 2,284 2,668 1,490 290 17 - 7,9343,750-3,999 - 145 668 1,584 1,932 1,017 213 12 - 5,5714,000-4,249 - 89 424 836 1,072 549 114 3 - 3,0874,250-4,499 - 43 168 367 478 255 45 1 - 1,3574,500-4,749 - 11 60 162 149 98 18 - - 4984,750-4,999 - 1 28 44 50 36 5 3 - 1675,000-5,249 - 2 9 14 20 4 5 - - 545,250-5,499 - 2 4 5 4 4 2 - - 21 5,500+ - - - 3 1 2 1 - - 7Low - 67 271 636 773 565 141 14 1 2,468Percent - 5.8 5.0 5.2 5.2 6.9 7.8 11.2 50.0 5.6Healthy 6 1,076 5,018 11,477 13,908 7,513 1,634 108 1 40,741Percent 100.0 92.8 93.1 92.9 93.2 91.3 90.3 86.4 50.0 92.6High - 16 101 228 224 144 31 3 - 747Percent - 1.4 1.9 1.8 1.5 1.7 1.7 2.4 - 1.7 N.S. - 1 2 8 13 7 4 - - 35total 6 1,160 5,392 12,349 14,918 8,229 1,810 125 2 43,991

50 b i r t h - r e l a t e d s t a t i s t i c s
table 15loW Birth WeiGht liVe BirthS BY aGe of mother anD GenDer
br i t i s h co l u M b i a, 2011
Age of Male Female TotalMother Number Percent Number Percent Number Percent Rate
< 15 - - - - - - - 15-19 35 2.9 32 2.5 67 2.7 57.76 20-24 137 11.4 134 10.6 271 11.0 50.26 25-29 315 26.2 321 25.4 636 25.8 51.50 30-34 374 31.1 399 31.5 773 31.3 51.82 35-39 271 22.5 294 23.2 565 22.9 68.66 40-44 63 5.2 78 6.2 141 5.7 77.90 45 + 6 0.5 8 0.6 14 0.6 112.00 N.S. 1 0.1 - - 1 0.0 + total 1,202 100.0 1,266 100.0 2,468 100.0 56.10
Note: Rate per 1,000 live births for the specified age group. Low birth weight: birth weight less than 2,500 grams. Total percentage may not add up to 100 due to rounding. Total includes unknown gender. + Denotes the number of cases is less than five Non-residents are excluded. N.S. – Not stated.
figure 31loW Birth WeiGht liVe BirthS BY aGe of mother
br i t i s h co l u M b i a, 2011
57.76
50.26 51.50 51.82
68.66
77.90
112.00
0
20
40
60
80
100
120
15-19 20-24 25-29 30-34 35-39 40-44 45 +
age of mother (in Years)
rate per 1,000 live Births

b i r t h - r e l a t e d s t a t i s t i c s 51 2006–2010 2011 Low Birth Weight Live Births Gestational Age (in Weeks)
Local Health Area Observed Ratio (p) Rate <37 37–41 42+ N.S. Total Rate
001 Fernie 33 0.81 44.84 1 1 - - 2 12.90 002 Cranbrook 76 1.07 59.14 6 5 - - 11 49.11 003 Kimberley 27 1.23 68.35 2 3 - - 5 74.63 004 Windermere 35 1.40 77.95 2 3 - - 5 64.94 005 Creston 38 1.18 65.40 4 1 - - 5 45.87 006 Kootenay Lake 5 0.70 39.06 - - - - - - 007 Nelson 61 0.93 51.87 2 5 - - 7 30.43 009 Castlegar 22 0.82 45.74 3 2 - - 5 39.37 010 Arrow Lakes 6 0.67 37.04 - - - - - - 011 Trail 44 0.98 54.12 9 5 - - 14 68.29 012 Grand Forks 15 0.92 51.02 8 2 - - 10 181.82 013 Kettle Valley 5 0.83 46.30 - - - - - - 014 Southern Okanagan 51 1.43 * 79.32 3 3 - - 6 48.00 015 Penticton 79 0.86 47.85 14 2 - - 16 49.38 016 Keremeos 9 0.83 45.92 - - - - - - 017 Princeton 19 2.38 * 131.94 1 - - - 1 34.48 018 Golden 18 0.94 52.33 - 3 - - 3 42.86 019 Revelstoke 19 0.86 47.50 3 1 - - 4 49.38 020 Salmon Arm 61 0.83 46.00 12 6 - - 18 63.38 021 Armstrong - Spallumcheen 19 0.77 42.79 1 - - - 1 11.24 022 Vernon 142 0.90 50.19 28 9 - - 37 64.01 023 Central Okanagan 393 0.88 * 49.04 65 19 - - 84 51.19 024 Kamloops 297 1.04 57.64 42 10 - - 52 50.88 025 100 Mile House 30 1.06 59.06 8 - - - 8 89.89 026 North Thompson 17 1.39 76.92 - - - - - - 027 Cariboo - Chilcotin 80 1.00 55.48 15 4 - - 19 73.08 028 Quesnel 77 1.10 61.21 15 1 - - 16 71.75 029 Lillooet 13 1.02 56.52 2 - - - 2 50.00 030 South Cariboo 25 1.49 82.51 1 - - - 1 16.39 031 Merritt 25 0.75 41.88 8 5 - - 13 98.48 032 Hope 18 0.92 50.99 3 - - - 3 44.12 033 Chilliwack 237 0.84 * 46.61 28 5 - - 33 32.07 034 Abbotsford 452 0.95 52.66 73 30 - - 103 59.43 035 Langley 359 0.94 52.07 58 14 - - 72 48.98 037 Delta 251 1.05 58.44 40 17 - - 57 67.14 038 Richmond 456 0.97 53.79 56 32 - - 88 55.52 040 New Westminster 215 1.12 62.30 27 12 - - 39 54.70 041 Burnaby 618 0.99 54.75 96 42 - - 138 60.61 042 Maple Ridge 269 1.01 55.86 33 17 - - 50 52.91 043 Coquitlam 630 1.07 59.28 82 25 - - 107 51.07 044 North Vancouver 322 0.96 53.37 56 21 - - 77 61.55 045 West Vancouver-Bowen Is. 63 0.84 46.63 9 4 - - 13 50.19 046 Sunshine Coast 46 0.77 42.87 5 2 - - 7 32.71 047 Powell River 32 0.83 46.04 3 3 - - 6 43.17 048 Howe Sound 112 0.87 48.21 15 7 - - 22 45.83 049 Bella Coola Valley 19 1.62 90.05 1 1 - - 2 54.05 050 Queen Charlotte 7 0.58 32.41 - - - - - - 051 Snow Country 2 1.72 95.24 2 - - - 2 500.00 052 Prince Rupert 39 0.76 42.03 4 1 - - 5 30.12 053 Upper Skeena 13 0.73 40.75 3 2 - - 5 73.53 054 Smithers 50 0.83 46.21 1 - - - 1 5.38 055 Burns Lake 23 0.99 54.89 3 1 - - 4 50.00 056 Nechako 52 0.86 47.62 7 1 - - 8 36.70 057 Prince George 306 1.00 55.50 30 19 - - 49 46.89 059 Peace River South 68 0.74 * 41.09 13 5 - - 18 52.02 060 Peace River North 126 0.77 * 42.51 19 13 - - 32 51.86 061 Greater Victoria 443 0.88 * 49.09 69 24 - - 93 52.63 062 Sooke 170 0.85 * 47.13 30 9 - - 39 48.33 063 Saanich 114 1.05 58.34 23 8 - - 31 78.09 064 Gulf Islands 22 0.87 48.25 2 1 - - 3 36.14 065 Cowichan 151 1.00 55.51 24 9 - - 33 61.68 066 Lake Cowichan 5 0.44 24.51 5 2 - - 7 179.49 067 Ladysmith 42 1.05 58.17 8 4 - - 12 82.19 068 Nanaimo 234 0.93 51.62 27 4 - - 31 32.26 069 Qualicum 62 0.88 49.01 4 4 - - 8 33.90 070 Alberni 92 0.99 54.66 17 5 - - 22 64.33 071 Courtenay 117 0.84 46.54 14 5 - - 19 36.19 072 Campbell River 103 0.95 52.96 11 6 - - 17 43.26 075 Mission 100 0.78 * 43.50 20 8 - - 28 58.95 076 Agassiz - Harrison 28 1.05 58.21 8 1 - - 9 101.12 077 Summerland 20 0.98 54.35 8 - - - 8 108.11 078 Enderby 12 0.57 * 31.66 4 - - - 4 54.79 080 Kitimat 18 0.70 38.71 4 2 - - 6 67.42 081 Fort Nelson 21 0.79 43.84 6 3 - - 9 105.88 083 Central Coast 4 0.51 28.57 1 - - - 1 32.26 084 Vancouver Island West 3 0.49 27.03 2 - - - 2 71.43 085 Vancouver Island North 41 0.96 53.46 5 - - - 5 33.78 087 Stikine 3 1.80 100.00 1 - - - 1 166.67 088 Terrace 68 1.00 55.37 6 - - - 6 25.00 092 Nisga'a 8 0.77 42.78 - - - - - - 094 Telegraph Creek - - - 1 - - - 1 166.67 161 Vancouver - City Centre 268 0.99 54.93 45 22 - - 67 64.24 162 Vancouver - Dwntwn E.side 146 1.08 59.81 27 8 - - 35 57.10 163 Vancouver - North East 347 1.15 * 63.70 62 22 - - 84 81.24 164 Vancouver - Westside 295 0.93 51.74 37 9 - - 46 41.29 165 Vancouver - Midtown 340 1.20 * 66.39 42 26 - - 68 65.38 166 Vancouver - South 469 1.30 * 72.39 52 27 - - 79 64.54 201 Surrey 1,642 1.18 * 65.37 273 102 - - 375 70.16 202 South Surrey/White Rock 167 1.07 59.33 22 11 - - 33 50.85 ProVincial total 12,082 1.00 55.49 1,782 686 - - 2,468 56.10
16L
OW
BIR
TH
WE
IGH
T L
IVE
BIR
TH
S B
Y L
OC
AL
HE
AL
TH
AR
EA
AN
D G
ES
TA
TIO
NA
L A
GE
,
br
itis
h c
ol
uM
bia
, 20
06–2
010
an
d 2
011
Tab
le 1
6
Note:
51
Low Birth Weight – birth weight less than 2,500 grams. Ratio – observed over the expected low birth weight live births. * Statistical testing indicates that observed low birth weight live births are significantly different from the expected (p<0.05, two-tailed). Rate per 1,000 live births in the specified area. Total includes residents with unknown LHA. N.S. - Not Stated.

52 b i r t h - r e l a t e d s t a t i s t i c s
figure 32loW Birth WeiGht liVe BirthS BY local health area
br i t i s h co l u M b i a, 2006–2010
Note:
Statistically Significant
QUintile (ratio)
5 (>1.11)
4 (1.00 - 1.11)
3 (0.91 - 1.00)
3 (0.80 - 0.91)
1 (<0.80)
see inset 2
see inset 1
Inset 1
Inset 2
Ratio - Observed over the expected. Refer toFigure 1 to clarify geographical location of LHAs.

b i r t h - r e l a t e d s t a t i s t i c s 53
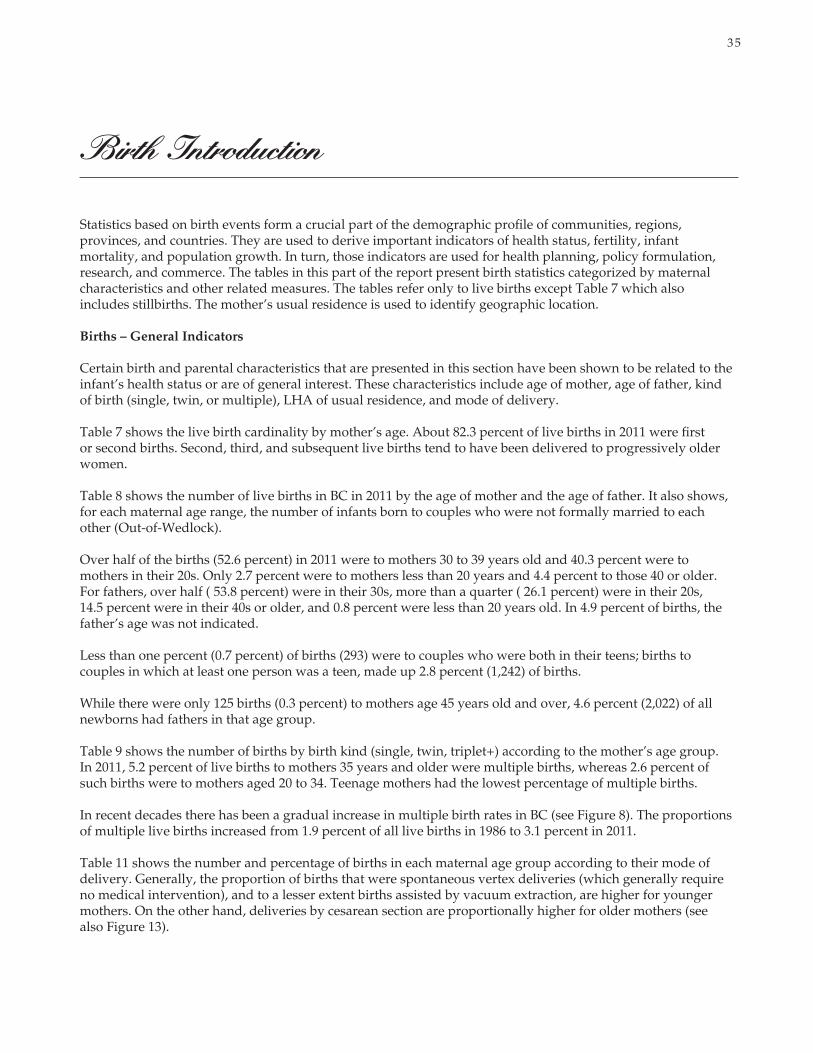
table 17maternal comPlicationS of PreGnancY anD
DeliVerY in liVe BirthS BY aGe of motherbr i t i s h co l u M b i a, 2006–2010 a n d 2011
2011 2006–2010 Age of Mother (in Years)Maternal Complications ICD-10 Code(s) Total Percent <20 20–29 30–39 40+ N.S. Total Percent
Note: Percent based upon maternal complications. Percent (*) based upon live births for the specified maternal age group. 1Where no other complication code is found. Total percentage may not add up to 100 due to rounding. N.S. - Not Stated. Non-residents are excluded.
Hypertension/hypertensive O10-O11, 2,607 1.6 17 211 301 39 - 568 1.7disorders in pregnancy O13, O16 Edema and proteinuria O12 22 0.0 1 1 2 - - 4 0.0without hypertension Pre-eclampsia/eclampsia O14-O15 1,039 0.7 11 82 118 14 - 225 0.7Hemorrhage in early pregnancy O20 5 0.0 - - 1 - - 1 0.0Hyperemesis gravidarum O21 60 0.0 - 6 8 - - 14 0.0Other maternal disorders O22-O23, 1,942 1.2 24 191 279 17 - 511 1.6predominantly related to O25-O29pregnancy Diabetes in pregnancy O24 2,579 1.6 6 218 470 71 - 765 2.3Multiple gestation and O30-O31 6,643 4.2 12 382 855 118 2 1,369 4.2related complications Fetal malpresentation O32 6,890 4.4 30 494 675 58 - 1,257 3.8Disproportion O33 402 0.3 3 34 29 2 - 68 0.2Maternal abnormality of O34 26,863 17.0 19 1,442 3,422 396 - 5,279 16.1pelvic organsDisorders of amniotic fluid O40-O42 4,378 2.8 32 368 534 62 - 996 3.0and membranes Placental disorders O43-O45, 2,327 1.5 9 186 345 35 - 575 1.7 O73Antepartum hemorrhage O46 421 0.3 - 29 52 6 - 87 0.3Prolonged pregnancy O48 1,183 0.7 4 88 137 9 - 238 0.7Preterm labour and delivery O60 9,195 5.8 56 656 790 58 - 1,560 4.7Abnormalities of forces of labour O62-O63 6,926 4.4 39 718 815 62 - 1,634 5.0Obstructed labour O64-O66 12,412 7.9 79 1,125 1,228 88 - 2,520 7.7Intrapartum hemorrhage O67 0 - - - - - - - 0.0Evidence of fetal distress O68 9,554 6.0 72 850 1,065 89 - 2,076 6.3Cord complications O69 2,685 1.7 15 263 259 23 - 560 1.7Obstetrical trauma O70-O71 1,879 1.2 17 215 216 10 - 458 1.4Postpartum hemorrhage O72 2,287 1.4 29 258 236 12 - 535 1.6Assisted or surgical delivery - O81-O82 31,463 19.9 150 2,604 3,681 384 - 6,819 20.7no cause given1 Maternal and puerperal O85-O86, 403 0.3 4 14 36 3 - 57 0.2infections O98, A34Other puerperal complications O87-O92 68 0.0 1 2 8 - - 11 0.0Maternal noninfectious diseases O99 2,488 1.6 21 253 365 37 - 676 2.1complicating the pregnant stateElderly primigravida Z355 8,657 5.5 - - 1,602 282 - 1,884 5.7Maternal drug use O355 431 0.3 1 36 29 - - 66 0.2Other maternal complications O00-O08 12,212 7.7 69 783 1,125 90 - 2,067 6.3 O350-O353 O356-O36,O47, O61, O74-O75, O95-O97total maternal complications 158,021 100.0 721 11,509 18,683 1,965 2 32,880 100.0live births with the above - number 114,798 519 8,612 13,115 1,284 2 23,532 maternal complications - Percent(*) 52.7 44.5 48.5 56.7 66.4 100 53.5
54 b i r t h - r e l a t e d s t a t i s t i c s
MA
TE
RN
AL
CO
MP
LIC
AT
ION
S O
F P
RE
GN
AN
CY
AN
D D
EL
IVE
RY
IN
LIV
E B
IRT
HS
BY
LO
CA
L H
EA
LT
H A
RE
A,
br
itis
h c
ol
uM
bia
, 20
06–2
010
an
d 2
011
Tab
le
18
2006–2010 2011 Observed Total Observed Expected Total Local Health Area Births Ratio (p) Percent Live Births Births Births Ratio (p) Percent Live Births
001 Fernie 418 1.08 56.8 736 107 82.9 1.29 * 69.0 155 002 Cranbrook 521 0.77 * 40.5 1,285 100 119.8 0.83 44.6 224 003 Kimberley 173 0.83 * 43.8 395 31 35.8 0.86 46.3 67 004 Windermere 221 0.93 49.2 449 42 41.2 1.02 54.5 77 005 Creston 248 0.81 * 42.7 581 56 58.3 0.96 51.4 109 006 Kootenay Lake 47 0.70 * 36.7 128 6 8.0 0.75 40.0 15 007 Nelson 475 0.77 * 40.4 1,176 105 123.0 0.85 45.7 230 009 Castlegar 221 0.87 * 45.9 481 59 67.9 0.87 46.5 127 010 Arrow Lakes 69 0.81 42.6 162 8 9.6 0.83 44.4 18 011 Trail 419 0.98 51.5 813 103 109.7 0.94 50.2 205 012 Grand Forks 138 0.89 46.9 294 32 29.4 1.09 58.2 55 013 Kettle Valley 34 0.60 * 31.5 108 4 7.0 0.58 30.8 13 014 Southern Okanagan 335 0.99 52.1 643 75 66.9 1.12 60.0 125 015 Penticton 915 1.05 55.4 1,651 206 173.3 1.19 * 63.6 324 016 Keremeos 104 1.01 53.1 196 17 15.0 1.14 60.7 28 017 Princeton 69 0.91 47.9 144 16 15.5 1.03 55.2 29 018 Golden 207 1.14 60.2 344 45 37.4 1.20 64.3 70 019 Revelstoke 199 0.94 49.8 400 42 43.3 0.97 51.9 81 020 Salmon Arm 788 1.13 * 59.4 1,326 176 151.9 1.16 62.0 284 021 Armstrong - Spallumcheen 233 1.00 52.5 444 52 47.6 1.09 58.4 89 022 Vernon 1,559 1.05 55.1 2,829 299 309.2 0.97 51.7 578 023 Central Okanagan 4,169 0.99 52.0 8,014 849 877.8 0.97 51.7 1,641 024 Kamloops 2,693 0.99 52.3 5,153 554 546.7 1.01 54.2 1,022 025 100 Mile House 248 0.93 48.8 508 45 47.6 0.95 50.6 89 026 North Thompson 89 0.76 * 40.3 221 11 12.8 0.86 45.8 24 027 Cariboo - Chilcotin 745 0.98 51.7 1,442 152 139.1 1.09 58.5 260 028 Quesnel 672 1.01 53.4 1,258 120 119.3 1.01 53.8 223 029 Lillooet 121 1.00 52.6 230 21 21.4 0.98 52.5 40 030 South Cariboo 142 0.89 46.9 303 21 32.6 0.64 * 34.4 61 031 Merritt 266 0.85 * 44.6 597 65 70.6 0.92 49.2 132 032 Hope 160 0.86 45.3 353 28 36.4 0.77 41.2 68 033 Chilliwack 2,474 0.92 * 48.7 5,085 530 550.4 0.96 51.5 1,029 034 Abbotsford 4,090 0.90 * 47.7 8,583 866 927.0 0.93 * 50.0 1,733 035 Langley 3,491 0.96 * 50.6 6,895 777 786.3 0.99 52.9 1,470 037 Delta 2,305 1.02 53.7 4,295 479 454.2 1.05 56.4 849 038 Richmond 4,389 0.98 51.8 8,477 850 847.9 1.00 53.6 1,585 040 New Westminster 2,048 1.13 * 59.3 3,451 392 381.4 1.03 55.0 713 041 Burnaby 5,930 1.00 52.5 11,287 1,249 1,218.0 1.03 54.9 2,277 042 Maple Ridge 2,615 1.03 54.3 4,816 507 505.5 1.00 53.7 945 043 Coquitlam 6,213 1.11 * 58.5 10,627 1,178 1,120.7 1.05 56.2 2,095 044 North Vancouver 3,240 1.02 53.7 6,033 669 669.2 1.00 53.5 1,251 045 West Vancouver-Bowen Is. 730 1.02 54.0 1,351 147 138.5 1.06 56.8 259 046 Sunshine Coast 592 1.05 55.2 1,073 134 114.5 1.17 62.6 214 047 Powell River 347 0.95 49.9 695 67 74.4 0.90 48.2 139 048 Howe Sound 1,337 1.09 * 57.6 2,323 293 256.8 1.14 * 61.0 480 049 Bella Coola Valley 113 1.02 53.6 211 18 19.8 0.91 48.6 37 050 Queen Charlotte 118 1.04 54.6 216 24 31.0 0.77 41.4 58 051 Snow Country 10 0.90 47.6 21 3 2.1 1.40 75.0 4 052 Prince Rupert 453 0.93 48.8 928 86 88.8 0.97 51.8 166 053 Upper Skeena 193 1.15 60.5 319 38 36.4 1.04 55.9 68 054 Smithers 501 0.88 * 46.3 1,082 78 99.5 0.78 * 41.9 186 055 Burns Lake 195 0.88 46.5 419 38 42.8 0.89 47.5 80 056 Nechako 552 0.96 50.5 1,092 118 116.6 1.01 54.1 218 057 Prince George 2,600 0.89 * 47.2 5,514 489 559.0 0.87 * 46.8 1,045 059 Peace River South 707 0.81 * 42.7 1,655 179 185.1 0.97 51.7 346 060 Peace River North 1,225 0.78 * 41.3 2,964 274 330.1 0.83 * 44.4 617 061 Greater Victoria 4,823 1.01 53.4 9,024 966 945.2 1.02 54.7 1,767 062 Sooke 1,989 1.05 * 55.1 3,607 398 431.7 0.92 49.3 807 063 Saanich 972 0.94 49.7 1,954 187 212.4 0.88 47.1 397 064 Gulf Islands 188 0.78 * 41.2 456 33 44.4 0.74 39.8 83 065 Cowichan 1,227 0.86 * 45.1 2,720 238 286.2 0.83 * 44.5 535 066 Lake Cowichan 98 0.91 48.0 204 20 20.9 0.96 51.3 39 067 Ladysmith 365 0.96 50.6 722 81 78.1 1.04 55.5 146 068 Nanaimo 2,702 1.13 * 59.6 4,533 541 514.1 1.05 56.3 961 069 Qualicum 712 1.07 56.3 1,265 139 126.2 1.10 58.9 236 070 Alberni 1,036 1.17 * 61.6 1,683 177 182.9 0.97 51.8 342 071 Courtenay 1,272 0.96 50.6 2,514 276 280.8 0.98 52.6 525 072 Campbell River 1,162 1.13 * 59.7 1,945 232 210.2 1.10 59.0 393 075 Mission 1,148 0.95 49.9 2,299 240 254.1 0.94 50.5 475 076 Agassiz - Harrison 234 0.92 48.6 481 50 47.6 1.05 56.2 89 077 Summerland 219 1.13 59.5 368 43 39.6 1.09 58.1 74 078 Enderby 198 0.99 52.2 379 31 39.0 0.79 42.5 73 080 Kitimat 248 1.01 53.3 465 51 47.6 1.07 57.3 89 081 Fort Nelson 228 0.90 47.6 479 34 45.5 0.75 40.0 85 083 Central Coast 70 0.95 50.0 140 16 16.6 0.96 51.6 31 084 Vancouver Island West 66 1.13 59.5 111 18 15.0 1.20 64.3 28 085 Vancouver Island North 372 0.92 48.5 767 79 79.2 1.00 53.4 148 087 Stikine 18 1.14 60.0 30 2 3.2 0.62 33.3 6 088 Terrace 562 0.87 * 45.8 1,228 86 128.4 0.67 * 35.8 240 092 Nisga'a 96 0.97 51.3 187 11 14.4 0.76 40.7 27 094 Telegraph Creek 18 0.66 34.6 52 3 3.2 0.93 50.0 6 161 Vancouver - City Centre 2,970 1.15 * 60.9 4,879 630 557.9 1.13 * 60.4 1,043 162 Vancouver - Dwntwn E.side 1,296 1.01 53.1 2,441 345 327.9 1.05 56.3 613 163 Vancouver - North East 2,863 1.00 52.6 5,447 603 553.1 1.09 * 58.3 1,034 164 Vancouver - Westside 3,117 1.04 * 54.7 5,702 609 595.9 1.02 54.7 1,114 165 Vancouver - Midtown 2,803 1.04 * 54.7 5,121 573 556.3 1.03 55.1 1,040 166 Vancouver - South 3,439 1.01 53.1 6,479 669 654.8 1.02 54.7 1,224 201 Surrey 13,637 1.03 * 54.3 25,120 2,886 2,859.2 1.01 54.0 5,345 202 South Surrey/White Rock 1,466 0.99 52.1 2,815 331 347.2 0.95 51.0 649 ProVincial total 114,798 1.00 52.7 217,720 23,532 23,532.0 1.00 53.5 43,991 Note:
54
*Statistical testing indicates that the observed number of births with maternal complications is significantly different from theexpected (p<0.05, two-tailed). Ratio - observed over expected. Percent of observed births is based on total live births. Total includesresidents with unknown LHA. Non-residents are excluded.
b i r t h - r e l a t e d s t a t i s t i c s 55
Note:
figure 33maternal comPlicationS of PreGnancY anD
DeliVerY in liVe BirthS BY local health areabr i t i s h co l u M b i a, 2006–2010
see inset 1
see inset 2
Statistically Significant
QUintile (ratio)
5 (>1.06)
4 (1.00 - 1.06)
3 (0.95 - 1.00)
3 (0.87 - 0.95)
1 (<0.87)
Ratio - Observed over the expected. Refer toFigure 1 to clarify geographical location of LHAs.

56 b i r t h - r e l a t e d s t a t i s t i c s
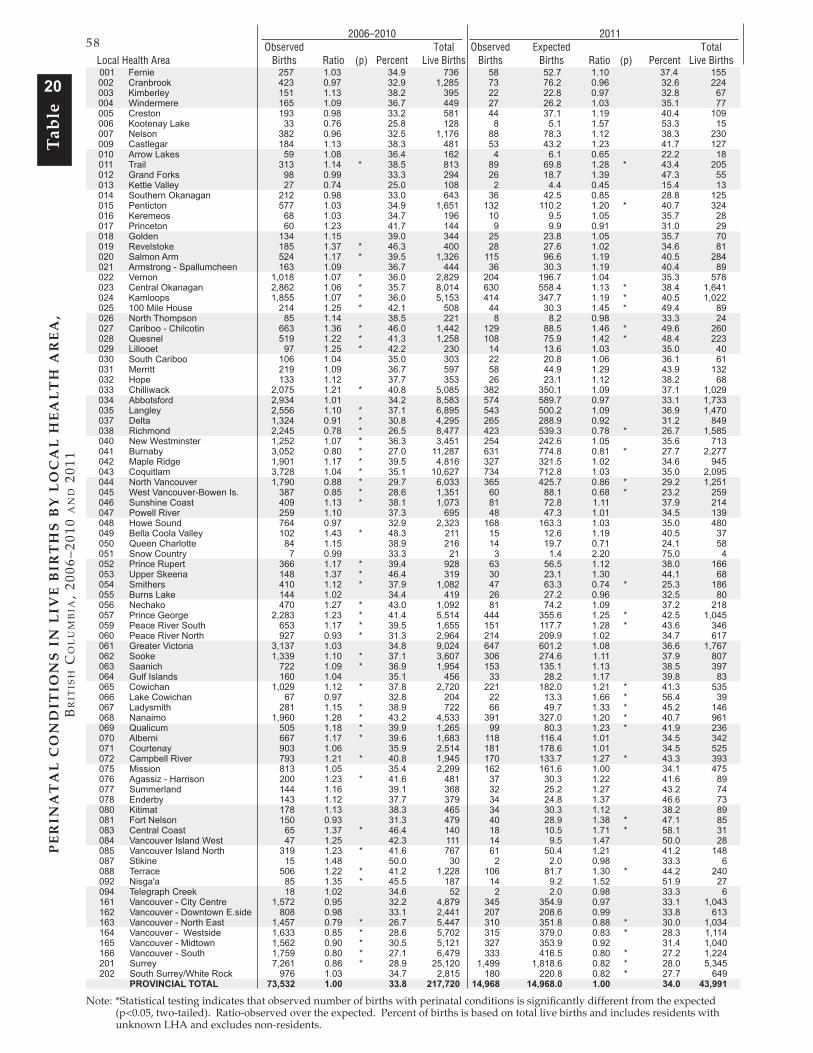
table 19Perinatal conDitionS in liVe BirthS BY aGe of mother
br i t i s h co l u M b i a, 2006–2010 a n d 2011
2011 2006–2010 Age of Mother (in Years)Perinatal Conditions ICD-10 Code Total Percent <20 20–29 30–39 40+ N.S. Total Percent
Fetus/newborn affected by P00 127 0.1 5 21 44 8 - 78 0.4maternal conditions that maybe unrelated to presentpregnancy Complications of pregnancy, P01, P03 12,303 13.0 70 1,133 1,798 201 2 3,204 15.3labour and deliveryFetus/newborn affected by P02 3,062 3.2 25 362 505 47 - 939 4.5complications of placenta, cord and membranesFetus affected by noxious P04 83 0.1 7 57 45 2 - 111 0.5influences transmitted viaplacenta (or breast milk)Slow fetal growth and P05 1,582 1.7 9 106 136 8 - 259 1.2malnutritionPerinatal disorders related P072, P073 15,823 16.7 87 1,149 1,615 190 - 3,041 14.6to short gestationDisorders related to long P08 20,448 21.6 97 1,364 1,830 148 - 3,439 16.5gestation or high birth weight Perinatal birth trauma P10-P15 343 0.4 4 58 36 1 - 99 0.5Intrauterine hypoxia and P20-P21 39,967 42.1 303 3,459 4,040 370 2 8,174 39.2birth asphyxiaRespiratory conditions of P22-P28 454 0.5 50 638 628 49 - 1,365 6.5fetus and newbornCardiovascular disorders P29 - - - - - - - - -originating in the perinatal periodInfections specific to P35-P39 19 0.0 - 5 4 - - 9 0.0the perinatal periodFetal and neonatal hemorrhage P50-P52, P54 81 0.1 2 6 3 - - 11 0.1Perinatal jaundice/other P53, P55-P61 51 0.1 1 9 6 - - 16 0.1hematological disordersPerinatal endocrine and P70-P74 34 0.0 1 - 4 1 - 6 0.0metabolic disordersDigestive system disorders of P76-P78 4 0.0 - 1 - - - 1 0.0fetus and newbornPerinatal conditions of the P80-P83 170 0.2 1 22 25 3 - 51 0.2integument and oftemperature regulation Other disorders originating P90-P96 333 0.4 4 45 25 - - 74 0.4in the perinatal periodall Perinatal conditions 94,884 100.0 666 8,435 10,744 1,028 4 20,877 100.0live births with the above - number 73,532 471 6,101 7,682 712 2 14,968 perinatal conditions - Percent(*) 33.8 40.4 34.4 33.2 36.8 100.0 34.0
Note: Percent based upon perinatal conditions. Percent (*) based upon live births for the maternal age group. Total percentage may not add up to 100 due to rounding. N.S. - Not stated. Non-residents are excluded.

b i r t h - r e l a t e d s t a t i s t i c s 57
Vital Statistics Information Box
33%
20% 20% 21% 21% 22% 22% 22% 22% 23% 23%
29% 30% 31% 29%
36% 35% 32%
37% 38%
0%
10%
20%
30%
40%
50%
2002 2003 2004 2005 2006 2007 2008 2009 2010 2011 Singleton Births multiple Births
Vital Statistics Information Box
BiRth and oldER mothERs in BRitish ColumBia, 2002 - 2011older mothers, those aged 35 and over, have increased their share of the total births to women in British columbia. Since 2002, the share of multiple births attributable to older mothers has increased by 30.8 percent. most of these births are via cesarean section; however, the proportion of these births considered to be low Birth Weight has remained relatively stable.
ProPortion of SinGleton anD mUltiPle BirthS
to motherS aGeD 35 anD olDer
br i t i s h co l u M b i a, 2002 - 2011
ProPortion of SinGleton anD mUltiPle BirthS
to motherS aGeD 35 anD olDer With
loW Birth WeiGht (<2500 GramS)
br i t i s h co l u M b i a, 2002 - 2011
ProPortion of SinGleton anD mUltiPle BirthS
to motherS aGeD 35 anD olDer BirtheD
Via ceSarean Section
br i t i s h co l u M b i a, 2002 - 2011
Proportion oftotal Births
35% 35% 37% 36% 37% 38% 38% 38% 38% 38%
72% 70% 70% 65%
71% 70% 70%
77%
72%
78%
0%
10%
20%
30%
40%
50%
60%
70%
80%
90%
100%
2002 2003 2004 2005 2006 2007 2008 2009 2010 2011
Singleton Births multiple Births
Proportion oftotal Births
4% 4% 5% 5% 5% 5% 5% 5% 4% 5%
47% 49% 50% 53%
47% 46% 49%
54% 51% 50%
0%
10%
20%
30%
40%
50%
60%
70%
80%
90%
100%
2002 2003 2004 2005 2006 2007 2008 2009 2010 2011
Singleton Births multiple Births
Proportion oftotal Births
58 b i r t h - r e l a t e d s t a t i s t i c s
2006–2010 2011 Observed Total Observed Expected Total Local Health Area Births Ratio (p) Percent Live Births Births Births Ratio (p) Percent Live Births
001 Fernie 257 1.03 34.9 736 58 52.7 1.10 37.4 155 002 Cranbrook 423 0.97 32.9 1,285 73 76.2 0.96 32.6 224 003 Kimberley 151 1.13 38.2 395 22 22.8 0.97 32.8 67 004 Windermere 165 1.09 36.7 449 27 26.2 1.03 35.1 77 005 Creston 193 0.98 33.2 581 44 37.1 1.19 40.4 109 006 Kootenay Lake 33 0.76 25.8 128 8 5.1 1.57 53.3 15 007 Nelson 382 0.96 32.5 1,176 88 78.3 1.12 38.3 230 009 Castlegar 184 1.13 38.3 481 53 43.2 1.23 41.7 127 010 Arrow Lakes 59 1.08 36.4 162 4 6.1 0.65 22.2 18 011 Trail 313 1.14 * 38.5 813 89 69.8 1.28 * 43.4 205 012 Grand Forks 98 0.99 33.3 294 26 18.7 1.39 47.3 55 013 Kettle Valley 27 0.74 25.0 108 2 4.4 0.45 15.4 13 014 Southern Okanagan 212 0.98 33.0 643 36 42.5 0.85 28.8 125 015 Penticton 577 1.03 34.9 1,651 132 110.2 1.20 * 40.7 324 016 Keremeos 68 1.03 34.7 196 10 9.5 1.05 35.7 28 017 Princeton 60 1.23 41.7 144 9 9.9 0.91 31.0 29 018 Golden 134 1.15 39.0 344 25 23.8 1.05 35.7 70 019 Revelstoke 185 1.37 * 46.3 400 28 27.6 1.02 34.6 81 020 Salmon Arm 524 1.17 * 39.5 1,326 115 96.6 1.19 40.5 284 021 Armstrong - Spallumcheen 163 1.09 36.7 444 36 30.3 1.19 40.4 89 022 Vernon 1,018 1.07 * 36.0 2,829 204 196.7 1.04 35.3 578 023 Central Okanagan 2,862 1.06 * 35.7 8,014 630 558.4 1.13 * 38.4 1,641 024 Kamloops 1,855 1.07 * 36.0 5,153 414 347.7 1.19 * 40.5 1,022 025 100 Mile House 214 1.25 * 42.1 508 44 30.3 1.45 * 49.4 89 026 North Thompson 85 1.14 38.5 221 8 8.2 0.98 33.3 24 027 Cariboo - Chilcotin 663 1.36 * 46.0 1,442 129 88.5 1.46 * 49.6 260 028 Quesnel 519 1.22 * 41.3 1,258 108 75.9 1.42 * 48.4 223 029 Lillooet 97 1.25 * 42.2 230 14 13.6 1.03 35.0 40 030 South Cariboo 106 1.04 35.0 303 22 20.8 1.06 36.1 61 031 Merritt 219 1.09 36.7 597 58 44.9 1.29 43.9 132 032 Hope 133 1.12 37.7 353 26 23.1 1.12 38.2 68 033 Chilliwack 2,075 1.21 * 40.8 5,085 382 350.1 1.09 37.1 1,029 034 Abbotsford 2,934 1.01 34.2 8,583 574 589.7 0.97 33.1 1,733 035 Langley 2,556 1.10 * 37.1 6,895 543 500.2 1.09 36.9 1,470 037 Delta 1,324 0.91 * 30.8 4,295 265 288.9 0.92 31.2 849 038 Richmond 2,245 0.78 * 26.5 8,477 423 539.3 0.78 * 26.7 1,585 040 New Westminster 1,252 1.07 * 36.3 3,451 254 242.6 1.05 35.6 713 041 Burnaby 3,052 0.80 * 27.0 11,287 631 774.8 0.81 * 27.7 2,277 042 Maple Ridge 1,901 1.17 * 39.5 4,816 327 321.5 1.02 34.6 945 043 Coquitlam 3,728 1.04 * 35.1 10,627 734 712.8 1.03 35.0 2,095 044 North Vancouver 1,790 0.88 * 29.7 6,033 365 425.7 0.86 * 29.2 1,251 045 West Vancouver-Bowen Is. 387 0.85 * 28.6 1,351 60 88.1 0.68 * 23.2 259 046 Sunshine Coast 409 1.13 * 38.1 1,073 81 72.8 1.11 37.9 214 047 Powell River 259 1.10 37.3 695 48 47.3 1.01 34.5 139 048 Howe Sound 764 0.97 32.9 2,323 168 163.3 1.03 35.0 480 049 Bella Coola Valley 102 1.43 * 48.3 211 15 12.6 1.19 40.5 37 050 Queen Charlotte 84 1.15 38.9 216 14 19.7 0.71 24.1 58 051 Snow Country 7 0.99 33.3 21 3 1.4 2.20 75.0 4 052 Prince Rupert 366 1.17 * 39.4 928 63 56.5 1.12 38.0 166 053 Upper Skeena 148 1.37 * 46.4 319 30 23.1 1.30 44.1 68 054 Smithers 410 1.12 * 37.9 1,082 47 63.3 0.74 * 25.3 186 055 Burns Lake 144 1.02 34.4 419 26 27.2 0.96 32.5 80 056 Nechako 470 1.27 * 43.0 1,092 81 74.2 1.09 37.2 218 057 Prince George 2,283 1.23 * 41.4 5,514 444 355.6 1.25 * 42.5 1,045 059 Peace River South 653 1.17 * 39.5 1,655 151 117.7 1.28 * 43.6 346 060 Peace River North 927 0.93 * 31.3 2,964 214 209.9 1.02 34.7 617 061 Greater Victoria 3,137 1.03 34.8 9,024 647 601.2 1.08 36.6 1,767 062 Sooke 1,339 1.10 * 37.1 3,607 306 274.6 1.11 37.9 807 063 Saanich 722 1.09 * 36.9 1,954 153 135.1 1.13 38.5 397 064 Gulf Islands 160 1.04 35.1 456 33 28.2 1.17 39.8 83 065 Cowichan 1,029 1.12 * 37.8 2,720 221 182.0 1.21 * 41.3 535 066 Lake Cowichan 67 0.97 32.8 204 22 13.3 1.66 * 56.4 39 067 Ladysmith 281 1.15 * 38.9 722 66 49.7 1.33 * 45.2 146 068 Nanaimo 1,960 1.28 * 43.2 4,533 391 327.0 1.20 * 40.7 961 069 Qualicum 505 1.18 * 39.9 1,265 99 80.3 1.23 * 41.9 236 070 Alberni 667 1.17 * 39.6 1,683 118 116.4 1.01 34.5 342 071 Courtenay 903 1.06 35.9 2,514 181 178.6 1.01 34.5 525 072 Campbell River 793 1.21 * 40.8 1,945 170 133.7 1.27 * 43.3 393 075 Mission 813 1.05 35.4 2,299 162 161.6 1.00 34.1 475 076 Agassiz - Harrison 200 1.23 * 41.6 481 37 30.3 1.22 41.6 89 077 Summerland 144 1.16 39.1 368 32 25.2 1.27 43.2 74 078 Enderby 143 1.12 37.7 379 34 24.8 1.37 46.6 73 080 Kitimat 178 1.13 38.3 465 34 30.3 1.12 38.2 89 081 Fort Nelson 150 0.93 31.3 479 40 28.9 1.38 * 47.1 85 083 Central Coast 65 1.37 * 46.4 140 18 10.5 1.71 * 58.1 31 084 Vancouver Island West 47 1.25 42.3 111 14 9.5 1.47 50.0 28 085 Vancouver Island North 319 1.23 * 41.6 767 61 50.4 1.21 41.2 148 087 Stikine 15 1.48 50.0 30 2 2.0 0.98 33.3 6 088 Terrace 506 1.22 * 41.2 1,228 106 81.7 1.30 * 44.2 240 092 Nisga'a 85 1.35 * 45.5 187 14 9.2 1.52 51.9 27 094 Telegraph Creek 18 1.02 34.6 52 2 2.0 0.98 33.3 6 161 Vancouver - City Centre 1,572 0.95 32.2 4,879 345 354.9 0.97 33.1 1,043 162 Vancouver - Downtown E.side 808 0.98 33.1 2,441 207 208.6 0.99 33.8 613 163 Vancouver - North East 1,457 0.79 * 26.7 5,447 310 351.8 0.88 * 30.0 1,034 164 Vancouver - Westside 1,633 0.85 * 28.6 5,702 315 379.0 0.83 * 28.3 1,114 165 Vancouver - Midtown 1,562 0.90 * 30.5 5,121 327 353.9 0.92 31.4 1,040 166 Vancouver - South 1,759 0.80 * 27.1 6,479 333 416.5 0.80 * 27.2 1,224 201 Surrey 7,261 0.86 * 28.9 25,120 1,499 1,818.6 0.82 * 28.0 5,345 202 South Surrey/White Rock 976 1.03 34.7 2,815 180 220.8 0.82 * 27.7 649 ProVincial total 73,532 1.00 33.8 217,720 14,968 14,968.0 1.00 34.0 43,991
PE
RIN
AT
AL
CO
ND
ITIO
NS
IN
LIV
E B
IRT
HS
BY
LO
CA
L H
EA
LT
H A
RE
A,
br
itis
h c
ol
uM
bia
, 20
06–2
010
an
d 2
011
Tab
le
20
Note:
20
58
*Statistical testing indicates that observed number of births with perinatal conditions is significantly different from the expected(p<0.05, two-tailed). Ratio-observed over the expected. Percent of births is based on total live births and includes residents with unknown LHA and excludes non-residents.

b i r t h - r e l a t e d s t a t i s t i c s 59
Note:
Note:
figure 34Perinatal conDitionS in liVe BirthS
BY local health areabr i t i s h co l u M b i a, 2006–2010
Ratio - Observed over the expected. Refer to Figure 1 to clarify geographical location of LHAs.