
BIROn - Birkbeck Institutional Research Online · 2019-07-29 · Greenbury report (1995), which...
42
BIROn - Birkbeck Institutional Research Online Al-Najjar, Basil and Rong, D. and Khaled, H. (2016) Determinants and value relevance of UK CEO pay slice. International Review of Applied Economics 30 (3), pp. 403-421. ISSN 0269-2171. Downloaded from: http://eprints.bbk.ac.uk/15042/ Usage Guidelines: Please refer to usage guidelines at http://eprints.bbk.ac.uk/policies.html or alternatively contact [email protected].
Transcript of BIROn - Birkbeck Institutional Research Online · 2019-07-29 · Greenbury report (1995), which...

BIROn - Birkbeck Institutional Research Online
Al-Najjar, Basil and Rong, D. and Khaled, H. (2016) Determinants and valuerelevance of UK CEO pay slice. International Review of Applied Economics30 (3), pp. 403-421. ISSN 0269-2171.
Downloaded from: http://eprints.bbk.ac.uk/15042/
Usage Guidelines:Please refer to usage guidelines at http://eprints.bbk.ac.uk/policies.html or alternativelycontact [email protected].

1
Determinants and Value Relevance of UK CEO Pay Slice
Basil Al-Najjara*
1, Rong Ding
b, Khaled Hussainey
c
aBirkbeck College
, University of London,
bWarwick University,
cPlymouth University
Forthcoming International Review of Applied Economics
Abstract
This paper studies the CEO Pay Slice (CPS) of UK listed firms during the period 2003 to
2009. We investigate the determinants of CPS. We study the links between CPS and measures of
firm performance. We find that firms with higher levels of corporate governance ratings and those
with more independent boards tend to have higher CPS. In addition, we find that CEOs are more
likely to receive lower compensation when they chair the board and when they work in firms with
large board size. We also find that higher CPS is positively associated with firm performance after
controlling the firm-specific characteristics and corporate governance variables. We get compatible
results when we examine the association between equity-based CPS and firm performance. Our
results remain robust to alternative accounting measures of firm performance. Our results suggest
that high UK CPS levels do indeed reflect top managerial talent rather than managerial power.
Key words: CEO pay slice, firm performance, corporate governance ratings, corporate governance
mechanisms.
JEL Classification: G30; M15
1 Corresponding author email: [email protected]
2
1. Introduction
Prior research has paid considerable attention to the effect of CEO characteristics on organizational
performance. Falato et al. (2011), using reputation, career record, and educational background as
proxies for CEO talent, document a positive effect of shareholders wealth on the appointment of
talented CEOs, which is consistent with the argument that talented CEOs have superior ability to
process economics information and make value-added decisions for shareholders. Chang et al. (2010)
examine CEO departure between 1992 and 2002, and find that CEO subsequent labour market
success is greater if the firm’s pre-departure performance is better and the prior pay is higher. This
suggests that CEOs are compensated for their abilities with high remunerations. However, during the
negotiation of compensation contract with the board, powerful managers may take advantage of their
influence over the board to maximize their personal welfare (Bertrand and Mullainathan 2001;
Bebchuk and Fried 2003), which implies that high compensation may reflect the power of managers
and indeed indicates weak governance of the firm. Measuring CEO’s power with the proportion of
the total compensation of top-five highly paid executives captured by CEO (CEO pay slice) in a
given firm, Bebchuk et al. (2011) find that CPS is associated with lower firm value and inferior
accounting performance. Furthermore, CPS is correlated with lower stock return accompanying
acquisition announcement and higher likelihood that CEOs receiving “lucky” option grant.
Consistent with the managerial power hypothesis, they conclude that higher CPS is associated with
agency problem.
To summarize, high CEO compensation reflected by CPS may imply that CEOs have superior
capability or qualification, which enhances their contribution to the firm. Alternatively, high CPS can
be explained by the managerial power approach, in that a weak corporate governance structure will
lead to an inefficient design of compensation contracts, so powerful CEOs will take this advantage to

3
maximize their personal benefits. The competing predictions from different theories call for more
empirical research on this topic.
In this study, we follow Bebchuk et al. (2011) and Forbes et al. (2014) and measure the relative
importance of the CEO using CPS, and test the association between CPS and firm performance in the
UK context.2 Different from Bebchuk et al. (2011), we find that higher CPS is positively associated
with firm performance measured by Tobin’s Q, after controlling for firm-specific characteristics and
governance variables. We also report similar findings when we substitute CPS with equity-based
CPS. Our results stay robust if we use accounting measures such as Return on Assets (ROA) and
Return on Equity (ROE) to reflect firm performance. We suggest that CEOs of public listed firms in
UK are compensated for their talents and capabilities, and the difference between our results and
those of Bebchuk et al. (2011) can be explained by the different institutional backgrounds between
US and UK. Although The United Kingdom (UK) and the United States (US) share a similarity in
diverse corporate ownership structures and generally high quality corporate governance (Wang and
Hussainey 2013), recent research argues that the US and UK have very different corporate
governance systems (Siepel and Nightingale 2014). A series of reports have been issued to
strengthen UK governance system. For example, Cadbury report (1992) addresses the financial
aspects of corporate governance and produces a code of best practice for publicly listed companies.
Greenbury report (1995), which concentrates on the remuneration of directors, recommends the
2 In this study we use CEO pay slice instead of the CEO pay inequality measure developed by Forbes et al. (2014) for
two reasons. First, Forbes et al. (2014) calculate a measure of CEO pay inequality as the compensation of the CEO
divided by remuneration to all the executives on the board. This measure is inversely associated with the size of the board.
Prior research (i.e. Guest 2009) shows that the board size is negatively associated with corporate performance using UK
data. As a result, examining the effect of CEO pay inequality on firm performance is vulnerable to the correlated omitted
variable problem, because CEO pay inequality and firm performance are related to board size. Second, our focus in this
paper is to investigate the association between CEO’s relative pay and firm’s future performance, and one benefit of
using CPS is that we may compare and reconcile our findings to those based on US data (i.e. Bebchuk et al. 2011). If we
do not use CPS, it will be difficult to triangulate our results with previous studies.

4
establishment of remuneration committee comprising entirely of non-executive directors to decide
the remuneration of the executive directors.3 Furthermore, it also recommended that long term
incentive schemes paid by firms (including stock options) should be subject to challenging
performance criteria. The recommendations of the Greenbury report have been subsequently taken
on board by the London Stock Exchange and have been incorporated into the UK listing rules.
Hampel report (1998) further requires UK public companies to disclose compensation information of
their directors. The recommendations of these three reports were combined to form part of London
Stock Exchange Combined code, which regulates all companies listed on the exchange (FRC,
Combined Code 2008). Consequently, compared with their counterparts in US, CEOs of UK listed
firms are less likely to have strong influence over the remuneration committee during the negotiation
of their compensation package. Instead, their compensation is structured to link reward to firm
performance, which suggests that CEOs of UK firms are more likely to be compensated for their
talents and capabilities that can improve firm performance.
Forbes et al. (2014) investigate the impact of CEO pay inequality on corporate performance using
the UK FTSE 100 firms. Our study complements Forbes et al. (2014) in at least three ways. First, we
focus on FTSE 250 firms while Forbes et al. (2014) look at FTSE 100 firms. FTSE 100 firms are the
largest firms listed on London Stock Exchange (LSE), accounting for over 80% of the entire market
capitalization of LSE, whereas FTSE 250 firms are relatively medium firms listed on LSE,
representing an important but less researched section of the entire economy. Our inferences based on
the analysis of data from FTSE 250 firms provide new insights into the interplay between CEO
compensation, corporate governance and firm performance among medium-sized UK firms, which
3 The responsibilities of the remuneration committee include: 1) the determination of company-wide policy on
remuneration; 2) the determination of individual remuneration package for each executive directors and other senior
executives if appropriate; 3) reporting directly to shareholders on behalf of the board of directors on all matters relating to
executive remuneration (Hughes 1996).
5
promotes our understanding of the operation and management of such firms. Second, our inferences
are based on the analysis with multiple performance measures (e.g., Tobin’s Q and return on equity)
but Forbes et al. (2014) draw conclusion only based on return to shareholders. Finally, we extend
Forbes et al. (2014) by investigating the impact of CPS on corporate governance using a
comprehensive set of governance variables and a larger sample size. We thus contribute to the
literature on CEO compensation in the UK setting. Our findings also have implication for the
ongoing debate about whether high CEO compensation reflects high managerial talent or managerial
power. The positive association between CPS/equity-based CPS and firm performance suggests that
CEOs of public listed firms in UK are more likely to be compensated for their managerial talent.
Finally, our study enriches the literature by providing evidence that institutional background may
play an important role in deciding how CEOs are compensated in different countries.
The remainder of the paper is structured as follows. Section 2 reviews the literature and Section 3
develops the hypotheses; Section 4 describes the data and research method; Section 5 presents the
empirical results; Section 6 concludes.
2. Literature review
There is a substantial amount of literature examining the impact of senior managers, in particular
CEOs on the organizations they lead. Bertrand and Schoar (2003) find that CEOs have different
management styles as they move between firms, and these differences affect corporate decisions
including investment, financing and organizational re-structure. Falato et al. (2011) document that
talented CEOs (measured with reputation, career record, and educational background) are more
likely to cut capital and M&A expenditures and shed excess capacities. Demerjian et al. (2011)
measure CEO talent as the efficiency of the CEO in generating revenues with firm resources and find

6
that employing CEOs with higher ability is associated with improved firm performance in
subsequent periods.
Other studies report mixed results on the stock market reaction to the decision of managerial
turnover. While Warner et al. (1988) do not find any significant results, Weisbach (1988) documents
significant and positive market reaction to turnover decisions. On the other hand, Khanna and
Poulsen (1995) find negative effects. Denis and Denis (1995) find stock markets react positively to
forced turnover while the reaction to CEO retirement is insignificant. Bennedsen et al. (2010)
provide evidence that CEO deaths are associated with declining operating profitability, asset growth,
and sales growth. In contrast, the deaths of other board members do not have strong impact on firm
performance. Therefore, they conclude that CEOs are important for the success of ongoing operation,
and their permanent or temporary absence impacts firm performance.
Managers may claim higher compensation because they have superior ability, or they have more
influence over the board when negotiating their compensation packages. Bebchuk and Fried (2003)
propose the managerial power approach by arguing that weak corporate governance structure leads
to an inefficient design of compensation contracts. For example, compensation for executives
including CEOs will be higher in firms where managers have more power, or the board is relatively
weak. Therefore, whether higher relative compensation reflects managerial talent or managerial
power is an empirical question to be addressed in this study.
A growing stream of literature supports a positive association between corporate governance
quality and firm performance. Empirical studies document a positive association between the
percentage of independent directors and Tobin’s Q (Core et al. 1999). In a similar vein, Conyon and
Peck (1998) conclude that board size is negatively associated with corporate performance measured

7
by return on equity. In terms of insider ownership and firm performance, previous literature reports a
positive relationship between insider ownership and firm performance (see for example, Agrawal
and Knoeber 1996; Ho 2005). Gompers et al. (2003) find that firms with strong corporate
governance have higher value. Furthermore, stock returns of firms with good corporate governance
outperform those of firms with weak governance. Bebchuk et al. (2009) identify six provisions to
create an “entrenchment index (E-index)”. 4
They show that stock returns are lower for firms with
higher E-index score. Overall the literature suggests that firms with good governance tend to have
higher value.
Beyer et al. (2010) state that the stewardship role allows capital providers to manage and utilize
their invested capital in a certain firm. Using a corporate governance disclosure index as a proxy for
the quality of corporate governance, Cheung et al. (2011) find that firms with higher quality of
corporate governance exhibit a subsequent increase in market value, whereas those with lower
quality of corporate governance exhibit a decrease in market value. This suggests that the quality of
corporate governance affects stock market participants when valuing firms. Sheu et al. (2011) focus
only on one particular type of corporate governance mechanisms (i.e. information related to
compensation paid to directors and executives). They find that the stock market participants provide
a higher valuation for those firms which disclose more information about their compensation
practices.
In the present study, we follow Cheung et al (2011) and Sheu et al. (2011) and consider corporate
governance practice, measured by corporate governance ratings, when examining the association
4 Among the six provisions, four limit shareholder rights (staggered boards, limits to shareholder amendments of bylaws,
supermajority requirement for merger and charter amendment) and the other two make potential hostile takeover more
difficult (poison pills and golden parachute). Therefore, higher index score implies that the firm is entrenched, or has
weak governance.

8
between CPS and firm performance. Prior research shows that corporate governance practice is
associated with lower cost of external capital (Anderson et al. 2003; Bhojraj and Sengupta 2003;
Anderson et al. 2004; Klock et al. 2005; Cremers et al, 2007; Chava et al. 2009; Lorca et al. 2011).
For example, cheap external funding might not be a major concern for large firms, as a result,
offering more information to stock market participants may help to alleviate the litigation risks,
reduce the volatility of stock price fluctuations, and enhance the management talent, signalling
effects which will have an impact on the firms’ valuation.
3. Hypothesis development
Following Bebchuk et al. (2011), we measure the relative importance of the CEO with CEO pay slice
(CPS), which is the percentage of the total compensation of top-five executives that is captured by
the CEO. We also compute the equity-based CPS as the percentage of the total equity-linked
compensation of top-five executives that is captured by the CEO. It is essential to note that as CPS is
computed using the compensation information of executives from the same firm, it automatically
controls for the firm-specific characteristics that affect the average level of compensation that varies
from firm to firm or industry to industry. However, the characteristics of CEO (e.g., talent and
expertise) may still have an effect on CPS. For example, using a sample of executives who switched
jobs between 1992 and 2007, Carter et al. (2010) find that talented executives received pay
premiums at their new employer, after controlling for the standard determinants of compensation.5
5 Carter et al. (2010) use two sets of proxies to capture the talent of executives. The first set of variables captures
characteristics of the executives’ managerial position and professional profile at the prior firm, while the second set of
variables measure firm performance and financial reporting quality of the executives’ former employer over their
managerial tenure.

9
Regarding the association between CPS/equity-based CPS and firm performance, we develop two
competing hypotheses based on different theories. According to the managerial talent hypothesis,
higher CPS may imply the outstanding talent and ability of the CEO, which can contribute to strong
performance of the firm. Falato et al. (2011) show that the CEO’s total compensation is an increasing
function of the CEO’s talent. CEO, as the most important executive in a firm, is playing a crucial
role in making corporate decisions and is taking the major responsibility to maximize shareholder’s
wealth. Talented CEO is able to claim higher compensation relative to other executives in the firm,
because CEO’s judgement and expertise can make a difference in decision-making that affects future
prospects of the firm. Furthermore, talented CEOs may have better outside opportunities, so higher
compensation is necessary to increase the opportunity cost of voluntary departure.
Consistent with the managerial power hypothesis, CEO might have more power when the
corporate governance is weak (e.g., less independent board), which can be reflected by higher CPS.
Bebchuk and Fried (2003) suggest that CEOs are more likely to take advantage of their power to
negotiate an excessive compensation package with the board. As a result, the CPS is more likely to
skew to the excessive side, which signals governance/agency problem in a firm. The weak corporate
governance may have negative effect on firm performance (Conyon and Peck 1998; Ho 2005; Brown
and Caylor 2006).
In this study we also look into this aspect but from corporate governance ratings perspectives.
Corporate governance ratings have been widely used in the governance-performance literature (see
for example Ben Amar and Boujenoui 2011; Epps and Cereola 2008; Drobetz et al. 2004; Ertugrul
and Hegde 2009). Bozec and Bozec (2012) find that a consistent finding across all governance-
performance studies is that there is a positive association between governance ratings and firm
performance. Furthermore, prior research suggests that good governance practices mitigate the

10
under-valuation of accounting earnings (Chen and Kao 2010). Finally, different studies (e.g. Cheung
et al. 2011; and Sheu et al. 2011) examine the effect of corporate governance disclosure on firm
value and their findings are consistent with the argument of Healy et al. (1999). In particular, they
find a positive association between corporate governance disclosure and firm value. Based on the
above discussion, we propose the following hypotheses:
Managerial talent hypothesis (H1a): Higher level of CPS is positively associated with future firm
performance.6
Managerial power hypothesis (H1b): Higher level of CPS is negatively associated with future firm
performance.
H2: Higher level of corporate governance ratings is positively associated with future firm
performance.
4. Research design
4.1 Data
Our study focuses on FTSE 250 firms in UK.7 We first collect data on CEO compensation from the
BoardEx database.8 CPS is calculated as follows: first, we compute the total annual compensation of
each executive for a sample firm as the sum of direct compensation and total equity linked
compensation (including the Black and Scholes value of the options granted, payouts of long-term
incentive plans and equity-based long-term compensation). Next, we select the value of
6 We regress firm performance in year t+1 on CPS in year t in the empirical analysis. 7 Consistent with previous literature, we exclude financial institutions and utility firms.
8UK publicly listed firms are required by the Directors' Remuneration Report Regulations (2002) to disclose information
on executive as well as non-executive’s compensation (including cash compensation, share options and long-term
incentive schemes) in a separate “Director’s remuneration report” as part of the annual report.
11
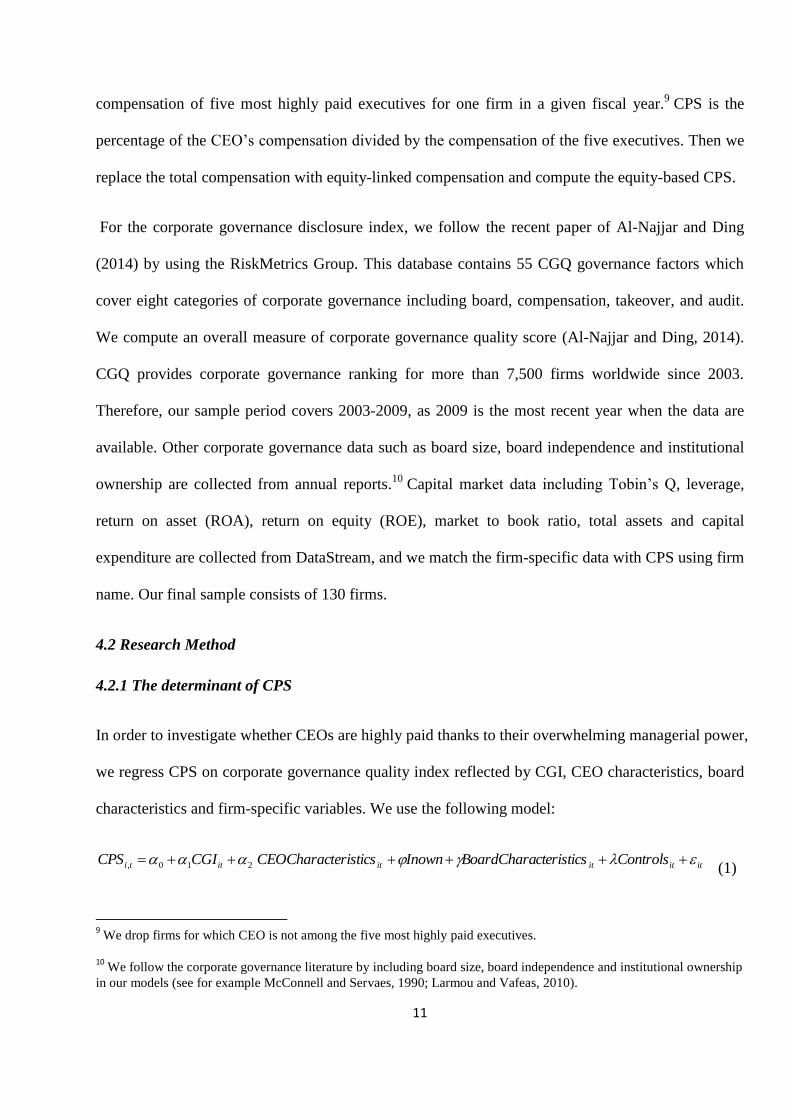
compensation of five most highly paid executives for one firm in a given fiscal year.9 CPS is the
percentage of the CEO’s compensation divided by the compensation of the five executives. Then we
replace the total compensation with equity-linked compensation and compute the equity-based CPS.
For the corporate governance disclosure index, we follow the recent paper of Al-Najjar and Ding
(2014) by using the RiskMetrics Group. This database contains 55 CGQ governance factors which
cover eight categories of corporate governance including board, compensation, takeover, and audit.
We compute an overall measure of corporate governance quality score (Al-Najjar and Ding, 2014).
CGQ provides corporate governance ranking for more than 7,500 firms worldwide since 2003.
Therefore, our sample period covers 2003-2009, as 2009 is the most recent year when the data are
available. Other corporate governance data such as board size, board independence and institutional
ownership are collected from annual reports.10
Capital market data including Tobin’s Q, leverage,
return on asset (ROA), return on equity (ROE), market to book ratio, total assets and capital
expenditure are collected from DataStream, and we match the firm-specific data with CPS using firm
name. Our final sample consists of 130 firms.
4.2 Research Method
4.2.1 The determinant of CPS
In order to investigate whether CEOs are highly paid thanks to their overwhelming managerial power,
we regress CPS on corporate governance quality index reflected by CGI, CEO characteristics, board
characteristics and firm-specific variables. We use the following model:
itititititti ControlscteristicsBoardCharaInowneristicsCEOCharactCGICPS 210, (1)
9 We drop firms for which CEO is not among the five most highly paid executives.
10 We follow the corporate governance literature by including board size, board independence and institutional ownership
in our models (see for example McConnell and Servaes, 1990; Larmou and Vafeas, 2010).

12
CPS is the CEO pay slice measured as the percentage of the total compensation of top-five
executives that is captured by the CEO; CGI is the value of corporate governance disclosure score;
CEO Characteristics include CEO tenure (number of years since becoming CEO), CEO chair
(duality) and CEO gender. Board characteristics include board independence and board size. We also
add institutional ownership (Inown) to our models. Controls are firm-specific characteristics
including size, leverage, market-to-book ratio, risk (captured by beta), Tobin’s Q, ROE and ratio of
capital expenditure to total assets. We also include year dummies and industry dummies in the
regression, and the standard errors are clustered at firm level. If the managerial power prediction
holds, we expect CPS to be negatively associated with CGI, because high CGI indicates better
quality of corporate governance. Furthermore, according to managerial power story CPS is likely to
be higher when the board is weak (e.g., less independent).Finally, we substitute CPS with equity-
based CPS (ECPS) and repeat the analysis.
4.2.2 CPS and firm performance
First, following a substantial literature that measures firm performance with Tobin’s Q (Lang and
Stulz 1994; Core et al. 1999; Gompers et al. 2003; Brown and Caylor 2006), we measure firm
performance in year t+1 with Tobin’s Q, which is calculated as the market value of common equity
plus the book value of preferred equity and long-term debt divided by the book value of assets. To
control for possible endogeneity between firm performance and the corporate governance factors, we
use the Instrumental Variable (IV) model to test our hypotheses. The instrument variables used in the
model are the first lag of the corporate governance variables, and the standard errors are clustered at
the firm level.11
We also control for the non-linear relationship between board size and institutional
ownership by including their square terms. In the regression we include year dummies and industry
11 The Shea partial R
2 for the instrument variables in all our models is higher than 0.50. In addition, the first stage
regression in our models indicates a good significant level and power. Hence the instruments in our case are not weak.

13
dummies to control for secular trends and industry-specific confounding effects, but for brevity we
do not report their coefficients in the tables.
ititititititti ControlsCGVDNTERACTIONCgidumCPSsQTobin I' 32101, (2)
We create Cgidum as a dummy variable that takes one for observations with their value of
corporate governance ratings score above the sample mean, zero otherwise. Following Cheung et al
(2011) and Sheu et al (2011), we expect a positive association between Cgidum and Tobin’s Q.
INTERACTION is the interaction between CPS and Cgidum. Following Hussainey and Walker
(2009), we identify four logical possibilities for the interaction between CPS and Cgidum. First, if
Cgidum and CPS are different ways of conveying the same information (substitutes), then the
coefficient on CPS will be equal to the coefficient on Cgidum. In addition, the INTERACTION
should be negative and equal in absolute value to the coefficients on CPS or Cgidum.
Second, if Cgidum and CPS convey unrelated types of information then performance for firms that
have high levels of Cgidum and lower CPS should be stronger than performance for firms that have
high levels of both Cgidum and CPS. Similarly, firm performance should be stronger when both
high levels of Cgidum and low CPS are present than when only the high levels of Cgidum is present.
In this case both Cgidum and CPS provide (‘additive’) unrelated information, so we predict the
INTERACTION should be positive and insignificantly different from zero.
Third, if Cgidum and CPs provide complementary information that is reinforcing, then the
interaction should be significantly larger than zero, because firms with either good internal
governance reflected by high Cgi or larger proportion of executive compensation claimed by CEO
tend to have better performance. However, if the coefficient of interaction is positive, we expect that
the sum of coefficients of Cgidum, CPS and INTERACTION should be significantly greater than the
sum of coefficients of Cgidum and CPS.

14
Finally, if Cgidum and CPS convey related information, but some of the information is common to
both (partially additive), then performance for firms that have high levels of Cgidum and low CPS
should be higher than performance of those that have high levels of Cgidum but pay high CEO
compensation. Similarly, firm performance should be higher when both higher Cgidum and lower
CPS are present. In this case, one may predict that the INTERACTION should be significantly less
than zero. In other words, the sum of Cgidum, CPS and INTERACTION should be significantly less
than the sum of the coefficients on Cgidum and CPS. The inference is that both CPS and Cgidum are
partial substitutes.
In Model (2), we control for a number of corporate governance mechanisms and firm
characteristics. CGVD refers to corporate governance mechanisms. These include board size, board
independence and institutional ownership. We also control for leverage (total debt divided by total
assets); ROE (net income divided by total equity); investment opportunities (capital expenditure
divided by total assets); growth opportunities (market-to-book ratio); firm size (logarithm of total
assets) and firm risk (beta). The coefficients of interest are 1 and 3 .
Next, we substitute CPS with equity-based CPS (ECPS) and re-run the model with the necessary
modifications of the interaction term. Consistent with previous literature that utilizes accounting
measures to reflect firm performance (e.g., Larcker et al. 2007; Bebchuk et al. 2010), we replace
Tobin’s Q with ROE (net income divided by total equity), and re-estimate the model with the
following regressions:12
ititititititti ControlsCGVDNTERACTIONCgidumCPSROE I32101, (3)
12
We exclude ROE as one of the control variable in these analyses.

15
5. Results
5.1 Summary statistics and correlation
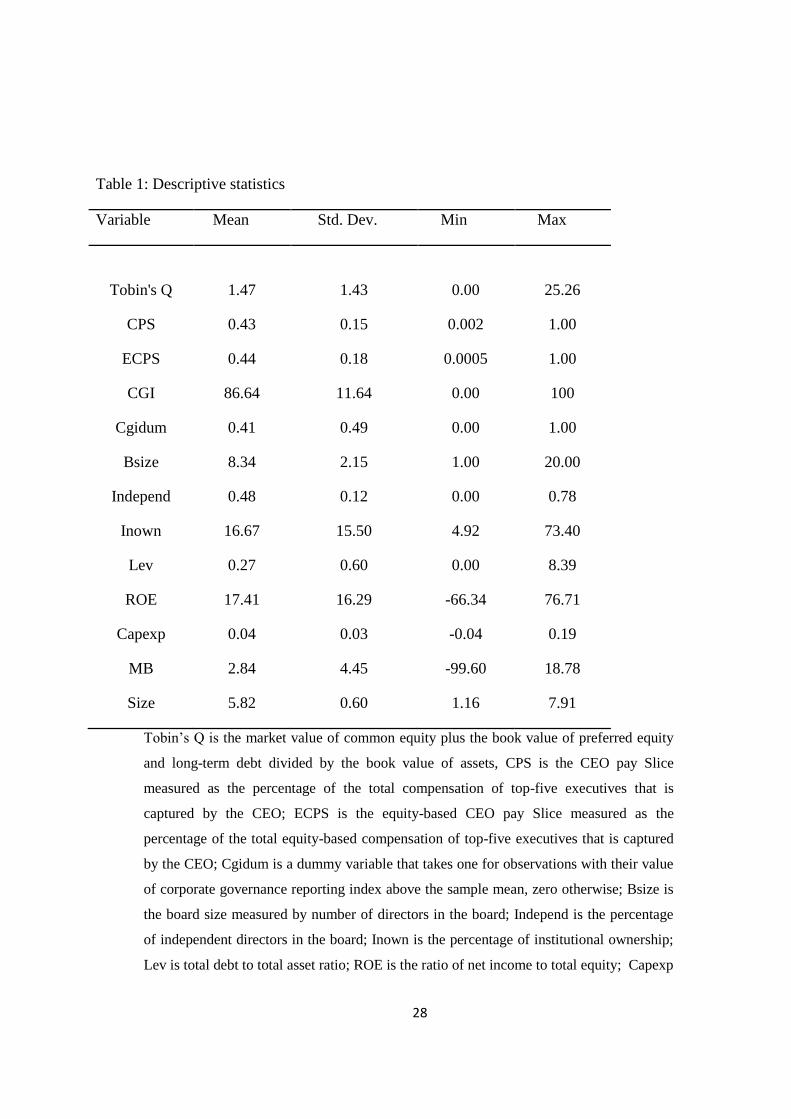
Table 1 provides the summary statistics of the variables. The mean of CPS (ECPS) is 0.43 (0.44),
which suggests that on average CEO compensation represents 43% (44%) of the total compensation
of the five most highly-paid executives within a firm. The mean of corporate governance disclosure
score (CGI) is 86.64, indicating that on average firms have relatively good record on corporate
governance quality. The average board has around 8 members, while 48% of board members are
independent. The percentage of ownership by institutional investors is 16.67%. ROE (return on
equity) is 17.41% for the average sample, which suggests that the sample firms have relatively strong
performance. The average capital expenditure is 4.2% of total assets and average market-to-book
ratio is 2.84.
<< Insert Table 1 about here >>
Table 2 reports the pair-wise correlation between the variables. Tobin’s Q is positively related
with ROE, as firms with higher accounting performance also have better valuation (performance).
Tobin’s Q is positively correlated with institutional ownership, as institutional investors have
reduced cost to monitor the management, which contributes to firm performance. Tobin’s Q is
negatively related to leverage and firm size. Importantly, CPS and ECPS are significantly correlated,
as nowadays equity-linked compensation takes an increasing proportion of total compensation for
executives. The correlation between CPS (ECPS) and corporate governance disclosure score (CGI) is
positive and significant. CPS (ECPS) is also positively correlated with firm size, consistent with the
view that large firms compensate CEOs with higher remuneration. Corporate governance disclosure
score is positively correlated with board independence and firm size, which suggests that large firms
and independent boards are likely to improve quality of corporate governance. The correlation
16
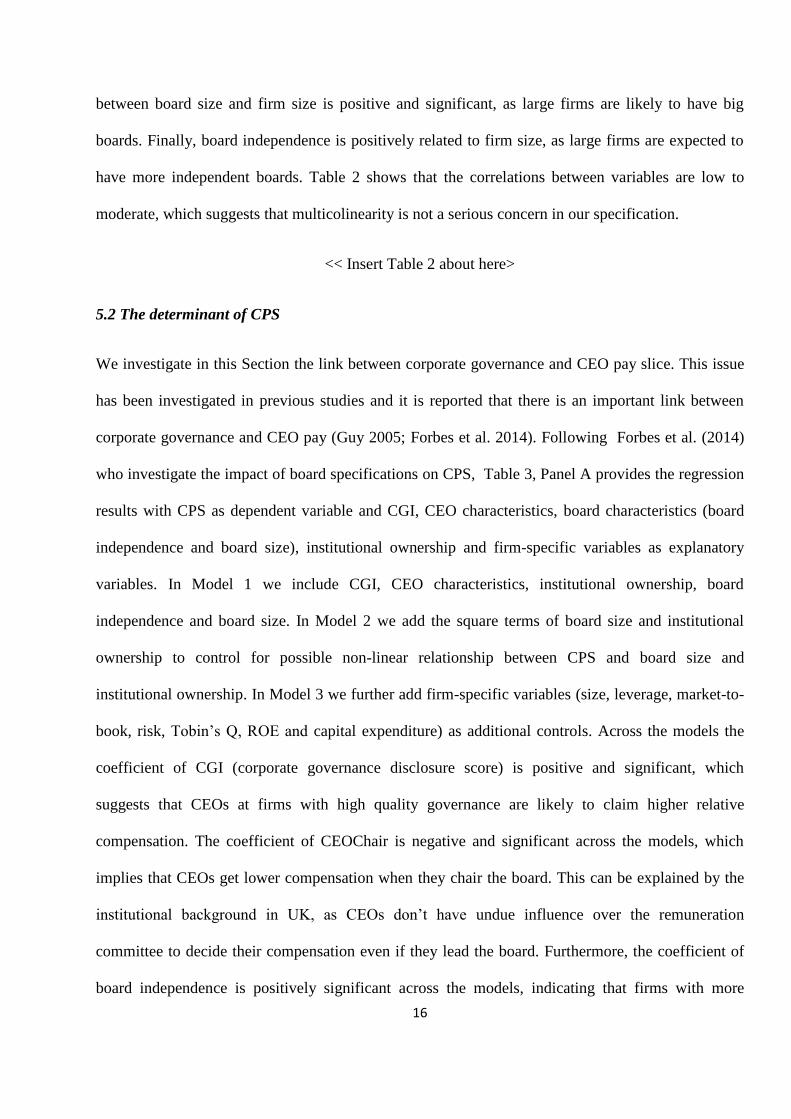
between board size and firm size is positive and significant, as large firms are likely to have big
boards. Finally, board independence is positively related to firm size, as large firms are expected to
have more independent boards. Table 2 shows that the correlations between variables are low to
moderate, which suggests that multicolinearity is not a serious concern in our specification.
<< Insert Table 2 about here>
5.2 The determinant of CPS
We investigate in this Section the link between corporate governance and CEO pay slice. This issue
has been investigated in previous studies and it is reported that there is an important link between
corporate governance and CEO pay (Guy 2005; Forbes et al. 2014). Following Forbes et al. (2014)
who investigate the impact of board specifications on CPS, Table 3, Panel A provides the regression
results with CPS as dependent variable and CGI, CEO characteristics, board characteristics (board
independence and board size), institutional ownership and firm-specific variables as explanatory
variables. In Model 1 we include CGI, CEO characteristics, institutional ownership, board
independence and board size. In Model 2 we add the square terms of board size and institutional
ownership to control for possible non-linear relationship between CPS and board size and
institutional ownership. In Model 3 we further add firm-specific variables (size, leverage, market-to-
book, risk, Tobin’s Q, ROE and capital expenditure) as additional controls. Across the models the
coefficient of CGI (corporate governance disclosure score) is positive and significant, which
suggests that CEOs at firms with high quality governance are likely to claim higher relative
compensation. The coefficient of CEOChair is negative and significant across the models, which
implies that CEOs get lower compensation when they chair the board. This can be explained by the
institutional background in UK, as CEOs don’t have undue influence over the remuneration
committee to decide their compensation even if they lead the board. Furthermore, the coefficient of
board independence is positively significant across the models, indicating that firms with more

17
independent board are likely to reward CEOs with high relative remuneration. The coefficient of
board size is negative and significant, which suggests that CEOs are more likely to receive lower
compensation in firms with large board. It is plausible that large board strengthens the governance
and increases the monitoring of the CEOs. Regarding the coefficients of the firm-specific variables,
none of them are significant. Our findings are broadly consistent with those reported in Bebchuk et al.
(2010), because leverage, market-to-book and capital expenditure are not significantly related to CPS
in their analysis.
We replace the dependent variable with ECPS and re-estimate the regressions. The results are
reported in Table 3, Panel B. Consistent with findings based on CPS, the coefficient of CGI
(corporate governance disclosure score) is positively significant and the coefficient of board
independence is strongly positive across the models, which confirms that CEOs are mole likely to get
higher relative compensation when the governance quality of the firm is higher and the board is more
independent. The coefficient of board size is significantly negative in Models 1 and 2, while the
coefficient of CEOChair is negative and significant in Model 1. Similar to results in Panel A, none of
the coefficients of firm-specific variables are significant.
Overall our findings are at odds with the prediction of managerial power hypothesis, which argues
that CEOs are likely to receive high relative compensation in firms with poor governance because
they have increasing negotiation power over the board. In contrast, we find that firms with high
quality of governance reflected by higher CGI and more independent boards are likely to reward
CEOs with high remuneration. Furthermore, CEOs receive lower compensation when they chair the
board of directors. It is likely that the strengthened internal governance of UK public corporations
reduced the influence and negotiation power of CEOs, so they do not get higher remuneration due to
their managerial power.
<< Insert Table 3 about here>>

18
5.3 Results on the association between CPS and firm performance
We discuss the results on the association between CPS (equity-based CPS) and Tobin’s Q in 5.3.1,
results on the association between CPS (equity-based CPS) and ROE in 5.3.2, and results on the
association between CPS (equity-based CPS) and sub-index related to board, compensation and
takeover in 5.3.3.
5.3.1 Results on the association between CPS/ECPS and Tobin’s Q
We run six models with Tobin’s Q as the dependent variable, and present the results in Table 4. In
Models 1 to 3 (Models 4 to 6) CPS (Equity-based CPS) is included as the explanatory variable of
central interest. To control for the possible curvilinear relationship between corporate governance
variables and firm performance, in Model 1 we include the square term of board size and
institutional ownership. Year dummies and industry dummies are introduced to control for the
secular trend and industry-specific effect. In Model 2, we leave out the square terms of board size
and institutional ownership. In Model 3, we retain the square of board size and institutional
ownership but skip the year-indicators. In Model 1 the coefficient of CPS is positive and significant
(1.530, P= 0.05), which suggests a positive association between future firm valuation measured by
Tobin’Q and CPS. The coefficients of Cgidum and the interaction term between Cgidum and CPS
are both insignificant. The results in Model 2 are similar to those in Model 1, in that coefficient of
CPS is positive and significant (0.294, P= 0.10). Coefficients of Cgidum and interaction are again
insignificant. Finally, the results in Model 3 confirm the positive association between CPS future
firm valuation measured by Tobin’s Q, and the coefficients of Cgidum and the interaction term
remain insignificant. We repeat the analysis in Models 4 to 6 where ECPS is the explanatory variable
of main interest. In Model 4 the coefficient of ECPS is significantly positive (1.306, P= 0.05), and in
Model 6 the coefficient of ECPS remains positive and significant (1.519, P=0.01). The coefficient of
ECPS in Model 5 is positive but insignificant. The findings suggest that CEOs who are able to
19
contribute to the future performance of their firms get relatively high equity-linked compensation. In
Models 4 to 6 the coefficients of Cgidum and the interaction term between Cgidum and ECPS
remain insignificant. Overall our findings lend support to H1a (the managerial talent hypothesis), as
CEOs are compensated for their superior talent and skills, which contributes to better firm valuation
in the future.
Among the control variables, the coefficient of board size is positive and significant across the
regressions except for Models 3 and 6. It is likely that large board consisting of members with
diversified expertise and experience can support managerial decision-making, which in turn
contributes to firm value. This finding is in line with Larmou and Vafeas (2010), who report a
positive association between board size and firm value. However, board size is positively related to
the cost of information sharing and monitoring, which implies that when the board becomes larger,
the positive effect on firm value gradually weakens. After crossing a certain threshold, the effect of
board size on firm value could even turn into negative. This is supported by our results that the
square term of board size is negatively associated with firm value. Such finding is also consistent
with the non-linear relationship between corporate governance and firm performance documented by
previous literature (McConnell and Servaes 1990), the coefficient of the square of board size is
negative and significant in Models 1 and 4. The coefficient of firm size is negative and significant
across the regressions. Finally, the coefficient of MB (market-to-book) is strongly positive across the
six models, which suggests that firms with higher growth opportunity are likely to have higher firm
valuation.
<< Insert Table 4 about here >>

20
5.3.2 Results on the association between CPS/ECPS and ROE
We run six models with ROE (return on equity) as the dependent variable. Consistently, in Models 1
to 3 (Models 4 to 6) CPS (equity-based CPS) is included as the explanatory variable of main interest.
The results are provided in Table 5. In Model 1 the coefficient of CPS is positive and significant
(20.823, P= 0.10), which suggests a positive association between CPS and future accounting
performance measured by ROE. In Model 2 the coefficient of CPS is positive and significant
(17.036, P= 0.05). Finally, the results in Model 3 confirm the positive association between CPS and
future accounting performance reflected by ROE (20.023, P= 0.05). The coefficients of Cgidum
remain insignificant while the interaction is negatively associated with ROE in Models (1) and (3).
We repeat the regressions in Models 4 to 6 where ECPS is the variable of central interest. In
Models 4 and 6 the coefficients of ECPS is significantly positive (15.516, P= 0.05; 16.528, P= 0.05),
and in Model 5 the coefficient of ECPS is positive but insignificant. In Models 4 to 6 the coefficients
of Cgidum and the interaction between Cgidum and ECPS remain insignificant, Overall our results,
which are consistent with findings based on Tobin’s Q, support H1a, as firms with high CPS/ECPS
tend to have better accounting performance measured by ROE.
Regarding the control variables, the coefficient of board size is positive but insignificant. The
coefficient of risk is negative and significant across the models, indicating that more risky firms have
lower future performance. Finally, the coefficient of MB (market-to-book) is strongly positive across
the models, which suggests that firms with higher growth opportunity have better future performance
measured by ROE.
<< Insert Table 5 about here >>

21
5.3.3 Results on the association between CPS/ECPS and sub-index related to board, compensation
and takeover
Finally, we replace CG index (CGI) with sub-index related to board, compensation and takeover, and
test whether these sub-indices have an impact of CPS (Models 1 and 2) and ECPS (Models 3 and 4).
The results, which are reported in Table 6, are generally consistent with early findings. In Models 1
the coefficient of board-sub is positive and significant (0.026, P= 0.05), which suggests a strong and
effective board reflected by a higher board sub-index is positively associated with CPS. In Model 2,
we do not include the year and industry dummies, and find largely consistent results (the coefficient
of board-sub is 0.023 P= 0.10). We also report evidence supporting a non-linear relationship between
board size and CPS, as the coefficients of board size are significantly negative while the coefficients
of square term of board size are significantly positive in both Models 1 and 2. The findings related to
control variables are broadly consistent with those reported in Table 3.
We re-estimate the regressions in Models 3 and 4 by substituting CPS with ECPS. In Models 3
and 4 the coefficients of board-sub are significant and positive (0.029, P= 0.10; 0.024, P= 0.10),
suggesting that an effective board is positively associated with ECPS. The results pertaining to
control variables are also consistent with those reported in Table 3.
<< Insert Table 6 about here >>

22
6. Conclusion
We follow Bebchuk et al. (2011) and measure the relative importance of the CEO with the
percentage of the total compensation of five highly paid executives that is captured by the CEO
(CPS). High CPS may indicate that the CEO has superior capability or skills, which enhances his/her
contribution to the firm (managerial talent hypothesis). Alternatively, high CPS can be explained by
the managerial power approach, since weak corporate governance structure will lead to inefficient
design of compensation contract, thus powerful CEOs will take this advantage to maximize their
remuneration.
Based the analysis on a sample of non-financial UK firms, we show that higher CPS is positively
associated with firm performance measured by Tobin’s Q after controlling the firm-specific
characteristics and governance variables that have been documented to affect performance. We
report similar results when we examine the association between equity-based CPS and firm
performance. Our results remain unaffected when we use return on assets and return on equity to
reflect accounting performance of the firm. Our findings largely support the managerial talent
hypothesis, as CEOs of listed firms in UK with outstanding capability and skills are able to enhance
firm performance and are thus rewarded with relatively higher compensation. We interpret the
difference between the findings of Bebchuk et al. (2011) and ours with the different institutional
background between US and UK: since 1990’s a series of reports have been issued to strengthen the
internal governance of public corporation in UK. In particular, the Greenbury report, which was
issued in 1995, recommends the establishment of remuneration committee comprising entirely of
non-executive directors to decide the remuneration policy and the remuneration of individual
executive directors. As a result, relative to their counterparts in the US, UK CEOs are less likely to
have overwhelming influences on the remuneration committee when negotiation their compensation
package. Instead, they are likely to be compensated for their managerial talent and capability. Finally,

23
we find limited evidence of substitutive relationship between CPS/ECPS and corporate governance
disclosure quality. We further show that firms with better corporate governance disclosure tend to
have higher CPS, suggesting that talented CEOs are more likely to be employed by well-governed
firms.
Our study contributes to the literature in the following ways. First, we corroborate findings of
early studies on CEO compensation and firm performance in the UK and contribute to the ongoing
debate about whether high CEO compensation reflects high managerial talent or managerial power.
The positive association between CPS/equity-based CPS and firm performance suggests that CEOs
of public listed firms in UK are more likely to be compensated for their managerial talent and
capability. Second, we enrich the literature by providing evidence that institutional background may
play a key role in deciding how CEOs are compensated in different countries.
Our study is subject to several limitations, however. First, although we take the standard
instrumental variable approach to mitigate the potential endogeneity problem in our analysis, we are
unable to rule out the endogeneity problem in our model. Second, our tests are based on a relatively
small sample of 130 firms. Third, our sample period (2003-2009) falls into the post-corporate
governance reform era in UK, so we are not able to disentangle the effect of the reform on the
association between CEO compensation and firm performance. Finally, different corporate
governance proxies can be used to investigate their effects on different measurers of firm
performance and value. We leave this for future research.

24
Reference
Agrawal, A., and Knoeber, C. 1996 “Firm performance and mechanisms to control agency problems
between managers and shareholders”. Journal of Financial and Quantitative Analysis 31: 377-397.
Al-Najjar, B. and Ding R. 2014 “Product market competition and corporate governance disclosure:
Evidence from the UK.” Economic Issues 19 (1): 73-93.
Anderson, R. C., Mansi, S. A. and Reeb D. M. 2003 “Founding family ownership and the agency
costs of debt”. Journal of Financial Economics 68: 263-285.
Anderson, R.C., Mansi, S.. and Reeb, D. 2004 “Board characteristics, accounting report integrity and
the cost of debt”. Journal of Accounting and Economics. 37: p. 315-342.
Bebchuk, L.A., Cohen, A., and Ferrell, A. 2009 “What matters in corporate governance? Review of
Financial Studies” 22: 783-827.
Bebchuk, L.A., Cremers, M. and Peyer, U. 2011 “The CEO pay slice”. Journal of Financial
Economics 102: 199-221.
Bebchuk, L.A., and Fried, J. 2003 “Executive compensation as an agency problem.”. Journal of
Economic Perspectives17: 71-92.
Ben Amar, W. and Boujenoui, A. CEO attributes 2011 “board composition and acquirer value
creation: A Canadian study”. Canadian Journal of Administration Sciences: 480–492
Bennedsen, M., Perez-Gonzalez, F. and Wolfenzon, D.. 2010 “Do CEOs Matter?” Working paper,
Columbia University, Available at:
http://www1.gsb.columbia.edu/mygsb/faculty/research/pubfiles/3177/valueceos.pdf
Bertrand, M., and Mullainathan. S. 2001 “Are CEOs rewarded for luck? The ones without
principals”. Quarterly Journal of Economics 116: 901-932.
Bertrand, M., and Schoar, A. 2003 “Managing with style: the effect of managers on firm policies.”
Quarterly Journal of Economics 118-4: 1169-1208.
Beyer, A., Cohen, D.A., Lys, T.Z. and Walther, B.R. 2010 “The financial reporting environment:
review of the recent literature”. Journal of Accounting and Economics 50: 296-343.
Bhojraj, S. and Sengupta, P. 2003 “Effect of corporate governance on bond ratings and yields: The
role of institutional investors and outside directors”. Journal of Business 76: 455-473.
Bozec, R. and Bozec, Y. 2006 “The use of governance indexes in the governance-performance
relationship literature: International evidence”. Canadian Journal of Administrative Sciences 2012:
79–98.
Brown, L.D., and Caylor, M. 2006 “Corporate governance and firm performance”. Journal of
Accounting and Public Policy 25: 409-434.

25
Cadbury Committee. Report for the Committee on the Financial Aspects of Corporate Governance
1992. London, UK: Gee & Co. Publishing Ltd.
Carter, M.E., Franco, F., and Tuna, I. 2010 “Premium pay for executive talent: an empirical analysis”.
Working paper, available at http://ssrn.com/abstract=1658903
Chang, Y., Dasgupta, S., Hilary, G. 2010 “CEO ability, pay and firm performance”. Management
Science 56 (10): 211-229.
Chava, S., Livdan, D. and Purnanandam, A. K.. 2009 “Do shareholder rights affect the cost of bank
loans?” The Review of Financial Studies; 22(8): 2973-3004.
Chen, A. and Kao, L. 2010 “To improve investors’ valuation of accounting earnings in emerging
markets: evidence from Taiwan”. Canadian Journal of Administration Sciences 27: 376-390.
Cheung, Y., Jiang, P., and Tan, W. 2010”A transparency disclosure index measuring disclosures:
Chinese listed companies”. Journal of Accounting and Public Policy 29(3): 259-280.
Cheung, Y., Connelly, J.T., Jiang, P. and Limpaphayom, P. 2011 “Does corporate governance
predict future performance? Evidence from Hong Kong”. Financial Management 40(1): 159-197.
Conyon, M., and Peck, S. 1998 “Board size and corporate performance: evidence from European
countries.” European Journal of Finance 4: 291-304.
Core, J.E., Holthausen, R. W. and Larcker, D. F. 1999 “Corporate governance, chief executive
officercompensation, and firm performance”, Journal of Financial Economics 51: 371-406.
Cremers, M., Nair, V. and Wei, C. 2007 “Governance mechanisms and bond prices”. The Review of
Financial Studies 20(5):1359-1388.
Demerjian, P., Lev, B. and McVay, S. 2011 “Quantifying managerial ability: A new measure and
validity tests”. Management Science: 1229-1248
Denis, D. and Denis, D. 1995Performance changes following top management dismissals. Journal of
Finance; 50: p. 1029-1057.
Drobetz, W., Schillhofer, A. and Zimmermann, H. 2004 “Corporate governance and expected stock
returns: evidence from Germany”. European Financial Management 10 (2): 267-293.
Epps, R. and Cereola, S. 2008 “Do institutional shareholder services (ISS) corporate governance
ratings reflect a company’s operating performance?” Critical Perspective of Accounting 19: 1135-
1148.
Ertugrul, M. and Hegde, S. 2009 “Corporate governance ratings and firm performance”. Financial
Management: 139-160.
Falato, A., Li, D., Milbourn, T. 2011 “To Each According To His Ability? CEO pay and the market
for CEOs”. Working paper, available at http://ssrn.com/abstract=1699384
26
Forbes, W. P., Pogue, M. and Hodgkinson, L. 2014. “CEO pay in the UK FTSE 100: pay
inequality, board size and performance”. The European Journal of Finance:
FRC. Financial Reporting Council2008.The UK Corporate Governance Code. UK
Gompers, P., Ishii, J., Metrick, A. 2003 “Corporate governance and equity price”. Quarterly Journal
of Economics 118: 107-155.
Greenbury Committee Report on Directors’ Pay 1995. London, UK: Gee & Co. Publishing Ltd.
Guest, P. 2009 “The impact of board size on firm performance: evidence form the UK”. European
Journal of Finance 15:(4): 385-404.
Guy, F. 2005 “Earnings Distribution, Corporate Governance and CEO Pay”, International Review of
Applied Economics 19:(1): 51-65.
Hample Report 1998. “Committee on Corporate Governance: Final Report”. London, UK: Gee &
Co. Publishing Ltd.
Healy, P.M., Hutton, A.P. and Paplepu, K.G. 1999 “Stock performance and intermediation changes
surrounding sustained increases in disclosure”. Contemporary Accounting Research 16(3): 485-519.
Ho, C-K. 2005 “Corporate governance and corporate competitiveness: an international analysis”.
Corporate Governance: An International Review 13: p. 211-253.
Hughes, J. 1996 “The Greenbury report on director’s remuneration.” International Journal of
Manpower 17: 4-9.
Hussainey, K., and Walker, M. 2009 “The effects of voluntary disclosure policy and dividend
propensity on prices leading earnings”. Accounting and Business Research 39 (1); 37-55.
Khanna, N., and Poulsen, A. 1995 “Managers of financially distressed firms: villaims or
scapegoats?” Journal of Finance 5: 471-517.
Klock, M. S., Mansi, S. A. and Maxwell, W. F. 2005 “Does corporate governance matter to
bondholders?” Journal of Financial and Quantitative Analysis 40(4): 693-719.
Lang, L.H.P., and Stultz, R.M. 1994 “Tobin’s Q, corporate diversification and firm performance”.
Journal of Political Economy 102: 1248-1280.
Larcker, D., Richardson, S., and Tuna, T. 2007 “Corporate governance, accounting outcomes and
organizational performance”. The Accounting Review 82(4): 963-1008.
Larmou, S., and Vafeas, N. 2010 “The relation between board size and firm performance in firms
with a history of poor operating performance”. Journal of Management and Governance 14:61-85.

27
Lorca, C., Sánchez-Ballesta, J. and García-Meca, E. 2011 “Board effectiveness and cost of debt”.
Journal of Business Ethics 100 (4): 613-631.
McConnell, J., and H. Servaes 1990 “Additional evidence on equity ownership and corporate value”.
Journal of Financial Economics 27: 595-612.
Ozkan, N. 2011 “CEO compensation and firm performance: an empirical investigation of UK panel
data”. European Financial Management :17260-285.
Sheu, H., Chung, H. and Liu 2011 “Comprehensive disclosure of compensation and firm value: The
case of policy reforms in an emerging market”. Journal of Business Finance & Accounting 37(9) &
(10): 1115–1144.
Siepel, J. and Nightingale, P. 2014 “Anglo-Saxon governance: similarities, difference and outcomes
in a financialised world’. Critical Perspectives on Accounting 25(1): 27-35.
Wang, M. and Hussainey, K. 2013 “Voluntary forward-looking statements driven by corporate
governance and their value relevance”. Journal of Accounting and Public Policy 32 (3): 26-49.
Warner, J., Watts, R. and Wruck, K. 1988 “Stock price and top management changes”. Journal of
Financial Economics 20: 461-492.
Weisbach, M. 1988 “Outside directors and CEO turnover”. Journal of Financial Economics 20: 431-
460.
28
Table 1: Descriptive statistics
Variable Mean Std. Dev. Min Max
Tobin's Q 1.47 1.43 0.00 25.26
CPS 0.43 0.15 0.002 1.00
ECPS 0.44 0.18 0.0005 1.00
CGI 86.64 11.64 0.00 100
Cgidum 0.41 0.49 0.00 1.00
Bsize 8.34 2.15 1.00 20.00
Independ 0.48 0.12 0.00 0.78
Inown 16.67 15.50 4.92 73.40
Lev 0.27 0.60 0.00 8.39
ROE 17.41 16.29 -66.34 76.71
Capexp 0.04 0.03 -0.04 0.19
MB 2.84 4.45 -99.60 18.78
Size 5.82 0.60 1.16 7.91
Tobin’s Q is the market value of common equity plus the book value of preferred equity
and long-term debt divided by the book value of assets, CPS is the CEO pay Slice
measured as the percentage of the total compensation of top-five executives that is
captured by the CEO; ECPS is the equity-based CEO pay Slice measured as the
percentage of the total equity-based compensation of top-five executives that is captured
by the CEO; Cgidum is a dummy variable that takes one for observations with their value
of corporate governance reporting index above the sample mean, zero otherwise; Bsize is
the board size measured by number of directors in the board; Independ is the percentage
of independent directors in the board; Inown is the percentage of institutional ownership;
Lev is total debt to total asset ratio; ROE is the ratio of net income to total equity; Capexp

29
is ratio of capital expenditures to total assets MB is market to book ratio, Size is natural
logarithm of total assets.

30
Table 2: Correlation
1 2 3 4 5 6 7 8 9 10 11 12
2. CPS -0.12*** 1.00
3. ECPS -0.11*** 0.96*** 1.00
4. CGI -0.06 0.10** 0.10** 1.00
11. MB 0.32*** 0.01 0.002 -0.02 -0.06* 0.03 0.04 -0.10*** 0.26 0.03 1.00
12. Size -0.39*** 0.06* 0.07* 0.09** 0..39*** 0.38*** -0.13*** -0.43*** -0.36*** -0.03 -0.04 1.00
1. Tobin's Q 1.00
5. BSize -0.05 -0.22*** -0.20*** -0.10** 1.00
6. Independ -0.11*** 0.29*** 0.26*** 0.12*** -0.05 1.00
7. Inown 0.13*** 0.003 -0.01 -0.02 0.09** -0.05 1.00
8. Lev -0.07** 0.02 0.02 0.10** -0.27*** -0.32*** -0.12*** 1.00
9. ROE 0.15*** -0.02 -0.03 -0.01 -0.004 0.02 -0.03 -0.05 1.00
10. Capexp 0.050 0.04 0.05 -0.002 -0.08** 0.06* 0.05 -0.11*** 0.10*** 1.00
Tobin’s Q is the market value of common equity plus the book value of preferred equity and long-term debt divided by the book value of assets, CPS is the
CEO pay Slice measured as the percentage of the total compensation of top-five executives that is captured by the CEO; ECPS is the equity-based CEO pay
Slice measured as the percentage of the total equity-based compensation of top-five executives that is captured by the CEO; Cgidum is a dummy variable that
takes one for observations with their value of corporate governance reporting index above the sample mean, zero otherwise; Bsize is the board size measured
by number of directors in the board; Independ is the percentage of independent directors in the board; Inown is the percentage of institutional ownership; Lev
is total debt to total asset ratio; ROE is the ratio of net income to total equity; Capexp is ratio of capital expenditures to total assets MB is market to book
ratio, Size is natural logarithm of total assets.

31
Table 3, Panel A: Regression Results on determinant of CPS.
Dependent Variable: CPS Model (1) Model (2) Model (3)
Coef. SE Coef. SE Coef. SE
CGI 0.001** 0.0001 0.001** 0.0001 0.001** 0.000
CEOTen 0.001 0.002 0.001 0.002 0.001 0.002
CEOChair -0.103*** 0.039 -0.101* 0.060 -0.075 0.064
CEOGen -0.015 0.025 -0.016 0.025 -0.046 0.040
Inown 0.001 0.001 0.001 0.002 0.001 0.002
Independ 0.420*** 0.072 0.439*** 0.081 0.393*** 0.089
Bsize -0.025*** 0.005 -0.034* 0.018 -0.088*** 0.034
Bsize2
0.001 0.001 0.003* 0.002
Inown2
0.000 0.000 0.000 0.000
Lev
-0.004 0.089
MB
-0.003 0.005
Tobin
-0.007 0.015
ROE
0.000 0.001
Capexp
0.066 0.370
Size
0.031 0.032
Risk
0.002 0.015
Cons 0.391*** 0.071 0.414* 0.087 0.607*** 0.228
Year dummies Yes
Yes
Yes
Industry dummies Yes
Yes
Yes
Number of clustered firms 130.000
130.000
130.000
R2 0.259
0.260
0.280
CPS is the CEO pay slice measured as the percentage of the total compensation of top-five executives that is captured by the CEO; CGI is the value of
corporate governance disclosure index; CEOTen is CEO tenure, CEOChair is a dummy variable that takes one if CEO is the chair of the board, zero
otherwise; CEOGen is a dummy variable is CEO is male, zero otherwise. Inown is the percentage of institutional ownership; Independ is the percentage of

32
independent directors in the board; Bsize is the board size measured by number of directors in the board; Bsize2 and Inown
2 are the squares of the board size
and percentage of institutional ownership, respectively; Lev is total debt to total asset ratio; MB is market to book ratio, Size is natural logarithm of total
assets; Tobin’s Q is the market value of common equity plus the book value of preferred equity and long-term debt divided by the book value of assets; ROE
is ratio of net income to total equity; Capexp is ratio of capital expenditures to total assets. Size is natural logarithm of total assets; Standard errors are
clustered at firm level.
***, **, * indicate coefficient is significant at 1 %, 5 %, and 10 % levels respectively.

33
Table 3, Panel B: Regression results on determinant of ECPS
Dependent Variable: ECPS Model (1) Model (2) Model (3)
Coef. SE Coef. SE Coef. SE
CGI 0.001** 0.001 0.001** 0.001 0.001* 0.0001
CEOTen 0.000 0.002 0.0001 0.002 0.0001 0.002
CEOChair -0.101** 0.041 -0.095 0.064 -0.074 0.068
CEOGen -0.018 0.027 -0.019 0.027 -0.050 0.043
Inown 0.000 0.001 0.001 0.002 0.001 0.002
Independ 0.445*** 0.078 0.454*** 0.086 0.409*** 0.096
Bsize -0.027*** 0.006 -0.033* 0.019 -0.082** 0.040
Bsize2
0.000 0.001 0.003 0.002
Inown2 0.000 0.000 0.000 0.000
Lev -0.014 0.100
Mb -0.003 0.005
Tobin -0.006 0.016
ROE 0.000 0.001
Capexp 0.070 0.397
Size 0.035 0.035
Risk -0.002 0.015
Cons 0.415*** 0.075 0.429*** 0.093 0.574** 0.261
Year dummies Yes Yes Yes
Industry dummies Yes Yes Yes
Number of clustered firms 130.000 130.000 130.000
R2 0.310 0.310 0.330

34
ECPS is the equity-based CEO pay slice measured as the percentage of the total equity-based compensation of top-five executives that is captured by the CEO;
CGI is the value of corporate governance disclosure index; CEOTen is CEO tenure, CEOChair is a dummy variable that takes one if CEO is the chair of the
board, zero otherwise; CEOGen is a dummy variable is CEO is male, zero otherwise. Inown is the percentage of institutional ownership; Independ is the
percentage of independent directors in the board; Bsize is the board size measured by number of directors in the board; Bsize2 and Inown
2 are the squares of
the board size and percentage of institutional ownership, respectively; Lev is total debt to total asset ratio; Risk is measured by firm’s historical beta; MB is
market to book ratio, Size is natural logarithm of total assets; Tobin’s Q is the market value of common equity plus the book value of preferred equity and
long-term debt divided by the book value of assets; ROE is ratio of net income to total equity; Capexp is ratio of capital expenditures to total assets; Standard
errors are clustered at firm level.
***, **, * indicate coefficient is significant at 1 %, 5 %, and 10 % levels respectively.

35

36
Table 4: Regression results with Tobin’s Q as the dependent variable
Dependent Variable:
Tobin’s Q
(1) (2) (3) (4) (5) (6)
Coef. SE Coef. SE Coef. SE Coef. SE Coef. SE Coef. SE
Independ -0.828 1.298 -0.706 0.678 -1.488 1.194 -0.829 1.270 -0.709 0.676 -1.480 1.169
Bsize 3.298*** 1.209 0.110** 0.047 2.502** 0.992 3.203*** 1.162 0.110** 0.047 2.420*** 0.962
Inown -0.036*** 0.038 -0.004 0.004 -0.028 0.035 -0.036 0.038 -0.004 0.004 -0.028 0.035
CPS 1.530** 0.769 0.294 0.348 1.742*** 0.620
ECPS
1.306* 0.657 0.266 0.328 1.519*** 0.538
Cgidum 0.143 0.278 0.082 0.178 0.100 0.272 0.079 0.265 0.072 0.173 0.042 0.257
Interaction -0.976 0.638 -0.259 0.385 -0.932 0.598
Interaction2
-0.790 0.575 -0.232 0.361 -0.764 0.544
bsize2 -0.175*** 0.065 -0.132** 0.055 -0.170*** 0.063 -0.128*** 0.053
inown2 0.001 0.001 0.0001*** 0.001 0.001 0.001 0.0001 0.001
Lev 1.514** 0.756 0.784** 0.377 0.972 0.642 1.489** 0.738 0.783** 0.377 0.954 0.633
Roe -0.005 0.007 -0.004 0.005 -0.002 0.008 -0.005 0.007 -0.004 0.005 -0.002 0.008
Capexp 4.095* 2.491 0.928 1.428 2.397 2.205 3.982* 2.436 0.925 1.426 2.348 2.162
Mb 0.236*** 0.063 0.235*** 0.052 0.239*** 0.060 0.236*** 0.063 0.236*** 0.051 0.240*** 0.059
Size -1.750*** 0.428 -1.158*** 0.214 -1.447*** 0.289 -1.726*** 0.416 -1.156*** 0.214 -1.429*** 0.284
Risk 0.026 0.127 0.0001 0.090 0.193 0.148 0.029 0.125 0.001 0.090 0.192 0.146
Cons -4.233 4.705 6.799*** 1.143 -2.213 4.438 -2.504 4.289 7.131*** 1.186 -1.881 4.319
Year dummies Yes
Yes
No
Yes
Yes
No
Industry dummies Yes
Yes
No
Yes
Yes
No
Number of clustered firms 130.000
130.000
130.000
130.000
130.000
130.000
R2 0.180
0.180
0.280
0.200
0.670
0.300

37
Tobin’s Q is the market value of common equity plus the book value of preferred equity and long-term debt divided by the book value of assets, Independ is
the percentage of independent directors in the board; Bsize is the board size measured by number of directors in the board; Inown is the percentage of
institutional ownership; CPS is the CEO pay Slice measured as the percentage of the total compensation of top-five executives that is captured by the CEO;
ECPS is the equity-based CEO pay Slice measured as the percentage of the total equity-based compensation of top-five executives that is captured by the
CEO; Cgidum is a dummy variable that takes one for observations with their value of corporate governance reporting index above the sample mean, zero
otherwise; Interaction is the interaction between CPS and Cgidum; Interaction2 is the interaction between ECPS and Cgidum. Bsize2 and Inown
2 are the
squares of the board size and percentage of institutional ownership, respectively; Lev is total debt to total asset ratio; ROE is net income to total equity ratio;
MB is market to book ratio; Size is natural logarithm of total assets; Risk is measured by firm’s historical beta; Capexp is ratio of capital expenditures to total
assets. Standard errors are clustered at firm level.
***,**,* indicate the coefficient is significant at 1 %, 5 %, and 10 % levels, respectively.

38
Table 5: Regression results with ROE as the dependent variable
Dependent Variable: ROE (1) (2) (3) (4) (5) (6)
Coef. SE Coef. SE Coef. SE Coef. SE Coef. SE Coef. SE
Independ -17.757 17.570 -14.312 15.245 -20.498 17.553 -16.593 16.893 -14.047 15.403 -20.316 18.380 Bsize 18.063 19.694 0.788 0.771 18.016 16.967 13.835 19.115 0.747 0.769 20.672 18.064 Inown 0.091 0.543 -0.054 0.075 0.300 0.528 0.116 0.524 -0.052 0.075 0.297 0.554 CPS 20.823** 8.647 17.036* 9.848 20.023** 9.785
ECPS
15.516** 7.169 14.334 9.162 16.528*** 9.181
Cgidum 3.444 5.035 4.390 4.045 4.595 5.085 2.705 5.024 3.700 3.928 2.944 5.305 Interaction -17.794* 10.362 -15.188 10.123 -19.677* 10.664
Interaction2
-14.719 9.990 -13.453 9.799 -16.634 10.552
bsize2 -0.953 1.054 -0.962 0.903 -0.730 1.023 -1.107 0.961
inown2 -0.005 0.010 -0.008 0.011 -0.005 0.010 -0.008 0.011
Lev -13.365 12.754 -
16.727** 8.061 -9.584 10.849 -14.566 12.540 -
16.649** 8.090 -8.601 11.344
capexp 1.930 41.792 -9.966 30.270 5.317 35.761 -1.713 40.162 -10.158 30.266 7.297 37.286
Mb 2.926*** 0.477 2.964*** 0.411 2.852*** 0.537 2.941*** 0.454 2.974*** 0.410 2.874*** 0.554
Size -0.102 6.642 2.318 4.115 2.600 5.414 0.875 6.536 2.386 4.113 2.171 5.553
Risk -4.299** 2.013 -3.906** 1.964 -3.555 2.300 -4.291** ` -3.892** 1.963 -3.453 2.317
cons -59.798 61.016 -4.338 25.111 -74.130 64.913 -46.033 58.870 -3.480 25.065 -82.114 68.507
Year dummies Yes
Yes
No
Yes
Yes
No Industry dummies Yes
Yes
No
Yes
Yes
No
Number of clustered firms 130.000
130.000
130.000
130.000
130.000
130.000 R
2 0.200
0.270
0.095
0.230
0.270
0.070

39
ROE is ratio of net income to total equity; Independ is the percentage of independent directors in the board; Bsize is the board size measured by number of
directors in the board; Inown is the percentage of institutional ownership; CPS is the CEO pay Slice measured as the percentage of the total compensation of
top-five executives that is captured by the CEO; ECPS is the equity-based CEO pay Slice measured as the percentage of the total equity-based compensation
of top-five executives that is captured by the CEO; Cgidum is a dummy variable that takes one for observations with their value of corporate governance
reporting index above the sample mean, zero otherwise; Interaction is the interaction between CPS and Cgidum; Interaction2 is the interaction between ECPS
and Cgidum. Bsize2 and Inown
2 are the squares of the board size and percentage of institutional ownership, respectively; Lev is total debt to total asset ratio;
MB is market to book ratio; Size is natural logarithm of total assets; Risk is measured by firm’s historical beta; Capexp is ratio of capital expenditures to total
assets. Standard errors are clustered at firm level. Some of the R2 are not reported as the regression doesn’t provide them for the 2SLS system.
***,**,* indicate the coefficient is significant at 1 %, 5 %, and 10 % levels, respectively.

40
Table 6: Regression results with sub- index related to board, compensation and takeover
(1) (2) (3) (4)
Coef. SE Coef. SE Coef. SE Coef. SE
Board-sub 0.026** 0.012 0.023* 0.013 0.029* 0.013 0.024* 0.014
Compensation-sub -0.014 0.011 -0.018* 0.010 -0.012 0.011 -0.014 0.012
Takeover-sub 0.0001 0.013 0.004 0.010 -0.001 0.015 0.010 0.012
CEOTen 0.001 0.002 0.001 0.002 0.0001 0.002 -0.001 0.003
CEOChair -0.100 0.064 -0.105* 0.061 -0.096 0.069 -0.097 0.066
CEOGen -0.049 0.038 -0.063** 0.033 -0.051 0.041 -0.061 0.040
Inown 0.001 0.002 0.002 0.002 0.001 0.002 0.002 0.002
Independ 0.382*** 0.090 0.398*** 0.090 0.394*** 0.097 0.419*** 0.096
Bsize -0.091*** 0.035 -0.095** 0.037 -0.086** 0.041 -0.093** 0.042
Bsize2
0.003* 0.002 0.004* 0.002 0.003 0.002 0.003 0.002
Inown2 0.0001*** 0.000 0.0001 0.000 0.000 0.000 0.000 0.000
Lev 0.003 0.092 -0.033 0.084 -0.004 0.103 -0.100 0.132
MB -0.002 0.005 -0.002 0.004 -0.003 0.005 -0.004 0.005
Tobin -0.009 0.015 0.002 0.015 -0.008 0.016 0.011 0.020

41
ROE 0.000 0.001 0.000 0.000 0.000 0.001 0.000 0.000
Capexp 0.024 0.387 0.122 0.362 0.025 0.413 0.343 0.525
Size 0.024 0.032 0.042 0.037 0.028 0.035 0.074 0.064
Risk -0.001 0.014 -0.003 0.014 -0.005 0.015 -0.008 0.016
Cons 0.656*** 0.252 0.549** 0.278 0.618** 0.283 0.325 0.455
Year dummies Yes
No
Yes
No
Industry dummies Yes
No
Yes
No
Number of clustered firms 130.000
130.000
130.000
130.000
R2
0.290
0.140
0.330
0.190
Models 1 and 2 have CPS as a dependent variable and Models 3 and 4 use ECPS as dependent variable; board sub is the sub-index for the corporate
governance index related to the board; compensation Sub is the sub-index for the corporate governance index related to compensation; takeover sub is the
sub-index related to takeover; other variables are defined as in table 1.
***,**,* indicate the coefficient is significant at 1 %, 5 %, and 10 % levels, respectively.