Birla Sun Life Mutual Fund - Aditya Birla Capital€¦ · 01 All About Mutual Funds What is the way...
66
Transcript of Birla Sun Life Mutual Fund - Aditya Birla Capital€¦ · 01 All About Mutual Funds What is the way...


Index
All About Mutual Funds 01
Savings Solutions 04
Regular Income Solutions 19
Wealth Creation Solutions 24
Tax Savings Solutions 48
Close Ended Scheme Performance 51
Fund Manager Wise Scheme Performance 52
Funds at A Glance 53
Investment Objective 56
Dividend History 58
Sector Allocation 60

01
All About Mutual Funds
What is the way then to help you achieve your financial needs and goals? The answer can be mutual funds. Here are a few things about mutual funds that you must know in order to benefit from them:
What are mutual funds?A mutual fund is a professionally managed collective investment scheme that pools money from many investors. This money is then invested in stocks, bonds, short-term money market instruments, and/or other securities.
Types of mutual fundsMutual funds can broadly be classified as open ended or close ended. While open ended funds are available for subscription and repurchase on a continuous basis and do not have a fixed maturity period, close ended funds are open for subscription only during a specified period at the time of launch of the scheme and have a stipulated maturity period. The funds can further be classified according to the investment objective as:
• Growth or equity funds: The aim of growth funds is to provide capital appreciation over medium to long term. Such schemes normally invest a major part of their corpus in equities and have comparatively high risks.• Debt funds: The objective of debt funds is to generate steady returns while aiming to preserve your capital. They invest only in fixed income instruments like company bonds, debentures, government securities etc.• Balanced funds: These funds invest in both equity and debt in varying proportions. So, their average returns and risk profile also fall some where in between growth and debt funds.
How do mutual funds score over equities? Unlike equity Investments, mutual fund investments do not
require you to analyze and track companies and the ways of the market. Also they can help them stay less affected by the fall in the prices of one particular stock as their returns are derived by overall performance of various stocks that the Mutual Fund invests in.
What’s the right time to buy and sell mutual funds?The right time to buy mutual funds is when the prices of the funds are low or falling. However, the holding period should be determined by the market conditions ideally. For eg. in growth funds a greater holding period can offer greater chance to benefit.
What are SIPs?A systematic investment plan allows you to invest in a fund at regular intervals rather than a lump sum one time amount. SIPs are based on the principle of rupee cost averaging which can help make a fall in scheme’s NAV work to the investor’s advantage. When the NAV falls because of a fall in the market, SIP can help accumulate more units at lower rates while restraining them from going overboard in a rising market by giving fewer units at those higher levels. Further, by staying invested for a long period of time, they may also profit from the appreciation in equities tend to show over the long term.
How do I select the right mutual funds?While choosing a mutual fund, it’s important to keep your objectives, risk appetite and investment budget in mind. You should also keep in mind the performance of the fund over the last couple of years and check the exit load charged by a particular scheme which is charged as a percentage of NAV and has the effect of reducing returns by that amount.
By keeping these simple things in mind, you can make mutual fund investments that can work to your advantage and help in realizing your financial goals.
Rising expenses, children’s education, unexpected emergencies and finally retirement – the demands on people’s money seem to be ever-rising. And savings alone may not prove to be enough to meet them all. Making judicious investments though can make their money work harder. However, most people are reluctant to invest as they find it very puzzling. More so, they don’t have the time to monitor the stock markets.

02
Investment OutlookEquity Investment Outlook
Domestic Growth Outlook This month we got another indication of the slowdown in India’s growth with Q3 FY12 GDP growth coming in at 6.1% versus 6.9% in Q2 FY12. To put this number in context we grew 5.6% in Dec’2008 and 6.1% is the lowest growth rate post the 2008 financial crisis. That said the reasons behind the slowdown are not new. From a supply perspective, Industrial growth has dropped significantly from a 6.8% rate in second half of FY11 to 2.6% in Q3 FY12. Slowdown in mining and manufacturing sectors is the major driver behind the slowdown in industrial growth.
From a demand stand-point the slowdown is primarily seen in gross capital formation or investments. Investments have actually shrunk by 1.6% in the July-December 2011 period. The glaring lack of investments growth is affecting not only near-term prospects, but also medium-term growth potential of the Indian economy. On the brighter side though, taking cognizance of the problems faced by industry. Unfortunately, there haven’t been any concrete proposals surfacing to solve the ongoing issues with availability of coal, land and labour.
Going forward, our fundamental view remains that India is poised for an estimated annual GDP growth of sub 7% for FY12 and FY13. We continue to believe that India is in a cyclical slowdown and all indicators point to current slowdown continuing over the next few quarters. Inflation OutlookOn the inflation front, we were pleasantly surprised as Jan 2012 WPI came in at 6.55% -- a level we were targeting by Mar 2012. More important than the headline number, manufactured products inflation (RBI gauge of core inflation) has stated to moderate and has now fallen to 6.5% in Jan 2012 from 8% in September 2011. Going forward we think that India’s inflation will oscillate between 5.5-6.5% through FY13. Our biggest comfort remains the moderation in YoY commodity prices as reflected by the CRY commodity index (CRY index is flat on YoY terms in 2012). The key risk in this forecast is a re-acceleration in commodity prices due to the liquidity injections by the ECB (European Central Bank).
Global Growth outlookGlobal markets and global economies have started to look better since mid-December 2011, when ECB (European Central Bank)
announced it will provide extended unlimited 3yr financing window to European banks at 1%. That said, we still think that Europe will struggle to grow in 2012 as a result of the austerity measures being implemented by Portugal, Spain and Italy. On the other hand, recent data out of US continues to beat expectations. US GDP growth clocked in 3% in Dec 2011 versus 0.4% in Mar 2011 quarter and consumer confidence has also picked up from 55.7 in August 2011 to 75.3 in February 2012. Overall, we continue to expect US and Europe growth to remain below trend over the next 12 months as economic recoveries for both will be hampered by high debt levels.
Central Bank StanceWe believe that RBI will focus on easing liquidity in the Mar’16 policy as borrowing in the LAF window has consistently exceeded the RBI’s comfort zone (1% of NDTL). Our expectation is for a 75bps CRR cut in the March policy. We think that the 50bps CRR cut by RBI in January 2012 is a first step along a number of liquidity and rate easing steps that the RBI will conduct over the next 9-12 months. In our view, CRR will be dramatically lower from the current 5.5% level by the time the current easing cycle is over.
We don’t think RBI will cut repo rate in the March policy meeting given the RBI stance of waiting for signs of fiscal consolidation (in the fiscal budget to be presented in Mar’16) before starting with the rate easing cycle.
Bond Market OutlookOur expectation over last few weeks that “current environment is better to own 1-3yr corporate bonds and lighten up on duration” has largely worked out. Since then, 10yr Gsec and 10yr corporate bond yields have stayed range bound in the 8.15-8.25% and 9.2-9.3% range. With RBI focused on improving liquidity over the next 1-2 months, we think the front end of the yield curve can offer attractive total return opportunity.
Due to tight liquidity conditions in money market space, partly due to seasonality and partly as a result of new SEBI regulations, 3mon and 6mon CD’s rates widened 75-100bps over last 4 weeks. We believe that both 3mon and 6mon rates have peaked at 11.15% and 10.75% respectively. With 1yr bank CD rates close to 200bps over repo rate, we think there is significant opportunity for 1-3yr rates to be 100-150bps lower over the next 6 months.
Debt Investment Outlook
The New Year momentum decelerated somewhat as we entered February 2012. The benchmark indices rose by approx. 3-3.5% (vs. 11.5-12.5% in January 2012). This was led by Real Estate, Auto and IT; while Capital Goods, Healthcare, Oil & Gas and FMCG lagged behind. Although, the liquidity tide over first 1 ½ months of the year lifted all boats together, markets have become more discerning since then. Given the policy uncertainty, we are not making significant sectoral deviations from the benchmark. However, we do maintain a bias towards rate sensitives, as monetary policy has highest potential for easing. While keeping sector allocations close to the benchmark, our preferred strategy is to build exposure through specific midcap stocks.
Expectations for policy and general economic conditions are not very high. Similarly, corporate earnings downgrade cycle is quite advanced and is decelerating. The bar for expectations is not very high and as such quite easy to surpass. Hence, risk reward seems? quite favorable for long-term investors to allocate money to equity assets. Opportunity cost of trying to time the rally could prove to be much larger than that of waiting.

03
Savings SolutionsWhat are Saving Solutions?
Our Savings Solutions are aimed at preserving your money, providing you with liquidity and giving you superior tax-efficient returns compared to bank accounts and FDs.
Who can benefit from Saving Solutions?
This is an ideal solution for investors who have low - medium propensity for risk and high liquidity. These can be ideal for first time investors in mutual funds.
Regular Income SolutionsWhat are Regular Income Solutions?
Our Regular Income Solutions aim to preserve your money and provide regular income.
Who can benefit from Regular Income Solutions?
This is an ideal solutions for investors who are interested in alternative modes of regular income, either in present of after retirement stage, and have low propensity for risk. (Regular income is not assured & is subject to availability of distributable surplus.)
Wealth Creation SolutionsWhat are Wealth Creation Solutions?
Our Wealth Creation Solutions aim to grow your money through equity/gold investments and are available in a range of conservative to aggressive options.
Who can benefit from Wealth Creation Solutions?
These solutions can be ideal for investors who are planning for future expenses, like higher education of children, marriage, buying a home etc.These solutions are available in the range of aggressive to conservative options to suit the needs of the investor.
Tax Savings SolutionsWhat are Tax Savings Solutions?
Our Tax Savings Solutions help to reduce your tax burden and at the same time, aim to grow your money through equity investments.
Who can benefit from Tax SavingsSolutions?
Tax saving is important, especially when investors can save up to ` 30,900 in taxes! Section 80C of the Income Tax Act, 1961 provides options to save tax by reducing the taxable income by up to ` 1 lakh.But, wealth creation is also important. Isn’t it? That’s why this solution is ideal for investors who would like to create wealth along with tax saving.Tax savings of ` 30,900 is calculated assuming qualifying amount of deduction is ` 1 lakh & investor falls in the top income tax slab of 30% & includes applicable cess. Investors are advised to consult their tax advisor in view of individual nature of tax benefits.Further, Tax deduction(s) available u/s 80C of the Income Tax Act, 1961 is subject to conditions specified therein. Investors are requested to note that fiscal laws may change from time to time and there can be no guarantee that the current tax position may continue in the future.
The Financial Solution(s) stated above is ONLY for highlighting the many advantages perceived from investments in Mutual Funds but does not in any manner, indicate or imply, either the quality of any particular Scheme or guarantee any specific performance/returns.

04
Savings Solutions
What are Saving Solutions?
Our Savings Solutions are aimed at preserving your money, providing you with liquidity and giving you superior tax-efficient returns compared to bank accounts and FDs.
Who can benefit from SavingSolutions?
This is an ideal solution for investors who have low - medium propensity for risk and high liquidity. These can be ideal for first time investors in mutual funds.
Benefits of Savings Solutions:
Make Inflation work in your favour: Inflation affects your returns from any investment including mutual funds. But, in case of savings solutions, you can use it to your advantage - through indexation - which can help you reduce the amount on which you have to pay tax. You can benefit from indexation, if investing for more than 1 year. Please consult your tax advisor on how to take advantage of indexation.
Aim to preserve your money: These schemes generally invest in instruments like bonds of reputed Indian companies and securities (bonds) issued by the Government of India which are considered relatively safe.
Aim to provide Liquidity: If you need to withdraw your money, all you have to do is submit a redemption slip and your money is normally credited to your bank account within one working day. You may also opt for an online redemption facility offered by many fund houses for added convenience.
Tax-efficient returns: You can earn returns in the form of monthly / quarterly dividends etc. which are completely tax-free in your hands. A dividend distribution tax of 13.519% is applicable and is deducted by the fund house.
There are various savings solutions available depending on the time period that you would like to invest for: a. 1 day to 3 months b. 3 to 6 months c. 6 months to 1 year d. 1 year +
Investors are advised to consult their tax advisor in view of individual nature of tax benefits. The Financial Solution (Savings Solution) stated above is ONLY for highlighting the many advantages perceived from investments in Mutual Funds but does not in any manner, indicate or imply, either the quality of any particular Scheme or guarantee any specific performance/returns.

Birla Sun Life Cash Plus
What is it?A fund that aims to provide the convenience of a savings account with the opportunity to earn higher post-tax returns. (Investors are advised to consult their tax advisor in view of individual nature of tax benefits.)
Fund Details
As on February 29, 2012
Fund Manager: Mr. Kaustubh Gupta & Ms. Sunaina Da CunhaManaging Fund Since: July 15, 2011Total Experience: 5 years & 7 yearsDate of inception: June 16, 1997Nature of the scheme: An Open-ended Liquid SchemeNAV of Plans / Options (`)^ Retail PlanGrowth: 279.6945 Dividend: 163.6940 Institutional PlanGrowth: 285.3258 Dividend: 108.0230 Weekly Dividend: 108.2047 Institutional Premium Plan Growth: 170.3510 Daily Dividend: 100.1950 Weekly Dividend: 100.3550
Benchmark: CRISIL Liquid Fund Index Load Structure (as % of NAV)Entry Load: Nil Exit Load: Nil Other Parameter Modified Duration : 0.06 yearsYield to Maturity: 9.59%Mark to Market: 0%Standard DeviationRetail Plan: 0.60%Institutional Plan: 0.59%Institutional Premium Plan: 0.57%
05
SAVINGS SOLUTIONS
Conservative Returns Low Risk 1 day + High Liquidity
^The Face Value per unit of all the plans/ options under Birla Sun Life Cash Plus has been changed from `.10/- to `.100/- effective from October 07, 2011
Investment Performance - Retail Plan - Growth
Date of Inception: June 16, 1997 NAV Per Unit. *
(`)
Birla Sun Life Cash Plus (%)
CRISIL Liquid
Fund Index # (%)
CRISIL 1Year T-BillIndex ##
(%)
Value of Standard Investment of ` 10000 in
Birla Sun Life Cash Plus (`)
CRISIL Liquid
Fund Index # (`)
CRISIL 1Year T-Bill
Index ## (`)
Since inception till December 30, 2011 (CAGR) 10.0000 7.22 N/A N/A 275603 N/A N/A
December 30, 2010 to December 30, 2011 (Absolute) 25.4163 8.44 8.17 6.44 10844 10817 10644
December 30, 2009 to December 30, 2010 (Absolute) 24.2811 4.68 5.11 2.81 10468 10511 10281
December 30, 2008 to December 30, 2009 (Absolute) 23.1954 4.68 4.89 3.38 10468 10489 10338
# Scheme Benchmark, ## Additional Benchmark, * As on start of period considered above.Past performance may or may not be sustained in future. Returns for dividend option would assume reinvestment of dividends declared, net of dividend distribution tax, if any, at the then prevailing NAV. Load and Taxes are not considered for computation of returns. When scheme/additional benchmark returns are not available, they have not been shown.Total Schemes Co-Managed by Fund Managers is 4. Total Schemes managed by Mr. Kaustubh Gupta is 77. Total Schemes managed by Ms. Sunaina Da Cunha is 5. Refer annexure on page no. 52 to know more on performance of schemes managed by Fund Managers.
NAV as on Dec 30, 2011: ` 275.6025
Rating Profile of Portfolio
60.60%
39.40%
AAA Cash & Current Assets
Issuer % to net Assets Rating Issuer % to net Assets RatingAllahabad Bank 7.13% State bank of Bikaner & Jaipur 2.45% CARE A1+
Canara Bank 4.20% CRISIL A1+ Axis Bank Ltd. 2.41% CRISIL A1+
ICICI Bank Ltd. 3.62% [ICRA] A1+ Karur Vysya Bank Ltd. 2.36% CRISIL A1+
Bank of Maharashtra 3.22% CRISIL A1+ Punjab National Bank 2.26% CARE A1+
Sterlite Energy Ltd. 2.59% CRISIL A1+ Indian Oil Corporation Ltd. 2.24% CRISIL A1+
Top Ten Portfolio Holdings
Note:Standard Deviation is calculated on annualised basis using 1 year history of monthly returns, source: MFI Explorer.
06
Birla Sun Life Cash Manager
What is it?A fund that aims to provide the convenience of a savings account with the opportunity to earn higher post-tax returns. (Investors are advised to consult their tax advisor in view of individual nature of tax benefits.)
Fund Details
As on February 29, 2012
Fund Manager: Mr. Kaustubh Gupta & Ms. Sunaina Da CunhaManaging Fund Since: July 15, 2011Total Experience: 5 years & 7 yearsDate of inception: Retail Plan: May 14, 1998Institutional Plan: September 27, 2004Nature of the scheme: An Open-ended Income Scheme
NAV of Plans / Options (`)^Retail PlanGrowth: 257.7782 Daily Dividend: 100.0450 Weekly Dividend: 100.0380 Institutional PlanGrowth: 178.3856 Daily Dividend: 100.0300 Weekly Dividend: 100.0411
Benchmark: CRISIL Short Term Bond Fund Index
Load Structure (as % of NAV) (Incl. for SIP) Entry Load: NilExit Load: Nil
Other ParameterModified Duration: 0.18 yearsYield to Maturity: 10.35%Mark to Market: 25%Standard Deviation: Retail Plan: 0.56%Institutional Plan: 0.58%
SAVINGS SOLUTIONS
Conservative Returns Low Risk 1 day + High Liquidity
^The Face Value per unit of all the plans/ options under Birla Sun Life Cash Manager has been changed from `.10/- to `.100/- effective from October 07, 2011
Investment Performance - Retail Plan - Growth
Date of Inception: May 14, 1998 NAV Per Unit. *
(`)
Birla Sun Life Cash
Manager (%)
CRISIL Short Term Bond Fund
Index # (%)
CRISIL 1Year T-BillIndex ##
(%)
Value of Standard Investment of ` 10000 in
Birla Sun Life Cash Manager
(`)
CRISIL Short Term Bond Fund Index # (`)
CRISIL 1 Year
T-Bill Index ## (`)
Since inception till December 30, 2011 (CAGR) 10.0000 7.09 N/A N/A 254194 N/A N/A
December 30, 2010 to December 30, 2011 (Absolute) 23.3888 8.68 7.87 6.44 10868 10787 10644
December 30, 2009 to December 30, 2010 (Absolute) 22.2476 5.13 4.70 2.81 10513 10470 10281
December 30, 2008 to December 30, 2009 (Absolute) 21.1518 5.18 6.75 3.38 10518 10675 10338
# Scheme Benchmark, ## Additional Benchmark, * As on start of period considered above.Past performance may or may not be sustained in future. Returns for dividend option would assume reinvestment of dividends declared, net of dividend distribution tax, if any, at the then prevailing NAV. Load and Taxes are not considered for computation of returns. When scheme/additional benchmark returns are not available, they have not been shown.Total Schemes Co-Managed by Fund Managers is 4. Total Schemes managed by Mr. Kaustubh Gupta is 77. Total Schemes managed by Ms. Sunaina Da Cunha is 5. Refer annexure on page no. 52 to know more on performance of schemes managed by Fund Managers.
NAV as on Dec 30, 2011: ` 254.1938
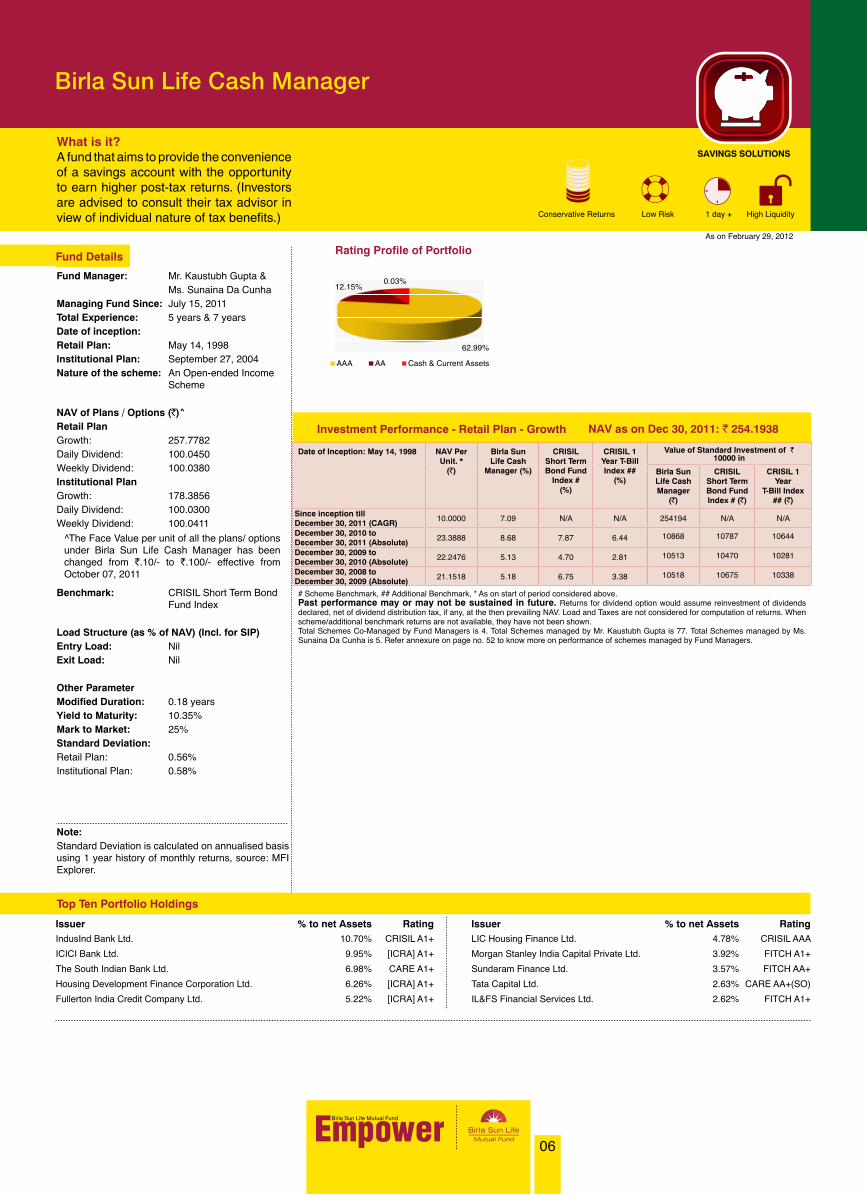
62.99%
12.15%0.03%
AAA AA Cash & Current Assets
Rating Profile of Portfolio
Issuer % to net Assets Rating Issuer % to net Assets RatingIndusInd Bank Ltd. 10.70% CRISIL A1+ LIC Housing Finance Ltd. 4.78% CRISIL AAA
ICICI Bank Ltd. 9.95% [ICRA] A1+ Morgan Stanley India Capital Private Ltd. 3.92% FITCH A1+
The South Indian Bank Ltd. 6.98% CARE A1+ Sundaram Finance Ltd. 3.57% FITCH AA+
Housing Development Finance Corporation Ltd. 6.26% [ICRA] A1+ Tata Capital Ltd. 2.63% CARE AA+(SO)
Fullerton India Credit Company Ltd. 5.22% [ICRA] A1+ IL&FS Financial Services Ltd. 2.62% FITCH A1+
Top Ten Portfolio Holdings
Note:Standard Deviation is calculated on annualised basis using 1 year history of monthly returns, source: MFI Explorer.

07
Birla Sun Life Savings Fund
What is it?A fund that aims to provide the convenience of a savings account with the opportunity to earn higher post-tax returns. (Investors are advised to consult their tax advisor in view of individual nature of tax benefits.)
Fund Details
Fund Manager: Mr. Maneesh Dangi & Mr. Kaustubh GuptaManaging Fund Since: July 15, 2011Total Experience: 11 years & 5 yearsDate of inception Retail Plan: November 27, 2001Institutional Plan: April 16, 2003Nature of the scheme: An Open-ended Short Term Income Scheme
NAV of Plans / Options (`)^Retail PlanGrowth: 197.1108 Daily Dividend: 100.0680 Weekly Dividend: 100.1135 Institutional PlanGrowth: 202.6478 Daily Dividend: 100.0680 Weekly Dividend: 100.1192
Benchmark: CRISIL Short Term Bond Fund Index
Load Structure (as % of NAV) (Incl. for SIP) Entry Load: NilExit Load: Nil
Other ParameterModified Duration: 0.11 yearsYield to Maturity: 10.47%Mark to Market: 20%Standard DeviationRetail Plan: 0.58%Institutional Plan: 0.54%
SAVINGS SOLUTIONS
Conservative Returns Low Risk 1 day + High Liquidity
As on February 29, 2012
^The Face Value per unit of all the plans/ options under Birla Sun Life Savings Fund has been changed from `.10/- to `.100/- effective from October 07, 2011
Investment Performance - Retail Plan - Growth
Date of Inception: Nov 27, 2001 NAV Per Unit. *
(`)
Birla Sun Life Savings
Fund (%)
CRISIL Short Term Bond Fund
Index # (%)
CRISIL 1Year T-BillIndex ##
(%)
Value of Standard Investment of ` 10000 in
Birla Sun Life Savings Fund (`)
CRISIL Short Term Bond Fund Index # (`)
CRISIL 1Year T-Bill
Index ## (`)
Since inception till December 30, 2011 (CAGR) 10.0000 6.81 N/A N/A 194184 N/A N/A
December 30, 2010 to December 30, 2011 (Absolute) 17.8242 8.94 7.87 6.44 10894 10787 10644
December 30, 2009 to December 30, 2010 (Absolute) 16.9359 5.25 4.70 2.81 10525 10470 10281
December 30, 2008 to December 30, 2009 (Absolute) 16.0717 5.38 6.75 3.38 10538 10675 10338
# Scheme Benchmark, ## Additional Benchmark, * As on start of period considered above.Past performance may or may not be sustained in future. Returns for dividend option would assume reinvestment of dividends declared, net of dividend distribution tax, if any, at the then prevailing NAV. Load and Taxes are not considered for computation of returns. When scheme/additional benchmark returns are not available, they have not been shown.Total Schemes Co-Managed by Fund Managers is 2. Total Schemes managed by Mr. Maneesh Dangi is 4. Total Schemes managed by Mr. Kaustubh Gupta is 77. Refer annexure on page no. 52 to know more on performance of schemes managed by Fund Managers.
NAV as on Dec 30, 2011: ` 194.1840
76.53%
23.44% 0.03%
AAA Cash & Current Assets AA
Rating Profile of Portfolio
Issuer % to net Assets Rating Issuer % to net Assets RatingMorgan Stanley India Capital Private Ltd. 12.33% FITCH A1+ LIC Housing Finance Ltd. 5.31% CRISIL AAA
IndusInd Bank Ltd. 8.39% CRISIL A1+ Tata Capital Ltd. 4.79% [ICRA] A1+
Reliance Ports & Terminals Ltd. 7.89% CARE AAA ICICI Bank Ltd. 4.43% [ICRA] A1+
Reliance Capital Ltd. 7.11% CARE AAA Mahindra & Mahindra Financial Services Ltd. 3.07% CRISIL A1+
Punjab National Bank 6.19% CARE A1+ Housing Development Finance Corporation Ltd. 2.47% CRISIL AAA
Top Ten Portfolio Holdings
Note:Standard Deviation is calculated on annualised basis using 1 year history of monthly returns, source: MFI Explorer.

08
Birla Sun Life Ultra Short Term Fund
What is it?A fund that aims to provide the convenience of parking your savings with an opportunity to earn higher post-tax returns. (Investors are advised to consult their tax advisor in view of individual nature of tax benefits)
Fund Details
As on February 29, 2012
Fund Manager: Mr. Kaustubh Gupta & Mr. Lokesh MallyaManaging Fund Since: Sep 29, 2009Total Experience: 5 years & 5 yearsDate of inception: April 19, 2002Nature of the scheme: An Open-ended Short Term Income SchemeNAV of Plans / Options (`)^ Retail PlanGrowth: 191.9380 Daily Dividend: 100.0550 Fortnightly Dividend: 103.9280 Institutional PlanGrowth: 126.9982 Daily Dividend: 100.0550 Weekly Dividend: 101.7285 Fortnightly Dividend: 103.0693
Benchmark: CRISIL Short Term Bond Fund Index
Load Structure (as % of NAV)Entry Load : NilExit Load** : For redemption/switch- out of units within 15 days from the date of allotment: 0.25% of applicable NAV. **Exit Load is NIL for units issued in Bonus & Dividend Reinvestment.Other Parameter Modified Duration: 0.21 yearsYield to Maturity: 9.85%Mark to Market: 30%Standard Deviation: 0.59%
SAVINGS SOLUTIONS
Conservative Returns Low-Medium Risk 1 month + High Liquidity
Investment Performance - Retail Plan - Growth NAV as on Dec 30, 2011: ` 189.0928
Date of Inception: April 19, 2002 NAV Per Unit. *
(`)
Birla Sun Life Ultra
Short Term Fund (%)
CRISIL Short Term Bond Fund
Index # (%)
CRISIL 1Year T-BillIndex ##
(%)
Value of Standard Investment of ` 10000 in
Birla Sun Life Ultra
Short Term Fund (`)
CRISIL Short Term Bond Fund Index # (`)
CRISIL 1 Year
T-Bill Index ## (`)
Since inception till December 30, 2011 (CAGR) 10.0000 6.80 6.31 5.13 189093 18102 16246
December 30, 2010 to December 30, 2011 (Absolute) 17.3468 9.01 7.87 6.44 10901 10787 10644
December 30, 2009 to December 30, 2010 (Absolute) 16.4565 5.41 4.70 2.81 10541 10470 10281
December 30, 2008 to December 30, 2009 (Absolute) 15.6477 5.17 6.75 3.38 10517 10675 10338
# Scheme Benchmark, ## Additional Benchmark, * As on start of period considered above.Past performance may or may not be sustained in future. Returns for dividend option would assume reinvestment of dividends declared, net of dividend distribution tax, if any, at the then prevailing NAV. Load and Taxes are not considered for computation of returns. Total Schemes Co-Managed by Fund Managers is 1. Total Schemes managed by Mr. Kaustubh Gupta is 77. Total Schemes managed by Mr. Lokesh Mallya is 2. Refer annexure on page no. 52 to know more on performance of schemes managed by Fund Managers.
^The Face Value per unit of all the plans/ options under Birla Sun Life Ultra Short Term Fund has been changed from `.10/- to `.100/- effective from October 07, 2011
79.26%
15.44%5.30%
AAA Cash & Current Assets Sovereign
Rating Profile of Portfolio
Issuer % to net Assets Rating Issuer % to net Assets RatingAxis Bank Ltd. 10.51% CRISIL A1+ State Bank of Bikaner and Jaipur 5.94% CARE A1+
State Bank Of Patiala 8.69% CRISIL A1+ Hindustan Petroleum Corporation Ltd. 5.45% CRISIL A1+
IndusInd Bank Ltd. 8.50% CRISIL A1+ Bharat Petroleum Corporation Ltd. 4.37% CRISIL A1+
National Housing Bank 8.16% [ICRA] A1+ 91 Days TBills 13 April 12 4.23% Sovereign
ICICI Bank Ltd. 7.95% [ICRA] A1+ State Bank of Mysore 4.12% [ICRA] A1+
Top Ten Portfolio Holdings
Note:Standard Deviation is calculated on annualised basis using 1 year history of monthly returns, source: MFI Explorer.

09
Birla Sun Life Dynamic Bond Fund
What is it?A dynamic income solution that aims to generate returns with active management in bonds of quality companies to capture positive price movements and minimize the impact of adverse price movements.
Fund Details
Fund Manager: Mr. Maneesh DangiManaging Fund Since: September 12, 2007Total Experience: 11 yearsDate of inception: September 27, 2004Nature of the scheme: An Open-ended Income Scheme
NAV of Plans / Options (`) Growth: 17.8759 Monthly Dividend: 10.5082 Quarterly Dividend: 11.5129
Benchmark: CRISIL Composite Bond Fund Index
Load Structure (as % of NAV) (Incl. for SIP) Entry Load: NilExit Load**: For redemption / switch-out of units within 180 days from the date of allotment: 0.50% of applicable NAV. For redemption / switch-out of units after 180 days from the date of allotment: Nil. **Exit Load is NIL for units issued in Bonus & Dividend Reinvestment. Other Parameter Modified Duration: 1.78 yearsYield to Maturity: 10.20%Mark to Market: 87%Standard Deviation: 1.35%
SAVINGS SOLUTIONS
Conservative Returns Low-Medium Risk 9 month + High Liquidity
As on February 29, 2012
Investment Performance - Retail Plan - Growth NAV as on Dec 30, 2011: ` 17.5496
Date of Inception: Sept 27, 2004 NAV Per Unit. *
(`)
Birla Sun Life Dynamic Bond Fund
(%)
CRISIL Composite Bond Fund
Index # (%)
CRISIL 10Year Gilt
Index ## (%)
Value of Standard Investment of ` 10000 in
Birla Sun Life Dynamic
Bond Fund (`)
CRISIL Composite Bond Fund Index # (`)
CRISIL 10Year Gilt
Index ## (`)
Since inception till December 30, 2011 (CAGR) 10.0000 8.06 5.59 5.50 17550 14842 14750
December 30, 2010 to December 30, 2011 (Absolute) 16.0589 9.28 6.92 1.88 10928 10692 10188
December 30, 2009 to December 30, 2010 (Absolute) 15.2156 5.54 4.96 3.17 10554 10496 10317
December 30, 2008 to December 30, 2009 (Absolute) 14.1618 7.44 3.85 -8.57 10744 10385 9143
# Scheme Benchmark, ## Additional Benchmark, * As on start of period considered above.Past performance may or may not be sustained in future. Returns for dividend option would assume reinvestment of dividends declared, net of dividend distribution tax, if any, at the then prevailing NAV. Load and Taxes are not considered for computation of returns. Total Schemes managed by Mr. Maneesh Dangi is 4. Refer annexure on page no. 52 to know more on performance of schemes managed by Fund Manager.
58.66%
28.86%
12.49%
AAA AA Cash & Current Assets
Rating Profile of Portfolio
Issuer % to net Assets Rating Issuer % to net Assets RatingLIC Housing Finance Ltd. 12.67% CRISIL AAA Cholamandalam Inv & Finance company Ltd. 4.27% [ICRA] AA
Housing Development Finance Corporation Ltd. 8.90% CRISIL AAA Godrej Consumer Products Ltd. 3.97% [ICRA] AA
IDBI Bank Ltd. 6.05% CRISIL AA+ Shriram Transport Finance Company Ltd. 3.85% CARE AA+
Reliance Utilities & Power Private Ltd. 5.71% CARE AAA India Bulls Financial Services Ltd. 3.54% CARE AA+
Power Finance Corporation Ltd. 4.73% CRISIL AAA Reliance Ports & Terminals Ltd. 2.63% CARE AAA
Top Ten Portfolio Holdings
Note:Standard Deviation is calculated on annualised basis using 1 year history of monthly returns, source: MFI Explorer.

10
Birla Sun Life Medium Term Plan
What is it?An income solution that aims to optimize returns in medium term by investing with portfolio duration between 1 year to 5 years and using flexibility to change duration based on prevailing interest rate environment.
Fund Details
As on February 29, 2012
Fund Manager: Mr. Maneesh Dangi & Mr. Kaustubh GuptaManaging Fund Since: June 25, 2009Total Experience: 11 years & 5 yearsDate of inception: March 25, 2009 Nature of the scheme: An Open-ended Income SchemeNAV of Plans / Options (`) Retail PlanGrowth: 12.2761 Weekly Dividend: 10.0224 Fortnightly Dividend: 10.2227 Monthly Dividend: 10.1972 Institutional PlanGrowth: 11.9172 Weekly Dividend: 10.0255 Fortnightly Dividend: 10.2227 Monthly Dividend: 10.1547
Benchmark: CRISIL Short Term Bond Fund Index
Load Structure (as % of NAV) (Incl. for SIP) Entry Load: NilExit Load**: 0.25% if redeemed / switched out within 90 days from the date of allotment. **Exit Load is NIL for units issued in Bonus & Dividend Reinvestment.Other Parameter Modified Duration: 1.21 yearsYield to Maturity: 10.35%Mark to Market: 73%Standard Deviation: Institutional Plan: 1.05%
SAVINGS SOLUTIONS
Conservative Returns Low-Medium Risk 3 month + High Liquidity
Investment Performance - Retail Plan - Growth NAV as on Dec 30, 2011: ` 12.1065
Date of Inception: Mar 25, 2009 NAV Per Unit. *
(`)
Birla Sun Life Medium
Term Plan (%)
CRISIL Short Term Bond Fund
Index # (%)
CRISIL 10Year GiltIndex ##
(%)
Value of Standard Investment of ` 10000 in
Birla Sun Life Medium
Term Plan (`)
CRISIL Short Term Bond Fund Index # (`)
CRISIL 10Year Gilt
Index ## (`)
Since inception till December 30, 2011 (CAGR) 10.0000 7.15 6.22 2.50 12107 11817 10706
December 30, 2010 to December 30, 2011 (Absolute) 11.0666 9.40 7.87 1.88 10940 10787 10188
December 30, 2009 to December 30, 2010 (Absolute) 10.4500 5.90 4.70 3.17 10590 10470 10317
# Scheme Benchmark, ## Additional Benchmark, * As on start of period considered above.Past performance may or may not be sustained in future. Returns for dividend option would assume reinvestment of dividends declared, net of dividend distribution tax, if any, at the then prevailing NAV. Load and Taxes are not considered for computation of returns. Total Schemes Co-Managed by Fund Managers is 2. Total Schemes managed by Mr. Maneesh Dangi is 4. Total Schemes managed by Mr. Kaustubh Gupta is 77. Refer annexure on page no. 52 to know more on performance of schemes managed by Fund Managers.
63.35%
25.65%11.01%
AAA AA Cash & Current Assets
Rating Profile of Portfolio
Issuer % to net Assets Rating Issuer % to net Assets RatingSundaram Finance Ltd. 23.75% [ICRA] AA+ Mahindra & Mahindra Financial Services Ltd. 1.90% CRISIL AA+
LIC Housing Finance Ltd. 17.79% CRISIL AAA ICICI Bank Ltd. 0.28% [ICRA] A1+
Housing Development Finance Corporation Ltd. 15.78% CRISIL AAA
Reliance Utilities & Power Private Ltd. 15.65% CARE AAA
ECL Finance Ltd. 13.85% CRISIL A1+
Top Portfolio Holdings
Note:Standard Deviation is calculated on annualised basis using 1 year history of monthly returns, source: MFI Explorer.

11
Birla Sun Life Income Plus
What is it?A fund that invests in a combination of bonds and Government securities of varying maturities from time to time with an aim to optimize returns.
Fund Details
As on February 29, 2012
Fund Manager: Mr. Prasad DhondeManaging Fund Since: Jan 11, 2010Total Experience: 11 yearsDate of inception: October 21, 1995 Nature of the scheme: An Open-ended Income Scheme
NAV of Plans / Options (`)Growth: 47.6084 Quarterly Dividend: 12.6598 Benchmark: CRISIL Composite Bond Fund Index
Load Structure (as % of NAV) (Incl. for SIP) Entry Load: NilExit Load**: 1% if redeemed / switched out within 365 days from the date of allotment. **Exit Load is NIL for units issued in Bonus & Dividend Reinvestment.Other Parameter Modified Duration: 5.58 yearsYield to Maturity: 8.94%Mark to Market: 83%Standard Deviation: 3.33%
SAVINGS SOLUTIONS
Moderate Returns Medium Risk 1 yr + High Liquidity
Investment Performance - Growth NAV as on Dec 30, 2011: ` 46.6158
Date of Inception: Oct 21, 1995 NAV Per Unit. *
(`)
Birla Sun Life Income
Plus (%)
CRISIL Composite Bond Fund
Index # (%)
CRISIL 10Year Gilt
Index ## (%)
Value of Standard Investment of ` 10000 in
Birla Sun Life Income Plus (`)
CRISIL Composite Bond Fund Index # (`)
CRISIL 10Year Gilt
Index## (`)
Since inception till December 30, 2011 (CAGR) 10.0000 10.00 5.95 N/A 46616 20240 N/A
December 30, 2010 to December 30, 2011 (Absolute) 43.0042 8.40 6.92 1.88 10840 10692 10188
December 30, 2009 to December 30, 2010 (Absolute) 41.6863 3.16 4.96 3.17 10316 10496 10317
December 30, 2008 to December 30, 2009 (Absolute) 42.1811 -1.17 3.85 -8.57 9883 10385 9143
# Scheme Benchmark, ## Additional Benchmark, * As on start of period considered above.Past performance may or may not be sustained in future. Returns for dividend option would assume reinvestment of dividends declared, net of dividend distribution tax, if any, at the then prevailing NAV. Load and Taxes are not considered for computation of returns. When additional benchmark returns are not available, they have not been shown.Total Schemes managed by Mr. Prasad Dhonde is 6. Refer annexure on page no. 52 to know more on performance of schemes managed by Fund Manager.
37.45%
34.53%
16.78%
11.24%
Sovereign AAA Cash & Current Assets AA
Rating Profile of Portfolio
Issuer % to net Assets Rating Issuer % to net Assets Rating9.15% GOI 14Nov2024 37.38% Sovereign Reliance Ports & Terminals Ltd. 5.46% CARE AAA
IDBI Bank Ltd. 10.79% CRISIL AA+ Hindustan Petroleum Corporation Ltd. 4.15% CRISIL AAA
Axis Bank Ltd. 6.81% CRISIL A1+ Power Grid Corporation of India Ltd. 3.20% CRISIL AAA
Housing Development Finance Corporation Ltd. 5.47% CRISIL AAA Reliance Gas Transportation Infra Ltd. 2.30% CRISIL AAA
Power Finance Corporation Ltd. 5.47% CRISIL AAA State Bank of Mysore 1.01% [ICRA] A1+
Top Ten Portfolio Holdings
Note:Standard Deviation is calculated on annualised basis using 1 year history of monthly returns, source: MFI Explorer.

12
Birla Sun Life Short Term Fund(erstwhile Birla Sun Life Income Fund. Name changed w.e.f February 01, 2012)
What is it?A moderate income fund that invests in a combination of Government securities & bonds of varying maturities which can offer superior levels of yield at relatively lower levels of risks.
Fund Details
As on February 29, 2012
Fund Manager: Mr. Prasad DhondeManaging Fund Since: July 01, 2011Total Experience: 11 yearsDate of inception: March 3, 1997Nature of the scheme: An Open-ended Income Scheme
NAV of Plans / Options (`) Growth: 39.0478 Monthly Dividend: 11.6020
Benchmark: CRISIL Composite Bond Fund Index
Load Structure (as % of NAV) (Incl. for SIP) Entry Load: NilExit Load**: For redemption/switch-out of units within 30 days from the date of allotment: 0.50% of applicable NAV. For redemption/switch-out of units after 30 days from the date of allotment: Nil. ** Exit Load is NIL for units issued in Bonus & Dividend Reinvestment. Other Parameter Modified Duration: 1.27 yearsYield to Maturity: 9.76%Mark to Market: 96%Standard Deviation: 3.02%
SAVINGS SOLUTIONS
Moderate Returns Medium Risk 1 yr + High Liquidity
Investment Performance - Growth NAV as on Dec 30, 2011: ` 38.4163
Date of Inception: March 3, 1997 NAV Per Unit. *
(`)
Birla Sun Life Short Term Fund
(%)
CRISIL Composite Bond Fund
Index # (%)
CRISIL 10Year Gilt
Index ## (%)
Value of Standard Investment of ` 10000 in
Birla Sun Life Short Term Fund
(`)
CRISIL Composite Bond Fund Index # (`)
CRISIL 10Year Gilt
Index ## (`)
Since inception till December 30, 2011 (CAGR) 10.0000 9.54 N/A N/A 38416 N/A N/A
December 30, 2010 to December 30, 2011 (Absolute) 35.0563 9.58 6.92 1.88 10958 10692 10188
December 30, 2009 to December 30, 2010 (Absolute) 33.7690 3.81 4.96 3.17 10381 10496 10317
December 30, 2008 to December 30, 2009 (Absolute) 35.6783 -5.35 3.85 -8.57 9465 10385 9143
# Scheme Benchmark, ## Additional Benchmark, * As on start of period considered above.Past performance may or may not be sustained in future. Returns for dividend option would assume reinvestment of dividends declared, net of dividend distribution tax, if any, at the then prevailing NAV. Load and Taxes are not considered for computation of returns. When scheme/additional benchmark returns are not available, they have not been shown.Total Schemes managed by Mr. Prasad Dhonde is 6. Refer annexure on page no. 52 to know more on performance of schemes managed by Fund Manager.
71.77%
24.24%4.00%
AAA AA Cash & Current Assets
Rating Profile of Portfolio
Issuer % to net Assets Rating Issuer % to net Assets RatingLIC Housing Finance Ltd. 12.62% CRISIL AAA Shriram Transport Finance Company Ltd. 5.78% CARE AA+
Housing Development Finance Corporation Ltd. 11.55% CRISIL AAA Mahindra & Mahindra Financial Service Ltd. 5.74% CRISIL AA+
Sundaram Finance Ltd. 9.19% [ICRA] AA+ National Housing Bank 5.73% FITCH AAA
Infrastructure Development Finance Company Ltd. 9.04% [ICRA] AAA National Housing Bank 5.64% CRISIL AAA
National Bank for Agriculture & Rural Development 6.88% CRISIL AAA Tata Motors Ltd. 5.37% CRISIL AAA(SO)
Top Ten Portfolio Holdings
Note:Standard Deviation is calculated on Annualised basis using 3 year history of monthly returns, source: MFI Explorer.

13
Birla Sun Life Floating Rate Fund - Long Term Plan
What is it?A fund that aims to generate income by investing substantially into floating rate debt/money market instruments.
Fund Details
As on February 29, 2012
Fund Manager: Mr. Kaustubh Gupta & Ms. Sunaina Da CunhaManaging Fund Since: July 15, 2011Total Experience: 5 years & 7 yearsDate of inception: June 05, 2003Nature of the scheme: An Open-ended Income Scheme
NAV of Plans / Options (`)^Retail PlanGrowth: 182.8090 Weekly Dividend: 100.0233 Institutional PlanGrowth: 125.8508 Daily Dividend: 100.0190 Weekly Dividend: 100.0237
Benchmark: CRISIL Liquid Fund Index
Load Structure (as % of NAV) (Incl. for SIP) Entry Load: NilExit Load**: Nil ** Exit Load is NIL for units issued in Bonus & Dividend Reinvestment.
Other Parameter Modified Duration: 0.20 yearsYield to Maturity: 10.00%Mark to Market: 40%Standard Deviation: 0.44%
SAVINGS SOLUTIONS
Conservative Returns Low Risk 1 month + High Liquidity
^The Face Value per unit of all the plans/ options under Birla Sun Life Floating Rate Fund – Long Term Plan has been changed from ` 10/- to ` 100/- effective from October 07, 2011
Investment Performance - Retail Plan - Growth NAV as on Dec 30, 2011: ` 180.0156
Date of Inception: June 05, 2003 NAV Per Unit. *
(`)
Birla Sun Life Floating Rate Fund - Long Term Plan (%)
CRISIL Liquid
Fund Index # (%)
CRISIL 1Year T - Bill
Index ## (%)
Value of Standard Investment of ` 10000 in
Birla Sun Life Floating
Rate Fund - Long
Term Plan (`)
CRISIL Liquid
Fund Index # (`)
CRISIL 1Year T - Bill
Index ## (`)
Since inception till December 30, 2011 (CAGR) 10.0000 7.10 5.95 4.96 180016 16417 15142
December 30, 2010 to December 30, 2011 (Absolute) 16.4875 9.18 8.17 6.44 10918 10817 10644
December 30, 2009 to December 30, 2010 (Absolute) 15.5268 6.19 5.11 2.81 10619 10511 10281
December 30, 2008 to December 30, 2009 (Absolute) 14.3539 8.17 4.89 3.38 10817 10489 10338
# Scheme Benchmark, ## Additional Benchmark, * As on start of period considered above.Past performance may or may not be sustained in future. Returns for dividend option would assume reinvestment of dividends declared, net of dividend distribution tax, if any, at the then prevailing NAV. Load and Taxes are not considered for computation of returns. Total Schemes Co-Managed by Fund Managers is 4. Total Schemes managed by Mr. Kaustubh Gupta is 77. Total Schemes managed by Ms. Sunaina Da Cunha is 5. Refer annexure on page no. 52 to know more on performance of schemes managed by Fund Managers.
94.27%
5.73%
AAA Cash & Current Assets
Rating Profile of Portfolio
Issuer % to net Assets Rating Issuer % to net Assets RatingKarnataka Bank Ltd. 18.28% [ICRA] A1+ Indian Oil Corporation Ltd. 4.24% CRISIL A1+
State Bank of Hyderabad 11.64% [ICRA] A1+ The Jammu & Kashmir Bank Ltd. 4.22% CRISIL A1+
ICICI Bank Ltd. 8.50% [ICRA] A1+ Infrastructure Development Finance Company Ltd. 3.19% [ICRA] A1+
Canara Bank 7.93% CRISIL A1+ IDBI Bank Ltd. 3.14% CRISIL A1+
State Bank of Bikaner and Jaipur 6.09% CARE A1+ Housing Development Finance Corporation Ltd. 3.13% [ICRA] A1+
Top Ten Portfolio Holdings
Note:Standard Deviation is calculated on annualised basis using 1 year history of monthly returns, source: MFI Explorer.

14
Birla Sun Life Floating Rate Fund - Short Term Plan
What is it?A fund that provides the convenience of parking your savings with an opportunity to earn higher post-tax returns. (Investors are advised to consult their tax advisor in view of individual nature of tax benefits.)
Fund Details
As on February 29, 2012
Fund Manager: Mr. Kaustubh Gupta & Ms. Sunaina Da CunhaManaging Fund Since: July 15, 2011Total Experience: 5 years & 7 yearsDate of inception: June 05, 2003Nature of the scheme: An Open-ended Income SchemeNAV of Plans / Options (`)^ Retail PlanGrowth: 174.9903 Daily Dividend: 100.0150 Weekly Dividend: 103.8797 Institutional PlanGrowth: 141.2055 Daily Dividend: 100.0200 Weekly Dividend: 100.2094
Benchmark: CRISIL Liquid Fund Index
Load Structure (as % of NAV)Entry Load: NilExit Load**: Nil ** Exit Load is NIL for units issued in Bonus & Dividend Reinvestment.
Other Parameter Modified Duration: 0.08 yearsYield to Maturity: 10.19%Mark to Market: 0%Standard Deviation: 0.54%
SAVINGS SOLUTIONS
Conservative Returns Low-Medium Risk 1 day + High Liquidity
^The Face Value per unit of all the plans/ options under Birla Sun Life Floating Rate Fund – Short Term Plan has been changed from `.10/- to `.100/- effective from October 07, 2011
Investment Performance - Retail Plan - Growth NAV as on Dec 30, 2011: ` 172.3020
Date of Inception: June 05, 2003 NAV Per Unit. *
(`)
Birla Sun Life Floating Rate Fund - Short Term
Plan (%)
CRISIL Liquid
Fund Index # (%)
CRISIL 1Year T - Bill
Index ## (%)
Value of Standard Investment of ` 10000 in
Birla Sun Life Floating
Rate Fund - Short
Term Plan (`)
CRISIL Liquid
Fund Index # (`)
CRISIL 1Year T - BillIndex ## (`)
Since inception till December 30, 2011 (CAGR) 10.0000 6.55 5.95 4.96 172302 16417 15142
December 30, 2010 to December 30, 2011 (Absolute) 15.8141 8.95 8.17 6.44 10895 10817 10644
December 30, 2009 to December 30, 2010 (Absolute) 14.9709 5.63 5.11 2.81 10563 10511 10281
December 30, 2008 to December 30, 2009 (Absolute) 14.2050 5.39 4.89 3.38 10539 10489 10338
# Scheme Benchmark, ## Additional Benchmark, * As on start of period considered above.Past performance may or may not be sustained in future. Returns for dividend option would assume reinvestment of dividends declared, net of dividend distribution tax, if any, at the then prevailing NAV. Load and Taxes are not considered for computation of returns. Total Schemes Co-Managed by Fund Managers is 4. Total Schemes managed by Mr. Kaustubh Gupta is 77. Total Schemes managed by Ms. Sunaina Da Cunha is 5. Refer annexure on page no. 52 to know more on performance of schemes managed by Fund Managers.
93.13%
6.87%
AAA Cash & Current Assets
Rating Profile of Portfolio
Issuer % to net Assets Rating Issuer % to net Assets RatingInfina Finance Pvt. Ltd. 14.62% CRISIL A1+ Vijaya Bank 5.74% CARE A1+
Axis Bank Ltd. 9.77% CRISIL A1+ State Bank of Hyderabad 5.01% [ICRA] A1+
Housing Development Finance Corporation Ltd. 9.00% [ICRA] A1+ Oriental Bank of Commerce 4.84% CRISIL A1+
ICICI Bank Ltd. 7.02% [ICRA] A1+ Sesa Goa Ltd. 4.11% CRISIL A1+
IndusInd Bank Ltd. 5.90% ING Vysya Bank Ltd. 3.90% CRISIL A1+
Top Ten Portfolio Holdings
Note:Standard Deviation is calculated on annualised basis using 1 year history of monthly returns, source: MFI Explorer.

83.84%
16.16%
15
Birla Sun Life Gilt Plus
What is it?A fund that aims to generate income and capital appreciation by investing exclusively in Government Securities.
As on February 29, 2012
Fund Manager: Mr. Prasad DhondeManaging Fund Since: July 01, 2011Total Experience: 11 yearsDate of inception: October 12, 1999Nature of the scheme: An Open-ended Government Securities SchemeNAV of Plans / Options (`) Liquid Plan Growth: 23.9167 Dividend: 10.6869 Annual Dividend Option: 10.8274 PF Plan Growth: 27.6004 Dividend: 11.0714 Regular PlanGrowth: 34.0907 Dividend: 12.5825 Benchmark: Liquid Plan: I-Sec SI-BEXPF Plan: I-Sec LI-BEXRegular Plan: I-Sec LI-BEX
Load Structure (as % of NAV) (Incl .for SIP)Liquid Plan, Regular Plan & PF Plan - Quarterly / Annual DividendEntry Load: NilExit Load: NilPF Plan - GrowthEntry Load: NilExit Load**: 1% if redeemed / switched out within 365 days from the date of allotment. **Exit Load is NIL for units issued in Bonus & Dividend Reinvestment.Other Parameter Modified Duration: Liquid Plan: 0.00 yearsPF Plan: 5.12 years Regular Plan: 5.04 years Yield to Maturity: Liquid Plan: 8.30% PF Plan: 8.35% Regular Plan: 8.36% Mark to Market:Liquid Plan: 93% PF Plan: 64% Regular Plan: 61%Standard Deviation: Liquid Plan: 1.06% PF Plan: 4.08%Regular Plan: 3.87%
Note:Standard Deviation is calculated on annualised basis using 3 year history of monthly returns, source: MFI Explorer.
Top Portfolio Holdings - Liquid PlanIssuer % to net Assets Rating Issuer % to net Assets Rating91 Days TBills 13 April 12 83.84% Sovereign Cash & Current Assets 36.11%Cash & Current Assets 16.16% 8.79% GOI 08 Nov 2021 33.68% Sovereign
9.15% GOI 14Nov2024 30.22% Sovereign
Top Portfolio Holdings - PF Plan
SAVINGS SOLUTIONS
Moderate Returns Medium Risk 1 yr + High Liquidity
Issuer % to net Assets RatingCash & Current Assets 38.08%8.79% GOI 08 Nov 2021 34.98% Sovereign9.15% GOI 14Nov2024 26.94% Sovereign
Investment Performance - Liquid Plan - Growth NAV as on Dec 30, 2011: ` 23.6093 Date of Inception: Oct 12, 1999 NAV Per
Unit. *(`)
Birla Sun Life Gilt Plus- Liquid Plan
(%)
I-Sec SI-BEX # (%)
CRISIL 1 Year
T-Bill Index ## (%)
Value of Standard Investment of ` 10000 in
Birla Sun Life Gilt
Plus - Liquid Plan (`)
I-Sec SI-BEX # (`)
CRISIL 1 YearT-Bill Index
## (`)
Since inception till December 30, 2011 (CAGR) 10.0000 7.28 N/A N/A 23609 N/A N/A
December 30, 2010 to December 30, 2011 (Absolute) 22.0573 7.04 7.66 6.44 10704 10766 10644
December 30, 2009 to December 30, 2010 (Absolute) 20.6985 6.56 4.82 2.81 10656 10482 10281
December 30, 2008 to December 30, 2009 (Absolute) 20.0060 3.46 5.33 3.38 10346 10533 10338
Date of Inception: Oct 12, 1999 NAV Per Unit. *
(`)
Birla Sun Life Gilt Plus- PF
Plan (%)
I-Sec LI-BEX # (%)
CRISIL 10 Year
Gilt Index ## (%)
Value of Standard Investment of ` 10000 in
Birla Sun Life Gilt Plus- PF Plan (`)
I-Sec LI-BEX # (`)
CRISIL 10 Year
Gilt Index ## (`)
Since inception till December 30, 2011 (CAGR) 10.0000 8.44 N/A N/A 26919 N/A N/A
December 30, 2010 to December 30, 2011 (Absolute) 24.4997 9.88 6.05 1.88 10988 10605 10188
December 30, 2009 to December 30, 2010 (Absolute) 23.8924 2.54 6.36 3.17 10254 10636 10317
December 30, 2008 to December 30, 2009 (Absolute) 26.6314 -10.28 -7.35 -8.57 8972 9265 9143
Investment Performance - PF Plan - Growth NAV as on Dec 30, 2011: ` 26.9191
Date of Inception: Oct 12, 1999 NAV Per Unit. *
(`)
Birla Sun Life Gilt Plus -
Regular Plan (%)
I-Sec LI-BEX # (%)
CRISIL 10 Year
Gilt Index ## (%)
Value of Standard Investment of ` 10000 in
Birla Sun Life Gilt
Plus- Regular Plan (`)
I-Sec LI-BEX # (`)
CRISIL 10 Year
Gilt Index ## (`)
Since inception till December 30, 2011 (CAGR) 10.0000 10.36 N/A N/A 33367 N/A N/A
December 30, 2010 to December 30, 2011 (Absolute) 31.5569 5.74 6.05 1.88 10574 10605 10188
December 30, 2009 to December 30, 2010 (Absolute) 30.5936 3.15 6.36 3.17 10315 10636 10317
December 30, 2008 to December 30, 2009 (Absolute) 32.8293 -6.81 -7.35 -8.57 9319 9265 9143
# Scheme Benchmark, ## Additional Benchmark, * As on start of period considered above.Past performance may or may not be sustained in future. Returns for dividend option would assume reinvestment of dividends declared, net of dividend distribution tax, if any, at the then prevailing NAV. Load and Taxes are not considered for computation of returns. When scheme/additional benchmark returns are not available, they have not been shown.Total Schemes managed by Mr. Prasad Dhonde is 6. Refer annexure on page no. 52 to know more on performance of schemes managed by Fund Manager.
Investment Performance - Regular Plan - Growth NAV as on Dec 30, 2011: ` 33.3667
Liquid Plan PF Plan Regular Plan
61.92%
38.08%
Sovereign Cash & Current Assets
63.89%
36.11%
Sovereign Cash & Current Assets
63.89%
36.11%
Sovereign Cash & Current Assets
Rating Profile of Portfolio
Top Portfolio Holdings - Regular Plan
Fund Details

Birla Sun Life Government Securities Fund
What is it?A fund that aims to generate current income consistent with the portfolio invested exclusively in Government Securities.
As on February 29, 2012
Fund Details
Fund Manager: Mr. Maneesh DangiManaging Fund Since: June 18, 2009Total Experience: 11 yearsDate of inception: October 28, 1999Nature of the scheme: An Open-ended Gilt SchemeNAV of Plans / Options (`) Long Term PlanGrowth: 30.9753 Half Yearly Dividend: 11.8497 Short Term Plan Retail PlanGrowth: 20.3300 Daily Dividend: 10.0031 Institutional PlanDaily Dividend: 10.0000 Benchmark: Long Term Plan: I-Sec LI-BEXShort Term Plan: I-Sec SI-BEXLoad Structure (as % of NAV) (Incl. for SIP) Entry Load: NilExit Load**: Long Term Plan: 1% if redeemed / switched out within 365 days from the date of allotment.Short Term Plan: Nil **Exit Load is NIL for units issued in Bonus & Dividend Reinvestment.
Other ParameterModified Duration:Long Term Plan: 6.45 yearsShort Term Plan: 0.00 yearsYield to Maturity: Long Term Plan: 8.24%Short Term Plan: 8.30%Mark to Market: Long Term Plan: 90%Short Term Plan: 0%Standard Deviation:Long Term Plan: 5.09%Short Term Plan: 0.70%
Note:Standard Deviation is calculated on annualised basis using 1 year history of monthly returns, source: MFI Explorer.
Issuer % to net Assets Rating Issuer % to net Assets Rating8.79% GOI 08 Nov 2021 69.28% Sovereign Cash & Current Assets 100.00%
9.15% GOI 14Nov2024 21.51% Sovereign
Cash & Current Assets 9.21% Sovereign
Top Portfolio Holdings - Long Term Plan Top Portfolio Holdings - Short Term Plan
SAVINGS SOLUTIONS
Moderate Returns Medium Risk 1 yr + High Liquidity
Date of Inception: Oct 28, 1999 NAV Per Unit. *
(`)
Birla Sun Life
Government Securities
Fund - Long Term Plan
(%)
I-Sec LI-BEX # (%)
CRISIL 10Year Gilt
Index ## (%)
Value of Standard Investment of ` 10000 in
Birla Sun Life
Government Securities
Fund - Long Term Plan
(`)
I-Sec LI-BEX # (`)
CRISIL 10Year GiltIndex ##
(`)
Since inception till December 30, 2011 (CAGR) 10.0000 9.44 N/A N/A 30011 N/A N/A
December 30, 2010 to December 30, 2011 (Absolute) 28.0546 6.98 6.05 1.88 10698 10605 10188
December 30, 2009 to December 30, 2010 (Absolute) 25.6628 9.32 6.36 3.17 10932 10636 10317
December 30, 2008 to December 30, 2009 (Absolute) 21.7180 18.16 -7.35 -8.57 11816 9265 9143
Investment Performance - Long Term Plan - Growth NAV as on Dec 30, 2011: ` 30.0114
Date of Inception: Oct 28, 1999 NAV Per Unit. *
(`)
Birla Sun Life
Government Securities
Fund - Short Term Plan
(%)
I-Sec SI-BEX # (%)
CRISIL 1Year T - Bill
Index ## (%)
Value of Standard Investment of ` 10000 in
Birla Sun Life
Government Securities
Fund - Short Term Plan (`)
I-Sec SI-BEX
# (`)
CRISIL 1Year T - BillIndex ## (`)
Since inception till December 30, 2011 (CAGR) 10.0000 5.90 N/A N/A 20078 N/A N/A
December 30, 2010 to December 30, 2011 (Absolute) 18.8685 6.41 7.66 6.44 10641 10766 10644
December 30, 2009 to December 30, 2010 (Absolute) 17.9442 5.15 4.82 2.81 10515 10482 10281
December 30, 2008 to December 30, 2009 (Absolute) 17.5020 2.53 5.33 3.38 10253 10533 10338
# Scheme Benchmark, ## Additional Benchmark, * As on start of period considered above.Past performance may or may not be sustained in future. Returns for dividend option would assume reinvestment of dividends declared, net of dividend distribution tax, if any, at the then prevailing NAV. Load and Taxes are not considered for computation of returns. When scheme/additional benchmark returns are not available, they have not been shown.Total Schemes managed by Mr. Maneesh Dangi is 4. Refer annexure on page no. 52 to know more on performance of schemes managed by Fund Manager.
Investment Performance - Short Term Plan - Retail Growth NAV as on Dec 30, 2011: ` 20.0783
16
Long Term Plan Short Term Plan
100.00%
Cash & Current Assets
90.79%
9.21%
Sovereign Cash & Current Assets
Rating Profile of Portfolio

17
Birla Sun Life Enhanced Arbitrage Fund
What is it?A fund that aims to generate income by investing in equity and equity related instruments and take advantage of the price differentials or mis-pricing prevailing in a stock or index.
Fund Details
As on February 29, 2012
Fund Manager: Mr. Ajay GargManaging Fund Since: Dec 05, 2011Total Experience: 15 yearsDate of inception: July 24, 2009Nature of the scheme: An Open-ended Equity Scheme
NAV of Plans / Options (`) Retail PlanGrowth: 11.5198 Dividend: 11.2498 Institutional PlanGrowth: 0.0000 Dividend: 0.0000
Benchmark: CRISIL Liquid Fund Index
Load Structure (as % of NAV) (Incl. for SIP) Entry Load: NilExit Load**: For Redemption / Switch-out of units before 90 days from the date of allotment: 0.75%. For Redemption / Switch-out of units on or after 90 days but before 180 days from the date of allotment: 0.50%. For Redemption/ Switch-out of units on or after 180 days from the date of allotment: Nil. **Exit Load is NIL for units issued in Bonus & Dividend Reinvestment.
SAVINGS SOLUTIONS
Conservative Returns Low-Medium Risk 1 yr + High Liquidity
Investment Performance - Retail Plan - Growth NAV as on Dec 30, 2011: ` 11.4548
Date of Inception: July 24, 2009 NAV Per Unit. *
(`)
Birla Sun Life
Enhanced Arbitrage Fund (%)
CRISIL Liquid
Fund Index # (%)
BSE SENSEX ##
(%)
Value of Standard Investment of ` 10000 in
Birla Sun Life
Enhanced Arbitrage Fund (`)
CRISIL Liquid
Fund Index # (`)
BSE SENSEX
## (`)
Since inception till December 30, 2011 (CAGR) 10.0000 5.75 5.93 3.16 11455 11501 10701
December 30, 2010 to December 30, 2011 (Absolute) 10.7007 7.05 8.17 -24.20 10705 10817 7580
December 30, 2009 to December 30, 2010 (Absolute) 10.1468 5.46 5.11 17.56 10546 10511 11756
# Scheme Benchmark, ## Additional Benchmark, * As on start of period considered above.Past performance may or may not be sustained in future. Returns for dividend option would assume reinvestment of tax free dividends declared at the then prevailing NAV. Load and Taxes are not considered for computation of returns. Total Schemes managed by Mr. Ajay Garg is 9. Refer annexure on page no. 52 to know more on performance of schemes managed by Fund Manager.
Issuer % to net Assets Issuer % to net AssetsApollo Tyres Ltd. 13.54% Reliance Industries Ltd. 8.13%
Rolta India Ltd. 12.50% Pantaloon Retail (India) Ltd. 7.48%
Cipla Ltd. 9.42% Tata Motors Ltd. - DVR 6.07%
Bajaj Auto Ltd. 8.93% Tata Motors Dvr 'A' Ordinar Fut Mar 2012 -6.15%
ITC Ltd. 8.23% Pantaloon Retail (India) Ltd. Fut Mar 12 -7.58%
Top Ten Portfolio Holdings
18
Birla Sun Life Short Term Opportunities Fund
Fund Details
As on February 29, 2012
Fund Manager: Mr. Lokesh Mallya & Ms. Sunaina Da Cunha Managing Fund Since: July 15, 2011Total Experience: 5 years & 7 yearsDate of inception: May 09, 2003Nature of the scheme: An Open-ended Income Scheme
NAV of Plans / Options (`) Retail Plan Growth: 16.6033 Dividend: 10.8828 Weekly Dividend: 10.0016 Institutional PlanGrowth: 12.1600 Dividend: 10.9955 Weekly Dividend: 9.9000 Benchmark: CRISIL Liquid Fund Index
Load Structure (as % of NAV) (Incl .for SIP)Entry Load: NilExit Load**: For redemption / switch-out of units within 365 days from the date of allotment: 2.00% of applicable NAV. For redemption / switch-out of units after 365 days but before 730 days from the date of allotment: 1.00% of applicable NAV. For redemption / switch-out of units after 730 days from the date of allotment: Nil. ** Exit Load is NIL for units issued in Bonus & Dividend Reinvestment.
Other ParameterStandard Deviation: 0.60%
Note:Standard Deviation Is calculated on Annualised basis using 3 year history of monthly returns, source: MFIExplorer.
Investment Performance - Growth NAV as on Dec 30, 2011: ` 16.3699
Date of Inception: May 09, 2003 NAV Per Unit. *
(`)
Birla Sun LifeShort Term
OpportunitiesFund (%)
CRISILLiquid
Fund Index # (%)
CRISIL 1Year T - Bill
Index ## (%)
Value of Standard Investment of ` 10000 in
Birla Sun LifeShort Term
OpportunitiesFund (`)
CRISILLiquidFund Index # (`)
CRISIL 1Year T - Bill
Index## (`)
Since inception till December 30, 2011 (CAGR) 10.0000 5.89 5.94 4.95 16370 16473 15191
December 30, 2010 to December 30, 2011 (Absolute) 14.9520 9.48 8.17 6.44 10948 10817 10644
December 30, 2009 to December 30, 2010 (Absolute) 14.1054 6.00 5.11 2.81 10600 10511 10281
December 30, 2008 to December 30, 2009 (Absolute) 13.0488 8.10 4.89 3.38 10810 10489 10338
# Scheme Benchmark, ## Additional Benchmark, * As on start of period considered above.Past performance may or may not be sustained in future. Returns for dividend option would assume reinvestment of dividends declared, net of dividend distribution tax, if any, at the then prevailing NAV. Load and Taxes are not considered for computation of returns. When additional benchmark returns are not available, they have not been shown.Total Schemes Co-Managed by Fund Managers is 1. Total Schemes managed by Mr. Lokesh Mallya is 2. Total Schemes managed by Ms.Sunaina Da Cunha is 5. Refer annexure on page no. 52 to know more on performance of schemes managed by Fund Managers.
SAVINGS SOLUTIONS
Conservative Returns Low-Medium Risk 1 yr + High Liquidity
What is it?It is a fund that focuses on enhancing the portfolio returns by identifying mispriced credit opportunities in the market and selectively investing in them.
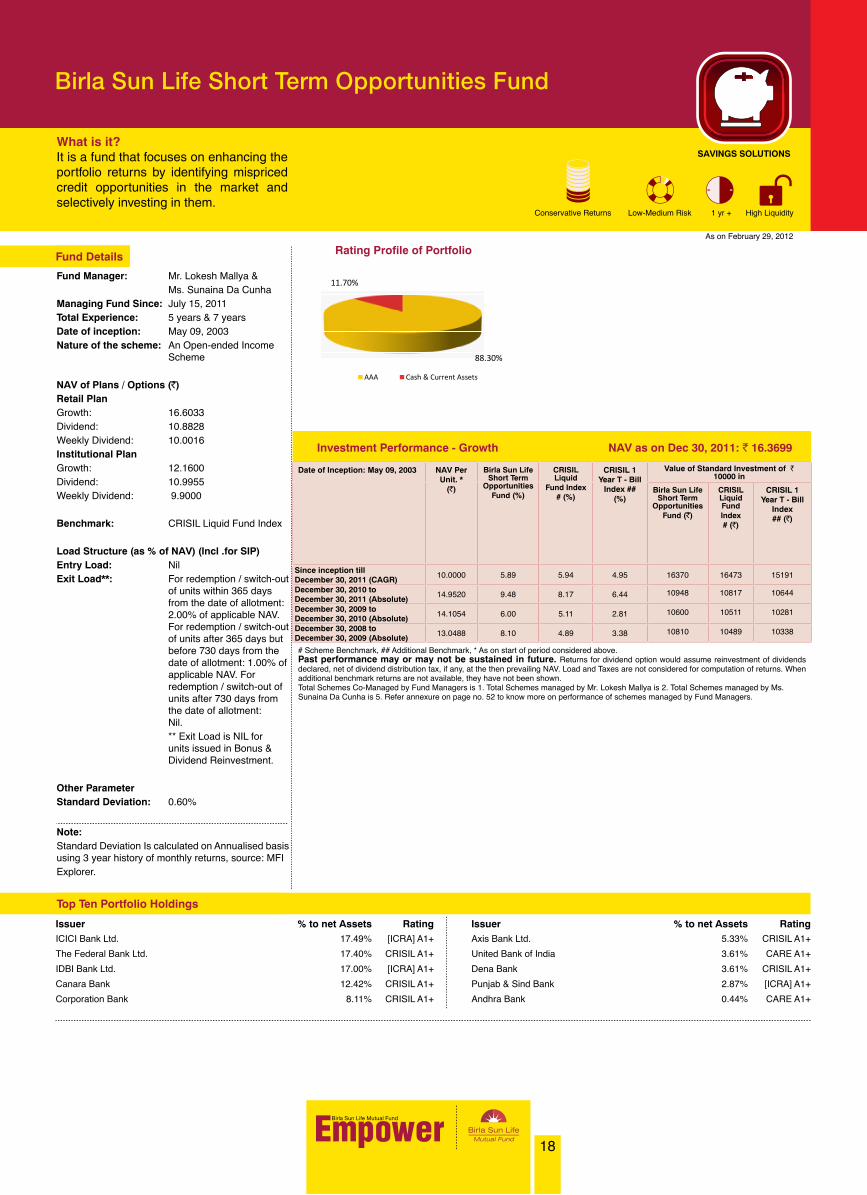
88.30%
11.70%
AAA Cash & Current Assets
Rating Profile of Portfolio
Issuer % to net Assets Rating Issuer % to net Assets RatingICICI Bank Ltd. 17.49% [ICRA] A1+ Axis Bank Ltd. 5.33% CRISIL A1+
The Federal Bank Ltd. 17.40% CRISIL A1+ United Bank of India 3.61% CARE A1+
IDBI Bank Ltd. 17.00% [ICRA] A1+ Dena Bank 3.61% CRISIL A1+
Canara Bank 12.42% CRISIL A1+ Punjab & Sind Bank 2.87% [ICRA] A1+
Corporation Bank 8.11% CRISIL A1+ Andhra Bank 0.44% CARE A1+
Top Ten Portfolio Holdings

19
Regular Income Solutions
What are Regular IncomeSolutions?
Our Regular Income Solutions aim to preserve your money and provide regular income.
Who can benefit from Regular Income Solutions?
This is an ideal solutions for investors who are interested in alternative modes of regular income, either in present of after retirement stage, and have low propensity for risk.(Regular income is not assured & is subject to availability of distributable surplus.)
Benefits of Regular Income Solutions:
They aim to preserve your money & provide regular income: These schemes generally invest in instruments like bonds of reputed Indian companies and securities (bonds) issued by the Government of India which are considered relatively safe in order to generate regular income for you.
They aim to fight Inflation: A small part is invested in equity i.e. stocks of Indian companies to help you stay ahead of inflation.
Tax-efficient Returns: You may opt for a monthly dividend option where, in addition to the growth of your invested amount, a portion of the same comes to you as monthly income which is given in the form of dividends. These dividends are completely tax-free in your hands!
A dividend distribution tax of 13.519% is applicable and is deducted by the fund house.
Investors are advised to consult their tax advisor in view of individual nature of tax benefits.Wherever mentioned, Regular Income / Second Income / Monthly Dividend is not assured and is subject to availability of distributable surplus. The Financial Solution (Regular Income Solution) statedabove is ONLY for highlighting the many advantages perceived from investments in Mutual Funds but does not in any manner, indicate or imply, either the quality of any particular Scheme or guarantee any specific performance/returns.
20
Birla Sun Life Monthly Income (An open-ended income scheme. Monthly income is not assured and is subject to availability of distributable surplus.)
What is it?A fund that seeks to provide you regular income with an opportunity to grow your money through fixed income investments and a limited exposure to the equity markets.
Fund Details
As on February 29, 2012
Fund Manager: Mr. Satyabrata Mohanty & Mr. Nishit DholakiaManaging Fund Since: June 18, 2009Total Experience: 12 years & 11 yearsDate of inception: July 14, 1999Nature of the scheme: An Open-ended Income Scheme
NAV of Plans / Options (`) Growth: 38.8776 Monthly Dividend: 11.3863 Quarterly Dividend: 11.9545
Benchmark: CRISIL MIP Blended Index
Load Structure (as % of NAV) (Incl .for SIP)Entry Load: NilExit Load**: 1.00% if redeemed / switched out within 365 days from the date of allotment. **Exit Load is NIL for units issued in Bonus & Dividend Reinvestment.
Other ParameterModified Duration: 3.13 yearsYield to Maturity: 9.57%(for Debt Component)Mark to Market: 87%Standard Deviation: 4.07%Sharpe Ratio##: 0.53 Beta: 0.83
REGULAR INCOME SOLUTIONS
Moderate Returns Medium Risk 1 yr + High Liquidity
Investment Performance - Growth
Date of Inception: July 14, 1999 NAV Per Unit. *
(`)
Birla Sun Life Monthly Income (%)
CRISIL MIP Blended
Index # (%)
CRISIL 10Year GiltIndex ##
(%)
Value of Standard Investment of ` 10000 in
Birla Sun Life Monthly
Income (`)
CRISIL MIP Blended
Index # (`)
CRISIL 10Year Gilt
Index## (`)
Since inception till December 30, 2011 (CAGR) 10.0000 11.26 N/A N/A 37531 N/A N/A
December 30, 2010 to December 30, 2011 (Absolute) 36.2801 3.45 1.82 1.88 10345 10182 10188
December 30, 2009 to December 30, 2010 (Absolute) 33.6896 7.69 7.01 3.17 10769 10701 10317
December 30, 2008 to December 30, 2009 (Absolute) 28.6539 17.57 13.10 -8.57 11757 11310 9143
# Scheme Benchmark, ## Additional Benchmark, * As on start of period considered above.Past performance may or may not be sustained in future. Returns for dividend option would assume reinvestment of dividends declared, net of dividend distribution tax, if any, at the then prevailing NAV. Load and Taxes are not considered for computation of returns. When scheme/additional benchmark returns are not available, they have not been shown.Performance of scheme may or may not be strictly comparable with that of its additional benchmark in view of hybrid nature of scheme.Total Schemes Co-Managed by Fund Managers is 5. Total Schemes managed by Mr. Satyabrata Mohanty is 17. Total Schemes managed by Mr. Nishit Dholakia is 7. Refer annexure on page no. 52 to know more on performance of schemes managed by Fund Managers.
NAV as on Dec 30, 2011: ` 37.5305
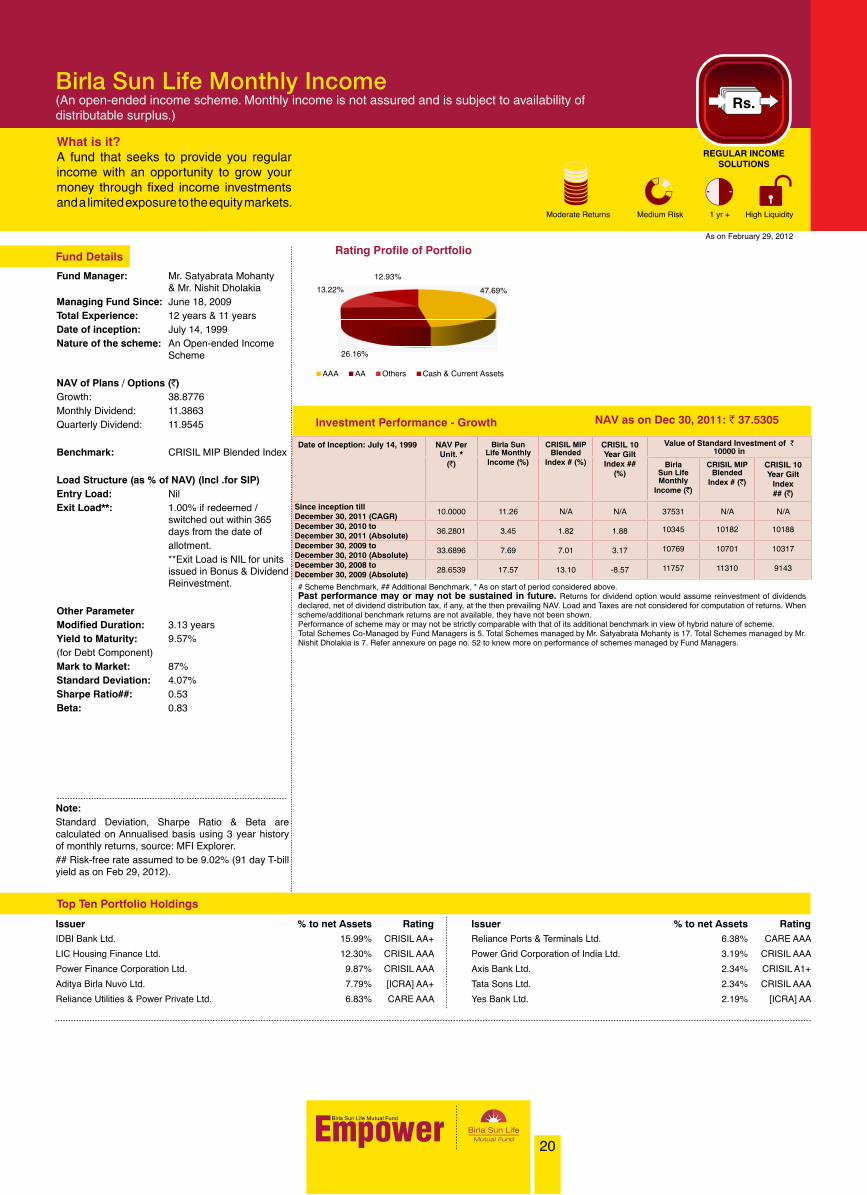
47.69%
26.16%
13.22%
12.93%
AAA AA Others Cash & Current Assets
Rating Profile of Portfolio
Issuer % to net Assets Rating Issuer % to net Assets RatingIDBI Bank Ltd. 15.99% CRISIL AA+ Reliance Ports & Terminals Ltd. 6.38% CARE AAA
LIC Housing Finance Ltd. 12.30% CRISIL AAA Power Grid Corporation of India Ltd. 3.19% CRISIL AAA
Power Finance Corporation Ltd. 9.87% CRISIL AAA Axis Bank Ltd. 2.34% CRISIL A1+
Aditya Birla Nuvo Ltd. 7.79% [ICRA] AA+ Tata Sons Ltd. 2.34% CRISIL AAA
Reliance Utilities & Power Private Ltd. 6.83% CARE AAA Yes Bank Ltd. 2.19% [ICRA] AA
Top Ten Portfolio Holdings
Note:Standard Deviation, Sharpe Ratio & Beta are calculated on Annualised basis using 3 year history of monthly returns, source: MFI Explorer.## Risk-free rate assumed to be 9.02% (91 day T-bill yield as on Feb 29, 2012).

21
Birla Sun Life MIP (An open-ended income scheme. Monthly income is not assured and is subject to availability of distributable surplus.)
What is it?A fund that seeks to provide you regular income with an opportunity to grow your money through fixed income investments and a limited exposure to the equity markets.
Fund Details
As on February 29, 2012
Fund Manager: Mr. Satyabrata Mohanty & Mr. Nishit DholakiaManaging Fund Since: June 18, 2009Total Experience: 12 years & 11 yearsDate of inception: November 20, 2000Nature of the scheme: An Open-ended Income Scheme
NAV of Plans / Options (`) Monthly Growth/ Payment: 28.0179 Monthly Dividend: 11.3166 Benchmark: CRISIL MIP Blended Index
Load Structure (as % of NAV) (Incl. for SIP)Entry Load: NilExit Load**: 1.00% if redeemed / switched out within 365 days from the date of allotment. **Exit Load is NIL for units issued in Bonus & Dividend Reinvestment.
Other Parameter Modified Duration: 3.14 yearsYield to Maturity: 9.57%(for Debt Component)Mark to Market: 87%Standard Deviation: 4.12%Sharpe Ratio##: 0.18 Beta: 0.83
REGULAR INCOME SOLUTIONS
Moderate Returns Medium Risk 1 yr + High Liquidity
Investment Performance - Growth
Date of Inception: Nov 20, 2000 NAV Per Unit. *
(`)
Birla Sun Life MIP (%)
CRISIL MIP Blended
Index # (%)
CRISIL 10Year GiltIndex ##
(%)
Value of Standard Investment of ` 10000 in
Birla Sun Life MIP
(`)
CRISIL MIP Blended
Index # (`)
CRISIL 10Year Gilt
Index ## (`)
Since inception till December 30, 2011 (CAGR) 10.0000 9.36 N/A N/A 27033 N/A N/A
December 30, 2010 to December 30, 2011 (Absolute) 26.3105 2.74 1.82 1.88 10274 10182 10188
December 30, 2009 to December 30, 2010 (Absolute) 24.5492 7.17 7.01 3.17 10717 10701 10317
December 30, 2008 to December 30, 2009 (Absolute) 21.2914 15.30 13.10 -8.57 11530 11310 9143
# Scheme Benchmark, ## Additional Benchmark, * As on start of period considered above.Past performance may or may not be sustained in future. Returns for dividend option would assume reinvestment of dividends declared, net of dividend distribution tax, if any, at the then prevailing NAV. Load and Taxes are not considered for computation of returns. When scheme/additional benchmark returns are not available, they have not been shown.Performance of scheme may or may not be strictly comparable with that of its additional benchmark in view of hybrid nature of scheme.Total Schemes Co-Managed by Fund Managers is 5. Total Schemes managed by Mr. Satyabrata Mohanty is 17. Total Schemes managed by Mr. Nishit Dholakia is 7. Refer annexure on page no. 52 to know more on performance of schemes managed by Fund Managers.
NAV as on Dec 30, 2011: ` 27.0326
55.66%22.35%
17.30%2.76% 1.93%
AAA OthersAA Cash & Current AssetsSovereign
Rating Profile of Portfolio
Issuer % to net Assets Rating Issuer % to net Assets RatingReliance Ports & Terminals Ltd. 13.72% CARE AAA Reliance Utilities & Power Private Ltd. 6.78% CARE AAA
IDBI Bank Ltd. 12.52% CRISIL AA+ Housing Development Finance Corporation Ltd. 3.87% CRISIL AAA
Power Finance Corporation Ltd. 10.62% CRISIL AAA IDBI Bank Ltd. 2.74% CRISIL AA+
Power Grid Corporation of India Ltd. 10.31% CRISIL AAA Aditya Birla Nuvo Ltd. 2.04% [ICRA] AA+
LIC Housing Finance Ltd. 8.87% CRISIL AAA 06.90% CGL 2019 1.93% Sovereign
Top Ten Portfolio Holdings
Note:Standard Deviation, Sharpe Ratio & Beta are calculated on Annualised basis using 3 year history of monthly returns, source: MFI Explorer.## Risk-free rate assumed to be 9.02% (91 day T-bill yield as on Feb 29, 2012).

Issuer % to net Assets Rating Issuer % to net Assets RatingLIC Housing Finance Ltd. 15.52% CRISIL AAA IDBI Bank Ltd. 4.75% CRISIL AA+
Power Finance Corporation Ltd. 8.69% CRISIL AAA Reliance Ports & Terminals Ltd. 4.21% CARE AAA
Power Finance Corporation Ltd. 8.66% [ICRA] AAA Tata Capital Ltd. 2.43% CARE AA+
IDBI Bank Ltd. 6.36% CRISIL AA+ Yes Bank Ltd. 1.60% [ICRA] AA
Housing Development Finance Corporation Ltd. 6.34% CRISIL AAA The South Indian Bank Ltd. 1.10%
Top Ten Portfolio Holdings
22
Birla Sun Life MIP II - Wealth 25 Plan (An open-ended income scheme. Monthly income is not assured and is subject to availability of distributable surplus.)
What is it?A fund that seeks to provide you regular income with an opportunity to grow your money through fixed income investments and a limited exposure to the equity markets.
Fund Details
As on February 29, 2012
Fund Manager: Mr. Satyabrata Mohanty & Mr. Nishit DholakiaManaging Fund Since: June 18, 2009Total Experience: 12 years & 11 yearsDate of inception: May 22, 2004Nature of the scheme: An Open-ended Income Scheme
NAV of Plans / Options (`) Monthly Growth / Payment: 18.8029 Monthly Dividend: 11.2391 Benchmark: CRISIL MIP Blended Index
Load Structure (as % of NAV) (Incl. for SIP) Entry Load: NilExit Load**: 1% if redeemed/switched out within 365 days from the date of allotment. **Exit Load is NIL for units issued in Bonus & Dividend Reinvestment.
Other Parameter Modified Duration: 3.00 yearsYield to Maturity: 9.48%Mark to Market: 84%Standard Deviation: 6.47%Sharpe Ratio##: 0.52 Beta: 1.33
REGULAR INCOME SOLUTIONS
Moderate Returns Medium Risk 1 yr + High Liquidity
Investment Performance - Growth NAV as on Dec 30, 2011: ` 17.8415
Date of Inception: May 22, 2004 NAV Per Unit. *
(`)
Birla Sun Life MIP II - Wealth 25 Plan (%)
CRISIL MIP Blended
Index # (%)
CRISIL 10Year GiltIndex ##
(%)
Value of Standard Investment of ` 10000 in
Birla Sun Life MIP II - Wealth 25 Plan (`)
CRISIL MIP Blended
Index # (`)
CRISIL 10Year Gilt
Index ## (`)
Since inception till December 30, 2011 (CAGR) 10.0000 7.90 7.00 3.78 17842 16733 13261
December 30, 2010 to December 30, 2011 (Absolute) 17.9253 -0.47 1.82 1.88 9953 10182 10188
December 30, 2009 to December 30, 2010 (Absolute) 16.6843 7.44 7.01 3.17 10744 10701 10317
December 30, 2008 to December 30, 2009 (Absolute) 13.8098 20.81 13.10 -8.57 12081 11310 9143
# Scheme Benchmark, ## Additional Benchmark, * As on start of period considered above.Past performance may or may not be sustained in future. Returns for dividend option would assume reinvestment of dividends declared, net of dividend distribution tax, if any, at the then prevailing NAV. Load and Taxes are not considered for computation of returns. Performance of scheme may or may not be strictly comparable with that of its additional benchmark in view of hybrid nature of scheme.Total Schemes Co-Managed by Fund Managers is 5. Total Schemes managed by Mr. Satyabrata Mohanty is 17. Total Schemes managed by Mr. Nishit Dholakia is 7. Refer annexure on page no. 52 to know more on performance of schemes managed by Fund Managers.
44.47%
24.22%
15.32%
15.23% 0.76%
AAA OtherAA Cash & Current AssetsSovereign
Rating Profile of Portfolio
Note:Standard Deviation, Sharpe Ratio & Beta are calculated on Annualised basis using 3 year history of monthly returns, source: MFI Explorer.## Risk-free rate assumed to be 9.02% (91 day T-bill yield as on Feb 29, 2012).
23
Birla Sun Life MIP II - Savings 5 Plan (An open-ended income scheme. Monthly income is not assured and is subject to availability of distributable surplus.)
What is it?A fund that seeks to provide you regular income with an opportunity to grow your money through fixed income investments and a limited exposure to the equity markets.
Fund Details
As on February 29, 2012
Fund Manager: Mr. Satyabrata Mohanty & Mr. Nishit DholakiaManaging Fund Since: June 18, 2009Total Experience: 12 years & 11 yearsDate of inception: May 22, 2004Nature of the scheme: An Open-ended Income Scheme
NAV of Plans / Options (`) Monthly Growth / Payment: 19.0439 Monthly Dividend: 11.5081 Benchmark: CRISIL MIP Blended Index
Load Structure (as % of NAV) (Incl. for SIP) Entry Load: NilExit Load** : 1% if redeemed/switched out within 365 days from the date of allotment. **Exit Load is NIL for units issued in Bonus & Dividend Reinvestment.
Other Parameter Modified Duration: 3.06 yearsYield to Maturity: 9.92%(for Debt Component)Mark to Market: 89%Standard Deviation: 2.39%Sharpe Ratio##: -0.15Beta: 0.45
Note:Standard Deviation, Sharpe Ratio & Beta are calculated on Annualised basis using 3 year history of monthly returns, source: MFI Explorer.## Risk-free rate assumed to be 9.02% (91 day T-bill yield as on Feb 29, 2012).
Issuer % to net Assets Rating Issuer % to net Assets RatingLIC Housing Finance Ltd. 15.96% CRISIL AAA Tata Sons Ltd. 4.30% CRISIL AAA
Power Finance Corporation Ltd. 15.10% CRISIL AAA Indian Railway Finance Corporation Ltd. 3.06% CRISIL AAA
IDBI Bank Ltd. 14.60% CRISIL AA+ LIC Housing Finance Ltd. 2.89% CARE AAA
Reliance Utilities & Power Private Ltd. 11.57% CARE AAA Axis Bank Ltd. 2.67% CRISIL A1+
Reliance Capital Ltd. 7.22% CARE AAA Sundaram Finance Ltd. 1.69% [ICRA] AA+
Top Ten Portfolio Holdings
REGULAR INCOME SOLUTIONS
Moderate Returns Medium Risk 1 yr + High Liquidity
Investment Performance - Growth NAV as on Dec 30, 2011: ` 18.5562
Date of Inception: May 22, 2004 NAV Per Unit. *
(`)
Birla Sun Life MIP
II - Savings 5 Plan (%)
CRISIL MIP Blended
Index # (%)
CRISIL 10Year GiltIndex ##
(%)
Value of Standard Investment of ` 10000 in
Birla Sun Life MIP II
- Savings 5 Plan (`)
CRISIL MIP Blended Index #
(`)
CRISIL 10Year Gilt
Index ## (`)
Since inception till December 30, 2011 (CAGR) 10.0000 8.46 7.00 3.78 18556 16733 13261
December 30, 2010 to December 30, 2011 (Absolute) 17.3105 7.20 1.82 1.88 10720 10182 10188
December 30, 2009 to December 30, 2010 (Absolute) 16.3399 5.94 7.01 3.17 10594 10701 10317
December 30, 2008 to December 30, 2009 (Absolute) 16.0665 1.70 13.10 -8.57 10170 11310 9143
# Scheme Benchmark, ## Additional Benchmark, * As on start of period considered above.Past performance may or may not be sustained in future. Returns for dividend option would assume reinvestment of dividends declared, net of dividend distribution tax, if any, at the then prevailing NAV. Load and Taxes are not considered for computation of returns.Performance of scheme may or may not be strictly comparable with that of its additional benchmark in view of hybrid nature of scheme. Total Schemes Co-Managed by Fund Managers is 5. Total Schemes managed by Mr. Satyabrata Mohanty is 17. Total Schemes managed by Mr. Nishit Dholakia is 7. Refer annexure on page no. 52 to know more on performance of schemes managed by Fund Managers.
64.56%
16.29%
10.24%8.91%
AAA AA Cash & Current Assets Others
Rating Profile of Portfolio

24
Wealth Creation Solutions
What are Wealth CreationSolutions?
Our Wealth Creation Solutions aim to grow your money through equity/gold investments and are available in a range of conservative to aggressive options.
Who can benefit from Wealth Creation Solutions?
Equity may be considered as an ideal option to give attractive long term returns and hence may be used for funding long-term needs (like child’s education, buying a home etc.)
Benefits of Wealth Creation Solutions:
Tax Free Returns: No capital gains tax (on withdrawal) if you stay invested for over a year as per current tax laws.
Invest in the long-term to overcome short-term ups and downs.
Risk is lowered: Mutual funds invest in many companies and funds are managed by experts; which can be considered as an alternative to direct investment in shares.
Investors are requested to consult their tax advisor before investing for individual nature of tax benefit. The Financial Solution (Wealth Creation Solution) stated above is ONLY for highlighting the many advantages perceived from investments in Mutual Funds but does not in any manner, indicate or imply, either the quality of any particular Scheme or guarantee any specific performance/returns.

25
Birla Sun Life Equity Fund
What is it?A Diversified Equity Fund that looks for opportunities without any sectoral or market cap bias with the aim to give you long term growth of capital.
Fund Details
As on February 29, 2012
Fund Manager: Mr. Mahesh PatilManaging Fund Since: November 17, 2005Total Experience: 20 yearsDate of inception: August 27, 1998Nature of the scheme: An Open-ended Growth Scheme
NAV of Plans / Options (`) Growth: 237.35 Dividend: 59.79
Benchmark: BSE 200
Load Structure (as % of NAV) (Incl. for SIP) Entry Load: Nil Exit Load**: 1% if redeemed switched out within 365 days from the date of allotment. **Exit Load is NIL for units issued in Bonus & Dividend Reinvestment.Other ParameterStandard Deviation: 28.23%Sharpe Ratio##: 0.62 Beta: 0.96
WEALTH CREATIONSOLUTIONS
High Returns High Risk 3 yrs+ High Liquidity
Investment Performance - Growth NAV as on Dec 30, 2011: ` 203.23
Date of Inception: Aug 27,1998 NAV Per Unit. *
(`)
Birla Sun Life Equity Fund (%)
BSE 200 # (%)
BSE SENSEX ##
(%)
Value of Standard Investment of ` 10000 in
Birla Sun Life Equity
Fund (`)
BSE 200 # (`)
BSE SENSEX
## (`)
Since inception till December 30, 2011 (CAGR)
10.00 25.42 14.07 13.14 203226 57980 51977
December 30, 2010 to December 30, 2011 (Absolute)
284.83 -28.65 -26.40 -24.20 7135 7360 7580
December 30, 2009 to December 30, 2010 (Absolute)
250.44 13.73 15.95 17.56 11373 11595 11756
December 30, 2008 to December 30, 2009 (Absolute)
133.37 87.78 86.70 78.50 18778 18670 17850
# Scheme Benchmark, ## Additional Benchmark, * As on start of period considered above.Past performance may or may not be sustained in future. Returns for dividend option would assume reinvestment of tax free dividends declared at the then prevailing NAV. Load and Taxes are not considered for computation of returns. Total Schemes managed by Mahesh Patil is 5. Refer annexure on page no. 52 to know more on performance of schemes managed by Fund Manager.
Issuer % to net Assets Issuer % to net AssetsReliance Industries Ltd. 5.96% State Bank of India 3.47%
Infosys Ltd. 5.24% Tata Consultancy Services Ltd. 3.18%
ICICI Bank Ltd. 4.72% Tata Motors Ltd. - DVR 2.83%
Housing Development Finance Corporation Ltd. 4.37% Bharti Airtel Ltd. 2.57%
ITC Ltd. 3.52% Dr. Reddys Laboratories Ltd. 2.44%
Top Ten Portfolio Holdings
Note:Standard Deviation & Sharpe Ratio are calculated on Annualised basis using 3 year history of monthly returns, source: MFI Explorer.## Risk-free rate assumed to be 9.02% (91 day T-bill yield as on Feb 29, 2012).

26
Birla Sun Life Advantage Fund
What is it?A Diversified Equity Fund that aims to achieve long-term growth of capital, at relatively moderate levels of risk through a research-based investment approach.
Fund Details
As on February 29, 2012
Fund Manager: Mr. Satyabrata MohantyManaging Fund Since: October 17, 2011Total Experience: 12 yearsDate of inception: February 24, 1995Nature of the scheme: An Open-ended Growth SchemeNAV of Plans / Options (`) Growth: 144.68 Dividend: 74.02 Benchmark: BSE Sensex
Load Structure (as % of NAV) (Incl. for SIP) Entry Load: Nil Exit Load**: 0.50% if redeemed / switched out within 7 days from the date of allotment. **Exit Load is NIL for units issued in Bonus & Dividend Reinvestment.
Other ParameterStandard Deviation: 29.27%Sharpe Ratio##: 0.61 Beta: 1.03
WEALTH CREATIONSOLUTIONS
High Returns High Risk 3 yrs+ High Liquidity
Date of Inception: Feb 24, 1995 NAV Per Unit. *
(`)
Birla Sun Life
Advantage Fund (%)
BSE SENSEX
# (%)
S&P CNX Nifty ##
(%)
Value of Standard Investment of ` 10000 in
Birla Sun Life
Advantage Fund (`)
BSE SENSEX
# (`)
S&P CNX Nifty ## (`)
Since inception till December 30, 2011 (CAGR) 10.00 17.94 9.29 9.37 124865 44733 45254
December 30, 2010 to December 30, 2011 (Absolute)
171.98 -27.40 -24.20 -24.21 7260 7580 7579
December 30, 2009 to December 30, 2010 (Absolute)
151.07 13.84 17.56 18.04 11384 11756 11804
December 30, 2008 to December 30, 2009 (Absolute)
81.33 85.75 78.50 73.50 18575 17850 17350
# Scheme Benchmark, ## Additional Benchmark, * As on start of period considered above.Past performance may or may not be sustained in future. Returns for dividend option would assume reinvestment of tax free dividends declared at the then prevailing NAV. Load and Taxes are not considered for computation of returns. Total Schemes managed by Satyabrata Mohanty is 17. Refer annexure on page no. 52 to know more on performance of schemes managed by Fund Manager.
Issuer % to net Assets Issuer % to net AssetsState Bank of India 5.19% HDFC Bank Ltd. 4.00%
Infosys Ltd. 4.49% Reliance Industries Ltd. 3.90%
Tata Motors Ltd. 4.14% Larsen & Toubro Ltd. 3.21%
HCL Technologies Ltd. 4.13% Tata Consultancy Services Ltd. 3.05%
ICICI Bank Ltd. 4.01% Axis Bank Ltd. 2.92%
Top Ten Portfolio Holdings
Note:Standard Deviation & Sharpe Ratio are calculated on Annualised basis using 3 year history of monthly returns, source: MFI Explorer.## Risk-free rate assumed to be 9.02% (91 day T-bill yield as on Feb 29, 2012).
Investment Performance - Growth NAV as on Dec 30, 2011: ` 124.86

27
Birla Sun Life Midcap Fund
What is it?A fund that provides an opportunity to invest in midsized companies which can be potential leaders of tomorrow.
Fund Details
As on February 29, 2012
Fund Manager: Mr. Sanjay ChawlaManaging Fund Since: September 12, 2007Total Experience: 22 yearsDate of inception: October 03, 2002Nature of the scheme: An Open-ended Growth Scheme
NAV of Plans / Options (`)Growth: 101.73 Dividend: 20.63
Benchmark: CNX Midcap
Load Structure (as % of NAV) (Incl. for SIP)Entry Load: NilExit Load**: 1% if redeemed / switched out within 365 days from the date of allotment. **Exit Load is NIL for units issued in Bonus & Dividend Reinvestment.
Other ParameterStandard Deviation: 32.46%Sharpe Ratio##: 0.81 Beta: 1.00
WEALTH CREATIONSOLUTIONS
High Returns High Risk 3 yrs+ High Liquidity
Date of Inception: Oct 03, 2002 NAV Per Unit. *
(`)
Birla Sun Life Midcap
Fund (%)
CNX Midcap #
(%)
BSE SENSEX ##
(%)
Value of Standard Investment of ` 10000 in
Birla Sun Life Midcap Fund (`)
CNX Midcap
# (`)
BSE SENSEX
## (`)
Since inception till December 30, 2011 (CAGR)
10.00 26.53 N/A 19.67 87355 N/A 52602
December 30, 2010 to December 30, 2011 (Absolute)
117.66 -25.75 -30.17 -24.20 7425 6983 7580
December 30, 2009 to December 30, 2010 (Absolute)
104.24 12.87 17.97 17.56 11287 11797 11756
December 30, 2008 to December 30, 2009 (Absolute)
47.67 118.67 100.22 78.50 21867 20022 17850
# Scheme Benchmark, ## Additional Benchmark, * As on start of period considered above.Past performance may or may not be sustained in future. Returns for dividend option would assume reinvestment of tax free dividends declared at the then prevailing NAV. Load and Taxes are not considered for computation of returns. When scheme benchmark returns are not available, they have not been shown.Total Schemes managed by Mr. Sanjay Chawla is 4. Refer annexure on page no. 52 to know more on performance of schemes managed by Fund Manager.
Issuer % to net Assets Issuer % to net AssetsGlaxosmithkline Consumer Healthcare Ltd. 3.71% Torrent Pharmaceuticals Ltd. 2.88%
Divis Laboratories Ltd. 3.31% Castrol India Ltd. 2.71%
Bata India Ltd. 3.17% United Phosphorus Ltd. 2.70%
Cadila Healthcare Ltd. 2.96% Motherson Sumi Systems Ltd. 2.68%
Solar Industries India Ltd. 2.95% Godrej Consumer Products Ltd. 2.64%
Top Ten Portfolio Holdings
Note:Standard Deviation, Sharpe Ratio & Beta are calculated on Annualised basis using 3 years history of monthly returns,source: MFI Explorer ## Risk-free rate assumed to be 9.02% (91 day T-bill yield as on Feb 29, 2012).
Investment Performance - Growth NAV as on Dec 30, 2011: ` 87.36

28
Birla Sun Life Frontline Equity Fund
What is it?A diversified equity fund that invests across sectors in line with BSE200 Index, with a bias for large caps but not exclusively focused on them.
Fund Details
As on February 29, 2012
Fund Manager: Mr. Mahesh PatilManaging Fund Since: November 17, 2005Total Experience: 20 yearsDate of inception: August 30, 2002Nature of the scheme: An Open-ended Growth Scheme
NAV of Plans / Options (`) Growth: 83.80 Dividend: 20.14
Benchmark: BSE 200
Load Structure (as % of NAV) (Incl. for SIP)Entry Load: NilExit Load**: 1% if redeemed / switched out within 365 days from the date of allotment. **Exit Load is NIL for units issued in Bonus & Dividend Reinvestment.
Other ParameterStandard Deviation: 25.84%Sharpe Ratio##: 0.78 Beta: 0.89
WEALTH CREATIONSOLUTIONS
High Returns High Risk 3 yrs+ High Liquidity
Date of Inception: Aug 30, 2002
NAV Per Unit. *
(`)
Birla Sun Life Frontline Equity Fund
(%)
BSE 200 # (%)
BSE SENSEX ##
(%)
Value of Standard Investment of ` 10000 in
Birla Sun Life Frontline
Equity Fund (`)
BSE 200 # (`)
BSE SENSEX
## (`)
Since inception till December 30, 2011 (CAGR)
10.00 23.90 19.40 18.44 72994 52368 48582
December 30, 2010 to December 30, 2011 (Absolute)
94.21 -22.52 -26.40 -24.20 7748 7360 7580
December 30, 2009 to December 30, 2010 (Absolute)
79.27 18.85 15.95 17.56 11885 11595 11756
December 30, 2008 to December 30, 2009 (Absolute)
42.03 88.60 86.70 78.50 18860 18670 17850
# Scheme Benchmark, ## Additional Benchmark, * As on start of period considered above.Past performance may or may not be sustained in future. Returns for dividend option would assume reinvestment of tax free dividends declared at the then prevailing NAV. Load and Taxes are not considered for computation of returns. Total Schemes managed by Mr. Mahesh Patil is 5. Refer annexure on page no. 52 to know more on performance of schemes managed by Fund Manager.
Issuer % to net Assets Issuer % to net AssetsReliance Industries Ltd. 6.37% Tata Consultancy Services Ltd. 3.51%
Infosys Ltd. 5.20% State Bank of India 3.12%
ICICI Bank Ltd. 5.20% Larsen & Toubro Ltd. 2.99%
Housing Development Finance Corporation Ltd. 4.97% Dr. Reddy's Laboratories Ltd. 2.89%
ITC Ltd. 4.57% Bharti Airtel Ltd. 2.89%
Top Ten Portfolio Holdings
Note:Standard Deviation, Sharpe Ratio & Beta are calculated on Annualised basis using 3 years history of monthly returns, source: MFI Explorer## Risk-free rate assumed to be 9.02% (91 day T-bill yield as on Feb 29, 2012).
Investment Performance - Growth NAV as on Dec 30, 2011: ` 72.99

29
Birla Sun Life Infrastructure Fund
What is it?A fund that seeks to participate in growth and development of infrastructure in India by investing in equity and equity related securities of companies in the infra sector.
Fund Details
As on February 29, 2012
Fund Manager: Mr. Mahesh Patil & Mr. Naysar ShahManaging Fund Since: Since inception & Dec 05, 2011Total Experience: 20 years & 12 yearsDate of inception: March 17, 2006Nature of the scheme: An Open-ended Growth Scheme
NAV of Plans / Options (`) Growth: 14.57 Dividend: 10.04 Benchmark: S&P CNX Nifty
Load Structure (as % of NAV) (Incl. for SIP)Entry Load: NilExit Load**: 1% if redeemed / switched out within 365 days from the date of allotment. **Exit Load is NIL for units issued in Bonus & Dividend Reinvestment.
Other ParameterStandard Deviation: 32.80%Sharpe Ratio##: 0.49 Beta: 1.13
WEALTH CREATIONSOLUTIONS
High Returns High Risk 3 yrs+ High Liquidity
Date of Inception: Mar 17, 2006 NAV Per Unit. *
(`)
Birla Sun Life Infrastructure
Fund (%)
S&P CNX
Nifty # (%)
BSE SENSEX ##
(%)
Value of Standard Investment of ` 10000 in
Birla Sun Life Infrastructure
Fund (`)
S&P CNX Nifty # (`)
BSE SENSEX
## (`)
Since inception till December 30, 2011 (CAGR)
10.00 2.99 6.37 6.28 11860 14299 14231
December 30, 2010 to December 30, 2011 (Absolute)
18.02 -34.18 -24.21 -24.20 6582 7579 7580
December 30, 2009 to December 30, 2010 (Absolute)
16.51 9.15 18.04 17.56 10915 11804 11756
December 30, 2008 to December 30, 2009 (Absolute)
8.41 96.31 73.50 78.50 19631 17350 17850
# Scheme Benchmark, ## Additional Benchmark, * As on start of period considered above.Past performance may or may not be sustained in future. Returns for dividend option would assume reinvestment of tax free dividends declared at the then prevailing NAV. Load and Taxes are not considered for computation of returns. Total Schemes Co-Managed by Fund Managers is 1. Total Schemes managed by Mr. Mahesh Patil is 5. Total Schemes managed by Mr. Naysar Shah is 2. Refer annexure on page no. 52 to know more on performance of schemes managed by Fund Managers.
Issuer % to net Assets Issuer % to net AssetsICICI Bank Ltd. 6.38% HDFC Bank Ltd. 2.96%
Larsen & Toubro Ltd. 4.14% Sadbhav Engineering Ltd. 2.88%
Cummins India Ltd. 3.83% Gujarat Gas Company Ltd. 2.38%
Reliance Industries Ltd. 3.47% IndusInd Bank Ltd. 2.36%
The Federal Bank Ltd. 3.07% Bharti Airtel Ltd. 2.30%
Top Ten Portfolio Holdings
Note:Standard Deviation, Sharpe Ratio & Beta are calculated on Annualised basis using 3 years history of monthly returns, source: MFI Explorer## Risk-free rate assumed to be 9.02% (91 day T-bill yield as on Feb 29, 2012).
Investment Performance - Growth NAV as on Dec 30, 2011: ` 11.86

30
Birla Sun Life India GenNext Fund
What is it?A Fund that strives to benefit from the rising consumption pattern in India, fuelled by high disposable incomes of the young generation (Generation Next).
Fund Details
As on February 29, 2012
Fund Manager: Mr. Sanjay ChawlaManaging Fund Since: September 12, 2007Total Experience: 22 yearsDate of inception: August 05, 2005Nature of the scheme: An Open-ended Growth Scheme
NAV of Plans / Options (`) Growth: 24.35 Dividend: 13.74
Benchmark: S&P CNX Nifty
Load Structure (as % of NAV) (Incl. for SIP)Entry Load: NilExit Load**: 1% if redeemed / switched out within 365 days from the date of allotment. **Exit Load is NIL for units issued in Bonus & Dividend Reinvestment.
Other ParameterStandard Deviation: 20.89%Sharpe Ratio##: 0.95 Beta: 0.70
WEALTH CREATIONSOLUTIONS
High Returns High Risk 3 yrs+ High Liquidity
Date of Inception: Aug 05, 2005
NAV Per Unit. *
(`)
Birla Sun Life India GenNext Fund (%)
S&P CNX Nifty # (%)
BSE SENSEX ##
(%)
Value of Standard Investment of ` 10000 in
Birla Sun Life India GenNext Fund (`)
S&P CNX Nifty # (`)
BSE SENSEX
## (`)
Since inception till December 30, 2011 (CAGR)
10.00 12.96 11.06 11.37 21832 19585 19932
December 30, 2010 to December 30, 2011 (Absolute)
25.26 -13.58 -24.21 -24.20 8642 7579 7580
December 30, 2009 to December 30, 2010 (Absolute)
19.83 27.38 18.04 17.56 12738 11804 11756
December 30, 2008 to December 30, 2009 (Absolute)
12.58 57.63 73.50 78.50 15763 17350 17850
# Scheme Benchmark, ## Additional Benchmark, * As on start of period considered above.Past performance may or may not be sustained in future. Returns for dividend option would assume reinvestment of tax free dividends declared at the then prevailing NAV. Load and Taxes are not considered for computation of returns. Total Schemes managed by Mr. Sanjay Chawla is 4. Refer annexure on page no. 52 to know more on performance of schemes managed by Fund Manager.
Issuer % to net Assets Issuer % to net AssetsHDFC Bank Ltd. 4.55% Nestle India Ltd. 3.29%
Castrol India Ltd. 4.22% ICICI Bank Ltd. 3.24%
Axis Bank Ltd. 3.89% Hathway Cable & Datacom Ltd. 3.18%
Sun Pharmaceutical Industries Ltd. 3.63% Bata India Ltd. 3.08%
Hero MotoCorp Ltd. 3.43% ITC Ltd. 2.74%
Top Ten Portfolio Holdings
Note:Standard Deviation, Sharpe Ratio & Beta are calculated on Annualised basis using 3 years history of monthly returns, source: MFI Explorer## Risk-free rate assumed to be 9.02% (91 day T-bill yield as on Feb 29, 2012).
Investment Performance - Growth NAV as on Dec 30, 2011: ` 21.83

31
Birla Sun Life New Millennium Fund
What is it?A thematic fund that invests in companies related to the IT sector like hardware, peripherals and components, software, telecom, media, internet and e-commerce and other technology enabled companies.
Fund Details
As on February 29, 2012
Fund Manager: Mr. Atul PenkarManaging Fund Since: September 12, 2007Total Experience: 11 yearsDate of inception: January 15, 2000Nature of the scheme: An Open-ended Growth Scheme
NAV of Plans / Options (`) Growth: 19.02 Dividend: 12.42
Benchmark: BSE Teck
Load Structure (as % of NAV) (Incl. for SIP)Entry Load: NilExit Load**: 1% if redeemed / switched out within 365 days from the date of allotment. **Exit Load is NIL for units issued in Bonus & Dividend Reinvestment.
Other ParameterStandard Deviation: 25.21%Sharpe Ratio##: 0.80 Beta: 1.01
WEALTH CREATIONSOLUTIONS
High Returns High Risk 3 yrs+ High Liquidity
Date of Inception: Jan 15, 2000 NAV Per Unit. *
(`)
Birla Sun Life New
Millennium Fund (%)
BSE Teck # (%)
BSE SENSEX ##
(%)
Value of Standard Investment of ` 10000 in
Birla Sun Life New
Millennium Fund (`)
BSE Teck # (`)
BSE SENSEX
## (`)
Since inception till December 30, 2011 (CAGR)
10.00 4.80 N/A 9.06 17427 N/A 28241
December 30, 2010 to December 30, 2011 (Absolute)
22.20 -21.49 -16.21 -24.20 7851 8379 7580
December 30, 2009 to December 30, 2010 (Absolute)
18.98 16.97 23.78 17.56 11697 12378 11756
December 30, 2008 to December 30, 2009 (Absolute)
10.31 84.09 66.92 78.50 18409 16692 17850
# Scheme Benchmark, ## Additional Benchmark, * As on start of period considered above.Past performance may or may not be sustained in future. Returns for dividend option would assume reinvestment of tax free dividends declared at the then prevailing NAV. Load and Taxes are not considered for computation of returns. When scheme benchmark returns are not available, they have not been shown.Total Schemes managed by Mr. Atul Penkar is 7. Refer annexure on page no. 52 to know more on performance of schemes managed by Fund Manager.
Issuer % to net Assets Issuer % to net AssetsInfosys Ltd. 37.79% Oracle Financial Services Software Ltd. 5.43%
Tata Consultancy Services Ltd. 15.17% Polaris Financial Technology Ltd. 4.04%
Bharti Airtel Ltd. 12.41% Wipro Ltd. 3.61%
Hexaware Technologies Ltd. 7.05% OnMobile Global Ltd. 2.06%
HCL Technologies Ltd. 5.68% Mphasis Ltd. 1.87%
Top Ten Portfolio Holdings
Note:Standard Deviation, Sharpe Ratio & Beta are calculated on Annualised basis using 3 years history of monthly returns, source: MFI Explorer## Risk-free rate assumed to be 9.02% (91 day T-bill yield as on Feb 29, 2012).
Investment Performance - Growth NAV as on Dec 30, 2011: ` 17.43

Fund Manager: Mr. Mahesh PatilManaging Fund Since: July 29, 2010Total Experience: 20 yearsDate of inception: October 24, 2005Nature of the scheme: An Open-ended Growth Scheme
NAV of Plans / Options (`) Growth: 22.1859 Dividend: 13.6653
Benchmark: S&P CNX Nifty
Load Structure (as % of NAV) (Incl .for SIP)Entry Load: NilExit Load**: 0.50% if redeemed / switched out within 7 days from the date of allotment. **Exit Load is NIL for units issued in Bonus & Dividend Reinvestment.
Other ParameterStandard Deviation: 23.29%Sharpe Ratio##: 0.75 Beta: 0.84
32
Birla Sun Life Top 100 Fund
What is it?A large cap focused fund that invests in equity and equity related securities of top 100 companies in India as measured by market capitalization.
Fund Details
As on February 29, 2012
WEALTH CREATIONSOLUTIONS
High Returns High Risk 3 yrs+ High Liquidity
Date of Inception: Oct 24, 2005 NAV Per Unit. *
(`)
Birla Sun Life Top 100
Fund (%)
S&P CNX Nifty # (%)
BSE SENSEX ##
(%)
Value of Standard Investment of ` 10000 in
Birla Sun Life Top
100 Fund (`)
S&P CNX Nifty # (`)
BSE SENSEX
## (`)
Since inception till December 30, 2011 (CAGR)
10.00 10.98 11.56 11.41 19037 19671 19512
December 30, 2010 to December 30, 2011 (Absolute)
24.15 -21.17 -24.21 -24.20 7883 7579 7580
December 30, 2009 to December 30, 2010 (Absolute)
20.43 18.18 18.04 17.56 11818 11804 11756
December 30, 2008 to December 30, 2009 (Absolute)
11.78 73.50 73.50 78.50 17350 17350 17850
# Scheme Benchmark, ## Additional Benchmark, * As on start of period considered above.Past performance may or may not be sustained in future. Returns for dividend option would assume reinvestment of tax free dividends declared at the then prevailing NAV. Load and Taxes are not considered for computation of returns. Total Schemes managed by Mr. Mahesh Patil is 5. Refer annexure on page no. 52 to know more on performance of schemes managed by Fund Manager.
Issuer % to net Assets Issuer % to net AssetsReliance Industries Ltd. 6.81% Bharti Airtel Ltd. 3.22%
Housing Development Finance Corporation Ltd. 5.24% Tata Motors Ltd. - DVR 2.88%
Infosys Ltd. 5.23% Larsen & Toubro Ltd. 2.86%
ICICI Bank Ltd. 4.76% Jindal Steel & Power Ltd. 2.76%
ITC Ltd. 4.74% State Bank of India 2.63%
Top Ten Portfolio Holdings
Note:Standard Deviation, Sharpe Ratio & Beta are calculated on Annualised basis using 3 years history of monthly returns,source: MFI Explorer ## Risk-free rate assumed to be 9.02% (91 day T-bill yield as on Feb 29, 2012).
Investment Performance - Growth NAV as on Dec 30, 2011: ` 19.0367

33
What is it?An equity fund aiming to capitalize on the growth opportunities provided by companies that are driven by India’s large population and consumption patterns.
Fund Details
As on February 29, 2012
Fund Manager: Mr. Ajay GargManaging Fund Since: September 12, 2007Total Experience: 15 yearsDate of inception: January 15, 2000Nature of the scheme: An Open-ended Growth Scheme
NAV of Plans / Options (`)Growth: 38.57 Dividend: 20.35
Benchmark: BSE 200
Load Structure (as % of NAV) (Incl. for SIP)Entry Load: NilExit Load**: 0.50% if redeemed / switched out within 7 days from the date of allotment. **Exit Load is NIL for units issued in Bonus & Dividend Reinvestment.
Other ParameterStandard Deviation: 25.60%Sharpe Ratio##: 0.82 Beta: 0.83
Birla Sun Life Buy India Fund
WEALTH CREATIONSOLUTIONS
High Returns High Risk 3 yrs+ High Liquidity
Date of Inception: Jan 15, 2000 NAV Per Unit. *
(`)
Birla Sun Life Buy
India Fund (%)
BSE 200 # (%)
BSE SENSEX ##
(%)
Value of Standard Investment of ` 10000 in
Birla Sun Life Buy
India Fund (`)
BSE 200 # (`)
BSE SENSEX
## (`)
Since inception till December 30, 2011 (CAGR)
10.00 11.02 7.97 9.06 34476 25017 28241
December 30, 2010 to December 30, 2011 (Absolute)
44.96 -23.31 -26.40 -24.20 7669 7360 7580
December 30, 2009 to December 30, 2010 (Absolute)
36.77 22.27 15.95 17.56 12227 11595 11756
December 30, 2008 to December 30, 2009 (Absolute)
18.94 94.14 86.70 78.50 19414 18670 17850
# Scheme Benchmark, ## Additional Benchmark, * As on start of period considered above.Past performance may or may not be sustained in future. Returns for dividend option would assume reinvestment of tax free dividends declared at the then prevailing NAV. Load and Taxes are not considered for computation of returns. Total Schemes managed by Mr. Ajay Garg is 9. Refer annexure on page no. 52 to know more on performance of schemes managed by Fund Manager.
Issuer % to net Assets Issuer % to net AssetsHousing Development Finance Corporation Ltd. 5.21% Shoppers Stop Ltd. 3.46%
GlaxoSmithKline Pharmaceuticals Ltd. 4.20% Pfizer Ltd. 3.44%
Maruti Suzuki India Ltd. 3.81% Rallis India Ltd. 3.42%
Mahindra & Mahindra Ltd. 3.60% Wyeth Ltd. 3.18%
ING Vysya Bank Ltd. 3.49% Tata Global Beverages Ltd. 3.18%
Top Ten Portfolio Holdings
Note:Standard Deviation, Sharpe Ratio & Beta are calculated on Annualised basis using 3 years history of monthly returns, source: MFI Explorer## Risk-free rate assumed to be 9.02% (91 day T-bill yield as on Feb 29, 2012).
Investment Performance - Growth NAV as on Dec 30, 2011: ` 34.48

34
Birla Sun Life MNC Fund
What is it?The fund that invests in securities of multinational companies in order to achieve long-term growth of capital with relatively moderate levels of risk.
Fund Details
As on February 29, 2012
Fund Manager: Mr. Ajay GargManaging Fund Since: June 18, 2009Total Experience: 15 yearsDate of inception: December 27, 1999Nature of the scheme: An Open-ended Growth Scheme
NAV of Plans / Options (`)Growth: 223.11 Dividend: 84.03
Benchmark: CNX MNC
Load Structure (as % of NAV) (Incl. for SIP)Entry Load: NilExit Load**: 1% if redeemed / switched out within 365 days from the date of allotment **Exit Load is NIL for units issued in Bonus & Dividend Reinvestment.
Other ParameterStandard Deviation: 19.81%Sharpe Ratio##: 1.58 Beta: 0.86
WEALTH CREATIONSOLUTIONS
High Returns High Risk 3 yrs+ High Liquidity
Date of Inception: Dec 27, 1999 NAV Per Unit. *
(`)
Birla Sun Life MNC Fund (%)
CNX MNC # (%)
BSE SENSEX ##
(%)
Value of Standard Investment of ` 10000 in
Birla Sun Life MNC Fund (`)
CNX MNC # (`)
BSE SENSEX
## (`)
Since inception till December 30, 2011 (CAGR)
36.11 27.63 8.23 10.19 187635 25865 32075
December 30, 2010 to December 30, 2011 (Absolute)
214.69 -12.60 -12.51 -24.20 8740 8749 7580
December 30, 2009 to December 30, 2010 (Absolute)
162.85 31.83 11.03 17.56 13183 11103 11756
December 30, 2008 to December 30, 2009 (Absolute)
84.96 91.68 90.17 78.50 19168 19017 17850
# Scheme Benchmark, ## Additional Benchmark, * As on start of period considered above.Past performance may or may not be sustained in future. Returns for dividend option would assume reinvestment of tax free dividends declared at the then prevailing NAV. Load and Taxes are not considered for computation of returns. Total Schemes managed by Mr. Ajay Garg is 9. Refer annexure on page no. 52 to know more on performance of schemes managed by Fund Manager.
Issuer % to net Assets Issuer % to net AssetsICRA Ltd. 5.99% CRISIL Ltd. 4.38%
Honeywell Automation India Ltd. 5.71% Bosch Ltd. 4.29%
Gujarat Gas Company Ltd. 5.30% Cummins India Ltd. 4.17%
ING Vysya Bank Ltd. 4.96% Maruti Suzuki India Ltd. 3.84%
Oracle Financial Services Software Ltd. 4.45% Pfizer Ltd. 3.60%
Top Ten Portfolio Holdings
Note:Standard Deviation, Sharpe Ratio & Beta are calculated on Annualised basis using 3 years history of monthly returns, source: MFI Explorer## Risk-free rate assumed to be 9.02% (91 day T-bill yield as on Feb 29, 2012).
Investment Performance - Growth NAV as on Dec 30, 2011: ` 187.64

35
Birla Sun Life Index Fund
What is it?A fund that is designed to mirror the market performance of the 50 companies in the Nifty Index.
Fund Details
As on February 29, 2012
Fund Manager: Mr. Ajay GargManaging Fund Since: October 01, 2006Total Experience: 15 yearsDate of inception: September 18, 2002Nature of the scheme: An Open-ended Index Linked Growth Scheme
NAV of Plans / Options (`) Growth: 52.8769 Dividend: 20.4400
Benchmark: S&P CNX Nifty
Load Structure (as % of NAV) (Incl. for SIP)Entry Load: NilExit Load**: 0.50% if redeemed / switched out within 7 days from the date of allotment. **Exit Load is NIL for units issued in Bonus & Dividend Reinvestment.
Other ParameterStandard Deviation: 26.66%
WEALTH CREATIONSOLUTIONS
High Returns High Risk 3 yrs+ High Liquidity
Date of Inception: Sept 18, 2002 NAV Per Unit. *
(`)
Birla Sun Life Index Fund (%)
S&P CNX Nifty # (%)
BSE SENSEX ##
(%)
Value of Standard Investment of ` 10000 in
Birla Sun Life Index Fund (`)
S&P CNX Nifty # (`)
BSE SENSEX
## (`)
Since inception till December 30, 2011 (CAGR)
10.00 17.71 18.13 19.01 45473 47014 50345
December 30, 2010 to December 30, 2011 (Absolute)
60.63 -25.00 -24.21 -24.20 7500 7579 7580
December 30, 2009 to December 30, 2010 (Absolute)
51.56 17.60 18.04 17.56 11760 11804 11756
December 30, 2008 to December 30, 2009 (Absolute)
29.75 73.29 73.50 78.50 17329 17350 17850
# Scheme Benchmark, ## Additional Benchmark, * As on start of period considered above.Past performance may or may not be sustained in future. Returns for dividend option would assume reinvestment of tax free dividends declared at the then prevailing NAV. Load and Taxes are not considered for computation of returns. Total Schemes managed by Mr. Ajay Garg is 9. Refer annexure on page no. 52 to know more on performance of schemes managed by Fund Manager.
Issuer % to net Assets Issuer % to net AssetsCNX Nifty Future MAR 12 8.60% HDFC Bank Ltd. 5.10%
Reliance Industries Ltd. 7.73% Housing Development Finance Corporation Ltd. 4.74%
Infosys Ltd. 7.72% Larsen & Toubro Ltd. 3.88%
ITC Ltd. 6.09% Tata Consultancy Services Ltd. 3.45%
ICICI Bank Ltd. 5.79% State Bank of India 3.22%
Top Ten Portfolio Holdings
Note:Standard Deviation is calculated on Annualised basis using 3 years history of monthly returns, source: MFI Explorer.
Investment Performance - Growth NAV as on Dec 30, 2011: ` 45.4733

36
Birla Sun Life India Opportunities Fund
What is it?A fund that allows investors to participate in India’s global outsourcing theme by identifying companies that seek to utilize India’s low cost and high quality resources to service the needs of global customers.
Fund Details
As on February 29, 2012
Fund Manager: Mr. Atul PenkarManaging Fund Since: September 12, 2007Total Experience: 11 yearsDate of inception: December 27, 1999Nature of the scheme: An Open-ended Growth SchemeNAV of Plans / Options (`) Growth: 49.99 Dividend: 15.80 Benchmark: S&P CNX 500
Load Structure (as % of NAV) (Incl. for SIP)Entry Load: NilExit Load**: 0.50% if redeemed / switched out within 7 days from the date of allotment. **Exit Load is NIL for units issued in Bonus & Dividend Reinvestment.
Other ParameterStandard Deviation: 26.53%Sharpe Ratio##: 0.91 Beta: 0.85
WEALTH CREATIONSOLUTIONS
High Returns High Risk 3 yrs+ High Liquidity
Date of Inception: Dec 27, 1999 NAV Per Unit. *
(`)
Birla Sun Life India
Opportunities Fund (%)
S&P CNX 500 # (%)
BSESENSEX ##
(%)
Value of Standard Investment of ` 10000 in
Birla Sun Life India
Opportunities Fund (`)
S&P CNX 500 #
(`)
BSE SENSEX
## (`)
Since inception till December 30, 2011 (CAGR)
23.70 8.77 12.85 10.19 41181 42735 32075
December 30, 2010 to December 30, 2011 (Absolute)
58.39 -29.47 -26.65 -24.20 7053 7335 7580
December 30, 2009 to December 30, 2010 (Absolute)
50.05 16.66 13.88 17.56 11666 11388 11756
December 30, 2008 to December 30, 2009 (Absolute)
23.91 109.33 86.90 78.50 20933 18690 17850
# Scheme Benchmark, ## Additional Benchmark, * As on start of period considered above.Past performance may or may not be sustained in future. Returns for dividend option would assume reinvestment of tax free dividends declared at the then prevailing NAV. Load and Taxes are not considered for computation of returns. Total Schemes managed by Mr. Atul Penkar is 7. Refer annexure on page no. 52 to know more on performance of schemes managed by Fund Manager.
Issuer % to net Assets Issuer % to net AssetsHexaware Technologies Ltd. 10.17% CRISIL Ltd. 4.60%
Oracle Financial Services Software Ltd. 6.22% Hindalco Industries Ltd. 4.51%
Cummins India Ltd. 5.37% Wipro Ltd. 4.33%
Infosys Ltd. 5.03% Hindustan Zinc Ltd. 3.96%
Honeywell Automation India Ltd. 4.80% HCL Technologies Ltd. 3.93%
Top Ten Portfolio Holdings
Note:Standard Deviation, Sharpe Ratio & Beta are calculated on Annualised basis using 3 year history of monthly returns, source: MFI Explorer.## Risk-free rate assumed to be 9.02% (91 day T-bill yield as on Feb 29, 2012).
Investment Performance - Growth NAV as on Dec 30, 2011: ` 41.18

37
Birla Sun Life Dividend Yield Plus
What is it?A fund that invests in high dividend paying companies across market cap which typically have steady cash flow generation.
Fund Details
As on February 29, 2012
Fund Manager: Mr. Nishit DholakiaManaging Fund Since: January 24, 2011Total Experience: 11 yearsDate of inception: February 26, 2003Nature of the scheme: An Open-ended Growth Scheme
NAV of Plans / Options (`) Growth: 85.68 Dividend: 12.85 Benchmark: S&P CNX 500
Load Structure (as % of NAV) (Incl. for SIP)Entry Load: NilExit Load**: 1% if redeemed / switched out within 365 days from the date of allotment. **Exit Load is NIL for units issued in Bonus & Dividend Reinvestment.
Other ParameterStandard Deviation: 24.12%Sharpe Ratio##: 1.10 Beta: 0.78
WEALTH CREATIONSOLUTIONS
High Returns High Risk 3 yrs+ High Liquidity
Date of Inception: Feb 26, 2003 NAV Per Unit. *
(`)
Birla Sun Life Dividend
Yield Plus (%)
S&P CNX 500 # (%)
BSE SENSEX ##
(%)
Value of Standard Investment of ` 10000 in
Birla Sun Life Dividend Yield Plus
(`)
S&P CNX 500 # (`)
BSE SENSEX
## (`)
Since inception till December 30, 2011 (CAGR)
10.00 25.22 19.34 19.23 73112 47785 47401
December 30, 2010 to December 30, 2011 (Absolute)
89.24 -18.07 -26.65 -24.20 8193 7335 7580
December 30, 2009 to December 30, 2010 (Absolute)
69.02 29.30 13.88 17.56 12930 11388 11756
December 30, 2008 to December 30, 2009 (Absolute)
36.41 89.56 86.90 78.50 18956 18690 17850
# Scheme Benchmark, ## Additional Benchmark, * As on start of period considered above.Past performance may or may not be sustained in future. Returns for dividend option would assume reinvestment of tax free dividends declared at the then prevailing NAV. Load and Taxes are not considered for computation of returns. Total Schemes managed by Mr. Nishit Dholakia is 7. Refer annexure on page no. 52 to know more on performance of schemes managed by Fund Manager.
Issuer % to net Assets Issuer % to net AssetsITC Ltd. 3.61% Glaxosmithkline Consumer Healthcare Ltd. 2.46%
Bajaj Auto Ltd. 3.35% Infosys Ltd. 2.38%
Tata Motors Ltd. - DVR 3.16% Bharat Petroleum Corporation Ltd. 2.19%
Oil & Natural Gas Corporation Ltd. 3.03% Cummins India Ltd. 2.12%
Hero MotoCorp Ltd. 3.01% Castrol India Ltd. 2.08%
Top Ten Portfolio Holdings
Note:Standard Deviation, Sharpe Ratio & Beta are calculated on Annualised basis using 3 years history of monthly returns, source: MFI Explorer## Risk-free rate assumed to be 9.02% (91 day T-bill yield as on Feb 29, 2012).
Investment Performance - Growth NAV as on Dec 30, 2011: ` 73.11
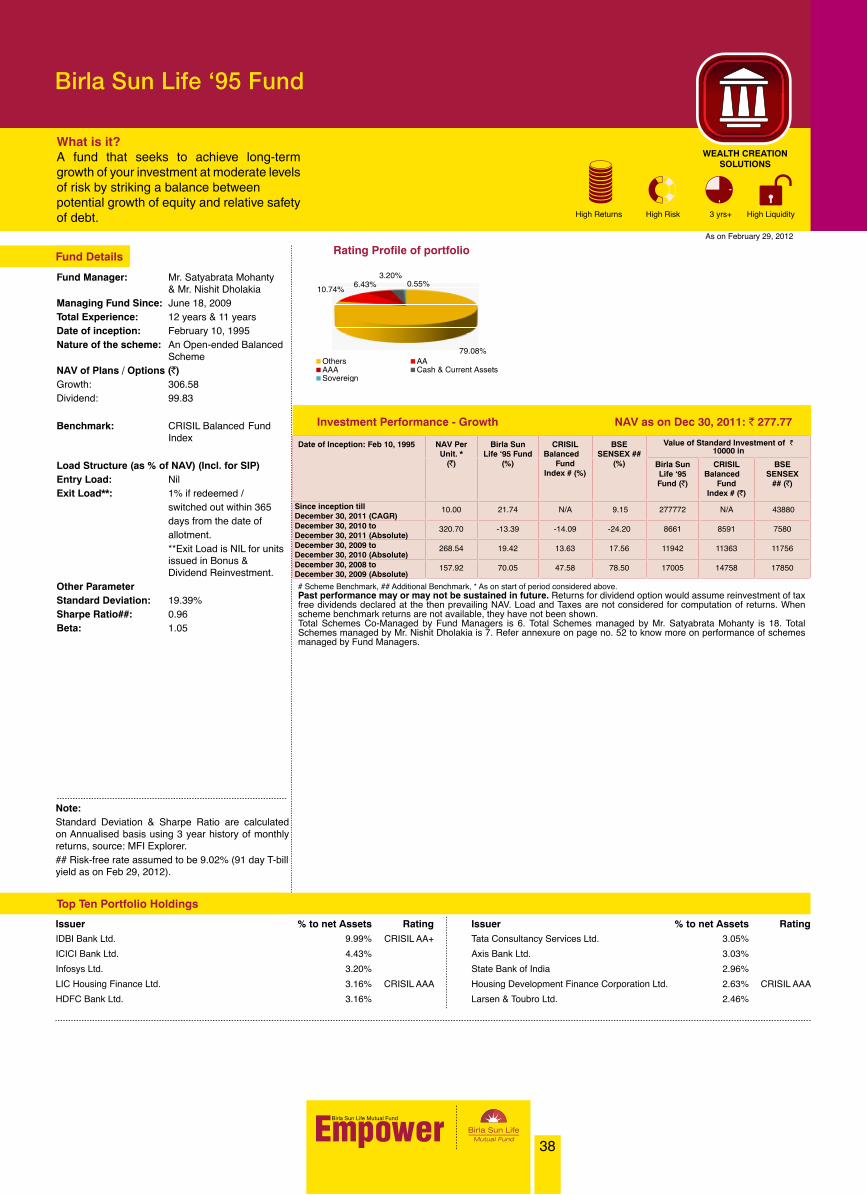
38
Birla Sun Life ‘95 Fund
What is it?A fund that seeks to achieve long-term growth of your investment at moderate levels of risk by striking a balance betweenpotential growth of equity and relative safety of debt.
As on February 29, 2012
Fund Details
Fund Manager: Mr. Satyabrata Mohanty & Mr. Nishit DholakiaManaging Fund Since: June 18, 2009Total Experience: 12 years & 11 yearsDate of inception: February 10, 1995Nature of the scheme: An Open-ended Balanced SchemeNAV of Plans / Options (`) Growth: 306.58 Dividend: 99.83
Benchmark: CRISIL Balanced Fund Index
Load Structure (as % of NAV) (Incl. for SIP) Entry Load: Nil Exit Load**: 1% if redeemed / switched out within 365 days from the date of allotment. **Exit Load is NIL for units issued in Bonus & Dividend Reinvestment.Other Parameter Standard Deviation: 19.39%Sharpe Ratio##: 0.96 Beta: 1.05
WEALTH CREATIONSOLUTIONS
High Returns High Risk 3 yrs+ High Liquidity
Investment Performance - Growth NAV as on Dec 30, 2011: ` 277.77
Date of Inception: Feb 10, 1995 NAV Per Unit. *
(`)
Birla Sun Life ‘95 Fund
(%)
CRISIL Balanced
Fund Index # (%)
BSE SENSEX ##
(%)
Value of Standard Investment of ` 10000 in
Birla Sun Life ‘95 Fund (`)
CRISIL Balanced
Fund Index # (`)
BSE SENSEX
## (`)
Since inception till December 30, 2011 (CAGR)
10.00 21.74 N/A 9.15 277772 N/A 43880
December 30, 2010 to December 30, 2011 (Absolute)
320.70 -13.39 -14.09 -24.20 8661 8591 7580
December 30, 2009 to December 30, 2010 (Absolute)
268.54 19.42 13.63 17.56 11942 11363 11756
December 30, 2008 to December 30, 2009 (Absolute)
157.92 70.05 47.58 78.50 17005 14758 17850
# Scheme Benchmark, ## Additional Benchmark, * As on start of period considered above.Past performance may or may not be sustained in future. Returns for dividend option would assume reinvestment of tax free dividends declared at the then prevailing NAV. Load and Taxes are not considered for computation of returns. When scheme benchmark returns are not available, they have not been shown.Total Schemes Co-Managed by Fund Managers is 6. Total Schemes managed by Mr. Satyabrata Mohanty is 18. Total Schemes managed by Mr. Nishit Dholakia is 7. Refer annexure on page no. 52 to know more on performance of schemes managed by Fund Managers.
Rating Profile of portfolio
79.08%
10.74%6.43%
3.20%0.55%
Others AAAAA Cash & Current AssetsSovereign
Issuer % to net Assets Rating Issuer % to net Assets RatingIDBI Bank Ltd. 9.99% CRISIL AA+ Tata Consultancy Services Ltd. 3.05%
ICICI Bank Ltd. 4.43% Axis Bank Ltd. 3.03%
Infosys Ltd. 3.20% State Bank of India 2.96%
LIC Housing Finance Ltd. 3.16% CRISIL AAA Housing Development Finance Corporation Ltd. 2.63% CRISIL AAA
HDFC Bank Ltd. 3.16% Larsen & Toubro Ltd. 2.46%
Top Ten Portfolio Holdings
Note:Standard Deviation & Sharpe Ratio are calculated on Annualised basis using 3 year history of monthly returns, source: MFI Explorer.## Risk-free rate assumed to be 9.02% (91 day T-bill yield as on Feb 29, 2012).

39
Birla Sun Life Asset Allocation Fund
What is it?An open ended Fund-of-Funds scheme with 3 plans to help you plan your investments to suit your risk profile.
Fund Details
As on February 29, 2012
Fund Manager: Mr. Satyabrata MohantyManaging Fund Since: June 18, 2009Total Experience: 12 yearsDate of inception: February 24, 2004Nature of the scheme: An Open-ended Fund of Funds Scheme
NAV of Plans / Options (`) Aggressive Plan Growth: 32.9734 Dividend: 32.9734 Conservative Plan Growth: 21.6072 Dividend: 21.6072 Moderate Plan Growth: 28.3712 Dividend: 28.3712 Benchmark: Aggressive Plan: S&P CNX NiftyModerate Plan: CRISIL Balanced Fund IndexConservative Plan: CRISIL MIP Blended Index
Load Structure (as % of NAV)Entry Load: NilExit Load: Nil
Other ParameterStandard Deviation Aggressive Plan: 18.97%Conservative Plan: 5.38%Moderate Plan: 13.55%
Note:Standard Deviation is calculated on Annualised basis using 3 years history of monthly returns, source: MFI Explorer.
Top Portfolio Holdings - Aggressive Plan Top Portfolio Holdings - Conservative Plan
WEALTH CREATIONSOLUTIONS
Moderate Returns Medium-High Risk 3 yrs+ High Liquidity
Issuer % to net AssetsBirla Sun Life Income Plus - Growth 45.35%Birla Sun Life Small and Midcap Fund - Growth 11.21%Birla Sun Life Infrastructure Fund - Growth 11.04%Birla Sun Life Govt. Securities Fund - Long Term Plan - Growth 10.34%Cash & Cash Equivalents 10.55%Birla Sun Life Advantage Fund - Growth 4.94%Birla Sun Life Top 100 Fund - Growth 3.38%Birla Sun Life India Opportunities Fund - Growth 3.01%
Top Portfolio Holdings - Moderate Plan
Investment Performance - Aggressive Plan - Growth NAV as on Dec 30, 2011: ` 30.3527Date of Inception: Feb 24, 2004 NAV Per
Unit. *(`)
Birla Sun Life AAF -
Aggressive Plan (%)
S&P CNX Nifty # (%)
BSE Sensex ## (%)
Value of Standard Investment of ` 10000 in
Birla Sun Life AAF -
Aggressive Plan (`)
S&P CNX Nifty # (`)
BSE Sensex## (`)
Since inception till December 30, 2011 (CAGR)
10.00 15.08 12.50 13.46 30353 25214 26951
December 30, 2010 to December 30, 2011 (Absolute)
35.95 -15.56 -24.21 -24.20 8444 7579 7580
December 30, 2009 to December 30, 2010 (Absolute)
31.08 15.68 18.04 17.56 11568 11804 11756
December 30, 2008 to December 30, 2009 (Absolute)
18.16 71.15 73.50 78.50 17115 17350 17850
Date of Inception: Feb 24, 2004 NAV Per Unit. *
(`)
Birla Sun Life AAF -
Conservative Plan (%)
CRISIL MIP Blended
Index # (%)
BSE Sensex ## (%)
Value of Standard Investment of ` 10000 in
Birla Sun Life AAF -
Conservative Plan (`)
CRISIL MIP Blended
Index # (`)
BSE Sensex## (`)
Since inception till December 30, 2011 (CAGR)
10.00 9.66 6.66 13.46 20728 16589 26951
December 30, 2010 to December 30, 2011 (Absolute)
20.78 -0.23 1.82 -24.20 9977 10182 7580
December 30, 2009 to December 30, 2010 (Absolute)
19.36 7.33 7.01 17.56 10733 10701 11756
December 30, 2008 to December 30, 2009 (Absolute)
15.87 22.00 13.10 78.50 12200 11310 17850
Investment Performance - Conservative Plan - Growth NAV as on Dec 30, 2011: ` 20.7276
Date of Inception: Feb 24, 2004 NAV Per Unit. *
(`)
Birla Sun Life AAF -
Moderate Plan (%)
CRISIL Balanced
Fund Index # (%)
BSE Sensex ## (%)
Value of Standard Investment of ` 10000 in
Birla Sun Life AAF - Moderate Plan (`)
CRISIL Balanced
Fund Index # (`)
BSE Sensex## (`)
Since inception till December 30, 2011 (CAGR)
10.00 13.21 10.51 13.46 26666 21917 26951
December 30, 2010 to December 30, 2011 (Absolute)
29.08 -8.29 -14.09 -24.20 9171 8591 7580
December 30, 2009 to December 30, 2010 (Absolute)
26.13 11.26 13.63 17.56 11126 11363 11756
December 30, 2008 to December 30, 2009 (Absolute)
17.52 49.14 47.58 78.50 14914 14758 17850
# Scheme Benchmark, ## Additional Benchmark, * As on start of period considered above.Past performance may or may not be sustained in future. Returns for dividend option would assume reinvestment of tax free dividends declared at the then prevailing NAV. Load and Taxes are not considered for computation of returns. Total Schemes managed by Satyabrata Mohanty is 17. Refer annexure on page no. 52 to know more on performance of schemes managed by Fund Manager.
Investment Performance - Moderate Plan - Growth NAV as on Dec 30, 2011: ` 26.6659
Issuer % to net Assets Issuer % to net AssetsBirla Sun Life Advantage Fund - Growth 22.17% Birla Sun Life Income Plus - Growth 66.38%Birla Sun Life Income Plus - Growth 19.84% Birla Sun Life Advantage Fund - Growth 9.55%Birla Sun Life Top 100 Fund - Growth 15.26% Birla Sun Life India Opportunities Fund 4.69%Birla Sun Life Small and Midcap Fund - Growth 15.24% Birla Sun Life Infrastructure Fund. 4.60%Birla Sun Life Infrastructure Fund -Growth 15.13% Birla Sun Life Midcap Fund - Growth 2.80%Birla Sun Life India Opportunities Fund - Growth 7.58% Cash & Cash Equivalents 4.02%Cash & Cash Equivalents 1.86% Birla Sun Life Top 100 Fund - Growth 2.33%Birla Sun Life Index Fund - Growth 0.00% Birla Sun Life Govt. Securities Fund - Long Term Plan - Growth 2.17%
Birla Sun Life Small and Midcap Fund - Growth 1.82%
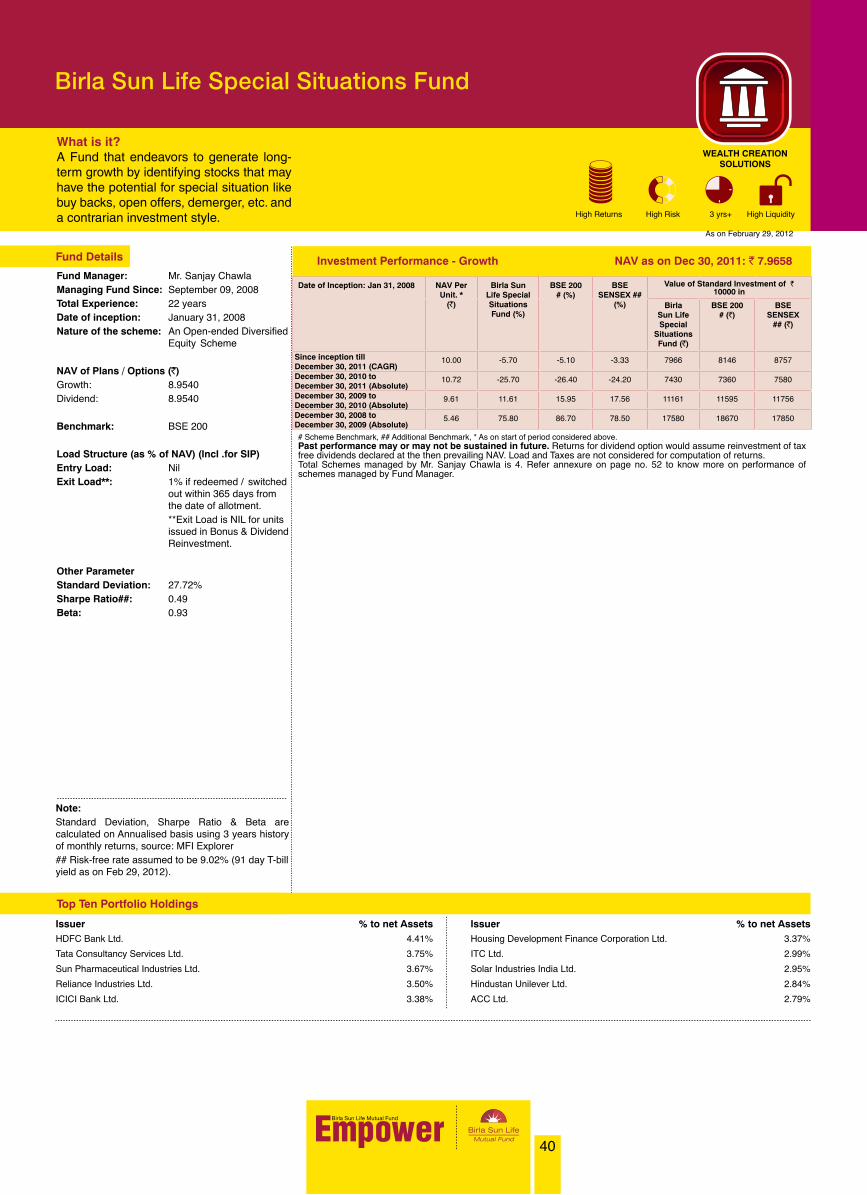
40
Birla Sun Life Special Situations Fund
What is it?A Fund that endeavors to generate long-term growth by identifying stocks that may have the potential for special situation like buy backs, open offers, demerger, etc. and a contrarian investment style.
Fund Details
As on February 29, 2012
Fund Manager: Mr. Sanjay ChawlaManaging Fund Since: September 09, 2008Total Experience: 22 yearsDate of inception: January 31, 2008Nature of the scheme: An Open-ended Diversified Equity Scheme
NAV of Plans / Options (`) Growth: 8.9540 Dividend: 8.9540
Benchmark: BSE 200
Load Structure (as % of NAV) (Incl .for SIP)Entry Load: NilExit Load**: 1% if redeemed / switched out within 365 days from the date of allotment. **Exit Load is NIL for units issued in Bonus & Dividend Reinvestment.
Other ParameterStandard Deviation: 27.72%Sharpe Ratio##: 0.49 Beta: 0.93
WEALTH CREATIONSOLUTIONS
High Returns High Risk 3 yrs+ High Liquidity
Date of Inception: Jan 31, 2008 NAV Per Unit. *
(`)
Birla Sun Life Special Situations Fund (%)
BSE 200 # (%)
BSE SENSEX ##
(%)
Value of Standard Investment of ` 10000 in
Birla Sun Life Special
Situations Fund (`)
BSE 200 # (`)
BSE SENSEX
## (`)
Since inception till December 30, 2011 (CAGR)
10.00 -5.70 -5.10 -3.33 7966 8146 8757
December 30, 2010 to December 30, 2011 (Absolute)
10.72 -25.70 -26.40 -24.20 7430 7360 7580
December 30, 2009 to December 30, 2010 (Absolute)
9.61 11.61 15.95 17.56 11161 11595 11756
December 30, 2008 to December 30, 2009 (Absolute)
5.46 75.80 86.70 78.50 17580 18670 17850
# Scheme Benchmark, ## Additional Benchmark, * As on start of period considered above.Past performance may or may not be sustained in future. Returns for dividend option would assume reinvestment of tax free dividends declared at the then prevailing NAV. Load and Taxes are not considered for computation of returns. Total Schemes managed by Mr. Sanjay Chawla is 4. Refer annexure on page no. 52 to know more on performance of schemes managed by Fund Manager.
Issuer % to net Assets Issuer % to net AssetsHDFC Bank Ltd. 4.41% Housing Development Finance Corporation Ltd. 3.37%
Tata Consultancy Services Ltd. 3.75% ITC Ltd. 2.99%
Sun Pharmaceutical Industries Ltd. 3.67% Solar Industries India Ltd. 2.95%
Reliance Industries Ltd. 3.50% Hindustan Unilever Ltd. 2.84%
ICICI Bank Ltd. 3.38% ACC Ltd. 2.79%
Top Ten Portfolio Holdings
Note:Standard Deviation, Sharpe Ratio & Beta are calculated on Annualised basis using 3 years history of monthly returns, source: MFI Explorer## Risk-free rate assumed to be 9.02% (91 day T-bill yield as on Feb 29, 2012).
Investment Performance - Growth NAV as on Dec 30, 2011: ` 7.9658
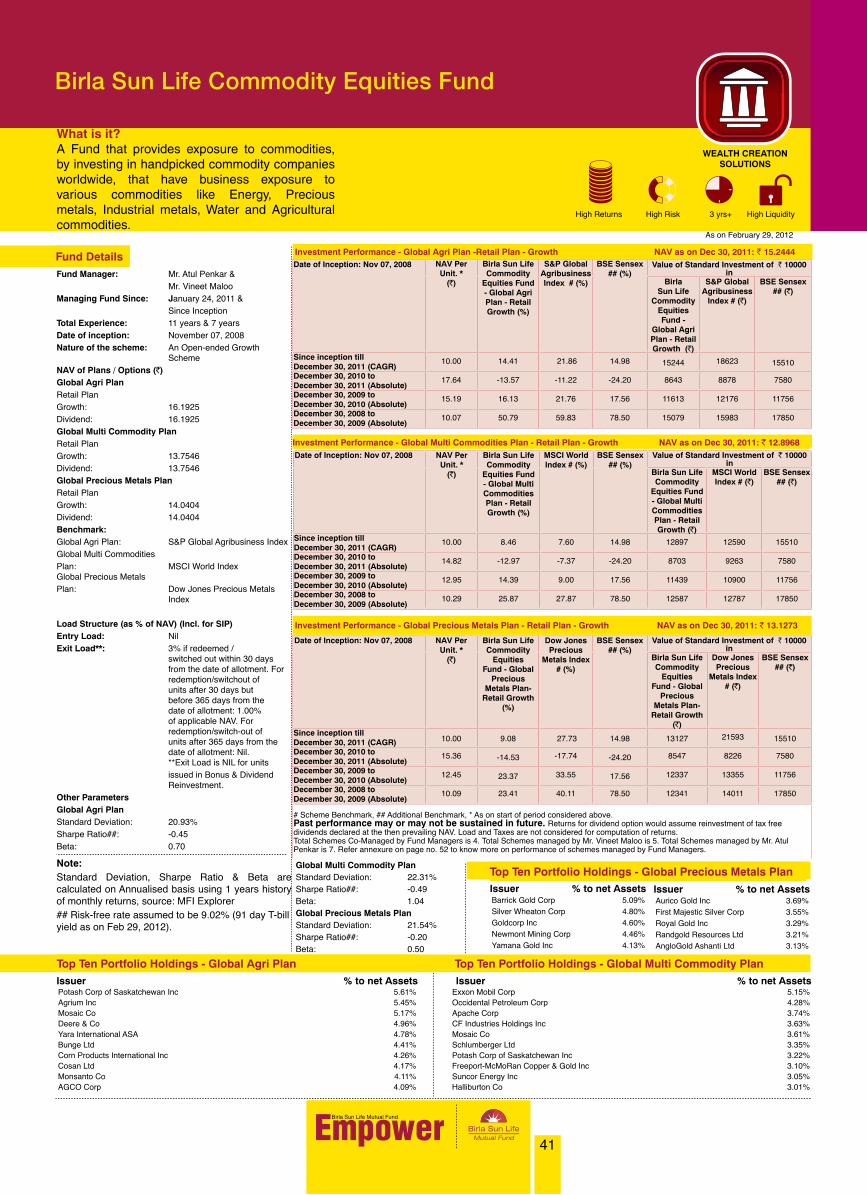
41
Birla Sun Life Commodity Equities Fund
What is it?A Fund that provides exposure to commodities, by investing in handpicked commodity companies worldwide, that have business exposure to various commodities like Energy, Precious metals, Industrial metals, Water and Agricultural commodities.
Fund Details
As on February 29, 2012
Fund Manager: Mr. Atul Penkar & Mr. Vineet MalooManaging Fund Since: January 24, 2011 & Since InceptionTotal Experience: 11 years & 7 yearsDate of inception: November 07, 2008Nature of the scheme: An Open-ended Growth SchemeNAV of Plans / Options (`) Global Agri PlanRetail PlanGrowth: 16.1925 Dividend: 16.1925 Global Multi Commodity PlanRetail PlanGrowth: 13.7546 Dividend: 13.7546 Global Precious Metals PlanRetail PlanGrowth: 14.0404 Dividend: 14.0404 Benchmark:Global Agri Plan: S&P Global Agribusiness Index Global Multi Commodities Plan: MSCI World Index Global Precious Metals Plan: Dow Jones Precious Metals Index
Load Structure (as % of NAV) (Incl. for SIP)Entry Load: NilExit Load**: 3% if redeemed / switched out within 30 days from the date of allotment. For redemption/switchout of units after 30 days but before 365 days from the date of allotment: 1.00% of applicable NAV. For redemption/switch-out of units after 365 days from the date of allotment: Nil. **Exit Load is NIL for units issued in Bonus & Dividend Reinvestment.Other ParametersGlobal Agri PlanStandard Deviation: 20.93%Sharpe Ratio##: -0.45Beta: 0.70 Note:Standard Deviation, Sharpe Ratio & Beta are calculated on Annualised basis using 1 years history of monthly returns, source: MFI Explorer ## Risk-free rate assumed to be 9.02% (91 day T-bill yield as on Feb 29, 2012).
Global Multi Commodity PlanStandard Deviation: 22.31%Sharpe Ratio##: -0.49Beta: 1.04Global Precious Metals PlanStandard Deviation: 21.54%Sharpe Ratio##: -0.20 Beta: 0.50
Issuer % to net Assets Issuer % to net AssetsPotash Corp of Saskatchewan Inc 5.61% Exxon Mobil Corp 5.15%Agrium Inc 5.45% Occidental Petroleum Corp 4.28%Mosaic Co 5.17% Apache Corp 3.74%Deere & Co 4.96% CF Industries Holdings Inc 3.63%Yara International ASA 4.78% Mosaic Co 3.61%Bunge Ltd 4.41% Schlumberger Ltd 3.35%Corn Products International Inc 4.26% Potash Corp of Saskatchewan Inc 3.22%Cosan Ltd 4.17% Freeport-McMoRan Copper & Gold Inc 3.10%Monsanto Co 4.11% Suncor Energy Inc 3.05%AGCO Corp 4.09% Halliburton Co 3.01%
Top Ten Portfolio Holdings - Global Agri Plan Top Ten Portfolio Holdings - Global Multi Commodity Plan
WEALTH CREATIONSOLUTIONS
High Returns High Risk 3 yrs+ High Liquidity
Issuer % to net AssetsBarrick Gold Corp 5.09%Silver Wheaton Corp 4.80%Goldcorp Inc 4.60%Newmont Mining Corp 4.46%Yamana Gold Inc 4.13%
Top Ten Portfolio Holdings - Global Precious Metals PlanIssuer % to net AssetsAurico Gold Inc 3.69%First Majestic Silver Corp 3.55%Royal Gold Inc 3.29%Randgold Resources Ltd 3.21%AngloGold Ashanti Ltd 3.13%
Investment Performance - Global Agri Plan -Retail Plan - Growth NAV as on Dec 30, 2011: ` 15.2444 Date of Inception: Nov 07, 2008 NAV Per
Unit. *(`)
Birla Sun Life Commodity
Equities Fund - Global Agri Plan - Retail Growth (%)
S&P Global Agribusiness Index # (%)
BSE Sensex ## (%)
Value of Standard Investment of ` 10000 in
Birla Sun Life
Commodity Equities Fund -
Global Agri Plan - Retail Growth (`)
S&P Global Agribusiness
Index # (`)
BSE Sensex## (`)
Since inception till December 30, 2011 (CAGR)
10.00 14.41 21.86 14.98 15244 18623 15510
December 30, 2010 to December 30, 2011 (Absolute)
17.64 -13.57 -11.22 -24.20 8643 8878 7580
December 30, 2009 to December 30, 2010 (Absolute)
15.19 16.13 21.76 17.56 11613 12176 11756
December 30, 2008 to December 30, 2009 (Absolute)
10.07 50.79 59.83 78.50 15079 15983 17850
Date of Inception: Nov 07, 2008 NAV Per Unit. *
(`)
Birla Sun Life Commodity
Equities Fund - Global
Precious Metals Plan-
Retail Growth (%)
Dow Jones Precious
Metals Index # (%)
BSE Sensex ## (%)
Value of Standard Investment of ` 10000 in
Birla Sun Life Commodity
Equities Fund - Global
Precious Metals Plan-
Retail Growth (`)
Dow Jones Precious
Metals Index # (`)
BSE Sensex## (`)
Since inception till December 30, 2011 (CAGR) 10.00 9.08 27.73 14.98 13127 21593 15510
December 30, 2010 to December 30, 2011 (Absolute)
15.36 -14.53 -17.74 -24.20 8547 8226 7580
December 30, 2009 to December 30, 2010 (Absolute)
12.45 23.37 33.55 17.56 12337 13355 11756
December 30, 2008 to December 30, 2009 (Absolute)
10.09 23.41 40.11 78.50 12341 14011 17850
# Scheme Benchmark, ## Additional Benchmark, * As on start of period considered above.Past performance may or may not be sustained in future. Returns for dividend option would assume reinvestment of tax free dividends declared at the then prevailing NAV. Load and Taxes are not considered for computation of returns. Total Schemes Co-Managed by Fund Managers is 4. Total Schemes managed by Mr. Vineet Maloo is 5. Total Schemes managed by Mr. Atul Penkar is 7. Refer annexure on page no. 52 to know more on performance of schemes managed by Fund Managers.
Investment Performance - Global Precious Metals Plan - Retail Plan - Growth NAV as on Dec 30, 2011: ` 13.1273
Date of Inception: Nov 07, 2008 NAV Per Unit. *
(`)
Birla Sun Life Commodity
Equities Fund - Global Multi Commodities Plan - Retail Growth (%)
MSCI World Index # (%)
BSE Sensex ## (%)
Value of Standard Investment of ` 10000 in
Birla Sun Life Commodity
Equities Fund - Global Multi Commodities Plan - Retail Growth (`)
MSCI World Index # (`)
BSE Sensex## (`)
Since inception till December 30, 2011 (CAGR)
10.00 8.46 7.60 14.98 12897 12590 15510
December 30, 2010 to December 30, 2011 (Absolute)
14.82 -12.97 -7.37 -24.20 8703 9263 7580
December 30, 2009 to December 30, 2010 (Absolute)
12.95 14.39 9.00 17.56 11439 10900 11756
December 30, 2008 to December 30, 2009 (Absolute)
10.29 25.87 27.87 78.50 12587 12787 17850
Investment Performance - Global Multi Commodities Plan - Retail Plan - Growth NAV as on Dec 30, 2011: ` 12.8968

42
Birla Sun Life International Equity Fund - Plan A
What is it?A fund that provides an opportunity to grow your money by investing in world-class companies across the globe.
Fund Details
As on February 29, 2012
Fund Manager: Mr. Mahesh Patil & Mr. Vineet MalooManaging Fund Since: Since InceptionTotal Experience: 20 years & 7 yearsDate of inception: October 31, 2007Nature of the scheme: An Open-ended Diversified Equity Scheme
NAV of Plans / Options (`) Growth: 10.2818 Dividend: 10.2818 Benchmark: S&P Global 1200
Load Structure (as % of NAV) (Incl. for SIP)Entry Load: Nil Exit Load: Nil Other ParameterStandard Deviation: 13.24%Sharpe Ratio##: 1.14 Beta: 0.76
WEALTH CREATIONSOLUTIONS
High Returns High Risk 3 yrs+ High Liquidity
Date of Inception: Oct 31, 2007 NAV Per Unit. *
(`)
Birla Sun Life
International Equity Fund -
Plan A (%)
S&P Global 1200 #
(%)
BSE SENSEX ## (%)
Value of Standard Investment of ` 10000 in
Birla Sun Life International Equity Fund -
Plan A (`)
S&P Global 1200 # (`)
BSE SENSEX
## (`)
Since inception till December 30, 2011 (CAGR) 10.00 0.35 -8.06 -5.82 10147 7045 7791
December 30, 2010 to December 30, 2011 (Absolute) 9.45 7.40 -7.57 -24.20 10740 9243 7580
December 30, 2009 to December 30, 2010 (Absolute) 8.99 5.07 8.68 17.56 10507 10868 11756
December 30, 2008 to December 30, 2009 (Absolute) 6.98 28.85 29.46 78.50 12885 12946 17850
# Scheme Benchmark, ## Additional Benchmark, * As on start of period considered above.Past performance may or may not be sustained in future. Returns for dividend option would assume reinvestment of tax free dividends declared at the then prevailing NAV. Load and Taxes are not considered for computation of returns. Total Schemes Co-Managed by Fund Managers is 1. Total Schemes managed by Mr. Mahesh Patil is 5. Total Schemes managed by Mr. Vineet Maloo is 5. Refer annexure on page no. 52 to know more on performance of schemes managed by Fund Managers..
Issuer % to net Assets Issuer % to net AssetsCoca-Cola Co 5.64% Wal-Mart Stores Inc 4.78%
Aetna Inc 5.07% Exxon Mobil Corp 4.55%
Apple Inc 5.05% Coach Inc 4.15%
Statoil ASA 4.91% ENSCO PLC 4.02%
Chubb Corp 4.81% Taiwan Semiconductor Manufacturing Co Ltd. 3.75%
Top Ten Portfolio Holdings
Note:Standard Deviation & Sharpe Ratio are calculated on Annualised basis using 3 year history of monthly returns, source: MFI Explorer.## Risk-free rate assumed to be 9.02% (91 day T-bill yield as on Feb 29, 2012).
Investment Performance - Growth NAV as on Dec 30, 2011: ` 10.1468

43
Birla Sun Life International Equity Fund - Plan B
What is it?A fund that provides an opportunity to grow your money by investing in world-class companies across the globe, with at least 65% exposure to domestic markets.
Fund Details
Fund Manager: Mr. Atul Penkar & Mr. Vineet MalooManaging Fund Since: July 29, 2010 / Since Inception Total Experience: 11 years & 7 yearsDate of inception: October 31, 2007Nature of the scheme: An Open-ended Diversified Equity Scheme
NAV of Plans / Options (`) Growth: 9.1370 Dividend: 9.1370
Benchmark: Customised Index †† A customized benchmark created using BSE 200 to the extent of 65% of portfolio and S&P Global 1200 to the extent of 35% of portfolio.
Load Structure (as % of NAV) (Incl. for SIP)Entry Load: NilExit Load**: 1% if redeemed / switched out within 365 days from the date of allotment. **Exit Load is NIL for units issued in Bonus & Dividend Reinvestment.
Other ParameterStandard Deviation: 20.33%Sharpe Ratio##: 0.64 Beta: 0.94
WEALTH CREATIONSOLUTIONS
High Returns High Risk 3 yrs+ High Liquidity
As on February 29, 2012
Date of Inception: Oct 31, 2007 NAV Per Unit. *
(`)
Birla Sun Life
International Equity Fund -
Plan B (%)
Customised Index † #
(%)
BSE SENSEX ## (%)
Value of Standard Investment of ` 10000 in
Birla Sun Life International Equity Fund -
Plan B (`)
Customised Index †
# (`)
BSE SENSEX
## (`)
Since inception till December 30, 2011 (CAGR) 10.00 -4.62 -3.56 -5.82 8211 8597 7791
December 30, 2010 to December 30, 2011 (Absolute) 10.03 -18.13 -14.83 -24.20 8187 8517 7580
December 30, 2009 to December 30, 2010 (Absolute) 8.92 12.38 12.17 17.56 11238 11217 11756
December 30, 2008 to December 30, 2009 (Absolute) 5.52 61.70 64.44 78.50 16170 16444 17850
# Scheme Benchmark, ## Additional Benchmark, * As on start of period considered above.Past performance may or may not be sustained in future. Returns for dividend option would assume reinvestment of tax free dividends declared at the then prevailing NAV. Load and Taxes are not considered for computation of returns. Total Schemes Co-Managed by Fund Managers is 4. Total Schemes managed by Mr. Vineet Maloo is 5. Total Schemes managed by Mr. Atul Penkar is 7. Refer annexure on page no. 52 to know more on performance of schemes managed by Fund Managers.† A customized benchmark created using BSE 200 to the extent of 65% of portfolio and S&P Global 1200 to the extent of 35% of portfolio.
Issuer % to net Assets Issuer % to net AssetsReliance Industries Ltd. 3.40% Bharti Airtel Ltd. 2.40%
ICICI Bank Ltd. 3.24% Axis Bank Ltd. 2.37%
ITC Ltd. 3.16% The India Cements Ltd. 2.13%
Tata Consultancy Services Ltd. 3.15% HDFC Bank Ltd. 2.10%
Infosys Ltd. 2.48% Larsen & Toubro Ltd. 1.98%
Top Ten Portfolio Holdings
Note:Standard Deviation, Sharpe Ratio & Beta are calculated on Annualised basis using 3 years history of monthly returns,source: MFI Explorer ## Risk-free rate assumed to be 9.02% (91 day T-bill yield as on Feb 29, 2012).
Investment Performance - Growth NAV as on Dec 30, 2011: ` 8.2115

44
Birla Sun Life Small & Midcap Fund
What is it?An Equity fund that aims to generate growth and capital appreciation by investing predominantly in equity and equity related securities of companies considered to be small and mid cap.
Fund Details
As on February 29, 2012
Fund Manager: Mr. Sanjay ChawlaManaging Fund Since: July 29, 2010Total Experience: 22 years Date of inception: May 31, 2007Nature of the scheme: An Open-ended Small & Mid Cap Equity Scheme
NAV of Plans / Options (`) Growth: 11.4814 Dividend: 11.4814 Benchmark: S&P CNX Midcap
Load Structure (as % of NAV) (Incl. for SIP)Entry Load: NilExit Load**: 1% if redeemed / switched out within 365 days from the date of allotment. **Exit Load is NIL for units issued in Bonus & Dividend Reinvestment.
Other ParameterStandard Deviation: 30.66%Sharpe Ratio##: 0.88 Beta: 0.94
WEALTH CREATIONSOLUTIONS
High Returns High Risk 3 yrs+ High Liquidity
Date of Inception: May 31, 2007 NAV Per Unit. *
(`)
Birla Sun Life Small & Midcap Fund
(%)
S & P CNX Midcap #
(%)
BSE SENSEX ##
(%)
Value of Standard Investment of ` 10000 in
Birla Sun Life Small & Midcap Fund (`)
S & P CNX Midcap
# (`)
BSE SENSEX
## (`)
Since inception till December 30, 2011 (CAGR) 10.00 -0.01 1.75 1.33 9996 10829 10626
December 30, 2010 to December 30, 2011 (Absolute) 12.85 -22.20 -30.17 -24.20 7780 6983 7580
December 30, 2009 to December 30, 2010 (Absolute) 10.87 18.18 17.97 17.56 11818 11797 11756
December 30, 2008 to December 30, 2009 (Absolute) 5.23 107.73 100.22 78.50 20773 20022 17850
# Scheme Benchmark, ## Additional Benchmark, * As on start of period considered above.Past performance may or may not be sustained in future. Returns for dividend option would assume reinvestment of tax free dividends declared at the then prevailing NAV. Load and Taxes are not considered for computation of returns. Total Schemes managed by Mr. Sanjay Chawla is 4. Refer annexure on page no. 52 to know more on performance of schemes managed by Fund Manager.
Issuer % to net Assets Issuer % to net AssetsWabco India Ltd. 7.21% Max India Ltd. 2.60%
Solar Industries India Ltd. 4.59% Glenmark Pharmaceuticals Ltd. 2.46%
Glaxosmithkline Consumer Healthcare Ltd. 3.10% Gateway Distriparks Ltd. 2.42%
Balkrishna Industries Ltd. 3.05% PTC India Ltd. 2.38%
Torrent Pharmaceuticals Ltd. 2.85% Hathway Cable & Datacom Ltd. 2.33%
Top Ten Portfolio Holdings
Note:Standard Deviation & Sharpe Ratio are calculated on Annualised basis using 3 years history of monthly returns, source: MFI Explorer.## Risk-free rate assumed to be 9.02% (91 day T-bill yield as on Feb 29, 2012).
Investment Performance - Growth NAV as on Dec 30, 2011: ` 9.9958

45
Birla Sun Life India Reforms Fund
What is it?An Equity fund that aims to generate growth and capital appreciation by building a portfolio of companies that are expected to benefit from the economic reforms, PSU divestment and increased government spending.
Fund Details
As on February 29, 2012
Fund Manager: Mr. Naysar ShahManaging Fund Since: January 24, 2011Total Experience: 12 yearsDate of inception: June 25, 2010Nature of the scheme: An Open-ended Equity Scheme
NAV of Plans / Options (`) Growth: 8.93 Dividend: 8.93
Benchmark: S&P CNX 500
Load Structure (as % of NAV) (Incl. for SIP)Entry Load: NilExit Load**: 1% if redeemed / switched out within 1 year from the date of allotment. **Exit Load is NIL for units issued in Bonus & Dividend Reinvestment.
Other ParameterStandard Deviation: 25.81%Sharpe Ratio##: -0.40 Beta: 0.93
WEALTH CREATIONSOLUTIONS
High Returns High Risk 3 yrs+ High Liquidity
Date of Inception: June 25, 2010 NAV Per Unit. *
(`)
Birla Sun Life India Reforms Fund (%)
S & P CNX 500 # (%)
BSE SENSEX ##
(%)
Value of Standard Investment of ` 10000 in
Birla Sun Life India Reforms Fund (`)
S & P CNX 500 # (`)
BSE SENSEX
## (`)
Since inception till December 30, 2011 (CAGR) 10.00 -17.82 -12.89 -8.13 7436 8114 8794
December 30, 2010 to December 30, 2011 (Absolute) 10.80 -31.11 -26.65 -24.20 6889 7335 7580
# Scheme Benchmark, ## Additional Benchmark, * As on start of period considered above.Past performance may or may not be sustained in future. Returns for dividend option would assume reinvestment of tax free dividends declared at the then prevailing NAV. Load and Taxes are not considered for computation of returns. Total Schemes managed by Mr. Naysar Shah is 2. Refer annexure on page no. 52 to know more on performance of schemes managed by Fund Manager.
Issuer % to net Assets Issuer % to net AssetsICICI Bank Ltd. 7.95% Max India Ltd. 3.27%
Larsen & Toubro Ltd. 5.74% HDFC Bank Ltd. 3.24%
Sadbhav Engineering Ltd. 4.33% Kalpataru Power Transmission Ltd. 3.06%
Oil & Natural Gas Corporation Ltd. 3.68% The Federal Bank Ltd. 3.05%
Gujarat State Fertilizers & Chemicals Ltd. 3.41% Indraprastha Gas Ltd. 2.84%
Top Ten Portfolio Holdings
Note:Standard Deviation & Sharpe Ratio are calculated on Annualised basis using 1 years history of monthly returns, source: MFI Explorer.## Risk-free rate assumed to be 9.02% (91 day T-bill yield as on Feb 29, 2012).
Investment Performance - Growth NAV as on Dec 30, 2011: ` 7.44

46
Birla Sun Life Pure Value Fund
What is it?An Open ended Diversified Equity fund that follows value investing strategy to generate consistent long-term capital appreciation.
Fund Details
As on February 29, 2012
Fund Manager: Mr. Nishit DholakiaManaging Fund Since: January 24, 2011Total Experience: 11 yearsDate of inception: March 27, 2008Nature of the scheme: An Open-ended Diversified Equity Scheme
NAV of Plans / Options (`) Growth: 16.1321 Dividend: 15.1153
Benchmark: BSE 200
Load Structure (as % of NAV) (Incl. for SIP)Entry Load: NilExit Load**: 1% if redeemed / switched out within 365 days from the date of allotment. **Exit Load is NIL for units issued in Bonus & Dividend Reinvestment.
Other ParameterStandard Deviation: 26.59%Sharpe Ratio##: 0.88 Beta: 0.76
WEALTH CREATIONSOLUTIONS
High Returns High Risk 3 yrs+ High Liquidity
Date of Inception: Mar 27, 2008 NAV Per Unit. *
(`)
Birla Sun Life Pure
Value Fund (%)
BSE 200 # (%)
BSE SENSEX ##
(%)
Value of Standard Investment of ` 10000 in
Birla Sun Life Pure
Value Fund (`)
BSE 200 # (`)
BSE SENSEX
## (`)
Since inception till December 30, 2011 (CAGR) 10.00 8.69 -1.14 -0.94 13669 9577 9650
December 30, 2010 to December 30, 2011 (Absolute) 17.79 -23.15 -26.40 -24.20 7685 7360 7580
December 30, 2009 to December 30, 2010 (Absolute) 14.51 22.53 15.95 17.56 12253 11595 11756
December 30, 2008 to December 30, 2009 (Absolute) 7.57 91.67 86.70 78.50 19167 18670 17850
# Scheme Benchmark, ## Additional Benchmark, * As on start of period considered above.Past performance may or may not be sustained in future. Returns for dividend option would assume reinvestment of tax free dividends declared at the then prevailing NAV. Load and Taxes are not considered for computation of returns. Total Schemes managed by Mr. Nishit Dholakia is 7. Refer annexure on page no. 52 to know more on performance of schemes managed by Fund Manager.
Issuer % to net Assets Issuer % to net AssetsFAG Bearings India Ltd. 5.94% Zuari Industries Ltd. 3.86%
Gateway Distriparks Ltd. 4.87% The South Indian Bank Ltd. 3.46%
Oil & Natural Gas Corporation Ltd. 4.71% City Union Bank Ltd. 3.42%
Glaxosmithkline Consumer Healthcare Ltd. 4.57% The Federal Bank Ltd. 3.25%
Wabco India Ltd. 3.87% Karur Vysya Bank Ltd. 3.15%
Top Ten Portfolio Holdings
Note:Standard Deviation, Sharpe Ratio & Beta are calculated on Annualised basis using 3 years history of monthly returns, source: MFI Explorer## Risk-free rate assumed to be 9.02% (91 day T-bill yield as on Feb 29, 2012).
Investment Performance - Growth NAV as on Dec 30, 2011: ` 13.6692

47
Birla Sun Life Long Term Advantage Fund
What is it?An Open ended Equity fund that invests in a Diversified portfolio of equity and equity related securities
Fund Details
As on February 29, 2012
Fund Manager: Mr. Atul PenkarManaging Fund Since: January 24, 2011Total Experience: 11 yearsDate of inception: October 10, 2006Nature of the scheme: An Open Ended Diversified Equity Scheme
NAV of Plans / Options (`) Growth: 13.48 Dividend: 12.45 Benchmark: BSE Sensex
Load Structure (as % of NAV) (Incl. for SIP)Entry Load: NilExit Load: 1% if redeemed / switched out within 365 days from the date of allotment. **Exit Load is NIL for units issued in Bonus & Dividend Reinvestment.
Other ParameterStandard Deviation: 24.72%Sharpe Ratio##: 0.81 Beta: 0.87
WEALTH CREATIONSOLUTIONS
High Returns High Risk 3 yrs+ High Liquidity
Date of Inception: Oct 10, 2006 NAV Per Unit. *
(`)
Birla Sun Life Long
Term Advantage Fund (%)
BSE Sensex #
(%)
S&P CNX Nifty ##
(%)
Value of Standard Investment of ` 10000 in
Birla Sun Life Long
Term Advantage
Fund (`)
BSE Sensex
# (`)
S&P CNX Nifty## (`)
Since inception till December 30, 2011 (CAGR) 10.00 2.97 4.36 5.07 11649 12500 12949
December 30, 2010 to December 30, 2011 (Absolute) 15.24 -23.56 -24.20 -24.21 7644 7580 7579
December 30, 2009 to December 30, 2010 (Absolute) 12.54 21.53 17.56 18.04 12153 11756 11804
December 30, 2008 to December 30, 2009 (Absolute) 6.83 83.60 78.50 73.50 18360 17850 17350
# Scheme Benchmark, ## Additional Benchmark, * As on start of period considered above.Past performance may or may not be sustained in future. Returns for dividend option would assume reinvestment of tax free dividends declared at the then prevailing NAV. Load and Taxes are not considered for computation of returns. Total Schemes managed by Mr. Atul Penkar is 7. Refer annexure on page no. 52 to know more on performance of schemes managed by Fund Manager.
Issuer % to net Assets Issuer % to net AssetsInfosys Ltd. 5.91% Housing Development Finance Corporation Ltd. 4.11%
Reliance Industries Ltd. 5.37% Tata Consultancy Services Ltd. 3.90%
ICICI Bank Ltd. 5.10% Bharti Airtel Ltd. 3.06%
ITC Ltd. 4.85% Jindal Steel & Power Ltd. 2.79%
HDFC Bank Ltd. 4.82% State Bank of India 2.53%
Top Ten Portfolio Holdings
Note:Standard Deviation & Sharpe Ratio are calculated son Annualised basis using 3 years history of monthly returns, source: MFI Explorer.## Risk-free rate assumed to be 9.02% (91 day T-bill yield as on Feb 29, 2012).
Investment Performance - Growth NAV as on Dec 30, 2011: ` 11.65

48
Tax Savings Solutions
What are Tax Savings Solutions?
Our Tax Savings Solutions help to reduce your tax burden and at the same time, aim to grow your money through equity investments.
Who can benefit from Tax Savings Solutions?
Tax saving is important, especially when investors can save up to ̀ 30,900 in taxes! Section 80C of the Income Tax Act, 1961 provides options to save tax by reducing the taxable income by up to ` 1 lakh.
But, wealth creation is also important. Isn’t it? That’s why this solution is ideal for investors who would like to create wealth along with tax saving.Tax savings of ` 30,900 is calculated assuming qualifying amount of deduction is ` 1 lakh & investor falls in the top income tax slab of 30% & includes applicable cess. Investors are advised to consult their tax advisor in view of individual nature of tax benefits.
Benefits of Tax Savings Solutions:
Low lock-in period: Your money is locked-in for just 3 years, as against the much longer lock-in periods in other options.
Potential to earn dividends: While your money is locked-in for 3 years, you may opt for the dividend option and can receive returns in the form of tax-free dividends during this time. This feature is unique only to tax saving solutions from mutual funds.
Earn market linked returns: Since investments are made in stocks of Indian companies, the value of your investment moves with the stock market. Although it comes with market related risks, your money is diversified i.e. spread out across stocks of multiple companies and is being monitored by an investment expert with an aim to minimize such risks.
Tax-free returns: When you withdraw your investment after 3 years, the returns are totally tax free. Yes, you save taxes on both, your initial investment and also on the returns.
Tax deduction(s) available u/s 80C of the Income Tax Act, 1961 is subject to conditions specified therein.Investors are requested to note that fiscal laws may change from time to time and there can be no guarantee that the current tax position may continue in the future.Investors are advised to consult their tax advisor in view of individual nature of tax benefits.The Financial Solution (Savings Solution) stated above is ONLY for highlighting the many advantages perceived from investments in Mutual Funds but does not in any manner, indicate or imply, either the quality of any particular Scheme or guarantee any specific performance/returns.

49
Birla Sun Life Tax Relief ‘96
What is it?A fund that provides an opportunity to save tax while growing your money through Equity investments.
Fund Details
Fund Manager Mr. Ajay GargManaging Fund Since: October 01, 2006Total Experience: 15 yearsDate of inception: March 29, 1996Nature of the scheme: An Open-ended ELSS Scheme with a lock - in of 3 years from the date of allotment.
NAV of Plans / Options (`) Growth: 10.09 Dividend: 71.21
Benchmark: BSE 200
Load Structure (as % of NAV) (Incl. for SIP)Entry Load: NilExit Load: Nil Other ParameterStandard Deviation: 29.96%Sharpe Ratio##: 0.64 Beta: 1.02
As on February 29, 2012
TAX SAVINGSSOLUTIONS
High Returns High Risk 3 yrs+ Low Liquidity
Investment Performance - Dividend NAV as on Dec 30, 2011: ` 61.34
Date of Inception: Mar 29, 1996 NAV Per Unit. *
(`)
Birla Sun Life Tax
Relief ‘96 (%)
BSE 200 # (%)
BSE SENSEX ##
(%)
Value of Standard Investment of ` 10000 in
Birla Sun Life Tax
Relief ‘96 (`)
BSE 200# (`)
BSE SENSEX
## (`)
Since inception till December 30, 2011 (CAGR) 10.00 26.69 11.24 10.15 61343 53587 45906
December 30, 2010 to December 30, 2011 (Absolute) 90.78 -29.02 -26.40 -24.20 7098 7360 7580
December 30, 2009 to December 30, 2010 (Absolute) 87.46 12.99 15.95 17.56 11299 11595 11756
December 30, 2008 to December 30, 2009 (Absolute) 45.76 101.50 86.70 78.50 20150 18670 17850
# Scheme Benchmark, ## Additional Benchmark, * As on start of period considered above.Past performance may or may not be sustained in future. Returns assume reinvestment of tax free dividends declared at the then prevailing NAV. Load and Taxes are not considered for computation of returns. Total Schemes managed by Mr. Ajay Garg is 9. Refer annexure on page no. 52 to know more on performance of schemes managed by Fund Manager.
Tax deduction(s) available u/s 80C of the Income Tax Act, 1961 is subject to conditions specified therein.Investors are requested to note that fiscal laws may change from time to time and there can be no guarantee that the current tax position may continue in the future.Investors are advised to consult their tax advisor in view of individual nature of tax benefits.
Issuer % to net Assets Issuer % to net AssetsReliance Industries Ltd. 6.32% Infosys Ltd. 3.55%
Tata Consultancy Services Ltd. 4.70% ING Vysya Bank Ltd. 3.00%
ICICI Bank Ltd. 4.60% Jindal Steel & Power Ltd. 2.89%
HDFC Bank Ltd. 4.18% Larsen & Toubro Ltd. 2.85%
Housing Development Finance Corporation Ltd. 4.01% Honeywell Automation India Ltd. 2.75%
Top Ten Portfolio Holdings
Note:Standard Deviation, Sharpe Ratio & Beta are calculated on Annualised basis using 3 years history of monthly returns, source: MFI Explorer.## Risk-free rate assumed to be 9.02% (91 day T-bill yield as on Feb 29, 2012).
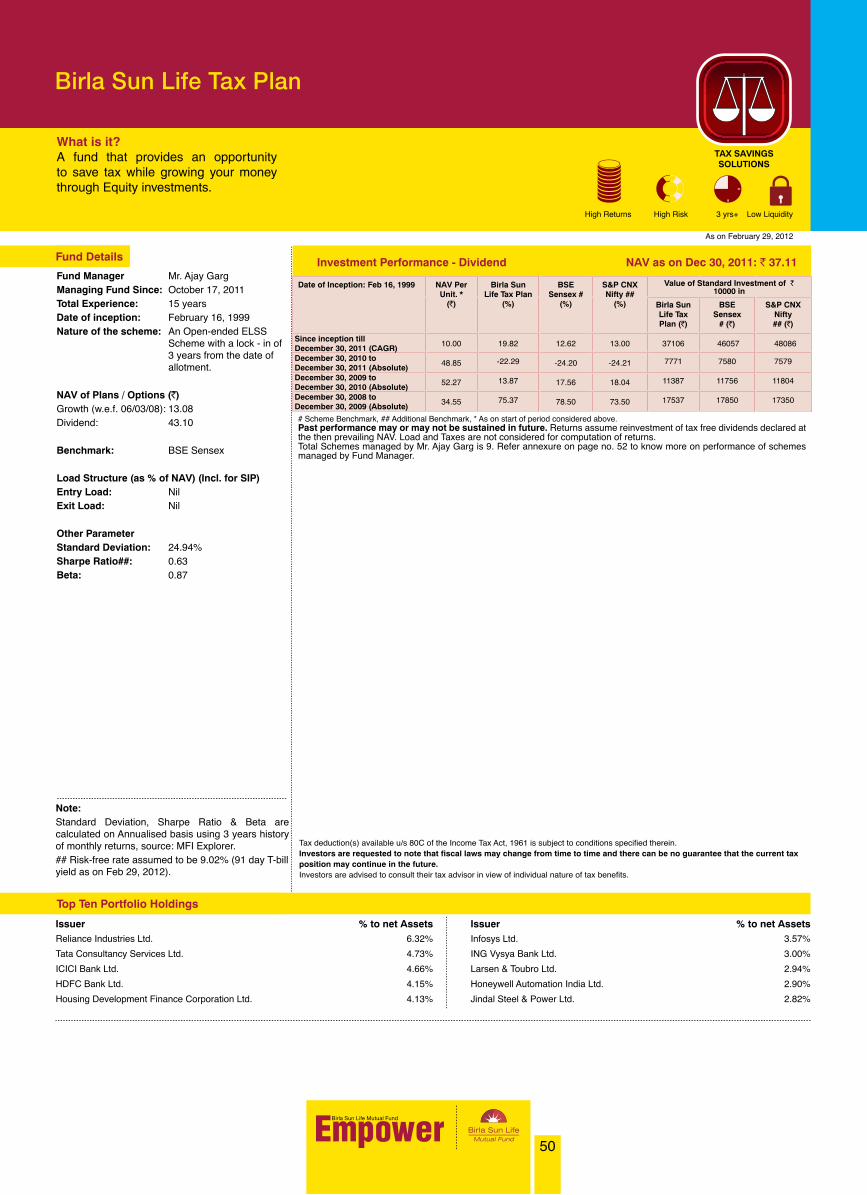
50
Birla Sun Life Tax Plan
What is it?A fund that provides an opportunity to save tax while growing your money through Equity investments.
Fund Details
As on February 29, 2012
Fund Manager Mr. Ajay GargManaging Fund Since: October 17, 2011Total Experience: 15 yearsDate of inception: February 16, 1999Nature of the scheme: An Open-ended ELSS Scheme with a lock - in of 3 years from the date of allotment.
NAV of Plans / Options (`) Growth (w.e.f. 06/03/08): 13.08 Dividend: 43.10 Benchmark: BSE Sensex
Load Structure (as % of NAV) (Incl. for SIP)Entry Load: NilExit Load: Nil Other ParameterStandard Deviation: 24.94%Sharpe Ratio##: 0.63 Beta: 0.87
TAX SAVINGSSOLUTIONS
High Returns High Risk 3 yrs+ Low Liquidity
Investment Performance - Dividend NAV as on Dec 30, 2011: ` 37.11
Date of Inception: Feb 16, 1999 NAV Per Unit. *
(`)
Birla Sun Life Tax Plan
(%)
BSE Sensex #
(%)
S&P CNX Nifty ##
(%)
Value of Standard Investment of ` 10000 in
Birla Sun Life Tax Plan (`)
BSE Sensex
# (`)
S&P CNX Nifty## (`)
Since inception till December 30, 2011 (CAGR) 10.00 19.82 12.62 13.00 37106 46057 48086
December 30, 2010 to December 30, 2011 (Absolute) 48.85 -22.29 -24.20 -24.21 7771 7580 7579
December 30, 2009 to December 30, 2010 (Absolute) 52.27 13.87 17.56 18.04 11387 11756 11804
December 30, 2008 to December 30, 2009 (Absolute) 34.55 75.37 78.50 73.50 17537 17850 17350
# Scheme Benchmark, ## Additional Benchmark, * As on start of period considered above.Past performance may or may not be sustained in future. Returns assume reinvestment of tax free dividends declared at the then prevailing NAV. Load and Taxes are not considered for computation of returns. Total Schemes managed by Mr. Ajay Garg is 9. Refer annexure on page no. 52 to know more on performance of schemes managed by Fund Manager.
Tax deduction(s) available u/s 80C of the Income Tax Act, 1961 is subject to conditions specified therein.Investors are requested to note that fiscal laws may change from time to time and there can be no guarantee that the current tax position may continue in the future.Investors are advised to consult their tax advisor in view of individual nature of tax benefits.
Issuer % to net Assets Issuer % to net AssetsReliance Industries Ltd. 6.32% Infosys Ltd. 3.57%
Tata Consultancy Services Ltd. 4.73% ING Vysya Bank Ltd. 3.00%
ICICI Bank Ltd. 4.66% Larsen & Toubro Ltd. 2.94%
HDFC Bank Ltd. 4.15% Honeywell Automation India Ltd. 2.90%
Housing Development Finance Corporation Ltd. 4.13% Jindal Steel & Power Ltd. 2.82%
Top Ten Portfolio Holdings
Note:Standard Deviation, Sharpe Ratio & Beta are calculated on Annualised basis using 3 years history of monthly returns, source: MFI Explorer.## Risk-free rate assumed to be 9.02% (91 day T-bill yield as on Feb 29, 2012).
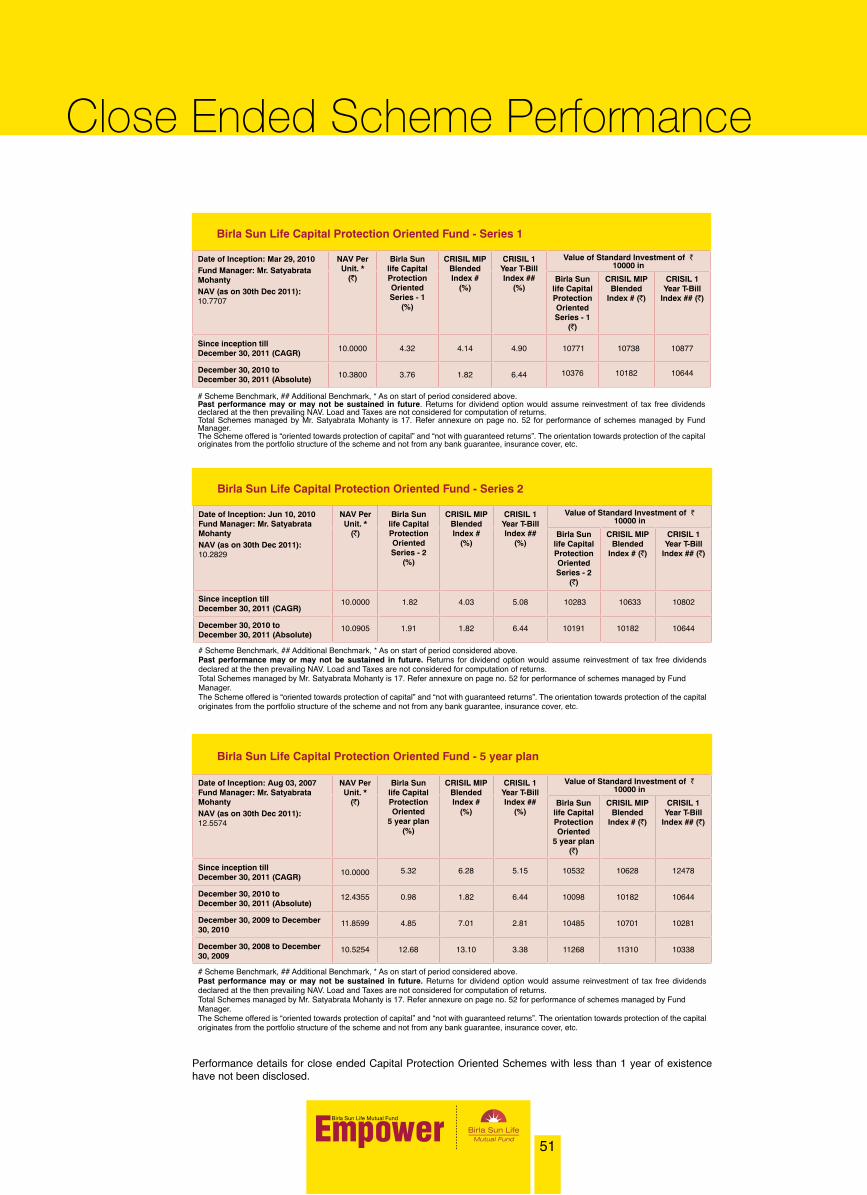
51
Close Ended Scheme Performance
Birla Sun Life Capital Protection Oriented Fund - Series 1
Date of Inception: Mar 29, 2010Fund Manager: Mr. Satyabrata Mohanty NAV (as on 30th Dec 2011): 10.7707
NAV Per Unit. *
(`)
Birla Sun life Capital Protection Oriented Series - 1
(%)
CRISIL MIP Blended Index #
(%)
CRISIL 1 Year T-Bill Index ##
(%)
Value of Standard Investment of ` 10000 in
Birla Sun life Capital Protection Oriented Series - 1
(`)
CRISIL MIP Blended
Index # (`)
CRISIL 1 Year T-Bill
Index ## (`)
Since inception till December 30, 2011 (CAGR) 10.0000 4.32 4.14 4.90 10771 10738 10877
December 30, 2010 to December 30, 2011 (Absolute) 10.3800 3.76 1.82 6.44 10376 10182 10644
# Scheme Benchmark, ## Additional Benchmark, * As on start of period considered above.Past performance may or may not be sustained in future. Returns for dividend option would assume reinvestment of tax free dividends declared at the then prevailing NAV. Load and Taxes are not considered for computation of returns.Total Schemes managed by Mr. Satyabrata Mohanty is 17. Refer annexure on page no. 52 for performance of schemes managed by FundManager. The Scheme offered is “oriented towards protection of capital” and “not with guaranteed returns”. The orientation towards protection of the capital originates from the portfolio structure of the scheme and not from any bank guarantee, insurance cover, etc.
Birla Sun Life Capital Protection Oriented Fund - 5 year plan
Date of Inception: Aug 03, 2007 Fund Manager: Mr. Satyabrata MohantyNAV (as on 30th Dec 2011): 12.5574
NAV Per Unit. *
(`)
Birla Sun life Capital Protection Oriented
5 year plan (%)
CRISIL MIP Blended Index #
(%)
CRISIL 1 Year T-Bill Index ##
(%)
Value of Standard Investment of ` 10000 in
Birla Sun life Capital Protection Oriented
5 year plan (`)
CRISIL MIP Blended
Index # (`)
CRISIL 1 Year T-Bill
Index ## (`)
Since inception till December 30, 2011 (CAGR) 10.0000 5.32 6.28 5.15 10532 10628 12478
December 30, 2010 to December 30, 2011 (Absolute)
12.4355 0.98 1.82 6.44 10098 10182 10644
December 30, 2009 to December 30, 2010
11.8599 4.85 7.01 2.81 10485 10701 10281
December 30, 2008 to December 30, 2009
10.5254 12.68 13.10 3.38 11268 11310 10338
# Scheme Benchmark, ## Additional Benchmark, * As on start of period considered above.Past performance may or may not be sustained in future. Returns for dividend option would assume reinvestment of tax free dividends declared at the then prevailing NAV. Load and Taxes are not considered for computation of returns.Total Schemes managed by Mr. Satyabrata Mohanty is 17. Refer annexure on page no. 52 for performance of schemes managed by FundManager. The Scheme offered is “oriented towards protection of capital” and “not with guaranteed returns”. The orientation towards protection of the capital originates from the portfolio structure of the scheme and not from any bank guarantee, insurance cover, etc.
Performance details for close ended Capital Protection Oriented Schemes with less than 1 year of existence have not been disclosed.
Birla Sun Life Capital Protection Oriented Fund - Series 2
Date of Inception: Jun 10, 2010 Fund Manager: Mr. Satyabrata MohantyNAV (as on 30th Dec 2011): 10.2829
NAV Per Unit. *
(`)
Birla Sun life Capital Protection Oriented Series - 2
(%)
CRISIL MIP Blended Index #
(%)
CRISIL 1 Year T-Bill Index ##
(%)
Value of Standard Investment of ` 10000 in
Birla Sun life Capital Protection Oriented Series - 2
(`)
CRISIL MIP Blended
Index # (`)
CRISIL 1 Year T-Bill
Index ## (`)
Since inception till December 30, 2011 (CAGR)
10.0000 1.82 4.03 5.08 10283 10633 10802
December 30, 2010 to December 30, 2011 (Absolute)
10.0905 1.91 1.82 6.44 10191 10182 10644
# Scheme Benchmark, ## Additional Benchmark, * As on start of period considered above.Past performance may or may not be sustained in future. Returns for dividend option would assume reinvestment of tax free dividends declared at the then prevailing NAV. Load and Taxes are not considered for computation of returns.Total Schemes managed by Mr. Satyabrata Mohanty is 17. Refer annexure on page no. 52 for performance of schemes managed by FundManager. The Scheme offered is “oriented towards protection of capital” and “not with guaranteed returns”. The orientation towards protection of the capital originates from the portfolio structure of the scheme and not from any bank guarantee, insurance cover, etc.

52
Fund Manager-wise Scheme Details
Schemes mentioned in order of performance for the period Dec 30 2010 - Dec 30 2011. Due to inherent difference in nature of schemes above (i.e. equity, hybrid, debt schemes) as may be managed by Fund Manager, performance of such schemes may not be strictly comparable.Further, performance of Fixed Term Plans (FTPs) / Fixed Maturity Plans (FMP) / Interval Income Schemes are not considered above, as FMPs / FTPs / Interval Income Schemes are close ended / interval schemes of varying maturities and performance of such schemes may not be strictly comparable with open ended schemes managed by Fund Managers.
Sr.no Funds Managed By Mr. Maneesh Dangi Refer page No
1 Birla Sun Life Medium Term Plan* 10
2 Birla Sun Life Dynamic Bond Fund* 9
3 Birla Sun Life Savings Fund 7
4 Birla Sun Life Government Securities Fund - Long Term Plan
16
5 Birla Sun Life Government Securities Fund - Short Term Plan 16
*Funds co-managed by Mr. Kaustubh GuptaFor the schemes in existence for less than a year, the past performance details have not be provided.
Sr.no Funds Managed By Mr. Mahesh Patil Refer page No
1 Birla Sun Life International Equity Fund - Plan A* 42
2 Birla Sun Life Top 100 Fund 32
3 Birla Sun Life Frontline Equity Fund 28
4 Birla Sun Life Equity Fund 25
5 Birla Sun Life Infrastructure Fund 29
*Funds co-managed by Mr. Vineet Maloo
Sr.no Funds Managed By Mr. Kaustubh Gupta Refer page No
1 Birla Sun Life Medium Term Plan$ 10
2 Birla Sun Life Floating Rate Fund - Short Term Plan* 14
3 Birla Sun Life Floating Rate Fund - Long Term Plan* 13
4 Birla Sun Life Ultra Short Term Fund# 8
5 Birla Sun Life Savings Fund$ 7
6 Birla Sun Life Cash Manager* 6
7 Birla Sun Life Cash Plus* 5*Funds co-managed by Ms. Sunaina Da Cunha# Funds co-managed by Mr. Lokesh Mallya$ Funds co-managed by Mr. Maneesh Dangi
Sr.no Funds Managed By Ms. Sunaina Da Cunha Refer page No
1 Birla Sun Life Short Term Opportunities Fund 18
2 Birla Sun Life Floating Rate Fund - Long Term Plan* 13
3 Birla Sun Life Floating Rate Fund - Short Term Plan* 14
4 Birla Sun Life Cash Manager* 65 Birla Sun Life Cash Plus* 5
*Funds co-managed by Mr. Kaustubh Gupta# Funds co-managed by Mr. Lokesh Mallya
Sr.no Funds Managed By Mr. Lokesh Mallya Refer page No
1 Birla Sun Life Short Term Opportunities Fund 18
2 Birla Sun Life Ultra Short Term Fund* 8
*Funds co-managed by Mr. Kaustubh Gupta#Funds co-managed by Ms. Sunaina Da Cunha
Sr.noFunds Managed By Mr. Satyabrata Mohanty
Refer page No
1 Birla Sun Life MIP II-Savings 5 Plan* 23
2 Birla Sun Life Capital Protection Oriented Fund - Series 1 & 2
51
3 Birla Sun Life Monthly Income* 20
4 Birla Sun Life MIP* 21
5 Birla Sun Life Asset Allocation Fund - Conservative Plan 39
6 Birla Sun Life MIP II-Wealth 25 Plan* 22
7 Birla Sun Life Asset Allocation Fund - Moderate Plan 39
8 Birla Sun Life ‘95 Fund* 38
9 Birla Sun Life Asset Allocation Fund - Aggressive Plan 39
10 Birla Sun Life Advantage Fund 26
*Funds co-managed by Mr. Nishit Dholakia
Sr.no Funds Managed By Mr. Nishit Dholakia Refer page No
1 Birla Sun Life MIP II-Savings 5 Plan* 23
2 Birla Sun Life Monthly Income* 20
3 Birla Sun Life MIP* 21
4 Birla Sun Life MIP II-Wealth 25 Plan* 22
5 Birla Sun Life ‘95 Fund* 38
6 Birla Sun Life Dividend Yield Plus 37
7 Birla Sun Life Pure Value Fund 46
*Funds co-managed by Mr. Satyabrata Mohanty
Sr.no Funds Managed By Mr. Sanjay Chawla Refer page No
1 Birla Sun Life India GenNext Fund 30
2 Birla Sun Life Small & Midcap Fund 44
3 Birla Sun Life Special Situations Fund 40
4 Birla Sun Life Midcap Fund 27
Sr.no Funds Managed By Mr. Ajay Garg Refer page No
1 Birla Sun Life Enhanced Arbitrage Fund 17
2 Birla Sun Life MNC Fund 34
3 Birla Sun Life Tax Plan 50
4 Birla Sun Life Buy India Fund 33
5 Birla Sun Life Index Fund 35
6 Birla Sun Life Tax Relief ‘96 49
Sr.no Funds Managed By Mr. Atul Penkar Refer page No
1 Birla Sun Life Commodity Equities Fund - Global Multi Commodity Plan*
41
2 Birla Sun Life Commodity Equities Fund - Global Agri Plan*
41
3 Birla Sun Life Commodity Equities Fund - Global Precious Metals Plan*
41
4 Birla Sun Life International Equity Fund - Plan B* 43
5 Birla Sun Life New Millennium Fund 31
6 Birla Sun Life Long Term Advantage Fund 47
7 Birla Sun Life India Opportunities Fund 36
*Funds co-managed by Mr. Vineet Maloo
Sr.no Funds Managed By Mr. Prasad Dhonde Refer page No
1 Birla Sun Life Gilt Plus - PF Plan 15
2 Birla Sun Life Short Term Fund 12
3 Birla Sun Life Income Plus 11
4 Birla Sun Life Gilt Plus - Liquid Plan 15
5 Birla Sun Life Gilt Plus - Regular Plan 15
Sr.no Funds Managed By Mr. Vineet Maloo Refer page No
1 Birla Sun Life International Equity Fund - Plan A# 42
2 Birla Sun Life Commodity Equities Fund - Global Multi Commodity Plan*
41
3 Birla Sun Life Commodity Equities Fund - Global Agri Plan*
41
4 Birla Sun Life Commodity Equities Fund - Global Precious Metals Plan* 41
5 Birla Sun Life International Equity Fund - Plan B* 43*Funds co-managed by Mr. Atul Penkar# Funds co-managed by Mr. Mahesh Patil
Sr.no Funds Managed By Mr. Naysar Shah Refer page No
1 Birla Sun Life India Reforms Fund 45
2 Birla Sun Life Infrastructure Fund* 29
*Funds co-managed by Mr. Mahesh Patil

53
Funds at a GlanceSAVINGS SOLUTIONS
SCHEME PLAN OPTION SUB OPTION MINIMUMINVESTMENTAMOUNT
DEFAULT OPTION EXIT LOADFor redemption-switch out consider from the date of allotment.
Birla Sun Life Cash Plus Retail Dividend Daily Dividend Reinvestment FP: ` 10,000/-
Application forDefault
Plan Option /Facility
< ` 1 Cr Retail Dividend Reinvstmt
> ` 1 Cr but Institutional Daily Dividend< ` 5 Crs Reinvstmt> ` 5 Crs Institutional Daily Dividend
Premium Reinvstmt
Nil.
Retail Growth AP: ` 1,000/-
Institutional Dividend Daily Dividend Reinvestment
Weekly Dividend Payout / Reinvestment FP: ` 1,00,00,000/-
Institutional Growth AP: ` 1,00,000/-
Institutional Premium - Dividend Daily Dividend Payout / Reinvestment
Weekly Dividend Payout / Reinvestment FP: ` 5,00,00,000/-
Dividend Payout / Reinvestment AP: ` 1,00,000/-
Institutional Premium – Growth
Birla Sun Life Cash Manager Dividend Daily Dividend Reinvestment FP: ` 10,000/-
Application forDefault
Plan Option /Facility
< ` 1 Cr DividendWeekly
Dividend Reinvstmt
> ` 1 Cr Institutional Daily Dividend Reinvstmt
Nil.
Weekly Dividend Reinvestment AP: ` 1,000/-
Institutional Daily DividendWeekly Dividend
Growth
ReinvestmentReinvestment
FP: ` 100,00,000/-AP: ` 1,00,000/-
GrowthFP: ` 10,000/-AP: ` 1,000/-
Birla Sun Life Savings FundInstitutional Plan
Daily DividendWeekly Dividend
Growth
ReinvestmentPayout / Reinvestment
FP: ` 1,00,00,000/-AP: ` 1,00,000/- Application for
DefaultPlan Option /Facility
< ` 1 Cr RetailWeekly
Dividend Reinvstmt
> ` 1 Cr Institutional Daily Dividend Reinvstmt
Nil.
Retail PlanFP: ` 10,000/-AP: ` 1,000/-
Birla Sun Life Ultra Short Term Fund
Institutional Plan
Daily DividendFortnightly Dividend
Weekly DividendGrowth
ReinvestmentPayout / ReinvestmentPayout / Reinvestment
FP: ` 2,00,00,000/-AP: ` 10,000/- Application for
DefaultPlan Option /Facility
< ` 2 Crs Retail Fortnightly Dividend
> ` 2 Crs Institutional Reinvstmt
within 15 days/0.25% of applicable NAV.
Retail PlanDaily Dividend
Fortnightly DividendGrowth
ReinvestmentPayout / Reinvestment
FP: ` 10,000/-AP: ` 1,000/-
Birla Sun Life Dynamic Bond Fund
Retail Plan Monthly Dividend Sweep FP: ` 5,00,000/- AP: ` 1,000/-
• Choice of Option : Quarterly Dividend• Choice of Sub-Option : Dividend Reinvestment
Within 180 days: 0.50% of applicable NAV. After 180 days: Nil. (w.e.f. February 01, 2012)
Monthly Dividend Payout / Reinvestment /Sweep FP: ` 5,000/- AP: ` 1,000/-
Quarterly Dividend Payout / Reinvestment /Sweep FP: ` 5,000/- AP: ` 1,000/-
Growth FP: ` 5,000/- AP: ` 1,000/-
Birla Sun Life Medium Term PlanInstitutional Plan Weekly Dividend
Fortnightly DividendMonthly Dividend
Growth
ReinvestmentPayout / Reinvestment
Payout / Reinvestment /Sweep
FP: ` 1,00,00,000/-AP: ` 10,000/-
• Choice of Plan : Retail• Choice of Option : Growth• Choice of Facility : Fortnightly Dividend Reinvestment
within 90 days /0.25% of applicable NAV.
Retail PlanFP: ` 5,000/-AP: ` 1,000/-
Birla Sun Life Floating Rate Fund
Short Term Plan
Institutional
Daily Dividend ReinvestmentWeekly Dividend Reinvestment
Growth
FP: ` 1,00,00,000/-AP: ` 1/- Application for
DefaultPlan Option /Facility
< ` 5 Crs Daily Dividend Reinvstmt
> ` 5 Crs Institutional Daily DividendReinvstmt
Nil.
Weekly DividendDaily Dividend
Growth
ReinvestmentReinvestment
FP: ` 5,000/-AP: ` 1,000/-
Long Term Plan
Retail PlanWeekly Dividend Reinvestment
Growth
FP: ` 5,000/-AP: ` 1,000/-
Daily Dividend Reinvestment. Nil.
Institutional Plan
Daily Dividend ReinvestmentWeekly Dividend Reinvestment
Growth
FP: ` 2,00,00,000/-AP: ` 1,00,000/-
Birla Sun Life Income Plus DividendGrowth
Payout / Reinvestment FP: ` 5,000/-AP: ` 1,000/-
Dividend Reinvestmentwithin 365 days/1.00% of applicable NAV.
Birla Sun Life Short Term Fund(Erstwhile Birla Sun Life Income Fund)
Monthly Dividend Payout/Reinvestment/Sweep
FP: ` 5,000/-AP: ` 1,000/-
Dividend Reinvestmentwithin 30 days/0.50% of applicable NAV.
Growth
Birla Sun Life Gilt PlusRegular Plan
Quarterly DividendGrowth
Payout / Reinvestment /Sweep
FP: ` 5,000/-AP: ` 1,000/-
Growth
For Liquid Plan, Regular Plan & PF Plan (Quarterly/Annual Div) Nil For PF Plan (Growth) within 365 days/1% of applicable NAV.
Liquid PlanQuarterly DividendAnnual Dividend
Growth
Payout / Reinvestment /SweepPayout / Reinvestment /Sweep
PF PlanQuarterly Dividend
GrowthPayout / Reinvestment /SweepQuarterly Gain / Annual Gain
The Financial Solution(s) stated above is ONLY for highlighting the many advantages perceived from investments in Mutual Funds but does not in any manner, indicate or imply, either the quality of any particular Scheme or guarantee any specific performance/returns.
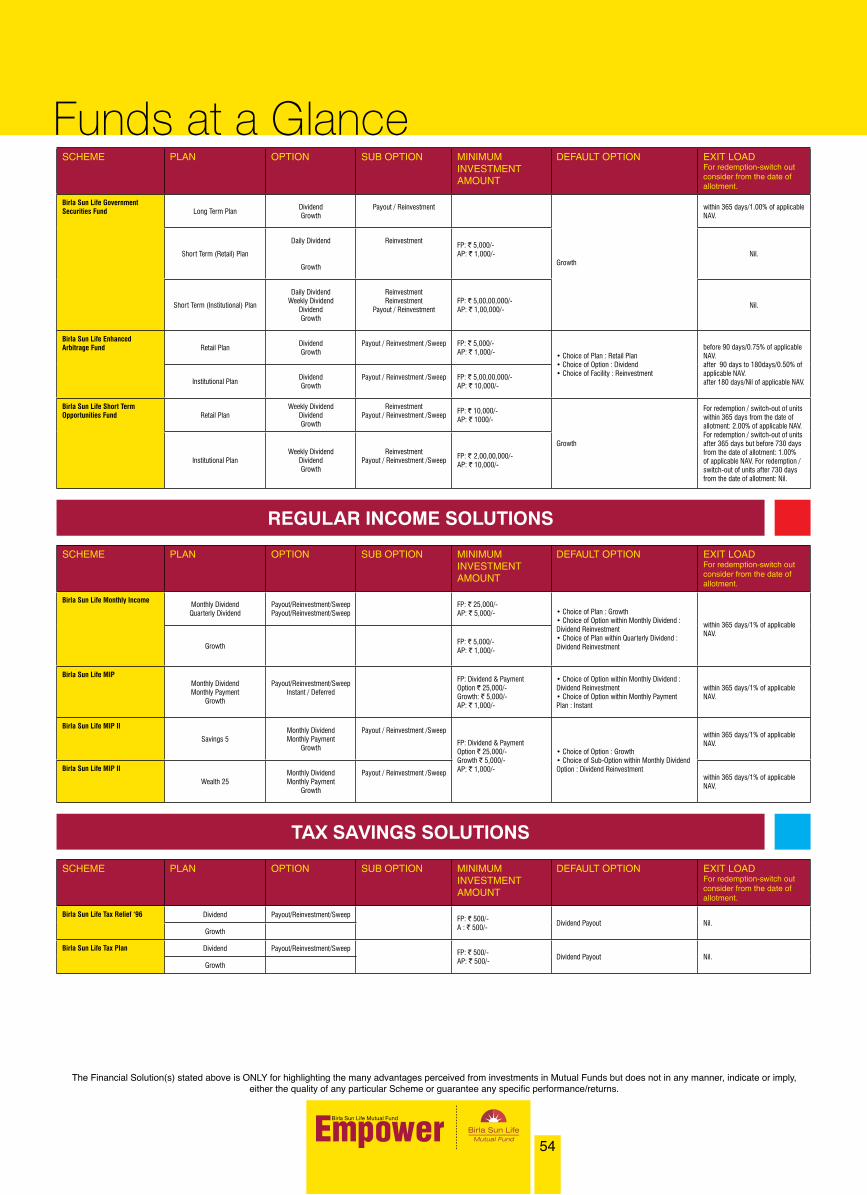
54
Funds at a Glance
REGULAR INCOME SOLUTIONS
SCHEME PLAN OPTION SUB OPTION MINIMUMINVESTMENTAMOUNT
DEFAULT OPTION EXIT LOADFor redemption-switch out consider from the date of allotment.
Birla Sun Life Government Securities Fund Long Term Plan
DividendGrowth
Payout / Reinvestment
Growth
within 365 days/1.00% of applicable NAV.
Short Term (Retail) Plan
Daily Dividend
Growth
ReinvestmentFP: ` 5,000/-AP: ` 1,000/- Nil.
Short Term (Institutional) Plan
Daily DividendWeekly Dividend
DividendGrowth
ReinvestmentReinvestment
Payout / ReinvestmentFP: ` 5,00,00,000/-AP: ` 1,00,000/-
Nil.
Birla Sun Life Enhanced Arbitrage Fund Retail Plan
DividendGrowth
Payout / Reinvestment /Sweep FP: ` 5,000/-AP: ` 1,000/- • Choice of Plan : Retail Plan
• Choice of Option : Dividend• Choice of Facility : Reinvestment
before 90 days/0.75% of applicable NAV.after 90 days to 180days/0.50% of applicable NAV.after 180 days/Nil of applicable NAV.Institutional Plan
DividendGrowth
Payout / Reinvestment /Sweep FP: ` 5,00,00,000/-AP: ` 10,000/-
Birla Sun Life Short Term Opportunities Fund Retail Plan
Weekly DividendDividendGrowth
ReinvestmentPayout / Reinvestment /Sweep
FP: ` 10,000/-AP: ` 1000/-
Growth
For redemption / switch-out of units within 365 days from the date of allotment: 2.00% of applicable NAV. For redemption / switch-out of units after 365 days but before 730 days from the date of allotment: 1.00% of applicable NAV. For redemption / switch-out of units after 730 days from the date of allotment: Nil.
Institutional PlanWeekly Dividend
DividendGrowth
ReinvestmentPayout / Reinvestment /Sweep
FP: ` 2,00,00,000/-AP: ` 10,000/-
SCHEME PLAN OPTION SUB OPTION MINIMUMINVESTMENTAMOUNT
DEFAULT OPTION EXIT LOADFor redemption-switch out consider from the date of allotment.
Birla Sun Life Monthly IncomeMonthly DividendQuarterly Dividend
Payout/Reinvestment/SweepPayout/Reinvestment/Sweep
FP: ` 25,000/-AP: ` 5,000/- • Choice of Plan : Growth
• Choice of Option within Monthly Dividend : Dividend Reinvestment• Choice of Plan within Quarterly Dividend : Dividend Reinvestment
within 365 days/1% of applicable NAV.
GrowthFP: ` 5,000/-AP: ` 1,000/-
Birla Sun Life MIPMonthly DividendMonthly Payment
Growth
Payout/Reinvestment/SweepInstant / Deferred
FP: Dividend & Payment Option ` 25,000/- Growth: ` 5,000/-AP: ` 1,000/-
• Choice of Option within Monthly Dividend : Dividend Reinvestment• Choice of Option within Monthly Payment Plan : Instant
within 365 days/1% of applicable NAV.
Birla Sun Life MIP II
Savings 5Monthly DividendMonthly Payment
Growth
Payout / Reinvestment /Sweep
FP: Dividend & Payment Option ` 25,000/-Growth ` 5,000/-AP: ` 1,000/-
• Choice of Option : Growth• Choice of Sub-Option within Monthly DividendOption : Dividend Reinvestment
within 365 days/1% of applicable NAV.
Birla Sun Life MIP II
Wealth 25Monthly DividendMonthly Payment
Growth
Payout / Reinvestment /Sweepwithin 365 days/1% of applicable NAV.
TAX SAVINGS SOLUTIONS
SCHEME PLAN OPTION SUB OPTION MINIMUMINVESTMENTAMOUNT
DEFAULT OPTION EXIT LOADFor redemption-switch out consider from the date of allotment.
Birla Sun Life Tax Relief ‘96 Dividend Payout/Reinvestment/Sweep FP: ` 500/-A : ` 500/-
Dividend Payout Nil.Growth
Birla Sun Life Tax Plan Dividend Payout/Reinvestment/Sweep FP: ` 500/-AP: ` 500/-
Dividend Payout Nil.Growth
The Financial Solution(s) stated above is ONLY for highlighting the many advantages perceived from investments in Mutual Funds but does not in any manner, indicate or imply, either the quality of any particular Scheme or guarantee any specific performance/returns.

55
Funds at a Glance
SCHEME PLAN OPTION SUB OPTION MINIMUMINVESTMENTAMOUNT
DEFAULT OPTION EXIT LOADFor redemption-switch out consider from the date of allotment.
Birla Sun Life Equity Fund Dividend Payout/Reinvestment/Sweep FP: ` 5,000/-AP: ` 1,000/- Dividend Reinvestment
within 365 days/1% of applicable NAV.Growth
Birla Sun Life Advantage Fund Dividend Payout/Reinvestment/Sweep FP: ` 5,000/-AP: ` 1,000/- Dividend Reinvestment
within 7 days/0.50% of applicable NAV.Growth
Birla Sun Life Midcap Fund Dividend
Growth
Dividend / Reinvestment / Sweep
FP: ` 5,000/-AP: ` 1,000/-
Dividend Reinvestmentwithin 365 days/1% of applicable NAV.Growth with Triggered
Facility
Birla Sun Life Frontline Equity Fund
DividendGrowth
Dividend / Growth / Sweep FP: ` 5,000/-AP: ` 1,000/-
Dividend Reinvestmentwithin 365 days/1% of applicable NAV.
Birla Sun Life Infrastructure Fund DividendGrowth
Dividend / Growth / Sweep FP: ` 5,000/-AP: ` 1,000/-
Dividend Reinvestmentwithin 365 days/1% of applicable NAV.
Birla Sun Life India GenNext Fund
Dividend Payout/Reinvestment/Sweep FP: ` 5,000/-AP: ` 1,000/-
Dividend Reinvestmentwithin 365 days/1% of applicable NAV.Growth
Birla Sun Life New Millennium Fund
Dividend Payout/Reinvestment/Sweep FP: ` 5,000/-AP: ` 1,000/-
Dividend Reinvestmentwithin 365 days/1% of applicable NAV.Growth
Birla Sun Life Top 100 Fund Dividend Payout/Reinvestment/Sweep FP: ` 5,000/-AP: ` 1,000/-
Dividend Reinvestmentwithin 7 days/0.50% of applicable NAV.Growth
Birla Sun Life Buy India Fund Dividend Payout/Reinvestment/Sweep FP: ` 5,000/-AP: ` 1,000/-
Dividend Reinvestmentwithin 7 days/0.50% of applicable NAV.Growth
Birla Sun Life MNC Fund Dividend Payout/Reinvestment/Sweep FP: ` 5,000/-AP: ` 1,000/-
Dividend Reinvestmentwithin 365 days/1% of applicable NAV.Growth
Birla Sun Life Index Fund Dividend Payout/Reinvestment/Sweep FP: ` 5,000/-AP: ` 1,000/-
Dividend Reinvestmentwithin 7 days/0.50% of applicable NAV.Growth
Birla Sun Life India Opportunities Fund
Dividend Payout/Reinvestment/Sweep FP: ` 5,000/-AP: ` 1,000/-
Dividend Reinvestmentwithin 7 days/0.50% of applicable NAV.Growth
Birla Sun Life Small & Midcap Fund
Dividend Payout / Reinvestment FP: ` 5,000/-AP : ` 1,000/-
Dividend Payoutwithin 365 days/1% of applicable NAV.Growth
Birla Sun Life India Reforms Fund
Dividend Payout / Reinvestment FP: ` 5,000/-AP : ` 1,000/-
Dividend Reinvestment within 1 year/1% of applicable NAV.Growth
Birla Sun Life Dividend Yield Plus Dividend Payout/Reinvestment/Sweep
Payout / Reinvestment /SweepFP: ` 5,000/-AP: ` 1,000/-
Dividend Reinvestmentwithin 365 days/1% of applicable NAV.Growth
PFDividendGrowth
Birla Sun Life ‘95 Fund Dividend Payout/Reinvestment/Sweep FP: ` 5,000/-AP: ` 1,000/-
Dividend Reinvestmentwithin 365 days/1% of applicable NAV.Growth
Birla Sun Life Asset Allocation Fund Aggressive
DividendGrowth
Payout / Reinvestment
FP: ` 5,000/-AP: ` 1,000/-
Dividend Reinvestment Nil.ModerateDividendGrowth
Payout / Reinvestment
ConservativeDividendGrowth
Payout / Reinvestment
Birla Sun Life Special Situations Fund
Dividend Payout/Reinvestment/Sweep FP: ` 5,000/-AP: ` 1,000/-
• Choice of Plan : Growth• Choice of Option : Reinvestment
within 365 days/1% of applicable NAV.Growth
Birla Sun Life Commod-ity Equities Fund (Global Agri Plan,Global Precious Metals Plan,Global Multi Commodity Plan)
Retail PlanDividendGrowth
Payout / Reinvestment /Sweep FP: ` 5,000/-AP: ` 1,000/- • Choice of Plan : Retail Plan
• Choice of Option : Growth• Choice of Facility : Reinvestment
within 30 days/3% of applicable NAV.after 30 days but before 365 days/1% of applicable NAV.Institutional Plan
DividendGrowth
Payout / Reinvestment /Sweep FP: ` 5,00,00,000/-AP: ` 10,000/-
Birla Sun Life International Equity Fund (Plan A)
Dividend Payout/Reinvestment/Sweep FP: ` 5,000/-AP: ` 1,000/-
Dividend Reinvestment Nil.Growth
Birla Sun Life International Equity Fund (Plan B)
Dividend Payout/Reinvestment/Sweep FP: ` 5,000/-AP: ` 1,000/-
Dividend Reinvestmentwithin 365 days/1% of applicable NAV.Growth
Birla Sun Life Pure Value Fund Dividend Payout/ReinvestmentFP : ` 5,000/-AP : ` 1,000/-
• Choice of Plan : Growth• Choice of Option : Reinvestment
within 365 days/1% of applicable NAV.
Growth
Birla Sun Life Long Term Advantage Fund
Dividend Payout/Reinvestment FP: ` 5,000/-AP: ` 1,000/-
Dividend Reinvestmentwithin 365 days/1% of applicable NAV.Growth
WEALTH CREATION SOLUTIONS
The Financial Solution(s) stated above is ONLY for highlighting the many advantages perceived from investments in Mutual Funds but does not in any manner, indicate or imply, either the quality of any particular Scheme or guarantee any specific performance/returns.

56
Investment ObjectiveSAVINGS SOLUTIONS
Birla Sun Life Cash Plus An Open-ended liquid scheme with the objective to provide reasonable returns at a high level of safety and liquidity through judicious investments in high quality debt and money market instruments.
Birla Sun Life Cash Manager An Open ended Income scheme with the objective to provide income which is consistent with a portfolio through investments in a basket of debt and money market instruments of very short maturities with a view to provide reasonable returns.
Birla Sun Life Savings Fund The primary objective of the schemes is to generate regular income through investments in debt and money market instruments. Income maybe generated through the receipt of coupon payments or the purchase and sale of securities in the underlying portfolio. The schemes will under normal market conditions, invest its net assets in fixed income securities, money market instruments, cash and cash equivalents.
Birla Sun Life Ultra Short Term Fund An Open-ended short term income scheme with the objective to generate income and capital appreciation by investing 100% of the corpus in a diversified portfolio of debt and money market securities with relatively low levels of interest rate risk.
Birla Sun Life Dynamic Bond Fund An Open-ended income scheme with the objective to generate optimal returns with high liquidity through active management of the portfolio by investing in high quality debt and money market instruments.
Birla Sun Life Medium Term Plan The primary investment objective of the Scheme is to generate regular income through investments in debt & money market instruments in order to make regular dividend payments to unit holders & secondary objective is growth of capital.
Birla Sun Life Income Plus An Open-ended Income Scheme to generate consistent income through superior yields on its investments at moderate levels of risk through a diversified investment approach. This income may be complemented by price changes of instruments in the portfolio.
Birla Sun Life Short Term Fund(Erstwhile Birla Sun Life Income Fund) Name change (w.e.f. 01 Feb, 2012)
An Open-ended income scheme with the objective to generate income and capital appreciation by investing 100% of the corpus in a diversified portfolio of debt and money market securities.
Birla Sun Life Floating Rate Fund Short Term Plan
The primary objective of the schemes is to generate regular income through investment in a portfolio comprising substantially of floating rate debt / money market instruments. The schemes may invest a portion of its net assets in fixed rate debt securities and money market instruments.
Birla Sun Life Gilt Plus An Open - ended government securities scheme with the objective to generate income and capital appreciation through investments exclusively in Government Securities.
Birla Sun Life Government Securities Fund
An Open-ended Gilt scheme with the objective to provide investors current income consistent with a portfolio invested 100% in securities issued by the Government of India or the State Governments, and the secondary objective is capital appreciation.
Birla Sun Life Enhanced Arbitrage Fund
An Open ended Equity Scheme with an investment objective to generate income by investing predominantly in equity and equity related instruments. Scheme intends to take advantage from the price differentials / mis-pricing prevailing for stock / index in various market segments (Cash & Futures).
Birla Sun Life Short Term Opportunties Fund
An Open ended Income scheme with the objective to generate regular income by investing primarily in investment grade fixed income securities / money market instruments with short to medium term maturities and across the credit spectrum within the universe of investment grade rating.
REGULAR INCOME SOLUTIONS
Birla Sun Life Monthly Income An Open-ended income scheme with the primary investment objective to generate regular income so as to make monthly and quarterly distributions to Unit holders and the secondary objective as growth of capital. Monthly income is not assured and is subject to availability of distributable surplus
Birla Sun Life MIP The primary objective of the scheme is to generate regular income so as to make monthly distributions to unit holders with the secondary objective being growth of capital. Income may be generated through the receipt of coupon payments, the amortization of the discount on debt instruments, receipt of dividends or the purchase and sale of securities in the underlying portfolio. The schemes will under normal market conditions, invest its net assets primarily in fixed income securities, money market instruments, cash and cash equivalents while at the same time maintaining a small exposure to equity markets. (Monthly income is not assured and is subject to availability of distributable surplus.)
Birla Sun Life MIP II - Wealth 25 Plan
An Open-ended income scheme with the objective to generate regular income so as to make monthly payment or distribution to unit holders with the secondary objective being growth of capital. Monthly Income is not assured and is subject to availability of distributable surplus.
Birla Sun Life MIP II - Savings 5 Plan
An Open-ended income scheme with the objective to generate regular income so as to make monthly payment or distribution to unit holders with the secondary objective being growth of capital. Monthly Income is not assured and is subject to availability of distributable surplus.
TAX SAVINGS SOLUTIONS
Birla Sun Life Tax Relief ‘96 An Open-ended equity linked savings scheme (ELSS) with the objective of long term growth of capital through a portfolio with a target allocation of 80% equity, 20% debt and money market securities
Birla Sun Life Tax Plan An Open-ended Equity Linked Savings Scheme (ELSS) with the objective to achieve long-term growth of capital along with income tax relief for investment.
The Financial Solution(s) stated above is ONLY for highlighting the many advantages perceived from investments in Mutual Funds but does not in any manner, indicate or imply, either the quality of any particular Scheme or guarantee any specific performance/returns.

57
Investment Objective
Birla Sun Life Equity Fund An Open-ended growth scheme with the objective of long term growth of capital, through a portfolio with a target allocation of 90% equity and 10% debt and money market securities.
Birla Sun Life Advantage Fund An Open-ended growth scheme with the objective to achieve long-term growth of capital at relatively moderate levels of risk through a diversified research based investment approach.
Birla Sun Life Midcap Fund An Open ended Growth Scheme with the objective to achieve long term growth of capital at controlled level of risk by investing primarily in ‘Mid-Cap’ Stocks. The level of risk is somewhat higher than a fund focused on large and liquid stocks. Concomitantly, the aim is to generate higher returns than a fund focused on large and liquid stocks.
Birla Sun Life Frontline Equity Fund An Open-ended growth scheme with the objective of long term growth of capital, through a portfolio with a target allocation of 100% equity by aiming at being as diversified across various industries and or sectors as its chosen benchmark index, BSE 200.
Birla Sun Life Infrastructure Fund An Open-ended growth scheme with the objective to providing for medium to long-term capital appreciation by investing predominantly in a diversified portfolio of equity and equity related securities of companies that are participating in the growth and development of Infrastructure in India.
Birla Sun Life India GenNext Fund An Open-ended growth scheme with the objective to target growth of capital by investing in equity/equity related instruments of companies that are expected to benefit from the rising consumption patterns in India, which in turn is getting fuelled by high disposable incomes of the young generation (Generation Next). The scheme will invest in companies that have the following characteristics: 1. Companies that seek growth in revenues arising out of demand from the younger generation (GenNext) for their products or services. 2. They should be engaged in manufacturing of products or rendering of services that go directly to the consumer. 3. The products and services should have distinct brand identity, thereby enabling choice.
Birla Sun Life New Millennium Fund A multi-sector open-ended growth scheme with the objective of long term growth of capital, through a portfolio with a target allocation of 100% equity, focusing on investing in technology and technology dependent companies, hardware, peripherals and components, software, telecom, media, internet and e-commerce and other technology enabled companies. The secondary objective is income generation and distribution of dividend.
Birla Sun Life Top 100 Fund An Open-ended growth scheme with the objective to provide medium to long term capital appreciation, by investing predominantly in a diversified portfolio of equity and equity related securities of top 100 companies as measured by market capitalization.
Birla Sun Life Buy India Fund A multi-sector open-ended growth scheme with the objective of long term growth of capital, through a portfolio with a target allocation of 100% equity, focusing on investing in businesses that are driven by India’s large population and inherent consumption patterns. The focus of the scheme will be in the consumer and healthcare sectors. The secondary objective is income generation and distribution of dividend.
Birla Sun Life MNC Fund An Open-ended growth scheme with the objective to achieve long-term growth of capital at relatively moderate levels of risk by making investments in securities of multi-national companies through a research based investment approach.
Birla Sun Life Index Fund An Open-ended index-linked growth scheme with the objective to generate returns commensurate with the performance of Nifty subject to tracking errors.
Birla Sun Life India Opportunities Fund An Open ended Growth Scheme with the objective to achieve superior long-term growth of capital by investing in shares of companies that do one or more of the following: 1. Leverage India’s intellectual capital for providing services, research and creative inputs. 2. Seek to use current and impending changes in patent laws / import tariffs / quotas to supply goods and services. 3. Leverage India’s lower labour costs for providing services and manufactured goods. 4. Leverage India’s large population of English speaking people for providing services.
Birla Sun Life Dividend Yield Plus An Open-ended growth scheme with the objective to provide capital growth and income by investing primarily in a well-diversified portfolio of dividend paying companies that have a relatively high dividend yield.
Birla Sun Life ‘95 Fund An Open ended Balanced Scheme with the objective to generate long term growth of capital and current income, through a portfolio with a target allocation of 60% equity and 40% debt and money market securities. The secondary objective is income generation and distribution of dividend.
Birla Sun Life Asset Allocation Fund An Open-ended Fund of Funds scheme with the objective to provide income and capital appreciation along with diversification by investing in a basket of debt and equity Mutual Fund schemes in line with the risk profile of the investors.
Birla Sun Life Special Situations Fund An Open-ended diversified equity scheme with an objective of the scheme is to generate long-term growth of capital by investing in a portfolio of equity and equity related securities. The Scheme would follow an investment strategy that would take advantage of Special Situations & Contrarian investment style.
Birla Sun Life Commodity Equities Fund
An Open ended Growth Scheme with the objective to offer long term growth of capital, by investing in (1) stocks of commodity companies, i.e., companies engaged in or focusing on the specified commodity business and/or (2) overseas mutual fund scheme(s), that have similar investment objectives. These securities could be issued in India or overseas.
Birla Sun Life International Equity Fund - Plan A
An Open-ended diversified equity scheme with an objective to generate long-term growth of capital, by investing predominantly in a diversified portfolio of equity and equity related securities in the international markets.
Birla Sun Life International Equity Fund - Plan B
An Open-ended diversified equity scheme with an objective to generate long-term growth of capital, by investing predominantly in a diversified portfolio of equity and equity related securities in the domestic and international markets.
Birla Sun Life Small & Midcap Fund An Open ended Small and Mid Cap Equity Scheme with an objective to generate consistent long-term capital appreciation by investing predominantly in equity and equity related securities of companies considered to be small and midcap. The Scheme may also invest a certain portion of its corpus in fixed income securities including money market instruments, in order to meet liquidity requirements from time to time.
Birla Sun Life India Reforms Fund An Open ended Equity Scheme with an investment objective is to generate growth and capital appreciation by building a portfolio of companies that are expected to benefit from the economic reforms, PSU divestment and increased government spending.
Birla Sun Life Pure Value Fund An Open ended Diversified Equity Scheme with the objective to generate consistent long-term capital appreciation by investing predominantly in equity and equity related securities by following value investing strategy.
Birla Sun Life Long Term Advantage Fund
An Open ended Diversified Equity Scheme with an to provide long-term capital appreciation, by investing predominantly in a diversified portfolio of equity and equity related securities.
WEALTH CREATION SOLUTIONS
The Financial Solution(s) stated above is ONLY for highlighting the many advantages perceived from investments in Mutual Funds but does not in any manner, indicate or imply, either the quality of any particular Scheme or guarantee any specific performance/returns.
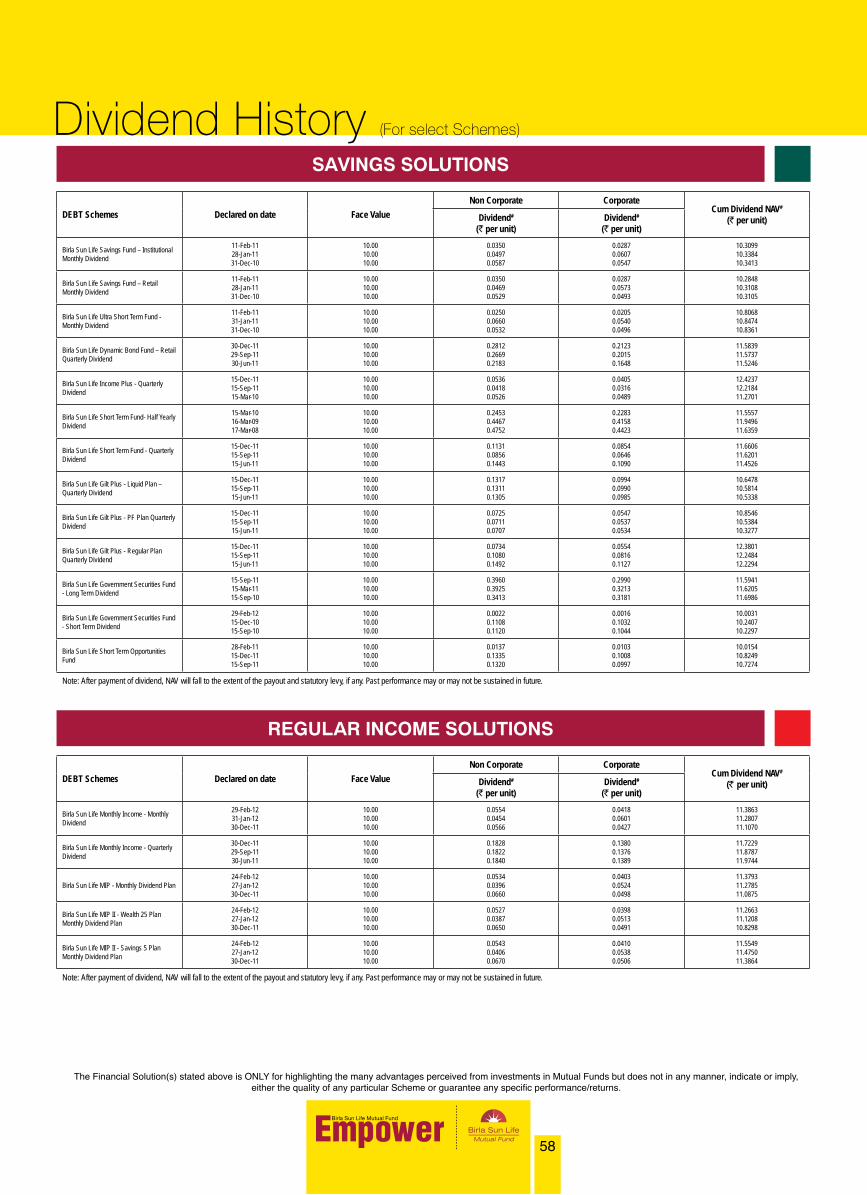
58
Dividend History (For select Schemes)
SAVINGS SOLUTIONS
DEBT Schemes Declared on date Face Value
Non Corporate CorporateCum Dividend NAV#
(` per unit)Dividend#
(` per unit)Dividend#
(` per unit)
Birla Sun Life Savings Fund – Institutional Monthly Dividend
11-Feb-1128-Jan-1131-Dec-10
10.0010.0010.00
0.03500.04970.0587
0.02870.06070.0547
10.309910.338410.3413
Birla Sun Life Savings Fund – Retail Monthly Dividend
11-Feb-1128-Jan-1131-Dec-10
10.0010.0010.00
0.03500.04690.0529
0.02870.05730.0493
10.284810.310810.3105
Birla Sun Life Ultra Short Term Fund - Monthly Dividend
11-Feb-1131-Jan-1131-Dec-10
10.0010.0010.00
0.02500.06600.0532
0.02050.05400.0496
10.806810.847410.8361
Birla Sun Life Dynamic Bond Fund – Retail Quarterly Dividend
30-Dec-1129-Sep-1130-Jun-11
10.0010.0010.00
0.28120.26690.2183
0.21230.20150.1648
11.583911.573711.5246
Birla Sun Life Income Plus - Quarterly Dividend
15-Dec-1115-Sep-1115-Mar-10
10.0010.0010.00
0.05360.04180.0526
0.04050.03160.0489
12.423712.218411.2701
Birla Sun Life Short Term Fund- Half Yearly Dividend
15-Mar-1016-Mar-0917-Mar-08
10.0010.0010.00
0.24530.44670.4752
0.22830.41580.4423
11.555711.949611.6359
Birla Sun Life Short Term Fund - Quarterly Dividend
15-Dec-1115-Sep-1115-Jun-11
10.0010.0010.00
0.11310.08560.1443
0.08540.06460.1090
11.660611.620111.4526
Birla Sun Life Gilt Plus - Liquid Plan – Quarterly Dividend
15-Dec-1115-Sep-1115-Jun-11
10.0010.0010.00
0.13170.13110.1305
0.09940.09900.0985
10.647810.581410.5338
Birla Sun Life Gilt Plus - PF Plan Quarterly Dividend
15-Dec-1115-Sep-1115-Jun-11
10.0010.0010.00
0.07250.07110.0707
0.05470.05370.0534
10.854610.538410.3277
Birla Sun Life Gilt Plus - Regular Plan Quarterly Dividend
15-Dec-1115-Sep-1115-Jun-11
10.0010.0010.00
0.07340.10800.1492
0.05540.08160.1127
12.380112.248412.2294
Birla Sun Life Government Securities Fund - Long Term Dividend
15-Sep-1115-Mar-1115-Sep-10
10.0010.0010.00
0.39600.39250.3413
0.29900.32130.3181
11.594111.620511.6986
Birla Sun Life Government Securities Fund - Short Term Dividend
29-Feb-1215-Dec-1015-Sep-10
10.0010.0010.00
0.00220.11080.1120
0.00160.10320.1044
10.003110.240710.2297
Birla Sun Life Short Term Opportunities Fund
28-Feb-1115-Dec-1115-Sep-11
10.0010.0010.00
0.01370.13350.1320
0.01030.10080.0997
10.015410.824910.7274
Note: After payment of dividend, NAV will fall to the extent of the payout and statutory levy, if any. Past performance may or may not be sustained in future.
REGULAR INCOME SOLUTIONS
DEBT Schemes Declared on date Face Value
Non Corporate CorporateCum Dividend NAV#
(` per unit)Dividend#
(` per unit)Dividend#
(` per unit)
Birla Sun Life Monthly Income - Monthly Dividend
29-Feb-1231-Jan-1230-Dec-11
10.0010.0010.00
0.05540.04540.0566
0.04180.06010.0427
11.386311.280711.1070
Birla Sun Life Monthly Income - Quarterly Dividend
30-Dec-1129-Sep-1130-Jun-11
10.0010.0010.00
0.18280.18220.1840
0.13800.13760.1389
11.722911.878711.9744
Birla Sun Life MIP - Monthly Dividend Plan24-Feb-1227-Jan-1230-Dec-11
10.0010.0010.00
0.05340.03960.0660
0.04030.05240.0498
11.379311.278511.0875
Birla Sun Life MIP II - Wealth 25 Plan Monthly Dividend Plan
24-Feb-1227-Jan-1230-Dec-11
10.0010.0010.00
0.05270.03870.0650
0.03980.05130.0491
11.266311.120810.8298
Birla Sun Life MIP II - Savings 5 Plan Monthly Dividend Plan
24-Feb-1227-Jan-1230-Dec-11
10.0010.0010.00
0.05430.04060.0670
0.04100.05380.0506
11.554911.475011.3864
Note: After payment of dividend, NAV will fall to the extent of the payout and statutory levy, if any. Past performance may or may not be sustained in future.
The Financial Solution(s) stated above is ONLY for highlighting the many advantages perceived from investments in Mutual Funds but does not in any manner, indicate or imply, either the quality of any particular Scheme or guarantee any specific performance/returns.

59
Dividend History (For select Schemes)
EQUITY SCHEMES Declared on date Dividend# (` per unit) Face value (`) Cum Dividend NAV (` per unit)
Birla Sun Life Equity Fund20-May-1115-Oct-1012-Mar-10
3.005.005.00
10.0010.0010.00
65.6982.3674.69
Birla Sun Life Advantage Fund04-Feb-1106-Aug-1026-Feb-09
4.507.006.25
10.0010.0010.00
81.1793.3988.77
Birla Sun Life Midcap Fund14-Jan-1116-Jul-1029-Jan-10
2.001.502.50
10.0010.0010.00
24.2926.0126.02
Birla Sun Life Frontline Equity Fund04-Feb-1106-Aug-1029-Jan-10
1.251.252.00
10.0010.0010.00
21.6523.1322.53
Birla Sun Life India GenNext Fund14-Jan-1116-Jul-1008-Jan-10
1.001.001.00
10.0010.0010.00
14.3914.9714.05
Birla Sun Life New Millennium Fund09-Sep-1026-Feb-1023-Sep-09
0.850.751.00
10.0010.0010.00
14.1613.4914.02
Birla Sun Life Top 100 Fund20-May-1115-Oct-1012-Mar-10
0.801.001.00
10.0010.0010.00
14.53316.57614.952
Birla Sun Life Buy India Fund29-Apr-1109-Sep-1026-Feb-10
1.751.751.25
10.0010.0010.00
23.7527.8322.44
Birla Sun Life MNC Fund25-Feb-1127-Aug-1026-Feb-10
5.255.253.75
10.0010.0010.00
76.7186.2774.35
Birla Sun Life Index Fund23-Mar-073-Feb-0417-Oct-03
6.501.655.60
10.0010.0010.00
21.8311.9916.19
Birla Sun Life India Opportunities Fund25-Feb-1127-Aug-1026-Feb-10
1.251.251.00
10.0010.0010.00
17.3819.2818.77
Birla Sun Life Dividend Yield Plus13-Feb-1217-Jun-1125-Feb-11
0.500.600.60
10.0010.0010.00
13.2013.7313.28
Birla Sun Life ‘95 Fund13-Feb-1229-Apr-1115-Oct-10
5.006.507.50
10.0010.0010.00
105.20114.40124.32
Note: After payment of dividend, NAV will fall to the extent of the payout and statutory levy, if any. Past performance may or may not be sustained in future.
WEALTH CREATION SOLUTIONS
TAX SAVINGS SOLUTIONS
EQUITY SCHEMES Declared on date Dividend# (` per unit) Face value (`) Cum Dividend NAV (` per unit)
Birla Sun Life Tax Relief ‘9631-Mar-1112-Mar-1031-Aug-09
10.0010.0010.00
4.007.004.00
82.8585.2178.56
Birla Sun Life Tax Plan20-May-1117-Sep-1012-Mar-10
10.0010.0010.00
1.002.007.50
45.1350.6951.60
Note: After payment of dividend, NAV will fall to the extent of the payout and statutory levy, if any. Past performance may or may not be sustained in future.
The Financial Solution(s) stated above is ONLY for highlighting the many advantages perceived from investments in Mutual Funds but does not in any manner, indicate or imply, either the quality of any particular Scheme or guarantee any specific performance/returns.
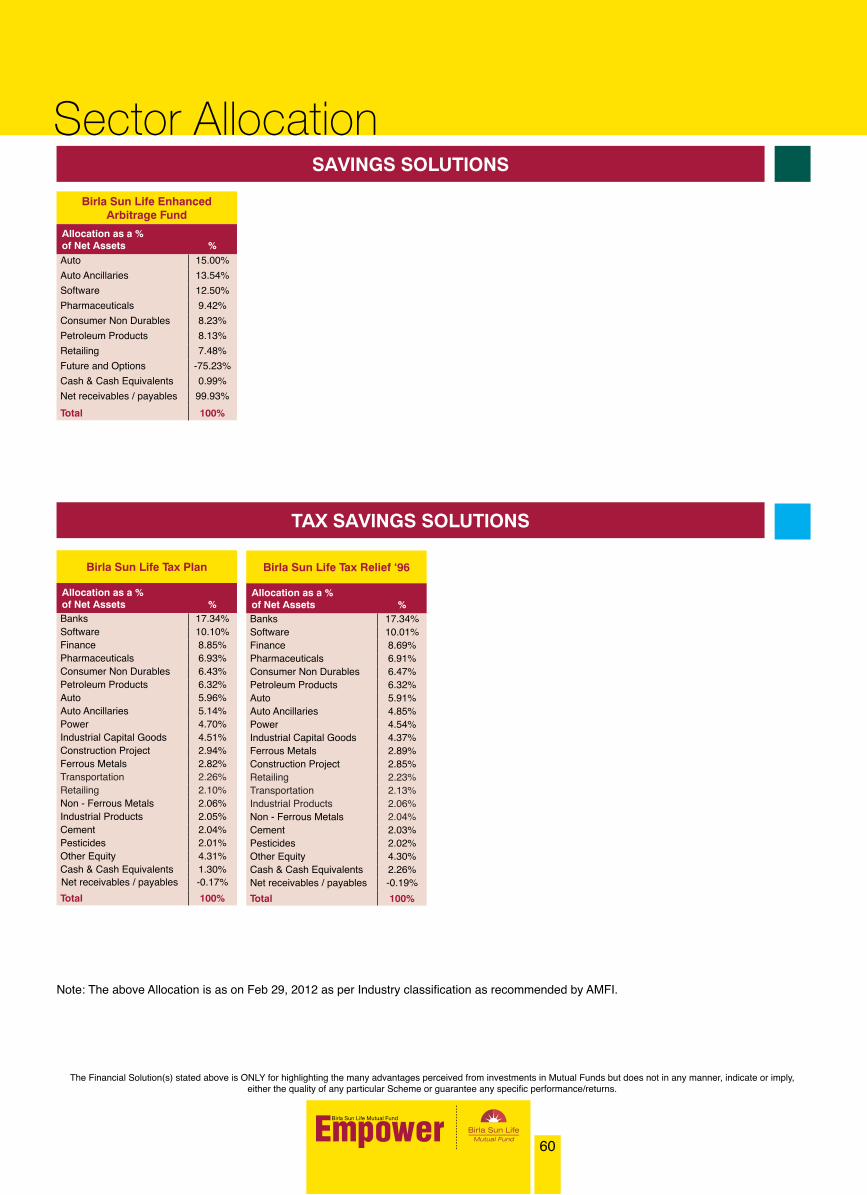
60
Sector AllocationSAVINGS SOLUTIONS
Birla Sun Life EnhancedArbitrage Fund
Allocation as a % of Net Assets %Auto 15.00%
Auto Ancillaries 13.54%
Software 12.50%
Pharmaceuticals 9.42%
Consumer Non Durables 8.23%
Petroleum Products 8.13%
Retailing 7.48%
Future and Options -75.23%
Cash & Cash Equivalents 0.99%
Net receivables / payables 99.93%
Total 100%
TAX SAVINGS SOLUTIONS
Birla Sun Life Tax Plan
Allocation as a % of Net Assets %Banks 17.34%Software 10.10%Finance 8.85%Pharmaceuticals 6.93%Consumer Non Durables 6.43%Petroleum Products 6.32%Auto 5.96%Auto Ancillaries 5.14%Power 4.70%Industrial Capital Goods 4.51%Construction Project 2.94%Ferrous Metals 2.82%Transportation 2.26%Retailing 2.10%Non - Ferrous Metals 2.06%Industrial Products 2.05%Cement 2.04%Pesticides 2.01%Other Equity 4.31%Cash & Cash Equivalents 1.30%Net receivables / payables -0.17%
Total 100%
Note: The above Allocation is as on Feb 29, 2012 as per Industry classification as recommended by AMFI.
Birla Sun Life Tax Relief ‘96
Allocation as a % of Net Assets %Banks 17.34%Software 10.01%Finance 8.69%Pharmaceuticals 6.91%Consumer Non Durables 6.47%Petroleum Products 6.32%Auto 5.91%Auto Ancillaries 4.85%Power 4.54%Industrial Capital Goods 4.37%Ferrous Metals 2.89%Construction Project 2.85%Retailing 2.23%Transportation 2.13%Industrial Products 2.06%Non - Ferrous Metals 2.04%Cement 2.03%Pesticides 2.02%Other Equity 4.30%Cash & Cash Equivalents 2.26%Net receivables / payables -0.19%
Total 100%
The Financial Solution(s) stated above is ONLY for highlighting the many advantages perceived from investments in Mutual Funds but does not in any manner, indicate or imply, either the quality of any particular Scheme or guarantee any specific performance/returns.
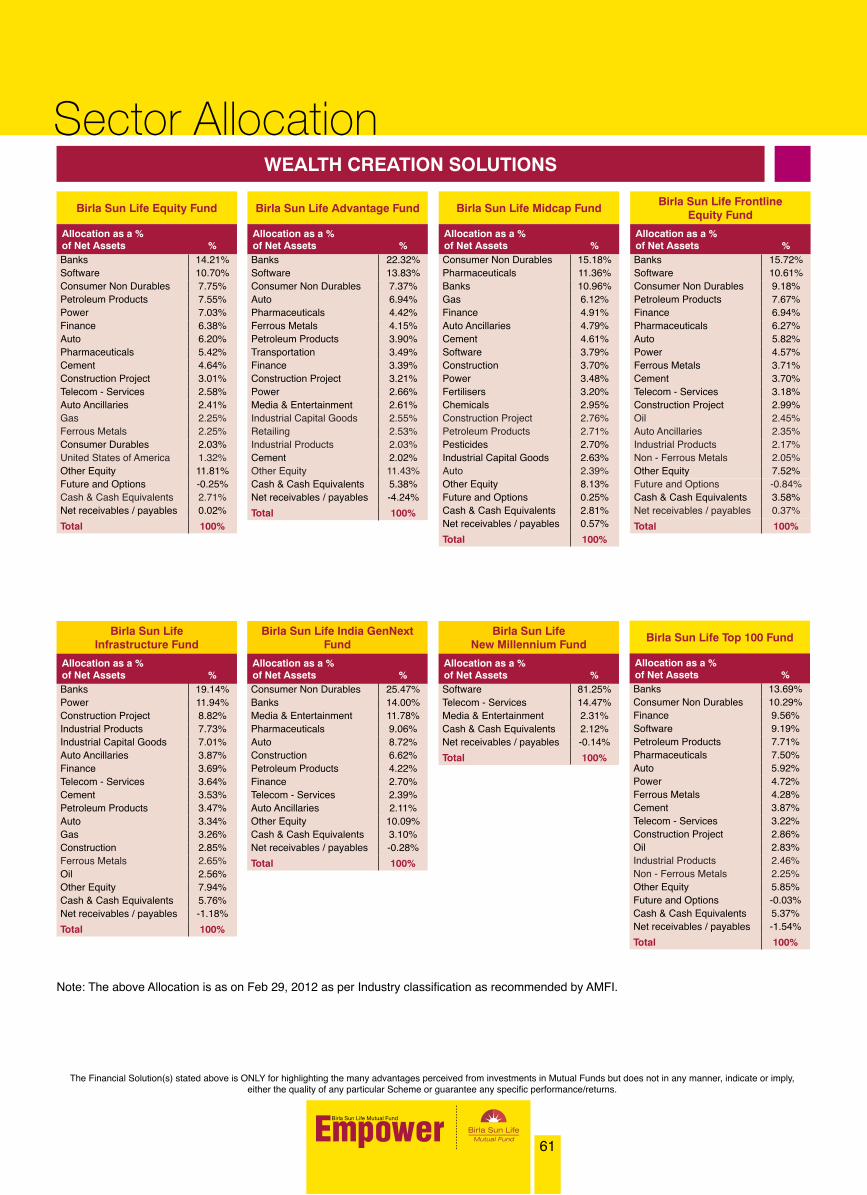
61
Sector Allocation
Birla Sun Life Equity Fund
Allocation as a % of Net Assets %Banks 14.21%Software 10.70%Consumer Non Durables 7.75%Petroleum Products 7.55%Power 7.03%Finance 6.38%Auto 6.20%Pharmaceuticals 5.42%Cement 4.64%Construction Project 3.01%Telecom - Services 2.58%Auto Ancillaries 2.41%Gas 2.25%Ferrous Metals 2.25%Consumer Durables 2.03%United States of America 1.32%Other Equity 11.81%Future and Options -0.25%Cash & Cash Equivalents 2.71%Net receivables / payables 0.02%
Total 100%
Birla Sun Life Advantage Fund
Allocation as a % of Net Assets %Banks 22.32%Software 13.83%Consumer Non Durables 7.37%Auto 6.94%Pharmaceuticals 4.42%Ferrous Metals 4.15%Petroleum Products 3.90%Transportation 3.49%Finance 3.39%Construction Project 3.21%Power 2.66%Media & Entertainment 2.61%Industrial Capital Goods 2.55%Retailing 2.53%Industrial Products 2.03%Cement 2.02%Other Equity 11.43%Cash & Cash Equivalents 5.38%Net receivables / payables -4.24%
Total 100%
Note: The above Allocation is as on Feb 29, 2012 as per Industry classification as recommended by AMFI.
WEALTH CREATION SOLUTIONS
Birla Sun Life Midcap Fund
Allocation as a % of Net Assets %Consumer Non Durables 15.18%Pharmaceuticals 11.36%Banks 10.96%Gas 6.12%Finance 4.91%Auto Ancillaries 4.79%Cement 4.61%Software 3.79%Construction 3.70%Power 3.48%Fertilisers 3.20%Chemicals 2.95%Construction Project 2.76%Petroleum Products 2.71%Pesticides 2.70%Industrial Capital Goods 2.63%Auto 2.39%Other Equity 8.13%Future and Options 0.25%Cash & Cash Equivalents 2.81%Net receivables / payables 0.57%
Total 100%
Birla Sun Life Frontline Equity Fund
Allocation as a % of Net Assets %Banks 15.72%Software 10.61%Consumer Non Durables 9.18%Petroleum Products 7.67%Finance 6.94%Pharmaceuticals 6.27%Auto 5.82%Power 4.57%Ferrous Metals 3.71%Cement 3.70%Telecom - Services 3.18%Construction Project 2.99%Oil 2.45%Auto Ancillaries 2.35%Industrial Products 2.17%Non - Ferrous Metals 2.05%Other Equity 7.52%Future and Options -0.84%Cash & Cash Equivalents 3.58%Net receivables / payables 0.37%
Total 100%
Birla Sun Life Infrastructure Fund
Allocation as a % of Net Assets %Banks 19.14%Power 11.94%Construction Project 8.82%Industrial Products 7.73%Industrial Capital Goods 7.01%Auto Ancillaries 3.87%Finance 3.69%Telecom - Services 3.64%Cement 3.53%Petroleum Products 3.47%Auto 3.34%Gas 3.26%Construction 2.85%Ferrous Metals 2.65%Oil 2.56%Other Equity 7.94%Cash & Cash Equivalents 5.76%Net receivables / payables -1.18%
Total 100%
Birla Sun Life India GenNext Fund
Allocation as a % of Net Assets %Consumer Non Durables 25.47%Banks 14.00%Media & Entertainment 11.78%Pharmaceuticals 9.06%Auto 8.72%Construction 6.62%Petroleum Products 4.22%Finance 2.70%Telecom - Services 2.39%Auto Ancillaries 2.11%Other Equity 10.09%Cash & Cash Equivalents 3.10%Net receivables / payables -0.28%
Total 100%
Birla Sun Life New Millennium Fund
Allocation as a % of Net Assets %Software 81.25%Telecom - Services 14.47%Media & Entertainment 2.31%Cash & Cash Equivalents 2.12%Net receivables / payables -0.14%
Total 100%
Birla Sun Life Top 100 Fund
Allocation as a % of Net Assets %Banks 13.69%Consumer Non Durables 10.29%Finance 9.56%Software 9.19%Petroleum Products 7.71%Pharmaceuticals 7.50%Auto 5.92%Power 4.72%Ferrous Metals 4.28%Cement 3.87%Telecom - Services 3.22%Construction Project 2.86%Oil 2.83%Industrial Products 2.46%Non - Ferrous Metals 2.25%Other Equity 5.85%Future and Options -0.03%Cash & Cash Equivalents 5.37%Net receivables / payables -1.54%
Total 100%
The Financial Solution(s) stated above is ONLY for highlighting the many advantages perceived from investments in Mutual Funds but does not in any manner, indicate or imply, either the quality of any particular Scheme or guarantee any specific performance/returns.

62
Sector AllocationBirla Sun Life Buy India Fund
Allocation as a % of Net Assets %Consumer Non Durables 18.55%Pharmaceuticals 18.05%Banks 15.83%Auto 11.98%Finance 8.68%Pesticides 6.48%Transportation 6.16%Retailing 5.86%Auto Ancillaries 2.96%Gas 2.40%Other Equity 1.82%Cash & Cash Equivalents 1.49%Net receivables / payables -0.26%
Total 100%
Note: The above Allocation is as on Feb 29, 2012 as per Industry classification as recommended by AMFI.
Birla Sun Life MNC Fund
Allocation as a % of Net Assets %Consumer Non Durables 21.12%Pharmaceuticals 12.30%Industrial Capital Goods 11.88%Finance 10.37%Auto Ancillaries 10.07%Industrial Products 6.29%Software 5.47%Gas 5.30%Banks 4.96%Auto 3.84%Pesticides 3.17%Cement 2.97%Other Equity 1.65%Cash & Cash Equivalents 0.69%Net receivables / payables -0.07%
Total 100%
Birla Sun Life Index Fund
Allocation as a % of Net Assets %Banks 17.54%Software 13.02%Petroleum Products 8.20%Auto 7.83%Consumer Non Durables 6.09%Finance 5.54%Power 4.04%Construction Project 3.88%Pharmaceuticals 3.55%Ferrous Metals 3.31%Oil 3.14%Telecom - Services 2.70%Cement 2.41%Consumer Non Durables 2.21%Industrial Capital Goods 2.13%Non - Ferrous Metals 2.05%Other Equity 3.42%Future and Options 8.60%Cash & Cash Equivalents 2.12%Net receivables / payables -1.77%
Total 100%
Birla Sun Life Dividend Yield Plus
Allocation as a % of Net Assets %Banks 17.82%Consumer Non Durables 12.04%Auto 9.99%Petroleum Products 8.41%Software 6.93%Oil 4.06%Finance 3.49%Industrial Products 3.32%Power 3.21%Gas 3.03%Pharmaceuticals 3.01%Cement 2.93%Chemicals 2.54%Media & Entertainment 2.38%Ferrous Metals 2.24%Transportation 2.20%Fertilisers 2.13%Other Equity 4.04%Cash & Cash Equivalents 6.11%Net receivables / payables 0.11%
Total 100%
Birla Sun Life ‘95 Fund
Allocation as a % of Net Assets %Banks 17.45%Corporate Debt 16.61%Software 8.69%Consumer Non Durables 4.82%Auto 4.59%Pharmaceuticals 3.69%Finance 2.90%Oil 2.47%Construction Project 2.46%Ferrous Metals 2.40%Petroleum Products 2.31%Industrial Capital Goods 2.07%Government Bond 0.55%PSU/PFI Bonds/Banks 0.38%Money Market Instruments 0.18%Other Equity 15.82%Cash & Current Assets 12.59%
Total 100%
Birla Sun Life India Opportunities Fund
Allocation as a % of Net Assets %Software 42.80%Non - Ferrous Metals 11.29%Pharmaceuticals 10.52%Industrial Capital Goods 8.01%Industrial Products 6.97%Finance 4.60%Petroleum Products 2.89%Media & Entertainment 2.47%Power 2.19%Auto 2.12%Telecom - Services 2.06%Cash & Cash Equivalents 4.53%Net receivables / payables -0.45%
Total 100%
The Financial Solution(s) stated above is ONLY for highlighting the many advantages perceived from investments in Mutual Funds but does not in any manner, indicate or imply, either the quality of any particular Scheme or guarantee any specific performance/returns.

63
Sector AllocationBirla Sun Life
Small & Midcap Fund
Allocation as a % of Net Assets %Consumer Non Durables 10.43%Auto Ancillaries 10.26%Pharmaceuticals 7.97%Industrial Products 6.71%Power 6.62%Banks 5.58%Chemicals 5.56%Media & Entertainment 5.44%Construction 4.90%Finance 3.75%Transportation 3.65%Industrial Capital Goods 3.38%Software 3.31%Gas 3.13%Cement 3.00%Textile Products 2.60%Fertilisers 2.46%Pesticides 2.25%Other Equity 4.95%Cash & Cash Equivalents 3.43%Net receivables / payables 0.59%
Total 100%
Birla Sun Life India Reforms Fund
Allocation as a % of Net Assets %Banks 25.98%Power 11.10%Construction Project 10.07%Fertilisers 8.09%Industrial Capital Goods 6.81%Oil 5.61%Gas 4.37%Petroleum Products 4.02%Industrial Products 3.30%Retailing 3.04%Finance 2.76%Telecom - Services 2.63%Media & Entertainment 2.58%Minerals/Mining 2.10%Transportation 2.01%Other Equity 2.62%Cash & Cash Equivalents 6.43%Net receivables / payables -3.53%
Total 100%
Note: The above Allocation is as on Feb 29, 2012 as per Industry classification as recommended by AMFI.
Birla Sun Life Pure Value Fund
Allocation as a % of Net Assets %Banks 24.38%Consumer Non Durables 8.64%Transportation 7.78%Petroleum Products 6.31%Fertilisers 6.08%Industrial Products 5.94%Pharmaceuticals 5.90%Pesticides 4.97%Oil 4.71%Auto Ancillaries 4.18%Power 3.64%Cement 2.68%Ferrous Metals 2.43%Non - Ferrous Metals 2.30%Gas 2.27%Other Equity 3.85%Cash & Cash Equivalents 2.62%Net receivables / payables 1.34%
Total 100%
Birla Sun Life Long TermAdvantage Fund
Allocation as a % of Net Assets %Banks 17.93%Software 15.61%Consumer Non Durables 6.14%Finance 5.93%Pharmaceuticals 5.71%Petroleum Products 5.37%Auto 5.30%Power 3.80%Auto Ancillaries 3.52%Media & Entertainment 3.18%Telecom - Services 3.06%Industrial Capital Goods 2.91%Ferrous Metals 2.79%Transportation 2.66%Construction 2.09%Construction Project 2.06%Other Equity 7.09%Cash & Cash Equivalents 4.59%Net receivables / payables 0.25%
Total 100%
Birla Sun Life CommodityEquities Fund - Global Agri Plan
Allocation as a % of Net Assets %United States of America 57.42%Germany 6.81%United Kingdom 6.67%Singapore 4.98%Australia 4.87%Norway 4.78%Switzerland 3.88%Brazil 3.52%Canada 3.04%Israel 2.20%Hong Kong 1.47%Cash & Cash Equivalents 1.00%Net receivables / payables -0.63%Total 100%
Birla Sun Life CommodityEquities Fund - Global Multi
Commodity PlanAllocation as a % of Net Assets %United States of America 73.88%United Kingdom 8.34%Canada 3.05%Spain 2.88%Norway 2.60%Netherlands 2.47%Switzerland 0.99%Brazil 0.76%Hong Kong 0.73%France 0.35%Cash & Cash Equivalents 6.00%Net receivables / payables -2.06%Total 100%
Birla Sun Life CommodityEquities Fund - Global Precious
Metals PlanAllocation as a % of Net Assets %United States of America 45.26%Canada 30.20%United Kingdom 4.47%Hong Kong 2.54%Australia 2.32%Cash & Cash Equivalents 17.75%Net receivables / payables -2.54%Total 100%
Birla Sun Life International Equity Fund - Plan B
Allocation as a % of Net Assets %United States of America 19.64%Banks 12.19%Software 9.08%Pharmaceuticals 4.86%Finance 4.77%Consumer Non Durables 4.63%Construction Project 3.65%Cement 3.46%Petroleum Products 3.40%Media & Entertainment 3.20%Auto Ancillaries 2.78%Non - Ferrous Metals 2.76%Hong Kong 2.65%Ferrous Metals 2.51%Telecom - Services 2.40%Auto 2.11%Switzerland 1.87%Norway 1.18%Germany 0.94%Singapore 0.75%Australia 0.52%Denmark 0.29%Other Equity 9.82%Cash & Cash Equivalents 3.07%Net receivables / payables -2.54%Total 100%
Country/Sector Allocation
Birla Sun Life International Equity Fund - Plan A
Allocation as a % of Net Assets %United States of America 70.74%Hong Kong 9.43%Switzerland 6.21%Norway 4.91%Germany 3.35%Australia 2.07%Singapore 1.73%Denmark 1.08%Cash & Cash Equivalents 2.13%Net receivables / payables -1.65%
Total 100%
The Financial Solution(s) stated above is ONLY for highlighting the many advantages perceived from investments in Mutual Funds but does not in any manner, indicate or imply, either the quality of any particular Scheme or guarantee any specific performance/returns.

64
For further details on our Funds, please contact our Customers Service Centres at details given below.
BIRLA SUN LIFE ASSET MANAGEMENT COMPANY LTD. (Investment Manager for Birla Sun Life Mutual Fund)One IndiaBulls Centre Tower 1, 17th Floor, Jupiter Mill Compound, 841, Senapati Bapat Marg, Elphinstone Road, Mumbai-400 013
BRANCHES IDEA Toll Free No. 1800-270-7000 & the centralised TOLL no. 022-66917777
AGRA JAIPUR PANJIM ALLAHABAD 0532 - 2427015 / 3201661 HUBLI 0836 - 4259989 / 4266283AHMEDABAD JALANDHAR PATIALA AMBALA 0171 - 2601345 JAMMU 0191 - 2432601AJMER JAMSHEDPUR PONDICHERY AMRAVATI 0721 - 6451692 JAMNAGAR 0288 - 3200064ALWAR JODHPUR PUNE ANAND 02692 - 247260 KOLKATA 033 - 22882592 / 4 / 5AMRITSAR KANPUR RAIPUR BENGALURU (Jayanagar) 080 - 41555000 MADURAI 0452 - 4231493 / 83AURANGABAD KOLHAPUR RAJKOT BENGALURU (Malleswaram) 080 - 42199223 MARGAO 0832 - 6480109BARODA KOTA RANCHI BENGALURU(Cunningham House Rd) 080 - 22389991 / 2 / 3 MATHURA 0565 - 3207007 / 6959BELGAUM LUCKNOW SALEM BHAVNAGAR 0278 - 6452524 MEHASANA 02762 - 658323 / 16BHILLAI LUDHIANA SHIMLA BHUBANESHWAR 0674 - 2535521 / 3413 MUMBAI (Head Office) 022 - 66928000BHOPAL MADURAI SILIGURI CHANDIGARH 0172 - 2783556 MYSORE 0821 - 4244400 / 1 / 2CALICUT MANDIGOBINDGARH SURAT CHENNAI (Anna Nagar) 044 - 43016950 / 1 / 2 / 4 / 6 NOIDA 0120 - 4203629CHENNAI (Adiyar) MANGALORE TRICHY CHENNAI (Egmore) 044 - 28191681 / 708 / 715 / 699 PATNA 0612 - 2323265 / 66COIMBATORE MEERUT UDAIPUR COCHIN 0484 - 2366817 / 2383969 / 4021722 THANE 022 - 67930660 / 1DEHRADUN MORADABAD VALSAD DELHI 011- 40744514 TRIVANDRUM 0471 - 4017007DHANBAD MUMBAI (Borivali) VARANASI DURGAPUR 0343 - 6454621 / 19 / 3201241 VAPI 0260 - 6454735 / 6ERODE MUMBAI (Ghatkopar) VASHI GUWAHATI 0361 - 2595020 / 2599273 VISHAKAPATNAM 0891 - 6631337 / 8GURGAON MUMBAI (Churchgate) VIJAYWADA GWALIOR 0751 - 6499442 / 378HYDERABAD (Abids) NAGPUR VISAGINDORE NASIKJABALPUR PANIPAT
Disclaimer: Any information contained in this publication does not constitute and shall be deemed not to constitute an advice, an offer to sell/ purchase or as an invitation or solicitation to do so for any securities of any entity and further, Birla Sun Life Asset Management Company Ltd.(BSLAMC)/ its subsidiaries / affiliates / sponsors / trustee or their officers, employees, personnel, directors shall not be liable for any loss, damage, liability whatsoever for any direct or indirect loss arising from the use or access of any information that may be displayed in this publication from time to time. Recipients of the information contained herein should exercise due care and caution and read the all the scheme related documents (including if necessary, obtaining the advice of tax / legal / accounting / financial / other professionals) prior to taking of any decision, acting or omitting to act, on the basis of the information contained herein.Editorial opinions expressed in the ‘Empower’ are not necessarily those of BSLAMC or any of their officers, employees, personnel, directors and BSLAMC and its officers, employees, personnel, directors do not accept responsibility for the editorial content. BSLAMC or any of its officers, employees, personnel, directors make no representation as to the accuracy, completeness or reliability of the editorial content and hereby disclaim any liability with regard to the same.
The Material provided in the Empower cannot be reproduced or quoted anywhere without express permission from Birla Sun Life Asset Management Company Ltd.
Mutual Fund investments are subject to market risks, read all scheme related documents carefully.
We value your customers as much as you do. As partners in your effort to keep your customers Informed and updated about their Investment, we ensure that all the information is accessible whenever they need it
View portfolio summary•
View transaction history•
Track portfolio•
Purchase, Switch & Redeem •
Change TPIN • (TrackportfoliopersonalIdentificationNumber
Get Account Statement instantly•
Online Portfolio Access
All India Telephone
MobileInvestmentManager
www.birlasunlife.com www.birlasunlife.com/mobile: 1-800-22-7000 (MTNL/BSNL)
1-800-270-7000
Toll Free