Bird Survey in the Cherry Point Aquatic Reserve · mixed sand and pebble infill. Cobble intertidal...
32
Bird Survey in the Cherry Point Aquatic Reserve 2013-2014 Monitoring Report Prepared for: Washington State Department of Natural Resources Grant #: PC-00J29801-0: Ensuring regulatory effectiveness in Puget Sound's most special places Prepared by: Cherry Point Aquatic Reserve Citizen Stewardship Committee Bird Survey Report Subcommittee Wendy Steffensen RE Sources for Sustainable Communities Jerry Joyce Washington Environmental Council and John L. Bower Fairhaven College of Interdisciplinary Studies Western Washington University October 2014
-
Upload
nguyendang -
Category
Documents
-
view
216 -
download
2
Transcript of Bird Survey in the Cherry Point Aquatic Reserve · mixed sand and pebble infill. Cobble intertidal...

Bird Survey in the Cherry Point Aquatic Reserve
2013-2014 Monitoring Report
Prepared for:
Washington State Department of Natural Resources Grant #: PC-00J29801-0: Ensuring regulatory effectiveness in Puget Sound's most special places
Prepared by:
Cherry Point Aquatic Reserve Citizen Stewardship Committee Bird Survey Report Subcommittee
Wendy Steffensen
RE Sources for Sustainable Communities
Jerry Joyce Washington Environmental Council
and
John L. Bower Fairhaven College of Interdisciplinary Studies
Western Washington University
October 2014
Publication Information
This Monitoring Report describes bird surveys conducted from April 2013 through June 2014 in the Cherry Point Aquatic Reserve. This project is funded by the National Estuary Program (NEP) of the United States Environmental Protection Agency (EPA) under assistance agreement PC-00J29801-0 to Washington Department of Natural Resources (WDNR).The contents of the report do not necessarily reflect the views and policies of the Environmental Protection Agency, nor does mention of trade names or commercial products constitute endorsement or recommendation for use.
Copies of this Monitoring Report will be available from the Washington State Department of Natural Resources at http://www.dnr.wa.gov/ResearchScience/Topics/AquaticHabitats/Pages/aqr_rsve_aquatic_reserves_program.aspx at the Aquatic Reserves website http://www.aquaticreserves.org/resources/ and at RE Sources website at https://sites.google.com/a/re-sources.org/main-2/programs/baykeeper .
Cover Photo: Citizen Scientist Marj Leone recording birds at South Cape site, 2013. RE Sources.
Authors and Contact Information
Wendy Steffensen North Sound Baykeeper RE Sources for Sustainable Communities 2309 Meridian Street Bellingham, WA 98225 [email protected]
Bird Survey Report Subcommittee Mary Blackstone Amy Mower John Yearsley Talor Garrod (intern)
Jerry Joyce Washington Environmental Council 1402 Third Avenue Seattle, WA 98101 206-440-8688 [email protected]
John L. Bower Fairhaven College of Interdisciplinary Studies Western Washington University 518 High St. Bellingham, WA 98225-9118 360-650-7217 [email protected]
Page iii Cherry Point Aquatic Reserve Bird Survey 2013-14
Bird Survey in the Cherry Point Aquatic Reserve
2013-2014 Monitoring Report
Contents
Abstract .................................................................................................................................................. 5
Introduction ............................................................................................................................................ 5
Study Area Characteristics ................................................................................................................... 5
Existing Bird Monitoring Data .............................................................................................................. 7
Goals and Objectives ........................................................................................................................... 8
Primary Objectives .......................................................................................................................... 8
Secondary Objectives ...................................................................................................................... 8
Study Design ........................................................................................................................................... 8
Field procedures ................................................................................................................................. 9
Survey Locations ................................................................................................................................. 9
Results .................................................................................................................................................. 11
Discussion ............................................................................................................................................. 19
Goal and Objectives .......................................................................................................................... 19
Completeness of the study ............................................................................................................ 20
Comparison of 2013–2014 Survey Data to Historical Studies ................................................................. 20
Summary of Bird Abundance Changes ............................................................................................... 28
Relative Seasonal Abundance of seven target bird species ................................................................ 29
Feasibility of continuing this study ..................................................................................................... 29
Recommendations for Planned Program and Procedure Improvements ............................................ 29
Training: ........................................................................................................................................ 29
Survey Procedures: ....................................................................................................................... 30
Possible future uses of this dataset ................................................................................................... 30
References ............................................................................................................................................ 31
Acknowledgments ................................................................................................................................. 32

Page iv Cherry Point Aquatic Reserve Bird Survey 2013-14
Tables
Table 1: The number of birds and observers for each survey date per location. ..................................... 11
Figures
Figure 1. Location of the aquatic reserves in Puget Sound. Cherry Point Aquatic Reserve is circled. ......... 6
Figure 2. The boundaries and characteristics of the Cherry Point Aquatic Reserve and adjacent area. ..... 7
Figure 3: South Cape survey location. .................................................................................................... 10
Figure 4: Neptune Beach survey site. ..................................................................................................... 10
Figure 5: Gulf Road survey site............................................................................................................... 10
Figure 6: Surveying at South Cape. Photo Credit: RE Sources ................................................................. 11
Figure 7. Number of Bald Eagles observed on each date at the three locations. ..................................... 12
Figure 8. Number of Brant observed on each date at the three locations. .............................................. 13
Figure 9. Number of Common Goldeneye observed on each date at the three locations. ...................... 14
Figure 10. Number of Common Loons Observed on each date at the three locations. ............................ 15
Figure 11. Number of Harlequin Ducks observed on each date at the three locations. ........................... 16
Figure 12. Number of Surf Scoters observed on each date at the three locations. .................................. 17
Figure 13. Shows the number of Western Grebes observed on each date at the three locations. ........... 18
Figure 14: Average number of Bald Eagles observed Jan-May and September-December. ..................... 22
Figure 15. Average number of Bald Eagles observed September-May .................................................... 22
Figure 16. Average number of Brant observed Jan-May and September-December. .............................. 23
Figure 17. Average number of Brant observed September-May. ............................................................ 23
Figure 18. Average number of Common Goldeneye observed Jan-May and September-December. ....... 24
Figure 19. Average number of Common Goldeneyes observed September-May .................................... 24
Figure 20. Average number of Common Loons observed Jan-May and September-December ............... 25
Figure 21. Average number of Common Loons observed September-May. ............................................ 25
Figure 22. Average number of Harlequin Ducks observed Jan-May and September-December.. ............ 26
Figure 23. Average number of Harlequin Ducks observed September-May. ........................................... 26
Figure 24. Average number of Surf Scoters observed January-May and September-December.. ............ 27
Figure 25. Average number of Surf Scoters observed September-May ................................................... 27
Figure 26. Average number of Western Grebes observed January-May and September-December ....... 28
Figure 27. Average number of Western Grebes observed September-May ............................................ 28

Page 5 Cherry Point Aquatic Reserve Bird Survey 2013-14
Abstract This study uses shore-based marine-bird census to examine changes in the abundance and distribution of seven species (Bald Eagle, Brant, Common Goldeneye, Common Loon, Harlequin Duck, Surf Scoter, and Western Grebe) within the Washington Department of Natural Resources Cherry Point Aquatic Reserve. In the study, shore-based census were conducted at least monthly from three sites within the reserve, with census locations and methodologies modeled after earlier census work conducted as part of the Marine Ecosystem Analysis (MESA) study (1978-1979 ) and the WWU Marine Bird Census (2003-2005). The current study was conducted April-June 2013 and September 2013-June 2014. The numbers of birds varied seasonally with some species numbers peaking in May, during herring spawning season, and some peaking in the fall and winter months. Brant and Surf Scoters were the most abundant, with counts numbering in the hundreds at some sites on some census days.
Comparison of our data with the MESA and WWU studies are largely consistent with the patterns seen between the 1970’s and 2000’s, including apparent decreases in surf scoter abundance. This report uses descriptive statistics to detect apparent trends in marine bird numbers over the last decade. Continued monitoring over the coming years will allow statistical tests for better determining the abundance trends of marine birds in the Cherry Point Aquatic Reserve
Introduction “The Washington Department of Natural Resources (WDNR) established aquatic reserves throughout Puget Sound to protect important native ecosystems. These reserves are an effort to promote the preservation, restoration, and enhancement of state-owned aquatic lands that are of special educational, scientific, or environmental interest (WDNR 2010).” One of the tools used for managing aquatic reserves and protecting their resources is measuring and monitoring the diversity, distribution, and abundance of bird species in the area.
This census monitored shorelines for seven target bird species in and around the Cherry Point Aquatic Reserve (CPAR). Census methods closely matched those used by John Bower in 2003 to 2005 (Bower, 2009; Anderson et al 2009) and by researchers in the 1970’s Marine Ecosystem Analysis Marine Bird Component (EPA, 1981).
This monitoring effort is contributing to historic data at the monitoring sites. The goals and objectives of this bird monitoring are to collect data over time at fixed monitoring sites and to document changes over time in abundance, using scientifically and statistically sound methods. The same locations monitored in 1978-79, and again in 2003-05, were monitored in 2013-14. Future monitoring will continue in 2014-15, and longer, given staff support and funding.
Study Area Characteristics
CPAR is located in the eastern Strait of Georgia in the Salish Sea. Its northern boundary is Birch Bay State Park and its southern boundary is the Lummi Indian Nation Reservation. The majority of the area in and near the reserve consists of a combination of WDNR owned aquatic lands, Birch Bay State Park, private lands, and tribal lands. Figure 1 shows the location of the reserve in Puget Sound. Figure 2 shows the reserve and surrounding characteristics.

Page 6 Cherry Point Aquatic Reserve Bird Survey 2013-14
Figure 1. Location of the aquatic reserves in Puget Sound. Base map source: WDNR (2011). Cherry Point Aquatic Reserve is circled.
The greater Cherry Point area falls under the following description by Washington Department of Natural Resources. “Geomorphic characteristics of the Whatcom County shoreline include glacial sediments, limited sea level rise, moderate tidal range, considerable wave exposure, rock strewn cobble beaches with moderate to high backshore bluffs. Because of its combination of exposure, fetch, and glacial makeup, Cherry Point has a unique beach type of large cobble/boulders with lower areas of mixed sand and pebble infill. Cobble intertidal areas, submerged aquatic vegetation and a steep gradient into deep water support a high diversity of… marine and shore birds and migratory waterfowl.”(WDNR, 2010)
Recreational uses include bird watching, walking the select public tidelands of Cherry Point, and nearshore recreational boating, including kayaking.

Page 7 Cherry Point Aquatic Reserve Bird Survey 2013-14
Figure 2. The boundaries and characteristics of the Cherry Point Aquatic Reserve and adjacent area.
Existing Bird Monitoring Data Several major bird censuses have been conducted in and near the CPAR. These are:
The MESA Puget Sound Project was a comprehensive environmental study of the area and included a rigorous marine-bird census component. The study surveyed marine birds in 13 regions over a two-year period, 1978-79. This baseline study included more than 7,000 counts, including abundance counts from over 100 shore-based sites, transect counts from ferries and small boats, breeding island counts, and aerial surveys (EPA 1981).
The WWU Marine Bird Study replicated the MESA bird census in 2003-2005 based on shoreline and ferry counts (the bulk of the original MESA data sets). Results indicated a 28.9% decline in the total number of birds observed at 62 study locations. Fourteen of the 37 most common overwintering Salish Sea species showed statistically significant declines, including decreases of over 50% for ten species. Significant increases were reported for six of the 37 species in the comparison (Bower, 2009).
WDFW/ Puget Sound Ambient Monitoring Programming (PSAMP) relies on aerial surveys conducted since 1992 (Evenson, et al, 2010; Nysewander, et al, 2005). The study repeated 54 aerial transect surveys conducted during the MESA study, enabling analysis of changes in long-term abundance. Results

Page 8 Cherry Point Aquatic Reserve Bird Survey 2013-14
from 1992-1999 showed significant declines in 13 of 20 species/groups of species studied, including declines as high as 95% in the case of the Western Grebe. While this study has been important in assessing long-term abundance trends in inland Washington waters, each survey transect occur only once in the winter. These transects are comparable to the aerial transects of the MESA study, which was a relatively minor part of that study.
Other relevant studies include the following:
Christmas Bird Counts in this area of Salish Sea began in 1957. Significant declines were reported for seven species and significant increases were reported for three of the 37 species in the comparison of bird abundance from 1976-85 to 1988-2007 (Bower, 2009).
The Lummi Intertidal Baseline Inventory (LIBI) was conducted to document the existing diversity, abundance, distribution, and habitats of biological resources that are found on the Lummi Reservation tidelands, just south of the Cherry Point Aquatic Reserve. The LIBI integrates the results from six field surveys that were conducted in 2008 and 2009 with compatible pre-existing information. One of these monitoring programs was the Shorebird and Marine Mammal Survey. This study documented the diversity and monthly abundance of birds and marine mammals. During the 11-month survey a total of 52 different bird species and two marine mammal species were identified. Generally, the diversity of birds present across the Reservation tidelands was lowest in the summer months and highest during the fall and winter months. Likewise, the total abundance of birds was lowest during the summer and highest during the fall and winter (LNR, 2010).
Goals and Objectives The goal of this study is to collect data from specific bird monitoring sites in and around the Cherry Point Aquatic Reserve and to document any changes in abundance over time.
Primary Objectives
The objectives of this study are:
Monitor bird abundance of seven target species: Bald Eagle, Brant, Common Goldeneye, Common Loon, Harlequin Duck, Surf Scoter, and Western Grebe at specific locations in and around the Cherry Point Aquatic Reserve.
Determine changes in abundance by comparing results with relevant data from previous studies. Effort will be made to establish continuity with the historic parameters to enable sound comparisons, including site and date fidelity.
Ensure data are collected and reported using accepted and verifiable quality control procedures.
Make data available for scientific and educational purposes.
Secondary Objectives
Effectively train local volunteer bird enthusiasts in scientific process using proper protocol, alpha codes for birds, understanding of bird ecology, habits, and identification through classroom and field training.
Study Design The protocol for this study is based on the studies done in the area previously as described by Bower (2009). The protocol consists of four or more individuals moving from one site to the next, doing a full and complete bird count at each site. There are two experts using spotting scopes to see distant birds, one birder using binoculars to see closer birds, and one note-taker. Additional people are used as bird spotters when available. Counts include all of the birds observed in the area while avoiding repeat

Page 9 Cherry Point Aquatic Reserve Bird Survey 2013-14
counts. Experts at bird identification and counting birds are qualified after completing in-class and field-testing, and after spending at least one full year practicing the protocol with previously qualified experts. Year one experts were designated by Dr. John Bower based on their experience in other marine bird censuses and known bird identification skills. Birds to be identified are Bald Eagle, Brant, Common Goldeneye, Common Loon, Harlequin Duck, Surf Scoter, and Western Grebe.
Surveys are conducted monthly September through March, and bimonthly in April and May.
This study replicates the methods used in the Bower 2003/2005 and the MESA 1978/1979 studies. The counts are intended to illustrate the abundance of these seven birds over time.
Field procedures This shore-based point-count protocol was developed to be compatible with the 1978/79 MESA Program protocols (EPA, 1981) as closely as possible. Shore-based point counts are conducted using binoculars and spotting scopes at least equal in quality to Eagle Optics Ranger 10×40 binoculars and 20-40× scopes (Eagle Optics, Middleton, WV, USA), with no time or distance limits; counts continued until all birds in the area were counted.
Birds are identified to species whenever possible, and identified as closely as possible to species when species identification was not possible (e.g. scoter spp. or duck spp.).
Each survey is conducted with the following methods. On arrival at the site, basic weather data such as cloud cover, wind, and Beaufort scale are recorded. Two experienced counters select a central point in the distance as a reference point. Scanning outward, away from the central point, the two counters identify and count all birds in the field of view. A trained and practiced scribe records the numbers called out by observers and repeats the numbers verbally to ensure accuracy of transcription. Scribes write down actual numbers separated by commas instead of using hash marks to tally the observations. At least one or two assistant observers use binoculars to scan the water locating birds or groups of birds that are closer to shore or that the counters have not recorded. Assistant observers are individuals who have not completed the training program or have not passed the requirements to become a survey counter. Subsequently the main counters positively identify and count these groups. Birds on the backshore are not counted but birds along the water’s edge or flying over the point count are counted.
Survey Locations The locations of the three fixed-network sites were identified based on historical monitoring programs. These are:
South Cape (Salt Spring Drive at Sandy Point); 48.787704N, 122.709489W
The South Cape site lies between a boat channel and a large beach and mud flat for feeding. There are no trees; the birds seen were either flying by or perched on rooftops.

Page 10 Cherry Point Aquatic Reserve Bird Survey 2013-14
Neptune Beach; 48.815984N, 122.708881W
The Neptune Beach site is on a cobble stone beach backed by a line of homes interspersed with a small pond, marsh, and large conifers. Several of the birds were sighted in the conifers. The site has a westerly exposure and modest protection from the northern pier.
Gulf Road; 48.855952N, 122.730497W
Gulf Road has a westerly exposure, but not much protection. The large trees on the shoreline are attractive to birds.
Figure 3: South Cape survey location.
Figure 5: Gulf Road survey site.
Figure 4: Neptune Beach survey site.

Page 11 Cherry Point Aquatic Reserve Bird Survey 2013-14
Results The surveying component of the study used a fixed network of three sites sampled monthly in April and May 2013. Surveys were resumed at the same sites in September 2013 and continued monthly until June 1, 2014. No survey was conducted in February 2014 despite two attempts, due to inclement weather with poor visibility. The maximum distances of observations were typically about 1000 m, depending on the elevation of the observers.
Results of the surveys are shown below in table and graphic form. Abbreviations denote locations at South Cape (SC), Neptune Beach (NB), and Gulf Road (GR).
Table 1: The number of birds and observers for each survey date per location.
Figure 6: Surveying at South Cape. Photo Credit: RE Sources
DATE
number of
surveyors
SC NB GR SC NB GR SC NB GR SC NB GR SC NB GR SC NB GR SC NB GR
4/10/2013 5 0 1 2 18 14 0 4 1 0 3 4 5 0 0 2 83 5 3 0 0 0
4/25/2013 5 0 1 1 110 15 0 2 1 0 9 12 13 0 0 0 177 19 18 0 0 51
5/5/2013 6 0 1 0 291 22 0 2 0 0 1 11 8 2 0 0 87 23 15 0 0 65
5/23/2013 6 0 0 0 1 0 0 0 0 0 6 6 0 0 0 0 15 0 0 0 2 0
9/14/2013 7 0 0 0 0 0 0 0 0 0 1 1 1 0 0 0 11 0 5 0 0 1
10/14/2013 7 0 0 1 0 0 0 0 0 0 5 10 15 2 0 3 49 105 64 2 7 0
11/17/2013 8 0 0 3 77 38 0 2 0 2 0 1 2 0 0 0 31 37 5 3 4 1
12/9/2013 6 1 1 2 137 0 0 15 3 8 3 3 3 0 0 0 36 7 9 0 0 3
1/18/2014 10 0 0 2 460 1 0 15 4 7 4 7 5 0 0 1 95 29 21 0 0 3
3/10/2014 7 4 2 1 73 0 0 11 4 6 0 5 5 0 0 0 43 25 24 0 0 0
4/7/2014 6 0 7 1 112 0 0 7 1 1 5 2 6 0 0 2 85 17 1 0 0 1
4/21/2014 8 0 1 2 434 39 5 5 0 3 6 10 8 0 0 10 320 88 4 0 0 0
5/5/2014 5 0 1 0 119 0 0 2 1 0 4 3 7 0 0 0 165 49 0 0 1 0
5/18/2014 4 0 0 0 9 0 0 0 2 0 2 2 1 0 0 0 80 155 24 9 39 0
6/1/2014 6 2 0 0 4 0 0 0 0 0 1 1 0 0 0 0 0 21 0 0 0 0
WESTERN
GREBEBALD EAGLE BRANT
COMMON
GOLDENEYE
HARLEQUIN
DUCK SURF SCOTERCOMMON LOON

Page 12 Cherry Point Aquatic Reserve Bird Survey 2013-14
Very few Bald Eagles were seen from the viewing sites. The most eagles were seen at Neptune Beach. The number of birds was highest in April 2014, with seven eagles at Neptune Beach; Numbers were relatively consistent the rest of the count period, ranging from 1 to 3 birds.
0
1
2
3
4
5
6
7
Number of Bald Eagles Observed at 3 Locations in Cherry Point Aquatic Reserve
Gulf Road
Neptune
South Cape
Figure 7. Number of Bald Eagles observed on each date at the three locations.

Page 13 Cherry Point Aquatic Reserve Bird Survey 2013-14
Brant clearly preferred the South Cape site. We postulate that this is due to the presence of large shallow water and mud flats at this site. The number of birds was highest with 460 in January and 434 in April of 2014.
0
50
100
150
200
250
300
350
400
450
500
Number of Brant Observed at 3 Locations in Cherry Point Aquatic Reserve
Gulf Road
Neptune
South Cape
Figure 8. Number of Brant observed on each date at the three locations.

Page 14 Cherry Point Aquatic Reserve Bird Survey 2013-14
Common Goldeneye counts were highest at South Cape, with the next highest counts at Gulf Road. The maximum number of birds was 15 in both December 2013 and January 2014, slowly decreasing monthly through May.
0
5
10
15
20
Number of Common Goldeneye Observed at 3 Locations in Cherry Point Aquatic Reserve
Gulf Road
Neptune
South Cape
Figure 9. Number of Common Goldeneye observed on each date at the three locations.

Page 15 Cherry Point Aquatic Reserve Bird Survey 2013-14
Common Loons had counts over 10 in April and October 2013 at Gulf Road. Generally, more loons were seen at Gulf Road and Neptune Beach.
0
2
4
6
8
10
12
14
16
Number of Common Loons Observed at 3 Locations in Cherry Point Aquatic Reserve
Gulf Road
Neptune
South Cape
Figure 10. Number of Common Loons observed on each date at the three locations.

Page 16 Cherry Point Aquatic Reserve Bird Survey 2013-14
No Harlequin Ducks were seen at Neptune Beach. Most Harlequin Ducks were seen at Gulf Road, with a few seen at South Cape. Overall, relatively few Harlequin Ducks were seen during the survey at these locations. Highest count was 10 on April 2014 at Gulf Road.
0
1
2
3
4
5
6
7
8
9
10
Number of Harlequin Ducks Observed at 3 Locations in Cherry Point Aquatic Reserve
Gulf Road
Neptune
South Cape
Figure 11. Number of Harlequin Ducks observed on each date at the three locations.

Page 17 Cherry Point Aquatic Reserve Bird Survey 2013-14
South Cape was where most Surf Scoters were seen throughout the survey, followed by Neptune Beach. Highest counts of surf scoters occurred in late April for both years. Late April is also the time when Cherry Point herring, a well know prey item for surf scoters, spawn (Gustafson, et al, 2006).
0
50
100
150
200
250
300
350
Number of Surf Scoters Observed at 3 Locations in Cherry Point Aquatic Reserve
Gulf Road
Neptune
South Cape
Figure 12. Number of Surf Scoters observed on each date at the three locations.

Page 18 Cherry Point Aquatic Reserve Bird Survey 2013-14
The largest numbers of Western Grebes were seen in April and May 2013 and May 2014. This again corresponds to the period when Cherry Point herring spawn. Large numbers of Western Grebe were seen at Gulf Road and Neptune Beach, but not South Cape.
0
10
20
30
40
50
60
70
Number of Western Grebe Observed at 3 Locations in Cherry Point Aquatic Reserve
Gulf Road
Neptune
South Cape
Figure 13. Shows the number of Western Grebes observed on each date at the three locations.
Page 19 Cherry Point Aquatic Reserve Bird Survey 2013-14
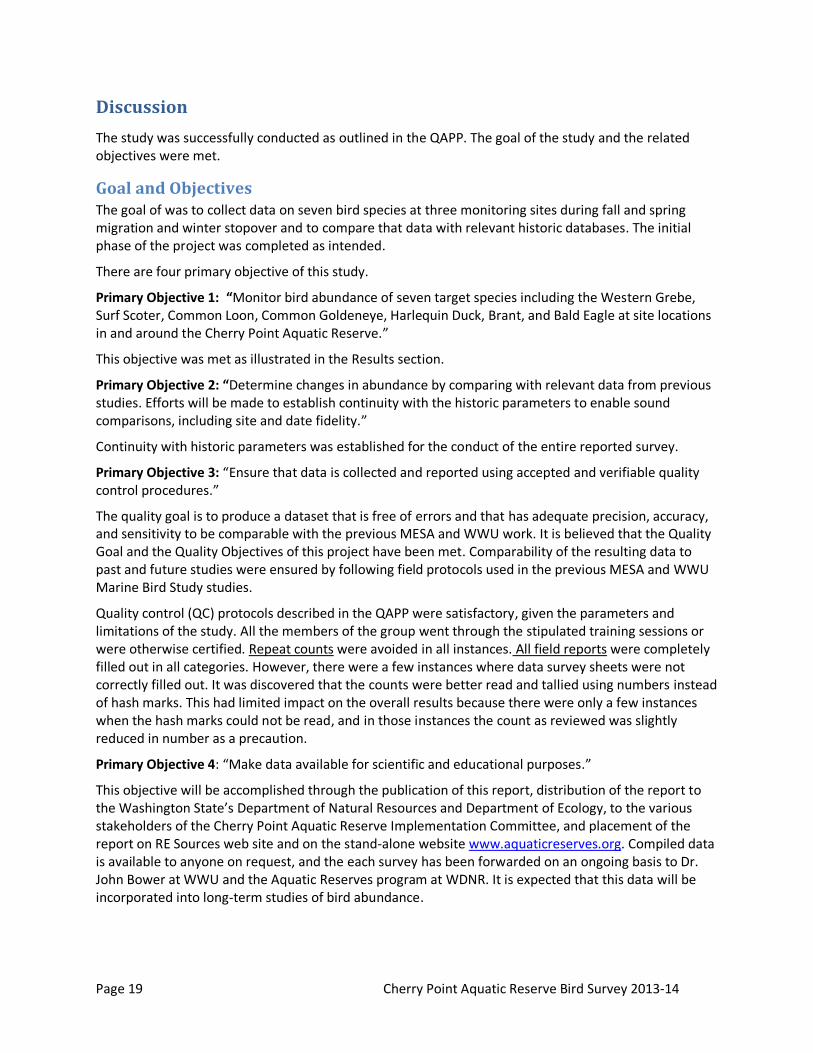
Discussion
The study was successfully conducted as outlined in the QAPP. The goal of the study and the related objectives were met.
Goal and Objectives The goal of was to collect data on seven bird species at three monitoring sites during fall and spring migration and winter stopover and to compare that data with relevant historic databases. The initial phase of the project was completed as intended.
There are four primary objective of this study.
Primary Objective 1: “Monitor bird abundance of seven target species including the Western Grebe, Surf Scoter, Common Loon, Common Goldeneye, Harlequin Duck, Brant, and Bald Eagle at site locations in and around the Cherry Point Aquatic Reserve.”
This objective was met as illustrated in the Results section.
Primary Objective 2: “Determine changes in abundance by comparing with relevant data from previous studies. Efforts will be made to establish continuity with the historic parameters to enable sound comparisons, including site and date fidelity.”
Continuity with historic parameters was established for the conduct of the entire reported survey.
Primary Objective 3: “Ensure that data is collected and reported using accepted and verifiable quality control procedures.”
The quality goal is to produce a dataset that is free of errors and that has adequate precision, accuracy, and sensitivity to be comparable with the previous MESA and WWU work. It is believed that the Quality Goal and the Quality Objectives of this project have been met. Comparability of the resulting data to past and future studies were ensured by following field protocols used in the previous MESA and WWU Marine Bird Study studies.
Quality control (QC) protocols described in the QAPP were satisfactory, given the parameters and limitations of the study. All the members of the group went through the stipulated training sessions or were otherwise certified. Repeat counts were avoided in all instances. All field reports were completely filled out in all categories. However, there were a few instances where data survey sheets were not correctly filled out. It was discovered that the counts were better read and tallied using numbers instead of hash marks. This had limited impact on the overall results because there were only a few instances when the hash marks could not be read, and in those instances the count as reviewed was slightly reduced in number as a precaution.
Primary Objective 4: “Make data available for scientific and educational purposes.”
This objective will be accomplished through the publication of this report, distribution of the report to the Washington State’s Department of Natural Resources and Department of Ecology, to the various stakeholders of the Cherry Point Aquatic Reserve Implementation Committee, and placement of the report on RE Sources web site and on the stand-alone website www.aquaticreserves.org. Compiled data is available to anyone on request, and the each survey has been forwarded on an ongoing basis to Dr. John Bower at WWU and the Aquatic Reserves program at WDNR. It is expected that this data will be incorporated into long-term studies of bird abundance.

Page 20 Cherry Point Aquatic Reserve Bird Survey 2013-14
Secondary Objective: “To effectively train local volunteer bird enthusiasts in scientific process using proper protocol, alpha-numeric codes for birds, understanding of bird ecology, habits and identification through classroom and field training.”
Forty-seven volunteers completed training for the surveys and 25 volunteers, including the three expert counters, participated in the survey. Fifteen volunteers have indicated an interest in continuing for the next survey season commencing September 2014 and continuing through June 2015. Four volunteers have indicated a desire to refine their identification skills in order to become certified as authorized counters for the surveys.
The data-gathering effort from April 2013 through June 2014 produced a complete set of data, but one that required substantial checking by the expert bird counters and by RE Sources due to the need to verify reporting by inexperienced volunteers and to follow QC protocols required by the QAPP.
The group learned several important lessons about the importance of careful training and practice in bird identification, as well as the requirements for scientifically valid survey counting and recording.
A core group of experienced volunteers now exists that will be able to continue future surveys with the help of additional recruits. The project promoted many goals of the citizen science program within the CPAR including environmental education, community outreach, and stewardship development.
See the Recommendations for Planned Procedure and Program Improvements section below for how we anticipate dealing with these issues in future surveys.
Completeness of the study Surveys were successfully conducted at the three designated sites. The planned surveys were completed on all but one month, with the survey on Feb 2014 missed due to bad weather. A minimum of four people attended all surveys, including two expert counters on spotting scopes, one or two scribes, and one or more persons on binoculars as spotters.
Comparison of 2013–2014 Survey Data to Historical Studies This study examines the densities and distributions of seven bird species within the Washington Department of Natural Resources Cherry Point Aquatic Reserve:
Bald Eagle
Brant
Common Goldeneye
Common Loon
Harlequin Duck
Surf Scoter
Western Grebe
This project replicates studies (with a limitation on the number of species recorded) done in the region in the MESA studies (1978-79) and WWU Marine Bird Study studies (2003-2005). The sites used in this study are a subset of the sites that were used in the previous studies. The observations were done in April-June 2013, October-December 2013, and January-June 2014. This replication of survey methodology and location should provide substantial information on the changes in bird density and distribution, especially if it can be continued over a substantial period in future surveys.
Assessment and monitoring methods were those used in the WWU Marine Bird Study (Bower, 2009; Anderson et al 2009). These methods closely follow those of the historic MESA studies (EPA, 1981).

Page 21 Cherry Point Aquatic Reserve Bird Survey 2013-14
The following graphs display the historic data for each of the three birds in two ways:
1. Averaged by month across the three sites for each study, 2. Averaged across the three sites for non-summer months for each study.
The first graphic illustrates the seasonality of bird distribution and the second gives a snapshot of overall abundance for each of the three studies, along with a measure of standard error.
All the data available from the three studies were used to compile these graphics. This includes the following: 24 surveys per site (1978/79), 19 surveys per site (2003/2005), and 15 surveys per site (2013/2014). Notably, surveys were not conducted for the month of March in the 2003/2005 series and for February in the 2013/2014 series. Surveys for the months of June-August were removed from averaged graphs because of lack of consistent surveys over the separate studies.

Page 22 Cherry Point Aquatic Reserve Bird Survey 2013-14
Figure 14: Average number of Bald Eagles observed at 3 sites for the years 1978-79, 2003-05, 2013-
2014 during the months Jan-May and September-December. No surveys were conducted in March 2003/05 and in February 2013/14
Bald Eagles did not increase between the 1970’s and 2000’s in the Cherry Point area, despite a significant increase in the greater region (Bower 2009), but appear to have increased between 2003/2005 and 2013-2014. The increase across the region can be attributed to the banning of DDT and other regulations set in place in the 70’s (US Fish and Wildlife Service 2014). Spring was the most abundant period for each study.
0
0.5
1
1.5
2
2.5
Jan Feb Mar Apr May Sep Oct Nov Dec
Nu
mb
er
of
Bir
ds
Month
Average Number of Bald Eagles Observed at 3 Sites for the years 1978-79, 2003-05, 2013-14, for the months Jan-May and Sept-Dec.
1978-1979
2003-2005
2013-2014
0.0
0.2
0.4
0.6
0.8
1.0
1.2
1.4
1.6
1.8
2.0
1978/1979 2003/2005 2013/2014
Nu
mb
er o
f B
ird
s
Average Number of Bald Eagles Observed from 3 sites at the Cherry Point Aquatic Reserve in 1978-79, 2003-05, and 2013-14
Figure 15. Average number of Bald Eagles observed from 3 sites from September-May for the
years 1978-79, 2003-05 and 2013-2014. Error bars show standard error.

Page 23 Cherry Point Aquatic Reserve Bird Survey 2013-14
Brant counts in the Cherry Point area increased between the 1970’s and the 2000’s and remained higher in the 2013/2014 study. This increase may reflect a northward movement of wintering Brant suggested by Bower (2009). However, Bower’s 2009 study noted that the abundance of Brant was highly varied over areas surveyed, with Brant abundance decreasing overall in northwest Washington inland waters (Bower, 2009; Evenson 2010) but increasing in some areas such as Padilla Bay (Anderson et al 2009) and some northern areas (Bower 2010). In fact, our study showed high counts only at the South Cape site. Winter and spring were the most abundant period in the studies.
0
100
200
300
400
500
Nu
mb
er
of
Bir
ds
Month
Average Number of Brants at 3 Sites for the years 1978-79, 2003-05, 2013-14, for the months January-May and
September-December
1978-1979
2003-2005
2013-2014
0.0
10.0
20.0
30.0
40.0
50.0
60.0
70.0
80.0
90.0
100.0
1978/1979 2003/2005 2013/2014
Nu
mb
er o
f B
ird
s
Average Number of Brant Observed from 3 sites at the Cherry Point Aquatic Reserve in 1978-79, 2003-05, and 2013-14
Figure 17. Average number of Brant observed from 3 sites from September-May for the years
1978-79, 2003-05 and 2013-2014. Error bars show standard error.
Figure 16. Average number of Brant observed at 3 sites for the years 1978-79, 2003-05,
2013-2014 during the months Jan-May and September-December. No surveys were conducted
in March 2003/05 and in February 2013/14
Page 24 Cherry Point Aquatic Reserve Bird Survey 2013-14
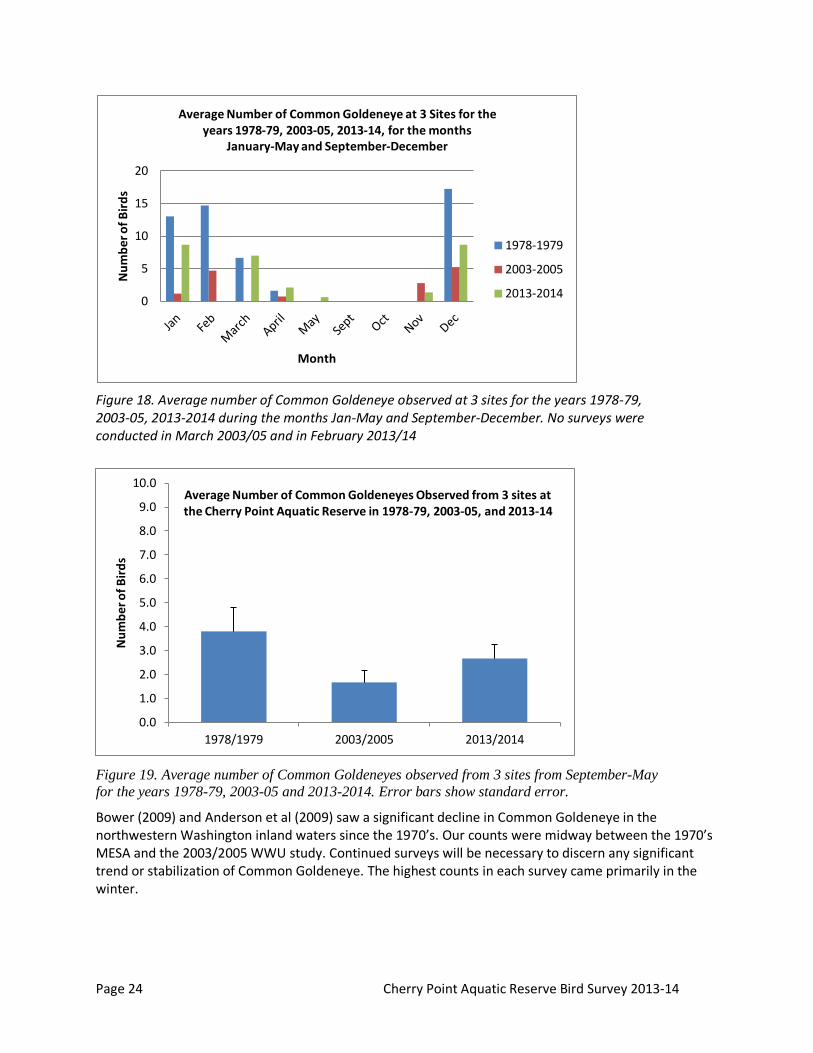
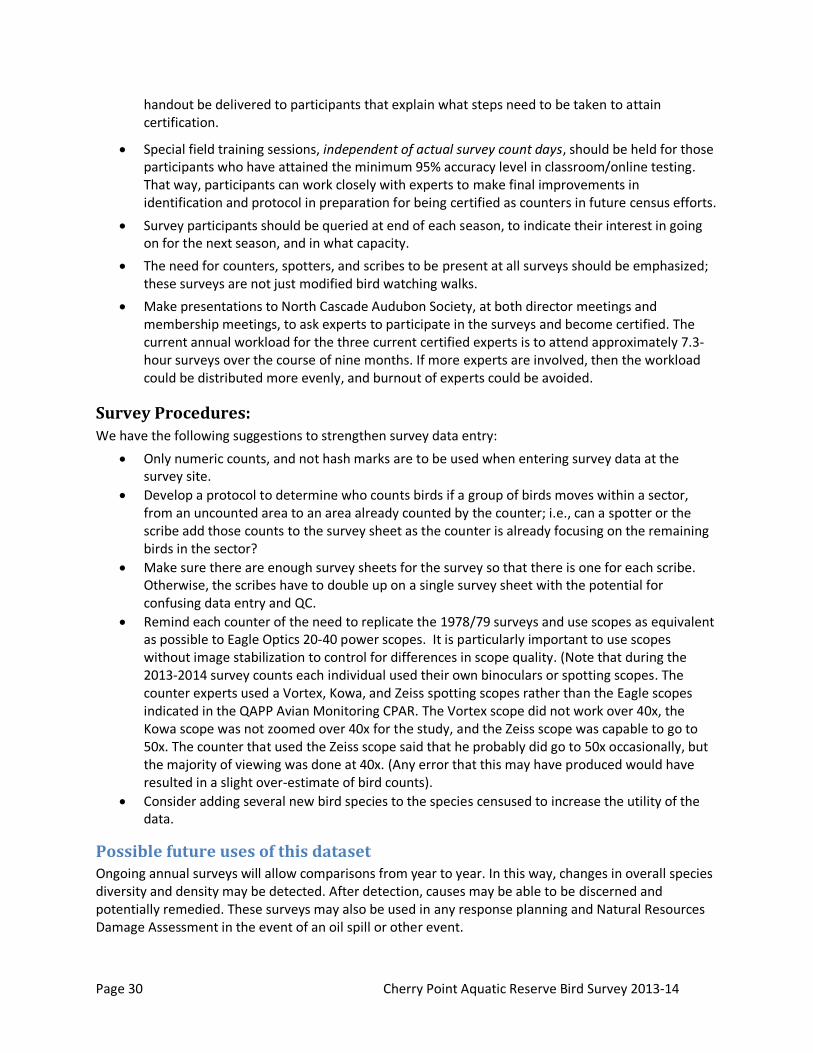
Bower (2009) and Anderson et al (2009) saw a significant decline in Common Goldeneye in the northwestern Washington inland waters since the 1970’s. Our counts were midway between the 1970’s MESA and the 2003/2005 WWU study. Continued surveys will be necessary to discern any significant trend or stabilization of Common Goldeneye. The highest counts in each survey came primarily in the winter.
0
5
10
15
20
Nu
mb
er
of
Bir
ds
Month
Average Number of Common Goldeneye at 3 Sites for the years 1978-79, 2003-05, 2013-14, for the months
January-May and September-December
1978-1979
2003-2005
2013-2014
0.0
1.0
2.0
3.0
4.0
5.0
6.0
7.0
8.0
9.0
10.0
1978/1979 2003/2005 2013/2014
Nu
mb
er o
f B
ird
s
Average Number of Common Goldeneyes Observed from 3 sites at the Cherry Point Aquatic Reserve in 1978-79, 2003-05, and 2013-14
Figure 19. Average number of Common Goldeneyes observed from 3 sites from September-May
for the years 1978-79, 2003-05 and 2013-2014. Error bars show standard error.
Figure 18. Average number of Common Goldeneye observed at 3 sites for the years 1978-79, 2003-05, 2013-2014 during the months Jan-May and September-December. No surveys were conducted in March 2003/05 and in February 2013/14

Page 25 Cherry Point Aquatic Reserve Bird Survey 2013-14
Common Loons have increased since the initial MESA study, which is consistent with significant increases in northwestern Washington inland waters (Bower 2009). The most abundant time of year for each study was primarily during the winter, though common loons are seen in the Cherry Pt. area year-round.
0.0
2.0
4.0
6.0
8.0
10.0
12.0
Nu
mb
er
of
Bir
ds
Month
Average Number of Common Loons at 3 Sites for the years 1978-79, 2003-05, 2013-14, for the months January-May and
September-December
1978-1979
2003-2005
2013-2014
0
1
2
3
4
5
6
7
8
9
10
1978/1979 2003/2005 2013/2014
Nu
mb
er o
f B
ird
s
Average Number of Common Loons Observed from 3 sites at the Cherry Point Aquatic Reserve in 1978-79, 2003-05, and 2013-14
Figure 21. Average number of Common Loons observed from 3 sites from September-May for the years 1978-79, 2003-05 and 2013-2014. Error bars show standard error.
Figure 20. Average number of Common Loons observed at 3 sites for the years 1978-79, 2003-05,
2013-2014 during the months Jan-May and September-December No surveys were conducted in March 2003/05 and in February 2013/14

Page 26 Cherry Point Aquatic Reserve Bird Survey 2013-14
Harlequin Duck counts were higher in the MESA and Bower/WWU surveys than in the current study (Bower 2009). The most abundant time of year for the surveys was winter and spring with a high average count of five in the December MESA study. Continued surveying at our sites will be needed to confirm the apparent negative trend.
0.0
1.0
2.0
3.0
4.0
5.0
6.0
Nu
mb
er
of
Bir
ds
Month
Average Number of Harlequin Ducks at 3 Sites for the years 1978-79 2003-05, 2013-14, for the months January-May and
September-December
1978-1979
2003-2005
2013-2014
0.0
1.0
2.0
3.0
4.0
5.0
6.0
7.0
8.0
9.0
10.0
1978/1979 2003/2005 2013/2014
Nu
mb
er o
f B
ird
s
Average Number of Harlequin Ducks Observed from 3 sites at the Cherry Point Aquatic Reserve in 1978-79, 2003-05, and 2013-14
Figure 23. Average number of Harlequin Ducks observed from 3 sites from September-May for the years 1978-79, 2003-05 and 2013-2014. Error bars show standard error.
Figure 22. Average number of Harlequin Ducks observed at 3 sites for the years 1978-79, 2003-
05, 2013-2014 during the months Jan-May and September-December. No surveys were conducted in March 2003/05 and in February 2013/14.

Page 27 Cherry Point Aquatic Reserve Bird Survey 2013-14
Surf Scoter counts have decreased dramatically since 1978/1979, primarily due to the collapse of the herring spawn event at Cherry Point (Bower, 2009). The highest counts were April and May for all studies.
1.0
10.0
100.0
1000.0
10000.0
Nu
mb
er
of
Bir
ds
Month
Average Number of Surf Scoters Observed at 3 Sites for the years 1978-79 2003-05, 2013-14, for the months January-May
and September-December
1978-1979
2003-2005
2013-2014
0
200
400
600
800
1000
1200
1400
1600
1800
2000
1978/1979 2003/2005 2013/2014
Nu
mb
er o
f B
ird
s
Average Number of Surf Scoters Observed from 3 sites at the Cherry Point Aquatic Reserve in 1978-79, 2003-05, and 2013-14
Figure 25. Average number of Surf Scoters observed from 3 sites from September-May for the
years 1978-79, 2003-05 and 2013-2014. Error bars show standard error.
Figure 24. Average number of Surf Scoters observed at 3 sites for the years1978-79, 2003-05 and
2013-14 during the months January-May and September-December. No surveys were conducted in March 2003/05 and in February 2013/14. Numbers are displayed on a log scale.

Page 28 Cherry Point Aquatic Reserve Bird Survey 2013-14
Western Grebe counts for Cherry Point increased slightly between the 1970’s MESA study and the 2003/2005 WWU study, but decreased dramatically in northwestern inland waters between the 1970’s and 2003/2005 (Bower 2009, Evenson et al 2010). In the current study, Western Grebes appear to have declined in the Cherry Point area, as well. The most abundant time of year for Western Grebes was October-January in all the surveys.
Summary of Bird Abundance Changes The comparisons of bird counts over the three surveys show that, in general, our results are in agreement with the numbers seen by Bower (2009). Strongest agreement was shown for Brant and
0.0
20.0
40.0
60.0
80.0
Nu
mb
er
of
Bir
ds
Month
Average Number of Western Grebes at 3 Sites for the years 1978-79 2003-05, 2013-14, for the months January-May and
September-December
1978-1979
2003-2005
2013-2014
0
5
10
15
20
25
30
1978/1979 2003/2005 2013/2014
Nu
mb
er o
f B
ird
s
Average Number of Western Grebes Observed from 3 sites at the Cherry Point Aquatic Reserve in 1978-79, 2003-05, and 2013-14
Figure 27. Average number of Western Grebes observed from 3 sites from September-May for the
years 1978-79, 2003-05 and 2013-2014. Error bars show standard error.
Figure 26. Average number of Western Grebes observed at 3 sites for the years1978-79, 2003-05
and 2013-14 during the months January-May and September-December. No surveys were conducted in March 2003/05 and in February 2013/14

Page 29 Cherry Point Aquatic Reserve Bird Survey 2013-14
Common Loon, which had increased since the 1970’s MESA study, and for Surf Scoter, which had decreased since the 1970’s MESA study.
Since the 2003/2005 WWU study, the abundance of some birds has appeared to change. The number of Bald Eagles has appeared to increase since the 1970’s and 2003/2005. The number of Harlequin Ducks appears to have fluctuated over the course of the three studies. Bower (2009) saw a significant increase in Harlequin Ducks Sound-wide and stable numbers at these three Cherry Point sites, whereas we saw what appears to be a decrease in abundance since 2003/05. The abundance of Western Grebe at Cherry Point has also appeared to decrease since the 2003/2005 study.
We believe that continued monitoring of these birds at these historic sites will increase the robustness of the dataset and contribute to our long-term knowledge.
Relative Seasonal Abundance of seven target bird species We did determine relative seasonal abundance during the survey period, which indicated that for all species counted, with the exception of Common Goldeneye, the numbers of birds per species were highest in April, with some carry over to May. Common Loon and Harlequin Duck also had high counts in October in addition to high counts in April. Common Goldeneye counts were highest, however, in December and January.
We suspect that high April and May counts are in part due to the presence of herring spawn as prey at Cherry Point. Most of Washington State’s herring stocks spawn between mid- January and early April. The notable exception is the Cherry Point stock in north Puget Sound, which spawns from early April through early June (Gustafson, et al, 2006).
Feasibility of continuing this study Many enthusiastic volunteers participated this first year, likely due in part to the draw of the CPAR, a place that is relatively close to urban centers but not very familiar to urban residents, and one in which environmental and industrial interests overlap. However, we note that while 31 volunteers participated in the 2013 training sessions, the 2014 training sessions attracted 16 volunteers. We identify below suggestions for increasing the number of skilled survey counters to increase the pool of participants.
We anticipate that current participants’ enthusiasm and interest will remain high given the beauty and natural resources many have learned to appreciate. We believe that continuing the annual surveys will expand a cadre of experts as they learn stronger identification skills, including people who can effectively implement the QC protocols.
Data processing and QC were somewhat challenging in this first year. We have identified ways to streamline data entry (discussed below) that will eliminate errors and speed up the work.
We do expect that continued funding for the project will be needed as the coordination and quality assurance workload is quite heavy during the survey preparation and implementation season. An unsupported volunteer-led effort could probably not be sustained indefinitely.
Recommendations for Planned Program and Procedure Improvements
Training:
We have the following suggestions to strengthen training:
Participants should be formally informed of the process to become eligible for certification as an expert counter. At the end of the four two-hour training sessions, we suggest that a printed
Page 30 Cherry Point Aquatic Reserve Bird Survey 2013-14
handout be delivered to participants that explain what steps need to be taken to attain certification.
Special field training sessions, independent of actual survey count days, should be held for those participants who have attained the minimum 95% accuracy level in classroom/online testing. That way, participants can work closely with experts to make final improvements in identification and protocol in preparation for being certified as counters in future census efforts.
Survey participants should be queried at end of each season, to indicate their interest in going on for the next season, and in what capacity.
The need for counters, spotters, and scribes to be present at all surveys should be emphasized; these surveys are not just modified bird watching walks.
Make presentations to North Cascade Audubon Society, at both director meetings and membership meetings, to ask experts to participate in the surveys and become certified. The current annual workload for the three current certified experts is to attend approximately 7.3-hour surveys over the course of nine months. If more experts are involved, then the workload could be distributed more evenly, and burnout of experts could be avoided.
Survey Procedures:
We have the following suggestions to strengthen survey data entry:
Only numeric counts, and not hash marks are to be used when entering survey data at the survey site.
Develop a protocol to determine who counts birds if a group of birds moves within a sector, from an uncounted area to an area already counted by the counter; i.e., can a spotter or the scribe add those counts to the survey sheet as the counter is already focusing on the remaining birds in the sector?
Make sure there are enough survey sheets for the survey so that there is one for each scribe. Otherwise, the scribes have to double up on a single survey sheet with the potential for confusing data entry and QC.
Remind each counter of the need to replicate the 1978/79 surveys and use scopes as equivalent as possible to Eagle Optics 20-40 power scopes. It is particularly important to use scopes without image stabilization to control for differences in scope quality. (Note that during the 2013-2014 survey counts each individual used their own binoculars or spotting scopes. The counter experts used a Vortex, Kowa, and Zeiss spotting scopes rather than the Eagle scopes indicated in the QAPP Avian Monitoring CPAR. The Vortex scope did not work over 40x, the Kowa scope was not zoomed over 40x for the study, and the Zeiss scope was capable to go to 50x. The counter that used the Zeiss scope said that he probably did go to 50x occasionally, but the majority of viewing was done at 40x. (Any error that this may have produced would have resulted in a slight over-estimate of bird counts).
Consider adding several new bird species to the species censused to increase the utility of the data.
Possible future uses of this dataset Ongoing annual surveys will allow comparisons from year to year. In this way, changes in overall species diversity and density may be detected. After detection, causes may be able to be discerned and potentially remedied. These surveys may also be used in any response planning and Natural Resources Damage Assessment in the event of an oil spill or other event.
Page 31 Cherry Point Aquatic Reserve Bird Survey 2013-14
References
Anderson, E.M., Bower, J.L., Nysewander, D.R., Evenson, J.R. & Lovvorn, J.R. 2009. Changes in avifaunal abundance in a heavily used wintering and migration site in Puget Sound, Washington, during 1966–2007. Marine Ornithology 37: 19–27. Bower, J.L. 2009. Changes in Marine Bird Abundance in Salish Sea: 1975 to 2007. Marine Ornithology 37: 9-17. Ecology, 2004. Guidelines for Preparing Quality Assurance Project Plans for Environmental Studies. Washington State Department of Ecology. Publication # 01-03-003. EPA, 1981. Marine Bird populations of the Strait of Juan de Fuca, Georgia Strait, and Adjacent Waters in 1978 and 1979. Publication # EPA- 600/ 7-81-156. Evenson, J.R, D.R. Nysewander, B.L. Murphie, and T.A. Cyra. 2010. Marine Bird and Mammal Component of the Puget Sound Ambient Monitoring Program web reports. Washington Department of Fish and Wildlife, Olympia, WA. Available at: http://wdfw.wa.gov/mapping/psamp/index.html. Gustafson R.G., J. Drake, M.J. Ford, J.M. Myers, E.E.Holmes, and R.S. Waples. 2006. Status review of CherryPoint Pacific herring (Clupea pallasii) and updated status review of the Georgia Basin Pacific herring distinct population segment under the Endangered Species Act. U.S.Dept. Commer., NOAA Tech. Memo. NMFS-NWFSC-76,182 p.
LNR, 2010. Lummi Intertidal Baseline Inventory. Appendix D: Shorebird and Marine Mammal Survey. Lummi Natural Resources Department March 2010. Available at http://lnnr.lummi-nsn.gov/LummiWebsite/userfiles/1_Appendix_D_Shorebirds_v4.0.pdf (Accessed April 7, 2013) Puget Sound Water Quality Action Team. 2002. Puget Sound Update: Eighth Report of the Puget Sound Ambient Monitoring Program. Puget Sound Water Quality Action Team. Olympia, Washington. US Fish and Wildlife Service. Questions and Answers about Bald Eagles Recovery and Delisting. Accessed 9/11/2014 at http://www.fws.gov/midwest/eagle/recovery/qandas.html
WDNR, 2010. Cherry Point Environmental Aquatic Reserve Management Plan. Available at: http://www.dnr.wa.gov/Publications/aqr_cp_mgmt_plan_2010.pdf (Accessed April 7, 2013). WDNR, 2011. Nisqually Reach Aquatic Reserve Management Plan. Accessed March 24, 2013 at http://www.dnr.wa.gov/Publications/aqr_nisqually_reserve_finalplan_2011.pdf.
Page 32 Cherry Point Aquatic Reserve Bird Survey 2013-14
Acknowledgments
Many thanks goes to the pilot and co-pilot of this project: Kelley Palmer McCarty put together all of the teaching materials for the classes, taught two four-week series of classes, and was the expert counter for many of the surveys. Paul Woodcock co-taught one of the class series, offered a refresher course, and was also an expert counter for many of the surveys.
We would also like to thank Tom Gries for his review and comments on this report.
We extend gratitude to the North Cascades Audubon Society for helping publicize the project, to RE Sources intern Taylor Garrod for data entry and assistance with graphics, and to WEC Project coordinator Maddie Foutch for formatting assistance and support throughout the project.
We also would like to extend a heartfelt thank you to all of the committee members and volunteers who helped plan the surveys and who took part in the surveys. This work would not have happened without your interest and dedication.