Bird census and survey techniques pdf
40
2 Bird census and survey techniques Richard D. Gregory, David W. Gibbons, and Paul F. Donald 2.1 Introduction In Chapter 1, we saw how it was possible to use simple methods to assess the species composition in an area and to give an idea of their relative abundances. Here, we consider methods that will allow us to derive estimates of population size or density or, where this is unnecessary or impossible, population indices. Armed with such information over a number of years, we can then track changes in population levels and, where appropriate, compare population levels between different sites. As described in Chapter 1, the distinction between a census and a survey is somewhat artificial, but here we use census to describe a particular type of survey that counts the total numbers in an area (Figure 2.1). 2.1.1 What are bird surveys and why do we need them? If we need a reliable estimate or index of the population size of a particular species in a given area, then we must undertake a survey. There may be a number of reasons for wishing to do this. It may simply be that, as the owner of a nature reserve, we wish to know how many individuals of a particular species of bird are present, or we may need baseline information for an area, or a species, that is poorly known. If repeated at regular intervals, the counts allow us to track changes in bird populations. Alternatively, it may be because a piece of land is being developed (e.g. turned into an industrial area) and we need to undertake an assess- ment of the likely impact of the development on the nature conservation value of the land. Frequently, bird survey data are used to assess whether a piece of land should receive legal protection from governments and their agencies; such desig- nations are important to conservation because they are intended to constrain potentially damaging activities. Information on population sizes of individual species can also be used to set priorities, allowing conservation effort to be focused on those species most in need of attention. In general, smaller population size is Suther-02.qxd 5/12/04 1:04 PM Page 17
Transcript of Bird census and survey techniques pdf

2Bird census and survey techniques
Richard D. Gregory, David W. Gibbons, and Paul F. Donald
2.1 Introduction
In Chapter 1, we saw how it was possible to use simple methods to assess thespecies composition in an area and to give an idea of their relative abundances.Here, we consider methods that will allow us to derive estimates of populationsize or density or, where this is unnecessary or impossible, population indices.Armed with such information over a number of years, we can then track changesin population levels and, where appropriate, compare population levels betweendifferent sites. As described in Chapter 1, the distinction between a census anda survey is somewhat artificial, but here we use census to describe a particular typeof survey that counts the total numbers in an area (Figure 2.1).
2.1.1 What are bird surveys and why do we need them?
If we need a reliable estimate or index of the population size of a particular speciesin a given area, then we must undertake a survey. There may be a number ofreasons for wishing to do this. It may simply be that, as the owner of a naturereserve, we wish to know how many individuals of a particular species of bird arepresent, or we may need baseline information for an area, or a species, that ispoorly known. If repeated at regular intervals, the counts allow us to track changesin bird populations. Alternatively, it may be because a piece of land is beingdeveloped (e.g. turned into an industrial area) and we need to undertake an assess-ment of the likely impact of the development on the nature conservation value ofthe land. Frequently, bird survey data are used to assess whether a piece of landshould receive legal protection from governments and their agencies; such desig-nations are important to conservation because they are intended to constrainpotentially damaging activities. Information on population sizes of individualspecies can also be used to set priorities, allowing conservation effort to be focusedon those species most in need of attention. In general, smaller population size is
Suther-02.qxd 5/12/04 1:04 PM Page 17

associated with greater risk of extinction locally, regionally, or globally. Suchinformation is collected by undertaking surveys over varying geographical areas.The lists of globally threatened bird species (BirdLife International 2000) or ofspecies of conservation concern in individual continents, countries or regions(e.g. Carter et al. 2000; Gregory et al. 2002; www.partnersinflight.org), are basedlargely on information on population size. In addition, surveys can be used tocollect information on where birds are in relation to different habitats, and soassess habitat associations.
2.1.2 What is monitoring and why do we need it?
Monitoring is a simple step on from a survey, in that by undertaking repeatsurveys we can estimate the population trend of a particular species over time.Here consistency of method is crucial to measuring genuine population fluctua-tions. Trend data are central to setting species conservation priorities. All otherthings being equal (e.g. population, range size and productivity), a species whosepopulation is declining will be of higher conservation priority than one that isnot. Monitoring has more uses than this, however. If a monitoring program iswell designed, it can be a research tool in its own right providing that suitableenvironmental data (e.g. habitats, predators, food supplies, weather) are collected,or are available elsewhere. Frequently, such analyses provide early pointerstowards the underlying causes of trends in species numbers. The monitoring of
18 | Bird census and survey techniques
Counting method
“Bird survey”
Entire study area
∼“true census”
Incomplete countComplete count∼“census”
Portion of study area
∼“plot or strip census”
Entire study area
Unadjusted count
method
Portion of study area
∼plot or square
Detectability adjusted
count
Fig. 2.1 Distinctions between surveys and censuses. Census counts, by their nature,
require no correction for detectability. All other counts, here termed “incomplete
counts,” can be used in their unadjusted, raw form, or preferably with adjustment for
detectability (adapted from Thompson 2002).
Suther-02.qxd 5/12/04 1:04 PM Page 18

demographic parameters, considered in Chapters 3 and 5, can also yield cluesabout the underlying demographic mechanisms, for example, declining pro-ductivity or declining adult survival that may drive a decline in numbers.Monitoring also plays a role in ascertaining the success or failure of conservationactions by faithfully recording their outcomes—these actions might be theacquisition of land to protect particular species, the adoption of new manage-ment practices, species recovery programs, or the success of government envi-ronmental policies. Sadly, such monitoring is often neglected and the trueefficacy of conservation actions is then hard to evaluate.
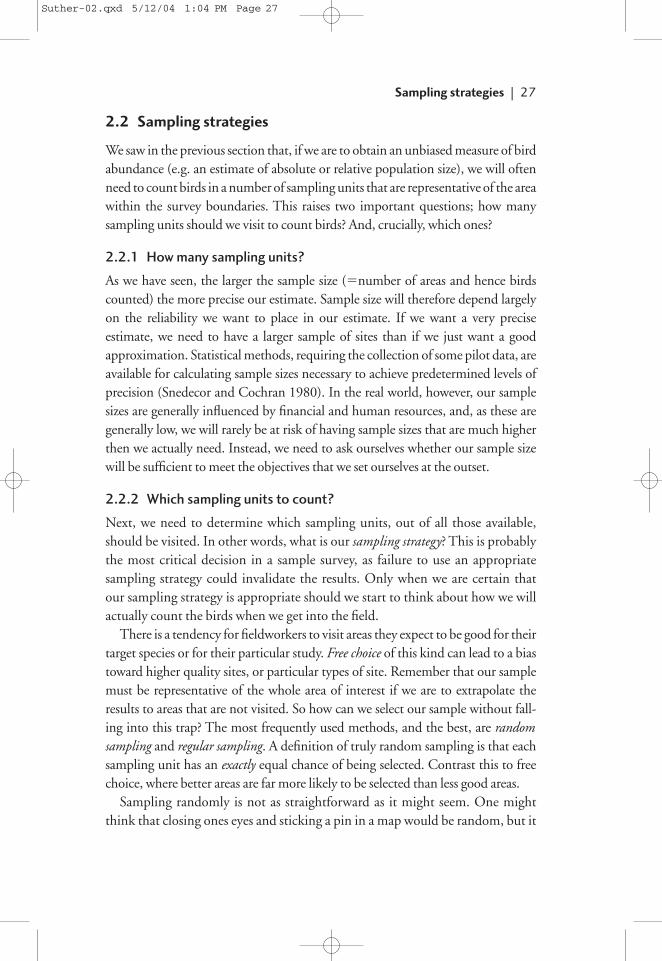
In some circumstances, birds can be excellent barometers of wider environ-mental health, particularly when such assessments use summarized data froma wide range of species (Bibby 1999, see also Niemi et al. 1997). Two of the best examples of such indicators are WWF’s Living Planet Index (Loh 2002,www.panda.org/news_facts/publications/general/livingplanet/index.cfm), andthe UK Government’s headline indicator of wild bird populations (Figure 2.2;Gregory et al. 2003, www.sustainable-development.gov.uk/indicators/headline/h13.htm).
2.1.3 Useful sources of information
This chapter is an introduction to survey design. The following publicationsgive more detail: Ralph and Scott (1981), Ralph et al. (1995), Bibby et al.
Introduction | 19
50
60
70
80
90
100
110
120
19
70
19
71
19
72
19
73
19
74
19
75
19
76
19
77
19
78
19
79
19
80
19
81
19
82
19
83
19
84
19
85
19
86
19
87
19
88
19
89
19
90
19
91
19
92
19
93
19
94
19
95
19
96
19
97
19
98
19
99
20
00
Year
Ind
ex (
19
70
=1
00
)
All species (105)Farmland species (19)Woodland species (33)
Fig. 2.2 The UK Government’s Quality of Life indicator showing population
trends among common native breeding birds.
Suther-02.qxd 5/12/04 1:04 PM Page 19

(1998, 2000), and Bennun and Howell (2002). In addition, Gilbert et al.(1998) and Steinkamp et al. (2003) outline species-specific methods for manytypes of birds, while Greenwood (1996) introduces the underlying theory.Finally, Buckland et al. (2001) describe special methods for density estimation,known as distance sampling (see below), which use data from line or pointtransects.
2.1.4 Begin at the beginning
Before rushing into undertake a survey or set up a monitoring program, we firstneed to clarify our objectives and review our resources. This is a key stage in plan-ning, and any ambiguity or uncertainty at this point could be fatal—wastingtime and money, and limiting the usefulness of the results. A common mistake isto be overambitious and try to collect much more information than is strictlyrequired to the point where this compromises quality and other activities. A useful technique here is to list your goals, the data required to fulfill them, thetime required to collect these data, and then revisit and prioritize your aims. It isalways tempting to ask a whole range of interesting questions, but in attemptingto do so, you may fail to answer the key ones. This section outlines how to goabout planning a survey; information on sampling strategies and field methodsare developed in later sections.
The key decisions to take are:
• Do we want to estimate population size accurately or will an index meetour needs? In other words, are we interested in absolute or relativeabundance?
• Where will we undertake the survey?• Should we cover the whole area of interest, or only sample part of it?• If we plan to sample, how should we select the study sites?• What geographical sampling units will we use? Mapped grid squares, forest
blocks, or other parcels of land?• What field method will we use?• What are the recording units for the birds: individuals, singing males, breed-
ing pairs, nests or territories?• How will the subsequent data analysis be carried out?• How will the results be reported and used?
A useful way of planning a survey is to try to envisage clearly the finishedproduct, even down to the details of what tables of data you wish to include inyour report. This will clarify the various stages that you need to go through tocollect these data.
20 | Bird census and survey techniques
Suther-02.qxd 5/12/04 1:04 PM Page 20

2.1.5 Population size or index?
If the aim of our survey is to determine accurately the population size (�totalnumbers) of a species in a particular area, then a population index is insufficientfor our needs. If, for example, we want to estimate the global population of theRaso Lark Alauda razae on its tiny island home, or the numbers of Sharpe’sLongclaw Macronyx sharpei, on a particular grassland, then we must choosea method that yields an absolute measure of population size and where errorcan be estimated. If, however, we are not interested in having populationsize per se, only whether a population is increasing, decreasing or stable, then a population index would meet our objectives. The implicit assumption here isthat there is a direct correlation between the population index and the true, butunknown, population size. A population index is a measure of population size inwhich the precise relationship between the index and population size is often notknown. The index, however, should ideally be directly proportional to changesin population size, such that if the population doubles then so does the index.Population monitoring can be achieved by obtaining, over a period of years,repeated measures of population size or index; frequently the latter is much lessresource-intensive than the former and a reliable index is preferable to a poorcount. As we saw in the previous chapter, because we are often interested in quitelarge changes in populations to trigger conservation action (such as 25–50%declines: Gregory et al. 2002), then simple methods are often more efficient.
In truth, the distinction between an estimate of population size and an indexmay be less we think, because in neither case do we actually know the realpopulation size.
2.1.6 Survey boundaries
The decision on where to undertake the survey again depends on its objectives,which should guide the setting of survey boundaries. These boundaries are largelyself-evident if we want to obtain an estimate of the numbers of one or morespecies in a discrete habitat area, such as a forest or marsh, or in a particulargeopolitical (e.g. country) or geographical (e.g. island) area.
Survey efficiency, however, can be greatly improved if we further refine theboundaries within the area of interest, as it is likely that the species will not bepresent everywhere. It would be inefficient to cover large areas of clearly unsuitablehabitat, but conversely little confidence could be placed on a study that excludedareas or habitats in which the species might be present. Boundary setting shouldbe based on existing information, ideally previously available distributional data.If the general distribution of the species has been mapped by an atlas project
Introduction | 21
Suther-02.qxd 5/12/04 1:04 PM Page 21

(see Chapter 1), then set the boundaries of the survey to those shown by theatlas—but be aware of any limitations to the original data collection. If suchinformation is not available—and for most parts of the world it will not be, orit is of uncertain provenance—then set your boundaries based on factors thatyou think might affect the species distribution, for example, altitudinal or habitatpreferences. For example, Arendt et al. (1999), set the boundaries for theirsurvey of the critically endangered Montserrat Oriole Icterus oberi on the knowndistribution of its favored habitat, humid and wet tropical forest, supplementedby knowledge of the bird’s distribution from local foresters. Some areas outsidethis boundary were also checked, but no orioles were found.
Frequently, decisions on where to set survey boundaries, and on how to designthe survey within those boundaries are closely linked. In many situations, ourknowledge of a species’ distribution and ecology is based on relatively scant andsometimes uncertain information. In this instance, we need to be more carefulin defining our survey boundaries and be cautious of the received wisdom. Theareas or habitats with uncertain information become particularly importantwhen they are large in extent. The practical implication is that we will often needto collect data over a wider area than is apparent at first sight, although it issensible to sample at a much lower intensity in peripheral areas. This is the basisof stratification, which will be discussed in more detail later. It is also sensible tocount over a larger area when a bird is known, or suspected, to be expandingits range. Paradoxically, it can be as important to confirm that a bird does notoccur in an area (and record a nil count), as it is to count it where it does occur.
2.1.7 Census or sample?
The next decision is whether to undertake a true census by attempting to countall birds, pairs or nests within the survey boundary, or to count in only a sampleof areas within the survey boundary. While it might be tempting to census thewhole area for the sake of completeness, it is often considerably more effectiveto census or survey representative sample areas and to extrapolate the results toobtain a figure for the total population with estimates of the likely error. Highlyclumped and conspicuous species, such as breeding seabirds or non-breedingwaterbirds, may be more amenable to counting most of the population at a limited number of sites. Where numbers are extremely large, however, within-site sampling may also be advisable. Rare birds with restricted ranges are ofteneasier to count using a true census, because sampling might record too few birdsto produce a reliable estimate. For more common and widespread species, itmay be expensive and unnecessary to count the whole area, and it might be more cost-effective to census or survey a representative selection of areas.
22 | Bird census and survey techniques
Suther-02.qxd 5/12/04 1:04 PM Page 22

It is possible to mix sample and census approaches within the same survey.Thus, in some areas or habitats a census of all birds is used, for example, wheredensities are high in limited geographical areas, yet in others only a sample ofareas or habitats is counted, for example, where densities are low over wide areas.
2.1.8 Sampling strategy
If we decide to undertake a sample survey, we need to be very clear about thesampling strategy. We need to ensure that the areas in which we count are trulyrepresentative of the area within the survey boundaries. If they are not, our finalestimate or index may be biased in an unknown manner. Strategies based onrandom, random stratified or regular sampling (also known as systematic sampling)are likely to be most robust. As this is such an important topic, it is outlined later.
2.1.9 Sampling unit
In tandem with our sampling strategy, we need to decide upon our sampling unit,the bits of the whole survey area we actually count birds in. This might be agrid square, the precise location and boundaries of which are available from maps.The area encompassed within the survey boundary can be subdivided into a largenumber of grid squares on a map, and a sample of these squares chosen at random for survey. While this approach is simple and statistically sound, it may notalways be practical. It might be difficult to use, for example, when surveying birdsliving in fragmented forest plots of variable size surrounded by farmed land.In such circumstances, individual plots can become the sampling unit. In this case,unlike the grid squares, the individual sampling units are likely to vary in size.
2.1.10 Field methods
We now need to consider what field method we will use to count the birds. Thereare a variety of options and the one we choose will depend upon the species orgroup of species being counted, the habitats involved and the level of detailrequired. For some species, it is necessary to develop specially tailored methods(see Gilbert et al. 1998; Steinkamp et al. 2003). If we are trying to survey a num-ber of species together, however, then we need a generic method that will encom-pass most species well. There are two principal methods for generic or singlespecies surveys; mapping and transects. These methods, plus others with specificuses, are outlined below.
2.1.11 Accuracy, precision, and bias
The terms accuracy, precision, and bias have specific meanings when applied toscientific data, such as bird surveys, though accuracy and precision are generally
Introduction | 23
Suther-02.qxd 5/12/04 1:04 PM Page 23

interchangeable in common use. It is extremely important to understand theseterms at the outset and to use them appropriately when we report survey results.As we will see, survey design essentially revolves around the twin aims of increas-ing accuracy and precision and reducing bias, but this is easier said than done.
Accuracy is a measure of how close our estimate is to the true population. Forexample, if our estimate is 510 parrots and the true population is 500, mostpeople would accept that our estimate was quite accurate. If our estimate is510 but the true population is 2000 parrots, then our estimate is patently inac-curate. Of course, the problem is that we usually do not know the actual num-bers and so it is extremely difficult to measure accuracy. In most circumstances,it is practically impossible to count every last individual in a population, andeven if it were technically possible, it would be prohibitively expensive. The onlypractical way to measure accuracy would be to carry out very intensive work insmall areas and to calibrate the findings with a wider survey—but such studiesare very time-consuming (e.g. DeSante 1981).
Precision is a measure of how close replicated estimates are from each other(and so it is unrelated to the true population size). This is the same as asking howmuch error is there around a mean estimate. Take the parrot example above;suppose that we have five counts during a period when the true populationstayed the same, and we get estimates of 490, 495, 500, 505, 510. Because theseestimates are close together, the difference between the extreme counts beingjust 4% of the mean, most people would accept that the estimates were relativelyprecise. Five counts of 300, 400, 500, 600, 700, with a difference betweenextreme counts of 80% of the mean, are imprecise. Coincidentally, the average ofboth sets of counts is accurate because it is close to the actual number of parrots,though of course this would not be known. A final set of counts of 990, 995,1000, 1005, 1010, is exactly as precise as the first set, with again a differenceof 4% of the mean between extreme counts, but hopelessly inaccurate. Hence,precision is independent of the true population size.
Unlike accuracy, precision can be measured in statistical terms (e.g. as a range,variance, standard error, 95% confidence limits, percentage error etc.) by look-ing at the differences in counts between the different sampling units. Be aware,however, that standard methods of calculating confidence limits assume thatthe counts follow a normal (or Gaussian) distribution, which is unlikely to be thecase for bird counts. The way around this is to use distribution-free methods,such as bootstrapping, to derive confidence limits (see later). Precision is deter-mined by two factors: the number of sample units visited (�numbers of sites andhence birds counted) and the degree of variation in the counts made in thosesampling units.
24 | Bird census and survey techniques
Suther-02.qxd 5/12/04 1:04 PM Page 24

Multiple counts can be obtained by counting the same study site repeatedlyin the same season, or by counting multiple study sites once. The first optiontells us about temporal variation at sites within a season, the second aboutspatial variation across the sites—both may be important depending on thestudy aims.
The relationship between precision, sample size and variance is shown inFigure 2.3. This shows that precision rapidly increases with increasing sample sizeand that it does so more rapidly where there is little variance in counts betweensampling units. As a good rule of thumb, the width of the confidence intervals isrelated to the number of sampling units N, as N�0.5. With smaller sample sizes,great increases in precision can be achieved for relatively small increases in samplesize. However, as sample sizes increase, so the additional precision gained declines,and when sample sizes become very large, we gain little in precision, even for verylarge increases in sample size. From a practical perspective, this tells us that if wewish to increase precision we need to take a larger sample of sites, but beyond acertain point, which we could think of as the optimum sample size, this producesdiminishing returns. We can use pilot data to make an informed decision aboutthe optimum sample size but, of course, there are often other more practicalconsiderations (e.g. individuals and time available for fieldwork, survey timerequired within each plot, or the terrain), and the ultimate decision about samplesize will be based as much upon these as on the theory.
The other element to influence precision is the variation in counts betweensampling units. If a bird is widely and evenly distributed, occurring in roughly
Introduction | 25
High
Low
Low
Precision
Low variance
High variance
Sample size
Fig. 2.3 The relationship between precision and sample size with high and low
variance. Larger samples sizes deliver greater precision, but as sample sizes increase
the benefit declines.
Suther-02.qxd 5/12/04 1:04 PM Page 25

similar numbers in different sampling units (as in Habitat B in Figure 2.4),then counts from different squares are likely to be similar and the estimates ofpopulation relatively precise. If a bird has a more clumped distribution, givinglots of variation between sampling units (as in Habitat A), then counts fromdifferent squares are likely to be dissimilar and have lower precision. Note thatdifferences in the ability of the observers to make the counts can also lead to highvariance even when the birds are actually evenly distributed.
Bias occurs when our estimates are either systematically larger or smaller thanthe true value. Put another way, inaccuracy is brought about by bias, which canarise from a poor sampling strategy (e.g. by only surveying the best areas) or aninappropriate field method (e.g. by counting around midday when a speciesis most active in the morning), or a combination of factors. A whole range offactors could lead to bias, for example, the field method, effort and speed ofsurveying, the habitat, the bird species and their density, the time of day, theseason of the year, the weather conditions, double counting, the observer’s skills,etc. The challenge is, first, to recognize all the potential sources of bias and,second, to standardize survey methods and improve standards where appro-priate, to reduce bias as much as possible. That said, bias is an unpleasant andoften unavoidable fact—and surveys should always consider the likely sources ofbias and how they might influence the findings. We should never assume that oursurvey is free of bias.
26 | Bird census and survey techniques
High variance
Low variance
Habitat A
Habitat B
Fig. 2.4 An illustration of uneven variance between two habitats. The filled symbols
represent birds.
Suther-02.qxd 5/12/04 1:04 PM Page 26
2.2 Sampling strategies
We saw in the previous section that, if we are to obtain an unbiased measure of birdabundance (e.g. an estimate of absolute or relative population size), we will oftenneed to count birds in a number of sampling units that are representative of the areawithin the survey boundaries. This raises two important questions; how manysampling units should we visit to count birds? And, crucially, which ones?
2.2.1 How many sampling units?
As we have seen, the larger the sample size (�number of areas and hence birdscounted) the more precise our estimate. Sample size will therefore depend largelyon the reliability we want to place in our estimate. If we want a very preciseestimate, we need to have a larger sample of sites than if we just want a goodapproximation. Statistical methods, requiring the collection of some pilot data, areavailable for calculating sample sizes necessary to achieve predetermined levels ofprecision (Snedecor and Cochran 1980). In the real world, however, our samplesizes are generally influenced by financial and human resources, and, as these aregenerally low, we will rarely be at risk of having sample sizes that are much higherthen we actually need. Instead, we need to ask ourselves whether our sample sizewill be sufficient to meet the objectives that we set ourselves at the outset.
2.2.2 Which sampling units to count?
Next, we need to determine which sampling units, out of all those available,should be visited. In other words, what is our sampling strategy? This is probablythe most critical decision in a sample survey, as failure to use an appropriatesampling strategy could invalidate the results. Only when we are certain thatour sampling strategy is appropriate should we start to think about how we willactually count the birds when we get into the field.
There is a tendency for fieldworkers to visit areas they expect to be good for theirtarget species or for their particular study. Free choice of this kind can lead to a biastoward higher quality sites, or particular types of site. Remember that our samplemust be representative of the whole area of interest if we are to extrapolate theresults to areas that are not visited. So how can we select our sample without fall-ing into this trap? The most frequently used methods, and the best, are randomsampling and regular sampling. A definition of truly random sampling is that eachsampling unit has an exactly equal chance of being selected. Contrast this to freechoice, where better areas are far more likely to be selected than less good areas.
Sampling randomly is not as straightforward as it might seem. One mightthink that closing ones eyes and sticking a pin in a map would be random, but it
Sampling strategies | 27
Suther-02.qxd 5/12/04 1:04 PM Page 27

28 | Bird census and survey techniques
(a)
(b)
(d)
(c)
Most birds
Fewest birds
Fig. 2.5 Choosing the right sampling units to count from a grid. (a) First, break
the whole area down into bits that can be counted—these are sampling units. In
this example, we have the resources to count 5 of the 25 sampling units. (b) Next
select your squares randomly (see text), count the birds (filled symbols) in these
specially selected sampling units (and no others), and estimate the population.
The estimate � number of birds counted divided by number of squares counted
(� average density of birds per square) multiplied by the total number of squares.
Thus, for example, population estimate � 6/5 � 25 � 30. Or, more correctly,
add your census count to an estimate of the number of birds in the remaining
un-surveyed squares � 6 � (6/5 � 20) � 30. This extrapolates data from areas
Suther-02.qxd 5/12/04 1:04 PM Page 28

Sampling strategies | 29
is not—squares toward the center of the map would be more likely to beselected than those around the edges. Trying to pick “random” squares by eye, ortrying to guess “random” numbers, will be similarly biased. If we deliberatelyselect squares we think might hold “average” numbers, this also biases our estim-ate of precision. There are a number of ways that sampling units can be selectedrandomly. Assigning each a different number, or using a grid in which eachcell has unique coordinates, allows us to select sampling units using randomnumbers. Random numbers can be selected using random number generatorsfrom scientific calculators, from most database packages (such as Excel), or fromstatistical tables. Alternatively, bits of paper each with the grid coordinatesof 1 square can be put into a hat and drawn out blind (this is only random ifevery square has a corresponding piece of paper). This low technology alternativeis perfectly acceptable and scientifically robust. The power of random selectionis that it does not matter if we miss the squares with most birds. In the examplein Figure 2.5, the two “best” squares were missed, and one of only two squareswhere the species was absent was selected, but the estimate was still extremelyclose to the real population size.
The procedure for randomly sampling non-regular units, such as nestingcolonies, lakes, forest blocks, etc., is similar. The key is to number or label each ofthe individual entities and then randomly sample from the whole set (so thateach has an exactly equal chance of being picked). Note that for irregularlydistributed sampling units, picking a point at random and selecting the nearestsampling unit does not produce a random sample, since sampling units that aremore isolated from others are more likely to be selected using this method thansampling units close to others.
2.2.3 Using stratification
We can often use prior knowledge about a species or an area to be surveyed inorder to sample more effectively. An important refinement is stratification, where
where we count (our sample) to those we do not count. (c) Random selection of
sampling units almost always provides a good estimate of the true population. In
this hypothetical example, our estimate was 30 and the “real” population was 33.
Here, open circles represent birds that were counted and filled circles those that
were not. (d) It may seem odd that our random sample has missed both the “best”
areas for birds, (i.e. with most birds in them), and actually counted one of only two
squares with no birds, but this does not matter. As we have seen above, the information
we collect from our random sample allows us to estimate the population accurately.
Had we based our counts on the best areas, our overall estimate would be a hopeless
overestimate.
Suther-02.qxd 5/12/04 1:04 PM Page 29
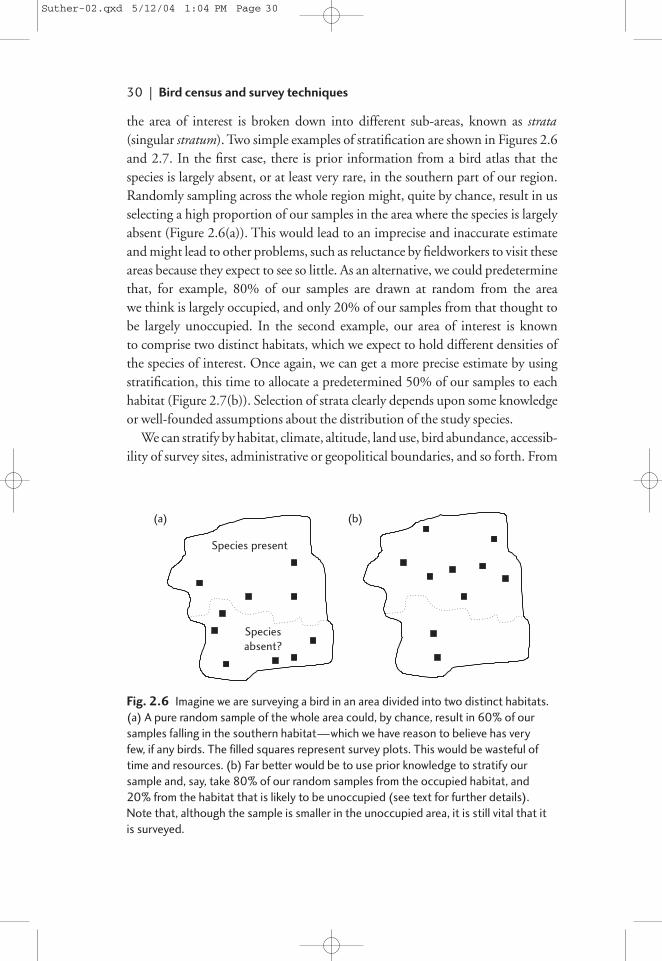
the area of interest is broken down into different sub-areas, known as strata(singular stratum). Two simple examples of stratification are shown in Figures 2.6and 2.7. In the first case, there is prior information from a bird atlas that thespecies is largely absent, or at least very rare, in the southern part of our region.Randomly sampling across the whole region might, quite by chance, result in usselecting a high proportion of our samples in the area where the species is largelyabsent (Figure 2.6(a)). This would lead to an imprecise and inaccurate estimateand might lead to other problems, such as reluctance by fieldworkers to visit theseareas because they expect to see so little. As an alternative, we could predeterminethat, for example, 80% of our samples are drawn at random from the areawe think is largely occupied, and only 20% of our samples from that thought tobe largely unoccupied. In the second example, our area of interest is known to comprise two distinct habitats, which we expect to hold different densities ofthe species of interest. Once again, we can get a more precise estimate by usingstratification, this time to allocate a predetermined 50% of our samples to eachhabitat (Figure 2.7(b)). Selection of strata clearly depends upon some knowledgeor well-founded assumptions about the distribution of the study species.
We can stratify by habitat, climate, altitude, land use, bird abundance, accessib-ility of survey sites, administrative or geopolitical boundaries, and so forth. From
30 | Bird census and survey techniques
Species present
Species absent?
(a) (b)
Fig. 2.6 Imagine we are surveying a bird in an area divided into two distinct habitats.
(a) A pure random sample of the whole area could, by chance, result in 60% of our
samples falling in the southern habitat—which we have reason to believe has very
few, if any birds. The filled squares represent survey plots. This would be wasteful of
time and resources. (b) Far better would be to use prior knowledge to stratify our
sample and, say, take 80% of our random samples from the occupied habitat, and
20% from the habitat that is likely to be unoccupied (see text for further details).
Note that, although the sample is smaller in the unoccupied area, it is still vital that it
is surveyed.
Suther-02.qxd 5/12/04 1:04 PM Page 30

what we know about the ecology of birds, it will often make sense to stratifyour sample by obvious factors, such as habitat and altitude. Where surveysrely on local observers, it might also make sense to stratify by their availability.Stratification by observer density might seem odd at first sight, but it provides anefficient way of maximizing the use of skilled volunteers when their distributionis uneven, as it often is. Stratification is strongly recommended because it canimprove both precision and accuracy, and it ensures proper habitat coverage.Thankfully, there are simple rules that help us choose the most appropriatestrata—and it turns out that, even when our prior assumptions about strata proveto be wrong, there is no detrimental effect.
In those situations where we have little information about the habitats used bya species, it makes sense to sample in proportion to the area of the differenthabitats. For example, if 80% of the area is forest and 20% farmed land, then80% and 20% of our samples should be in forest and farms, respectively. Whenwe know more about species density in different habitats there are some simplerules designed to improve precision. For example, Sutherland (2000) suggeststhat sampling should be proportional to the likely proportion of the speciesoccurring in a habitat—so if preliminary information suggests 60% of a
Sampling strategies | 31
(a) (b)Habitat 1
Habitat 2
Fig. 2.7 Next, imagine our study area comprises two distinct habitats of roughly
equal area, within which our chosen study species lives but at quite different
densities. (a) A random sample across the whole area is quite likely to result in an
uneven split of survey squares between the two habitats. If 70% of the squares happen
to fall in one habitat then the population estimate for the whole area based on the
10 squares would inevitably be dominated, or biased, by that habitat. (b) The solution
to this problem is to stratify so, for example, half the samples fall in each habitat—the
data are then analyzed by strata and the results combined to give an unbiased estimate
of population size (see text for further information on sampling within strata).
Suther-02.qxd 5/12/04 1:04 PM Page 31

population lives in forest, then 60% of our sample should be in that habitat. Ofcourse, there is an element of circularity in this, and it depends on the reliabilityof the original information. There is the added complication that numbers maybe much more variable in one habitat than in another, requiring many morecounts there to achieve the same level of precision.
In general, we can improve precision by choosing strata that minimize thevariation between sampling units within a stratum while maximizing the varia-tion between strata. This is quite easily achieved because birds generally occur at different densities in different habitats. As we have seen above, the simplestchoice is proportional allocation of sampling units within strata, but if the costs ofcounting sampling units differs across strata, or the counts are more variable insome strata, we can adjust our sampling to optimize allocation (Box 2.1: Snedecorand Cochran 1980). The basic rule is to take smaller samples, compared to pro-portional allocation, in a stratum where sampling is expensive, and to take biggersamples in a stratum where the counts are more variable. Even rough estimatesof variability and cost can help to improve sampling design.
Problems can arise if the number of strata is large relative to the total number ofstudy plots (so that only a few sampling units are selected in each stratum). Werecommend using a small number of strata; 2–6 is generally sufficient. One ofthe reasons for this is that a separate population estimate should be calculatedfor each stratum and these estimates must be added together to get an overallestimate of the total population. Likewise, confidence limits on these estimateshave to be found by combining information from the strata (Box 2.2;see Wilkinson et al. 2002, Wotton et al. 2002).
In the real world, it may be very difficult to sample totally at random, forexample, because you are unable to travel long distances to remote areas to count
32 | Bird census and survey techniques
Box 2.1 Choice of sample sizes within strata
1. Proportional allocation: Take the same fraction of sampling units from eachstratum; that is, make nh/Nh the same for all strata
2. Optimum allocation: Make nh proportional to Nh Sh/√Ch. This delivers thesmallest standard error around an estimate for a given cost.
Where: nh is the sample size chosen in the hth stratum, Nh the total number ofsampling units in the hth stratum, Sh the standard deviation of sampling units in thehth stratum, and Ch is the cost of sampling per sampling unit in the hth stratum.
Suther-02.qxd 5/12/04 1:04 PM Page 32

birds. A more pragmatic approach is semi-random sampling, where samplingunits are randomly selected within a predefined area. If, for example, you are ableto travel a maximum of 50 km from your base to count birds, it is possible to selectcount sites at random from those available within this radius. An alternative is todefine a larger area (which does not need to be contiguous) within which you areable to count, comprising say 5 or 10 km2, and randomly select smaller samplesquares from within this area. This is, however, liable to introduce bias. For exam-ple, a semi-random approach is likely to over-sample areas close to human popula-tion centers if that is where you live. Nevertheless, semi-random is better than justvisiting areas that seem good for birds. By sampling a small number of genuine ran-domly chosen squares, it is also possible to check on the nature and degree of bias.
A potential problem with random sampling, particularly when sample sizesare low, is that, just by chance, our samples might be concentrated in one part ofthe survey area that is particularly good for a species, or might miss an area inwhich we were particularly interested (Figure 2.8(a)). If we are using stratifica-tion, this is less of a problem; we can, for example, stipulate that every grid square,
Sampling strategies | 33
Box 2.2 Analyzing stratified samples
The simple rule in analysing stratified samples is that each step of calculationneeds to be carried out at the level of the stratum and the estimate then combinedwith those from all other strata. If we want to estimate the size of a bird’s popu-lation and had collected data from three strata (e.g. low, medium, and highabundance, or farmland, scrub, and forest habitats), we would calculate the bird’sdensity in each stratum separately based on our field counts, then multiply up bythe area of each stratum, and then add these numbers together to give an overallpopulation estimate. All very simple—and the same approach holds when calcu-lating confidence limits using the bootstrap procedure, but here we add countsfrom the sampling units we visited to an estimate of the numbers from theremaining area of that stratum that was not visited. Thus, we re-sample at randomwith replacement from sample sites within strata, calculate an estimate of densityand multiply by the area of the habitat that was not surveyed, and add to this theactual number of birds counted. We repeat this process to create 999 uniqueestimates of the number of birds within each stratum. For each replicate,(1,2,3, … ,999) the number of birds would then be summed across the strata(strata 1, replicate 1 � strata 2, replicate 1 � strata 3, replicate 1, etc.), to give999 “bootstrapped” estimates of the overall population size. These totals are thensorted or ranked in size and the 25th and 975th values taken as the 95% confi-dence intervals.
Suther-02.qxd 5/12/04 1:04 PM Page 33

or every stratum, contains a fixed number of sampling units (Figure 2.8(b)). Analternative to random sampling that gets around this problem is regular orsystematic sampling. This involves selecting the sampling units by choosing themin a regular pattern (Figures 2.8(c) and 2.9(a)). We can use random numbers tohelp us do this. If we want a 10% sample from 100 squares, we can select a ran-dom number, say 7, then take every 10th square from a list in standard order;7, 17, 27, 37, . . . , 97. Alternatively, we could simply decide to sample every 1-km square in the north-east corner of every 10-km square and so forth toachieve a predetermined sample size. There are advantages to regular samplingcompared to a random design:
• Regular samples are easier to select—a single random number is all that isrequired.
• It samples evenly over the area of interest; there is ‘built-in’ stratificationthat ensures that samples are taken from across the whole area of interest.
• In consequence, it is often more accurate.• It can be used to create maps and atlases.• It is easy to understand and explain to others.
34 | Bird census and survey techniques
Fig. 2.8 There are certain situations, in which a pure random sample can, by chance,
miss an important part of the study area, which could lead to serious under- or over-
estimation of a population depending on its distribution. In this example, a random
sample (a) under-samples the southeast corner of the study area. A stratified random
approach (b) could alleviate this problem by requiring a survey point in every grid
square in the study area. Similarly, a regular sample (c) overcomes this problem
because survey points are located in the center of every grid square. Here the filled
circles represent sampling units (n � 20) within a study area defined by the bold border.
(a) (b)
???
(c)
Suther-02.qxd 5/12/04 1:04 PM Page 34

Stratification can be used alongside regular sampling too. For example, we couldtake every seventh square from a stratum where a bird is thought to be common,but every fourteenth square from a stratum where it is thought to be rare(see Nemeth and Bennun 2000 for a similar approach).
There is, however, a possible bias in systematic sampling, in that this methodmight over- or under-sample certain features that are regularly distributed in thelandscape. For example, it might be that parallel roads are the same distance apartas our lines of samples, leading to over- or under-sampling of areas near roads. Inreality, however, such biases are very rare, although we need to be aware of them.In summary, regular sampling has much to recommend it and it has probablybeen under-used in the past.
An attractive alternative is to integrate the strengths of random and regularsampling by using a randomized Latin square design (Figure 2.9(b)), in whicheach column and each row holds one, and only one, sampling unit. Samplingunits are drawn randomly from the rows and columns on the condition thatevery row and column can only contain a single square, which ensures balancedcoverage of the area. This pattern of sampling can be repeated across the studyarea and within larger sampling units.
2.3 Field methods
In the section above, we considered the key question of how we choose whereto make our counts. Now we must consider how to choose between countingmethods. Although we have presented survey design as a linear process, in reality,there should be a strong feedback loop in which the sampling strategies and
Field methods | 35
(a) (b)
Fig. 2.9 (a) An example of a regular sampling method, and (b) a randomized Latin
square design. Survey squares are shaded.
Suther-02.qxd 5/12/04 1:04 PM Page 35

field methods influence and alter each other, and they will in turn influence andpotentially alter the survey objectives (Figure 2.10). For example, if the requiredsurvey method for a particular species, or habitat, is labor intensive, this mightdictate that a smaller number of census plots could be covered. Equally, if thesampling strategy dictated that survey effort needed to be spread across severalpotential habitats because of uncertainty over the true habitat requirements ofa scarce species, this might lead us to re-define and simplify our survey objectives.
There are some general issues to consider in planning fieldwork:
• The season and the time of day the survey is to be carried out.• The size of the survey plots.• The number of visits to be made to each sample plot or area (commonly
around 10 visits for territory mapping, 2–4 for transects, see below).• The recommended search effort, for example, walking speed (this is particu-
larly important for line transects) or count duration (for point counts), andgeneral counting protocol for the observers.
• The recording units and behavior of the birds to be noted (ages, sexes, nests,singing, calling males, etc).
The three most common field methods are mapping, and line and point tran-sects; each of these is discussed in turn below.
2.3.1 Mapping
During the temperate zone breeding season, many individual birds are restrictedto relatively small areas, actively defending a territory or spending much timearound a nest. If a number of visits are made to an area, and the exact location ofbirds plotted on maps, it becomes possible to identify clusters of sightings and soto estimate directly the total number of pairs or territories of each species present.
36 | Bird census and survey techniques
Survey objectivesSampling strategy
Field methods
Survey design
Fig. 2.10 Feedback loops operating in survey design between the survey objectives,
sampling strategy, and field methods.
Suther-02.qxd 5/12/04 1:04 PM Page 36

An essential component of this method is the use of activity codes to describebird behavior in the field. These allow observers to record simultaneous observa-tions of territory-holding birds, different forms of territorial behavior and otherfactors that later allow an analyst to approximate the boundaries between adja-cent bird territories. This is the method of territory or spot mapping. Examplesof these codes, and of the way that maps can be analyzed, are given in Marchantet al. (1990), Gibbons et al. (1996), and Bibby et al. (2000). At first sight, thiswould appear to be an extremely accurate and precise method, but this is notalways the case and one needs to be aware of the underlying assumptions aboutterritoriality. An obvious advantage of the method is that it produces a detailedmap of the distribution and size of territories, allowing us to link bird distribu-tion with habitats. For certain purposes, for example, habitat management ona nature reserve, such information can be invaluable. The method does, however,have a number of disadvantages:
• It requires high quality maps of the study area.• It is time consuming, requiring up to 10 visits to each site to be able to
identify territories (though fewer visits could be made if only one speciesis being surveyed—a minimum is around four). The time required formapping can be up to seven times that of transects.
• Because of the intensity of recording, only small areas can normally becovered, generally 1–4 km2 (though again this depends on whether a singlespecies is being studied and its ecology, and how much time is available).
• Mapping requires a high level of observer skill in identifying and record-ing birds.
• Interpretation of the results can be difficult, subjective, and requires theapplication of consistent rules, particularly when territory densities are high.Territories at the edge of a plot are troublesome and require arbitrary rules.
• It is an inefficient method for recording non-territorial species, semi-colonialspecies, those that sing for brief periods, or those that are not monogamous.
• It is difficult to use in dense or featureless habitats (e.g. thick forests, flatdeserts) or when bird densities are high.
• It is difficult to compare results across studies unless common standards ofterritory analysis have been applied.
Despite these limitations, territory mapping has proved a useful method ofsurveying birds in temperate situations and the results have proved a valuabledata source for ecological research. In those situations where it is critical to mapindividual territories, and sufficient resources exist to do this, it is the method ofchoice. When used appropriately, it allows fine-scale habitat associations to be
Field methods | 37
Suther-02.qxd 5/12/04 1:04 PM Page 37

studied and probably provides relatively accurate estimates of population size(although precision, and especially accuracy, are not easily measured). Mappingmethods can also be usefully combined with nest finding, radio telemetry, mistnetting etc. in research projects. Mapping has seldom been used in the tropics,largely because breeding is more asynchronous and many species have complexsocial behaviors.
2.3.2 Transects
There are two types of transect most commonly used in bird surveying, linetransects and point transects. The latter are often termed point counts. Both arebased on recording birds along a predefined route within a predefined surveyunit. In the case of line transects, bird recording occurs continually, whereasfor point transects, it occurs at regular intervals along the route and for a givenduration at each point. There are a number of variations on this theme wherebirds are recorded to an exact distance (variable distance) or within bands (fixeddistance) from the transect point or line. The two methods can also be combinedwithin the same survey. While there are important differences between the lineand point transects, and choosing between them is an important decision insurvey design, there are also many practical and theoretical similarities.
Line and point transects are the preferred survey methods in many situations.They are highly adaptable methods and can be used in terrestrial, freshwater, andmarine systems. They can be used to survey individual species, or groups of species.They are efficient in terms of the quantity of data collected per unit of effortexpended, and for this reason they are particularly suited to monitoring projects.Both can be used to examine bird–habitat relationships (though generally less wellthan territory mapping), and both can be used to derive relative and absolutemeasures of bird abundance. Transects can be usefully supplemented and, to somedegree, verified in combination with other count methods such as sound record-ing, mist netting, and tape playback (e.g. Whitman et al. 1997; Haselmayer andQuinn 2000).
There are a series of issues to consider when using transects in the field. Therecommended walking speed is particularly important for line transects, as arethe counting instructions for the observers. A further important considerationis whether to use full distance estimation, that is, estimating distances fromthe center of the point count or from the transect line, to all birds heard or seen,or to use estimation within distance bands or belts. In the latter case, one needsto decide on the specific distance bands.
We would always recommend recording some measure of the distance to eachbird seen or heard because this provides a useful measure of bird detectability
38 | Bird census and survey techniques
Suther-02.qxd 5/12/04 1:04 PM Page 38

in the habitat concerned and allows species-by-species density estimation(see Detection probabilities). It is always preferable to record the exact distance tobirds, or failing this, distance within many belts, but in reality, this will oftenprove to be impractical. As range-finders become increasingly affordable, theyopen the way for simple and accurate distance estimation, especially for singlespecies surveys.
2.3.3 Line transects
At its simplest, a line transect involves traveling a predetermined route andrecording birds on either side of the observer. The distance a bird is seen or heardfrom the transect line is normally recorded as an absolute measure, or in distancebands. Distances should be estimated perpendicular to the transect line (ratherthan the distance from the bird to the observer). Distance estimation of this kindis key to the estimation of bird densities. Perpendicular distances can be estimatedin a number of ways:
1. Distance is estimated by eye from the line, given practice and periodicchecking against known distances; fixed distances can also be marked unob-trusively in the field using marker posts or colored tape to aid recording.
2. Observers may be able to visually mark the position of a bird when detectedand then use a tape or range finder to measure the distance when they areperpendicular to where the bird was recorded.
3. Bird observations can be plotted on to high quality maps and the distancemeasured subsequently. This requires good mapping skills and is helped byhaving fixed markers in the field.
4. Observers can use a sighting compass to estimate the angle (�) betweenthe transect line and a line from the observer to the bird, and use a tape orrange finder to measure the distance (d ) from that point to the bird. Theperpendicular distance is then calculated as d cos �.
The sampling strategy chosen for a particular survey determines the samplesquare or unit to be surveyed, but there is still the choice of line transect routeswithin this area. There are several options, and some flexibility is advisable. Forexample, a regular or systematic approach could be used with parallel transectsorientated north to south, or a series of transects oriented along the long axisof the study area. A random approach, for example, with starting points anddirections of transects selected randomly, could be used. One could even usea stratified random approach, for example, with the starting points and directionof transects selected at random, but where each lies within an individual habitatstratum. In reality, topography, watercourses, roads, certain land uses, and access
Field methods | 39
Suther-02.qxd 5/12/04 1:04 PM Page 39

permissions, might all limit access, so that the actual routes counted will differ tosome degree from the ideal routes—but such deviation cannot be avoided.In some cases, it might be necessary to substitute a piece of transect for one thatcannot be covered, providing it is equivalent in habitat.
The survey design of the Breeding Bird Survey in the United Kingdom,which uses a line transect approach, provides a useful model that can be adoptedelsewhere for breeding birds (Gregory 2000; Gregory and Baillie 1998,www.bto.org/survey/bbs.htm). This survey is based on two counting visits to asquare each breeding season, with one previous visit to set up a route, and usesthree distance bands, 0–25, 25–100, and over 100 m. In general, and for easeof comparison across studies of terrestrial breeding birds, we recommend aminimum of two visits to a plot each season and a maximum four visits. Werecommend, as a minimum, 2 distance bands, 0–25 and over 25 m for linetransects, and preferably three (as above) or more.
Observers often differ in their ability to record birds and other data. If morethan one observer is available, bias can be reduced by matching observers toparticular tasks they suit (e.g. one spotting and identifying birds, one estimatingdistances, one acting as data recorder), and by incorporating training. Inter-observer differences in bird identification can be monitored and compared(e.g. by plotting the decline in the percentage of bird records unidentifiedthrough time).
Line transects are highly adaptable; they have been used to survey seabirds fromships, and waterbirds and seabirds from the air, although these are specializedand expensive applications.
2.3.4 Point transects
Point transects differ from line transects in that observers travel along the tran-sect and stop at predefined spots, allow the birds time to settle, and then recordall the birds seen or heard for a predetermined time, ranging, at the extremes,from 2 to 20 min. Again, we have three choices in deciding where to site pointcounts within the study plot. There are, of course, many variations on this themeand the counting stations do not need to follow a set route. One could selectindividual points at random, or by a stratified random design, and access each ofthem individually—in fact, this is one of the strengths of point transects becausethey do not require access across the whole survey area. As with line transects,practical barriers might limit the degree to which the ideal routes can befollowed, but equivalent points can be substituted with a little care.
If the point transect is the chosen method for a particular survey, then thesame set of considerations outlined above would apply. In addition, for point
40 | Bird census and survey techniques
Suther-02.qxd 5/12/04 1:04 PM Page 40

counts one needs to decide on a settling time once the counting station isreached, and on the duration of the count itself. For ease of comparison acrossstudies of terrestrial breeding birds, we recommend the minimum number ofvisits to a plot is two and a maximum four. We recommend a 5- or 10-min countperiod plus an initial settling time of 1 min. For the longer period, we suggestthat birds recorded in the first and second 5 min are noted separately (allowingsome check on double counting, on whether birds are attracted to the observer,and allowing comparison with 5-min counts). We recommend a minimum oftwo distance bands, 0–30 m and over 30 m, better still would be 3 bands, 0–30,30–100 and over 100 m. Lastly, we suggest a minimum of 200 m betweencounting stations. Ralph et al. (1995) review point count methods and providepractical recommendations for their use.
The North American Breeding Bird Survey, which is a continent-wide survey,involves point counts along randomly selected road transects (Sauer et al. 2001;www.mbr-pwrc.usgs.gov/bbs/).
2.3.5 Rules for recording birds in the field
The aim is to record all birds identified by sight or sound with an estimate ofdistance when first detected. It might be helpful to indicate whether a birdis detected by sight or sound on a recording form. Birds that are seen flyingover the census area (aerial species) are recorded separately because they cannotbe included in standard density estimation. For such mobile species, it is best tomake an estimate of their numbers along each section of transect, or at eachpoint. If birds fly away as you are counting, record them from the point you firstsaw them. We recommend that birds flushed as you approach a point countstation should be recorded from that point and included in the point counttotals (but you must make this plain in the write-up). Try to avoid double-counting the same individual birds at a point count or within a transect sectionby using careful observation and common sense. It is, however, correct to recordwhat are likely to be the same individual birds when they are detected fromsubsequent point counts or transect sections.
2.3.6 Choosing between line and point transects
There is little to choose between line and point transects because they are soadaptable to species and habitats, but each is better suited to particular situations(Table 2.1). The strengths and weaknesses of the methods need to be matchedagainst your survey objectives.
Both methods require a relatively high level of observer skill and experiencebecause a large proportion of contacts and identifications will be by song or call.
Field methods | 41
Suther-02.qxd 5/12/04 1:04 PM Page 41

Some thought needs to be given to surveying birds that are non-territorial, semi-colonial species, those that sing for brief periods, and those that have unusualmating systems; but this is less of a concern than in territory mapping. A poten-tial disadvantage of both transect methods for some purposes is that they tend tofollow paths, tracks, or roads and so may not be representative of the area asa whole. A practical way around this using point counts is to establish countingstations at right angles to the transect, and say 30 or 50 m into the habitat.
2.3.7 Detection probabilities
Having conducted a survey of a species in a particular habitat, it makes sense tocompare the results with those of other similar studies in order to place yourfindings in context. This is often easier said than done, however, because to do sousing the raw, or “unadjusted counts,” you must assume that the probability ofdetecting birds is the same for each data set that is compared. It is an inescapablefact that some birds present in your study area will go undetected regardless ofthe survey method and how well the survey is carried out. Detectability is a key
42 | Bird census and survey techniques
Table 2.1 A comparison of line and point transects
Line transects Point transects
Suit extensive, open, and uniform habitats Suit dense habitats such as forest and scrub
Suit mobile, large or conspicuous species, Suit cryptic, shy, and skulking species
and those that easily flush
Suit populations at lower density and more Suits populations at higher density and
species poor more species rich
Cover the ground quickly and efficiently Time is lost moving between points, but
recording many birds counts give time to spot and identify
shy birds
Double counting of birds is a minor issue, Double counting of birds is a concern
as the observer is continually on the move within the count period—especially for
longer counts
Birds are less likely to be attracted to the Birds may be attracted to the presence of
observer observers at counting stations
Suited to situations where access is good Suited to situations where access is
restricted
Can be used for bird–habitat studies Better suited to bird–habitat studies
Errors in distance estimation have a smaller Errors in distance estimation can have
influence on density estimates (because a larger influence on density estimates
the area sampled increases linearly from (because the area sampled increases
the transect line) geometrically from the transect point)
Suther-02.qxd 5/12/04 1:04 PM Page 42

concept in wildlife surveys and we neglect it at our peril. Thus, comparison of“unadjusted counts” will only be valid if the numbers represent a constantproportion of the actual population present across space and time. This assump-tion is often questionable and has been a matter of much debate (Buckland et al.2001; Rosenstock et al. 2002; Thompson 2002). To be clear, this could affectcomparisons between different habitats surveyed at the same time, and betweenthe same or different habitats surveyed at different times.
The solution is to “adjust” counts to take account of detectability, and a numberof different methods have been proposed (Thompson 2002). For example, the“double-observer” approach uses counts from primary and secondary observers,who alternate roles, to model detection probabilities and adjust the counts(Nichols et al. 2000). The “double-sampling” approach uses the findings froman intensive census at a subsample of sites to correct the unadjusted counts from a larger sample of sites (Bart and Earnst 2002). The “removal model” assesses thedetection probabilities of different species during the period of a point count andadjusts the counts accordingly (Farnsworth et al. 2002). Finally, “distance sam-pling” models the decline in the detectability of species with increasing distancefrom an observer and corrects the counts appropriately.
Distance sampling is a specialized way of estimating bird densities fromtransect data and of assessing the degree to which our ability to detect birds differsin different habitats and at different times (Buckland et al. 2001; Rosenstock et al.2002). The software and further information to undertake these analyses arefreely available at: www.ruwpa.st-and.ac.uk/software.html. Distance samplingtakes account of the fact that the number of birds we see or hear declines withdistance from the observer. The shape of this decline, the distance function, differsamong species, among observers and, importantly, among habitats—birds withinopen grassland are detectable over greater distances than those within denseforest—even when they occur at the same densities. Distance sampling models the“distance function” and estimates density taking into account both the birds thatwere observed, plus those that were likely to be present but were not detected. Thismethod is strongly recommended.
Distance sampling provides an efficient and simple way of estimating birddensity from field data. It allows for differences in conspicuousness betweenhabitats and species (though not observers), enabling comparisons to be madebetween and within species, and across different habitats at different times.Density estimates improve with the number of birds recorded—a minimumof about 80 records is recommended. The method relies on a number of assump-tions which need to be evaluated carefully in the field and steps taken to lessentheir effects (Buckland et al. 2001). The key assumptions of distance methodsare that all the birds actually on the transect line or at the counting station are
Field methods | 43
Suther-02.qxd 5/12/04 1:04 PM Page 43

recorded (for cryptic and shy species this may not be true), and that birds do notmove in response to the observer prior to detection.
2.3.8 Colonial birds
Around 15% of bird species nest in colonies, either on cliffs, in trees, on theground, in caves or in burrows. In some ways, this makes them easy to count,since birds are concentrated in generally conspicuous aggregations. However,counting birds in colonies also poses problems:
• Numbers may be huge, making counting difficult; it may be necessary tosample parts of the colony (using strategies described above) and extrapolate.
• Breeding may not be synchronous. At any time, part of the populationmight be elsewhere, and the birds present on the second visit might notnecessarily be those present on the first; individual marking of birds may benecessary.
• There may be large numbers of non-breeders or “helpers” present, or birdsmight be absent from the colony for long periods; it may be better to countnests rather than individuals.
• Old nests might appear to be active; it might be advisable to countapparently active or occupied nests only.
• Colony attendance might vary greatly during the day and over the year; itmay be necessary to make a number of counts at different times.
A critical step is to decide what it is that you want to count. Is it the total numberof birds present, the number of breeding pairs, the number of apparently activenests, or the number of occupied burrows? This decision will help to determinethe count method used.
Counts of large colonies often involve breaking the colony down into smallerunits for ease of counting. In the case of cliff colonies, photographs can be usedto divide the cliff into counting units, or even to count the birds directly.Cliff colonies should always be counted from opposite the colony rather thanfrom above when nests are more easily missed. Aerial photography has been usedto estimate numbers of large colonial birds, such as Gannets Morus bassanus.Tree-nesting colonies can be counted in a similar fashion, with nests in either alltrees being counted or just a sample of trees. Large colonies of ground-nestingbirds can be subdivided into smaller counting units by using a grid systemmarked out with string. The counters can then visit all, or a random stratified orregular sample of grid squares. Alternatively, densities of nests can be estimatedusing distance sampling (see above) and extrapolated for total colony area.Burrow-nesting seabirds are particularly difficult to count, many of them return
44 | Bird census and survey techniques
Suther-02.qxd 5/12/04 1:04 PM Page 44

to land after dark, and burrows may be occupied by more than one pair, or theymay be unoccupied. It is possible to assess whether burrows are occupied usingplayback methods (although you need to know or measure the response rate),endoscopes, smell, or by planting toothpicks around the entrance to the burrowand seeing whether these get knocked over (but beware pre-breeding birds thatare prospecting for nest sites). Multiple occupancy of burrows is difficult todetect and remains a problem. Steinkamp et al. (2003) provide a practical anddetailed review of survey methods for seabirds and colonial waterbirds.
2.3.9 Counting roosts and flocks
Counting large aggregations of birds away from breeding colonies poses manyof the same problems as counting birds in colonies, but with some additionalconsiderations:
• If disturbed by the counter, birds are unlikely to return to the same place;observers need to maintain a distance.
• Birds may be closer together than when they are in nesting colonies wherethey tend to space themselves out, so great care is needed to count thosepresent.
• Flocks often contain several species; it is necessary to count each separately.• Some aggregations, such as roosting flocks, form for only short periods,
often when light conditions are poor. Counts of nocturnal roosts oftenrequire the use of photography or of counts of groups of birds joining theroost.
Stationary flocks of up to 500 birds can be counted directly with relativeease if conditions are good. For larger flocks, and for rapidly moving flocks,photography or estimation methods are needed. A common method whenestimating very large flocks is to count, say, 10, 20, 50, 100, or 500 birds and thenestimate what proportion of the flock this represents. An important considerationwhen using this method is that birds in flocks do not tend to be evenly distributed,with higher densities in the center of the flock and lower densities at the periphery.Alternatively, for wading birds feeding on open mudflats and waterbirds on lakes,the flock can be broken down into smaller counting units using natural features ofthe habitat or distant landmarks. When birds are in dense groups, accurate countsare only possible by counting from above, or by counting them as they enter orleave an area. Care is needed so that counting does not disturb the birds; countfrom concealed or raised positions. The exception to this rule is the flush methodin which birds are deliberately flushed into the air in order to get a better count ofnumbers (see Steinkamp et al. 2003). Coastal birds might be more easily counted
Field methods | 45
Suther-02.qxd 5/12/04 1:04 PM Page 45

at particular stages of the tide, for example, at high tide roosts, than when moredispersed over a larger area. Photography is a useful method, but in tightly packedflocks, many birds may be obscured. For larger birds, aerial or even satellitephotography gets around this problem, although identification may be difficult.A general consideration when counting flocks is that observers show a naturaltendency to overestimate small flocks and underestimate large flocks, althoughthe extent to which different observers do this varies greatly. Furthermore, mostobservers estimate the size of larger flocks far less accurately than smaller flocks.It is always helpful for individual counters to repeat their own section counts andcompare them with those from another observer.
For flocking species that disperse to feed over wide areas, it is often advisableto count the birds as they enter or leave roost sites at dawn or dusk, particularlywhere the sites are used traditionally and predictably.
2.3.10 Counting leks
In a small proportion of birds (around 150 species), males gather in communalgatherings, known as leks, to display and compete for females during the breed-ing season. At this time, a high proportion of males can be detected at a relativelysmall number of often traditionally used sites. One or two counts of the leks maybe sufficient to give a reasonable and efficient census of the local population.There are downsides to this method however. For example, you need to be surethat all the leks present in an area have been detected, as birds can move betweenleks, and the smaller they are, the harder they are to find. Counts restricted tothe largest traditional leks may well sample a specific group of birds and wedo not know the area from which the birds came. In addition, some males maynot choose to visit leks and this is particularly true for younger males. Finally, lekcounts provide a poor means of surveying female birds.
2.3.11 Counting migrants
Counting large, diurnal migrants, such as raptors, cranes, storks, and pelicans,where they pass through migration bottlenecks, is often more efficient and easierthan trying to count them when dispersed over huge breeding or winteringgrounds, although this only samples birds that are low enough to be seen. InIsrael, counters are arranged in a line across the front of migration and use radiosto ensure that no more than one observer records each large flock of migratingbirds. As migration can take place at great heights, observers often count inteams, continually scanning the sky and working together. Similar coordinatedraptor counts occur across North America where their potential for populationmonitoring has been explored (Lewis and Gould 2000).
46 | Bird census and survey techniques
Suther-02.qxd 5/12/04 1:04 PM Page 46

Estimation of the numbers of smaller nocturnal migrants is particularlydifficult, but considerable progress has been made in this field (www.birds.cornell.edu/brp). Many smaller migrants call as they migrate, allowing at leastminimum numbers to be assessed and species to be identified. Recently developedmethods use microphones and complex computer programs to try to estimatetotal numbers of calling birds passing, as well as their height and speed (Evans andRosenberg 2000, www.birds.cornell.edu/brp). Radar has been used to not onlydetect passing flocks, but also to estimate their numbers, direction of flight, speed,altitude, and even wing beat rate, but not their specific identity. This methodrequires access to extremely sophisticated, and usually militarily sensitive equip-ment and is generally beyond the reach of most researchers. Counts of migrantspassing in front of the moon, or passing through the beams of bright lights, are oflimited use, because only a small proportion of birds can be seen and most cannotbe identified. A further indirect method of measuring changes in numbers ofmigrants, although not the absolute numbers, is ringing (banding), and a highproportion of ringing effort is concentrated at migration stopover points (Dunnet al. 1997). These methods are described in detail in Chapter 7.
2.3.12 Capture techniques
Because most species of bird tend to be visible and vocal, methods to survey themgenerally rely on observers seeing or hearing them. Occasionally, however, thismay not be the case, as in species that live in dense undergrowth, or in the forestcanopy, which may be rarely seen or heard. Under such circumstances, one wayto census them is to catch them using mist nets. Capture techniques have beenwidely used in the tropics where they can be usefully combined with other censusmethods (e.g. Whitman et al. 1997). Broadly, two separate approaches canbe used; either capture-mark-recapture (also known as mark-release-recapture,MRR) which allows estimations of population size, or catch per unit effort whichcan be used to produce population indices.
Capture methods can be time consuming and require substantial trainingto develop the skills necessary to catch, handle, and mark birds. The safety andwelfare of the birds are always of paramount importance. In many countries,these techniques are licensed, and anyone considering using them shouldapply to the relevant authority well in advance. As we have seen in the previouschapter, mist netting is a relatively poor method for surveying birds. Furtherinformation on methods of capture and marking are given in Chapter 4. Despitethese disadvantages, capture techniques yield much information besides popu-lation size and trend estimation. In particular, they can provide valuable infor-mation on demographic parameters, such as survival and breeding success, in
Field methods | 47
Suther-02.qxd 5/12/04 1:04 PM Page 47

addition to information on bird movements. Chapter 5 covers these issuesin detail.
The principle behind standard effort capture-mark-recapture is that, if birds arecaught and individually marked (e.g. with rings or bands), then from the ratio ofmarked to unmarked birds subsequently recaptured, population size can be esti-mated. Imagine that on the first day of capture at a site, 100 birds of a particularspecies were caught in nets, marked, and released. A week later, the nets were putback up. This time 50 of the same species were caught, 25 of which had beenmarked on the first day. If we assume that the population is closed and the original100 birds caught had become fully mixed back in the population over the inter-vening week, then the total population size of the species on the site is 200. That is,we assume that the proportion of birds caught on the second date that were marked(25/50 or 50%) is the same as that in the total population on the site. Because weknow that the number of marked birds is 100, then the total population is twicethat, that is, 200. Expressed mathematically: the total population size, P � n1n2/m2
where n1 is the number caught, marked, and released on the first date, n2 thenumber caught on the second date, and m2 is the number of those caught on thesecond date that were marked. In practice, there is no need to actually catch birdson the second date, as they could be recorded by walking around the site tryingto see as many birds as possible and recording those that were marked.
While the capture-mark-recapture approach may seem simple, it is in practicefraught with problems because it relies on a suite of assumptions, many of whichmay be untrue. For example:
• It assumes that birds mix freely within the population and this may rarelybe the case.
• It assumes that the population is closed and that no birds enter or leave thepopulation, either through births, deaths, or movements.
• It assumes that marking does not affect the probability that a bird willbe recaptured, and that marked birds have the same probability of survivalas unmarked birds.
• It assumes that marks do not fall off or become less visible.
While many of these assumptions may be broken, it is possible to plan fieldworkto minimize their influence on the results. For example, if the first and secondcapture dates are reasonably close together, the study site is well defined, andthe study is undertaken outside of the breeding and migration periods, then thepopulation will more approximate a closed one.
An array of mathematical models has been developed to analyze data fromcapture-mark-recapture studies. While it is not within the scope of this chapter
48 | Bird census and survey techniques
Suther-02.qxd 5/12/04 1:04 PM Page 48

to go into these methods, a range of approaches is available. The simplest ofthese, which is known as the Lincoln index (or Petersen method) assumes onecapture and one recapture (or re-sighting) event only, and that the population isclosed. The calculations for this model are essentially those described above.More complex models allow for multiple capture (re-sighting) events, and foropen populations. The latter types of model, generally known as Jolly-Sebermodels, provide information on both population size and survival rates. Furtherinformation on these models is given in Chapter 5.
The principle behind standard effort capture is that populations of birds canbe reliably monitored by capture methods if capture effort is kept constant overtime, and done at the same season each year. Several programs for monitoringbirds with this method exist, but perhaps the best known is the ConstantEffort Sites scheme of the British Trust for Ornithology (Peach et al. 1996,www.bto.org/ringing/ringinfo/ces/index.htm), which is being followed by anincreasing number of European countries. The Monitoring Avian Productivityand Survival (MAPS: www.birdpop.org/maps.htm) program is a similar initiat-ive in North America.
Catch per unit effort data can be used to:
• Monitor population trends of adult birds, based on the numbers caught.• Estimate absolute population size using the capture-mark-recapture
methods outlined above.• Monitor changes in productivity using the ratio of juveniles to adults
caught late in the season.• Estimate adult survival rates from between-year re-traps of ringed (banded)
birds (see Chapter 5).
For the Constant Effort Sites scheme, the capture method involves placingthe same types (e.g. mesh size) and lengths of mist nets (see Chapter 4), in thesame positions, for the same length of time (about 6 h per visit) over a series of12 visits during May to August. These methods are held constant from year toyear. All birds caught are identified, aged, and sexed, and all un-ringed birds areringed. While it might be tempting to vary net lengths from visit to visit, particu-larly if the number of fieldworkers varies from visit to visit, this could influencethe catches. Simply calculating the number of birds per 10 m of net is insuffi-cient, because doubling net lengths does not necessarily double the number ofbirds caught. Similarly, catching for twice as long with half the length of nets onsome visits is not advised as capture success may vary with time of day.
Constant effort ringing is commonly used in dense habitats (scrub, reed beds,undergrowth, etc), but it can also be used in forest canopies, with nets raised high
Field methods | 49
Suther-02.qxd 5/12/04 1:04 PM Page 49

above the ground using pulleys or telescopic poles. Because some dense habitats,such as scrub and reed bed, can be successional, care needs to be taken to ensurethat population trends reflect real changes in bird numbers rather than localhabitat change around the nets. Although the Constant Effort Sites scheme usesmist nets, any accepted capture technique (Chapter 4) can be used, providingthat effort is standardized (same number of traps, places, time periods, etc).
As a general survey or monitoring tool, catch per unit effort has some limi-tations, such as requiring specialist equipment and training and thus beingexpensive to maintain.
2.3.13 Tape playback
Some species of bird are particularly difficult to see or hear. Examples of suchspecies are those that have skulking behavior, live in dense habitats, are nocturnalor crepuscular or nest down burrows. The probability of detecting these speciescan sometimes be increased by the use of tape playback, in which the taped callor song of a bird is played, and a response listened for. Recordings of the calls andsongs of many species are now commercially available, and can be copied to tape.Ideally, use a tape loop, so that a short length of call can be repeated continuouslyfor as long as is required. The call can be broadcast from a simple hand-heldloudspeaker but care is needed to keep disturbance to a minimum and not toaffect the bird’s natural behavior.
The results from census work involving tape playback need careful interpreta-tion. If the aim is simply to determine whether a given species is present in anarea, then tape playback may simply increase the chance of finding it. If, however,the aim is to estimate population size or to produce a population index, thenmore care is needed. To generate a reliable population index, the probability ofbirds responding to the tape needs to be held as constant as possible. This can behelped, for example, by standardizing the manner in which the tape is played(same volume, recording, playback length, time of day, season, etc), and ensur-ing that the tape is not played to any one individual too frequently, causing it tohabituate and respond less frequently. Tape playback has been used widely formonitoring populations of marsh birds, owls and raptors (Gibbons et al. 1996;Newton et al. 2002; Lor and Malecki 2002).
Estimating absolute population size from tape playback is more complex, as theprobability of the average bird in the population responding to playback needs tobe known. Frequently, detailed additional work will be required to determineresponse probabilities. Such work has been undertaken on owls and nocturnalburrow-nesting seabirds. For example, Brooke (1978) has shown that responsesto playback of their call were obtained only from half of all occupied Manx
50 | Bird census and survey techniques
Suther-02.qxd 5/12/04 1:04 PM Page 50

Shearwater Puffinus puffinus burrows. Detailed observations on incubatingbirds showed that this was because males and females shared incubation equally,but that only males responded to playback. Playing the tape into numerous bur-rows, counting the number of responses, and doubling this number could thusyield an estimate of the overall population. Unfortunately, response probabilitiesare not always constant. In their studies of Storm Petrels Hydrobates pelagicusRatcliffe et al. (1998) have shown that response probabilities vary among yearsand colonies, and the cause of this variation is unknown. To estimate populationsize, it is thus necessary to determine year-specific and colony-specific responseprobabilities.
2.3.14 Vocal individuality
The songs and calls of many bird species are unique and often identifiable at thelevel of an individual, if not by ear, then from a sonogram. Acoustically distinctcalls of this kind have considerable potential in monitoring and conservation,particularly for birds that occur in dense vegetation or are otherwise difficult toobserve, but this potential has not always been realized (McGregor et al. 2000).The method involves recording songs or calls with a directional microphone andexamining sound spectrograms using freely available software. The spectrogramsfrom an individual bird are often recognizable by eye and discrimination can beformalized using statistical techniques.
Work on Bitterns Botaurus stellaris, in Britain has shown that their booming callsare individually quite distinct. This has allowed their numbers to be monitoredmore accurately and their year-to-year survival to be estimated (Gilbert et al.2002). In a study of the Corncrake Crex crex information gained from vocalizationsincreased census estimates by some 20–30% (Peake and McGregor 2001), andshowed that males called less frequently than was previously thought. The churringcall of male European Nightjar Caprimulgus europaeus, a mainly nocturnal andmobile species, has been shown to differ between individuals (Rebbeck et al. 2001).The pulse rate of calls and the phase lengths together allow identification of nearly99% of males. Interestingly, males were shown to move some distance withina breeding season, but return to the same territory year after year. It is hard to seehow these insights could have been gained by other methods. One can also applycapture-mark-recapture methods to re-sightings based on vocalizations to estimatepopulation size. In contrast, although the calls of Black-throated Diver Gaviaarctica are distinct, the method proved impractical as a monitoring tool becausecalls are infrequent and difficult to record (McGregor et al. 2000). In each case,quantitative rules were developed to help discriminate one bird from another, butthis is not always straightforward and, in some cases, ambiguity remains.
Field methods | 51
Suther-02.qxd 5/12/04 1:04 PM Page 51

An advantage of this method is that it is non-intrusive, which might beparticularly useful in studying rare and endangered species. The disadvantagesare: that it requires high quality recording of birds that often live at low densitiesacross scattered sites; ideally, one needs an independent means of identification,such as marking or radio tracking, to corroborate the findings; it requiresspecialist and quite expensive equipment; it often tells us only about breedingmales; and it can be time-consuming, unless the analysis is automated (seeRebbeck et al. 2001).
2.4 Conclusions
A whole variety of different approaches can be used in surveying birds, buta series of questions need to be asked before work can begin. For example, arewe interested in relative or absolute abundance, or a population index instead ofa population estimate? As we have seen, it is vital to establish the objectives ofthe survey at the outset and consider their practicality and relative priority. Thesurvey objectives will interact with, and be influenced by, the sampling strategy(choosing where to count) and the field method (how to count); these takentogether define our survey design. A number of generic rules help us decide howto select our survey plots; random stratified and regular sample designs are best.Stratification should always be considered. Furthermore, a number of rules allowus to choose between survey methods and apply them in an appropriate fashion.We recommend line and point transects as the two most adaptable and efficientmethods for most surveys. While each survey must be tailored to a particularsituation, the common application of field methods will greatly enhance ourability to compare across studies; and we make some practical suggestions.A number of specialized and often more intensive techniques are available forsurvey and research purposes.
References
Arendt, W.J., Gibbons, D.W., and Gray, G. (1999). Status of the volcanically threatenedMontserrat Oriole Icterus oberi and other forest birds in Montserrat, West Indies. BirdConserv. Int., 9, 351–372.
Bart. J. and S. Earnst. (2002). Double sampling to estimate density and population trendsin birds. Auk, 119, 36–45.
Bennun, L. and Howell, K (2002). African Forest biodiversity: a field survey manual for ver-tebrates, eds. G. Davies, and M. Hoffmann, Earthwatch Europe, Earthwatch, Oxford.
Bibby, C.J. (1999). Making the most of birds as environmental indicators. Ostrich, 70, 81–88.Bibby, C., Jones, M., and Marsden, S. (1998). Expedition Field Techniques: Bird Surveys.
Royal Geographical Society, London.
52 | Bird census and survey techniques
Suther-02.qxd 5/12/04 1:04 PM Page 52

Bibby, C.J., Burgess, N.D., Hill, D.A., and Mustoe, S.H. (2000). Bird Census Techniques,2nd ed. Academic Press, London.
BirdLife International (2000). Threatened birds of the world. Barcelona and Cambridge,Lynx Edicions and BirdLife International, UK.
Brooke, M. de L. (1978). Sexual differences in voice and individual recognition in theManx shearwater (Puffinus puffinus). Anim. Behav., 26, 622–629.
Buckland, S.T., Anderson, D.R., Burnham, K.P., Laake, J.L., and Borchers, D.L. (2001).Introduction to Distance Sampling: Estimating Abundance of Biological Populations.Oxford University Press, New York.
Carter, M.F, Hunter, W.C., Pashley, D.N., and Rosenberg, K.V. (2000). Setting conserva-tion priorities for land birds in the United States: the partners in flight approach. Auk,117, 541–548.
DeSante, D.F. (1981). A field test of the variable circular plot censusing technique in aCalifornia coastal scrub breeding bird community. In Estimating Numbers of TerrestrialBirds, eds. C.J. Ralph, and J.M. Scott. Studies in Avian Biology, 6, 177–185.
Dunn, E.H., Hussell, D.J.T., and Adams, R.J. (1997). Monitoring songbird populationchange with autumn mist netting. J. Wildlife Manage., 61, 389–396.
Evans, W.R. and K.V. Rosenberg. (2000). Acoustic monitoring of night-migrating birds: aprogress report. In Strategies for Bird Conservation: The Partners in Flight Planning Process.Proceedings of the 3rd Partners in Flight Workshop; Cape May, NJ. October 1–5, 1995.
Farnsworth, G.L., Pollock, K.H., Nichols, J.D., Simons, T.R., Hines, J.E., andSauer, J.R. (2002). A removal model for estimating detection probabilities from pointcount surveys. Auk, 119, 414–425.
Gibbons, D.W., Hill, D., and Sutherland, W.J. (1996). Birds. In Ecological CensusTechniques: A handbook, ed. W.J. Sutherland, pp. 227–259.
Gilbert, G., Gibbons, D.W., and Evans, J. (1998). Bird Monitoring Methods—a manualof techniques for key UK species. RSPB, Sandy.
Gilbert, G., Tyler, G.A., and Smith, K.S. (2002). Local annual survival of booming maleGreat Bittern Botaurus stellaris in Britain, in the period 1990–1999. Ibis, 144, 51–61.
Greenwood, J.J.D. (1996). Basic techniques. In Ecological Census Techniques: A handbook,ed. W.J. Sutherland, pp. 11–110.
Gregory, R.D. (2000). Development of breeding bird monitoring in the United Kingdomand adopting its principles elsewhere. The Ring, 22, 35–44.
Gregory, R.D. and Baillie, S.R. (1998). Large-scale habitat use of some declining Britishbirds. J. Appl. Ecol. 35, 785–799.
Gregory, R.D., Wilkinson, N.I., Noble, D.G., Brown, A.F., Robinson, J.A., Hughes,J. Procter, D.A., Gibbons D.W., and Galbraith, C.A. (2002). The population statusof birds in the United Kingdom, Channel Islands and Isle of Man: an analysis of conser-vation concern 2002–2007. Br. Birds, 95, 410–448.
Gregory, R.D., Noble, D., Field, R., Marchant, J.H, Raven, M., and Gibbons D.W.(2003). Using birds as indicators of biodiversity. Ornis Hungarica (in press).
Haselmayer, J. and Quinn, J.S. (2000). A comparison of point counts and sound recordingas bird survey methods in Amazonian southeast Peru. Condor, 102, 887–893.
Lewis, S.A. and Gould, W.R., (2000). Survey effort effects on power to detect trends inraptor migration counts. Wildlife Soc. Bull., 28, 317–329.
References | 53
Suther-02.qxd 5/12/04 1:04 PM Page 53

Lor S., Malecki, R.A. (2002). Call-response surveys to monitor marsh bird populationtrends. Wildlife Soc. Bull., 30, 1195–1201.
Loh, J. (ed.) (2002). Living Planet Report 2002. WWF Gland Switzerland.Marchant, J.H, Hudson, R., Carter, S.P., and Whittington, P.A. (1990). Population trends
in British breeding birds. British Turst for Ornithology, Thetford.McGregor, P.K., Peake, T.M., and Gilbert, G. (2000). Communication behaviour and
conservation. In Behaviour and Conservation, eds. L. Morris Gosling and W.J. Sutherland,pp. 261–280.
Nichols, J.D., Hines, J.E., Sauer, J.R., Fallon, F., Fallon, J., and Heglund, P.J. (2000).A double-observer approach for estimating detection probability and abundance fromavian point counts. The Auk, 117, 393–408.
Niemi, G.J., Hanowski, J.M., Lima, A.R., Nicholls, T., Weiland, N. (1997). A criticalanalysis on the use of indicator species in management. J. Wildlife Manage., 61:1240–1252.
Nemeth, E. and Bennun, L. (2000). Distribution, habitat selection and behaviour of theEast Coast Akalat Sheppardia gunningi sokokensis in Kenya and Tanzania. Bird Conser.Int., 10, 115–130.
Newton, I., Kavanagh, R., Olsen, J., and Tyalor, I. (2002). Ecology and Conservation of owls.CSIRI Publishing, Collingwood, Victoria, Australia.
Peach, W.J., Buckland, S.T., and Baillie, S.R. (1996). The use of constant effort mist-netting to measure between-year changes in the abundance and productivity of commonpasserines. Bird Stud., 43, 142–156.
Peake, T.M. and McGregor, P.K. (2001). Corncrake Crex crex census estimates: a conserva-tion application of vocal individuality. Anim. Behav. Conserv. 24, 81–90.
Ralph, C.J. and Scott, M. (1981) Estimating numbers of terrestrial birds. Studies in Avianbiology No. 6. Cooper Ornithological Society, USA.
Ralph, C.J. Sauer, J.R., and Droege, S. (1995). Monitoring Bird Populations by PointCounts. www.rsl.psw.fs.fed.us/projects/wild/gtr149/gtr_149.html.
Ratcliffe, N., Vaughan, D, Whyte, C., and Shepherd, M. (1998). The status of stormpetrels on Mousa, Shetland. Scott. Birds, 19, 15–163.
Rebbeck, M., Corrick, R., Eaglestone, B., and Stainton, C. (2001). Recognition of indi-vidual European Nightjars Caprimulgus europaeus from their song. Ibis, 143, 468–475.
Rosenstock, S.S., Anderson, D.R., Giesen, K.M., Leukering, T., and Carter, M.F (2002).Landbird counting techniques: Current practices and an alternative. Auk, 119, 46–53.
Sauer, J.R., Hines, J.E., and Fallon, J. (2001). The North American Breeding Bird Survey,Results and Analysis 1966–2000. Version 2001.2, USGS Patuxent Wildlife ResearchCenter, Laurel, MD.
Snedecor, G.W. and Cochran, W.G. (1980). Statistical Methods. The Iowa State Universitypress, Iowa.
Steinkamp, M., Peterjohn, H., Bryd, V., Carter, H., and Lowe, R. (2003). Breeding seasonsurvey techniques for seabirds and colonial waterbirds throughout North America.www.im.nbs.gov/cwb/manual/.
Sutherland, W.J. (2000). The Conservation Handbook: Research, management and Policy.Blackwell Scientific, Oxford.
54 | Bird census and survey techniques
Suther-02.qxd 5/12/04 1:04 PM Page 54

Thompson, W. L. (2002). Towards reliable bird surveys: accounting for individuals presentbut not detected. The Auk 119:18–25.
Whitman, A.A., Hagan, J.M., and Brokaw, N.V.L. (1997). A comparison of two birdsurvey techniques used in a subtropical forest. Condor, 99, 955–965.
Wilkinson, N.I., Langston, R.H., Gregory, R.D., Gibbons, D.W., and Marquiss, M.(2002). Capercaillie Tetrrao urogallus, abundance and habitat use in Scotland, in winter1998–99. Bird Stud., 49, 177–185.
Wotton, S.R., Carter, I., Cross, A.V., Etheridge, B., Snell, N., Duffy, K., Thorpe, R., andGregory, R.D. (2002). Breeding status of the Red kite Milvus milvus in Britain in 2000.Bird Stud., 49, 278–286.
References | 55
Suther-02.qxd 5/12/04 1:04 PM Page 55

Suther-02.qxd 5/12/04 1:04 PM Page 56