BIP Supplemental Information Q4 2020
57
BROOKFIELD INFRASTRUCTURE PARTNERS L.P. Q4 2020 Supplemental Fourth Quarter and Full Year, December 31, 2020 Information
Transcript of BIP Supplemental Information Q4 2020

BROOKFIELD INFRASTRUCTURE PARTNERS L.P.
Q4 2020 Supplemental
Fourth Quarter and Full Year, December 31, 2020
Information

1
Cautionary Statement Regarding Forward-Looking Statements
This Supplemental Information contains forward-looking information within the meaning of Canadian provincial securities laws and “forward-looking statements” within the meaning of certain securities laws including Section 27A of the U.S. Securities Act of 1933, as amended, Section 21E of the U.S. Securities Exchange Act of 1934, as amended, “safe harbor” provisions of the United States Private Securities Litigation Reform Act of 1995 and in any applicable Canadian securities regulations. We may make such statements in this report, in other filings with Canadian regulators or the SEC or in other communications. The words “expect”, “target”, “believe”, “objective”, “anticipate”, “plan”, “estimate”, “growth”, “increase”, “return”, “expand”, “maintain”, derivatives thereof and other expressions of similar import, or the negative variations thereof, and similar expressions of future or conditional verbs such as “will”, “may”, “should”, “could”, which are predictions of or indicate future events, trends or prospects and which do not relate to historical matters, identify forward-looking statements. Forward-looking statements in this Supplemental Information include among others, statements with respect to our assets tending to appreciate in value over time, current and proposed growth initiatives in our assets and operations, increases in FFO per unit and resulting capital appreciation, returns on capital and on equity, increasing demand for commodities and global movement of goods, volume increases in the businesses in which we operate, expected capital expenditures, the impact of planned capital projects by customers of our businesses, the extent of our corporate, general and administrative expenses, our ability to close acquisitions and the expected timing thereof, our capacity to take advantage of opportunities in the marketplace, the future prospects of the assets that Brookfield Infrastructure operates or will operate, ability to identify, acquire and integrate new acquisition opportunities, long-term targeted returns on our assets, sustainability of distribution levels, the level of distribution growth and payout ratios over the next several years and our expectations regarding returns to our unitholders as a result of such growth, operating results and margins for our business and each of our operations, future prospects for the markets for our products, Brookfield Infrastructure’s plans for growth through internal growth and capital investments, ability to achieve stated objectives, ability to drive operating efficiencies, return on capital expectations for the business, contract prices and regulated rates for our operations, our expected future maintenance and capital expenditures, commissioning of capital from our backlog, ability to deploy capital in accretive investments, impact on the business resulting from our view of future economic conditions, our ability to maintain sufficient financial liquidity, our ability to draw down funds under our bank credit facilities, our ability to secure financing through the issuance of equity or debt, expansions of existing operations, financing plans for operating companies, foreign currency management activities and other statements with respect to our beliefs, outlooks, plans, expectations and intentions. Although we believe that Brookfield Infrastructure’s anticipated future results, performance or achievements expressed or implied by the forward-looking statements and information are based upon reasonable assumptions and expectations, the reader should not place undue reliance on forward-looking statements and information because they involve known and unknown risks, uncertainties and other factors which may cause the actual results, performance or achievements of Brookfield Infrastructure to differ materially from anticipated future results, performance or achievements expressed or implied by such forward-looking statements and information.
Factors that could cause actual results to differ materially from those contemplated or implied by forward-looking statements include: general economic and financial conditions in the countries in which we do business which may impact market demand for our products and services, foreign currency risk, the level of government regulation affecting our businesses, the outcome and timing of various regulatory, legal and contractual issues, global credit and financial markets, the competitive business environment in the industries in which we operate, the competitive market for acquisitions and other growth opportunities, availability of equity and debt financing, the completion of various large capital projects by customers of our businesses which themselves rely on access to capital and continued favorable commodity prices, weakening of demand for products and services in the markets for the commodities that underpin demand for our infrastructure, our ability to complete transactions in the competitive infrastructure space (including the transactions referred to in this presentation, some of which remain subject to the satisfaction of conditions precedent, and the inability to reach final agreement with counterparties to transactions referred to in this presentation as being currently pursued, given that there can be no assurance that any such transaction will be agreed to or completed) and to integrate acquisitions into existing operations, our ability to complete large capital expansion projects on time and within budget, our ability to achieve the milestones necessary to deliver targeted returns to our unitholders, including targeted distribution growth, ability to negotiate favorable take-or-pay contractual terms, traffic volumes on our toll roads, our ability to obtain relevant regulatory approvals and satisfy conditions precedent required to complete acquisitions, acts of God, weather events, or similar events outside of our control, and other risks and factors detailed from time to time in documents filed by Brookfield Infrastructure with the securities regulators in Canada and the United States, including Brookfield Infrastructure’s most recent Annual Report on Form 20-F under the heading “Risk Factors”.
We caution that the foregoing list of important factors that may affect future results is not exhaustive. When relying on our forward-looking statements to make decisions with respect to Brookfield Infrastructure, investors and others should carefully consider the foregoing factors and other uncertainties and potential events. Except as required by law, Brookfield Infrastructure undertakes no obligation to publicly update or revise any forward-looking statements or information, whether written or oral, that may be as a result of new information, future events or otherwise.
CAUTIONARY STATEMENT REGARDING USE OF NON-IFRS, ACCOUNTING MEASURESAlthough our financial results are determined in accordance with International Financial Reporting Standards (IFRS), the basis of presentation throughout much of this report differs from IFRS in that it is organized by business segment and utilizes, funds from operations (FFO), adjusted funds from operations (AFFO), adjusted EBITDA and invested capital as important measures. This is reflective of how we manage the business and, in our opinion, enables the reader to better understand our affairs. We provide a reconciliation to the most directly comparable IFRS measure on pages 42-52 of this Supplemental Information. Readers are encouraged to consider both measures in assessing Brookfield Infrastructure's results.
BUSINESS ENVIRONMENT AND RISKSBrookfield Infrastructure's financial results are impacted by various factors, including the performance of each of our operations and various external factors influencing the specific segments and geographic locations in which we operate; macro-economic factors such as economic growth, changes in currency, inflation and interest rates; regulatory requirements and initiatives; and litigation and claims that arise in the normal course of business. These and other factors are described in Brookfield Infrastructure’s most recent Annual Report on Form 20-F which is available on our website at www.brookfieldinfrastructure.com and at www.sec.gov/edgar.shtml and www.sedar.com.

2
InfrastructureR83 G55 B82
RenewableR92 G153 B121
Private EquityR230 G203 B140
• Increased FFO by $70 million, or 5% year-over-year, and FFO per unit by 2%, despite a challenging global operating environment
– Results for the year benefited from organic growth of 6%, the contribution from capital deployed across all segments and realized gains on our financial asset portfolio
– The single largest negative impact on results was a 23% depreciation in the Brazilian real, which reduced U.S. denominated FFO by ~$100 million
– Results were further impacted by a temporary loss of earnings caused by global economic shutdowns in the first half of the year
– Payout ratio of 68% after adjusting for the impacts of a lower Brazilian real, the economic shutdowns and the timing of capital deployment
• Total distributions paid in 2020 of $1.94 per unit represent an increase of 7% compared to the prior year
• Return of invested capital of 13% after adjusting for the impact of the Brazilian real
• Net income increased compared to the prior year due to the benefits of organic growth, contributions from recently completed acquisitions and a realized gain associated with the partial disposition of our Australian export terminal, partially offset by the impact of foreign exchange and higher depreciation associated with our annual revaluation process and new investments
• Total assets increased primarily as a result of recent acquisitions, partially offset by the impacts of dispositions, depreciation and amortization and foreign exchange
2020 HighlightsKEY PERFORMANCE METRICS
KEY BALANCE SHEET METRICS
PERFORMANCE HIGHLIGHTS
$1,454 million of FFO
$1.94 Distributions per unit (See “Reconciliation of Non-IFRS Financial Measures“) 12 months ended December 31
US$ MILLIONS, EXCEPT PER UNIT INFORMATION, UNAUDITED 2020 2019
Funds from operations (FFO) $ 1,454 $ 1,384
Per unit FFO1 3.13 3.06
Distributions per unit1 1.94 1.81
Payout ratio2 78 % 74 %
Growth of per unit FFO 2 % 9 %
Adjusted funds from operations (AFFO) 1,173 1,096
Return on Invested Capital (ROIC)3 12 % 12 %
Net income4 394 233
Net income per limited partner unit5 0.35 0.06
Adjusted Earnings 621 591
Adjusted Earnings per unit1 1.34 1.30
As of
US$ MILLIONS, UNAUDITED Dec 31, 2020 Dec 31, 2019
Total assets $ 61,331 $ 56,308
Corporate borrowings 3,158 2,475
Invested capital 9,213 9,009
1.Average units, adjusted for BIPC share split, for the twelve-month period ended December 31, 2020 was 464.9 million (2019: 452.9 million). Average units, prior to adjusting for BIPC, for the twelve-month period ended December 31, 2020 was 418.4 million, respectively (2019: 407.6 million)
2.Payout ratio defined as distributions paid (inclusive of GP incentive and preferred unit) divided by FFO3.Return on invested capital is calculated as AFFO, adjusted for an estimate of returns of capital of $122 million
for the twelve-month period ended December 31, 2020 (2019: $109 million), divided by average invested capital
4. Includes net income attributable to non-controlling interests - Redeemable Partnership Units held by Brookfield, non-controlling interests - Exchange LP Units, general partner, limited partners and class A shares of BIPC
5.Average limited partnership units outstanding on a time weighted average basis for the twelve-month period ended December 31, 2020 was 294.7 million (2019: 285.6 million). Net income per limited partnership unit has been adjusted to reflect the dilutive impact of the special distribution

3
FINANCING AND LIQUIDITY• Liquidity at the corporate level currently stands at $2.4 billion• Completed the sale of four mature assets and several
financings generating over $700 million of proceeds– Combined, these sales resulted in an after-tax IRR of 20%
and a 3x multiple of capital• Raised ~$700 million in net proceeds at the corporate level:
– Raised C$900 million of medium term-notes, with part of the proceeds used to opportunistically redeem C$450 million of notes that were to mature in 2022
– Issued $400 million of green preferred units in two equal tranches; proceeds were raised in September 2020 and January 2021, respectively
• To enhance liquidity during the economic shutdown, we secured an incremental $1 billion bulge facility
GROWTH INITIATIVES• Closed the acquisition of a newly constructed portfolio of
137,000 telecom towers in India for $3.4 billion (BIP's share - $580 million)
• Acquired an interest in a world-class U.S. LNG export terminal for ~$1.5 billion (BIP's share - $425 million)
• Deployed over $600 million ($350 million net of margin) in publicly listed infrastructure opportunities amidst volatility in the capital markets
• Agreed to acquire a controlling stake in Thermondo Gmbh, the largest independent residential heating distribution company in Germany, for ~$75 million (BIP’s share – ~$20 million)
2020 Highlights (cont’d)
OPERATIONS• Deployed ~$935 million in growth capital expenditures to increase
rate base at our utilities operations and add capacity at our transport, midstream and data businesses
• New connection activity at our U.K. residential distribution business averaged ~80% of prior year levels and has steadily increased since the government mandated shutdown in April– New sales have fully recovered with Q4 levels exceeding the
prior year; backlog totals 1.2 million connections
• Our Brazilian regulated gas transmission operation received its annual inflationary tariff adjustment resulting in a 24% increase in local currency revenue for 2021
• Continued the build-out of our electricity transmission lines in Brazil through the acquisition of 300 kilometers of pre-construction transmission lines, increasing our total portfolio to 5,300 kilometers
• Traffic volumes at our toll roads have steadily recovered from declines experienced earlier in the year; during Q4, average traffic exceeded the prior year on a same-store basis by 5%
• Our U.K. port operation received two favorable rulings with respect to ongoing arbitration processes with long-term tenants; rulings resulted in a 3x increase to annual rent
• Our U.S. gas pipeline delivered strong results during the year, benefiting from favorable market conditions and the commissioning of two growth projects– These projects required $110 million (BIP's share - $55 million)
of capital and will contribute annual EBITDA of $45 million (BIP's share - $23 million)
• Progressed the integration and development of our India telecom tower business with the signing of a binding term sheet with one of India's leading MNOs in January to co-locate their telecommunication equipment on our towers

4
Our Business
OUR MISSION
• To own and operate a globally diversified portfolio of high quality infrastructure assets that will generate sustainable and growing distributions over the long-term for our unitholders
PERFORMANCE TARGETS AND KEY MEASURES
• Target a 12% to 15% total annual return on invested capital measured over the long term
• Expect to generate returns from in-place cash flows plus growth through investments in upgrades and expansions of our asset base
• Growth in FFO per unit is one of the key performance metrics that we use to assess our ability to sustainably increase distributions in future periods
BASIS OF PRESENTATION
• Our consolidated financial statements are prepared in accordance with International Financial Reporting Standards (IFRS) as issued by the International Accounting Standards Board (IASB)
• For each operating segment, this Supplemental Information outlines Brookfield Infrastructure’s proportionate share of results in order to demonstrate the impact of key value drivers of each operating segment on the partnership’s overall performance

5
Distribution Policy
Our payout ratio is determined based on the amount of cash flow generated in our businesses that is available for distribution
• Objective is to pay a distribution that is sustainable on a long-term basis while retaining sufficient liquidity within our operations to fund recurring growth capital expenditures and general corporate requirements
• We fund all of our growth initiatives through a combination of issuances of common equity, preferred equity and corporate debt, proceeds from asset sales and retained internally generated cash flow
– Available funding and assessment of corporate liquidity is undertaken prior to committing to all new investments and capital projects
• Distributions are determined on the basis of the proportionate cash flow generating capacity of our businesses. We monitor proportionate cash flow from operations rather than focusing exclusively on its consolidated equivalent, since we exercise co-control or significant influence over decision-making with respect to distributions from our unconsolidated subsidiaries:
– Each of our businesses is required to distribute all of its available cash (generally defined as cash on hand less any amounts reserved for committed growth projects)
– Our governance arrangements over these businesses effectively provide us with a veto over any decision not to distribute all available cash flow. That is, any decision not to distribute available cash flow in these businesses requires our consent

6
Distribution Profile
BIP has a conservative payout ratio underpinned by stable, highly regulated or contracted cash flows generated from operations
• We believe that a payout of 60-70% of FFO is appropriate
• Targeting 5% to 9% annual distribution growth, in light of expected per unit FFO growth
• Distribution payout is reviewed with the Board of Directors in the first quarter of each year
• The Board of Directors has declared a quarterly distribution in the amount of $0.51 per unit, payable on March 31, 2021 to unitholders of record as at the close of business on February 26, 2021. This quarterly distribution represents a 5% increase compared to the prior year
– Distributions have grown at a compound annual growth rate of 10% over the last 10 years
• Below is a summary of our distribution history since the spin-off
US$, UNAUDITED 2008 2009 2010 2011 2012 2013 2014 2015 2016 2017 2018 2019 2020 2021F
Annual Distribution1 $0.53 $0.64 $0.66 $0.79 $0.90 $1.04 $1.15 $1.27 $1.4 $1.57 $1.69 $1.81 $1.94 $2.04
Growth N/A — % 4% 20% 14% 15% 12% 10% 10% 12% 8% 7% 7% 5 %
1. Annual distribution amounts have been adjusted for the 3-for-2 stock split effective September 14, 2016 and the special distribution of BIPC shares effective March 31, 20202. 2008 distribution was prorated from spin-off

7
Distribution Profile (cont'd)
Over the last 10 years, the Partnership has been able to achieve its target payout ratio of60-70% of funds from operations while increasing its distribution by an average of 10%
• Based on our distribution track record, the Partnership’s average distribution payout ratio for the last 10 years is 69% of FFO, as shown below
TotalUS$ MILLIONS, UNAUDITED 2011 2012 2013 2014 2015 2016 2017 2018 2019 2020 2011-2020Funds from Operations (FFO) $ 392 $ 462 $ 682 $ 724 $ 808 $ 944 $ 1,170 $ 1,231 $ 1,384 $ 1,454 $ 9,251
Adjusted Funds from Operations (AFFO) 300 355 553 593 672 771 941 982 1,096 1,173 7,436
Distributions 222 304 388 448 546 628 794 919 1,027 1,134 6,410
FFO payout ratio 57 % 66 % 57 % 62 % 68 % 67 % 68 % 75 % 74 % 78 % 69 %AFFO payout ratio 74 % 86 % 70 % 76 % 81 % 81 % 84 % 94 % 94 % 97 % 86 %

8
Organic Growth within our Business
Organic growth demonstrates our ability to deliver sustainable cash flow growth
• Our business is well-positioned to deliver per unit FFO organic growth of 6-9%
• The three principle drivers of recurring annual cash flow growth embedded in our businesses are:
• In order to showcase the sustainability of our cash flow growth year-over-year, we calculate organic growth prior to management fees and corporate expenses and remove the following impacts:
– Contributions from acquisitions and dispositions completed in the last 12 months
– Impacts of foreign exchange since the previous period
– Movements in results at our gas storage operations as cash flows can be impacted by volatility caused by movements in spreads relating to natural gas prices
Volume Upsidefrom GDP
Growth
1-2%
Cash FlowsReinvested
2-3%
FFO/UnitGrowth
6-9%
Inflationary Price Increases
3-4%
+ + =

9
Our Operations
• Own and operate a diversified portfolio of high-quality, long-life utilities, transport, midstream and data assets
• Generate stable cash flows with ~95% of adjusted EBITDA supported by regulated or long-term contracts
• Leverage Brookfield’s best in-class operating segments to extract additional value from investments
SEGMENT DESCRIPTION ASSET TYPE PRIMARY LOCATION
UtilitiesRegulated or contractual businesses which earn a return on their asset base
lRegulated Transmission(1)
lCommercial & Residential Distribution(1)lNorth & South America, Asia PacificlNorth & South America, Europe
TransportProvide transportation for freight, commodities and passengers
lRail lToll Roads lDiversified Terminals(1)
lNorth & South America, Asia PacificlSouth America & Asia PacificlNorth America, Europe & Asia Pacific
Midstream(1)Systems that provide transmission, gathering, processing and storage services
lMidstream lNorth America
DataProvide critical infrastructure and services to global communication companies
l Data Transmission & DistributionlData Storage
lEurope & Asia PacificlNorth & South America, Asia Pacific
1. During the fourth quarter of 2020, our partnership conducted a comprehensive review of our operating segments. To better align with how our partnership reviews and evaluates our operations, our district energy and Indian natural gas operations were reallocated to our regulated distribution and regulated transmission subsegments, respectively, within our utilities segment. Our Australian export terminal was reallocated to our ports subsegment, within our transport segment. Our regulated distribution subsegment was renamed commercial and residential distribution, our ports subsegment was renamed diversified terminals, our energy segment was renamed to midstream and our data infrastructure segment was renamed to data

10
Selected Income Statement and Balance Sheet Information
The following tables present selected income statement and balance sheet information by operating segment on a proportionate basis:
STATEMENTS OF OPERATIONS STATEMENTS OF FINANCIAL POSITION
12 months ended December 31, As of
US$ MILLIONS, UNAUDITED 2020 2019 US$ MILLIONS, UNAUDITED Dec 31, 2020 Dec 31, 2019
Net income (loss) by segment Net assets by segment
Utilities $ 220 $ 303 Utilities $ 6,814 $ 6,679
Transport 85 90 Transport 9,155 7,962
Midstream 95 190 Midstream 3,829 3,689
Data 32 (13) Data 3,338 2,204
Corporate (38) (337) Corporate (2,062) (1,284)
Net income $ 394 $ 233 Total assets $ 21,074 $ 19,250
Adjusted EBITDA by segment Net debt by segment
Utilities $ 854 $ 850 Utilities $ 3,918 $ 3,567
Transport 806 833 Transport 4,946 3,904
Midstream 379 320 Midstream 1,584 1,562
Data 266 175 Data 1,343 886
Corporate (312) (279) Corporate 2,694 2,202
Adjusted EBITDA $ 1,993 $ 1,899 Net debt $ 14,485 $ 12,121
FFO by segment Partnership capital by segment
Utilities $ 659 $ 672 Utilities $ 2,896 $ 3,112
Transport 590 603 Transport 4,209 4,058
Midstream 289 244 Midstream 2,245 2,127
Data 196 136 Data 1,995 1,318
Corporate (280) (271) Corporate (4,756) (3,486)
FFO $ 1,454 $ 1,384 Partnership capital $ 6,589 $ 7,129

11
OPERATING SEGMENTS

12
SEGMENT OVERVIEW• Businesses that generate long-term returns on
regulated or contractual asset base (rate base)• Rate base increases with capital that we invest to
upgrade and/or expand our systems• Virtually all of adjusted EBITDA supported by
regulated or contractual revenues
OBJECTIVES• Invest capital to increase our rate base • Earn an attractive return on rate base• Provide safe and reliable service to our customers
OPERATIONS• Regulated Transmission:
– ~4,200 km of natural gas pipelines in North America, South America and India
– ~5,300 km of transmission lines in Brazil, of which ~2,000 km are operational
• Commercial & Residential Distribution:– Provides residential infrastructure services to
~1.9 million customers annually in the U.S. and Canada and ~330,000 long-term contracted sub-metering services within Canada
– ~6.9 million connections, predominantly electricity and natural gas, and ~1.5 million installed smart meters
– Delivers 3,792,000 pounds per hour of heating and 327,000 tons of contracted cooling capacity
Utilities Operations
1. Return on rate base is adjusted EBITDA divided by time weighted average rate base2. Return on rate base excludes impact of connections revenue at our UK regulated distribution business, a return of capital
component from earnings generated at our Brazilian transmission businesses and foreign exchange
The following table presents selected key performance metrics of our utilities segment:
• FFO of $659 million in 2020 compared to $672 million in the prior year
– FFO benefited from inflation-indexation and capital commissioned into rate base over the last 12 months, the contribution to earnings from two acquisitions and higher exchange rates on our British pound hedge contracts
– These positive impacts were more than offset by a delay in the recognition of connections revenue at our U.K. regulated distribution business, loss of earnings associated with three asset sales and the impact of a decline in the Brazilian real, which reduced U.S. dollar results by approximately $50 million
12 months ended December 31
US$ MILLIONS, UNAUDITED 2020 2019
Rate base $ 5,199 $ 5,169
Funds from operations (FFO) $ 659 $ 672
Maintenance capital (30) (33)
Adjusted funds from operations (AFFO) $ 629 $ 639
Return on rate base1,2 12 % 12 %

13
FINANCIAL RESULTS
• Adjusted EBITDA and FFO were $854 million and $659 million, respectively, versus $850 million and $672 million, respectively, in the prior year
– Commercial & Residential Distribution: Adjusted EBITDA and FFO benefited from inflation-indexation, capital commissioned into rate base in the last 12 months, and higher exchange rates on our British pound hedge contracts
– These positive factors were more than offset by lower connections activity at our U.K. regulated distribution business and the loss of earnings associated with the sales of our Colombian distribution utility and Australian district energy operation
– Regulated Transmission: Adjusted EBITDA and FFO benefited from inflation-indexation and the contribution from the acquisitions of a North American regulated gas transmission business and a natural gas pipeline in India
– These positive factors were more than offset by the loss of earnings from the sale of our North American transmission operation and the impact of foreign exchange
Utilities Operations (cont’d)
The following table presents our utilities segment’s proportionate share of financial results:
The following table presents our proportionate adjusted EBITDA and FFO for this operating segment by business:
12 months ended December 31
US$ MILLIONS, UNAUDITED 2020 2019
Revenue $ 1,339 $ 1,315
Connections revenue 95 117
Cost attributable to revenues (580) (582)
Adjusted EBITDA 854 850
Interest expense (152) (147)
Other expenses (43) (31)
Funds from operations (FFO) 659 672
Depreciation and amortization (268) (264)
Deferred taxes and other items (171) (105)
Net income $ 220 $ 303
12 months ended December 31 Adjusted EBITDA FFO
US$ MILLIONS, UNAUDITED 2020 2019 2020 2019Commercial & Residential Distribution $ 497 $ 492 $ 401 $ 402
Regulated Transmission 357 358 258 270
Total $ 854 $ 850 $ 659 $ 672

14
CAPITAL BACKLOG
Projects that we have been awarded and/or filed with regulators with anticipated commissioning into rate base in the next two to three years
• Ended the period with ~$1.1 billion of total capital to be commissioned into rate base; a 10% decrease compared to the prior year
– New connection mandates awarded during the period were more than offset by the impact of foreign exchange and capital projects commissioned into rate base
• The largest contributors to capital expected to be commissioned into rate base include:
– ~$625 million at our U.K. regulated distribution business;
– ~$220 million at our Brazilian electricity transmission business; and
– ~$145 million at our North American residential infrastructure business to grow the customer base
RATE BASE
• Rate base increased compared to year-end as the impact of new connections at our U.K. regulated distribution business, inflation-indexation at our Brazilian regulated gas transmission business and new long-term rental contracts secured at our North American residential infrastructure business were more than offset by the impact of foreign exchange and asset sales
Utilities Operations (cont’d)
The following tables present our proportionate share of capital backlog and rate base:
12 months ended December 31
US$ MILLIONS, UNAUDITED 2020 2019
Capital backlog, start of period $ 848 $ 853
Impact of asset sales (19) —
Additional capital project mandates 360 624
Less: capital expenditures (521) (496)
Foreign exchange and other (34) (133)
Capital backlog, end of period 634 848
Construction work in progress 438 340
Total capital to be commissioned $ 1,072 $ 1,188
12 months ended December 31
US$ MILLIONS, UNAUDITED 2020 2019
Rate base, start of period $ 5,169 $ 3,960
Acquisitions — 832
Impact of asset sales (162) —
Capital expenditures commissioned 338 362
Inflation and other indexation 164 172
Regulatory depreciation (87) (81)
Foreign exchange and other (223) (76)
Rate base, end of period1 $ 5,199 $ 5,169
1. Rate base excludes our North American district energy operation as we agreed to sell the business in February 2021

15
Transport Operations
SEGMENT OVERVIEW• Provide transportation for freight, commodities and
passengers• Rail and toll road revenues are subject to regulatory
price ceilings, while diversified terminals are primarily unregulated
OBJECTIVES• Increase throughput of existing assets
• Expand networks in a capital efficient manner to support incremental customer demand
• Provide safe and reliable service for our customers
OPERATIONS• Rail
– 116 short line freight railroads comprising over 22,000 km of track in North America and Europe
– Sole provider of rail network in southern half of Western Australia with ~5,500 km of track and operator of ~4,800 km of rail in Brazil
• Toll Roads – ~3,800 km of motorways in Brazil, Chile, Peru
and India• Diversified Terminals
– 13 terminals in North America, U.K., and Australia
– ~25 million tonnes per annum LNG export terminal in the U.S. and ~85 million tonnes per annum export facility in Australia
The following table presents selected key performance metrics for our transport segment:
• FFO of $590 million in 2020 compared to $603 million in 2019
– Current year results benefited from:
i. Higher volumes moved across our rail networks in Australia and Brazil;
ii. The contributions from recently completed acquisitions (North American rail operation and U.S. LNG export terminal); and
iii. Favorable arbitration settlements at our U.K. port operation
– These positive factors were more than offset by economic shutdown related traffic declines at our toll road businesses, the loss of earnings associated with the partial sale of our Chilean toll road operation and a decline in the Brazilian real, which reduced results by ~$50 million
12 months ended December 31
US$ MILLIONS, UNAUDITED 2020 2019
Growth capital expenditures $ 138 $ 178
Adjusted EBITDA margin 51 % 52 %
Funds from operations (FFO) 590 603
Maintenance capital (133) (154)
Adjusted funds from operations (AFFO) $ 457 $ 449
1. Adjusted EBITDA margin is adjusted EBITDA divided by revenues

16
Transport Operations (cont’d)
The following table presents our transport segment’s proportionate share of financial results:
FINANCIAL RESULTS
• Adjusted EBITDA and FFO were $806 million and $590 million, respectively, versus $833 million and $603 million, respectively, in the prior year
– Rail: Adjusted EBITDA and FFO increased due to higher volumes moved on our rail networks in Brazil and Australia, and the contribution from our North American rail operation acquired in December 2019, partially offset by the impact of foreign exchange
– Toll roads: Adjusted EBITDA and FFO decreased as a result of a partial sale of our Chilean toll road operation, the planned hand-back of a state concession at our Brazilian toll road operation, government restrictions on traffic flows and the impact of a lower Brazilian real
– Diversified terminals: Adjusted EBITDA and FFO increased primarily due to the recent acquisition of our U.S. LNG export terminal and favorable arbitration settlements at our U.K. operations– These positive factors were partially offset by
the loss of income from the sale of our European port operation
– Container volumes were in-line with the prior year as shipping activity recovered from the disruption to global trade created by the economic shutdowns in the first half of the year
12 months ended December 31
US$ MILLIONS, UNAUDITED 2020 2019
Revenue $ 1,573 $ 1,614
Cost attributable to revenues (767) (781)
Adjusted EBITDA 806 833
Interest expense (214) (227)
Other expenses (2) (3)
Funds from operations (FFO) 590 603
Depreciation and amortization (419) (370)
Deferred taxes and other items (86) (143)
Net income $ 85 $ 90
12 months ended December 31 Adjusted EBITDA FFO
US$ MILLIONS, UNAUDITED 2020 2019 2020 2019
Rail $ 328 $ 282 $ 265 $ 215
Toll Roads 216 314 142 223
Diversified terminals 262 237 183 165
Total $ 806 $ 833 $ 590 $ 603
The following table presents our proportionate adjusted EBITDA and FFO for this operating segment by business:

17
Title Slide Font
Light BackgroundR17 G17 B17
Dark BackdropR255 G255 B255
Real EstateR71 G151 B181
InfrastructureR83 G55 B82
RenewableR92 G153 B121
Private EquityR230 G203 B140
R17 G17 B17
Logo & Divider Slide Font
Transport Operations (cont’d)
Capital Backlog
We expect enhancements to our networks over the next two to three years to expand capacity and support additional volumes, leading to cash flow growth over the long term The following table presents our proportionate share of growth capital backlog:
• Consists of the following types of projects:
– Rail: Upgrading and expanding our network to capture volume growth from incremental activity in the sectors we serve
– Toll roads: Increasing the capacity of our roads by increasing and widening lanes on certain routes to support traffic growth
– Diversified terminals: Increasing capacity of our terminals by deepening the berths and enhancing and modernizing our existing infrastructure
• Largest contributors to capital to be commissioned over the next two to three years are our South American toll road businesses and our diversified terminals with ~$465 million and ~$275 million, respectively
12 months ended December 31US$ MILLIONS, UNAUDITED 2020 2019
Capital backlog, start of period $ 383 $ 529
Impact of acquisitions 54 —
Additional capital project mandates 157 90
Less: capital expenditures (138) (178)
Foreign exchange and other (35) (58)
Capital backlog, end of period $ 421 $ 383
Construction work in progress 333 199
Total capital to be commissioned $ 754 $ 582

18
Midstream Operations
1. Adjusted EBITDA margin is adjusted EBITDA divided by revenues
The following table presents selected key performance metrics for our midstream segment:
SEGMENT OVERVIEW• Systems that provide transmission and storage
services• Profitability based on the volume and price achieved
for the provision of these services• Businesses are typically unregulated or subject to
price ceilings
OBJECTIVES• Satisfy customer growth requirements by increasing
the utilization of our assets and expanding our capacity in a capital efficient manner
• Provide safe and reliable service to our customers
OPERATIONS• Midstream:
– ~15,000 km of natural gas transmission pipelines in the U.S.
– ~600 billion cubic feet of natural gas storage in the U.S. and Canada
– 16 natural gas processing plants with ~2.9 Bcf per day of total processing capacity and ~3,400 km of gas gathering pipelines in Canada
• FFO of $289 million in 2020 compared to $244 million in 2019
– FFO at our midstream operations grew organically by 13%, despite a challenging operating environment– Results benefited from strong transportation volumes and
improved storage spreads across our portfolio, as well as the commissioning of two growth projects in the fourth quarter at our U.S. gas pipeline
– Results also benefited from the acquisition of the federally regulated portion of our Western Canadian midstream business acquired in December 2019
12 months ended December 31
US$ MILLIONS, UNAUDITED 2020 2019
Growth capital expenditures $ 145 $ 91
Adjusted EBITDA margin1 66 % 65 %
Funds from operations (FFO) 289 244
Maintenance capital (92) (84)
Adjusted funds from operations (AFFO) $ 197 $ 160

19
Midstream Operations (cont’d)
The following table presents our midstream segment’s proportionate share of financial results:
FINANCIAL RESULTS
• Adjusted EBITDA and FFO were $379 million and $289 million, respectively, versus $320 million and $244 million, respectively, in the prior year
– Adjusted EBITDA and FFO increased due to new growth initiatives commissioned at our U.S. gas pipeline, higher spreads at our storage operations and the incremental earnings associated with the acquisition of the federally regulated portion of our western Canadian midstream business
12 months ended December 31
US$ MILLIONS, UNAUDITED 2020 2019
Revenue $ 572 $ 491
Cost attributable to revenues (193) (171)
Adjusted EBITDA 379 320
Interest expense (93) (86)
Other income 3 10
Funds from operations (FFO) 289 244
Depreciation and amortization (153) (131)
Deferred taxes and other items (41) 77
Net income $ 95 $ 190

20
Title Slide Font
Light BackgroundR17 G17 B17
Dark BackdropR255 G255 B255
Real EstateR71 G151 B181
InfrastructureR83 G55 B82
RenewableR92 G153 B121
Private EquityR230 G203 B140
R17 G17 B17
Logo & Divider Slide Font
Midstream Operations (cont’d)
Capital BacklogEnhancements to our systems over the next two to three years that are expected to expand capacity to support additional volumes, leading to cash flow growth over the long term
• Consists of the following midstream projects:
– Expanding systems to capture volume growth underpinned by long-term take-or-pay contracts
– Upgrading systems to attain incremental volumes from increased demand in regions we serve
• ~$110 million at our U.S. gas pipeline, primarily related to the second phase of the Gulf Coast expansion project, which is anchored by a 20-year, 300,000 dekatherms per day contract with a large LNG operator and is expected to be commissioned in early 2021
The following table presents our proportionate share of growth capital backlog:
12 months ended December 31US$ MILLIONS, UNAUDITED 2020 2019
Capital backlog, start of period $ 161 $ 223
Additional capital project mandates 18 25
Less: capital expenditures (145) (91)
Foreign exchange and other (26) 4
Capital backlog, end of period $ 8 $ 161
Construction work in progress 121 93
Total capital to be commissioned $ 129 $ 254

21
SEGMENT OVERVIEW
• Businesses that provide critical infrastructure and essential services to media broadcasting and telecom sectors
• Adjusted EBITDA underpinned by both regulated and unregulated services, secured by long-term inflation-linked contracts
OBJECTIVES
• Increase profitability through site rental revenue growth
• Maintain high level of service by managing availability and reliability of our customers network
• Deploy capital in response to customer demands for increased densification of their networks
OPERATIONS
• Data Transmission & Distribution:
– ~137,000 operational telecom towers in India
– ~7,000 towers and active rooftop sites in France
– ~10,000 km of fiber located in France and Brazil
– ~1,600 cell sites and over 11,500 kilometers of fiber optic cable in New Zealand
– ~2,100 active telecom towers and over 70 distributed antenna systems, primarily in the U.K.
• Data Storage:
– 54 data centers, with ~1.6 million square feet of raised floors and 198 megawatts of critical load capacity
Data Operations
1. Adjusted EBITDA margin is adjusted EBITDA divided by revenues
• FFO of $196 million in 2020 compared to $136 million in 2019
– Results increased organically from new points-of-presence and the roll-out of our fiber-to-the-home strategy at our French telecom operations and the completion of three newly constructed data centers in South America
– Results also benefited from the contribution of several recently completed acquisitions and higher rates on our Euro hedge contracts
– Acquisitions include our Indian telecom tower operation, as well as data distribution businesses in New Zealand and in the U.K.
The following table presents selected key performance metrics for our data segment:
12 months ended December 31
US$ MILLIONS, UNAUDITED 2020 2019
Growth capital expenditures $ 131 $ 104
Adjusted EBITDA margin1 51 % 52 %
Funds from operations (FFO) 196 136
Maintenance capital (26) (17)
Adjusted funds from operations (AFFO) $ 170 $ 119

22
Data Operations (cont’d)
The following table presents our data segment’s proportionate share of financial results:
FINANCIAL RESULTS
• Adjusted EBITDA and FFO were $266 million and $196 million, respectively, versus $175 million and $136 million, respectively, in the prior year
– Data Transmission & Distribution: Adjusted EBITDA and FFO increased due to ~280 new tower sites added and ~150,000 new fiber plugs commissioned at our French telecom business, and the benefit of higher rates on Euro denominated FFO hedge contracts
– Results also benefited from the contributions from telecom businesses acquired in India, New Zealand and the U.K.
– Data Storage: Adjusted EBITDA and FFO decreased as the contribution from recently commissioned data centers in South America was more than offset by lower sales at our U.S. operation
12 months ended December 31
US$ MILLIONS, UNAUDITED 2020 2019
Revenue $ 519 $ 336
Cost attributable to revenues (253) (161)
Adjusted EBITDA 266 175
Interest expense (69) (42)
Other (expenses) income (1) 3
Funds from operations (FFO) 196 136
Depreciation and amortization (194) (129)
Deferred taxes and other items 30 (20)
Net income (loss) $ 32 $ (13)
12 months ended December 31 Adjusted EBITDA FFO
US$ MILLIONS, UNAUDITED 2020 2019 2020 2019
Data Transmission & Distribution $ 213 $ 121 $ 163 $ 101
Data Storage 53 54 33 35
Total $ 266 $ 175 $ 196 $ 136
The following table presents our proportionate adjusted EBITDA and FFO for this operating segment by business:

23
Data Operations (cont’d)
Capital BacklogAdditions and improvements to our networks and sites over the next two or three years that are expected to accommodate growing data consumption, leading to cash flow growth over the long term
12 months ended December 31US$ MILLIONS, UNAUDITED 2020 2019
Capital backlog, start of period $ 152 $ 200
Impact of acquisitions 144 27
Additional capital project mandates 180 59
Less: capital expenditures (131) (104)
Foreign exchange and other 22 (30)
Capital backlog, end of period $ 367 $ 152
Construction work in progress 48 41
Total capital to be commissioned $ 415 $ 193
The following table presents our proportionate share of growth capital backlog:
• Capital to be commissioned includes ~$360 million within our Data Transmission and Distribution segment and ~$55 million at our Data Storage operations:
– Data Transmission & Distribution: Includes ~$160 million related to our fiber-to-the-home roll-out and ~$140 million related to the build-out of additional contracted towers at our Indian telecom towers business
– Data Storage: Increasing the capacity of our data storage network with the build-out of new sites or expansion of existing data centers, which are all underpinned by attractive long-term contracts
– Total capital to be commissioned primarily relates to the construction of several new facilities at our South American operation, which are all underpinned by attractive long-term contracts to investment grade, global hyperscale customers

24
Corporate
The following table presents the components of corporate on a proportionate basis:
FINANCIAL RESULTS
• General and administrative costs were relatively consistent with prior year
– Anticipate corporate and administrative costs of $10 to $12 million per year, excluding base management fee
• We pay Brookfield an annual base management fee equal to 1.25% of our market value, plus recourse debt net of cash
– Base management fee increased from prior year due to a higher share price and capital market activity used to fund new growth initiatives
• Other income includes interest and dividend income, as well as realized gains or losses earned on corporate financial assets
– During the year we deployed over $600 million ($350 million net of margin) into attractively valued financial assets; we sold ~40% during the year and realized gains of ~$60 million
• Corporate financing costs include interest expense and standby fees on our committed credit facility, less interest earned on cash balances
12 months ended December 31
US$ MILLIONS, UNAUDITED 2020 2019
General and administrative costs $ (11) $ (9)
Base management fee (301) (270)
Adjusted EBITDA (312) (279)
Other income 127 91
Financing costs (95) (83)
Funds from operations (FFO) (280) (271)
Deferred taxes and other items 242 (66)
Net loss $ (38) $ (337)

25
Liquidity
Total liquidity was $3.5 billion at December 31, 2020, comprised of the following:
As ofUS$ MILLIONS, UNAUDITED Dec 31, 2020 Dec 31, 2019
Corporate cash and financial assets $ 464 $ 273
Committed corporate credit facility1 2,975 1,975
Subordinated corporate credit facility 500 500
Draws under corporate credit facility1 (1,131) (820)
Commitments under corporate credit facility (63) (54)
Deposit from parent2 (545) —
Proportionate cash retained in businesses 502 406
Proportionate availability under subsidiary credit facilities 767 687
Total liquidity $ 3,469 $ 2,967
1. Includes a $1,975 million committed corporate credit facility and a $1,000 million temporary bulge facility. As of December 31, 2020, draws of $1,131 million were outstanding under our committed corporate credit facility and our temporary bulge facility was undrawn
2. Brookfield Infrastructure, from time to time, will place deposits with, or receive deposits from Brookfield. The deposit bears interest at market rates and was provided to Brookfield Infrastructure to utilize excess cash held by the parent to repay Brookfield Infrastructure’s draws on the corporate credit facility
• We maintain sufficient liquidity at all times to participate in attractive opportunities as they arise, withstand sudden adverse changes in economic circumstances and maintain a relatively high payout of our FFO to unitholders
• Principal sources of liquidity are cash flows from operations, undrawn credit facilities, proceeds from capital recycling and access to public and private capital markets
• We may, from time to time, invest in financial assets comprised mainly of liquid equity and debt infrastructure securities in order to earn attractive short-term returns and for strategic purpose

26
Maturity Profile
We finance our assets principally at the operating company level with debt that generally has long-term maturities, few restrictive covenants and no recourse to either Brookfield Infrastructure or our other operations.
On a proportionate basis as of December 31, 2020, scheduled principal repayments over the next five years are as follows:
US$ MILLIONS, UNAUDITED
AverageTerm
(years) 2021 2022 2023 2024 2025 Beyond TotalRecourse borrowingsNet corporate borrowings1 7 $ — $ — $ — $ 550 $ — $ 1,492 $ 2,042 Total recourse borrowings1 7 — — — 550 — 1,492 2,042 UtilitiesCommercial & Residential Distribution 12 90 82 320 235 260 1,940 2,927 Regulated Transmission 9 68 45 327 278 25 367 1,110
11 158 127 647 513 285 2,307 4,037 TransportRail 4 142 179 201 267 176 397 1,362 Toll Roads 9 128 88 134 150 119 524 1,143 Diversified Terminals 5 4 180 238 844 579 881 2,726
5 274 447 573 1,261 874 1,802 5,231
Midstream 6 3 353 165 42 313 733 1,609
DataData Transmission & Distribution 7 — 206 43 301 60 530 1,140 Data Storage 4 53 24 49 2 148 — 276
6 53 230 92 303 208 530 1,416 Total non-recourse borrowings 7 488 1,157 1,477 2,119 1,680 5,372 12,293 Total borrowings1 7 $ 488 $ 1,157 $ 1,477 $ 2,669 $ 1,680 $ 6,864 $ 14,335
3 % 8 % 10 % 19 % 12 % 48 % 100 %
1. Total borrowings, recourse borrowings and the average term to maturity are presented on a pro-forma basis to exclude draws of $1,131 million on our corporate credit facilities and deferred financing fees of $15 million

27
Proportionate Net Debt
The following table presents proportionate net debt by operating segment:
As of
US$ MILLIONS, UNAUDITED Dec 31, 2020 Dec 31, 2019Non-recourse borrowings
Utilities $ 4,037 $ 3,727 Transport 5,231 4,079 Midstream 1,609 1,588 Data 1,416 931 Corporate 3,158 2,475
Total borrowings $ 15,451 $ 12,800 Cash retained in businesses
Utilities $ 119 $ 160 Transport 285 175 Midstream 25 26 Data 73 45 Corporate 464 273
Total cash retained $ 966 $ 679 Net debt
Utilities $ 3,918 $ 3,567 Transport 4,946 3,904 Midstream 1,584 1,562 Data 1,343 886 Corporate 2,694 2,202
Total net debt $ 14,485 $ 12,121
• Weighted average cash interest rate is 4.2% for the overall business, in which our utilities, transport, midstream, data and corporate segments were 3.8%, 4.8%, 5.6%, 4.7%, and 3.1%, respectively

28
Supplemental Measures
The following table presents supplemental measures to assist users in understanding and evaluating the partnership's capital structure
The following table provides the calculation of Return on Invested Capital:
As ofUS$ MILLIONS, UNAUDITED Dec. 31, 2020 Dec. 31, 2019Partnership units outstanding, end of period1 420.1 418.3 Price1 $ 49.40 $ 49.99 Partnership Market Capitalization 20,753 20,911
Class A Shares of BIPC outstanding 44.9 — Price 72.30 — BIPC Market Capitalization $ 3,246 —
Combined Market Capitalization 23,999 20,911 Preferred units 1,202 1,007 Proportionate net debt 14,485 12,121 Enterprise Value (EV) 39,686 34,039
Proportionate Net Debt to Capitalization (based on market value) 36 % 36 %Proportionate Net Debt to Capitalization (based on invested capital) 61 % 57 %Corporate Borrowings to Capitalization (based on invested capital) 13 % 12 %
12 months ended December 31US$ MILLIONS, UNAUDITED 2020 2019FFO $ 1,454 $ 1,384
Maintenance Capital (281) (288)
Return of Capital (122) (109)
Adjusted AFFO 1,051 987
Weighted average Invested Capital $ 9,067 $ 8,563
Return on Invested Capital (ROIC)2 12 % 12 %1. Partnership units outstanding and unit price as at December 31, 2019 are presented prior to the dilutive impact of the BIPC special distribution2. Return on invested capital is calculated as adjusted AFFO divided by weighted averaged invested capital

29
Supplemental Measures (cont’d)
For the year ended December 31US$ MILLIONS, UNAUDITED 2018 2019 2020 2018 - 2020
Capital deployed in new investments $ 1,040 $ 1,761 $ 976 $ 3,777
Growth capital expenditures (net of non-recourse debt financing) 441 372 397 1,210
Total growth initiatives 1,481 2,133 1,373 4,987
Cash raised in capital markets (608) (940) (502) (2,050)
Proceeds from asset sales (1,033) (780) (370) (2,183)
Funding from retained cash flows and credit facility draws $ (160) $ 413 $ 501 $ 754
We fund growth initiatives with proceeds from capital recycling, capital market issuances and retained operating cash flows
• We target retaining 15% of our operating cash flows (FFO) for the equity component of recurring growth capital expenditures • We look to fund new investment opportunities and large-scale growth capital expenditure projects with proceeds from capital
recycling and capital market issuances
Over the last 3 years, we have deployed approximately $5.0 billion in acquisitions and organic growth initiatives, of which over $4.2 billion has been funded through our capital recycling program and capital market issuances

30
Foreign Currency Hedging Strategy
• As at December 31, 2020, 46% of overall net equity is USD functional• We have implemented a strategy to hedge the majority of our expected FFO generated in AUD, GBP, EUR, CAD, CLP, COP, PEN,
NZD and INR for the next 24 months • For the 12 months ended December 31, 2020, 23%, 15%, 18%, 20% and 24% of our pre-corporate FFO was generated in USD,
AUD, GBP, BRL, and other, respectively• Due to our FFO hedging program ~80% of our pre-corporate FFO is effectively generated in USD and the balance in BRL
To the extent that it is economic to do so, we hedge a portion of our equity investments and/or cash flows exposed to foreign currencies. The following principles form the basis of our foreign currency hedging strategy:• We leverage any natural hedges that may exist within our operations
• We utilize local currency debt financing to the extent possible
• We may utilize derivative contracts to the extent that natural hedges are insufficient
The following table presents our hedged position in foreign currencies as at December 31, 2020:
Foreign Currency HedgesUS$ MILLIONS, UNAUDITED USD1 AUD NZD GBP BRL CAD2 EUR INR Other
Gross equity investment – US$ $ 3,565 1,711 159 1,890 1,575 1,301 893 722 259
Corporate Items – US$ (4,284) — — — — — — — —
Equity investment (719) 1,711 159 1,890 1,575 1,301 893 722 259
FX contracts – US$ $ 4,331 (1,008) (159) (844) — (1,292) (756) (143) (129)
Net unhedged – US$ 3,612 703 — 1,046 1,575 9 137 579 130
% of equity investment hedged N/A 59% 100% 45% —% 99% 85% 20% 50%
1. USD corporate items this includes medium-term notes, draws on our revolving credit facility, U.S. denominated preferred shares and the deposit from our parent2. CAD net equity investment excludes $1,202 million of preferred unit and preferred shares

31
Capital Reinvestment
The following table highlights the sources and uses of cash during the year:
12 months ended December 31US$ MILLIONS, UNAUDITED 2020 2019
Funds from operations (FFO) $ 1,454 $ 1,384
Maintenance capital (281) (288)
Funds available for distribution (AFFO) 1,173 1,096
Distributions paid (1,134) (1,027)
Funds available for reinvestment 39 69
Growth capital expenditures (935) (869)
Debt funding of growth capex 538 497
Non-recourse debt issuances (repayments) 54 111
Proceeds from asset sales 370 780
New investments (976) (1,761)
Draws (net of repayments) on corporate credit facility 311 310
Partnership unit issuances, net of repurchases 9 781
Proceeds from debt issuances 298 87
Preferred unit and preferred shares issued, net of repurchases 195 72
Deposit received from (repaid to) parent 545 —
Impact of foreign currency movements (45) (6)
Changes in working capital and other (116) (34)
Change in proportionate cash 287 37
Opening, proportionate cash 679 642
Closing, proportionate cash $ 966 $ 679
• Financing plan: We fund recurring growth capital expenditures with cash flow generated by operations, as well as debt financing that is sized to maintain credit profile
• To fund large-scale development projects and acquisitions, we will evaluate a number of capital sources including proceeds from the sale of non-core assets as well as equity and debt financings

32
Capital Reinvestment (cont’d)
The following tables present the components of growth and maintenance capital expenditures by operating segment:
12 months ended December 31US$ MILLIONS, UNAUDITED 2020 2019
Growth capital expenditures by segment
Utilities $ 521 $ 496
Transport 138 178
Midstream 145 91
Data 131 104
Total $ 935 $ 869
12 months ended December 31US$ MILLIONS, UNAUDITED 2020 2019
Maintenance capital expenditures by segment
Utilities $ 30 $ 33
Transport 133 154
Midstream 92 84
Data 26 17
Total $ 281 $ 288
• We estimate annual maintenance capital expenditures for the upcoming year will be $40-45 million, $155-165 million, $90-100 million and $35-40 million for our utilities, transport, midstream and data segments, respectively, for a total range of $320-350 million
33
Partnership Capital
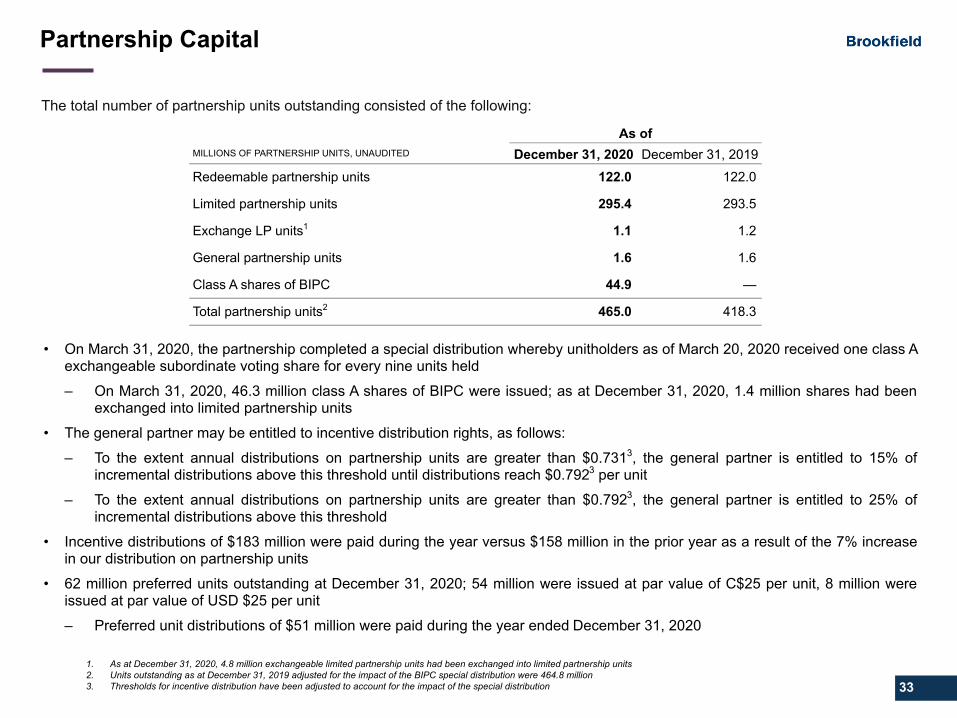
As ofMILLIONS OF PARTNERSHIP UNITS, UNAUDITED December 31, 2020 December 31, 2019
Redeemable partnership units 122.0 122.0
Limited partnership units 295.4 293.5
Exchange LP units1 1.1 1.2
General partnership units 1.6 1.6
Class A shares of BIPC 44.9 —
Total partnership units2 465.0 418.3
The total number of partnership units outstanding consisted of the following:
• On March 31, 2020, the partnership completed a special distribution whereby unitholders as of March 20, 2020 received one class A exchangeable subordinate voting share for every nine units held
– On March 31, 2020, 46.3 million class A shares of BIPC were issued; as at December 31, 2020, 1.4 million shares had been exchanged into limited partnership units
• The general partner may be entitled to incentive distribution rights, as follows:
– To the extent annual distributions on partnership units are greater than $0.7313, the general partner is entitled to 15% of incremental distributions above this threshold until distributions reach $0.7923 per unit
– To the extent annual distributions on partnership units are greater than $0.7923, the general partner is entitled to 25% of incremental distributions above this threshold
• Incentive distributions of $183 million were paid during the year versus $158 million in the prior year as a result of the 7% increase in our distribution on partnership units
• 62 million preferred units outstanding at December 31, 2020; 54 million were issued at par value of C$25 per unit, 8 million were issued at par value of USD $25 per unit
– Preferred unit distributions of $51 million were paid during the year ended December 31, 2020
1. As at December 31, 2020, 4.8 million exchangeable limited partnership units had been exchanged into limited partnership units2. Units outstanding as at December 31, 2019 adjusted for the impact of the BIPC special distribution were 464.8 million3. Thresholds for incentive distribution have been adjusted to account for the impact of the special distribution

34
Business Group Colours
Real EstateR71 G151 B181
InfrastructureR83 G55 B82
RenewableR92 G153 B121
Private EquityR230 G203 B140
R244 G124 B16
Logo & Divider Slide Font
REVIEW OF FOURTH QUARTER PERFORMANCE

35
InfrastructureR83 G55 B82
RenewableR92 G153 B121
Private EquityR230 G203 B140
Q4 2020 HIGHLIGHTS
KEY PERFORMANCE METRICS PERFORMANCE HIGHLIGHTS(See “Reconciliation of Non-IFRS Financial Measures" )
Three months endedDecember 31
US$ MILLIONS, EXCEPT PER UNIT INFORMATION, UNAUDITED 2020 2019
Funds from operations (FFO) $ 398 $ 358
Per unit FFO1 0.86 0.77
Distributions per unit1 0.485 0.452
Payout ratio2 72 % 73 %
Growth of per unit FFO 12 % 5 %
Adjusted funds from operations (AFFO) 323 274
Return on Invested Capital (ROIC)3 13 % 11 %
Net income4 331 23
Net income (loss) per limited partner unit5 0.58 (0.06)
Adjusted Earnings 213 156
Adjusted Earnings per unit1 0.46 0.34
1.Average units, adjusted for BIPC share split, for the three-month period ended December 31, 2020 was 465.0 million (2019: 464.8 million). Average units, prior to adjusting for BIPC, for the three-month periods ended December 31, 2020 was 418.5 million (2019: 418.3 million)
2.Payout ratio defined as distributions paid (inclusive of GP incentive and preferred unit distributions) divided by FFO3.Return on invested capital is calculated as AFFO, adjusted for an estimate of returns of capital of $31 million for the
three-month periods ended December 31, 2020 (2019: $28 million), divided by average invested capital4. Includes net income attributable to non-controlling interests - Redeemable Partnership Units held by Brookfield, non-
controlling interests - Exchange LP Units, general partner, limited partners and class A shares of BIPC5.Average limited partnership units outstanding on a time weighted average basis for the three-month periods ended
December 31, 2020 was 295.4 million (2019: 293.5 million). Net income (loss) per limited partnership unit has been adjusted to reflect the dilutive impact of the special distribution
• Increased FFO per unit by 12% compared to the prior year
– Results for the quarter benefited from organic growth of 7% and the contribution from capital deployed across all segments
– The single largest negative impact on results was a 24% decline in the Brazilian real which reduced U.S. dollar earnings by $26 million
– Payout ratio would have been 67% adjusting for the impact of a lower Brazilian real
• Quarterly distribution of $0.485 per unit represents an increase of 7% compared to prior year
• Net income increased compared to the prior year due to contribution from recently completed acquisitions and a gain on sale of ~$360 million realized on the IPO of our Australian export terminal

36
Selected Income Statement and Balance Sheet Information
The following tables present selected income statement and balance sheet information by operating segment on a proportionate basis:
STATEMENTS OF OPERATIONSThree months ended
December 31
US$ MILLIONS, UNAUDITED 2020 2019
Net income (loss) by segment
Utilities $ 62 $ 58
Transport 34 18
Midstream 48 140
Data 39 (4)
Corporate 148 (189)
Net income $ 331 $ 23
Adjusted EBITDA by segment
Utilities $ 218 $ 223
Transport 237 202
Midstream 110 86
Data 92 54
Corporate (93) (79)
Adjusted EBITDA $ 564 $ 486
FFO by segment
Utilities $ 168 $ 178
Transport 170 147
Midstream 86 64
Data 61 42
Corporate (87) (73)
FFO $ 398 $ 358

37
Utilities Operations
FINANCIAL RESULTS
• Adjusted EBITDA and FFO were $218 million and $168 million, respectively, versus $223 million and $178 million, respectively, in the prior year
– Commercial & Residential Distribution: Adjusted EBITDA and FFO benefited from inflation-indexation and additions to rate base
– These positive factors were more than offset by lower connections income at our U.K. regulated distribution business and the loss of earnings associated with the sales of our Colombian distribution utility and Australian district energy operations
– Regulated Transmission: Results decreased as the benefits of inflation-indexation and the contribution from a North American regulated gas transmission business were more than offset by the impact of a 24% reduction in the Brazilian real
The following table presents our utilities segment’s proportionate share of financial results:
The following table presents our proportionate adjusted EBITDA and FFO for this operating segment by business:
Three months ended December 31
US$ MILLIONS, UNAUDITED 2020 2019
Revenue $ 353 $ 337
Connections revenue 28 31
Cost attributable to revenues (163) (145)
Adjusted EBITDA 218 223
Interest expense (38) (39)
Other expenses (12) (6)
Funds from operations (FFO) 168 178
Depreciation and amortization (71) (66)
Deferred taxes and other items (35) (54)
Net income $ 62 $ 58
Three months ended December 31 Adjusted EBITDA FFO
US$ MILLIONS, UNAUDITED 2020 2019 2020 2019Commercial & Residential Distribution $ 126 126 $ 104 107
Regulated Transmission 92 $ 97 64 $ 71
Total $ 218 $ 223 $ 168 $ 178

38
Transport Operations
The following table presents our transport segment’s proportionate share of financial results:
Three months ended December 31
US$ MILLIONS, UNAUDITED 2020 2019
Revenue $ 475 $ 356
Cost attributable to revenues (238) (154)
Adjusted EBITDA 237 202
Interest expense (69) (54)
Other income (expense) 2 (1)
Funds from operations (FFO) 170 147
Depreciation and amortization (156) (95)
Deferred taxes and other items 20 (34)
Net income $ 34 $ 18
Three months ended December 31 Adjusted EBITDA FFO
US$ MILLIONS, UNAUDITED 2020 2019 2020 2019
Rail $ 83 $ 71 $ 69 $ 54
Toll Roads 57 78 38 55
Diversified Terminals 97 53 63 38
Total $ 237 $ 202 $ 170 $ 147
The following table presents our proportionate adjusted EBITDA and FFO for this operating segment by business:
FINANCIAL RESULTS
• Adjusted EBITDA and FFO were $237 million and $170 million, respectively, versus $202 million and $147 million, respectively, in the prior year
– Rail: Adjusted EBITDA and FFO increased as a result of higher mineral volumes on our Australian rail network and the contribution from the acquisition of our North American rail operation, partially offset by the impact of foreign exchange
– Toll roads: Adjusted EBITDA and FFO decreased as an 5% increase in same-store volumes was more than offset by the planned hand-back of a state concession, the partial sale of an interest in our Chilean toll road operation and the impact of a lower Brazilian real
– Diversified terminals: Adjusted EBITDA and FFO increased due to higher container moves across our global port operations, further property lease payments received at our U.K. port operations and the initial contribution of our recently acquired U.S. LNG export terminal

39
Midstream Operations
The following table presents our midstream segment’s proportionate share of financial results:
Three months ended December 31
US$ MILLIONS, UNAUDITED 2020 2019
Revenue $ 159 $ 127
Cost attributable to revenues (49) (41)
Adjusted EBITDA 110 86
Interest expense (24) (21)
Other expenses — (1)
Funds from operations (FFO) 86 64
Depreciation and amortization (39) (22)
Deferred taxes and other items 1 98
Net income $ 48 $ 140
FINANCIAL RESULTS
• Adjusted EBITDA and FFO were $110 million and $86 million, respectively, versus $86 million and $64 million, respectively, in the prior year
– Adjusted EBITDA and FFO increased due to the incremental earnings associated with the acquisition of the federally regulated portion of our western Canadian midstream business, higher spreads at our storage operations and new growth initiatives commissioned at our U.S. gas pipeline

40
Data Operations
The following table presents our data segment’s proportionate share of financial results:
Three months ended December 31
US$ MILLIONS, UNAUDITED 2020 2019
Revenue $ 184 $ 116
Cost attributable to revenues (92) (62)
Adjusted EBITDA 92 54
Interest expense (30) (11)
Other expenses (1) (1)
Funds from operations (FFO) 61 42
Depreciation and amortization (60) (39)
Deferred taxes and other items 38 (7)
Net income (loss) $ 39 $ (4)
The following table presents our proportionate adjusted EBITDA and FFO for this operating segment by business:
Three months ended December 31 Adjusted EBITDA FFO
US$ MILLIONS, UNAUDITED 2020 2019 2020 2019
Data Transmission & Distribution $ 78 $ 39 $ 52 $ 32
Data Storage 14 15 9 10
Total $ 92 $ 54 $ 61 $ 42
FINANCIAL RESULTS
• Adjusted EBITDA and FFO were $92 million and $61 million, respectively, versus $54 million and $42 million, respectively, in the prior year
– Data Transmission & Distribution: Adjusted EBITDA and FFO increased due to the roll-out of our fiber-to-the-home strategy at our French telecom business, the contributions from telecom businesses acquired in the U.K. and India, and higher rates on our Euro denominated FFO hedge contracts
– These positive factors were partially offset by lower roaming revenue at our New Zealand data distribution business
– Data Storage: Adjusted EBITDA and FFO decreased as the benefit of capital commissioned within our South American operations was more than offset by lower sales at our U.S. operations

41
Corporate
The following table presents the components of corporate on a proportionate basis:
Three months ended December 31
US$ MILLIONS, UNAUDITED 2020 2019
General and administrative costs $ (3) $ (3)
Base management fee (90) (76)
Adjusted EBITDA (93) (79)
Other income 33 27
Financing costs (27) (21)
Funds from operations (FFO) (87) (73)
Deferred taxes and other items 235 (116)
Net income (loss) $ 148 $ (189)
FINANCIAL RESULTS
• General and administrative costs were relatively consistent with prior year
– Anticipate corporate and administrative costs of $10 to $12 million per year, excluding the base management fee
• We pay Brookfield an annual base management fee equal to 1.25% of our market value, plus recourse debt net of cash
– Base management fee increased over the prior year due to a higher unit price and capital market activity used to fund new growth initiatives
• Other income includes interest and dividend income, as well as realized gains or losses earned on corporate financial assets
• Corporate financing costs include interest expense and standby fees on our committed credit facility, less interest earned on cash balances

42
Business Group Colours
Real EstateR71 G151 B181
InfrastructureR83 G55 B82
RenewableR92 G153 B121
Private EquityR230 G203 B140
R244 G124 B16
Logo & Divider Slide Font
APPENDIX – RECONCILIATION OF NON-IFRS FINANCIAL MEASURES

43
Reconciliation of Non-IFRS Measures to IFRS Measures
RECONCILIATION OF NET INCOME TO FUNDS FROM OPERATIONS
Three months ended December 31 12 months ended December 31US$ MILLIONS, UNAUDITED 2020 2019 2020 2019
Net income attributable to partnership1 $ 331 $ 23 $ 394 $ 233
Add back or deduct the following:
Depreciation and amortization 326 222 1,034 895
Deferred income taxes (41) 46 (3) 77
Mark-to-market on hedging items and other (218) 67 29 179
FFO 398 358 1,454 1,384
Maintenance capital expenditures (75) (84) (281) (288)
AFFO $ 323 $ 274 $ 1,173 $ 1,096
1. Includes net income attributable to limited partners, the general partner, and non-controlling interests ‒ Redeemable Partnership Units held by Brookfield, Exchange LP Units, and class A shares of BIPC

44
Reconciliation of Non-IFRS Measures to IFRS Measures (cont’d)
RECONCILIATION OF NET INCOME ADJUSTED EARNINGS
Three months ended December 31 12 months ended December 31
US$ MILLIONS, UNAUDITED 2020 2019 2020 2019
Net income attributable to partnership1 $ 331 $ 23 $ 394 $ 233
Add back or deduct the following:
Depreciation and amortization expense due to application of revaluation model and acquisition accounting 138 106 486 414
Mark-to-market on hedging items and other 106 54 167 (8)
Gain on sale of subsidiaries or ownership changes (362) (27) (426) (48)
Adjusted Earnings $ 213 $ 156 $ 621 $ 591
• Adjusted Earnings provides a supplemental understanding of the performance of our underlying operations and also gives users enhance comparability of our ongoing performance relative to peers; defined as net income attributable to our partnership, excluding the following:
– Incremental depreciation and amortization expense associated with the revaluation of our property, plant and equipment and the impact of purchase price accounting to reflect historical depreciation levels
– Non-cash fair value changes relating to hedging activities, as we believe these items are not reflective of the ongoing performance of our operations
– Disposition gains or losses recorded in net income as these items by definition are non-recurring in nature
1. Includes net income attributable to limited partners, the general partner, and non-controlling interests ‒ Redeemable Partnership Units held by Brookfield, Exchange LP Units, and class A shares of BIPC

45
Reconciliation of Non-IFRS Measures to IFRS Measures (cont’d)
RECONCILIATION OF NET INCOME ADJUSTED EARNINGS PER UNIT
Three months ended December 31 12 months ended December 31
US$ MILLIONS, UNAUDITED 2020 2019 2020 2019
Net income (loss) per limited partnership unit1 $ 0.58 $ (0.06) $ 0.35 $ 0.06
Add back or deduct the following:
Depreciation and amortization expense due to application of revaluation model and acquisition accounting 0.30 0.23 1.05 0.91
Mark-to-market on hedging items 0.36 0.23 0.86 0.44
Gain on sale of subsidiaries or ownership changes and other (0.78) (0.06) (0.92) (0.11)
Adjusted Earnings per unit2 $ 0.46 $ 0.34 $ 1.34 $ 1.30
1. Average limited partnership units outstanding on a time weighted average basis for the three and twelve-month periods ended December 31, 2020 of 295.4 million and 294.7 million, respectively (2019: 293.5 million and 285.6 million for the three and twelve-month periods). Net income (loss) per limited partnership unit has been adjusted to reflect the dilutive impact of the special distribution
2. Average units, adjusted for the special distribution, for the three and twelve-month periods ended December 31, 2020 of 465.0 million and 464.9 million, respectively (2019: 464.8 million and 452.9 million for the three and twelve-month periods)

46
Reconciliation of Non-IFRS Measures to IFRS Measures (cont’d)
Brookfield Infrastructure’s Share
FOR 12 MONTHS ENDEDDECEMBER 31, 2020US$ MILLIONS, UNAUDITED Utilities Transport Midstream Data Corporate Total
Contribution from investments in
associates
Attributable to non-controlling
interestAs per IFRS
financials
Revenues $ 1,434 $ 1,573 $ 572 $ 519 $ — $ 4,098 $ (1,379) $ 6,166 $ 8,885
Costs attributed to revenues (580) (767) (193) (253) — (1,793) 600 (3,650) (4,843)
General and administrative costs — — — — (312) (312) — — (312)
Adjusted EBITDA 854 806 379 266 (312) 1,993 (779) 2,516
Other (expense) income (43) (2) 3 (1) 127 84 17 (188) (87)
Interest expense (152) (214) (93) (69) (95) (623) 177 (733) (1,179)
FFO 659 590 289 196 (280) 1,454 (585) 1,595
Depreciation and amortization (268) (419) (153) (194) — (1,034) 471 (1,142) (1,705)
Deferred taxes (80) 30 (10) 74 (11) 3 (65) 8 (54) Mark-to-market on hedging items and other (91) (116) (31) (44) 253 (29) 48 49 68
Share of earnings from associates — — — — — — 131 — 131 Net income attributable to non-controlling interest — — — — — — — (510) (510)
Net income (loss) attributable to partnership1 $ 220 $ 85 $ 95 $ 32 $ (38) $ 394 $ — $ — $ 394
RECONCILIATION OF PROPORTIONATE OPERATING RESULTS TO CONSOLIDATED OPERATING RESULTS
1. Includes net income attributable to limited partners, the general partner, and non-controlling interests ‒ Redeemable Partnership Units held by Brookfield, Exchange LP Units, and class A shares of BIPC

47
Reconciliation of Non-IFRS Measures to IFRS Measures (cont’d)
RECONCILIATION OF PROPORTIONATE OPERATING RESULTS TO CONSOLIDATED OPERATING RESULTS
Brookfield Infrastructure’s Share
FOR 12 MONTHS ENDEDDECEMBER 31, 2019US$ MILLIONS, UNAUDITED Utilities Transport Midstream Data Corporate Total
Contribution from investments in
associates
Attributable to non-controlling
interestAs per IFRS
financials
Revenues $ 1,432 $ 1,614 $ 491 $ 336 $ — $ 3,873 $ (1,424) $ 4,148 $ 6,597
Costs attributed to revenues (582) (781) (171) (161) — (1,695) 649 (2,349) (3,395)
General and administrative costs — — — — (279) (279) — — (279)
Adjusted EBITDA 850 833 320 175 (279) 1,899 (775) 1,799
Other (expense) income (31) (3) 10 3 91 70 11 (109) (28)
Interest expense (147) (227) (86) (42) (83) (585) 173 (492) (904)
FFO 672 603 244 136 (271) 1,384 (591) 1,198
Depreciation and amortization (264) (370) (131) (129) (1) (895) 399 (718) (1,214)
Deferred taxes (41) 25 (55) 10 (16) (77) 52 (3) (28)
Mark-to-market on hedging items and other (64) (168) 132 (30) (49) (179) (84) (60) (323)
Gain on sale of associates — — — — — — — — —
Share of earnings from associates — — — — — — 224 — 224
Net income attributable to non-controlling interest — — — — — — — (417) (417)
Net income attributable to partnership1 $ 303 $ 90 $ 190 $ (13) $ (337) $ 233 $ — $ — $ 233
1. Includes net income attributable to limited partners, the general partner, and non-controlling interests ‒ Redeemable Partnership Units held by Brookfield, Exchange LP Units, and class A shares of BIPC

48
Reconciliation of Non-IFRS Measures to IFRS Measures (cont’d)
RECONCILIATION OF PROPORTIONATE OPERATING RESULTS TO CONSOLIDATED OPERATING RESULTS
Brookfield Infrastructure’s Share
FOR THREE MONTHS ENDEDDECEMBER 31, 2020US$ MILLIONS, UNAUDITED Utilities Transport Midstream Data Corporate Total
Contribution from investments in
associates
Attributable to non-controlling
interestAs per IFRS
financials
Revenues $ 381 $ 475 $ 159 $ 184 $ — $ 1,199 $ (438) $ 1,773 $ 2,534
Costs attributed to revenues (163) (238) (49) (92) — (542) 199 (1,013) (1,356)
General and administrative costs — — — — (93) (93) — — (93)
Adjusted EBITDA 218 237 110 92 (93) 564 (239) 760
Other (expense) income (12) 2 — (1) 33 22 6 (88) (60)
Interest expense (38) (69) (24) (30) (27) (188) 62 (246) (372)
FFO 168 170 86 61 (87) 398 (171) 426
Depreciation and amortization (71) (156) (39) (60) — (326) 170 (363) (519)
Deferred taxes (12) 27 (2) 47 (19) 41 (66) 25 —
Mark-to-market on hedging items and other (23) (7) 3 (9) 254 218 12 155 385 Share of earnings from associates — — — — — — 55 — 55 Net income attributable to non-controlling interest — — — — — — — (243) (243)
Net income attributable to partnership1 $ 62 $ 34 $ 48 $ 39 $ 148 $ 331 $ — $ — $ 331
1. Includes net income attributable to limited partners, the general partner, and non-controlling interests ‒ Redeemable Partnership Units held by Brookfield, Exchange LP Units, and class A shares of BIPC
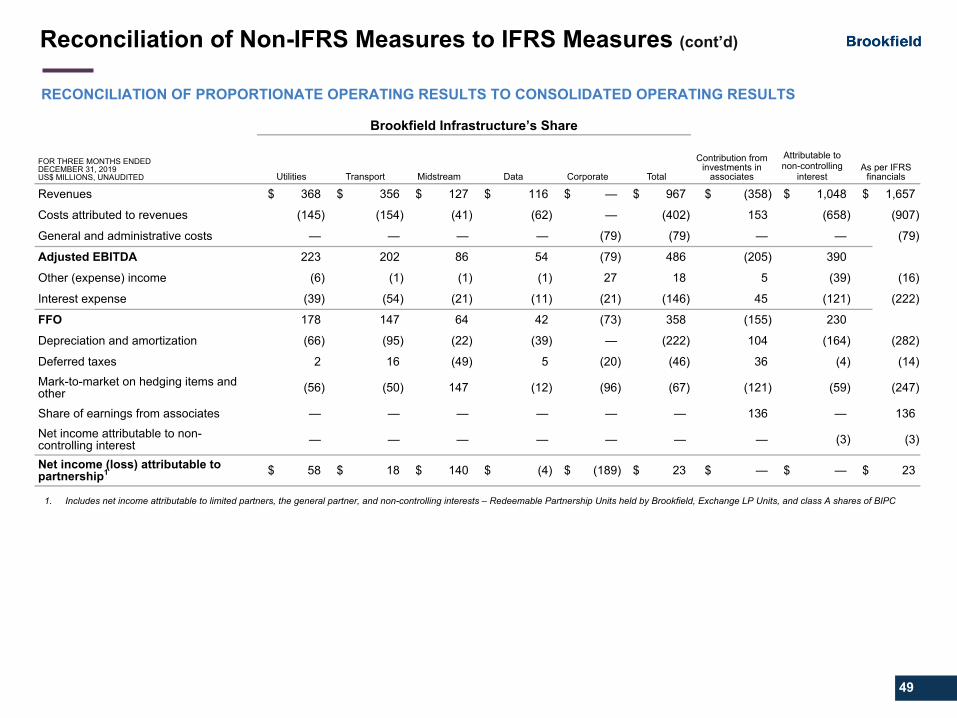
49
Reconciliation of Non-IFRS Measures to IFRS Measures (cont’d)
RECONCILIATION OF PROPORTIONATE OPERATING RESULTS TO CONSOLIDATED OPERATING RESULTS
Brookfield Infrastructure’s Share
FOR THREE MONTHS ENDEDDECEMBER 31, 2019US$ MILLIONS, UNAUDITED Utilities Transport Midstream Data Corporate Total
Contribution from investments in
associates
Attributable to non-controlling
interestAs per IFRS
financials
Revenues $ 368 $ 356 $ 127 $ 116 $ — $ 967 $ (358) $ 1,048 $ 1,657
Costs attributed to revenues (145) (154) (41) (62) — (402) 153 (658) (907)
General and administrative costs — — — — (79) (79) — — (79)
Adjusted EBITDA 223 202 86 54 (79) 486 (205) 390
Other (expense) income (6) (1) (1) (1) 27 18 5 (39) (16)
Interest expense (39) (54) (21) (11) (21) (146) 45 (121) (222)
FFO 178 147 64 42 (73) 358 (155) 230
Depreciation and amortization (66) (95) (22) (39) — (222) 104 (164) (282)
Deferred taxes 2 16 (49) 5 (20) (46) 36 (4) (14)
Mark-to-market on hedging items and other (56) (50) 147 (12) (96) (67) (121) (59) (247)
Share of earnings from associates — — — — — — 136 — 136
Net income attributable to non-controlling interest — — — — — — — (3) (3)
Net income (loss) attributable to partnership1 $ 58 $ 18 $ 140 $ (4) $ (189) $ 23 $ — $ — $ 23
1. Includes net income attributable to limited partners, the general partner, and non-controlling interests ‒ Redeemable Partnership Units held by Brookfield, Exchange LP Units, and class A shares of BIPC

50
Reconciliation of Non-IFRS Measures to IFRS Measures (cont’d)
RECONCILIATION OF PARTNERSHIP CAPITAL TO INVESTED CAPITAL
For the three months ended December 31 For the 12 months ended December 31
Partnership Capital Invested Capital Partnership Capital Invested Capital
US$ MILLIONS, UNAUDITED 2020 2019 2020 2019 2020 2019 2020 2019
Opening balance1 $ 5,744 $ 6,690 $ 9,211 $ 9,007 $ 7,129 $ 6,429 $ 9,009 $ 8,156
Items impacting Partnership Capital
Net income 331 $ 23 — — 394 233 — —
Other comprehensive income 804 677 — — 68 351 — —
Ownership changes and other (6) — — — 123 362 — —
Distributions to unitholders (286) (263) — — (1,134) (1,027) — —
Items impacting Invested Capital
Preferred units offerings, net — — — — — — 195 72
Items impacting both metrics
Equity issuances, net 2 2 2 2 9 781 9 781
Ending balance $ 6,589 $ 7,129 $ 9,213 $ 9,009 $ 6,589 $ 7,129 $ 9,213 $ 9,009
Weighted averaged Invested Capital $ — $ — $ 9,211 $ 9,007 $ — $ — $ 9,067 $ 8,563
1. Invested Capital includes cumulative opening balance differences of $3,467 million and $1,880 million for the three and 12 month periods ended December 31, 2020, respectively (2019: $2,317 million and $1,727 million for the three and twelve-month periods) due to preferred units, maintenance capital expenditures, other comprehensive income and non-cash statement of operating results items since inception of the partnership

51
Reconciliation of Non-IFRS Measures to IFRS Measures (cont’d)
RECONCILIATION OF PROPORTIONATE ASSETS TO CONSOLIDATED ASSETS – AS OF DECEMBER 31, 2020
Total Attributable to Brookfield Infrastructure
US$ MILLIONS, UNAUDITED Utilities Transport Midstream Data CorporateBrookfield
Infrastructure
Contribution from
investment in associates
Attributable to non-controlling
interest
Working capital
adjustmentAs per IFRS financials 1
Total assets $6,814 $9,155 $3,829 $3,338 $(2,062) $21,074 $(4,895) $37,851 $7,301 $61,331
RECONCILIATION OF PROPORTIONATE ASSETS TO CONSOLIDATED ASSETS – AS OF DECEMBER 31, 2019
Total Attributable to Brookfield Infrastructure
US$ MILLIONS, UNAUDITED Utilities Transport Midstream Data CorporateBrookfield
Infrastructure
Contribution from
investment in associates
Attributable to non-controlling
interest
Working capital
adjustmentAs per IFRS financials 1
Total assets $6,679 $7,962 $3,689 $2,204 $(1,284) $19,250 $(2,884) $32,621 $7,321 $56,308
1. The above tables provide each segment’s assets in the format that management organizes its segments to make operating decisions and assess performance. Each segment is presented on a proportionate basis, taking into account Brookfield Infrastructure’s ownership in operations using consolidation and the equity method whereby the Partnership either controls or exercises significant influence over the investment respectively. The above table reconciles Brookfield Infrastructure’s proportionate assets to total assets presented on the Partnership’s consolidated statements of financial position by removing net liabilities contained within investments in associates, reflecting the assets attributable to non-controlling interests, and adjusting for working capital assets which are netted against working capital liabilities

52
Reconciliation of Non-IFRS Measures to IFRS Measures (cont’d)
RECONCILIATION OF CONSOLIDATED DEBT TO PROPORTIONATE DEBT
As ofUS$ MILLIONS, UNAUDITED Dec 31, 2020 Dec 31, 2019
Consolidated debt $ 23,178 $ 21,019
Add: proportionate share of debt of investment in associates
Utilities 491 455
Transport 3,247 1,158
Midstream 968 972
Data 769 688
Add: proportionate share of debt directly associated with assets held for sale — 104
Less: debt attributable to non-controlling interest 1 (12,876) (11,094)
Premium on debt and cross currency swaps (326) (502)
Proportionate debt $ 15,451 $ 12,800
1. Includes draws made under Brookfield's private funds credit facility used to bridge acquisitions over year-end. Borrowings made under the facility are secured by limited partner commitments and are non-recourse to the Partnership

53
Business Group Colours
Real EstateR71 G151 B181
InfrastructureR83 G55 B82
RenewableR92 G153 B121
Private EquityR230 G203 B140
R244 G124 B16
Logo & Divider Slide Font
APPENDIX – OPERATING SEGMENT PRESENTATION

54
For the 12 months ended December 31, 2020
US$ MILLIONS, UNAUDITED
Previous Operating Segments Current Operating SegmentsPreviously Reported Adjustments
Currently Reported
Utilities UtilitiesRegulated Distribution Commercial & Residential Distribution $ 267 $ 134 $ 401 Regulated Transmission Regulated Transmission 218 40 258 Regulated Terminal n/a 73 (73) —
558 101 659 Transport Transport
Rail Rail 265 — 265 Toll Roads Toll Roads 142 — 142 Ports Diversified Terminals 110 73 183
517 73 590 Energy Midstream
Natural Gas Midstream Midstream 329 (40) 289 Distributed Energy n/a 134 (134) —
463 (174) 289 Data Data
Data Transmission & Distribution Data Transmission & Distribution 163 — 163 Data Storage Data Storage 33 — 33
196 — 196
Corporate Corporate (280) — (280) Total Total $ 1,454 $ — $ 1,454
Reconciliation of operating segment presentation
RECONCILIATION OF OPERATING SEGMENT PRESENTATION FOR THE 12 MONTHS ENDED DECEMBER 31, 2020

55
For the 12 months ended December 31, 2019
US$ MILLIONS, UNAUDITED
Previous Operating Segments Current Operating SegmentsPreviously Reported Adjustments
Currently Reported
Utilities UtilitiesRegulated Distribution Commercial & Residential Distribution $ 268 $ 134 $ 402 Regulated Transmission Regulated Transmission 236 34 270 Regulated Terminal n/a 73 (73) —
577 95 672 Transport Transport
Rail Rail 215 — 215 Toll Roads Toll Roads 223 — 223 Ports Diversified Terminals 92 73 165
530 73 603 Energy Midstream
Natural Gas Midstream Midstream 278 (34) 244 Distributed Energy n/a 134 (134) —
412 (168) 244 Data Data
Data Transmission & Distribution Data Transmission & Distribution 101 — 101 Data Storage Data Storage 35 — 35
136 — 136
Corporate Corporate (271) — (271) Total Total $ 1,384 $ — $ 1,384
Reconciliation of operating segment presentation (cont'd)
RECONCILIATION OF OPERATING SEGMENT PRESENTATION FOR THE 12 MONTHS ENDED DECEMBER 31, 2019

56
Use of Non-IFRS Measures
• Funds from operations (FFO), adjusted funds from operations (AFFO), adjusted EBITDA, adjusted earnings, invested capital and their per share equivalents, where applicable, are non-IFRS measures which do not have any standard meaning prescribed by IFRS and therefore may not be comparable to similar measures presented by other companies
– FFO, AFFO, adjusted earnings and invested capital are reconciled to Net Income and Partnership capital, respectively, the closest measures determined under IFRS on pages 43, 44 and 50, respectively
• FFO is defined as net income excluding the impact of depreciation and amortization, deferred income taxes, breakage and transaction costs, and non-cash valuation gains or losses
– Brookfield Infrastructure uses FFO to assess its operating results
• Adjusted EBITDA is defined as FFO excluding the impact of interest expense, and other income or expenses
– Brookfield Infrastructure uses Adjusted EBITDA as a measure of operating performance
• Adjusted Earnings is defined as net income attributable to our partnership, excluding the impact of depreciation and amortization expense from revaluing property, plant and equipment and the effects of purchase price accounting, mark-to-market on hedging items and disposition gains or losses
• AFFO is a measure of our long-term sustainable performance and is calculated as FFO less capital expenditures required to maintain the current performance of our operations (maintenance capital expenditures)
• Invested capital tracks the initial investment that we make in a business plus all cash flow that we re-invest in the business


![YSLO RTS ELEC BOARD FR - Somfy...BIP-BIP [] BIP-BIP [] BIP-BIP [] BIP-BIP [_____] BIP-BIP [] BIP-BIP [] BIP-BIP []… Appuyer sur la touche jusqu’au va-et-vient du vantail prioritaire](https://static.fdocuments.in/doc/165x107/60fbc1563febf120f853a528/yslo-rts-elec-board-fr-somfy-bip-bip-bip-bip-bip-bip-bip-bip-.jpg)