
Biotechnology - ::Gateway Engineering Education Coalition · rDNA in the market and a very large...
26
Biotechnology Raj Mutharasan Department of Chemical Engineering, Drexel University, Philadelphia, PA 1.0 A bit of history It is less than fifty years ago that Watson and Crick determined the structure of deoxy ribonucleic acid (DNA), and just over 25 years ago that recombinant DNA (rDNA) was invented. First products of rDNA technology, human insulin, entered the market in the early eighties. Now we have over 25 products of rDNA in the market and a very large number of therapeutic proteins are under development. The combined market value of the new biotechnology products exceed 50 billion dollars and the combined market capitalization of the new biotech companies value approximately one trillion dollars. Table1 gives a brief history and Table 2 gives biotechnology products in the market place. Table 1 Brief History of Modern Biotechnology 1953 Watson and Crick determined DNA structure 1970 First restriction endonuclease isolated 1973 Boyer and Cohen establish recombinant DNA methodology 1975 Kohler and Milstein describe production of monoclonal antibodies 1978 Genentech produced human insulin in E. Coli 1978 John Baxter reported cloning the gene for human growth hormone 1980 Kary Mullis (Cetus Corp.) Conducted in vitro, the polymers chain reaction (PCR). 1981 Genentech, Inc. cloned interferon gamma. Bill Rutter and Pablo Valenzuela identify hepatitis B surface antigen. Scientists at Ohio University produced the first transgenic animal. 1983 Syntex received FDA approval for a monoclonal antibody based diagnostic test for Chlamydia trachomatis. 1984 Chiron Corp. announced the first cloning and sequencing of the entire human immunodeficiency virus (HIV) genome 1985 Genetic fingerprinting enters the court room 1986 Orthoclone OKT3® (Muromonab CD3) approved for reversal of acute kidney transplant rejection. Automated DNA fluorescence sequencer invented. First recombinant vaccine (for hepatitis) to Chiron Corp approved. First genetically engineered crop, gene altered tobacco plant approved. 1987 Genentech received FDA approval to market rtPA (genetically engineered tissue plasminogen activator) to treat heart attacks. Recombivax HB® (recombinant hepatitis B vaccine) approved. 1989 Epogen® (Epoetin alfa) a genetically engineered protein introduced. 1990 Approval for human somatic cell gene therapy trial. GenPharm International, Inc. created the first transgenic dairy cow. The Human Genome Project launched. Estimated cost: $13 billion. 1993 Chiron's Betaseron is approved for multiple sclerosis. Researchers clone human embryos and successfully nurture them in a Petri dish for several days. 1994 The BRCA1 gene reported to cause of non-inherited breast cancers. Vpr, a gene governing reproduction of the HIV virus. 1994 The enzyme telomerase reported as responsible for the unchecked growth of cells seen in human cancers. 1995 Gene therapy, immune system modulation and genetically engineered antibodies enter clinical trials. 1996 Biogen's recombinant interferon drug. Avonex® approved for multiple sclerosis. 1997 Researchers at Roslin Institute report cloning a sheep named Dolly from the cell of an adult
Transcript of Biotechnology - ::Gateway Engineering Education Coalition · rDNA in the market and a very large...
Biotechnology
Raj Mutharasan Department of Chemical Engineering, Drexel University, Philadelphia, PA
1.0 A bit of history It is less than fifty years ago that Watson and Crick determined the structure of deoxy ribonucleic acid (DNA), and just over 25 years ago that recombinant DNA (rDNA) was invented. First products of rDNA technology, human insulin, entered the market in the early eighties. Now we have over 25 products of rDNA in the market and a very large number of therapeutic proteins are under development. The combined market value of the new biotechnology products exceed 50 billion dollars and the combined market capitalization of the new biotech companies value approximately one trillion dollars. Table1 gives a brief history and Table 2 gives biotechnology products in the market place.
Table 1 Brief History of Modern Biotechnology 1953 Watson and Crick determined DNA structure 1970 First restriction endonuclease isolated 1973 Boyer and Cohen establish recombinant DNA methodology 1975 Kohler and Milstein describe production of monoclonal antibodies 1978 Genentech produced human insulin in E. Coli 1978 John Baxter reported cloning the gene for human growth hormone 1980 Kary Mullis (Cetus Corp.) Conducted in vitro, the polymers chain reaction (PCR). 1981 Genentech, Inc. cloned interferon gamma. Bill Rutter and Pablo Valenzuela identify hepatitis
B surface antigen. Scientists at Ohio University produced the first transgenic animal. 1983 Syntex received FDA approval for a monoclonal antibody based diagnostic test for
Chlamydia trachomatis. 1984 Chiron Corp. announced the first cloning and sequencing of the entire human
immunodeficiency virus (HIV) genome 1985 Genetic fingerprinting enters the court room 1986 Orthoclone OKT3® (Muromonab CD3) approved for reversal of acute kidney transplant
rejection. Automated DNA fluorescence sequencer invented. First recombinant vaccine (for hepatitis) to Chiron Corp approved. First genetically engineered crop, gene altered tobacco plant approved.
1987 Genentech received FDA approval to market rtPA (genetically engineered tissue plasminogen activator) to treat heart attacks. Recombivax HB® (recombinant hepatitis B vaccine) approved.
1989 Epogen® (Epoetin alfa) a genetically engineered protein introduced. 1990 Approval for human somatic cell gene therapy trial. GenPharm International, Inc. created the
first transgenic dairy cow. The Human Genome Project launched. Estimated cost: $13 billion. 1993 Chiron's Betaseron is approved for multiple sclerosis. Researchers clone human embryos
and successfully nurture them in a Petri dish for several days. 1994 The BRCA1 gene reported to cause of non-inherited breast cancers. Vpr, a gene governing
reproduction of the HIV virus. 1994 The enzyme telomerase reported as responsible for the unchecked growth of cells seen in
human cancers. 1995 Gene therapy, immune system modulation and genetically engineered antibodies enter
clinical trials. 1996 Biogen's recombinant interferon drug. Avonex® approved for multiple sclerosis. 1997 Researchers at Roslin Institute report cloning a sheep named Dolly from the cell of an adult

ewe. Polly the first sheep cloned by nuclear transfer technology bearing a human gene appears later. A new DNA technique combines PCR, DNA chips, and computer programming providing a new tool in the search for disease causing genes.
1998 Favorable results with a new antibody therapy against breast cancer, HER2neu (Herceptin), herald a new era of treatment based on molecular targeting of tumor cells.
2000 A near complete draft of the human genome map is produced, showing the locations of more than 30,000 genes.
Table 2 Products of (Therapeutic) Biotechnology Acctimmune (gamma interferon). Genentech, Inc. Approved for use in the management of chronic granulomatous disease (December, 1990). Activase (recombinant alteplase). Genentech, Inc. Approved for use in the treatment of myocardial infarction (November, 1987) and acute pulmonary embolism (June, 1990). Adagen (adenosine deaminase) Enzon, Inc. Approved for use in the treatment of infants and children with severe immunodeficiency (March, 1990). Alferon N Interferon Sciences, Inc. Approved for use in treating genital warts (October, 1989). Betaseron (recombinant interferon beta 1-B). Berlex Laboratories/Chiron Corp. Approved for use in the management of relapsing, remitting multiple sclerosis (August, 1993). Ceredase (alglucerase) Genzyme Corp. Approved for use in treating Type 1 Gaucher's disease (April, 1991). Cerezyme (imiglucerase) Genzyme Corp. Approved for use in treating Type 1 Gaucher's disease (June, 1994). Engerix-B SmithKline Beecham. Approved for use as a hepatitis B vaccine (September, 1989). EPOGEN (epoetin alfa). Amgen Ltd. Approved for use in treating anemia associated with chronic renal failure and anemia in Retrovir-treated, HIV-infected patients (June, 1989). Humatrope (somatropin) Eli Lilly & Co. Approved for treating human growth hormone deficiency in children (March, 1987). Humulin (recombinant human insulin). Eli Lilly & Co. Approved for the treatment of diabetes (October, 1982). Intron A (alpha-interferon). Schering-Plough Corp. Approved for the treatment of hairy cell leukemia (June, 1986), genital warts (June, 1988), AIDS-related Kaposi's sarcoma (November, 1988), non-A, non-B hepatitis (February, 1991), and hepatitis B (July, 1992). KoGENate (antihemophiliac factor). Miles, Inc. Approved for use in the treatment of hemophilia A (February, 1993). Leukine (yeast-derived GM-CSF). Immunex Corp. Approved for use in autologous bone marrow transplantation (March, 1991). Neupogen. Amgen Ltd. Approved for use in treating cheomtherapy-induced neutropenia (February, 1991) and bone marrow transplant-associated neutropenia (June, 1994). Oncaspar (pegaspargase) Enzone/Rhone-Poulenc Rorer Approved for use in treating acute lymphoblastic leukemia (February, 1994). Orthoclone OKT 3. Ortho Biotech. Approved for use in reversal of acute kidney transplant rejection (June, 1986). Procrit (epoetin alfa). Ortho Biotech. Approved for use in the treatment of anemia associated with chronic renal failure (December, 1990) and anemia in Retrovir-treated, HIV-infected patients and chemotherapy-associated anemia (April, 1993). Proleukin, IL-2 Chiron Corp. Approved for the treatment of kidney (renal) carcinoma (May, 1992). Protropin (somatrem). Genentech, Inc. Approved for treating human growth hormone deficiency in children (May, 1985).

Pulmozyme (DNase). Genentech, Inc. Approved for use in the management of cystic fibrosis (December, 1993). Recombinate rAHF (recombinant antihemophiliac factor). Baxter Healthcare Recombinate rAHF is the recombinant version of blood clotting factor VIII, and it has been approved for the treatment of hemophilia A (December, 1992). Recombivax HB Merck & Co. Approved as a hepatitis B prevention vaccine (July, 1986). Roferon-A (recombinant alfa-interferon). Hoffman-La Roche. Approved for the treatment of hairy cell leukemia (June, 1986) and AIDS-related Kaposi's sarcoma (November, 1988). 2.0 Applications of Biotechnology Applications of biotechnology are quite broad, ranging from agriculture to medicine and is given in a synopsis form in Table 3. A few examples are included for illustration
Table 3 Applications of Biotechnology Adapted from http://www.biotech.unsw.edu.au
Agriculture Plant breeding to improve resistance to pests,
diseases, drought and salt conditions Mass propagation of plant clones Bioinsecticide development modification of plants to
improve nutritional and processing characteristics
Chemical Industry
Production of bulk chemicals and solvents such as ethanol, citric acid, acetone and butanol
Synthesis of fine specialty chemicals such as enzymes, amino acids, alkaloids and antibiotics
Medicine
Development of novel therapeutic molecules for medical treatments
Diagnostics Drug delivery systems Tissue engineering of replacement organs Gene therapy
Food Industry
Production of bakers' yeast, cheese, yogurt and fermented foods such as vinegar and soy sauce
Brewing and wine making Production of flavors and coloring agents
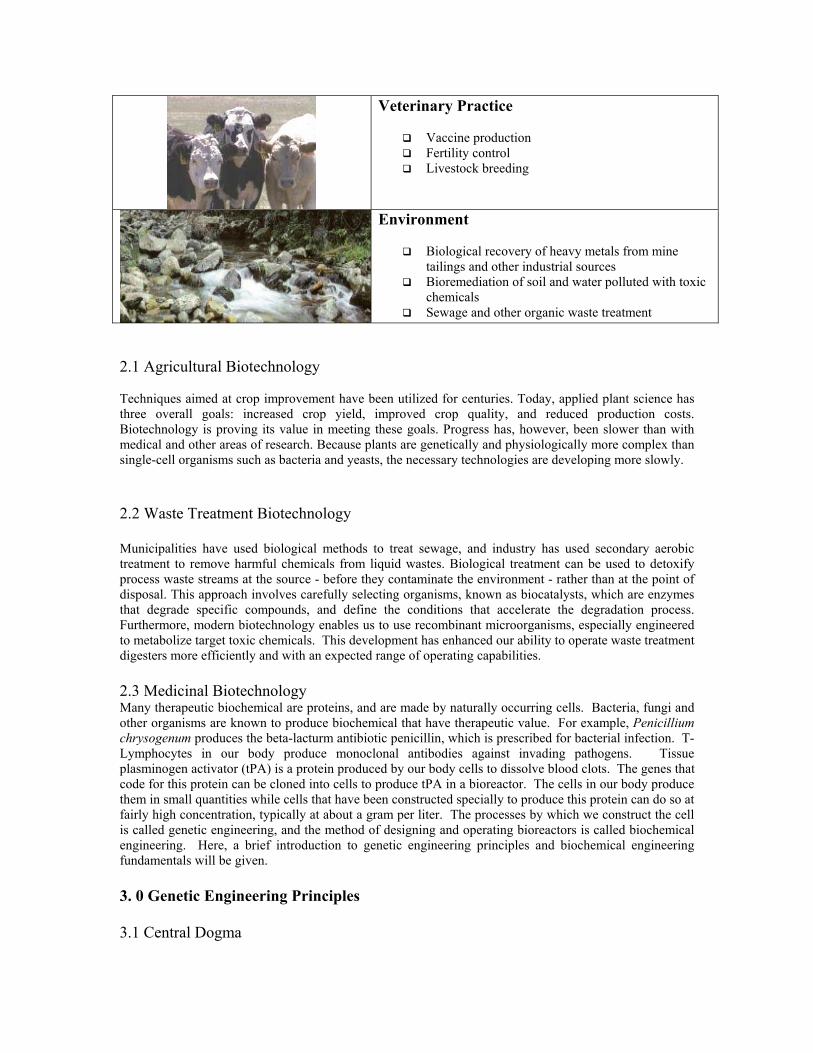
Veterinary Practice
Vaccine production Fertility control Livestock breeding
Environment
Biological recovery of heavy metals from mine tailings and other industrial sources
Bioremediation of soil and water polluted with toxic chemicals
Sewage and other organic waste treatment 2.1 Agricultural Biotechnology Techniques aimed at crop improvement have been utilized for centuries. Today, applied plant science has three overall goals: increased crop yield, improved crop quality, and reduced production costs. Biotechnology is proving its value in meeting these goals. Progress has, however, been slower than with medical and other areas of research. Because plants are genetically and physiologically more complex than single-cell organisms such as bacteria and yeasts, the necessary technologies are developing more slowly. 2.2 Waste Treatment Biotechnology Municipalities have used biological methods to treat sewage, and industry has used secondary aerobic treatment to remove harmful chemicals from liquid wastes. Biological treatment can be used to detoxify process waste streams at the source - before they contaminate the environment - rather than at the point of disposal. This approach involves carefully selecting organisms, known as biocatalysts, which are enzymes that degrade specific compounds, and define the conditions that accelerate the degradation process. Furthermore, modern biotechnology enables us to use recombinant microorganisms, especially engineered to metabolize target toxic chemicals. This development has enhanced our ability to operate waste treatment digesters more efficiently and with an expected range of operating capabilities. 2.3 Medicinal Biotechnology Many therapeutic biochemical are proteins, and are made by naturally occurring cells. Bacteria, fungi and other organisms are known to produce biochemical that have therapeutic value. For example, Penicillium chrysogenum produces the beta-lacturm antibiotic penicillin, which is prescribed for bacterial infection. T-Lymphocytes in our body produce monoclonal antibodies against invading pathogens. Tissue plasminogen activator (tPA) is a protein produced by our body cells to dissolve blood clots. The genes that code for this protein can be cloned into cells to produce tPA in a bioreactor. The cells in our body produce them in small quantities while cells that have been constructed specially to produce this protein can do so at fairly high concentration, typically at about a gram per liter. The processes by which we construct the cell is called genetic engineering, and the method of designing and operating bioreactors is called biochemical engineering. Here, a brief introduction to genetic engineering principles and biochemical engineering fundamentals will be given. 3. 0 Genetic Engineering Principles 3.1 Central Dogma
The central dogma of molecular biology is "DNA makes RNA makes protein." In molecular terms, a gene is that portion of DNA that encodes for a single protein. The theory that "one gene makes one protein" has been revised with the discovery that some proteins are composed of several different sub-units of protein, and the "one gene makes one polypeptide" rule still holds true. Messenger RNA is a precise copy (transcript) of the coded sequence of nucleic acid bases [see next section] in DNA, and this message is translated into a unique protein molecule at ribosomes present in the cytoplasm of all cells. Proteins, which are largely made up of carbon , hydrogen, oxygen, and nitrogen, are made from 20 different amino acids. The versatility of proteins, the workhorse molecules of the cell, stems from the immense variety of molecular shapes that can be created by linking amino acids together in different sequences. The smaller proteins consist of only a few dozen amino acids, whereas the larger ones may contain in excess of 200 amino acids, all linked together in a linear chain by peptide bonds. As the proteins are released from the ribosome, they fold into unique shapes, under the influence of intra-molecular forces that depend on the particular sequence of amino acids. So the protein primary sequence, encoded in the gene and faithfully transcribed and translated into an amino acid chain, determines the three-dimensional structure of the emerging molecule. The human body is thought to contain 30,000 different proteins with each playing a specific role. For example, hemoglobin carries oxygen in the blood while actin and myosin interact to generate muscle movements. 3.2 Nucleic acids
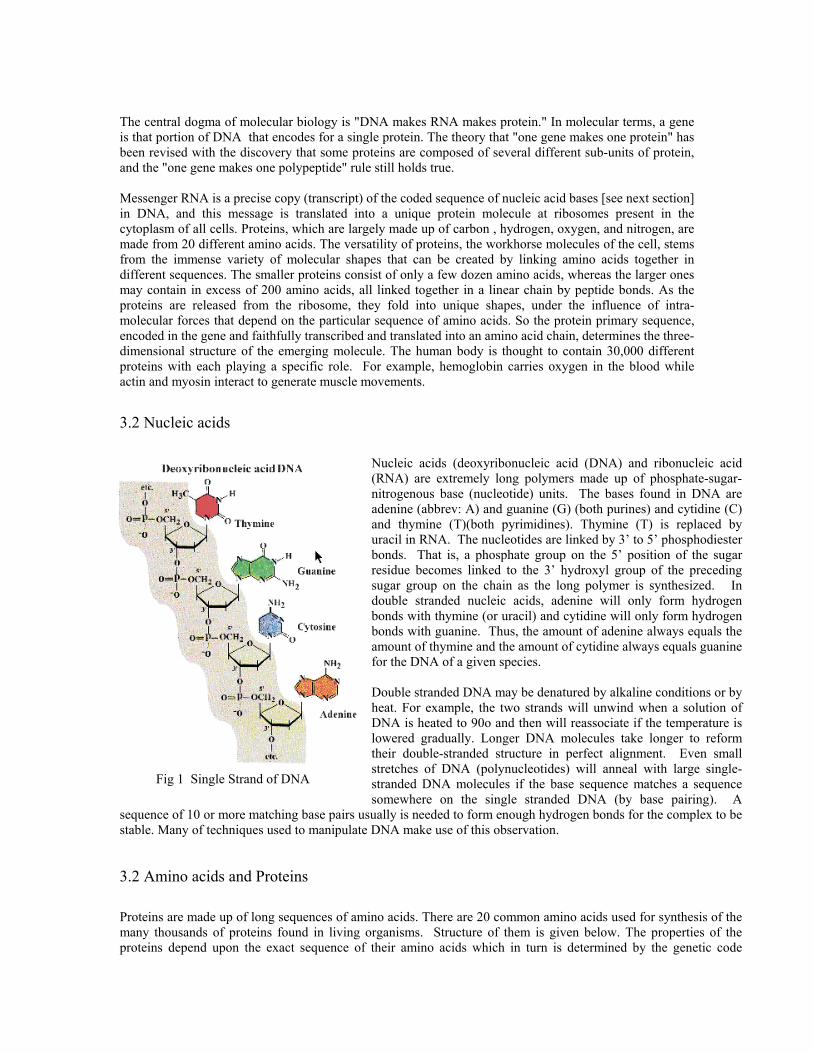
Nucleic acids (deoxyribonucleic acid (DNA) and ribonucleic acid (RNA) are extremely long polymers made up of phosphate-sugar-nitrogenous base (nucleotide) units. The bases found in DNA are adenine (abbrev: A) and guanine (G) (both purines) and cytidine (C) and thymine (T)(both pyrimidines). Thymine (T) is replaced by uracil in RNA. The nucleotides are linked by 3’ to 5’ phosphodiester bonds. That is, a phosphate group on the 5’ position of the sugar residue becomes linked to the 3’ hydroxyl group of the preceding sugar group on the chain as the long polymer is synthesized. In double stranded nucleic acids, adenine will only form hydrogen bonds with thymine (or uracil) and cytidine will only form hydrogen bonds with guanine. Thus, the amount of adenine always equals the amount of thymine and the amount of cytidine always equals guanine for the DNA of a given species. Double stranded DNA may be denatured by alkaline conditions or by heat. For example, the two strands will unwind when a solution of DNA is heated to 90o and then will reassociate if the temperature is lowered gradually. Longer DNA molecules take longer to reform their double-stranded structure in perfect alignment. Even small stretches of DNA (polynucleotides) will anneal with large single-stranded DNA molecules if the base sequence matches a sequence somewhere on the single stranded DNA (by base pairing). A
sequence of 10 or more matching base pairs usually is needed to form enough hydrogen bonds for the complex to be stable. Many of techniques used to manipulate DNA make use of this observation.
Fig 1 Single Strand of DNA
3.2 Amino acids and Proteins Proteins are made up of long sequences of amino acids. There are 20 common amino acids used for synthesis of the many thousands of proteins found in living organisms. Structure of them is given below. The properties of the proteins depend upon the exact sequence of their amino acids which in turn is determined by the genetic code

discussed below. A major goal of genetic engineering is to be able to make useful quantities of peptides and proteins, some of which are as small as a dozen amino acids on up to proteins containing hundreds of amino acids.
Table 4. The 20 Amino Acids. Adapted from the web (W.H. Freeman and Sinauer Associates)
During synthesis of proteins, amino acids are added one at a time according to the genetic code using complex structures called ribosomes. Each amino acid is added to the preceding one by a splitting out of water between the carboxyl group of one amino acid and the amino group of the next amino acid. The resulting bond between the two is known as the peptide bond:
- CH2 – CO – NH – CH2 – COO –
The first amino acid of a protein usually will have a free amino group (the amino end) and the last amino acid will usually have a carboxyl group (the carboxy end).
3.3 The Genetic Code for Protein Synthesis
DNA transfers information to mRNA in the form of a code defined by a sequence of nucleotides bases. During protein synthesis, ribosomes move along the mRNA molecule and "read" its sequence three nucleotides at a time (codon) from the 5' end to the 3' end. Each amino acid is specified by the mRNA's codon, and then pairs with a sequence of three complementary nucleotides carried by a particular tRNA (anticodon). Each amino acid is coded for by several different three-base codons. Figure 5 lists this code. For example, leucine is coded for by CUU, CUC, CUA, CUG, UUA, and UUG. Notice that in this example, only the last base is different. Three codons, TAA, TAG, and TGA are used as stop codons to tell ribosomes to stop reading the code and stop making protein. Methionine has only one codon (AUG) and it is used as the first amino acid to start a new protein (it sometimes is removed later, as all proteins do not have an N-terminal methionine). We will not go into the details of protein synthesis, but the general features are shown in the figure. Ribosomes assemble on the mRNA in the region containing a ribosome binding site and the initiation codon (AUG for methionine). Amino acids are brought to the proper site on the ribosome in the form of complexes with special small RNA molecules known as transfer RNAs. Each transfer RNA is specific for its own amino acid and has an “anti-codon” on one end of the loop shaped molecule and the amino acid at the other. In the case of methionine, the anti-codon would be UAC which will associate with AUG of the bound RNA. After a second transfer RNA with its amino acid enters the site, a peptide bond is synthesized between the two amino acids. The ribosome then shuttles
Figure 5 The Genetic Code. Adapted fromNational Health Museum web page. Legend:Ala: Alanine Cys: Cysteine Asp: Asparticacid Glu: Glutamic acid Phe: PhenylalanineGly: Glycine His: Histidine Ile: IsoleucineLys: Lysine Leu: Leucine Met: MethionineAsn: Asparagine Pro: Proline Gln: GlutamineArg: Arginine Ser: Serine Thr: ThreonineVal: Valine Trp: Tryptophane Tyr: TyrosisneA = adenine G = guanine C = cytosine T =thymine U = uracil
three bases along the mRNA so that the next transfer RNA and its amino acid may enter and undergo polymerization. The process continues until a stop codon is reached and the ribosome falls off the mRNA. Since RNA is constructed from four types of nucleotides, there are 64 possible triplet sequences or codons (4x4x4). Three of these possible codons specify the termination of the polypeptide chain. They are called "stop codons". That leaves 61 codons to specify only 20 different amino acids. Therefore, most of the amino acids are represented by more than one codon. The genetic code is said to be degenerate. 3.4 Enzymes - Protein Biocatalysts An essential group of proteins - the enzymes - act as biological catalysts and regulate all aspects of cell metabolism. Though grouped together for their capacity to speed up chemical reactions that would proceed only very slowly at room temperature, different classes of enzymes vary greatly in their structure and function. One important class of enzymes are used in genetic manuplations. For example, restriction endonucleases are used to cleave genomic DNA into large fragments at defined nucleotide sequences.
3.5 Essential Cloning Steps Insert the DNA into plasmids. Genes of interest are inserted into small DNA molecules known as plasmids, which are self-replicating, extrachromosomal genetic elements originally isolated from the bacterium, Escherichia coli. The circular plasmid DNA is opened using the same endonuclease that was used to cleave the genomic DNA. Join the ends of DNA with the enzyme, DNA ligase. The inserted DNA is joined to the plasmid DNA using another enzyme, DNA ligase, to give a recombinant DNA molecule. The new plasmid vector contains the original genetic information for replication of the plasmid in a host cell plus the inserted DNA. Introduce the new vector into host. The new vector is inserted back into a host where many copies of the genetic sequence are made as the cell grows and divide with the replicating vector inside. Isolate the newly-synthesized DNA, or the protein coded for by the inserted gene. The host may even transcribe and translate the gene and
Fig 6. Steps involved in inserting gene of interest into a host organism. From National Health Museum Web page.

obligingly produce product of the inserted gene. Alternatively, many copies of the DNA gene itself may be isolated for sequencing the nucleic acid or for other biochemical studies. A sketch of the scheme of steps used to construct an organism carrying the gene of interest is shown in tha figure below. Many variations on the basic methodology described above have been developed. Due to space and time limitations we will not discuss them here. Instead we will focus on how the host is then used to grow in large quantities to manufacture the protein of interest. 4.0 Biochemical Engineering Commercial production of recombinant protein produced by genetically engineered organisms requires two distinct body of knowledge, namely, molecular biology and process engineering. Background in molecular biology will enable us to create effectively expressed genes in bacteria or cells of animal origin for manufacturing. Background in process engineering principles will enable us to design and operate large-scale plants for growing genetically engineered organisms and for the subsequent processing of purification and formulation of product. In the early days, it was thought that scale-up was simply a matter of using larger volumes. That is, conditions that were found to be good at a small-scale would be equally effective on a larger scale and that to achieve this it was merely necessary to use a larger fermentor vessel with a larger medium volume. Such an approach resulted in product variability, both in terms of yield and quality, but also expensive operating costs. Hence, a systematic study of process engineering principles is needed for scaling up and operation of biotechnological processes for manufacture. 4.1 Bioreactor The heart of a bioprocess used for manufacture of biologicals, is a bioreactor. A commercial unit is illustrated in Fig 7. It is usually a large vessel ranging from 1000
Fig 7 Large Scale Fermentor Used for Cultivating Bacteria and Yeast.
liters to 100,000 liters, made of stainless steel equipped with temperature, pH and dissolved oxygen measurement and control systems. The bioreactor is equipped with an agitation system to keep the contents uniformly mixed and to provide oxygen transfer. The design of the bioreactor should ensure sterility and provide for containment of the genetically engineered microorganism. The bioreactor includes sensors that permit monitoring of as many critical process parameters (temperature, pH, dissolved oxygen) as possible so that they can be adjusted to within allowable values.

4.2 Productions and Purification Generally, large-scale microbial cultivation or cell culture, and product purification steps are carried out in a stepwise manner (Fig. 8).
P r od u ct ionFe r m e n t or
St e r ilizeFe r m e n t or &Me d iu m
Se e dFe r m e n t or
St ock Cu lt u r e >>Sh a k e Fla sk s
Ce llSe p a r a t ion
Pr od u ctPu r ifica t ion
Figure 8 Steps in Large Scale Biotechnological Processes A typical procedure begins with the formulation and sterilization of growth medium and sterilization of the fermentation equipment. The cells are grown first as a stock culture (5 to 10 mL), then in a shake flask (200 to 1,000 mL), and then in a seed fermentor (10 to 100 liters). Finally, the production fermentor (1,000 to 100,000 liters) is inoculated. After the fermentation step is completed, the cells are separated from the culture fluid by either centrifugation or filtration. If the product is intracellular, the cells are disrupted, the cell debris removed, and the product recovered from the debris-free broth. If the product is extracellular, it is purified from the cell-free culture medium. Although microorganisms can be grown in a number of different ways (batch, fed-batch, or continuous culture), it is most common to cultivate them in a batch fermentor. In batch fermentation, the sterile growth medium is inoculated with a suitable amount of microorganisms, and the fermentation, i.e cell growth, proceeds without any further addition of fresh growth medium. In some processes the cells themselves will be the product. In others the product is what the cells produce as they grow or as they are induced to produce. For example, in yeast manufacture the product is the biomass (cell) itself while in insulin manufacture, the product is formed as an intracellular product. In this case, the cells are disrupted to harvest the intracellular insulin and the cell debris is discarded.

4.3 Manufacturing Issues It is necessary to monitor and control culture parameters such as dissolved oxygen concentration, pH, temperature, and mixing regardless of the process that is used to grow cells. Changes in these parameters can significantly affect the process yield and the stability of product protein. Optimal growth of E. coli cells and many other microorganisms that are used as hosts (see section on Molecular Biology) for recombinant genes usually require large amounts of dissolved oxygen. Because oxygen is sparingly soluble in water (8.4 mg/L at 25°C), it must be supplied continuously -- generally in the form of sterilized air -- to a growing culture. The air produces bubbles and the stirrer is used to break up the bubbles and mix the content of the reactor. If air flow is inadequate or the air bubbles are too large, the rate of transfer of oxygen to the cells is low and is not sufficient to meet cellular oxygen demand. Thus the fermentors are equipped to monitor dissolved oxygen level of the medium, to transfer oxygen efficiently to the culture medium, and to mix the broth to provide a uniform culture environment. Temperature is another physiological parameter that is be monitored and controlled. Microorganisms have optimal temperature for growth. If grown at a temperature below the optimum, growth occurs slowly resulting in a reduced rate of cellular production. On the other hand, if the growth temperature is too high, not only will death occur, but in situations where the target protein may be under the control of temperature sensitive promoter, it may be expressed prematurely, lowering product yield. Most microorganisms grow optimally between pH 5 and 7. As the cells grow, metabolites are released into the medium, a process that can change medium pH. Therefore, the pH of the medium must be monitored and be adjusted by base or acid addition to maintain a constant pH. Adequate mixing of a microbial culture is essential for ensuring adequate supply of nutrients and prevention of the accumulation of any toxic metabolites within the bioreactor. Although good mixing is easy to achieve at small scales, it is one of the major problems in increasing the scale of bioreactors. Agitation of the broth also affects the rate of transfer of oxygen and heat transfer removal via cooling coils. Excessive agitation can cause mechanical damage to microbial or mammalian cells. Hence a balance must be reached between the need to provide good mixing and the need to avoid cell damage.. The process design should also include factors that make it easy to implement Good Manufacturing Practices. Although most recombinant microorganisms are not hazardous, it is important to design processes that ensure that they are not inadvertently released into the environment. Hence, fail-safe systems should be considered in equipment design and operation to prevent accidental spills of live recombinant organisms and to contain them if a spill does occur. Furthermore, all recombinant microorganisms must be treated by a verified procedure to render them nonviable before they are discharged from the production facility, and the spent culture medium must also be treated to ensure that it does not contain viable organisms and that its disposal does not create an environmental hazard. 4.4 Cellular Content Cells primarily contain water! Typically 70% of cell mass is water and the remaining is dry matter. Therefore it is conventional to express cell composition on a dry basis. The microorganism Eschericia coli is widely used in genetic engineering. Typical elements found in Eschericia coli are given below:

Table 5 Elemental Composition of E. coli
(After Stanier et al)
Element % Dry Weight C 50 O 20 N 14 H 8 P 3 S 1 K 1 Na 1 Ca 0.5 Mg 0.5 Cl 0.5 Fe 0.2
others 0.3 Nearly half of the dry matter in cells is carbon and the elements carbon, oxygen, nitrogen and hydrogen total up to about 92% of the total. This observation for E. coli is also found to be generally true for other cellular organisms. Analysis of many organisms indicates that the carbon content varies from 46 to 50%, hydrogen from 6 to 7%, nitrogen 8 to 14% and oxygen from 29 to 35%. These are small variations and the variations appear to depend on substrate and growth conditions. For many engineering calculations, it is reasonable to consider cell as a chemical species having the formula
This engineering approximation is a good starting point for many quantitative analysis while a more carefully formulated empirical formula based on proximate analysis may be necessary for complete material flow analysis. The cell molecular weight for the above cell formula is 12+1.8 + 0.5(16) +0.2 (14) = 24.6. Example 2-1 Suppose we want to produce 10 g of cells using glucose as a carbon source. What is the minimum amount of glucose that would be needed? Solution. Assume cell composition is CH1.8 O0.5 N0.2 Glucose has a molecular mass of 180 C6 H12 O6
Moles of cells to be grown = 10
24.6 Since glucose has 6 moles of carbon per mole of glucose,
Moles of glucos e needed = 16
• 10
24.6
Therefore, min glu cose needed = 16
• 10
24.6 • 180 ≈ 12.2 g
4.5 Growth Reaction

In the above example, we have assumed that all of the carbon found in substrate (glucose) is incorporated into cell mass. This does not happen as the cell needs to “oxidize” or respire some of the carbon to produce energy for biosynthesis and maintenance of cellular metabolic machinery. In addition cells may produce extracellular products that accumulate in the broth. Hence we can represent growth as:
The medium is the “food” for the cell. It serves as a source for all elements needed by the cell to grow (or biosynthesis) and for product formation. The compounds carbon dioxide and water on the product side of the reaction above result from oxidation of glucose in the medium. Since the cellular material contains C, N, P, S, K, Na, Ca, etc, the medium must be formulated to supply these elements in the appropriate form. The above growth reaction can be re-stated as
If we neglect the “others” and assign stoichiometric coefficient for each of the species in the above equation on the basis of one mole of glucose (C-source) consumed, we re-write the above as
[1] where ammonia represents the nitrogen source. We will refer to this reaction as growth reaction. Note that whatever nitrogen that is supplied in the medium, it is expressed as equivalent nitrogen in the form of ammonia. Cells require nitrogen in both organic and inorganic form. It is common to supply the inorganic nitrogen as salts of ammonium ( e.g. ammonium phosphate ) while the organic nitrogen is usually supplied as amino acids or proteinous extracts which are rich in nitrogen. In most production processes using recombinant cells, glucose is used as the carbon source The growth reaction derived above is useful in interpreting laboratory data reported in the literature. Because the early work in cell growth were reported by microbiologists, it is necessary for us to learn the terms used by microbiologists to describe growth stoichiometry. We will then relate the above reaction equation to commonly reported cell properties. 4.6 Cell Yield and Stoichiometric Coefficients
Fig 9 Anaerobic growth of Pseudomonas lindneri on glucose .
40 30 20 10 0
300
250
200
150
100
50
0
Glucose, mM
Slope = 7.2 µg/ml per mM
(Data from Bauschop et al 1960)
Consider the experimental cell (Pseudomonas lindneri) growth data shown in Fig 2-1a, originally reported by Bauchop and Elsden. The experiment consisted of inoculating five test tubes containing growth medium with the bacterium. Each of the test tubes contained different concentrations of carbon source - in this case glucose at levels from about 4 mM to 36 mM. The cultures were incubated anaerobically (i.e. in absence of oxygen) at growth temperature (30 C) for two days or until growth ceases. The resulting cells were filtered, dried and weighed. This mass of bacteria obtained is plotted against the starting glucose concentration. The important observation

illustrated by the data is the straight line relationship between carbon source concentration (reactant in chemical parlance) and the cell concentration ( product ). The slope of the line represents the amount of cells obtained per unit amount of glucose consumed.
If we convert the above to mass basis,
The above value is often called cell yield, growth yield, or yield. If one examines the growth reaction stated in the previous section, the slope (in mass units) we calculated above can be equated as follows.
In the above the numerator term contains the amount of cell created and the denominator contains the amount of substrate consumed. In other words, the measurements reported by Bauschop and Elsden enable us to calculate the stoichiometric coefficient, α. That is,
Mathematically, cell yield is defined as
where represents change in cell concentration and ∆X ∆S represents change in substrate concentration. The subscript X/S indicates the basis of yield - cell on the basis of substrate. This notation comes in handy when we need to calculate yield based on more than one substrate. Examining the above and comparing with growth reaction, one notes that the yield defined here corresponds to a mass-based stoichiometric coefficient. Taking the limit of the above equation as ∆S approaches zero,
The absolute sign is used to eliminate the negative value of the derivative. Note that dS is negative, because substrate is consumed. Yield is always reported as a positive value. The above definition of yield can be applied to product, P on the basis of substrate consumed. Thus,
Often times, product yield and cell yield are reported by biologists, and we will use the above mathematical relationships to determine medium formulations and other design calculations. 4.7 Growth Kinetics If a viable inoculum is introduced into a medium that contains a carbon source, suitable nitrogen source, other nutrients necessary for growth, and physiologic temperature and pH are maintained, it will grow. The rate of biomass synthesis is proportional to biomass present. That is
rx = µ X [2] where rx is the amount of cells synthesized in g L , X is cell concentration in g L . The
parameter µ is called specific growth rate. For constant growth rate, one can show that in batch growth, the cell concentration will be expressed by
-1 h-1 -1
[3]
where X0 is the initial (inoculum) cell concentration. The time, t, refers to the time since the inoculum emerged from lag phase. Eq(4-3) can be rearranged setting the conditions for doubling of biomass. That is
the doubling times, t is: d
[4]
The values of doubling time and specific growth rate have been reported by many researchers. Given below is a sample of typical values.
Table 6 Typical Growth Rates
Organism Growth Rate µ [h-1]
Doubling time, td [h]
E. coli 2.0 0.35 Yeast 0.3 2.3 Hybridoma 0.05 13.9 Insect Cells 0.06 11.6
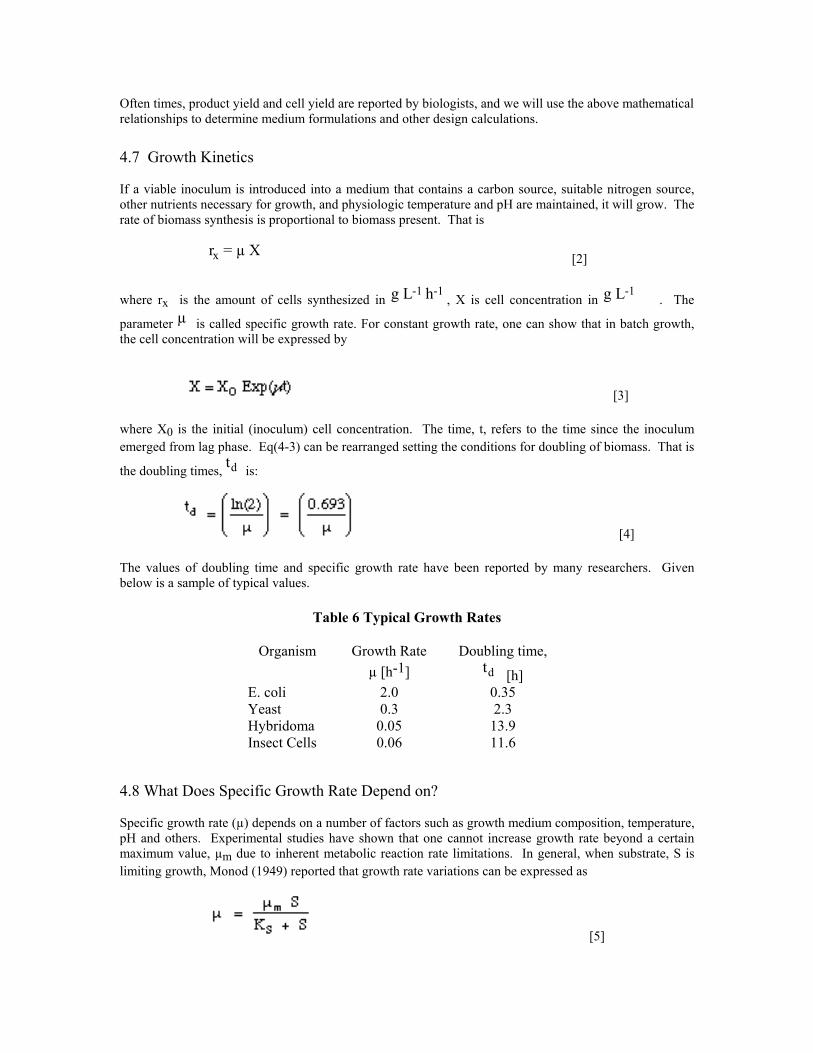
4.8 What Does Specific Growth Rate Depend on? Specific growth rate (µ) depends on a number of factors such as growth medium composition, temperature, pH and others. Experimental studies have shown that one cannot increase growth rate beyond a certain maximum value, µm due to inherent metabolic reaction rate limitations. In general, when substrate, S is limiting growth, Monod (1949) reported that growth rate variations can be expressed as
[5]
where KS is called Monod constant or simply the substrate saturation constant. The significance of KS is, when substrate concentration is numerically equal to KS, growth rate is exactly half of maximum growth rate. See Figure 10.
S, g/ L
0
0.1
0.2
0.3
0.4
0.5
0 5 10 15 20 25
Figure 10 Monod Kinetics. Dependence of Growth Rate on Limiting Substrate. Specific growth rate reaches a maximum value of 0.5 h-1. Value of KS here is 0.5 g L-1. Note that when S = 0.5 g L-1, µ is half of its maximum.
4.9 Rate Expression and Metabolic Quotient We have already discussed rate expressions for cell growth, Eq (2). Let us now examine rate expressions for other medium components in the growth reaction, Eq (1). Consider the growth reaction on the basis of one g of substrate consumed. It can be written as , 1 g S + YO2/S g of O2 + YNH3/S g of NH3 = YX/S g of Biomass + YCO2/S CO2 + others
The stoichiometric coefficients in growth reaction become yield coefficients on the basis of substrate. See theExample discussed earlier. The general rate expression is then:
[6]
where ri is expressed in g of i L-1 h-1. Since rx is the most fundamental of the various rates, it is conventional to write the stoichiometric coefficient in terms of it. That is
[7]
Following the examples above, the rate expression for species i can be written as
[8]
Metabolic quotients are rate expressions on the basis of unit mass of biomass. That is
[9]
The metabolic quotient for oxygen is of special interest. This single property determines the upper limit of cell concentration that can be achieved in many bacterial fermentation systems. We will see further analysis in the next chapter. Typical values of metabolic coefficients are given below.
Table 7 – Typical Metabolic Quotients
Organism
qglucose g g-1 h-1
qO2 g g-1 h-1
E. coli 2.5 0.3 Yeast 0.5 0.2 Hybridoma 0.2 0.02
An Example If specific growth rate of a bacteria is 0.35 h-1 and cell yield based on glucose is 0.6, calculate glucose consumption rate.
qG = µ
YX / G =
0.35YX / G
= 0.48 g G (g Cell)−1 h−1
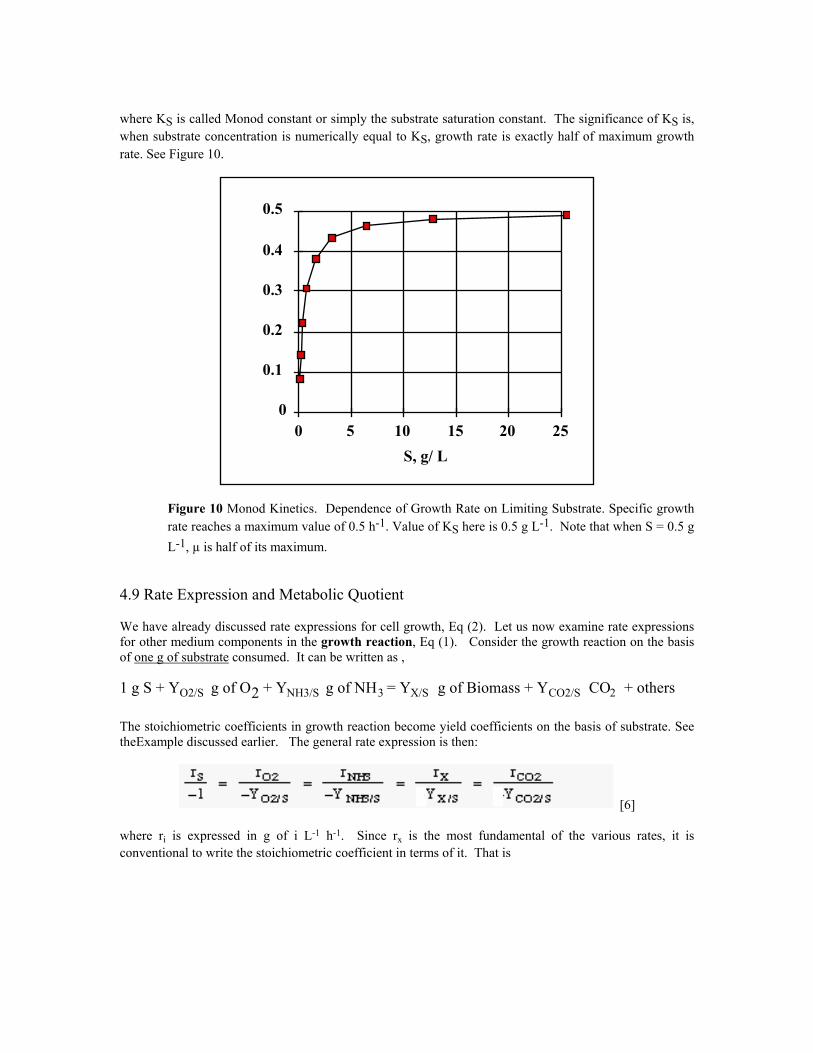
4.10 Factors Affecting Growth Rate Nutrients in the medium, pH, temperature, dissolved oxygen concentration and other cultivation environmental conditions all affect growth rate. Temperature and pH dependence are illustrated in Fig 4-3 a and b. In Figure 11 a the maximum growth rate is observed at 39 C for E. coli. Product formation kinetics (for example insulin), product yield (YP/S), cell yield (YX/S) are also affected by temperature. In general, cell yield decreases with temperature while similar defining relationships for product has not been reported. It is important to note that the optimum temperature for growth may be different from that for product formation.
0.1
1
Gro
wth
Rat
e
3.1 3.15 3.2 3.25 3.3 3.35 3.4 3.45 3.5 3.55
1,000/T(K)
47 Ο
45
42
3937
30
21
17
13.5
oo o
o o
o
o
o
48 o0.5
2
3
h-1
Figure 11 Effect of Temperature on Growth Rate of E. coli. Maximum growth rate is at 39 C. Plot is given as a function of inverse absolute temperature. The declining line from 39 C to 21 and then to 13 C suggest that the growth rate constant behaves somewhat similar to chemical reaction rate constant.
0
0.1
0.2
0.3
0.4
0.5
0.6
0.7
0.8
0.9
1
1.1
Dim
entio
nles
s Spe
cific
Gro
wth
Rat
e
2 4 6 8
pH
WithAdaptation
WithoutAdaptation
µ/µm
10
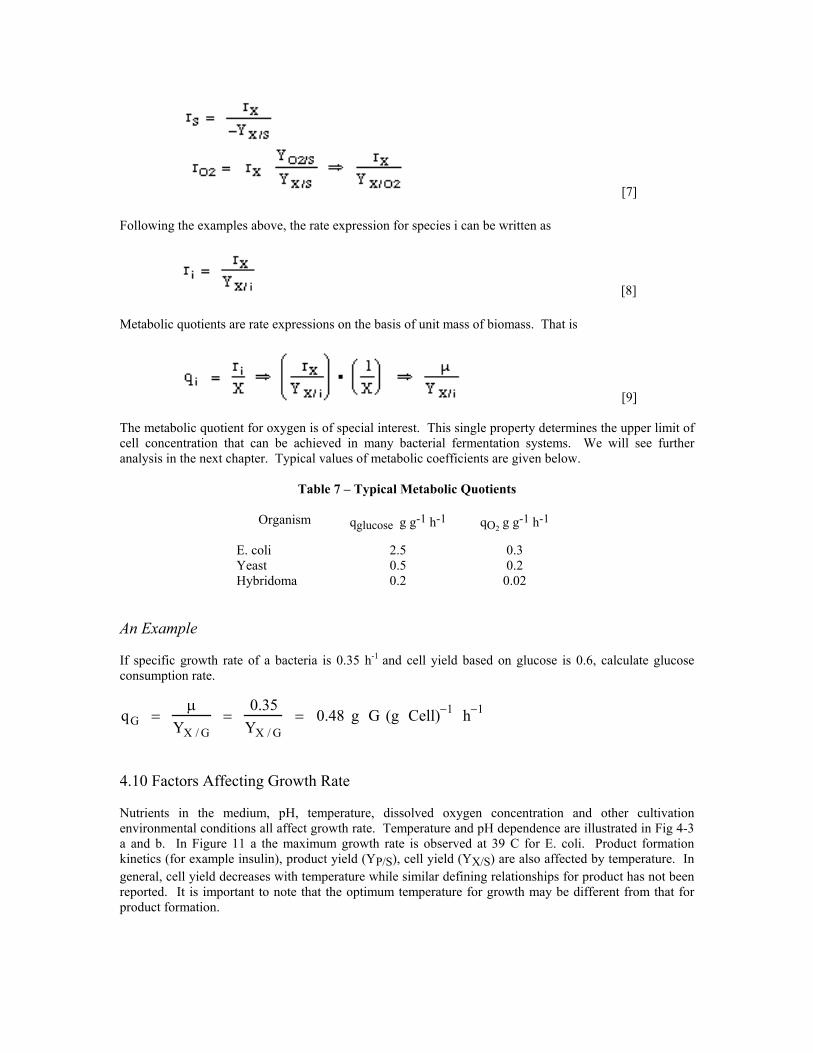
Figure 12 Effect of pH on Growth rate. Typical pH ranges over which reasonable growth can be expected is about 1 to 2 units. With adaptation, broader ranges can be achieved.
Optimum pH values for growth range from 4 to 7 for bacteria, from 4 to 7 for yeast and 6.2 to 7.2 for animal cells. Optimum pH for product formation may be different from that for growth. Many bacteria produce a different mix of products when pH is altered. For example, Clostridium butylicum produces acetic and butyric acids at near neutral pH while butanol, acetone and ethanol are produced under acidic pH (biological equivalent of Le Chatelier's Principle!). However, in the case of a recombinant cell expressing a recombinant protein, pH usually affects kinetics of recombinant protein generation rather than the product mix. Hybridomas are known to produce antibodies at a higher rate at pH 6.2 than at 7.2. Because of the difference in conditions for growth and product formation, optimization is often necessary.
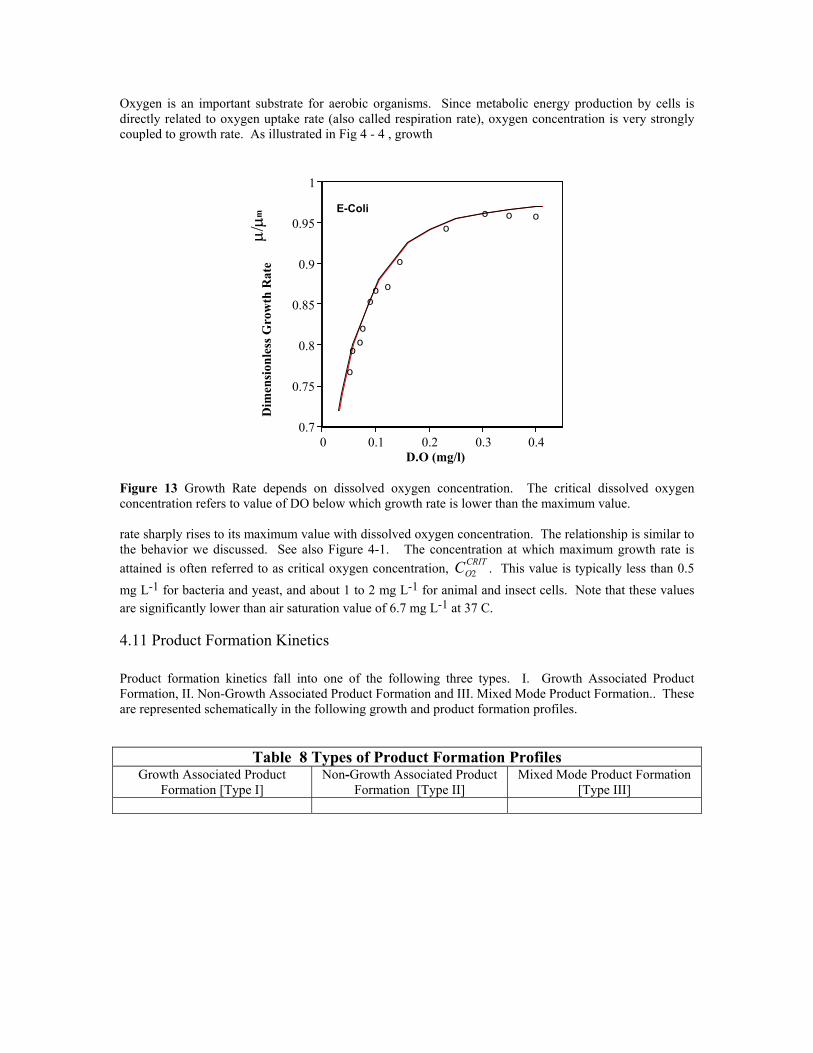
Oxygen is an important substrate for aerobic organisms. Since metabolic energy production by cells is directly related to oxygen uptake rate (also called respiration rate), oxygen concentration is very strongly coupled to growth rate. As illustrated in Fig 4 - 4 , growth
0.7
0.75
0.8
0.85
0.9
0.95
1
Dim
ensi
onle
ss G
row
th R
ate
0 0.1 0.2 0.3 0.4D.O (mg/l)
o
o
oo
o
oo
o
oo o oE-Coli
µ/µm
Figure 13 Growth Rate depends on dissolved oxygen concentration. The critical dissolved oxygen concentration refers to value of DO below which growth rate is lower than the maximum value.
rate sharply rises to its maximum value with dissolved oxygen concentration. The relationship is similar to the behavior we discussed. See also Figure 4-1. The concentration at which maximum growth rate is attained is often referred to as critical oxygen concentration, C . This value is typically less than 0.5 mg L-1 for bacteria and yeast, and about 1 to 2 mg L-1 for animal and insect cells. Note that these values are significantly lower than air saturation value of 6.7 mg L-1 at 37 C.
O2CRIT
4.11 Product Formation Kinetics Product formation kinetics fall into one of the following three types. I. Growth Associated Product Formation, II. Non-Growth Associated Product Formation and III. Mixed Mode Product Formation.. These are represented schematically in the following growth and product formation profiles.
Table 8 Types of Product Formation Profiles Growth Associated Product
Formation [Type I] Non-Growth Associated Product
Formation [Type II] Mixed Mode Product Formation
[Type III]

Time
PRODUCT, P
CELL, X
Cel
l or P
rodu
ct C
once
ntra
tion
Time
CELL, X
PRODUCT, P
Cel
l or P
rodu
ct C
once
ntra
tion
Time
CELL, X
PRODUCT, P
Cel
l or P
rodu
ct C
once
ntra
tion
Typical time-profiles of these three cases are illustrated above. In Type I shown in Fig 4-5a, product is formed simultaneously with growth of cells. That is product concentration increases with cell concentration. The metabolic quotient for P can be expressed as a function of µ,
[10]
It is clear from the above, the proportionality constant, α is the yield coefficient, YP/X. In Type II, product formation is unrelated to growth rate, but is a function of cell concentration. This is expressed as
[11]
Antibody formation by hybridoma, and some antibiotic fermentation exhibit this type of behavior. In the third category, product formation is a combination of growth rate and cell concentration. That is,
[12]
Many biochemical processes fall into this category. Note that if β is zero and α is YP/X, this case reduces to Type I. If α = 0, it reduces to non-growth associated case. Therefore let us consider this more general case for further analysis. In a batch reactor, product accumulation can be obtained by carrying out mass balance on the product.
Rate of Product Formation = Accumulation of Product
[13]
For constant reactor volume, V,
[14]

If we consider exponential phase only, X = X0 Exp(µmt). That is, substituting in the above gives
[15]
Integrating from t = 0, P = P0 we get
[16]
The above expression can be used to calculate the amount of product concentration at the end of a growth cycle.
4.12 Oxygen Transfer in Bioreactors Oxygen is needed by cells for respiration. Oxygen used by cells in suspension must be available as dissolved oxygen. Since oxygen solubility is quite small, about 6 to 7 mg/L under normal cultivation conditions, metabolic oxygen requirement is supplied on a as needed basis by continuous aeration of culture medium. Actively respiring yeast requires about 0.15 g O2 (g cell)-1 h. At a cell concentration of 10 gL-1, medium saturated with air can support less than 30 seconds worth of metabolic oxygen. That is, a continuous supply of oxygen must be maintained in any viable aerobic manufacturing process. In this Chapter, we will first get a quantitative appreciation for metabolic oxygen demand, followed by methods used in calculating rates at which oxygen is transfered from sparged air. We will then examine methods useful in characterizing oxygen mass transfer coefficient. Finally we will evaluate bioreactor operation and design based on oxygen transfer capability. 4.13 Metabolic Oxygen Demand Metabolic oxygen demand of an organism depends on the biochemical nature of the cell and cultivation conditions. Oxygen need is usually satisfied in most cells if the dissolved oxygen concentraiton in the medium is kept at about 1 mg/L. If the oxygen level is allowed to fall far below this value, oxygen consumption rate decreases with concomitant decrease in biochemical energy production, and as a result cell growth rate also decreases. The value of oxygen concentration above which growth rate is at the
maximum was described as the critical oxygen concentration, . Characteristic values are summarized in Table 9.
Table 9 Critical Oxygen Concentration
Organism CO2CRIT in mg L-1
E. coli at 37 C 0.26
S. cerevisiae at 30 C 0.13
Penicillium sp at 24 C 0.78 The oxygen requirement for growth is expressed best in the the parameter, yield coefficient, YX/O2. It represents the amount of oxygen required to grow one gram of cells. Typical values summarized in Table

10, show that approximately 0.7 to 1 g of oxygen is needed to produce 1 g of cells. In the same table respiration quotient is also included.
Table 10 Stoichiometric Oxygen Demand &Respiration Rate
Organism Substrate YX/O2 g (g cell)-1 h
qO2 g O2 (g cell)-1 h
E. coli Glucose 1.1 0.20 S.cerevisae Glucose 0.98 0.30 Pennicillium sp. Glucose 1.35 0.18 Hybridoma CHO cells
Volumetric rate of oxygen transfer, RO2. can be expressed as:
[17]
The term, kL A represents the product of mass transfer coefficient and interfacial area available for mass treansfer. In a bioreactor, air is sparged and the liquid is agitated to break up the bubbles so that interfacial area can be kept high to enhance rate of oxygen transfer. In such systems, the area, A, is not easily measured or estimated. But, the term consisting of the product - mass transfer coefficient and interfacial area - is more readily measured. Further more, it is convenient to use interfacial area per unit volume, a, rather than total area, A because rate of oxygen transfer is expressed per unit volume of bioreactor, similar to rate of cell growth, which is reported on a volumetric basis. Hence, area per unit volume, a, is combined with the mass transfer coefficient, kL and is given by the term, kLa. Oxygen solubility at
bioreactor conditions is given by C . DOL*
Eq[17] will be our working equation for describing transfer of oxygen from gas phase to growth medium. In order for us to calculate oxygen transfer rate (OTR), we need the mass transfer coefficient, kLa , solubility of oxygen in the medium, C and the dissolved oxygen concentration in the culture medium, CDOL.
DOL*
4.14 Bioreactor Oxygen Balance Let us now consider the case of oxygen balance within a bioreactor in which cells are growing and in the process consuming oxygen. There is a continuous inflow of air at a constant volumetric flow rate. The liquid broth is agitated by a Rushton agitator (flat blade stirrer ). Le the metabolic oxygen uptake rate be qO2 and cell concentration is X. Let us examine the reactor system over a sufficiently short period that we can treat X as a constant. Consider oxygen balance over the liquid phase of the bioreactor.
O2 transfered from Gas Phase - O2 consumed by Cells = Accumulation
[18]
For constant liquid phase volume, the above can be simplified to
[19]
The concentration, CDO is readily measured using an dissolved oxygen electrode. A later segment of the course on Biosensors, will deal with principle of measurement and construction of DO electrodes. If oxygen being supplied is in exact balance with the oxygen consumed by the cells, we expect the dissolved oxygen concentration to remain constant; that is, the derivative in Eq(19) will vanish. That is,
[20]
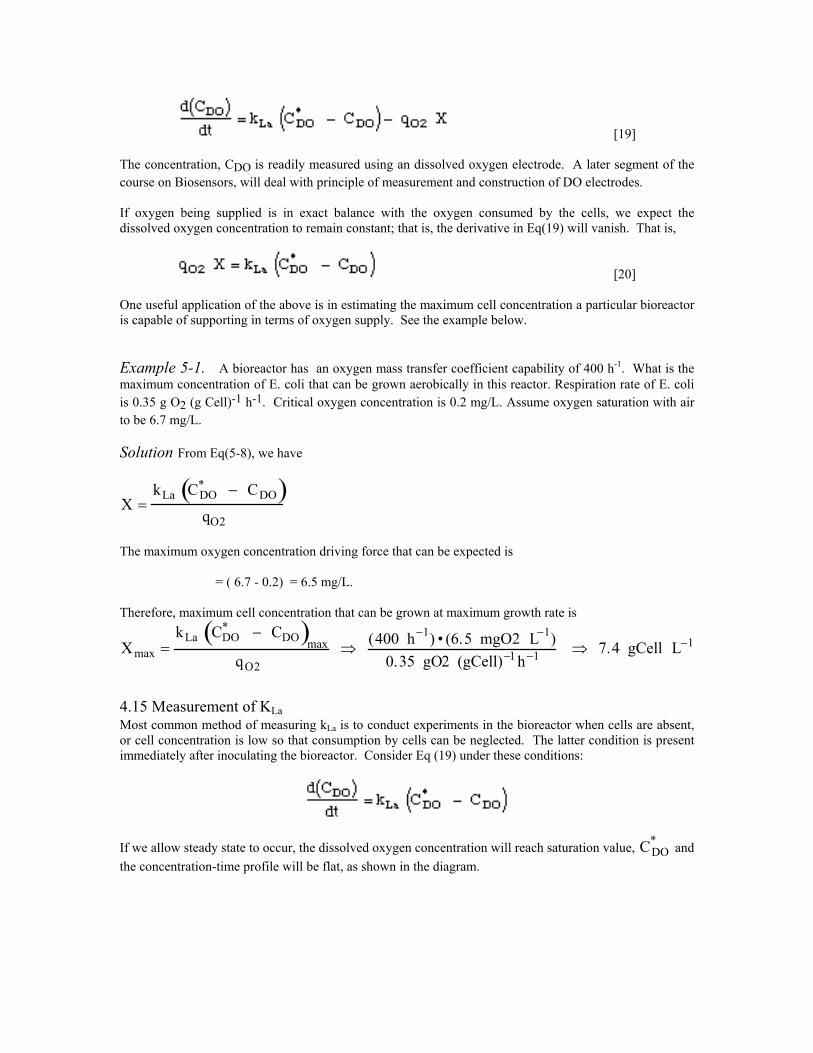
One useful application of the above is in estimating the maximum cell concentration a particular bioreactor is capable of supporting in terms of oxygen supply. See the example below. Example 5-1. A bioreactor has an oxygen mass transfer coefficient capability of 400 h-1. What is the maximum concentration of E. coli that can be grown aerobically in this reactor. Respiration rate of E. coli is 0.35 g O2 (g Cell)-1 h-1. Critical oxygen concentration is 0.2 mg/L. Assume oxygen saturation with air to be 6.7 mg/L. Solution From Eq(5-8), we have
X =kLa CDO
* − CDO( )qO2
The maximum oxygen concentration driving force that can be expected is = ( 6.7 - 0.2) = 6.5 mg/L. Therefore, maxim grown at maximum growth rate is um cell concentration that can be
Xmax =kLa CDO
* − CDO( )max
qO2 ⇒ (400 h−1) • (6.5 mgO2 L−1)
0.35 gO2 (gCell)−1 h−1 ⇒ 7.4 gCell L−1
4.15 Measurement of KLa Most common method of measuring kLa is to conduct experiments in the bioreactor when cells are absent, or cell concentration is low so that consumption by cells can be neglected. The latter condition is present immediately after inoculating the bioreactor. Consider Eq (19) under these conditions:
If we allow steady state to occur, the dissolved oxygen concentration will reach saturation value, C and the concentration-time profile will be flat, as shown in the diagram.
DO*

CL
time
O2 on
O2 Off
Fig 5-2 Oxygen Profile During a Transient. The responses will be exponential, rather than straight lines.
If the oxygen source (air) is replaced by nitrogen, the resulting response of the system is described by the above equation with the term, C set to zero. That is, DO
*
The solution to the above is
If one plots the response on a semi-log plot, the slope will equal to the negative of mass transfer coefficient. It is relatively a simple experiment and the data analysis is also easy to do. When other type of transient mass transfer experiments are conducted, the above equations should be suitably modified. For example for the case of nitrogen to air switch, we should suitably modify the solution because the initial condition is now different. 4.16 A Design Example You are part of a tech service team asked to evaluate if the available 10,000 liter fermentor is adequate to produce 10 kg/day of a recombinant protein using a strain of E. coli that expresses the protein as 20 % of cellular protein. In order to enhance plasmid stability, the nutrients are manipulated to give a low specific growth rate is 0.2 h-1. The oxygen demand is 0.15 g O2/g cell - h. Assume that the recombinant protein formation is cell growth associated. Data: The lag phase is 4 hours. Typical clean-up time following a fermentation batch and preparation for the next batch is 8 hours. The plant runs three shifts. Cell yield on substrate is 0.55 g cell/g substrate. Available support services can supply inoculum of a maximum of 6 kg of cells every 24 hour period. Maximum KLa for the available fermentor is 500 h-1. Fermentor accessories are capable of handling cell concentrations of 60 g/L. Assume any other parameters you need to complete the calculation. Assumption: Critical oxygen conc. is 0.2 mg/L and DO at air saturation is 6.4 mg/L

Solution A: Lag phase and clean-up/ prep time is given as 12 h. If a batch is to completed within each 24 h period, production is limited to 12 h per day. If this is not a limitation, one can optimize production by varying batch time. Let us first evaluate assuming 12 h batch times. If max. cell concentration of 20.6 g/L is obtained, amount of r-protein produced is = (0.2) (0.5) (20.6) = 2.06 g/L. 50% of cell dry matter was assumed to be protein. Hence in 10,000 liters, we will produce 20.6 kg. Next to determine the inoculum level. The maximum batch growth phase is 12 h. Substitute in growth eqn, and assuming nutrients are present to support exponential growth during the 12 h period,
For 10,000 liters, we will need 18.7 kg every 12 h. Since only 6 kg is available, max. protein that can be produced is {(0.2)(0.5)[0.6 Exp((0.2)(12)] • 10,000 = 6.61 kg Solution B: Now let us allow batch times to be longer than 12 h, meaning that there might not be a harvest every day. Since it is advantageous to use the max. inoculum concentration, select X0 = 0.6 g/L. This value is obtained by diving 6 kg of cells in 10,000 L. Max. cell concentration is fixed due to aeration requirements. Use the batch growth eqn to find the batch growth time of 17.7 h. Hence 20.6 kg or r-protein will be produced every 29.7 h which gives a 24 h production rate of 16.6 kg. What alternative way of running reactor would you recommend to achieve the production target? 5.0 Closure In this module you were introduced to some of the key elements of biotechnology. We discussed some of the biological principles that enable us to construct microorganisms or cells that carry out biochemical reactions of commercial value. You are also introduced to basic principles of biochemical engineering. Governing relationships between growth stoichiometry, growth rate and product formation were discussed. Although this could serve as an introduction to the subject area, there is a whole lot we did not get to speak about. These include, gene therapy, human genomics, tissue engineering, cancer diagnostic tools, use of biotechnology in crime detection, and a whole score of applications. With a little bit more reading, you will be able to understand these and other emerging fields of biotechnology.

6.0 Exercises
1. Predict the amino acid sequences of peptides formed by ribosomes in response to the following messengers, assuming that the initial codon begins with the first base on the left. GGUCAGUCGCUCCUGAUU UUGGAUGCGCCAUAAUUUGCU CAUGAUGCCUGUUGCUAC
2. A batch growth of cells generated the following data.
------------------------ Time biomass Substrate (hr) (g/L) (g/L) ------------------------ 0 0.1 10.0 1 0.15 9.9 2 0.2 9.8 3 0.25 9.7 4 0.68 8.8 5 1.8 6.5 5.5 3.0 4.1 6 5.0 0.2 7 5.3 0 8 5.3 0 ------------------------
Estimate the length of the lag phase, specific growth rate, doubling time, and substrate-to-cell yield coefficient. What about the saturation constant (Ks) in the Monod model?
3. General background information on insulin. What is the cause of diabetes? Find out the role insulin plays in glucose digestion and its modeof action (e.g., is insulin an enzyme that catalyzes one of the steps in glucose digestion?). Why are some people diabetic?
4. Go to a web resource and report on the amino acid sequence of insulin. Find the DNA gene
sequence of insulin of a couple of common mammals (e.g., pigs, goats, etc). Compare the above gene sequences. Would you say they are identical, similar, or dissimilar?
5. A protein contains 124 amino acids. What is the least number of nucleotides you can expect to
find in the gene encoding the proteins?
6. A polynucleotide 5'-A G G U U A U A G G A A A A A -3' is translated in vitro in a system that does not require a start codon. What polypeptide is synthesized? Indicate the amino and carboxylic end of the peptide.
7. Describe what DNA array is. Use the web to search information.
8. Go to the website http://www.atcc.org/ which is a non-profit organization which maintains a
collection of various types of biological material, and find out the components of Eagle’s medium. Note there is more than one. Report on at least two, and explain why the composition is different.
9. Go to genomic database at Hopkins: http://gdbwww.gdb.org/. Determine insulin gene from at least two species, and report on % similarity of the nucleotides. You may have to wade through several searches to do this. You may also go to alternate sites for genomic data.
10. You are cloning mammalian genomic DNA to obtain the gene for a protein of 200,000 molecular
weight.
a. What size DNA would you look for among DNA fragments obtained by limited digestion with restriction endonucleases? What assumption should you make to determine this?
b. Would your answer differ for a bacterial gene? Explain. c. What vector (plasmid, lambda, etc) would you select for cloning of the DNA(s) in (a) and
(b) above.
11. Aerbic growth of Sachromyces ceravasiae (yeast) on ethanol is described by
C2H5OH + a O2 + b NH3 = 0.2 CH1.8O0.5N0.2 + d CO2 + e H2O Apply the growth equation concept and do the following calculations.
d. Determine the parameters: a, b, d, and e e. Determine Yx/s and Yx/O2
12. It is determined that the empirical formula C12H23O7 is representative of 330g of yeast. Growth
on n-paraffin as a sole carbon source is given by the following growth reaction. Nitrogen has been neglected.
a(CH2) + bO2 C12 H23 O7 + dCO2 + eH2O
(a) Calculate a,b,c,d and e in terms of YX/S (g of cells/g substrate) (b) If repiratory quotient was measured as 0.90, calculate the stoichiometric coefficients, a, b,c and d. Are the results reasonable? Comment.
13. Problem Statement: Baker's yeast fermentation can be described by the following reaction: a C6H12O6 + b O2 + c NH3 --------> C6H10NO3 + d H2O + e CO2 + f C2H6O (glucose) (yeast) (ethanol)
The fermentor is continuously monitored with an oxygen gas sensor and a carbon dioxide gas sensor. From these measurements, one can construct the respiratory quotient (RQ), which is defined as the number of moles of CO2 produced per mole of O2 consumed during fermentation. Given the RQ and the yeast yield Yx/s (i.e., the number of grams of yeast produced per gram of glucose consumed), find the ethanol yield Yp/s (i.e., the number of grams of ethanol produced per gram of glucose consumed) in terms of RQ and Yx. When Yx=0.5, what does a measurement of RQ=1 tell you? Species Formula MW ----------------------------------------------------- Glucose C6H12O6 180 Yeast C6H10NO3 144 Ethanol C2H6O 46


![Saizen [somatropin (rDNA origin) for injection] … · Saizen® [somatropin (rDNA origin) for injection] cool.click ...](https://static.fdocuments.in/doc/165x107/5b8977fc7f8b9abe1e8db089/saizen-somatropin-rdna-origin-for-injection-saizen-somatropin-rdna-origin.jpg)