Biotechnology for sustainable use of bio-resources - Projects at
32
Biotechnology for sustainable use of bio-resources: biorefining in the EU, the US and China Working Paper by Maive Rute Harvard Weatherhead Center Fellow 2012/13 May 2013
Transcript of Biotechnology for sustainable use of bio-resources - Projects at

Biotechnology for sustainable use of bio-resources:
biorefining in the EU, the US and China
Working Paper by Maive Rute
Harvard Weatherhead Center Fellow 2012/13
May 2013
INTRODUCTION
Global challenges such as limited of resources and climate change mobilize us to search for
solutions. Biotechnology is among the key enabling technologies we look to as a possible
provider of such solutions. The application of biotechnology in the agro-food sector or so
called “green biotechnology” is expected to help increase yields, develop new resistant crop
varieties or plants that can grow on marginal lands, provide ways for reducing the use of
pesticides and other chemicals in agriculture, and to improve our diets. Besides these direct
impacts, the new agricultural methods such as no till or lower application of chemicals would
also have positive environmental and climate effects.
The application of biotechnology in the industrial production and in the environmental sector,
known as white biotechnology, has the ultimate goals of shifting production to renewable
biological raw materials, improving the efficiency of industrial processes, reducing the
negative environmental impacts, and remediating polluted environments. Industrial or white
biotechnology uses enzymes and micro-organisms to make biobased products in a wide
variety of sectors: chemicals, food and feed, healthcare, detergents, paper and pulp, textiles
and energy. Biotechnologies can be used and combined with other technologies in the existing
industries or in specific biomass based refineries, i.e. biorefineries. Agricultural products,
biomass, and organic waste, including food processing waste and effluents are transformed
into other substances in the same way as crude oil is used as a feedstock in the production of
chemicals. (OECD 2011, page 8).
A strong boost for improved utilization of biological raw materials came from biofuel’s
mandatory targets established in the US and in the EU and the steady investments made in
Brazil in this sector. According to the International Energy Agency the global production of
biofuels has been growing steadily over the last decade from 16 billion liters in 2000 to more
than 100 billion liters in 2011. Today biofuels provide around 3% of global road transport
fuel, while Brazil, met nearly 23% of its road transport fuel demand in 2009 with biofuels.
The rapid development of the biofuel sector creates a basis for increasing the biomass use in
related processing industries such as chemicals and various materials industries.
This paper is inspired by the proposal of some 30-40 European companies and industry
associations to the European Commission for establishing a public-private partnership for
sustainable biomass conversion. This initiative, Biobased and Renewable Industries for
Development and Growth in Europe (BRIDGE), is currently under scrutiny and discussion.
The aim of this working paper is to compare the competitive position of the European Union
and the United States on the background of rapidly growing China in one of the key enabling
technologies of future growth – biotechnology, notably industrial biotechnology. The paper is
based on a desk-top review of the recent literature and presents updated figures and examples
on the trends, notably as to the emergence of biorefineries in Europe, China and in the US.
Emphasis will be given to the public policies and overall competitive situation, not to the
technical details of individual technologies.
DEVELOPMENT OF BIOTECHNOLOGY
From a small set of technologies available in laboratories some 40 years ago, biotechnology
has developed into a broad field of applications in pharmaceutical, medical, agriculture, food,
chemical, environmental, and wood processing industries. Biotechnology covers a very
heterogeneous range of sectors that makes the comparison of a country’s competitive position
difficult. The situation is further aggravated by the fact that the statistical offices do not
collect data on biotechnology and therefore one has to often use indirect methods or specific
surveys for assessment. Below I have used the latest data from the OECD in order to establish
some general trends.
Unfortunately, the OECD data on biotechnology does not cover all the EU Member States;
therefore the figures in Tables 1 and 2 are underestimates. Furthermore, the definition of a
biotechnology firm itself seems somewhat open-ended, which explains why the OECD and
Ernst and Young (Table 3) arrive at significantly differing figures as to the number of such
firms. One reason for these differences might be the fact that Ernst and Young mostly focus
on research-intensive pharmaceutical and medical sector firms.
Even though there are no statistics available on the number of companies involved in
industrial biotechnology (which is the main fields of interest of this paper) it would be
beneficial to establish some facts about the market size and trends. Industrial biotechnology
has been utilized for decades in the production of biofuels, biochemicals for pharmaceuticals
markets, food and feed, fine chemicals, detergents, and hygiene products. Bioethanol
production has been increasing rapidly with world-wide annual growth rates above 10%.
Since 2008, the US is the leading bioethanol producer, leaving Brazil in second place. Europe
is lagging behind in these developments because of the very strong public objection to
converting food crops to fuel, among other reasons. This is one of the reasons why Europe is
now mobilizing efforts on the “second generation” (non-food) biofuels and biomaterials.
Biopolymers are emerging products with a broad range of applications. The value of
biochemicals (other than pharmaceuticals) could increase from 1.8% of all chemical
production in 2005 to between 12 – 20% by 2015. For decades, plastics from fossil fuels have
grown faster than any other type of bulk chemicals. By 2100 an estimated 1 billion tons
annual plastics would consume some 25% of current oil production. Biobased plastics are
attractive in terms of using alternative raw materials, but also due to emissions and energy
savings. A significant growth in the biobased polymers sector is expected from the
development of new polymers with new properties, from continuous regulatory pressure to
reduce carbon footprints and, from increased economic incentives to use renewable biological
raw materials. (OECD, 2011). The bioplastics company representatives suggest that the
bioplastics sector is growing at least 20% per year. (Goodall, 2011).
Sales of bio-based products in Europe in 2007 amounted to €48b or 3.5% of total chemical
sales. By 2017, the sales are estimated to be €340b, totaling 15.4% of all chemical sales.
(EuropaBio, 2012).
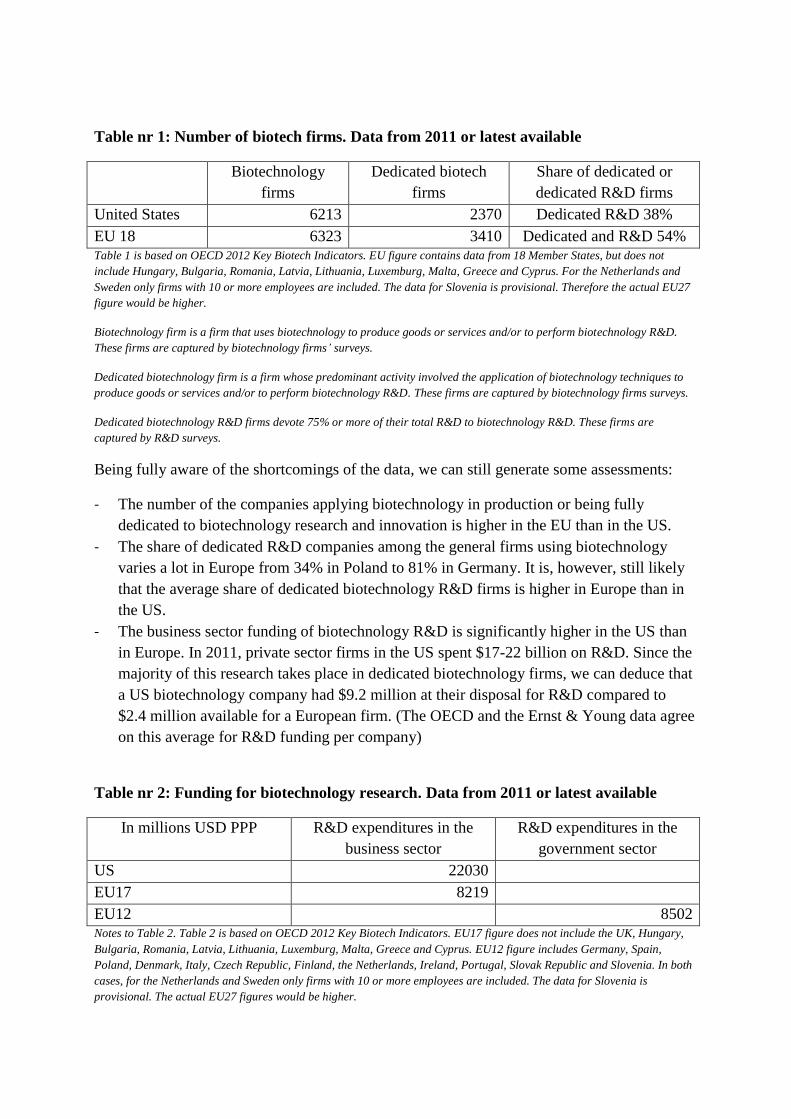
Table nr 1: Number of biotech firms. Data from 2011 or latest available
Biotechnology
firms
Dedicated biotech
firms
Share of dedicated or
dedicated R&D firms
United States 6213 2370 Dedicated R&D 38%
EU 18 6323 3410 Dedicated and R&D 54% Table 1 is based on OECD 2012 Key Biotech Indicators. EU figure contains data from 18 Member States, but does not
include Hungary, Bulgaria, Romania, Latvia, Lithuania, Luxemburg, Malta, Greece and Cyprus. For the Netherlands and
Sweden only firms with 10 or more employees are included. The data for Slovenia is provisional. Therefore the actual EU27
figure would be higher.
Biotechnology firm is a firm that uses biotechnology to produce goods or services and/or to perform biotechnology R&D.
These firms are captured by biotechnology firms’ surveys.
Dedicated biotechnology firm is a firm whose predominant activity involved the application of biotechnology techniques to
produce goods or services and/or to perform biotechnology R&D. These firms are captured by biotechnology firms surveys.
Dedicated biotechnology R&D firms devote 75% or more of their total R&D to biotechnology R&D. These firms are
captured by R&D surveys.
Being fully aware of the shortcomings of the data, we can still generate some assessments:
- The number of the companies applying biotechnology in production or being fully
dedicated to biotechnology research and innovation is higher in the EU than in the US.
- The share of dedicated R&D companies among the general firms using biotechnology
varies a lot in Europe from 34% in Poland to 81% in Germany. It is, however, still likely
that the average share of dedicated biotechnology R&D firms is higher in Europe than in
the US.
- The business sector funding of biotechnology R&D is significantly higher in the US than
in Europe. In 2011, private sector firms in the US spent $17-22 billion on R&D. Since the
majority of this research takes place in dedicated biotechnology firms, we can deduce that
a US biotechnology company had $9.2 million at their disposal for R&D compared to
$2.4 million available for a European firm. (The OECD and the Ernst & Young data agree
on this average for R&D funding per company)
Table nr 2: Funding for biotechnology research. Data from 2011 or latest available
In millions USD PPP R&D expenditures in the
business sector
R&D expenditures in the
government sector
US 22030
EU17 8219
EU12 8502 Notes to Table 2. Table 2 is based on OECD 2012 Key Biotech Indicators. EU17 figure does not include the UK, Hungary,
Bulgaria, Romania, Latvia, Lithuania, Luxemburg, Malta, Greece and Cyprus. EU12 figure includes Germany, Spain,
Poland, Denmark, Italy, Czech Republic, Finland, the Netherlands, Ireland, Portugal, Slovak Republic and Slovenia. In both
cases, for the Netherlands and Sweden only firms with 10 or more employees are included. The data for Slovenia is
provisional. The actual EU27 figures would be higher.

The shortage of research and innovation funding in Europe is somewhat offset by public
sector efforts. Again, the available data is unfortunately rather patchy. OECD data (Table 2)
seems to suggest that the public sector support for biotechnology R&D in Europe actually
exceeds the expenditures by private firms. This is consistent with the general R&D funding
trends in Europe where the public sector provided 2.03% and the private sector 1.27% of GDP
in 2011.
Table nr 3: Overview of the US biotechnology sector by Ernst & Young
The 2011 Biotechnology Innovation Watch report by Technopolis Group (Table nr 4)
generates some interesting new information:
- The report deals with dedicated biotechnology firms where the average R&D expenditure
makes up 64% of the annual turnover;
- 9 out of 10 such companies have received public funding from the local, national, or EU
level whereas in most cases such funding is combined. 100% of large companies had
received public funding compared to 89 % of small companies.
- The biotech firms in Central and Eastern Europe receive significantly less support than
their counterparts in Western, Northern, and Southern Europe. Public funding from local

sources is almost non-existent, funding from central government is lower, and the general
EU support reaches only 24% of Central and Eastern European firms compared to 50% in
Southern Europe.
- The penetration rate (63%) of the EU research and technological development funding is
high. Large companies and companies located in Western and Northern Europe have been
the most successful in obtaining funding from 5th
and 6th
framework programs.
Table nr 4: Engagement in R&D and R&D funding of firms
R&D activities and
funding
all in % of total
Country group Firm size All
firms Central
& East
West &
North
South Small Medium Large
Total R&D expenditure/
Total turnover in 2004
38 64 79 62 64 82 64
Any public funding 73 100 89 89 90 100 90
Public funding from local
or regional authorities
5 44 65 44 39 53 43
Public funding from
central government
50 67 68 61 66 77 64
Public funding from the
EU
24 42 50 33 48 82 41
Funding from EU’s 5th
or
6th
framework program
41 79 61 53 72 94 63
Adapted from Enzing, C. (Technopolis Group). December 2011. Sectoral Innovation Watch
It might, however, be premature for the DG RTD biotech team to congratulate themselves for
this success. First of all, the report talks only about the number of companies that have gained
funding, but does not tell us anything about the sufficiency or efficacy of funding. Secondly,
if the number of dedicated biotechnology companies in Europe remains stagnant, this may
cause problems with the absorption capacity of the EU funding. Thirdly, we also need to be
vigilant about establishing research priorities based not on the views of yesterday, but the
opportunities of tomorrow. As presented in Figure 1, this is a real risk.
Figure 1 is based on a survey organized by the Industrial Biotechnology European Research
Area Network (ERA-IB Net) where the member companies compared the available research
funding with their actual needs. The message from this survey is clear:
- Public research funding for bulk agricultural products and for food and feed industries
exceeds the needs of these sectors.
- Bio-based polymers and materials seem to remain off the radar of public funding. Bio-
inspired materials and textiles receive much less compared to their needs.

The OECD 2011 overview of the Industrial Biotechnology development arrives at a similar
conclusion, stating that there is a serious mismatch between the level of investment in
industrial biotechnology R&D and the potential market opportunities for the sector. Only 2%
of private biotechnology R&D went to industrial biotech in 2003, while the OECD expects
industrial biotechnology will contribute up to 39% of the gross value added in 2030. The
latter figure excludes the share of biofuels, which will clearly contribute substantially to the
gross value added. The OECD therefore acknowledges the pressing need to boost research in
industrial biotechnologies and invites both the public and private sectors to increase their
investments, to establish public-private partnerships, and to reduce regulatory burdens for
bringing new products into markets.
The European Industry association EuropaBio specifies in their 2012 report: “The right
policies and incentives for R&D development are essential to growth in this industry… One
of the key challenges faced by industrial biotechnology companies, who are often still in the
early and start-up phase, is access to finance…funding for pilot and demonstration plants is
crucial to bridge the gap from research to commercialization.”
Figure nr 1: Comparison of research areas of interest between firms and national public
sector funding
Source: www.era-ib.net and OECD. 2011. Industrial Biotechnology and Climate Change. Opportunities and Challenges.
When we further analyze the outcomes of research and innovation, it is good to note that 66%
of dedicated biotechnology firms report having actually innovated during the observed
0 5 10 15 20
Bio-inspired materials & textiles
Other biobased polymers &materials
Agriculture - bulk products
Food, feed and drink - bulkproducts
Energy - bulk products
Other bulk products
Company areas of interest
Funded by public researchprograms

timeframe. Contrary to what we often hear, according to the Biotechnology Innovation Watch
the large firms have introduced more innovations than the small firms (Table nr 5). The
companies in Western and Northern Europe have been more successful in innovation. The
latter may also reflect the availability of funding as discussed above. The biotechnology
companies are active not only in product innovation, but pursue innovation in services or
production methods with almost the same vigor as the share of companies reporting having
innovated in the respective fields (46% versus 44% versus 41%).
Table nr 5: Innovation activities in European biotechnology firms
Innovative activity
all in % of total
number of firms
Country group Firm size All
firms Central
& East
West &
North
South Small Medium Large
Overall innovation
activity
52 77 61 61 77 91 66
Introduced onto the
market new or
significantly improved
good
34 62 32 41 54 72 46
Introduced onto the
market new or
significantly improved
service
26 57 36 40 48 70 44
Introduced onto the
market new or
significantly improved
production method
38 46 35 36 47 75 41
Adapted from Enzing, C. (Technopolis Group). December 2011. Sectoral Innovation Watch. The underlying CIS4 data has
been obtained directly at the premises of the Eurostat Safe Centre in Luxembourg. Due to reasons of anonymity, data
availability and data protection policies at Eurostat, the data sets are limited. Overall such data is mostly suitable for
comparative analysis between firms from different country groups and different size classes.
Figure nr 2: Share in biotechnology patents filed under PCT 2008 - 2010
Source: OECD. December 2012. Key Biotech Indicators. Last updated in December 2012
Share in biotech patents filed under PCT 2008 - 2010
US
EU27
Japan
BRIICS
Others

Another standard way of measuring the outcome of research and innovation is to look at the
number of patent applications. Here the US, with 41% of total patent applications between
2008-2010, is a clear leader. 28% of the patent applications came from the European Union,
11 % from Japan, and more than 5 % from the BRICS countries (Figure 2).
Patenting in Europe has been significantly more expensive than in the US. With the recent
agreement between 25 Member States to create a European Community Patent, a great step
forward has been taken in speeding up the process and in reducing its costs. The first
Community patents are expected to be issued in 2014.
SUSTAINABLE SUPPLY OF BIOMASS
When analyzing the potential of replacing fossil resources with biological renewable raw
materials, the biomass availability in a sustainable and economically feasible way becomes
crucial. Just as is the case for biotechnology, the data for biomass and bio-waste are also
fragmented and the estimates vary significantly.
The International Energy Agency defines biomass as follows: “Biomass is any organic, i.e.
decomposing, matter derived from plants or animals available on a renewable basis. Biomass
includes wood and agricultural crops, herbaceous and woody energy crops, municipal organic
wastes as well as manure.”
One of the most recent estimates of sustainable biomass supply in the EU comes from the
Biomass Futures project which primarily assesses the role of bioenergy in meeting Europe’s
renewable energy targets. The project has utilized the Member States’ National Renewable
Energy Actions Plans (NREAP) to extract the biomass and bio-waste estimates. Biomass
Futures project has then done modeling work on the supply of different biomass sources
under two different scenarios: 1) a Reference scenario based on current sustainability criteria
for biomass and biofuels; 2) a Sustainability scenario anticipating stricter sustainability
criteria applied to all bioenergy feedstock, including solid and gaseous bioenergy. The results
are presented in Table 6.
The present EU biomass supply is estimated at 314 MTOE. The amounts indicated in Table 6
for additional harvestable roundwood and specific perennial crops under the current supply
should be seen as potential since these categories are not currently utilized. As to roundwood
and partially also other forestry biomass, one has to keep in mind that these resources are used
for other competing purposes and would normally not be available for conversion into
biofuels or biomaterials.
Both scenarios anticipate an increased supply of specific perennial crops and better use of
waste as well as forestry residues. The Reference scenario arrives at a potential biomass
supply worth of 429 MTOE in 2020, while the Sustainability scenario leads to a reduction of
the domestic supply by about 13 % and gives 375 MTOE as the potential available biomass in
Europe. In the Sustainability scenario the biomass available at a lower price becomes more

limited. In the reference scenario there are 300 MTOE biomass available at a price of a
maximum 250 euros per TOE, while in the Sustainability scenario the supply at this price
drops to 270 MTOE.
Table nr 6: Biomass supply in Europe in MTOE (million tons oil equivalent)
Category Current
supply
Reference
scenario 2020
Sustainability
scenario 2020
Expected
demand for
energy
sector 2020
Energy
demand/
reference
supply
Wastes 42 36 36 24 84%
Agricultural
residues
89 106 106 17 16%
Rotational crops 9 17 0 9 71%
Perennial crops 0 58 52 23 40%
Landscape care
wood
9 15 11 9 100%
Roundwood
production
57 56 56 0 0%
Additional
harvestable
roundwood
41 38 35 0 0%
Primary forestry
residues
20 41 19 32 77%
Secondary forestry
residues
14 15 15 11 73%
Tertiary forestry
residues
32 45 45 31 56%
Total 314 429 375 155 37% Source: Adapted from the Biomass Futures project www.biomassfutures.eu
The expected demand for energy and biofuels use in 2020 is derived from the National
Renewable Energy Action Plans and assumes the use for electricity and heat whereas biofuels
share is projected at 9%. The model also compares the biomass raw material cost against
fossil fuels and assumes that the economic agents would search for least expensive raw
materials which may also be imported. These imports mostly consist of wood pellets,
feedstocks for biofuel production, and biofuels.
The results of the Biomass Futures project indicate that the National Renewable Energy Plans
underway in the Member States would not lead to optimal utilization of the available
domestic biomass. In fact, even if we exclude fully the additional harvestable wood resources,
the projected utilization of biomass supply would be only 37%. It is important to remember
that these estimations look only at the energy and fuel use and do not include the raw material

needs of processing industries. The national renewable energy plans also foresee imports of
either cheap biomass or biofuels from other regions which will amount to approximately 46
MTOE.
It is interesting to note that under the Sustainability Scenario the Biomass Futures project
foresees a sharp increase in production of 2nd
generation biofuels and elimination of biofuels
from European rotational food crops.
The estimations of the Biomass Futures project fall well in the range of earlier studies. In a
2006 study, European Environmental Agency (EEA) estimated the EU primary energy
requirement to be 1.8 billion tons oil equivalent (TOE) in 2020 and projected biomass to be
able to contribute with 13 % or 236 million TOE, compared to 69 million TOE actually
provided in 2003. An almost identical projection is reproduced in the European Commission's
Impact Assessment of the Renewable Energy Roadmap where the former scenario results in a
biomass potential of 230 million TOE, the latter being 195 million TOE.
The European Commission Directorate General for Agriculture and Rural Development
recognizes the crucial role agriculture is going to play in the future of sustainable provision of
biomass both from fields as well as from forests. Through their policies, the EU supports
biomass supply for bioenergy and biofuels, but so far unfortunately the other uses of biomass
such as biomaterials are out of the scope of agricultural or rural measures. In the short to
medium run, available but partly unused biomass potential from waste, forestry, and residues
can readily be tapped into. In the longer run, the genuine growth in biomass potential will
have to come from agriculture.
Wood to biodiesel in Finland
UPM will invest 150 MEUR to the first biorefinery in the world producing wood based
advanced biofuels. UPM’s biorefinery will have a production capacity of 100 000 tons per
year and it will be located in Lappenranta, Finland. This is equal to 120 million liters of
biofuels. The main product is advanced biodiesel. The investment decision was made in
February 1, 2012, construction started in summer 2012, and production will begin in 2014.
Besides the better utilization of residues, the biomass market development should increasingly
favor growing perennial grasses, short rotation forestry, and short rotation coppice. The
European Biomass Association (AEBIOM) estimated the EU area at below 0.1 million ha in
2007 and expects about 2 million ha in 2020. Also, much more forest biomass could be
harvested. Recent projections for 2030 quantify the sustainably realizable potential of wood
for energy from EU forests as high as 675 million cubic meters (146 million TOE) per year,
provided intensive wood mobilization efforts are applied. Only 60–70 % of the annual
increment of EU forests is harvested. At present, about 42 % of the harvest is eventually used
for energy; residues from higher value processing have a significant share. (DG AGRI, 2013).
Domestically available biomass could satisfy a much larger share of Europe’s energy needs as
well as to provide raw material to processing industry. More than half of the oil that Europe

currently consumes could be replaced by biomass derived products (Table 7). However, not
all of the domestic supply would be available at competitive price ranges (165 – 350
euros/TOE) without further investments in more efficient logistics and integration of the
residue use in the primary forestry and agriculture sector activities.
A Bloomberg 2011 study arrived at a similar conclusion that up to half of the EU €40bn
annual crude energy bill could be used for sourcing domestic biofuel if the necessary refining
facilities and supply chains were put in place. However, raw material price matters. The
biofuels industry consensus suggests biorefinery gate prices for agricultural residues in the
next decade to be between 50 and 100 euros per dry ton.
Table nr 7: Share of biomass in Europe’s total energy balance in MTOE
Current level Projections 2020
Total energy consumption 2009 1155
Including oil products 500
Including biofuel and waste 71
Domestic biomass availability 314 429
MSs estimated utilization 155
Imported biomass/ biofuel 46
Source: International Energy Agency and Biomass Futures project
Furthermore, this underutilization of biological renewable resources is also largely due to the
pre-commercial stage of technology for efficient conversion of wastes and various lingo-
cellulosic materials. Additional difficulties arise from the lack of logistical supply chains of
biomass and the first level processing facilities. In the following we will look into these issues
and discuss how bio-refining could gradually and partially replace or complement oil-
refining.
DEVELOPMENT OF BIOREFINING
Using biomass to replace fossil fuels as well as using biotechnological processes in the
processing industry can bring various environmental and climate benefits such as reduced
GHG emissions and other pollutants to water, air, and soil. The literature also refers to
reduction in waste and to economies in energy and water consumption. The full climate
change mitigation potential of industrial biotechnology ranges between 1 billion and 2.5
billion tons of CO2 per year by 2030. (WWF, 2009).
The conversion of biomass into various product streams and the integration of
biotechnologies with other technologies cover a wide range of industrial realities. The widely
accepted definition for biorefining and biorefineries comes again from the International
Energy Agency (IEA): “Biorefining is the sustainable processing of biomass into a spectrum
of marketable products and energy”.

“The Joint European Biorefinery Vision for 2030” which was created in collaboration with 5
European Technology Platforms specifies this definition further:
- Biorefinery: covering basic concepts, the facilities themselves, processes, and cluster
formation
- Sustainable: encompasses maximizing economic efficiency, minimizing environmental
impact, fossil fuel replacement, and also takes account of socio-economic aspects
- Processing: upstream processing, transformation, fractionation, thermo-chemical and/or
biochemical conversion, extraction, separation, and downstream processing are all
included
- Biomass: comprises crops, organic waste, agricultural and forestry waste, wood, and
aquatic biomass
- Marketable: describes a product for which a market with quality, volume and price
(acceptable to consumers) already exists or is expected to be developed in the near future
- Products: includes both intermediates and final products, i.e. food, feed, materials, and
chemicals (specialties, commodities and platform molecules)
- Energy: fuels (liquid, gas and solid), power, and heat.
Table nr 8: Support estimates for biofuels in 2006
Total support estimates
Ethanol Biodiesel
Total support
estimate in
Billions of $
Variable share
in %
Total support
estimate in
Billions of $
Variable share
in %
US 5.8 93 0.53 89
EU25 1.6 98 3.1 90
Approximate average and variable rates of support per liter of biofuels
Average US$/ liter Average US$/liter
US 0.28 Federal 0.15,
States 0.00-0.26
0.55 Federal 0.26,
States 0.00 -0.26
EU25 1.00 0.00 – 0.90 0.70 0.00 – 0.50 Source: adapted from FAO. 2008. Biofuels: prospects, risks and opportunities
The variable share depends on the level of production or consumption and includes market-price support, production
payments or tax credits, fuel-excise tax credits and subsidies to variable inputs. The EU average biofuels support refers to
support by the Member States.
A crucial step in developing this industry is establishing integrated biorefineries that could
convert various feedstocks simultaneously into affordable biofuels, energy, and wide range of
biochemicals and biomaterials. This broad product range would help optimize the use of
biological raw material and improve overall process economics. However, to arrive at such
commercially viable biorefineries, significant technology development and large financial
investments are needed.

Emerging biofuel industries enjoy government support worldwide as specific subsidies,
mandates, adjustments to fuel taxes and, incentives for the use of flex-fuel vehicles have been
made available. Several countries are now developing extra incentives for second generation
biofuels. In stark contrast to biofuels, other biobased products suffer from a lack of tax
incentives, subsidies, or other supporting regulations. In Table 8 the level of support for
biofuel policies is presented. While it helps to create market and supply chains for other
biomaterials, it also makes the emergence of the other uses difficult due to competition on
feedstocks, subsidies, and finance.
The International Energy Agency estimates that about half of the estimated biofuel demand by
2030 could come from agricultural and forest residues, but this requires intensive RD&D
efforts over the next 10 – 15 years. Due to the high skill and capital requirements the OECD
countries along with Brazil and China and possibly India would be making the move. China
and India could produce about 19% of the future second generation biofuels. (IEA, 2010)
BIOREFINING IN CHINA
A pilot phase for biobased ethanol was introduced in China during 2000 – 2005. This
included building 4 large bioethanol plants with a total capacity of over 1 million tons of
ethanol per year. These plants use corn as feedstock. Fiscal subsidies, a VAT refund, and
income tax exemption were offered to the bioethanol producers. Petrochina and Sinopec were
tasked to blend bioethanol with gasoline. As a consequence, the domestic bioethanol
production picked up rapidly in China and reached some 1.7 million tons by 2011, covering
reportedly 20% of gasoline consumption in the 9 provinces where they are available.
In 2006, the main large bioethanol production plants in China were (from Tan, 2008):
1. Huaren Group in Heilongjiang Province, Corn-based, 400,000t/y,
2. Jilin Province in North-East China, Corn-based, 400,000t/y,
3. Tianguan Group in Henan Province, Corn-based, 400,000t/y,
4. Fengyuan Group in Anhui Province, Corn-based, 440,000t/y,
5. Zhongliang Group in Guangxi Province, COFCO Cassava-based plant 1000,000t/y.
China’s biofuel and biomaterial industry is still in its initial stage. The current level of
production of 1.7 million tons of biofuel is mostly derived from food crops which the
government has now prohibited as feedstock. But the 18th
Party Congress has made green
development key to China’s future. Among other initiatives the 12th
Five-Year Plan has set
biofuel targets: 4 million tons of ethanol and 10 million tons of biodiesel by 2020. Fully
flexible and integrated biorefineries have been identified as a priority, which means that
public and private investments are likely to follow soon (WEF, 2012).
Following the initial focus on biofuels only, the programs have been enlarged to biobased
chemicals and there are now numerous incentives for producers and a preferential tax

treatment for selected firms in emerging biochemical industries in place. Since 2005 a specific
program promotes production and consumption of biodegradable plastics. In 2007 there were
9 companies producing L-lactic acid for biomaterials (PLA) with the annual total output of
close to 85 thousand tons. Pilot and demonstration plants for other biochemicals are also in
operation.
The question of feedstocks is particularly problematic in China which has only 0.092 ha of
arable land per capita compared to roughly 2 ha in Brazil or close to 1 ha in the US. Using
non-arable lands in regions such as Inner Mongolia for energy crops as well as bio-wastes
from cities and industries, and agricultural and forestry residues are being explored.
Chempolis, Henan Yinge joint venture for new biorefinery in China
Chempolis Ltd from Finland and Henan Yinge Industrial Investment have in 2011 established
a joint venture in Luohe, Henan province, to construct a biorefinery producing 160 000 tons
of non-wood papermaking fibers and biochemicals.
The biorefinery will utilize the Chempolis formicofib technology using wheat straw as raw
material. Total project investment will be $40 million, of which Chemopolis will invest 25
percent. Chempolis’ formicofib converts non-wood raw materials into papermaking fiber for
paper and board, packaging, and hygiene products; while formicobio processes non-food raw
materials into cellulosic ethanol.
Chempolis has also signed a license and EPC agreement with Tianjin Jiuqian Paper Co Ltd. to
supply three formico® biorefineries, each capable of producing 100,000 t/a of bleached wheat
straw pulp. The new plants are scheduled to start up in 2012-2013.
Due to the new policy of shifting away from food crops as feedstock, there are several pilot
and demonstration plants now in operation or being constructed for 2nd
generation biofuels
and materials. The above mentioned corn ethanol plants are also experimenting with
cellulosic feedstock (Heilongjiang and Tianguan) such as wheat straw, corn cobs, and rice
bran. According to the World Economic Forum Platform for Biorefineries Biotechnology and
Bioenergy report from the December 2012 Beijing meeting, China has the most bioethanol
pilot plants in the world testing various technologies for 2nd
generation fuels and materials.
Large state-owned enterprises such as China National Petroleum Corporation (CNPC) have
taken a leading role in developing biorefineries. CNPC has already established a 200,000-ton
bioethanol project and is committed to building the first 60,000-ton aviation biofuel facility
by 2014. Foreign investments and technologies are also moving in from the US, the EU, and
Brazil.

BIOREFINING IN EUROPE
In the European Union several Union level policies influence the development of
biorefineries: the renewable energy policy establishes mandatory biofuels targets, the
common agriculture and rural development policy supports provision of biomass, regional
and cohesion funds can support construction of necessary infrastructure and facilities, and the
research and innovation policy devotes funds to technology development.
The central piece of legislation is the Renewable Energy Directive 2009/28/EC. It sets
ambitious binding targets for all Member States such that the EU will reach a 20% share of
renewable energy by 2020. For the transport sector, it sets a specific minimum 10% target for
each Member State. The Directive also establishes a comprehensive sustainability scheme for
biofuels. The Directive requires Member States to plan their development of each type of
renewable energy, including bioenergy, by designing National Renewable Energy Action
Plans. In addition to the general EU bioenergy/ biofuel policy, Member States have
introduced their own incentives and subsidy schemes.
The Common Agricultural Policy (CAP) encourages, through its rural development measures,
the supply of bioenergy from agriculture and forestry and the use of bioenergy on farms and
in rural areas. Direct payments to farmers have been fully decoupled from production and are
granted to farmers — regardless of what they grow and for what purpose (food, feed, energy,
material) — provided they comply with the cross-compliance scheme.
In order to enable farmers to respond even better to changing market requirements, the latest
revision of the CAP, called "Health Check", has abolished the energy crop premium and the
set-aside scheme. Thus, specific aids for growing (annual) energy crops no longer exist. The
rural development policy provides a variety of measures with which the Member States can
support bioenergy production and consumption.
As to the research and innovation funding, it is important to note that only about 5% of
funding is allocated at the EU level. The majority of research funding is still done by the
Member States. The EU 7th
Framework Program for Research and Technological
Development devoted about €1.8bn to research on agriculture, food and biotechnology over
the period 2007 – 2013. Various collaborative projects on biorefining were funded among
others. Some relevant examples include the following.
SUPRABIO is one of four research projects developing biorefinery technology that is funded
under the European Commission’s Sustainable Biorefineries Call. Its sister projects are
EuroBioRef, BIOCORE, and Star-Colibri. The biorefinery projects co-operated and liaised
with the aim to harmonize procedures for multi-criteria sustainability analyses, harmonize
biomass characterization protocols, and explore opportunities to organize common training
and education activities. The budget is €19m of which more than €12m comes from EU
budget.

The Star-COLIBRI project is a Coordination and Support Action aimed at overcoming
fragmentation and promoting cross-fertilization in the area of biorefineries research. It
received ca €2 m from the EU budget. Website: www.star-colibri.eu.
The EUROBIOREF project targets research, testing, optimization, and demonstration of bio-
refinery processes with the dual aim to use all fractions of various biomasses and exploit their
potential to produce the highest possible value in an eco-efficient and sustainable way. It
received €23.1m as part of the total budget of €37.4m. Website: www.eurobioref.org.
The BIOCORE project (Biocommodity refinery) with total budget of €20.3m (€14m from the
EU) will conceive and analyze the industrial feasibility of a biorefinery that will allow the
conversion of a variety of non-food biomass, including cereal by-products (straws etc.),
forestry residues and short rotation woody crops, into 2nd
generation biofuels, chemicals, and
polymers. Through pilot scaling testing of certain technologies, BIOCORE will be able to
demonstrate the industrial feasibility of biorefining under market-like conditions. Website:
www.biocore-europe.org.
One example of national level initiatives would be biorefinery research center in Leuna,
Germany where processes are developed to enable the extraction of basic chemicals from
biomass for eventual use in industry. This involves the combination of both chemical and
biotechnological methods. A total of €53 million has been invested in this German flagship
project, which is now available for use for researchers in both academia and industry.
The European biorefineries are currently in their initial stage. According to one report there
are 93 biorefineries in Europe of various types using cereals, oilseed, wood, waste, or green
and dry agricultural biomass. More than half are produce biofuels (Enzing, 2011). This figure
is still rather modest, notably when compared to the market penetration of some more
established and cheaper technologies such as biogas plants. Europe has more than 8,000
biogas plants, many of them in the ranging from 100–500 kW of electrical output. Such
installments have often benefitted from the support of either EU rural development or
structural funds. In the early years the focus was on electricity and heat generation, but now
there is a clear shift towards upgrading biogas (typically 50-60% methane) to almost pure
(typically 97%) methane that is completely interchangeable with natural gas. Studies show
that a substantial growth in the use of biomethane for transport will occur in the coming years,
from the current first steps in some European cities to about 1MTOE in 2020. (Baxter, 2012).
The European Biorefinery vision paper provides a well-informed overview of which types of
biorefineries are likely to emerge in which locations within Europe. Biorefineries based on
locally produced wood are likely to be developed in Northern Europe or in densely forested
rural areas in Western, Central, and Eastern Europe (“Mid-Europe”).
Typical agricultural crops such as cereals, sugar beet, oilseeds, and dedicated non-food crops
should give rise to biorefineries in the rural areas of Mid-Europe. The commercial
biorefineries would range from 50,000-150,000 tons of annual ethanol output, plus other

products. To produce one ton of cellulosic ethanol, about 4.5 tons of agricultural residue
would be needed, requiring a sufficient collection area in the relative vicinity of the plant. The
Bloomberg 2011 study indicates that farmers in Poland could earn some 84 €/ha for wheat
straw and in France up to 222 €/ha.
Waste and wood for chemicals in Norway
Borregaard has developed a new technology for the production of green chemicals and sugars
based on biomass from wood and agricultural and forestry waste. On April 16, 2013 the
biorefinery demonstration plant at Borregaard’s production facility in Sarpsborg was
inaugurated.
Construction of the demonstration plant has cost just under NOK 140 m, 58 m of which is
investment funding from Innovation Norway's Environmental Technology Support Scheme,
NOK 19 m from the Research Council of Norway and NOK 35 m from the EU’s FP7.
Borregaard is one of the world's most advanced biorefineries. All the components of wood are
used in the production of advanced biochemicals that can replace petroleum-based
alternatives. Borregaard's specialty cellulose is used in e.g. filters, adhesives and plastics.
Lignin, which binds wood fibers together, is the raw material for a range of products used in
concrete admixtures, car batteries, and animal feed products. Bioethanol is produced from the
sugar in wood and is used in biofuels. Borregaard is the world’s only producer of the vanilla
flavor vanillin from wood.
If the sustainability and climate policies allow for continued importation of biomass, then
large biorefineries based on imported biomass will be established near large ports such as
Rotterdam. The development of biorefineries in Southern Europe is more difficult to predict,
but they are most likely to develop in rural areas if appropriate dedicated crops are grown.
The European Biorefinery Vision paper further elaborates on the optimal scale of
biorefineries: “Scale will have a major impact on the types of industrial biorefinery and their
geographical distribution:
- Large-scale integrated biorefineries, mainly based on thermochemical process, are likely
to emerge in northern Europe and/or be associated with large ports.
- Small/medium scale integrated biorefineries, mainly based on biotech processes, are likely
to emerge in rural areas across Europe.
- Decentralized biorefineries will also emerge in all regions, as a consequence of the
development of a network of pre-treatment units.
The world’s first commercial-scale cellulosic ethanol plant in Italy

The world’s first commercial-scale cellulosic ethanol plant, Beta Renewables in Crescentino
Italy, started testing operations at the end of 2012 and has managed to stabilize production in
this first-of-its-kind plant in the spring of 2013. Approximately 180,000 tons of dry biomass
per year from the surrounding areas will be transported to the plant annually to produce
40,000 tons of ethanol. The main feedstocks are wheat straw and giant reed (Arundo donax).
The plant is later aiming at achieving a full capacity of 60,000 metric tons of ethanol per year.
Beta Renewables is a €250m joint venture between M&G and TPG Capital and TPG Biotech.
The main owner is Mossi & Ghisolfi (M&G), a $3 billion per year chemical firm that ranks as
one of the world’s largest PET producers, a polymer used in plastics bottles and multiple
other products. The Danish enzyme producer, Novozymes SA, joined the venture in October
2012, investing $115m in cash and acquiring a 10% share in Beta Renewables along with
marketing and other intellectual property rights.
Scale also has a major impact on technology choice and industrial strategy. Basically, there
are three possibilities:
- Small/medium-sized production facility.
- Medium/large production facility linked to a network of decentralized primary processing
plants (biomass fractioning and/or concentrating units). Low cost, de-centralized pre-
treatment plants (e.g. fast pyrolysis, torrefaction) combined with centralized biorefineries
to improve the overall biomass supply chain. High energy density feedstocks overcome
low density biomass problems, can be transported further at an acceptable cost, and can be
processed in bigger biorefineries to take advantage of economies of scale.
- Very large production facility, located near a port and using mainly imported biomass.”
BIOREFINING IN THE UNITED STATES
There is a wide range of support available in the United States for biomass conversion into
biofuels and bioproducts. The following list does not aim at being comprehensive, but rather
highlights the most important developments.
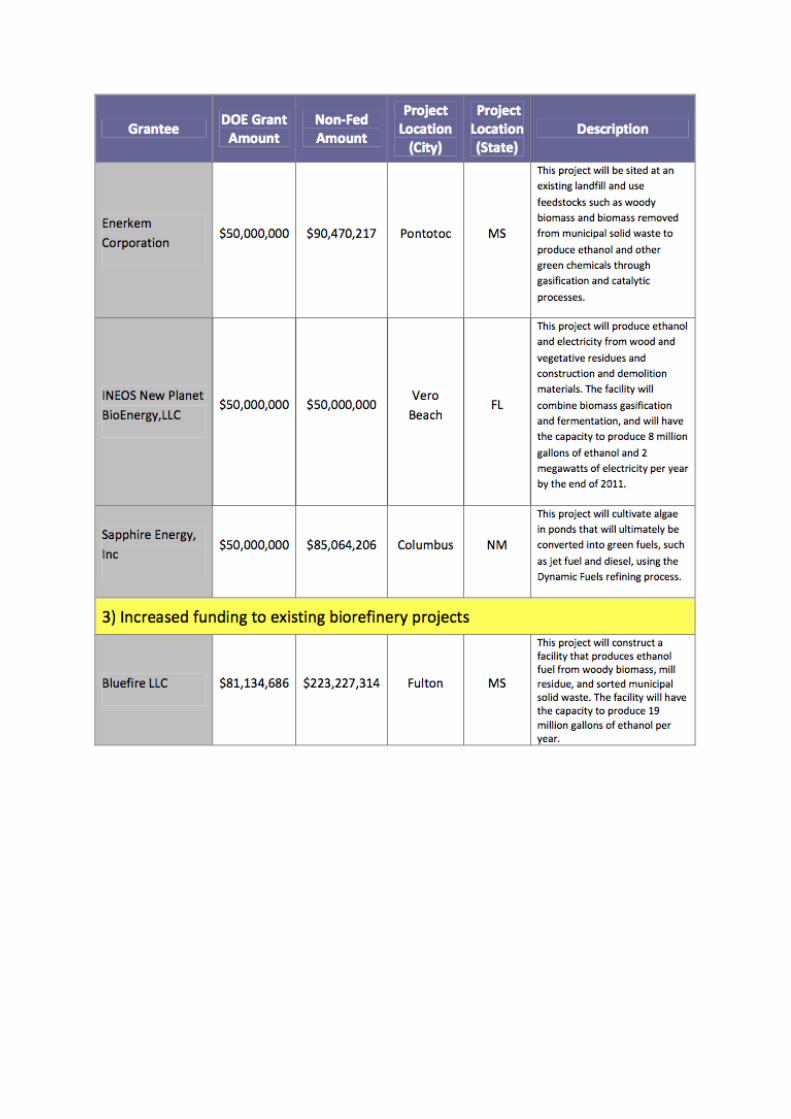
In 2009, the US Department of Energy, in cooperation with the US Department of
Agriculture, announced the selection of 19 integrated biorefinery projects to receive up to
$564 million (average $29.7 million per project) from the American Recovery and
Reinvestment Act to accelerate the construction and operation of pilot, demonstration, and
commercial scale facilities. The projects—in 15 states—were expected to validate refining
technologies and help lay the foundation for full commercial-scale development of a biomass
industry in the United States. The projects would produce advanced biofuels, biopower, and
bioproducts using biomass feedstocks at the pilot, demonstration, and full commercial scale.

Biomass Research and Development Initiative (BRDI) is specifically established to help
increase the availability of alternative renewable fuels and biobased products for diversifying
the nation's energy resources. Funding is provided through USDA's National Institute of Food
and Agriculture (NIFA) and DOE's Biomass Program. Section 9008(e)(3) of the Food
Conservation and Energy Act of 2008 provides direction and guidance on the technical areas
addressed by the BRDI. Grant recipients are required to contribute a minimum of 20% of
matching funds for research and development projects and 50% of matching funds for
demonstration projects. Recipients must pursue projects that integrate science and engineering
research in three areas: feedstocks development, biofuels and biobased products development,
and biofuels development analysis. In 2010, DOE reports having committed over $1 billion to
27 cost-shared biorefinery projects. Table 9 presents the recent allocations from BRDI.
Appendices 1 and 2 present an overview of the funded biorefinery projects.
Table nr 9: BRDI funding for research and development in biorefining
Amount of
funding in M$
Number of
projects
Average per
project M$
Purpose
2010 33 biofuels, bioenergy and high-
value biobased products
2011 47 8 5.9 same
2012 41 13 3.2 same
Biomass Crop Assistance Program (BCAP), created by the 2008 Farm Bill, is a primary
component of the domestic agriculture, energy, and environmental strategy to reduce U.S.
reliance on foreign oil, improve domestic energy security, reduce carbon pollution, and spur
rural economic development and job creation. BCAP provides incentives to farmers, ranchers,
and forest landowners to establish, cultivate, and harvest biomass for heat, power, bio-based
products, and biofuels. Many bioenergy crops need several years to become established.
Many bioenergy facilities need several years to reach commercial scale. BCAP serves as a
catalyst to unite these dynamics by reducing the financial risk for landowners who decide to
grow unconventional crops for these new markets.
With BCAP, crop producers and bioenergy facilities can team together to submit proposals to
USDA for selection as a BCAP project area. If selected, crop producers will be eligible for
reimbursements of up to 75% of the cost of establishing a bioenergy perennial crop. Producers
can receive up to 5 years of annual payments for herbaceous (non-woody) crops (annual or
perennial), and up to 15 years of annual payments for woody crops (annual or perennial).
Assistance for the collection, harvest, storage, and transportation of crops to facilities will be
available to each producer for 2 years in the form of a matching payment for up to $45 per ton
of the delivery cost. The BCAP Impact Statement estimates that by 2023, up to $88.5 billion
in economic activity and 700,000 jobs could be created.
Farm Bill tax credits and incentives from 2013 Federal budget:

1) Cellulosic biofuels producer tax credit. Under current law, facilities producing
cellulosic biofuel can claim a $1.01 per gallon production tax credit on fuel produced
before the end of 2012. This provision was created in the 2008 Farm Bill. The
provision would extend this production tax credit for one additional year, for cellulosic
biofuel produced through 2013. The proposal also expands the definition of qualified
cellulosic biofuel production to include algae-based fuel. This provision is estimated
to cost $59 million over ten years.
2) Incentives for biodiesel and renewable diesel. The bill extends for two years,
through 2013, the $1.00 per gallon tax credit for biodiesel, as well as the small agri-
biodiesel producer credit of 10 cents per gallon. The bill also extends the $1.00 per
gallon tax credit for diesel fuel created from biomass through 2013. This provision is
estimated to cost $2.181 billion over ten years.
The biodiesel tax incentive expired on Dec. 31, 2011. A recent study found that
the industry would have produced an additional 300 million gallons this year with the
tax incentive in place. That would have supported some 19,213 additional jobs, for a
total of 83,258 jobs supported by the industry nationwide, according to the study,
conducted by Cardno ENTRIX, an international economics consulting firm.
3) Cellulosic biofuels bonus depreciation. Under current law, facilities producing
cellulosic biofuel can expense 50 percent of their eligible capital costs in the first year
for facilities placed-in-service by the end of 2012. This provision was created in the
2008 Farm Bill. The provision would extend this bonus depreciation for one
additional year for facilities placed-in-service before the end of 2013. The proposal
also expands the definition of qualified cellulosic biofuel production to include algae-
based fuel. This provision is estimated to cost less than $500,000 over ten years.
In 2012, the Obama Administration proposed $998 million for the second year of a cross-
agency Science, Engineering, and Education for Sustainability initiative that will take an
integrated approach to furthering U.S. energy independence, enhancing environmental
stewardship, reducing energy and carbon intensity, and generating sustained economic
growth. In conjunction with this initiative, the Obama Administration proposed $576 million,
an increase of $209 million over the 2010 enacted level, for research—such as
nanotechnology and biotechnology—that will lead to breakthroughs in clean energy
technologies of the future.
There is also a support program for generating demand for biobased products: the Bio-
preferred program for public procurement. Federal agencies are required to give special
preference to BioPreferred products, as long as they meet the standards and cost effectiveness
measures of those agencies. Under the Federal procurement preference program, USDA
designates categories of biobased products. Federal agencies and their contractors are then
required to give preferential consideration to these designated product categories when
making purchases.

CONCLUSIONS
The number of companies applying biotechnology in the production or being fully dedicated
to biotechnology research and innovation is higher in the EU than in the US. The share of
dedicated R&D companies among the general firms using biotechnology varies greatly in
Europe, from 34% in Poland to 81% in Germany. It is, however, still likely that the average
share of dedicated biotechnology R&D firms is higher in Europe than in the US. However,
these firms tend to be smaller (not to mention underfunded) than their American counterparts.
The business sector funding of biotechnology R&D is significantly higher in the US
compared to Europe. In 2011, private sector firms in the US spent 17-22 billion dollars on
R&D. Since a lion’s share of this research takes place in dedicated biotechnology firms, we
can deduce that a US biotechnology company had almost 4 times more, i.e. $9.2 million at
their disposal for R&D compared to $2.4 million available for a European firm.
The shortage of research and innovation funding in Europe is somewhat compensated by
public sector efforts. There is little data available, but OECD figures seem to suggest that the
public sector support to biotechnology R&D in Europe actually exceeds the expenditures by
the firms themselves. This is in line with the general R&D funding trends in Europe where the
public sector provided 2.03% and the private sector 1.27% compared to GDP in 2011.
Nine out of 10 biotechnology companies in Europe have received some sort of public funding
either from the local, national, or EU level, whereas in most cases such funding is combined.
The biotech firms in Western, Northern, and Southern Europe receive significantly more
support than their counterparts in Central and Eastern Europe, where public funding from
local sources is almost non-existent, funding from central governments is lower, and the
general EU support reaches only 24% of such firms compared to 50% in Southern Europe.
The penetration rate (63%) of EU research and technological development funding is high.
Large biotech companies and companies located in Western and Northern Europe have been
most successful in obtaining funding from 5th
and 6th
framework programs.
There is a discrepancy between the public research funding offer both at the national and EU
level and the needs of the industry. Public research funding for bulk agricultural products and
for food and feed industries exceeds the needs of these sectors. At the same time, bio-based
polymers and materials seem to remain outside of public funders radar screen. Bio-inspired
materials and textiles receive much less compared to their needs and growth potential. These
claims from European industries are supported by the OECD 2011 overview of the Industrial
Biotechnology development which states that there is a serious mismatch between the level of
investment in industrial biotechnology R&D and the potential market opportunities for the
sector.
Europe has large untapped reserves of biomass and biowaste. Domestically available biomass
could satisfy a much larger share of Europe’s energy needs as well as provide raw material to
the processing industry than the Member States national plans currently capture. More than
half of the oil that Europe currently consumes could be replaced by biomass derived fuels and
products. This underutilization of biological renewable resources is largely due to the pre-

commercial stage of technology for efficient conversion of feedstocks such as wastes and
various lingo-cellulosic materials. Additional difficulties arise from the lack of logistical
supply chains of biomass and first level processing facilities.
The US, European Union, and China all have successful – in terms of creating substantial
production quantities in the 1st generation biofuels – policies in place promoting biofuel
production and consumption. Now the policies and attention are shifting away from food
crops based biofuels towards 2nd
generation ones and the policies along with support schemes
are being revisited.
The US Federal level support to R&D in industrial biotechnology through the BRDI program
is comparable in its size and focus to the EU FP7 funding over the last years, but Europe has
nothing comparable to the 19 integrated biorefinery projects that received $564 million
(average $29.7 million per project) from the American Recovery and Reinvestment Act in
2009 with the aim of accelerating the construction and operation of pilot, demonstration, and
commercial scale facilities. Besides this massive stimulus, the US DOE claims to have
already invested about $1 billion in biorefinery development.
Another difference between the EU and the US support to biorefining lies in the extent of
synergies between energy and farm policies and the attention given to biomaterials other than
biofuels. The USDA and DOE collaborate on their support to biorefining and have therefore
provided joint financing to projects in order to create economically viable integrated
biorefineries. Recipients must pursue projects that integrate science and engineering research
in three areas: feedstocks development, biofuels and biobased products development, and
biofuels development analysis. Although the earlier US biofuels programs may have
neglected biobased materials, in recent years the biobased products have always figured
among the expected results of federal funding. In Europe, the policies and funding for energy,
agriculture, and R&D still tend to remain separated and pursue their specific mandates, thus
undermining the opportunities for greater synergies. The 2012 European Bioeconomy
Strategy and the future R&D program Horizon may help overcome this fragmentation.
There is further significant difference between the US Farm policy and the EU CAP: the
former has specific incentives in place for non-food biomass cultivation and collection as well
as for forming first-level processing capacities, the latter does not.
Europe has developed the first commercially viable lignocellulosic technologies based on
agricultural residues and wood, which now need substantial funding from public and private
sources for further fine-tuning and spreading of the technologies to bring down costs and
increase performance reliability. In parallel, other technological paths are being pursued for
conversion technologies needed for other types of raw materials, particularly marine biomass
and various types of wastes. Significant funding is needed for the construction of pilot plants
and first commercial biorefineries. The possible future public-private partnership, BRIDGE,
for developing sustainable biorefineries in Europe can play a crucial role in bringing Europe
up to speed with its main competitors.

BIBLIOGRAPHY
1. American Recovery and Reinvestment Act subsidies for biorefineries:
http://www1.eere.energy.gov/biomass/recovery.html
http://www.eia.gov/cneaf/solar.renewables/page/biomass/biomass.gif
2. Baxter, David, European Commission Joint Research Center. 2012. Biomethane as
transport fuel in Europe. In the journal: Be Sustainable. The magazine of bioenergy and
bioeconomy. Published by ETA-Florence Renewable Energies.
3. Beta Renewables. World’s first commercial-scale cellulosic ethanol plant uses the
PROESA process. http://www.betarenewables.com/Crescentino.html
4. Biomass Crop Assistance Program
http://www.fsa.usda.gov/FSA/newsReleases?area=newsroom&subject=landing&topic=pf
s&newstype=prfactsheet&type=detail&item=pf_20110503_energ_en_bcap1.html
5. Bloomberg New Energy Finance. April 2011. Bioproducts: diversifying farmers’ income.
How a bioproduct industry will affect the EU27 agricultural sector.
6. Bloomberg New Energy Finance. January 2012. Next-generation bioproducts:
opportunities in Central and Eastern Europe.
7. BRIDGE Public Private Partnership under establishment – website http://bridge2020.eu/
8. Borregaard. April 16, 2013. Official Inauguration of Borregaard's Biorefinery
Demonstration Plant http://www.borregaard.com/News/Official-Inauguration-of-
Borregaard-s-Biorefinery-Demonstration-Plant
9. Chancellor inaugurates Leuna biorefinery centre
http://www.biotechnologie.de/BIO/Navigation/EN/news,did=156186.html?listBlId=77908
&
10. Chempolis, Henan Yinge JV for new biorefinery in China
http://www.biofuelsdigest.com/bdigest/2011/01/24/chempolis-henan-yinge-jv-for-new-
biorefinery-in-china/
11. Chiaramonti, David and Giovannini, Arianna. 2012. Reeds will help us meet our energy
needs. In the journal: Be Sustainable. The magazine of bioenergy and bioeconomy.
Published by ETA-Florence Renewable Energies.
12. Goodall, Chris for Biome Bioplastics. 2011. Bioplastics: an important component of
global sustainability.
http://www.borregaard.com/News/Official-Inauguration-of-Borregaard-s-Biorefinery-Demonstration-Plant

13. Elbersen, B. et al. Sustainable Biomass Supply in EU. 2012. In the journal: Be
Sustainable. The magazine of bioenergy and bioeconomy. Published by ETA-Florence
Renewable Energies. Check also project website: www.biomassfutures.eu
14. Enzing, C. (Technopolis Group). December 2011. Sectoral Innovation Watch.
Biotechnology Sector.
15. EuropaBio and Ernst&Young. 2012. What Europe has to offer biotechnology companies.
Unraveling the tax, financial and regulatory framework.
16. European Commission, DG Agriculture and Rural Development website section on
biomass and biofuels support http://ec.europa.eu/agriculture/bioenergy/cap/index_en.htm
17. European Commission, DG Energy website section on biofuels
http://ec.europa.eu/energy/renewables/biofuels/biofuels_en.htm
18. FAO. 2008. The State of Food and Agriculture. Biofuels: prospects, risks and
opportunities.
19. OECD. 2011. Industrial Biotechnology and Climate Change. Opportunities and
Challenges.
20. OECD. December 2012. Key Biotech Indicators. Last updated in December 2012.
Available at http://www.oecd.org/innovation/inno/keybiotechnologyindicators.htm#
21. Retka Schill, Susanne. March 5, 2013. Beta Renewables CEO declares cellulosic ethanol
now ready. Ethanol Producer Magazine
http://www.ethanolproducer.com/articles/9624/beta-renewables-ceo-declares-cellulosic-
ethanol-now-ready
22. Star-COLIBRI. Joint European Biorefinery Vision for 2030. Strategic Targets for 2020 –
Collaboration Initiative on Biorefineries. 2011.
23. International Energy Agency. European Union Energy balance. Online database:
http://www.iea.org/stats/balancetable.asp?COUNTRY_CODE=30
24. International Energy Agency. Biofuels. http://www.iea.org/topics/biofuels/
25. International Energy Agency. 2010. Sustainable production of second-generation biofuels.
Potential and perspectives in major economies and developing countries.
26. Tan, Tianwei. College of life science and technology Beijing University of Chemical
Technology. 2008. Biorefinery in China. Online:
http://www.esf.edu/biorefineries/2009/documents/TianweiTan.pdf

27. WEF, World Economic Forum. 2012. Industry Partnership Meeting for Chemicals.
Platform for Biorefineries, Biotechnology and Bioenergy Collaboration throughout the
Value Network in China.
28. WWF. 2009. More Than Green Fuel in a Dirty Economy.
http://www.europabio.org/sites/default/files/report/industrial_biotechnology_-
_more_than_green_fuel_in_a_dirty_economy.pdf
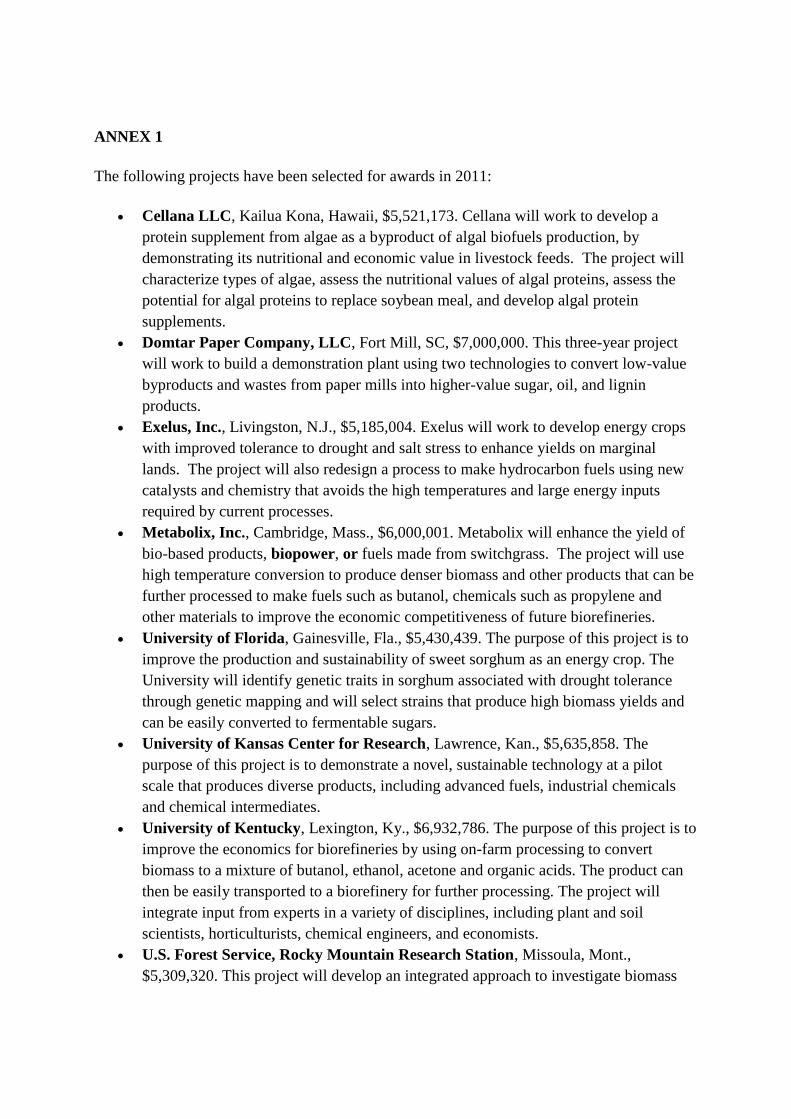
ANNEX 1
The following projects have been selected for awards in 2011:
Cellana LLC, Kailua Kona, Hawaii, $5,521,173. Cellana will work to develop a
protein supplement from algae as a byproduct of algal biofuels production, by
demonstrating its nutritional and economic value in livestock feeds. The project will
characterize types of algae, assess the nutritional values of algal proteins, assess the
potential for algal proteins to replace soybean meal, and develop algal protein
supplements.
Domtar Paper Company, LLC, Fort Mill, SC, $7,000,000. This three-year project
will work to build a demonstration plant using two technologies to convert low-value
byproducts and wastes from paper mills into higher-value sugar, oil, and lignin
products.
Exelus, Inc., Livingston, N.J., $5,185,004. Exelus will work to develop energy crops
with improved tolerance to drought and salt stress to enhance yields on marginal
lands. The project will also redesign a process to make hydrocarbon fuels using new
catalysts and chemistry that avoids the high temperatures and large energy inputs
required by current processes.
Metabolix, Inc., Cambridge, Mass., $6,000,001. Metabolix will enhance the yield of
bio-based products, biopower, or fuels made from switchgrass. The project will use
high temperature conversion to produce denser biomass and other products that can be
further processed to make fuels such as butanol, chemicals such as propylene and
other materials to improve the economic competitiveness of future biorefineries.
University of Florida, Gainesville, Fla., $5,430,439. The purpose of this project is to
improve the production and sustainability of sweet sorghum as an energy crop. The
University will identify genetic traits in sorghum associated with drought tolerance
through genetic mapping and will select strains that produce high biomass yields and
can be easily converted to fermentable sugars.
University of Kansas Center for Research, Lawrence, Kan., $5,635,858. The
purpose of this project is to demonstrate a novel, sustainable technology at a pilot
scale that produces diverse products, including advanced fuels, industrial chemicals
and chemical intermediates.
University of Kentucky, Lexington, Ky., $6,932,786. The purpose of this project is to
improve the economics for biorefineries by using on-farm processing to convert
biomass to a mixture of butanol, ethanol, acetone and organic acids. The product can
then be easily transported to a biorefinery for further processing. The project will
integrate input from experts in a variety of disciplines, including plant and soil
scientists, horticulturists, chemical engineers, and economists.
U.S. Forest Service, Rocky Mountain Research Station, Missoula, Mont.,
$5,309,320. This project will develop an integrated approach to investigate biomass

feedstock production, logistics, conversion, distribution and end use centered on using
advanced conversion technologies at existing forest industry facilities.
2012 awarded projects include:
Quad County Corn Cooperative ($4.25 million – Galva, Iowa). This project will
retrofit an existing corn starch ethanol plant to add value to its byproducts, which will
be marketed to the non-ruminant feed markets and to the biodiesel industry. This
project enables creation of diverse product streams from this facility, opening new
markets for the cooperative and contributing to the U.S. Environmental Protection
Agency’s goals for cellulosic ethanol production and use.
Agricultural Research Service’s National Center for Agricultural Utilization
Research ($7 million - Peoria, Illinois). This project will optimize rapeseed/canola,
mustard and camelina oilseed crops for oil quality and yield using recombinant inbred
lines. Remote sensing and crop modeling will enhance production strategies to
incorporate these crops into existing agricultural systems across four ecoregions in the
Western United States. The oils will be hydrotreated to produce diesel and jet fuel.
Cooper Tire & Rubber Co. ($6.85 million - Findlay, Ohio). Guayule is a hardwood
perennial natural rubber-producing shrub grown in the semi-arid southwestern United
States. This project will optimize production and quality of guayule rubber using
genomic sequencing and development of molecular markers. The extracted rubber will
be used in tire formulations, and the remaining plant residue will be evaluated for use
in biopower and for conversion to jet fuel precursors.
University of Wisconsin ($7 million - Madison, Wisconsin).This project will utilize
dairy manure as a source of fiber and fertilizer. Fiber will be converted to ethanol,
manure used for fertilizer, and oil from the crops will be converted to biodiesel used in
farm equipment. The project goal is to develop closed-loop systems with new product
streams that benefit the environment.
University of Hawaii ($6 million - Manoa, Hawaii). This project will optimize the
production of grasses in Hawaii, including napier grass, energycane, sugarcane and
sweet sorghum. Harvest and preprocessing will be optimized to be compatible with the
biochemical conversion to jet fuel and diesel.
Grantee Non‐Fed Amount Project Location (City)

ANNEX 2