Biotech in Europe: Scaling Innovation
111
CONFIDENTIAL AND PROPRIETARY Any use of this material without specific permission of McKinsey & Company is strictly prohibited Barcelona, May 20-21 2019 McKinsey report | Bio€quity Europe conference Biotech in Europe: Scaling Innovation
Transcript of Biotech in Europe: Scaling Innovation

CONFIDENTIAL AND PROPRIETARYAny use of this material without specific permission of McKinsey & Company is strictly prohibited
Barcelona, May 20-21 2019
McKinsey report | Bio€quity Europe conference
Biotech in Europe: Scaling Innovation
McKinsey & Company 2
Biotech in Europe: Scaling innovationExecutive summary
Introduction
Biotech is entering its next S-curve of growth, as the industry moves into the next decade. Gene therapies, stem cell treatments, antisense, siRNA and CAR-T are just some of today’s driving forces. Even more innovative science and technology is on the horizon.
Across a fragmented landscape, the maturing biotech space in Europe needs to achieve greater scale in the innovation it is creating, and deliver on the promise of the golden age of biotech.
In this context, this report investigates the path forward for the region, and we attempt to answer three fundamental questions:
1. What makes the European biotech space uniquely attractive?
2. What financing is required to fuel growth?
3. Looking forward, how can biotech leaders and investors succeed?
1. What makes the European biotech space uniquely attractive?
Hotspots, across a fragmented landscape. The biotech landscape in Europe is complex. Hundreds of companies, multiple countries, different paths toinnovation and financing and, of course, different geographies. To “see” through the complexity, ~1000 European biotech companies were identifiedand naturally clustered with a purpose-built methodology. This clusteringallowed for the mapping of biotech hotspots, in terms of geography,modalities and therapeutic areas clusters. This mapping reveals trending hotspot shifts, across the region, over time. It provides insight into thedirection the industry is taking in the future. For example, the UK has been disproportionately accelerating across technologies and disease areas, becoming home to 35% of all new biotechs since 2012. In fact, the trend of Europe moving at “two speeds” is accelerating. While “Service provision” still represents the largest modality focus in most countries, Cell and Gene Therapy (CGT) and mmunotherapies are the fastest growing – now close toone third of companies absorbing 40% of investment. In turn,
Oncology and CNS absorbing about half of the investment overth period.
World-class science and innovation in Europe. Europe is home to 32% of the top 50 life sciences universities, and holds a similar level of publication in top 10 journals vs. the US. Its leadership in science development means it leads both the US and China in terms of publications. Publication topics of focus are largely similar across regions. However, that innovation
McKinsey & Company 3
Biotech in Europe: Scaling innovationExecutive summary (continued)
strength does not yet translate fully to patents or new medicines. For example, in terms of patent origination, the US and, more recently China are 3x to 9x more productive respectively. Further down the innovation chain, European biotechs have contributed 13% of biotech-originated FDA new drug approvals in 2017-18, which is 6 lower than those from USbiotechs. Looking forward, however, there is potential: European biotechs overall benefit from 5 less investment versus US counterparts andshow more promise in emerging topics, driving 32% of all projects in Ph3or registration for products based on technology such as antisense, viral vectors, or siRNA. On an indexed base, we estimate Early Innovation (based on publications and patents) to be 0.73 versus the US, while Late Innovation (based on drug approvals and innovative candidates) is down to 0.41.
Top innovation & talent. Biotech experts, from Europe and beyond, consider the overall level of innovation and the quality of R&D talent inEurope very high, close to US levels and well above China. However, on such scaled assessment, there is a perceived limitation in the availability of specific profiles and the ability to attract and retain it. There is a perceived lack of both biotech-specific experience and entrepreneurial spirit around the biotech ecosystem in Europe. That adds to the challenge of financing.
2. Is financing where it need to be?
“Good value” for European biotechs. The average deal size has grown to~USD 165m average in 2018. While still around 40% lower than the higher-priced US deals, this represents a growth of 20% per annum since 2012. Inaddition, the return profile in Europe has a somewhat advantageous shape. Pre-money valuations are ~30% lower than in the US and the operational costlevels are often lower (estimated 60% of US cost in terms of structure or talent).
Financing for European biotechs is maturing. Available venture capital isestimated to have tripled to USD 2.3 bn in 2018. In the last seven years, stronger European VC funds have emerged and have doubled in average size. Most experts agree that sufficient financing is now available for early-stage private venture rounds. As business models evolve in the region, deal types are diversifying beyond pure licensing, now 35% of deals in 2018 versus up to 80% in 2012. While there is growing appetite to build late-stage plays, especially when focused on niche therapies, the US still holds a higher number of deals with higher mean value (Europe is 42% lower). This is driven by the stronger focus on business acquisitions and direct investment inthe US.
The (late-stage) financing gap v the US remains, and continues to grow.Despite the positive dynamic , the private venture financing gap versus USbiotechs is growing and now stands at almost 5 . This gap is especiallynotable when raising larger amounts in late-stage rivate venture financing
McKinsey & Company 4
Biotech in Europe: Scaling innovationExecutive summary (continued)
rounds or on public markets. This is exacerbated at country level, asthe ratios between early and late financing are highly variable acrossEurope. On public markets, IPOs are 3 larger on Nasdaq than onEuropean ex ges. As a result, European biotechs increasingly look tothe US for their growth capital: almost 30% of private venture investmentnow originates from the US, and since 2012 almost one in three Europeanbiotechs filing for an IPO have done so directly on US exchanges onsimilar terms to their US counterparts. In addition, over 95 % of total follow-on offerings by European biotechs have been on US exchanges, not European ones. Looking east, few European biotechs appear equipped toexplore investment in and from China, despite an increase in the appetite of those investors for Europe for the next 2-3 years.
3. Looking forward: How can leaders and investors succeed?
Overall, Europe remains an opportunity as a less mature biotech ecosystem than the one found in the US. Despite the increasing financing gap, attractive opportunities await those who focus on cultivating them. Europe has strong innovation fundamentals, and talent pools. It is less ‘over-fished’ than the US, while boasting access to sufficient early-stagefinancing. It has strong signs of success and “doing more with less”. To capitali e, biotech leaders and investors need to excel in 3 dimensions:
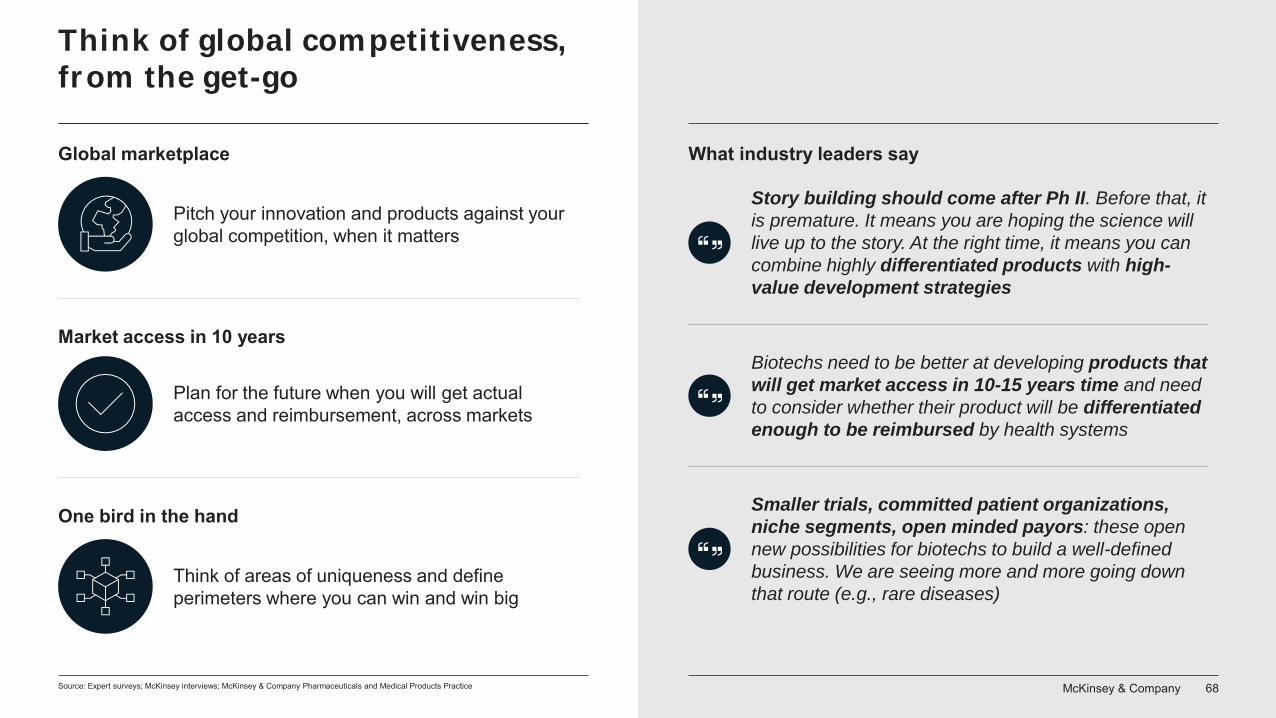
Think global and build global competitiveness. Developdifferentiated and globally competitive products to secure marketaccess in an evolving ‘future state’. Focus on defined perimeters towin big.
Prepare for success. Carefully stage when/how exactly to go tofinancial markets. Attract entrepreneurial and biotech experience,credibility, non-Europe exposure and networks. Be flexible in workingwith talent
From the East to the West. Adopt a clear path to US financing early-on. Build a board and syndicates geared to larger private rounds anda potential IPO. As Chinese investor sentiment turns, look ast forraising capital and forming partnerships.

McKinsey & Company 5MMMMMMMMccccMMMMMMMMMMMMMMMMccMMMMMMMMcMMMMMMMMMcMMMMMMcMMcMcMMMMMcMMMMMMMMMMMMMMMMMMMMMMMMMMMMMMMMMMMMMMccKiKKiKiKiiiiiinnnnnnnnnnnnnsnssnsnsnssnsnnssssnnnnnsnsnnnnsnsnsnnnnssnsssssnnnsssnsssnnsssssssssnssseeeeeeeyeyeyeyeyyyyyyeeyeeeeeeeeeeyyeeeeeeeeeeeeeyeeyeeeeeeeeyyeeyeeeeeeeeeyeeeee &&&& CCCCCCCCCCCCCCCCCCCCCCCCCCCCCCComomomomomomomomomommommmmmmomoomomommommmommmomooomooomommmommmmmmooo papapapappp nynnynynynynnnynynnnnnynnnnnnnnnnnnnnnnnnnnnnnnnnnyynnnnnnnnnnnnnnnnnnnynnnnnnnnnnynnnnnnnynnnnynnnnnnnynnnnnnnnnnnnnnnnn 555555555555555555555555555555555555555555555555555555555555555
Three questions on scaling Biotech Innovation in Europe
01
What makes the European biotech space
uniquely attractive?
03
Looking forward: How can leaders and investors succeed?
02
Is financing where it needs to be?
McKinsey & Company 6
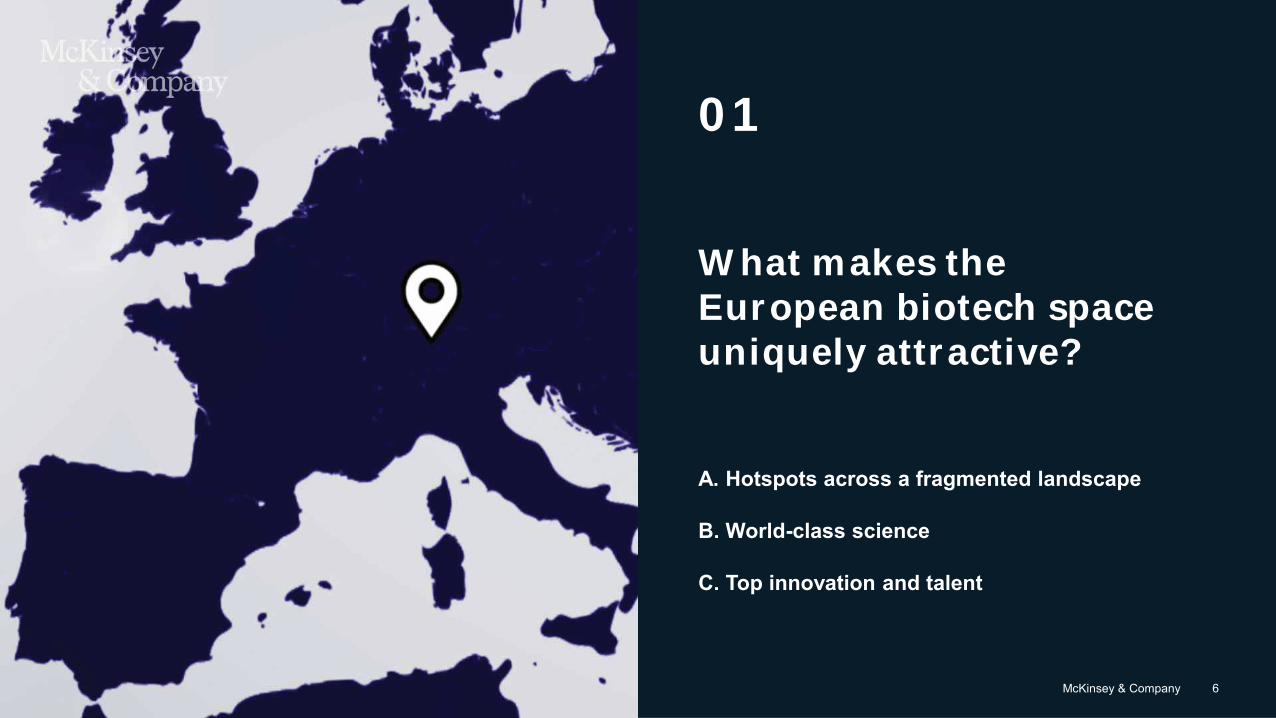
What makes the European biotech space uniquely attractive?
A. Hotspots across a fragmented landscape
B. World-class science
C. Top innovation and talent
01
McKinsey & Company 7
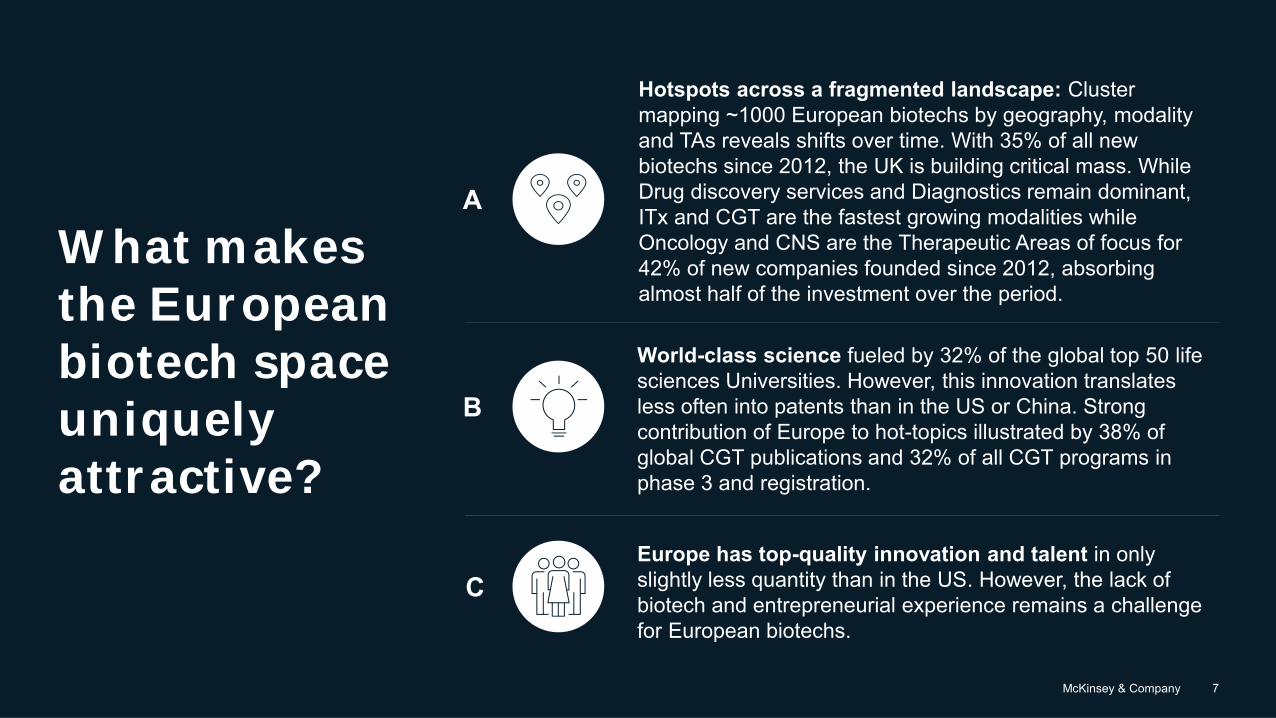
What makes the European biotech space uniquely attractive?
B
World-class science fueled by 32% of the global top 50 life sciences Universities. However, this innovation translates less often into patents than in the US or China. Strong contribution of Europe to hot-topics illustrated by 38% of global CGT publications and 32% of all CGT programs in phase 3 and registration.
CEurope has top-quality innovation and talent in only slightly less quantity than in the US. However, the lack of biotech and entrepreneurial experience remains a challenge for European biotechs.
A
Hotspots across a fragmented landscape: Cluster mapping ~1000 European biotechs by geography, modality and TAs reveals shifts over time. With 35% of all new biotechs since 2012, the UK is building critical mass. While Drug discovery services and Diagnostics remain dominant, ITx and CGT are the fastest growing modalities while Oncology and CNS are the Therapeutic Areas of focus for 42% of new companies founded since 2012, absorbing almost half of the investment over the period.
McKinsey & Company 8
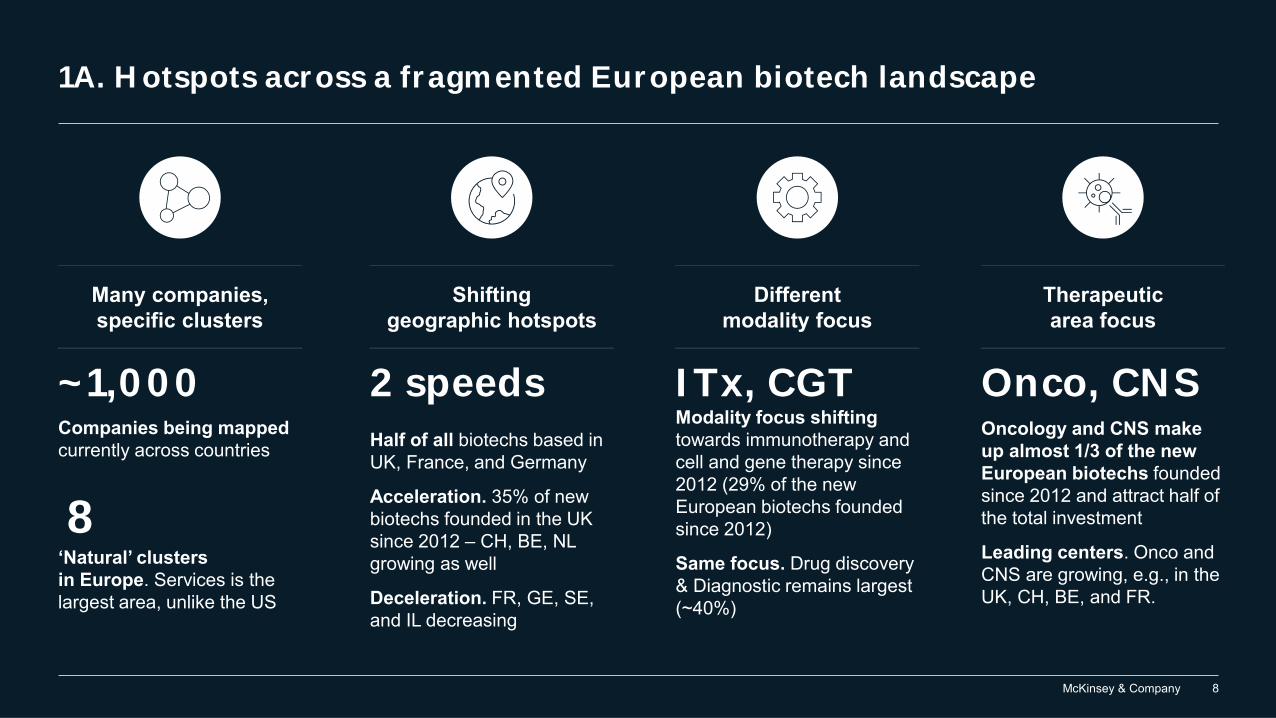
1A. Hotspots across a fragmented European biotech landscape
2 speeds
Shifting geographic hotspots
Half of all biotechs based in UK, France, and Germany
Acceleration. 35% of new biotechs founded in the UK since 2012 – CH, BE, NL growing as well
Deceleration. FR, GE, SE, and IL decreasing
~1,000
Many companies, specific clusters
8
Companies being mappedcurrently across countries
‘Natural’ clusters in Europe. Services is the largest area, unlike the US
Modality focus shifting towards immunotherapy and cell and gene therapy since 2012 (29% of the new European biotechs founded since 2012)
Same focus. Drug discovery & Diagnostic remains largest (~40%)
ITx, CGT
Different modality focus
Therapeutic area focus
Onco, CNSOncology and CNS make up almost 1/3 of the new European biotechs founded since 2012 and attract half of the total investment
Leading centers. Onco and CNS are growing, e.g., in the UK, CH, BE, and FR.
McKinsey & Company 9
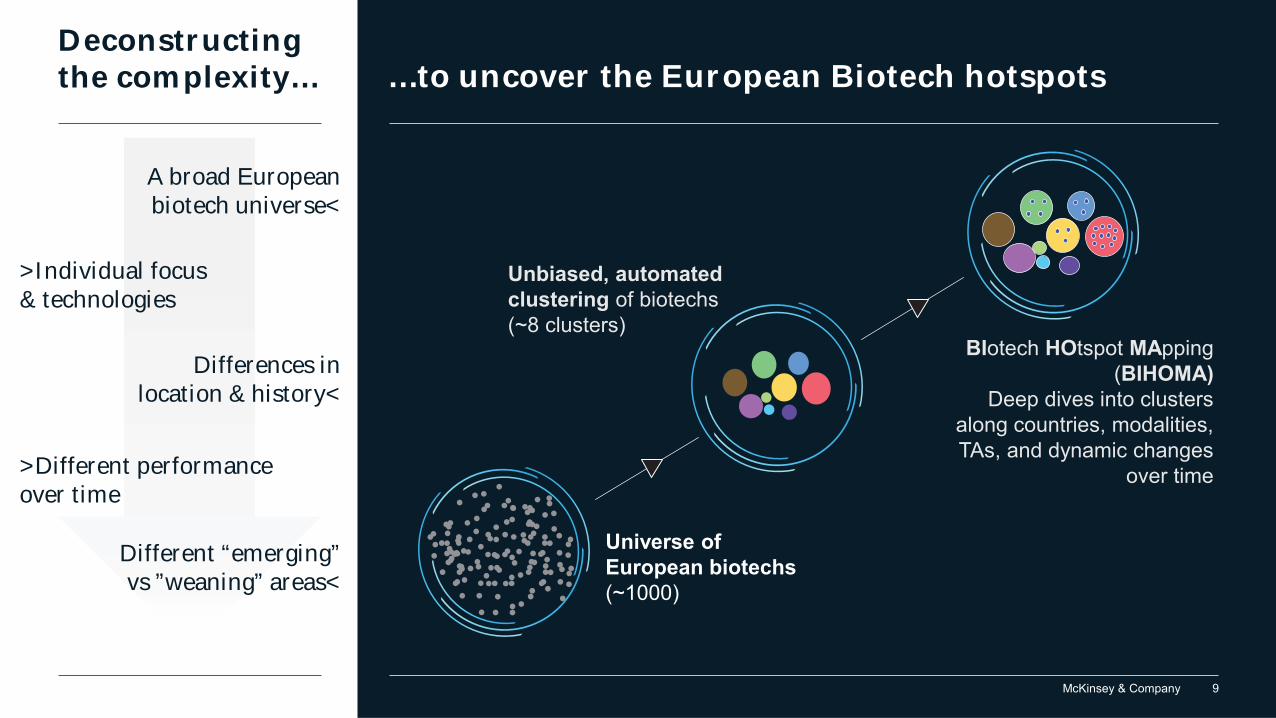
Deconstructing the complexity… …to uncover the European Biotech hotspots
A broad European biotech universe<
>Individual focus& technologies
Differences in location & history<
>Different performanceover time
Different “emerging” vs ”weaning” areas<
Universe of European biotechs (~1000)
Unbiased, automated clustering of biotechs (~8 clusters)
BIotech HOtspot MApping(BIHOMA)
Deep dives into clusters along countries, modalities, TAs, and dynamic changes
over time
McKinsey & Company 10Source: Startup and Investment Landscape Analytics, Pitchbook February 2019, BCIQ February/March 2019
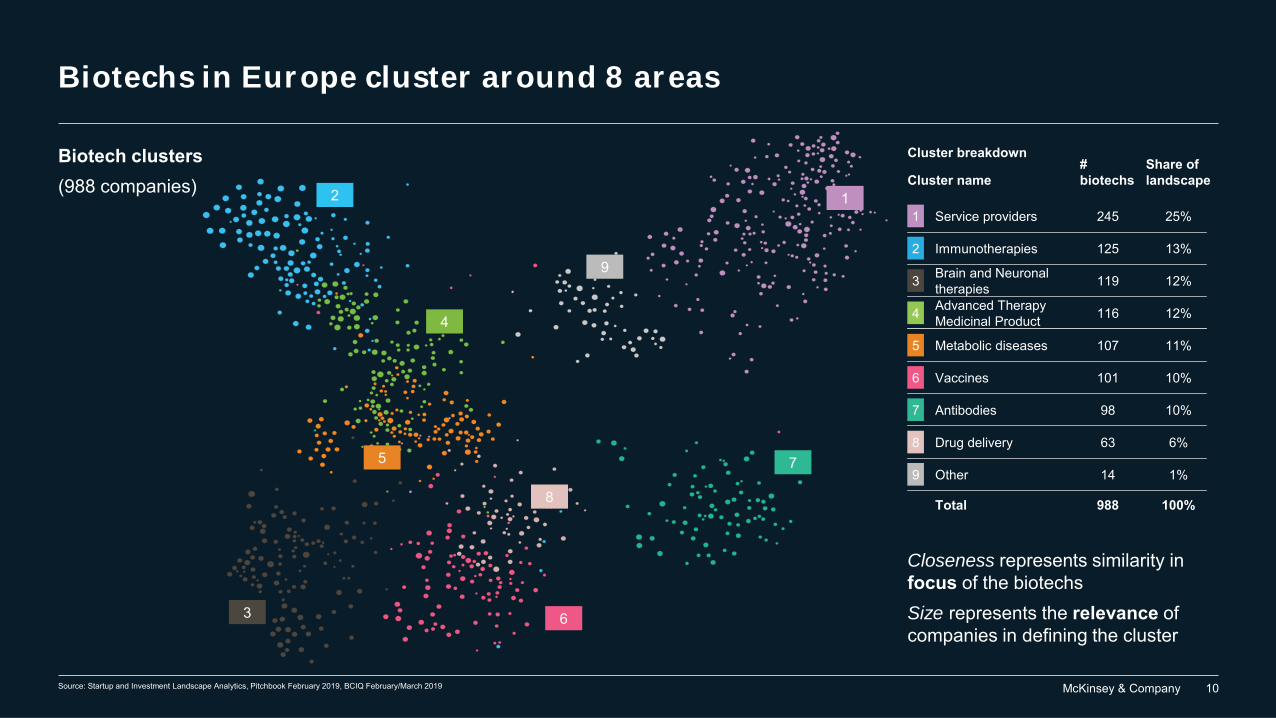
Biotech clusters (988 companies)
Closeness represents similarity in focus of the biotechsSize represents the relevance of companies in defining the cluster
Cluster breakdown
4 Advanced Therapy Medicinal Product 116 12%
5 Metabolic diseases 107 11%
6 Vaccines 101 10%
Total 988 100%
7 Antibodies 98 10%
8 Drug delivery 63 6%
9 Other 14 1%
3 Brain and Neuronal therapies 119 12%
2 Immunotherapies 125 13%
Service providers 245 25%1
# biotechs
Share of landscapeCluster name
Biotechs in Europe cluster around 8 areas
4
75
1
3 6
2
8
9
McKinsey & Company 11
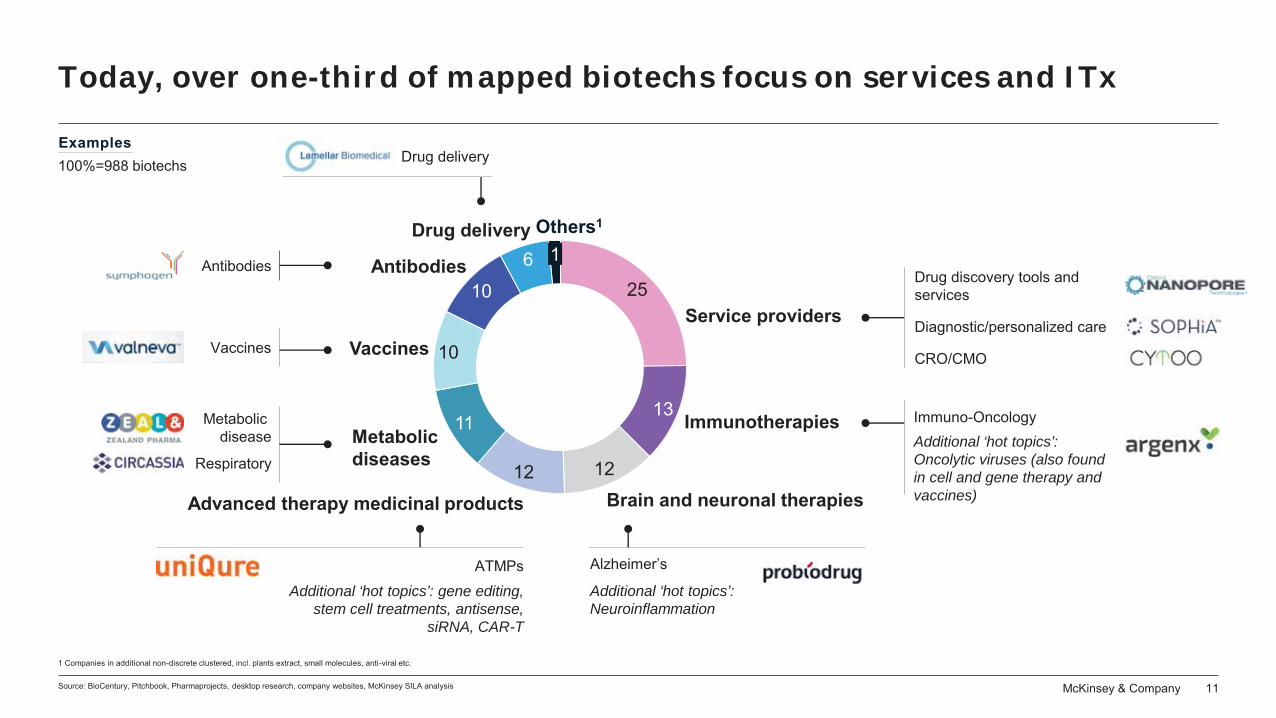
Drug delivery
25
13
1212
11
10
106
Drug delivery
Metabolic diseases
Advanced therapy medicinal products
Service providers
Others1
Immunotherapies
Brain and neuronal therapies
Vaccines
Antibodies 1
Today, over one-third of mapped biotechs focus on services and ITx
Source: BioCentury, Pitchbook, Pharmaprojects, desktop research, company websites, McKinsey SILA analysis
1 Companies in additional non-discrete clustered, incl. plants extract, small molecules, anti-viral etc.
Vaccines
Antibodies
Metabolic disease
Respiratory
ATMPsAdditional ‘hot topics’: gene editing,
stem cell treatments, antisense, siRNA, CAR-T
Alzheimer’s
Additional ‘hot topics’: Neuroinflammation
Diagnostic/personalized care
Drug discovery tools and services
CRO/CMO
Immuno-OncologyAdditional ‘hot topics’: Oncolytic viruses (also found in cell and gene therapy and vaccines)
Examples100%=988 biotechs
McKinsey & Company 12
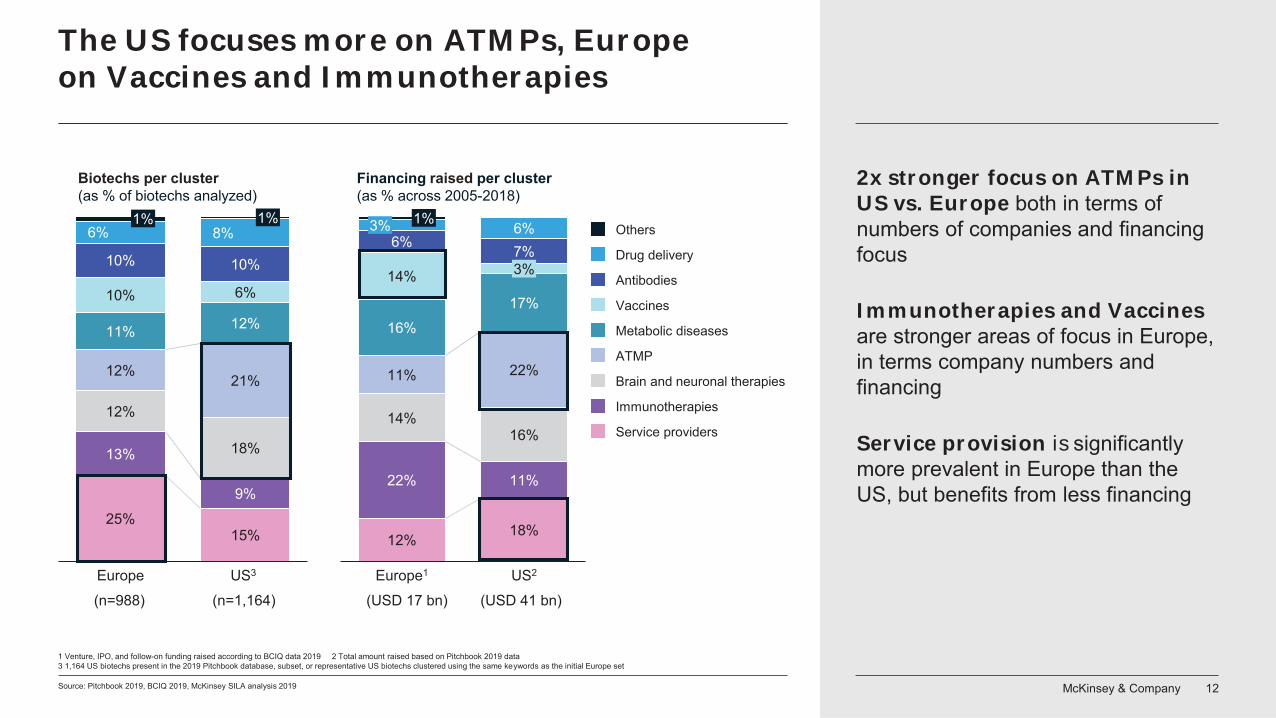
The US focuses more on ATMPs, Europeon Vaccines and Immunotherapies
Source: Pitchbook 2019, BCIQ 2019, McKinsey SILA analysis 2019
25%15%
13%
9%
12%
18%
12%21%
11% 12%
10% 6%
10% 10%
6% 8%1%
Biotechs per cluster(as % of biotechs analyzed)
1%
US3Europe
Vaccines
Others
Drug delivery
Antibodies
Metabolic diseases
ATMP
Brain and neuronal therapies
Immunotherapies
Service providers
12% 18%
22% 11%
14%16%
11% 22%
16%17%
14%
6% 7%6%
3%
Financing raised per cluster(as % across 2005-2018)
US2
3% 1%
Europe1
(n=988) (n=1,164) (USD 17 bn) (USD 41 bn)
1 Venture, IPO, and follow-on funding raised according to BCIQ data 2019 2 Total amount raised based on Pitchbook 2019 data 3 1,164 US biotechs present in the 2019 Pitchbook database, subset, or representative US biotechs clustered using the same keywords as the initial Europe set
2x stronger focus on ATMPs in US vs. Europe both in terms of numbers of companies and financing focus
Immunotherapies and Vaccines are stronger areas of focus in Europe, in terms company numbers and financing
Service provision is significantly more prevalent in Europe than the US, but benefits from less financing
McKinsey & Company 13McKinsey & Company 13
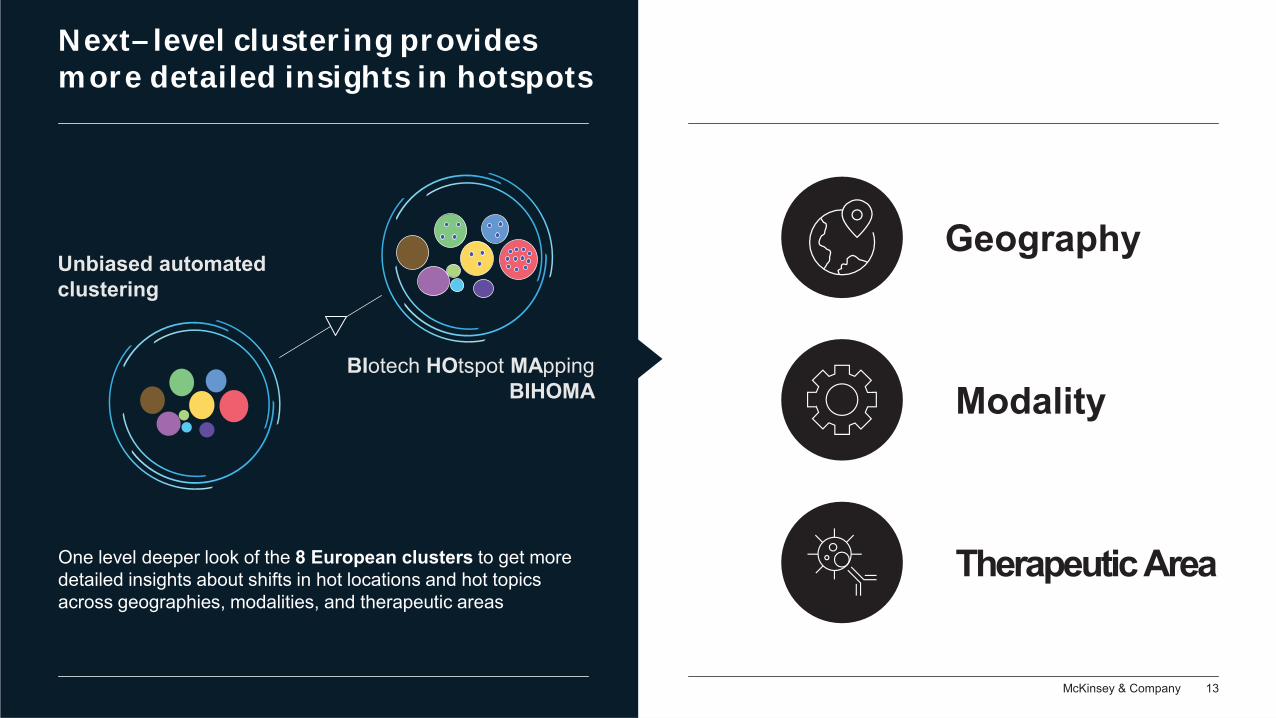
Next–level clustering provides more detailed insights in hotspots
One level deeper look of the 8 European clusters to get more detailed insights about shifts in hot locations and hot topics across geographies, modalities, and therapeutic areas
Modality
Geography
T A
Unbiased automated clustering
BIotech HOtspot MAppingBIHOMA
McKinsey & Company 14
10.3 12.2 9.9 11.8 9.9 8.030.5 5.7 1.5
23.2 13.4 9.8 13.4 15.2 12.5 6.3 3.6 2.7
30.6 15.3 9.2 9.2 8.2 9.2 7.1
13.1 16.7 15.5
11.2
7.1 8.3 14.3 15.5 8.3 1.2
20.7 8.5 15.9 7.3 12.2 12.2 9.8 11.0 2.4
21.1 6.6 21.1 13.2 7.9 7.9 11.8 7.9 2.6
27.5 11.6 5.8 21.7 8.7 2.9 15.9 5.8
10.5 21.1 5.3 15.8 13.2 10.5 15.8 2.6 5.3
29.7 13.5 8.1 13.5 13.5 8.1 10.8 2.7
32.1 10.7 14.3 7.1 7.1 14.3 7.1 7.1
19.0 47.6 4.8 14.3 9.5 4.8
22.7 9.1 9.1 9.1 13.6 13.6 9.1 13.6
17.6 5.9 5.9 23.5 23.5 11.8 11.8
26.7 13.3 20.0 6.7 13.3 13.3 6.7
7.1 14.3 28.6 7.1 7.1 28.6 7.1
50.0 25.0 25.0
2.7 3.2 2.6 3.1 2.6 2.18.1 1.5 0.4
2.6 1.5 1.1 1.5 1.7 1.4 0.7 0.4 0.3
3.0 1.5 0.9 0.9 0.8 0.9 0.7
1.1 1.4 1.3
1.1
0.6 0.7 1.2 1.3 0.7 0.1
1.7 0.7 1.3 0.6 1.0 1.0 0.8 0.9 0.2
1.6 0.5 1.6 1.0 0.6 0.6 0.9 0.6 0.2
1.9 0.8 0.4 1.5 0.6 0.2 1.1 0.4
0.4 0.8 0.2 0.6 0.5 0.4 0.6 0.1 0.2
1.1 0.5 0.3 0.5 0.5 0.3 0.4 0.1
0.9 0.3 0.4 0.2 0.2 0.4 0.2 0.2
0.4 1.0 0.1 0.3 0.2 0.1
0.5 0.2 0.2 0.2 0.3 0.3 0.2 0.3
0.3 0.1 0.1 0.4 0.4 0.2 0.2
0.4 0.2 0.3 0.1 0.2 0.2 0.1
0.1 0.2 0.4 0.1 0.1 0.4 0.1
0.2 0.1 0.1
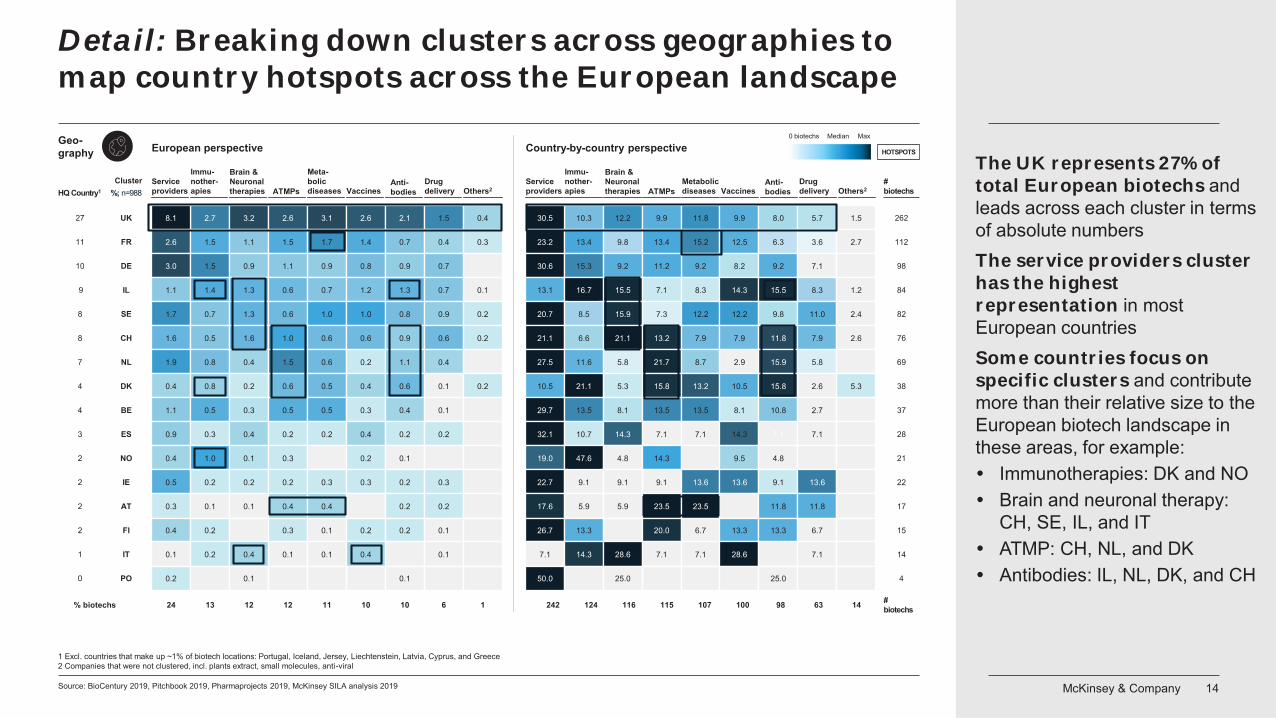
Detail: Breaking down clusters across geographies to map country hotspots across the European landscape
Source: BioCentury 2019, Pitchbook 2019, Pharmaprojects 2019, McKinsey SILA analysis 2019
Cluster
HOTSPOTS
Immu-nother-apies ATMPs
Brain & Neuronal therapies
Meta-bolicdiseases Vaccines
Anti-bodies
Drug delivery Others2
Service providers
Immu-nother-apies
Metabolic diseases Vaccines
Anti-bodies
Drug delivery Others2
Service providers
Country-by-country perspective
HQ Country1
27
11
10
9
8
8
7
4
4
3
2
2
2
2
1
0
%; n=988
UK
FR
DE
IL
SE
CH
NL
DK
BE
ES
NO
IE
AT
FI
IT
PO
24 13 12 12 11 10 10 6 1
European perspective
% biotechs 242 124 116 115 107 100 98 63 14 #biotechs
1 Excl. countries that make up ~1% of biotech locations: Portugal, Iceland, Jersey, Liechtenstein, Latvia, Cyprus, and Greece2 Companies that were not clustered, incl. plants extract, small molecules, anti-viral
#biotechs
262
112
98
84
82
76
69
38
37
28
21
22
17
15
14
4
Max0 biotechs MedianGeo-graphy
The UK represents 27% of total European biotechs andleads across each cluster in terms of absolute numbersThe service providers cluster has the highest representation in most European countriesSome countries focus on specific clusters and contribute more than their relative size to the European biotech landscape in these areas, for example:
Immunotherapies: DK and NOBrain and neuronal therapy:CH, SE, IL, and ITATMP: CH, NL, and DKAntibodies: IL, NL, DK, and CH
ATMPs
Brain & Neuronal therapies
McKinsey & Company 15
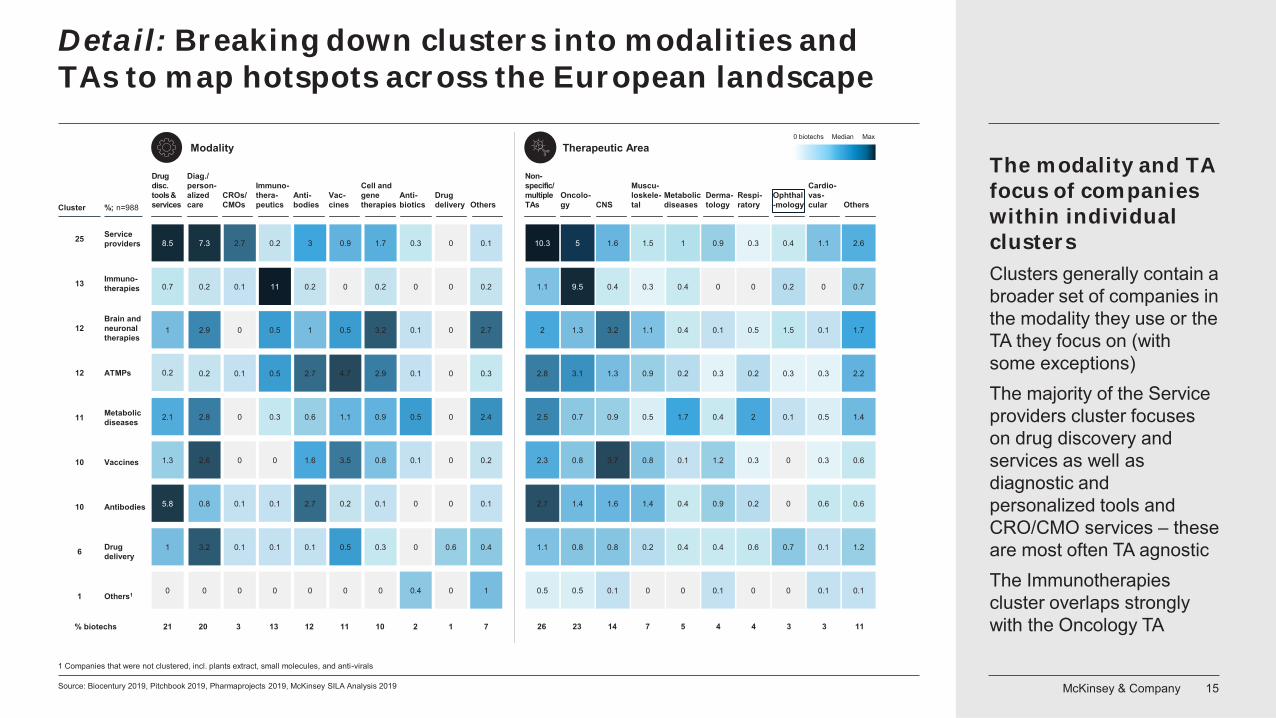
Detail: Breaking down clusters into modalities and TAs to map hotspots across the European landscape
Source: Biocentury 2019, Pitchbook 2019, Pharmaprojects 2019, McKinsey SILA Analysis 2019
Therapeutic AreaModality
1 Companies that were not clustered, incl. plants extract, small molecules, and anti-virals
Max0 biotechs Median
0.7
0.2
1
2.1
1.3
5.8
1
8.5
0
0.2
0.2
2.9
2.8
2.6
0.8
3.2
7.3
0
0.1
0.1
0
0
0
0.1
0.1
2.7
0
11
0.5
0.5
0.3
0
0.1
0.1
0.2
0
0.2
2.7
1
0.6
1.6
2.7
0.1
3
0
0
4.7
0.5
1.1
3.5
0.2
0.5
0.9
0
0.2
2.9
3.2
0.9
0.8
0.1
0.3
1.7
0
0
0.1
0.1
0.5
0.1
0
0
0.3
0.4
0
0
0
0
0
0
0.6
0
0
0.2
0.3
2.7
2.4
0.2
0.1
0.4
0.1
1
Drug disc. tools & services
Diag./ person-alizedcare
CROs/ CMOs
Immuno-thera-peutics
Anti-bodies
Vac-cines
Cell and gene therapies
Anti-biotics
Drug delivery Others
Non-specific/multiple TAs
Oncolo-gy CNS
Muscu-loskele-tal
Metabolic diseases
Derma-tology
Respi-ratory
Ophthal-mology
Cardio-vas-cular Others
1.1
2.8
2
2.5
2.3
2.7
1.1
10.3
0.5
9.5
3.1
1.3
0.7
0.8
1.4
0.8
5
0.5
0.4
1.3
3.2
0.9
3.7
1.6
0.8
1.6
0.1
0.3
0.9
1.1
0.5
0.8
1.4
0.2
1.5
0
0.4
0.2
0.4
1.7
0.1
0.4
0.4
1
0
0
0.3
0.1
0.4
1.2
0.9
0.4
0.9
0.1
0
0.2
0.5
2
0.3
0.2
0.6
0.3
0
0.2
0.3
1.5
0.1
0
0
0.7
0.4
0
0
0.3
0.1
0.5
0.3
0.6
0.1
1.1
0.1
0.7
2.2
1.7
1.4
0.6
0.6
1.2
2.6
0.1
Cluster
13
12
12
11
10
10
6
25
1
%; n=988
Drug delivery
Others1
Vaccines
Antibodies
Immuno-therapies
Brain and neuronal therapies
ATMPs
Metabolic diseases
Service providers
26 23 14 7 5 4 4 3 3 1121 20 3 13 12 11 10 2 1 7% biotechs
The modality and TA focus of companies within individual clustersClusters generally contain a broader set of companies in the modality they use or the TA they focus on (with some exceptions)The majority of the Service providers cluster focuses on drug discovery and services as well as diagnostic and personalized tools and CRO/CMO services – these are most often TA agnosticThe Immunotherapies cluster overlaps strongly with the Oncology TA
McKinsey & Company 16Sources: PubMed April 2019; BioCentury 2019, Pitchbook 2019, Pharmaprojects 2019, McKinsey SILA analysis 2019
23
12 119 10
7 64 3 3 3 2 2 2 1
35
107 7
5
9 8
35
31
31 1 1 0 0
% of biotechs since 2012 (n=311)% of biotechs prior to 2012 (n=677)
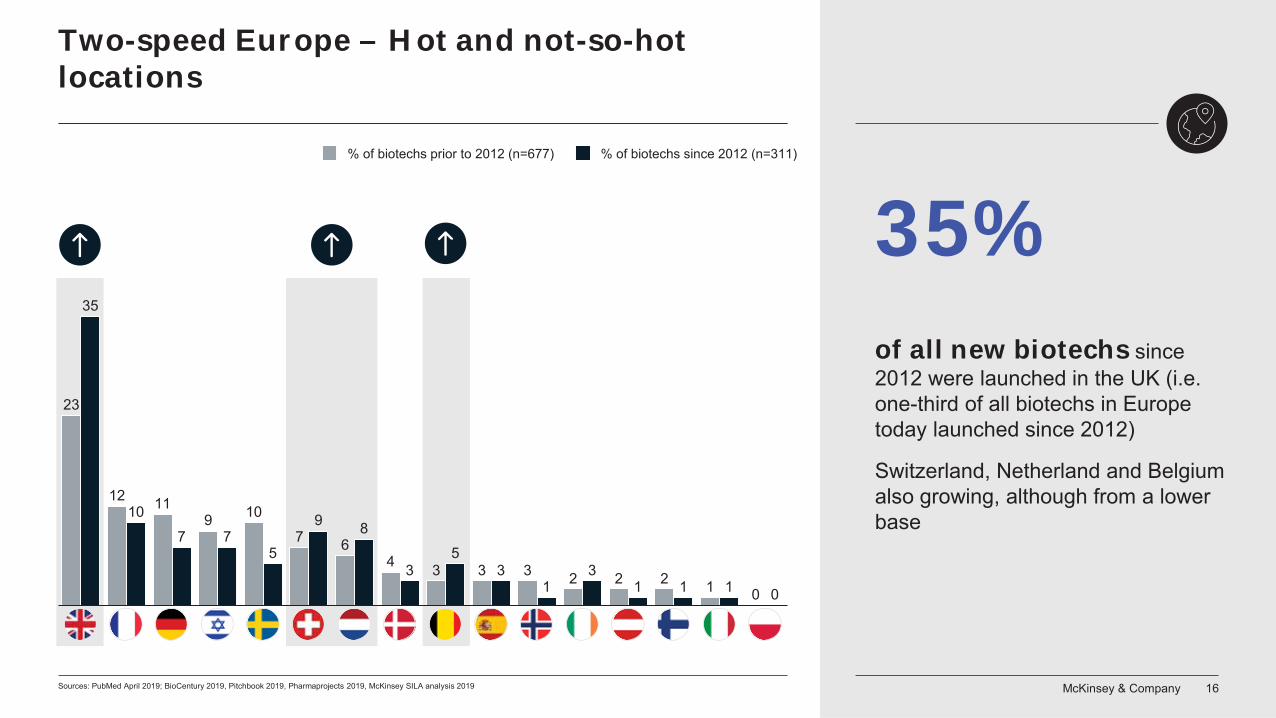
Two-speed Europe – Hot and not-so-hot locations
of all new biotechs since2012 were launched in the UK (i.e. one-third of all biotechs in Europe today launched since 2012)
Switzerland, Netherland and Belgium also growing, although from a lower base
35%
McKinsey & Company 17
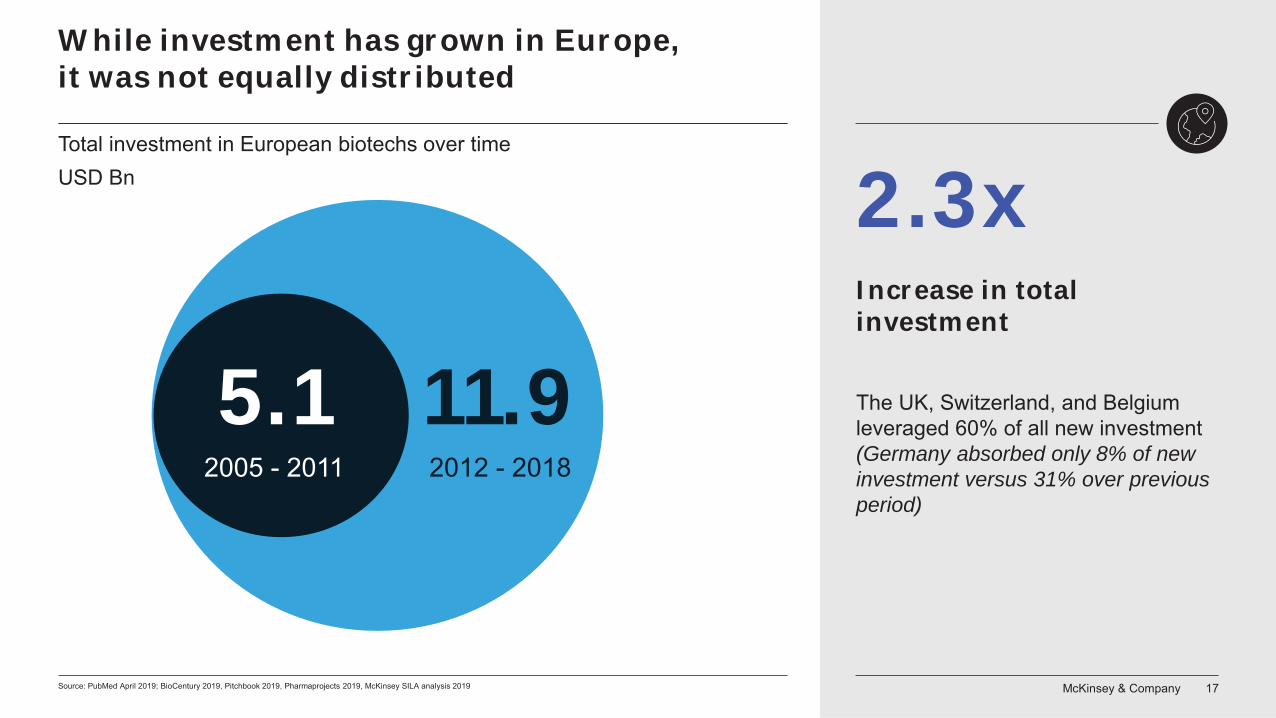
While investment has grown in Europe, it was not equally distributed
Source: PubMed April 2019; BioCentury 2019, Pitchbook 2019, Pharmaprojects 2019, McKinsey SILA analysis 2019
Total investment in European biotechs over timeUSD Bn
5.12005 - 2011
11.92012 - 2018
The UK, Switzerland, and Belgium leveraged 60% of all new investment (Germany absorbed only 8% of new investment versus 31% over previous period)
2.3xIncrease in total investment
McKinsey & Company 18
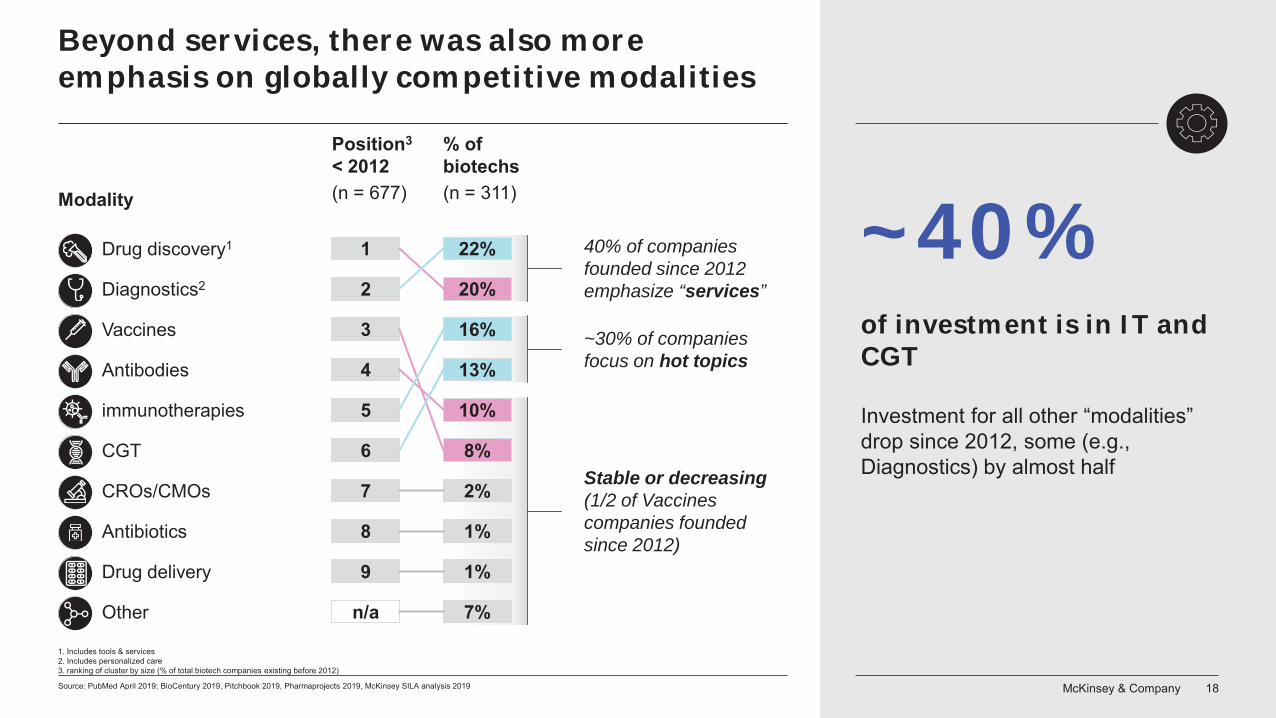
Beyond services, there was also more emphasis on globally competitive modalities
Source: PubMed April 2019; BioCentury 2019, Pitchbook 2019, Pharmaprojects 2019, McKinsey SILA analysis 2019
Modality
Position3
< 2012(n = 677)
% of biotechs(n = 311)
20%
1Drug discovery1 22%
2Diagnostics2
2%7CROs/CMOs
16%
5immunotherapies 10%
4Antibodies
8%
3Vaccines
13%
6CGT
1%8Antibiotics
1%9Drug delivery
7%n/aOther
1. Includes tools & services2. Includes personalized care3. ranking of cluster by size (% of total biotech companies existing before 2012)
40% of companies founded since 2012 emphasize “services”
Stable or decreasing (1/2 of Vaccines companies founded since 2012)
~40% of investment is in IT andCGT
Investment for all other “modalities” drop since 2012, some (e.g., Diagnostics) by almost half
~30% of companies focus on hot topics
McKinsey & Company 19
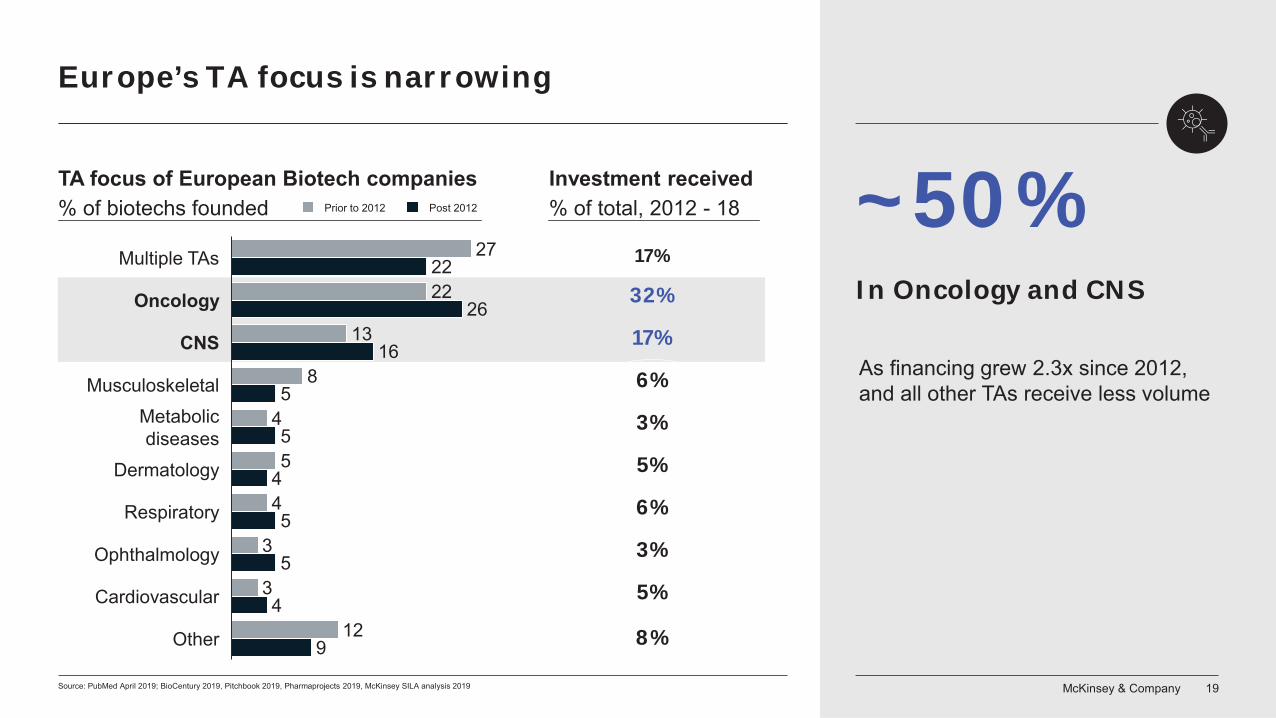
Europe’s TA focus is narrowing
Source: PubMed April 2019; BioCentury 2019, Pitchbook 2019, Pharmaprojects 2019, McKinsey SILA analysis 2019
27
22
13
8
4
5
4
3
3
12
22
26
16
5
5
4
5
5
4
9
Dermatology
Metabolicdiseases
Musculoskeletal
Multiple TAs
Cardiovascular
Oncology
CNS
Respiratory
Ophthalmology
Other
Post 2012Prior to 2012
TA focus of European Biotech companies% of biotechs founded
Investment received% of total, 2012 - 18
17%
32%
17%
6%
3%
5%
6%
3%
5%
8%
As financing grew 2.3x since 2012, and all other TAs receive less volume
~50% In Oncology and CNS
McKinsey & Company 20Source: PubMed April 2019; BioCentury 2019, Pitchbook 2019, Pharmaprojects 2019, McKinsey SILA analysis 2019
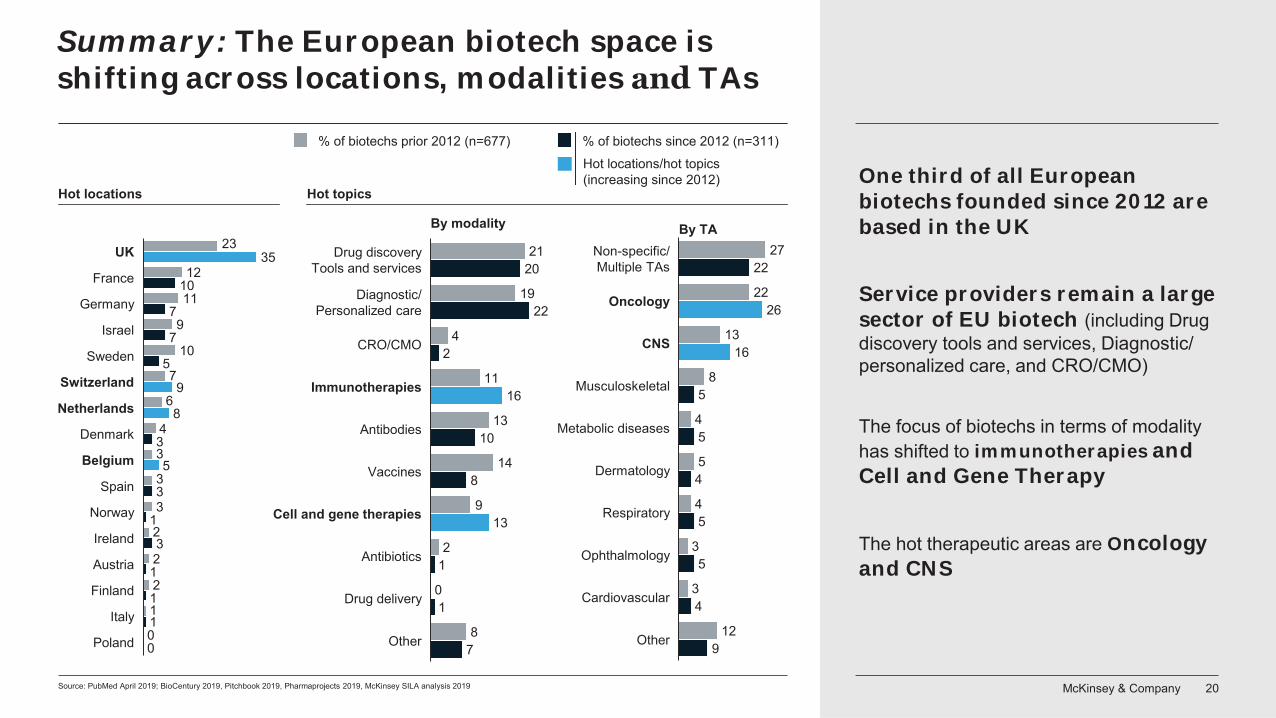
23
12
11
9
10
7
6
4
3
3
3
2
2
2
1
35
10
7
7
5
9
8
3
5
3
1
3
1
1
1
Denmark
Sweden
UK
Netherlands
France
0
Switzerland
Germany
Israel
Belgium
Austria
Spain
Norway
Ireland
Finland
Italy
Poland 0
% of biotechs prior 2012 (n=677) % of biotechs since 2012 (n=311)
21
19
4
11
13
14
9
2
8
20
22
2
16
10
8
13
1
1
7
Diagnostic/Personalized care
Drug discoveryTools and services
Vaccines
CRO/CMO
Immunotherapies
Antibodies
Cell and gene therapies
Antibiotics
Drug delivery
Other
0
27
22
13
8
4
5
4
3
3
12
22
26
16
5
5
4
5
5
4
9
Musculoskeletal
Non-specific/Multiple TAs
Respiratory
Cardiovascular
Oncology
CNS
Ophthalmology
Metabolic diseases
Dermatology
Other
Hot locations/hot topics (increasing since 2012)
By modality By TA
Hot topicsHot locationsOne third of all European biotechs founded since 2012 are based in the UK
Service providers remain a large sector of EU biotech (including Drug discovery tools and services, Diagnostic/ personalized care, and CRO/CMO)
The focus of biotechs in terms of modality has shifted to immunotherapies and Cell and Gene Therapy
The hot therapeutic areas are Oncologyand CNS
Summary: The European biotech space is shifting across locations, modalities TAs
McKinsey & Company 21
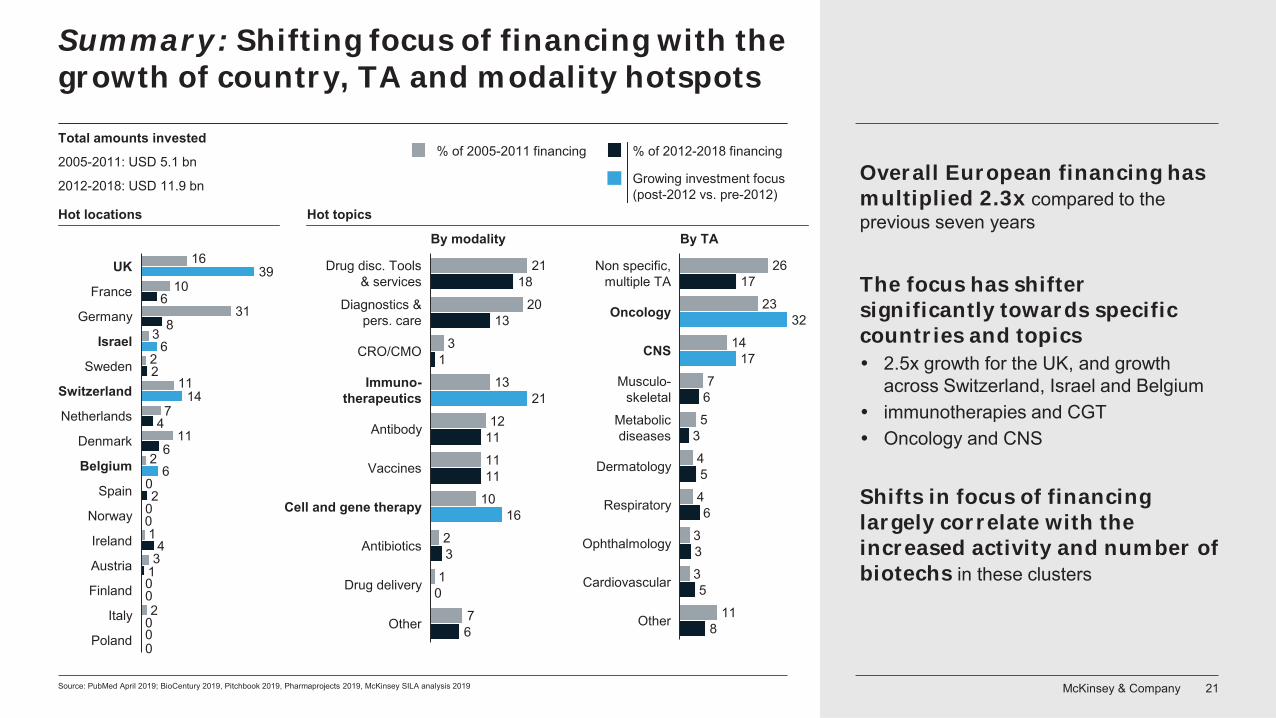
Summary: Shifting focus of financing with the growth of country, TA and modality hotspots
Source: PubMed April 2019; BioCentury 2019, Pitchbook 2019, Pharmaprojects 2019, McKinsey SILA analysis 2019
16
10
31
3
2
11
7
11
2
0
1
3
2
39
6
86
2
14
4
66
2
0
4
1
Norway
Denmark
UK
France
Germany
Israel
Ireland
Switzerland
Sweden
Netherlands
Belgium
0
Spain
Austria
Finland
Italy
Poland
0
0
000
% of 2005-2011 financing % of 2012-2018 financing
Hot locations
26
23
14
7
5
4
4
3
3
11
17
32
17
6
3
5
6
3
5
8
Musculo-skeletal
Non specific,multiple TA
Oncology
CNS
Metabolicdiseases
Dermatology
Ophthalmology
Respiratory
Cardiovascular
Other
21
20
3
13
12
11
10
2
1
7
18
13
1
21
11
11
16
3
0
6
Immuno-therapeutics
Drug disc. Tools& services
Antibiotics
Diagnostics &pers. care
Antibody
CRO/CMO
Vaccines
Cell and gene therapy
Drug delivery
Other
Total amounts invested
2005-2011: USD 5.1 bn
2012-2018: USD 11.9 bn Growing investment focus (post-2012 vs. pre-2012)
Hot topics
By modality By TA
Overall European financing has multiplied 2.3x compared to the previous seven years
The focus has shifter significantly towards specific countries and topics
2.5x growth for the UK, and growthacross Switzerland, Israel and Belgiumimmunotherapies and CGTOncology and CNS
Shifts in focus of financing largely correlate with the increased activity and number of biotechs in these clusters
McKinsey & Company 22
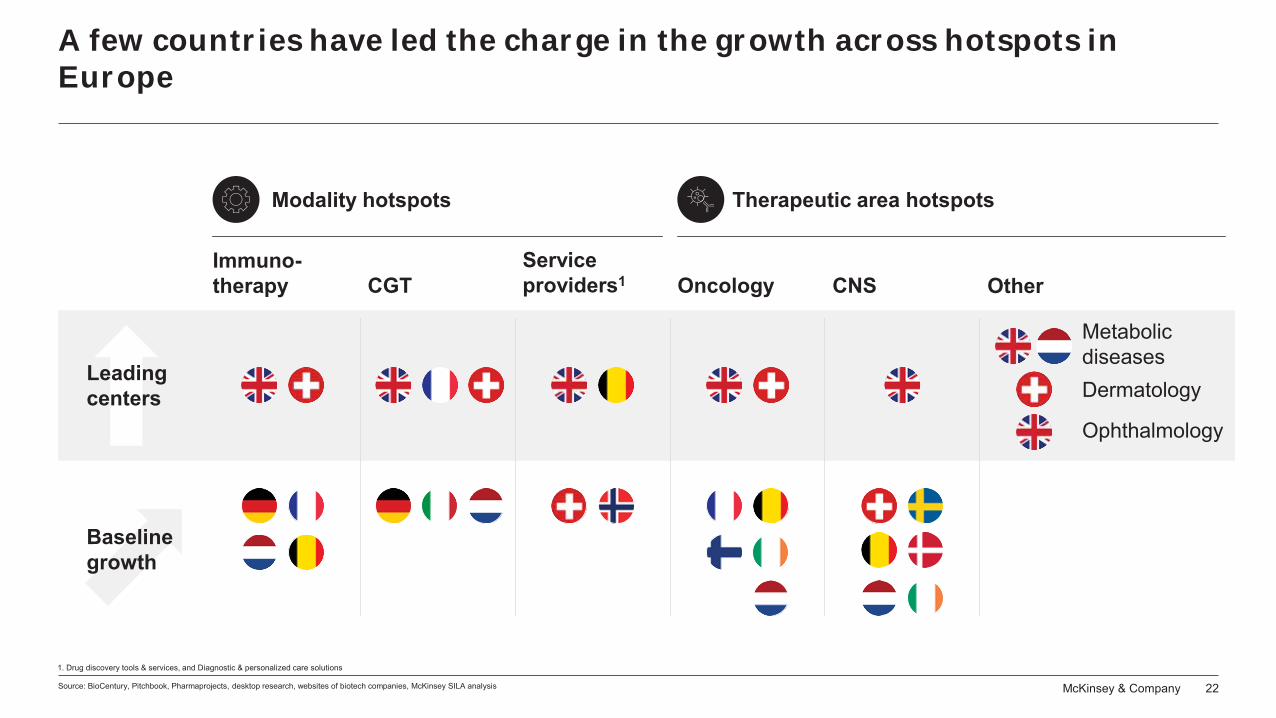
A few countries have led the charge in the growth across hotspots in Europe
1. Drug discovery tools & services, and Diagnostic & personalized care solutions
Source: BioCentury, Pitchbook, Pharmaprojects, desktop research, websites of biotech companies, McKinsey SILA analysis
Baseline growth
Leading centers
Modality hotspots Therapeutic area hotspots
Metabolic diseasesDermatology
Ophthalmology
CGTImmuno-therapy
Service providers1 CNSOncology Other
McKinsey & Company 23
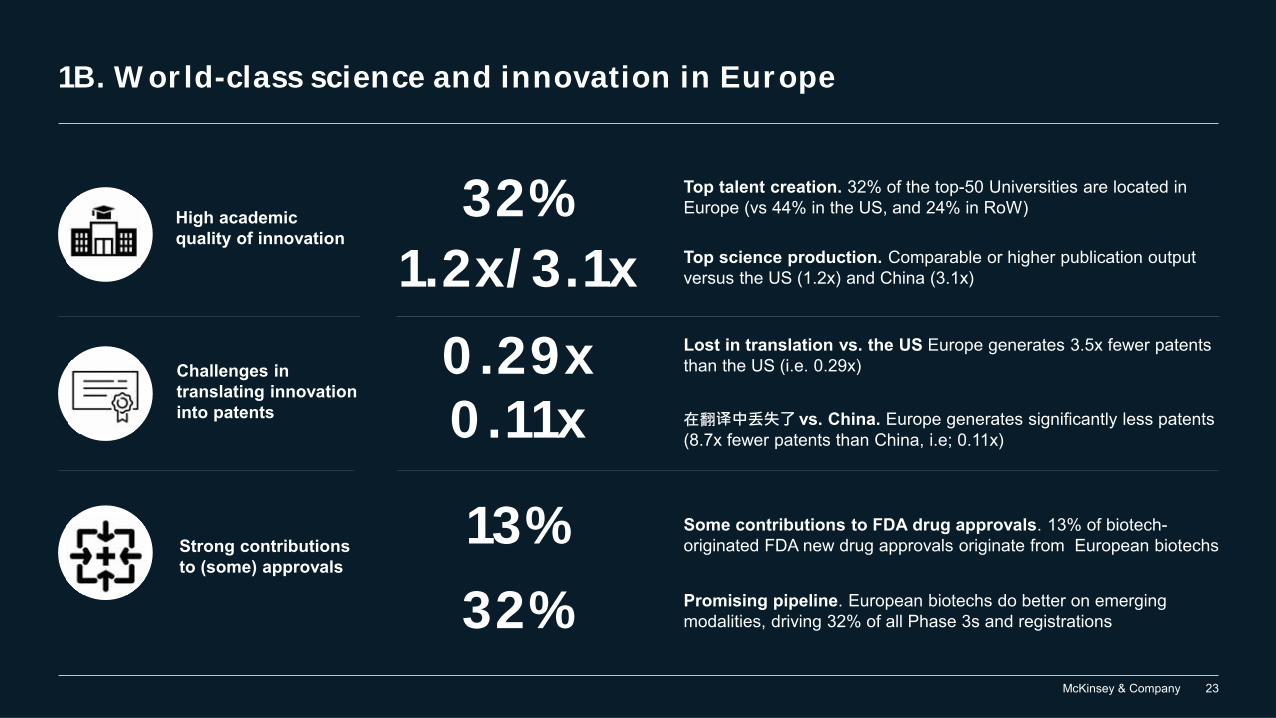
1B. World-class science and innovation in Europe
Strong contributions to (some) approvals
Challenges in translating innovation into patents
High academic quality of innovation
32%1.2x/3.1x
Top talent creation. 32% of the top-50 Universities are located in Europe (vs 44% in the US, and 24% in RoW)
Top science production. Comparable or higher publication output versus the US (1.2x) and China (3.1x)
0.29x 0.11x
Lost in translation vs. the US Europe generates 3.5x fewer patents than the US (i.e. 0.29x)
Some contributions to FDA drug approvals. 13% of biotech-originated FDA new drug approvals originate from European biotechs
Promising pipeline. European biotechs do better on emerging modalities, driving 32% of all Phase 3s and registrations
13%32%
vs. China. Europe generates significantly less patents (8.7x fewer patents than China, i.e; 0.11x)
McKinsey & Company 24Source: The Times World University rankings, CWTS Leiden Ranking 2018 – ranking of University publications (2013-2016); McKinsey Analysis
Max0 biotechs Median
10
19
2935
3940
42
37
43
47
146 69161718
202128
3032
4549
5058
11
13
22
31
27
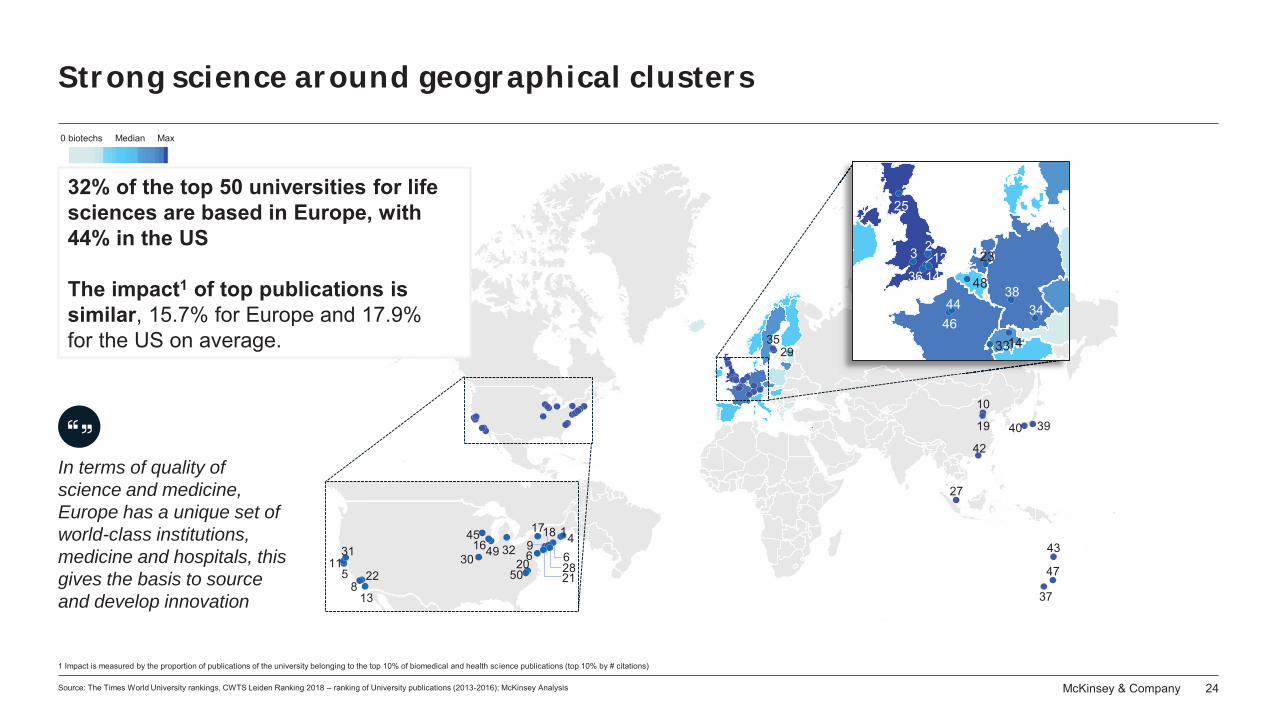
32% of the top 50 universities for life sciences are based in Europe, with 44% in the US
The impact1 of top publications issimilar, 15.7% for Europe and 17.9% for the US on average.
25
23 1236 14
34
1433
3844
46
48
23
1 Impact is measured by the proportion of publications of the university belonging to the top 10% of biomedical and health science publications (top 10% by # citations)
In terms of quality of science and medicine, Europe has a unique set of world-class institutions, medicine and hospitals, this gives the basis to source and develop innovation
Strong science around geographical clusters
McKinsey & Company 25Source: PubMed April 2019; BioCentury BCIQ 2019, Pitchbook 2019, Pharmaprojects 2019, McKinsey SILA analysis 2019
27
10
988
74
4
32
22
21
1116
18
455
234
9
2
23
214
3
Denmark
Sweden
Netherlands
UKFrance
Norway
Switzerland
IsraelGermany
BelgiumSpain
IrelandAustriaFinland
ItalyPoland
11
0
13
6
16
15
38
5
6
Immuno-therapies
Serviceproviders1
Antibiotics
Vaccines
CGT
Antibodies
Drug delivery
By modality
25
27
8
14
4
6
4
12
Dermatology
Oncology
Cardiovascular
Musculo-skeletal
CNS
Metabolicdiseases
Respiratory
By TA
Ophthalmology
% of biotechs % of publications
Hot topic
1. Services providers include Drug discovery tools and services, diagnostic and personalised care, CRO/CMO related topics
By location
Analysis of European publications since 2005, percent of biotech companies / publications
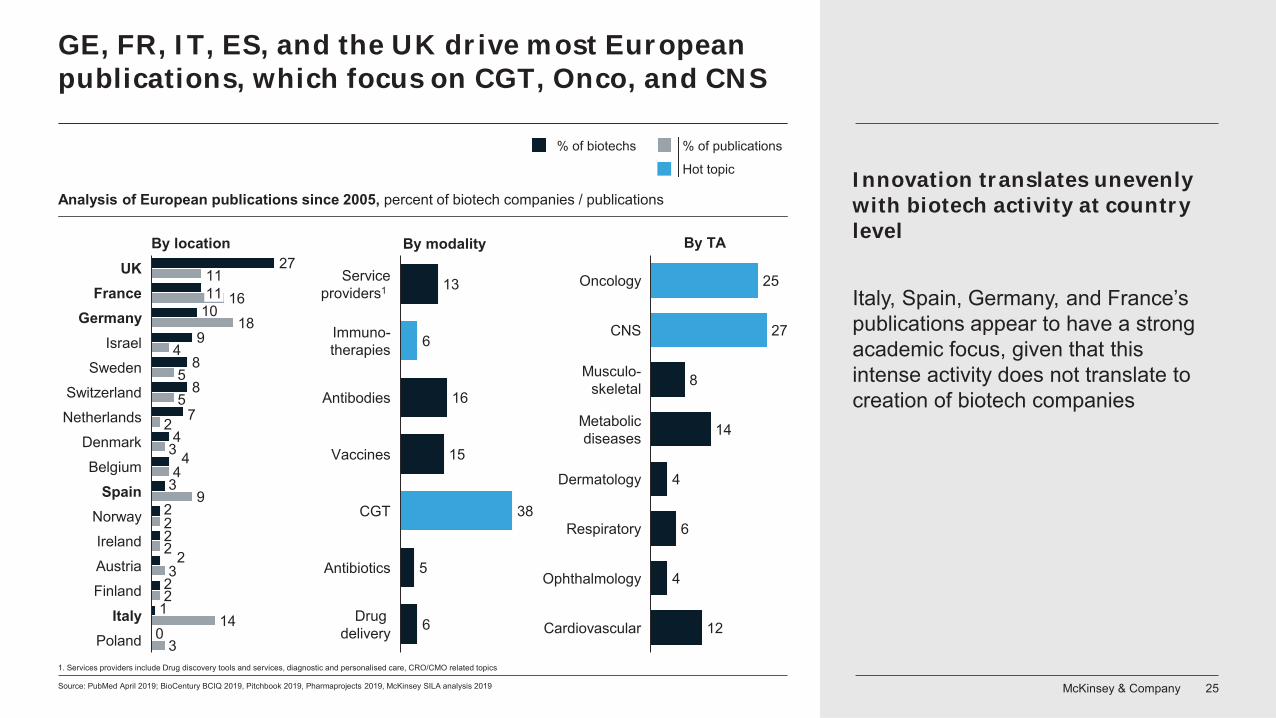
GE, FR, IT, ES, and the UK drive most European publications, which focus on CGT, Onco, and CNS
Innovation translates unevenly with biotech activity at country level
Italy, Spain, Germany, and France’s publications appear to have a strong academic focus, given that this intense activity does not translate to creation of biotech companies
McKinsey & Company 26Source: PubMed April 2019; Expert interviews 2019; McKinsey Analysis
% publications in region 2005-2018, # publications
3%
Europe
35%
21%
8%
15%
5%
8%4%
4%
US
38%
3%3%
23%7%
1,751,992
3%
20%
10%8%
11%
3%
China
33%
16%
568,737
8%
9%1,477,507
~3.1x
~1.2x
ATMP
Drug delivery
Service provider
Antibody
Vaccines
Metabolic diseases
Brain and neuronal therapies
Immunotherapies
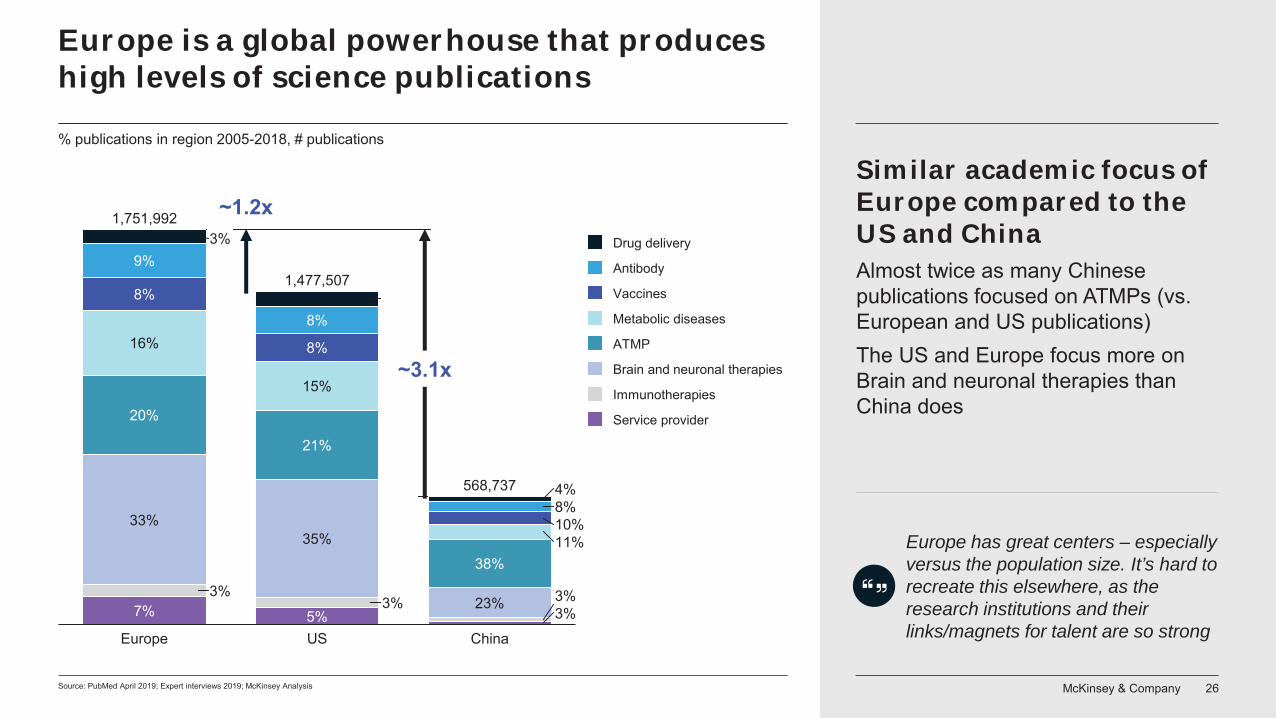
Europe has great centers – especially versus the population size. It’s hard to recreate this elsewhere, as the research institutions and their links/magnets for talent are so strong
Similar academic focus of Europe compared to the US and ChinaAlmost twice as many Chinese publications focused on ATMPs (vs. European and US publications)The US and Europe focus more on Brain and neuronal therapies than China does
Europe is a global powerhouse that produces high levels of science publications
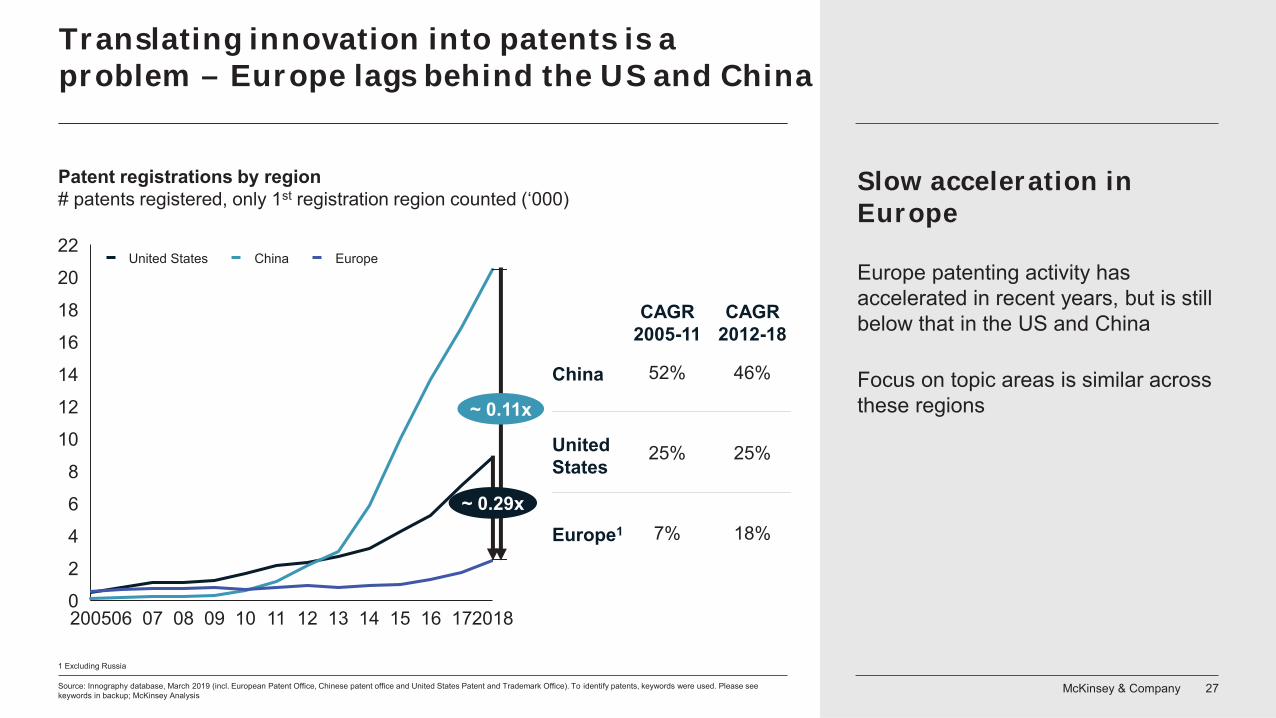
McKinsey & Company 27Source: Innography database, March 2019 (incl. European Patent Office, Chinese patent office and United States Patent and Trademark Office). To identify patents, keywords were used. Please see keywords in backup; McKinsey Analysis
Patent registrations by region# patents registered, only 1st registration region counted (‘000)
0
12
6
4
8
10
20
14
16
18
2
22
200506 08 09 10 11 12 13 14 15 16 17201807
~ 0.29x
~ 0.11x
United States China Europe
United States
Europe1
CAGR2005-11
25% 25%
7% 18%
52% 46%China
CAGR2012-18
1 Excluding Russia
Translating innovation into patents is a problem – Europe lags behind the US and China
Slow acceleration in Europe
Europe patenting activity has accelerated in recent years, but is still below that in the US and China
Focus on topic areas is similar across these regions
McKinsey & Company 28
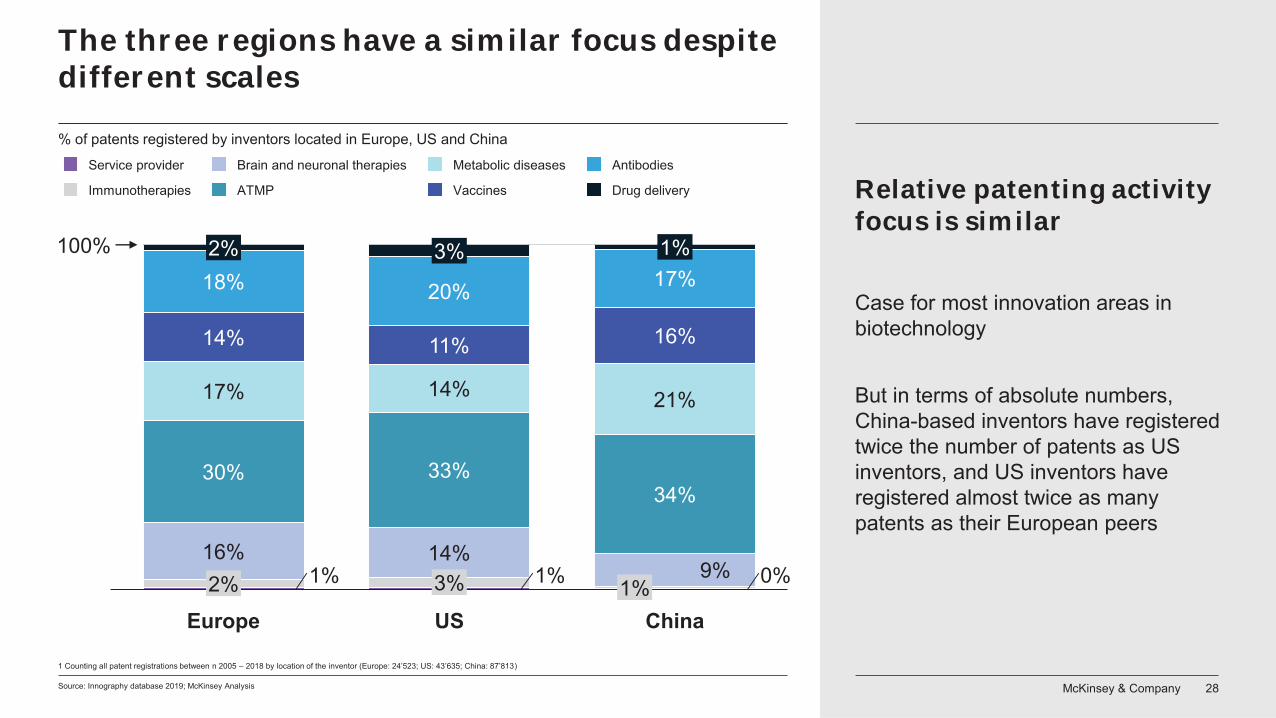
The three regions have a similar focus despite different scales
Source: Innography database 2019; McKinsey Analysis
1% 1% 0%16% 14%
9%
30% 33%34%
17% 14% 21%
14% 11% 16%
18% 20% 17%3%2%
2%
USEurope3% 1%
1%
China
100%
Brain and neuronal therapiesService provider
Immunotherapies
Metabolic diseases
ATMP Vaccines
Antibodies
Drug delivery
1 Counting all patent registrations between n 2005 – 2018 by location of the inventor (Europe: 24’523; US: 43’635; China: 87’813)
% of patents registered by inventors located in Europe, US and China
Relative patenting activity focus is similar
Case for most innovation areas in biotechnology
But in terms of absolute numbers, China-based inventors have registered twice the number of patents as US inventors, and US inventors have registered almost twice as many patents as their European peers
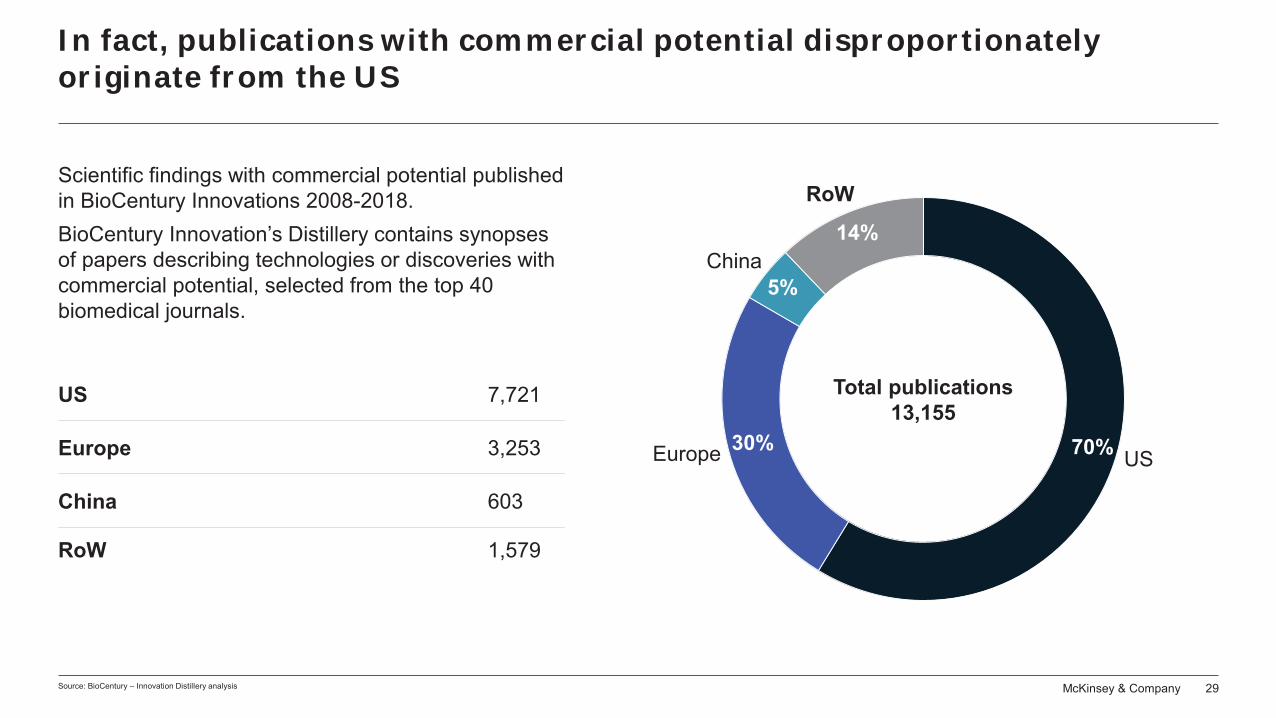
McKinsey & Company 29Source: BioCentury – Innovation Distillery analysis
Scientific findings with commercial potential published in BioCentury Innovations 2008-2018. BioCentury Innovation’s Distillery contains synopses of papers describing technologies or discoveries with commercial potential, selected from the top 40 biomedical journals.
China 603
RoW 1,579
Europe 3,253
US 7,721
70%30%
5%
14%
RoW
Europe US
China
Total publications13,155
In fact, publications with commercial potential disproportionately originate from the US
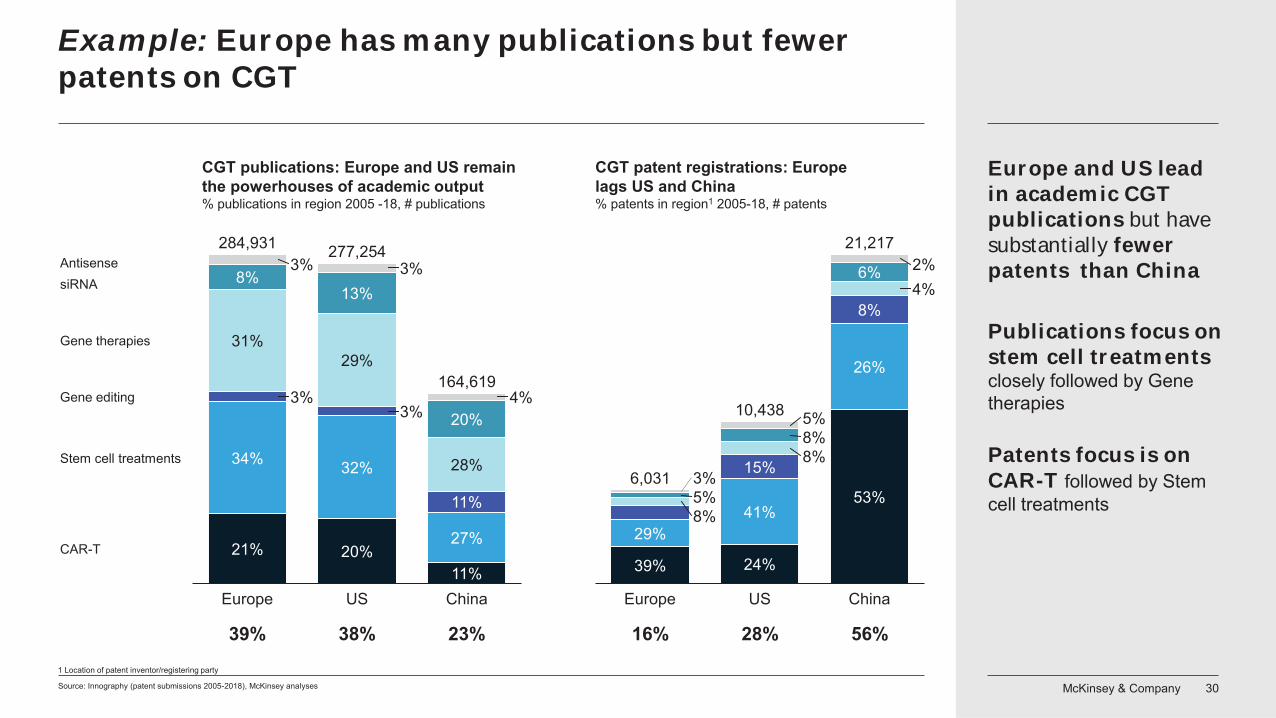
McKinsey & Company 30Source: Innography (patent submissions 2005-2018), McKinsey analyses
CGT publications: Europe and US remain the powerhouses of academic output% publications in region 2005 -18, # publications
CGT patent registrations: Europe lags US and China% patents in region1 2005-18, # patents
China
8%
39%
5%
29%
26%
3%
Europe
10,438
8%5%
8%15%
41%
24%
US
6%4%
8%
53%
2%
6,031
21,217
21%
4%164,619
8%
34%
31%
3%
3%
Europe
13%
29%
32%
20%CAR-T
siRNA3%
US
20%
28%
11%
27%
11%
3%
China
Gene therapies
Gene editing
284,931
Stem cell treatments
Antisense277,254
1 Location of patent inventor/registering party
39% 38% 23% 16% 28% 56%
Example: Europe has many publications but fewer patents on CGT
Europe and US lead in academic CGT publications but have substantially fewer patents than China
Patents focus is on CAR-T followed by Stem cell treatments
Publications focus on stem cell treatments closely followed by Gene therapies
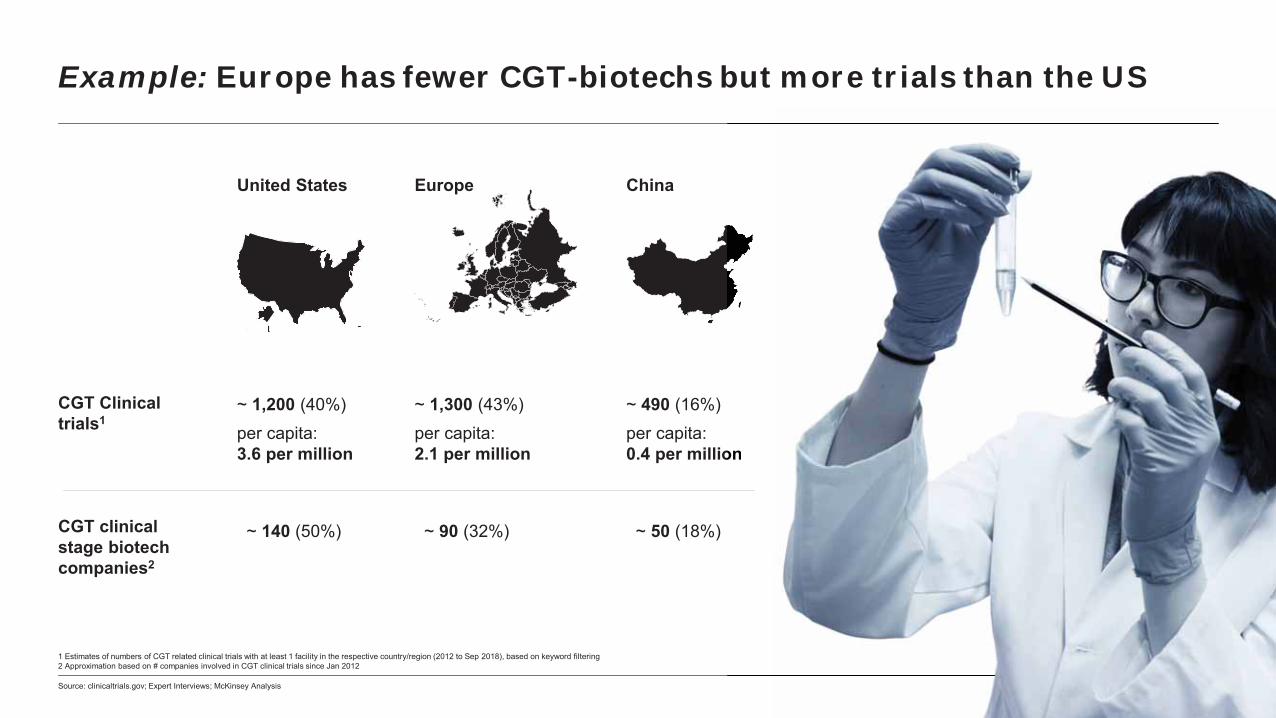
McKinsey & Company 31Source: clinicaltrials.gov; Expert Interviews; McKinsey Analysis
~ 1,200 (40%)per capita: 3.6 per million
United States
~ 1,300 (43%)per capita: 2.1 per million
Europe
~ 490 (16%)per capita: 0.4 per million
China
1 Estimates of numbers of CGT related clinical trials with at least 1 facility in the respective country/region (2012 to Sep 2018), based on keyword filtering 2 Approximation based on # companies involved in CGT clinical trials since Jan 2012
MMcMcMcMcMcMcMcMcKiKKiKiK nnsnsnnsnsn eyeyeyeyey &&&&&& CCCCCCCCCCComomomommomomomomomoommmppapapapap nynyyynny 31311
on
~ 140 (50%) ~ 90 (32%) ~ 50 (18%)
CGT Clinical trials1
CGT clinical stage biotech companies2
Example: Europe has fewer CGT-biotechs but more trials than the US
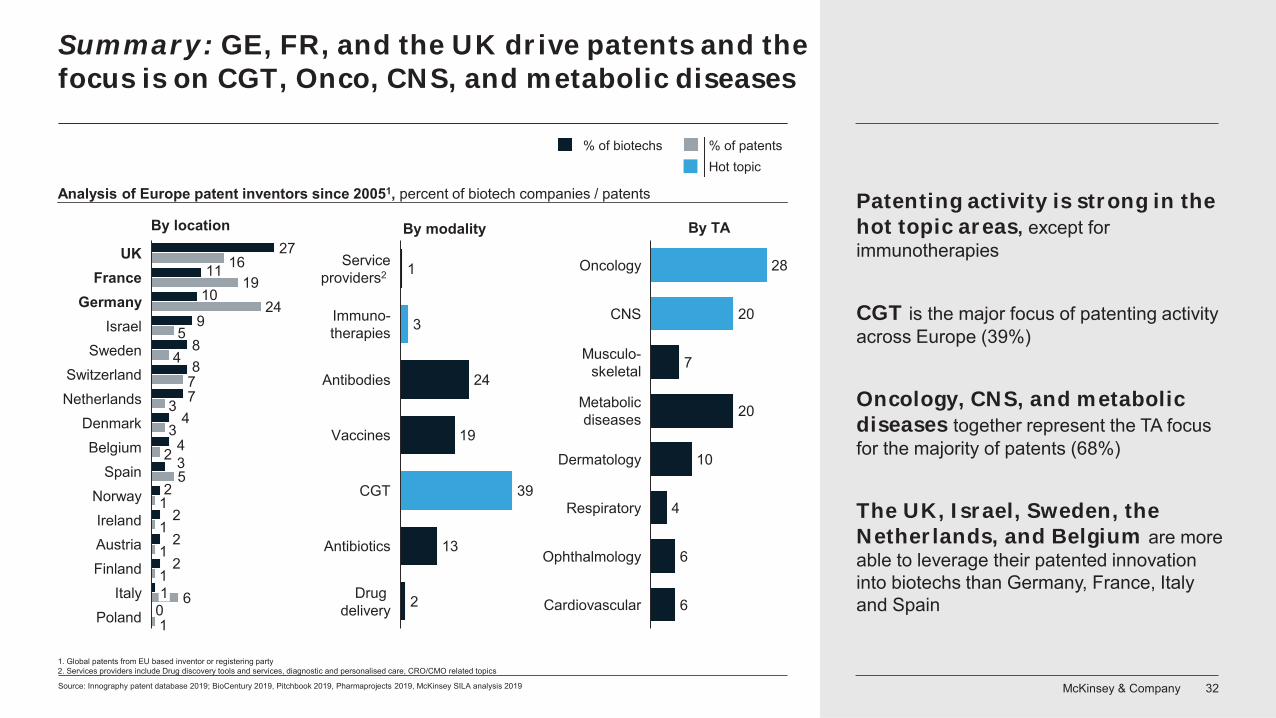
McKinsey & Company 32Source: Innography patent database 2019; BioCentury 2019, Pitchbook 2019, Pharmaprojects 2019, McKinsey SILA analysis 2019
2711
10
988
74
43
2
222
1619
24
54
733
25
1111
6
1
Switzerland
Germany
UKFrance
IsraelSweden
Netherlands
Norway
DenmarkBelgium
Spain
IrelandAustriaFinland
ItalyPoland
10
1
3
24
19
39
13
2
Antibodies
Serviceproviders2
Antibiotics
Immuno-therapies
CGT
Vaccines
By modality
Drug delivery
28
20
7
20
10
4
6
6Cardiovascular
Musculo-skeletal
Oncology
Metabolicdiseases
Respiratory
CNS
Ophthalmology
Dermatology
By TA
% of biotechs % of patents
1. Global patents from EU based inventor or registering party2. Services providers include Drug discovery tools and services, diagnostic and personalised care, CRO/CMO related topics
By location
Hot topic
Analysis of Europe patent inventors since 20051, percent of biotech companies / patents
Summary: GE, FR, and the UK drive patents and the focus is on CGT, Onco, CNS, and metabolic diseases
Patenting activity is strong in the hot topic areas, except for immunotherapies
CGT is the major focus of patenting activity across Europe (39%)
Oncology, CNS, and metabolic diseases together represent the TA focus for the majority of patents (68%)
The UK, Israel, Sweden, the Netherlands, and Belgium are more able to leverage their patented innovation into biotechs than Germany, France, Italy and Spain
McKinsey & Company 33
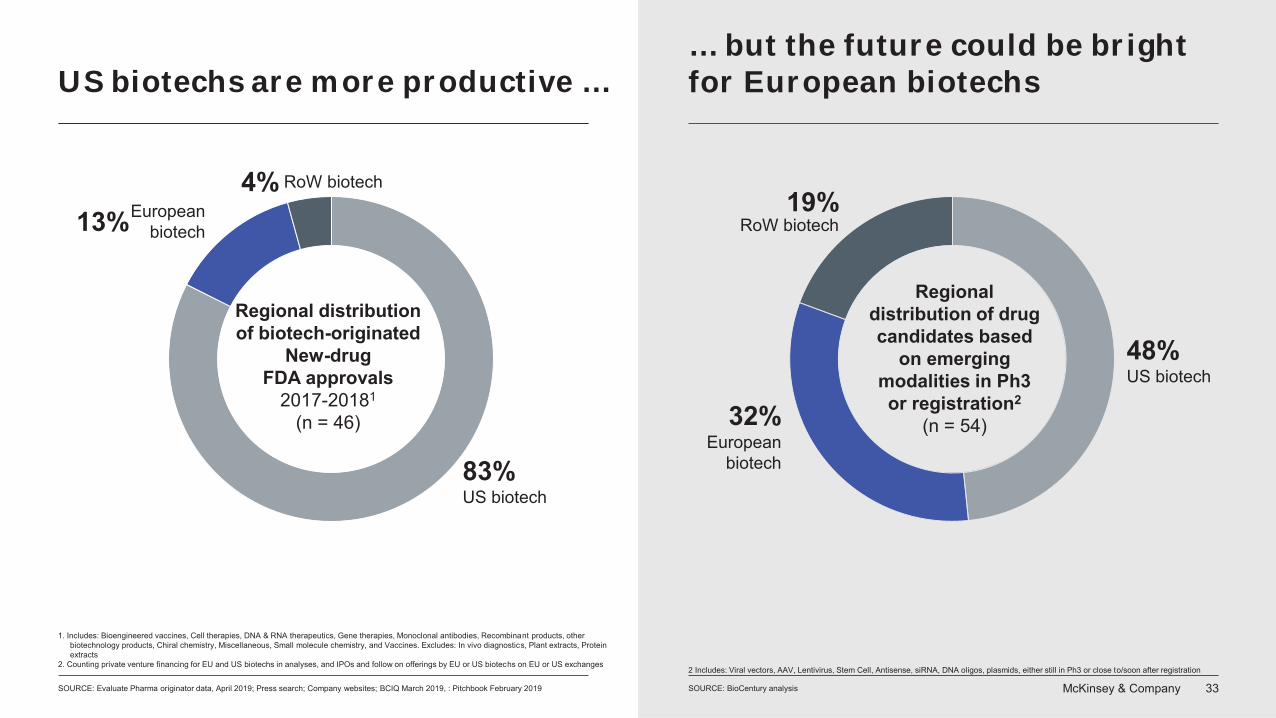
US biotechs are more productive …… but the future could be bright for European biotechs
SOURCE: Evaluate Pharma originator data, April 2019; Press search; Company websites; BCIQ March 2019, : Pitchbook February 2019
Regional distributionof biotech-originated
New-drug FDA approvals
2017-20181
(n = 46)
1. Includes: Bioengineered vaccines, Cell therapies, DNA & RNA therapeutics, Gene therapies, Monoclonal antibodies, Recombinant products, other biotechnology products, Chiral chemistry, Miscellaneous, Small molecule chemistry, and Vaccines. Excludes: In vivo diagnostics, Plant extracts, Proteinextracts
2. Counting private venture financing for EU and US biotechs in analyses, and IPOs and follow on offerings by EU or US biotechs on EU or US exchanges
SOURCE: BioCentury analysis
Regional distribution of drug candidates based
on emerging modalities in Ph3 or registration2
(n = 54)
2 Includes: Viral vectors, AAV, Lentivirus, Stem Cell, Antisense, siRNA, DNA oligos, plasmids, either still in Ph3 or close to/soon after registration
US biotech83%
Europeanbiotech13%
RoW biotech4%RoW biotech
Europeanbiotech
US biotech48%
32%
19%
McKinsey & Company 34
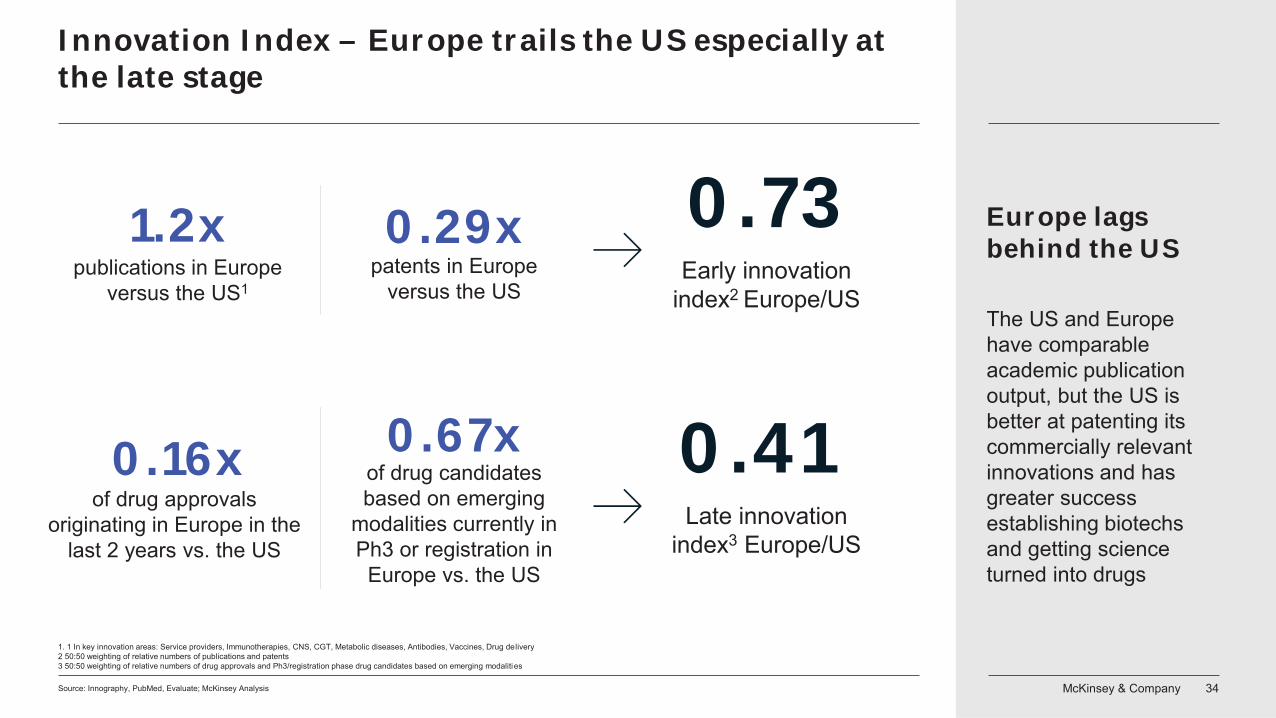
Innovation Index – Europe trails the US especially at the late stage
1. 1 In key innovation areas: Service providers, Immunotherapies, CNS, CGT, Metabolic diseases, Antibodies, Vaccines, Drug delivery2 50:50 weighting of relative numbers of publications and patents3 50:50 weighting of relative numbers of drug approvals and Ph3/registration phase drug candidates based on emerging modalities
Europe lags behind the US
The US and Europe have comparable academic publication output, but the US is better at patenting its commercially relevant innovations and has greater success establishing biotechs and getting science turned into drugs
Source: Innography, PubMed, Evaluate; McKinsey Analysis
publications in Europe versus the US1
1.2x 0.29xpatents in Europe
versus the US
0.73Early innovation
index2 Europe/US
of drug approvals originating in Europe in the
last 2 years vs. the US
0.16x 0.67xof drug candidates based on emerging
modalities currently in Ph3 or registration in
Europe vs. the US
0.41Late innovation
index3 Europe/US
McKinsey & Company 35
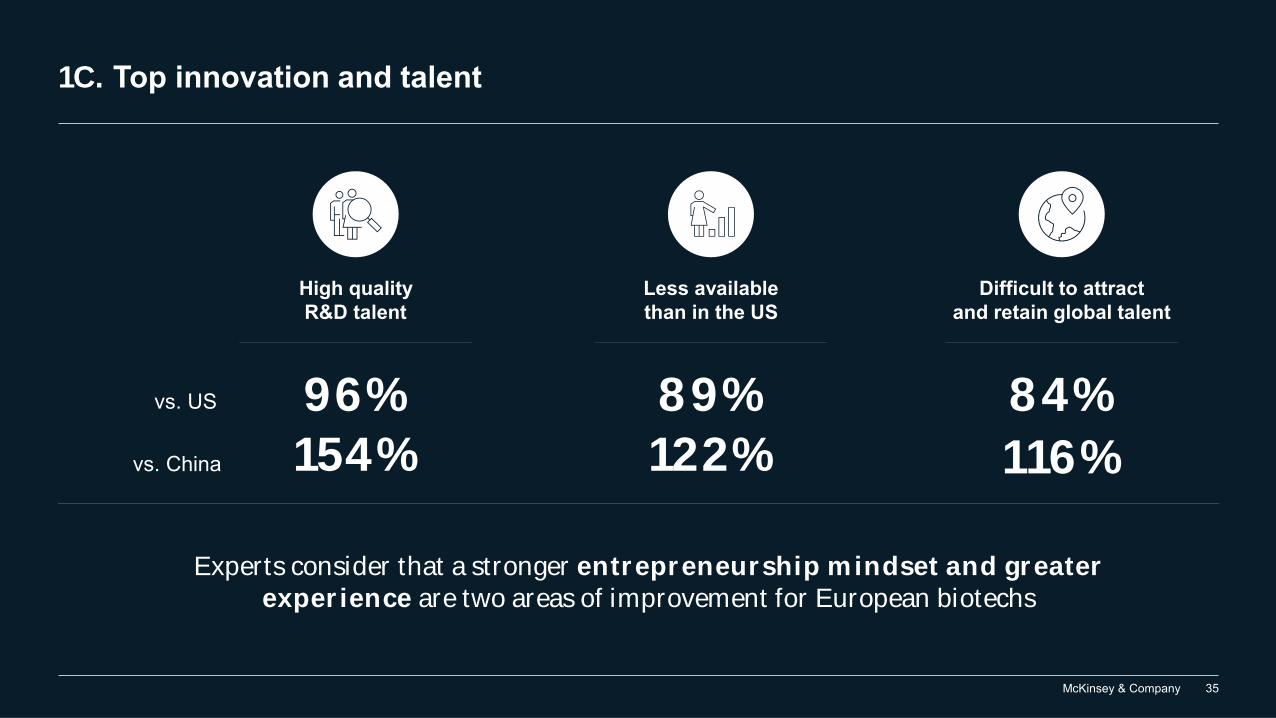
1C. Top innovation and talent
Less available than in the US
High quality R&D talent
Difficult to attract and retain global talent
89%122%
96%154%
84%116%
vs. US
vs. China
Experts consider that a stronger entrepreneurship mindset and greater experience are two areas of improvement for European biotechs
McKinsey & Company 36Source: Expert surveys & interviews including from the 2018 China Drug Innovation Index in the McKinsey report “Building Bridges to Innovation”, China Healthcare Summit 2018; McKinsey analysis
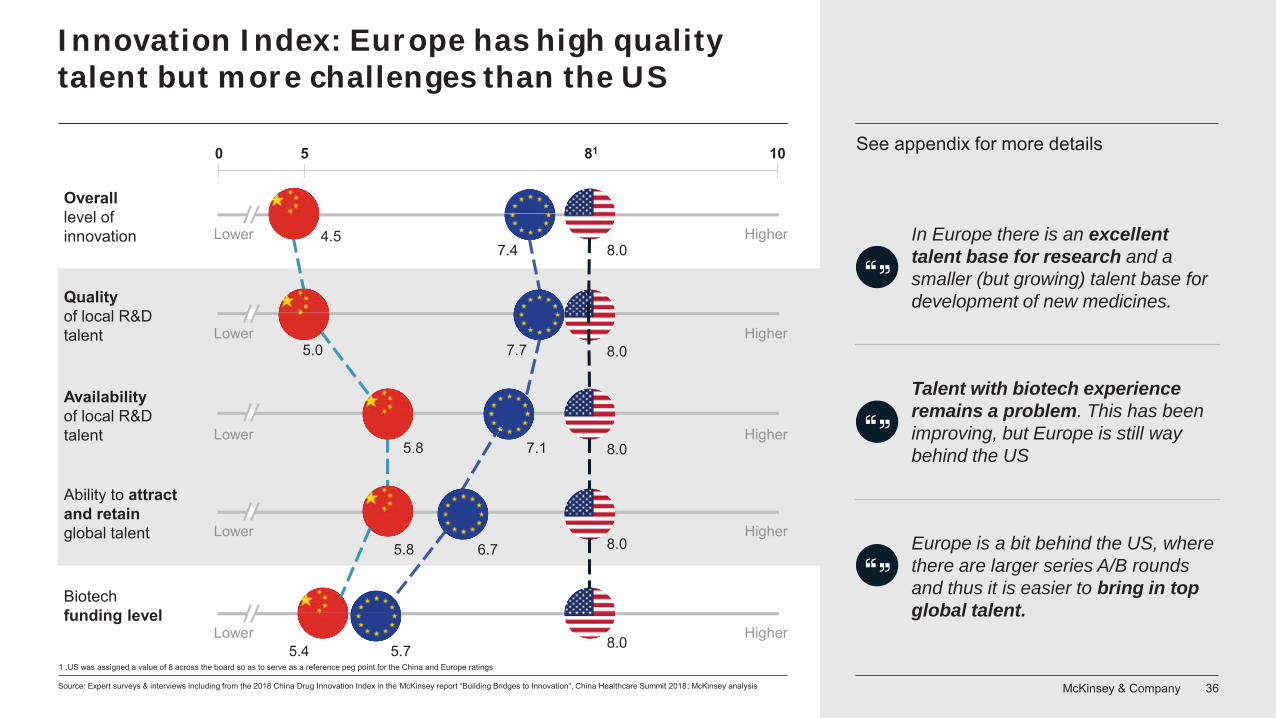
In Europe there is an excellent talent base for research and a smaller (but growing) talent base for development of new medicines.
Europe is a bit behind the US, where there are larger series A/B rounds and thus it is easier to bring in top global talent.
Talent with biotech experience remains a problem. This has been improving, but Europe is still way behind the US
Innovation Index: Europe has high quality talent but more challenges than the US
0 105
Overalllevel of innovation HigherLower 4.5
7.4
Quality of local R&D talent Lower Higher
5.0 7.7
Availability of local R&D talent HigherLower
5.8 7.1
Ability to attract and retain global talent HigherLower
5.8 6.7
Biotech funding level
HigherLower5.4 5.7
81
8.0
8.0
8.0
8.0
1 .US was assigned a value of 8 across the board so as to serve as a reference peg point for the China and Europe ratings
8.0
See appendix for more details
McKinsey & Company 37Source: Expert interviews 2019, McKinsey cross-industry experts (McKinsey Org Practice)
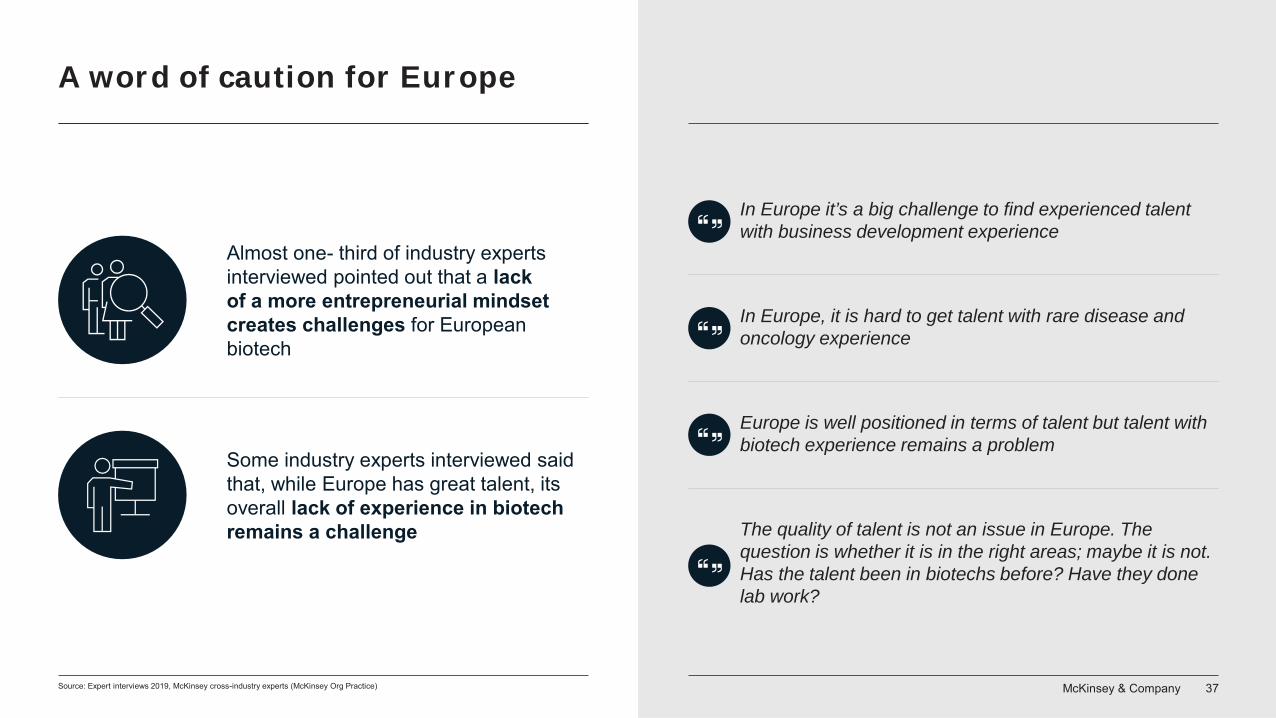
Some industry experts interviewed said that, while Europe has great talent, its overall lack of experience in biotech remains a challenge
Almost one- third of industry experts interviewed pointed out that a lack of a more entrepreneurial mindset creates challenges for European biotech
In Europe it’s a big challenge to find experienced talent with business development experience
Europe is well positioned in terms of talent but talent with biotech experience remains a problem
In Europe, it is hard to get talent with rare disease and oncology experience
The quality of talent is not an issue in Europe. The question is whether it is in the right areas; maybe it is not. Has the talent been in biotechs before? Have they done lab work?
A word of caution for Europe
McKinsey & Company 38
Is financing where it needs to be?
02
A. “Good value” in European biotechs
B. Financing for European biotech is maturing
C. Gap versus US biotechs keeps growing
McKinsey & Company 39
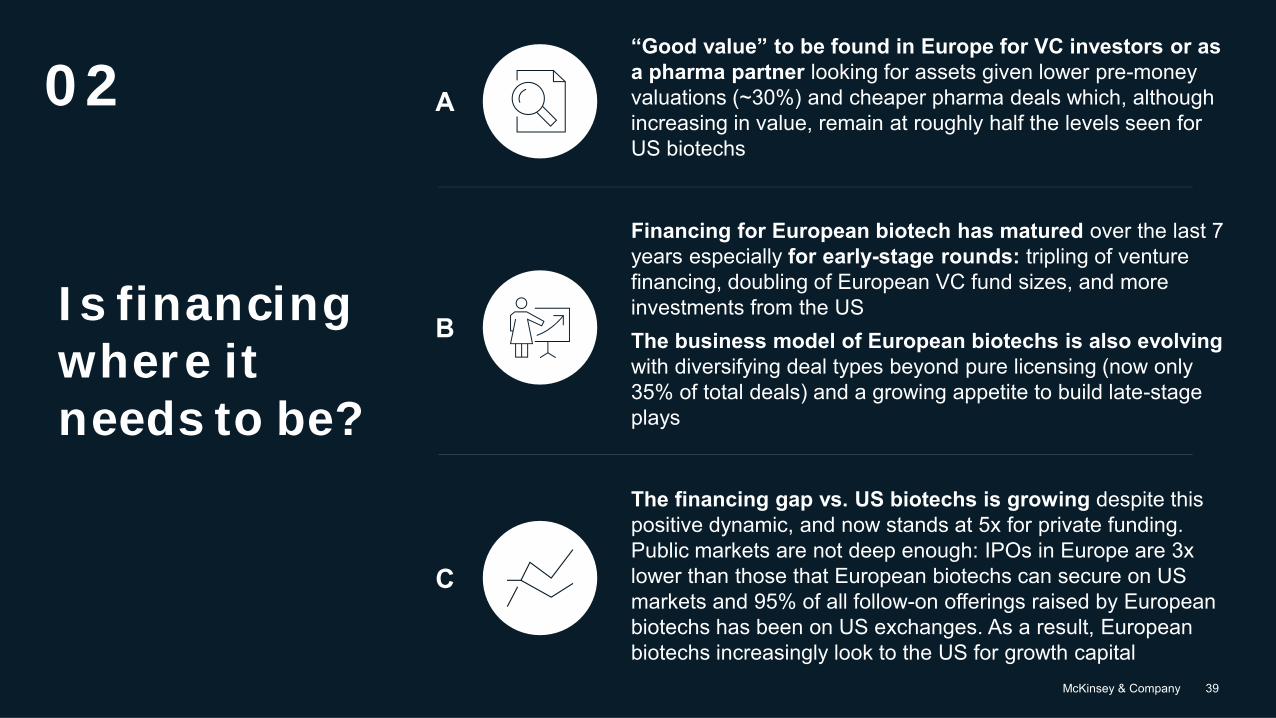
Is financing where it needs to be?
02 A
“Good value” to be found in Europe for VC investors or as a pharma partner looking for assets given lower pre-money valuations (~30%) and cheaper pharma deals which, although increasing in value, remain at roughly half the levels seen for US biotechs
B
Financing for European biotech has matured over the last 7 years especially for early-stage rounds: tripling of venture financing, doubling of European VC fund sizes, and more investments from the US The business model of European biotechs is also evolving with diversifying deal types beyond pure licensing (now only 35% of total deals) and a growing appetite to build late-stage plays
C
The financing gap vs. US biotechs is growing despite this positive dynamic, and now stands at 5x for private funding. Public markets are not deep enough: IPOs in Europe are 3x lower than those that European biotechs can secure on US markets and 95% of all follow-on offerings raised by European biotechs has been on US exchanges. As a result, European biotechs increasingly look to the US for growth capital
McKinsey & Company 40
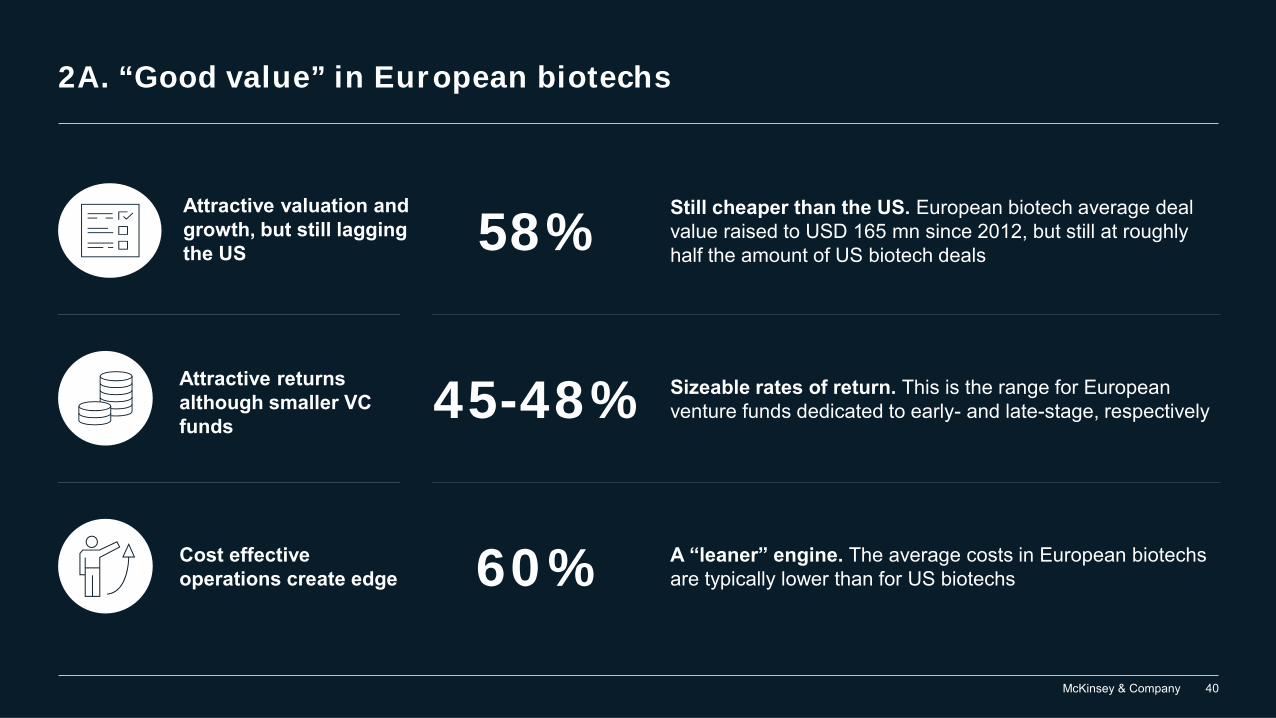
2A. “Good value” in European biotechs
58%Still cheaper than the US. European biotech average deal value raised to USD 165 mn since 2012, but still at roughly half the amount of US biotech deals
Attractive valuation and growth, but still lagging the US
Attractive returns although smaller VC funds
45-48% Sizeable rates of return. This is the range for European venture funds dedicated to early- and late-stage, respectively
Cost effective operations create edge
A “leaner” engine. The average costs in European biotechsare typically lower than for US biotechs60%
McKinsey & Company 41
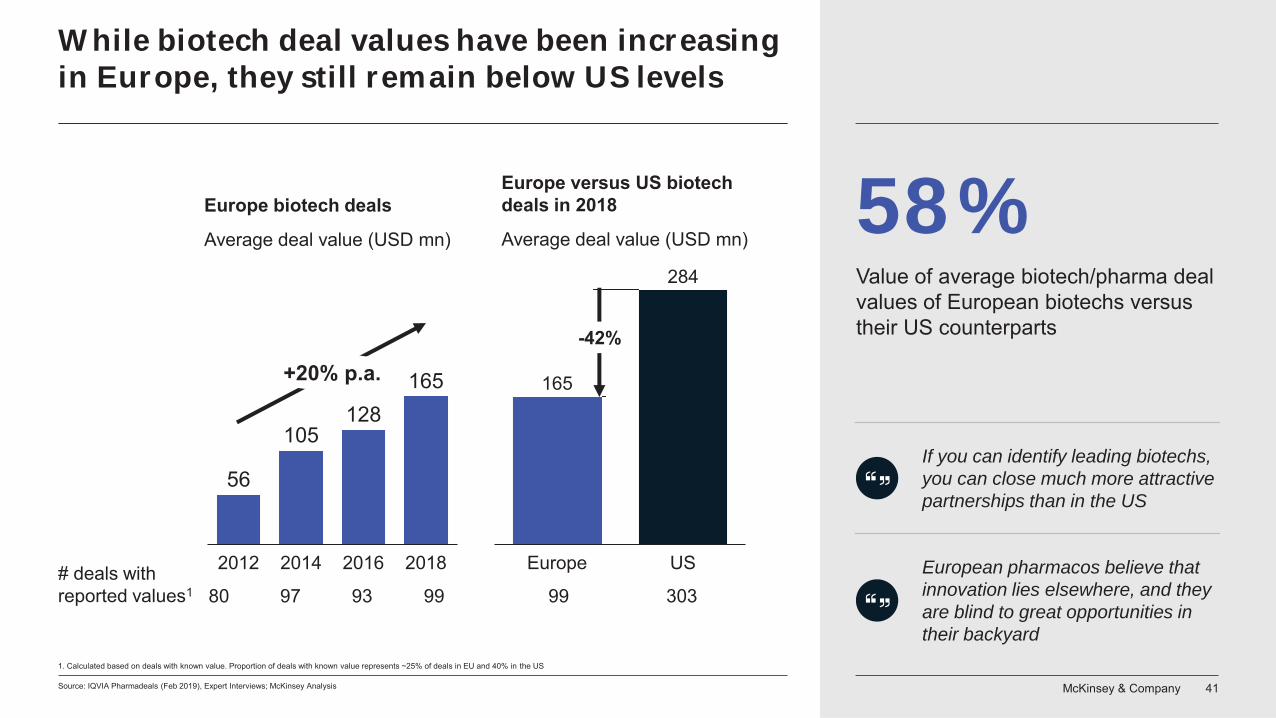
While biotech deal values have been increasing in Europe, they still remain below US levels
Source: IQVIA Pharmadeals (Feb 2019), Expert Interviews; McKinsey Analysis
Europe biotech deals
Average deal value (USD mn)
# deals with reported values1 80 97 93 99
165
284
Europe US
-42%
Europe versus US biotech deals in 2018
Average deal value (USD mn)
56
105128
165
20182012 2014 2016
+20% p.a.
99 303
1. Calculated based on deals with known value. Proportion of deals with known value represents ~25% of deals in EU and 40% in the US
58%
European pharmacos believe that innovation lies elsewhere, and they are blind to great opportunities in their backyard
If you can identify leading biotechs, you can close much more attractive partnerships than in the US
Value of average biotech/pharma deal values of European biotechs versus their US counterparts
McKinsey & Company 42
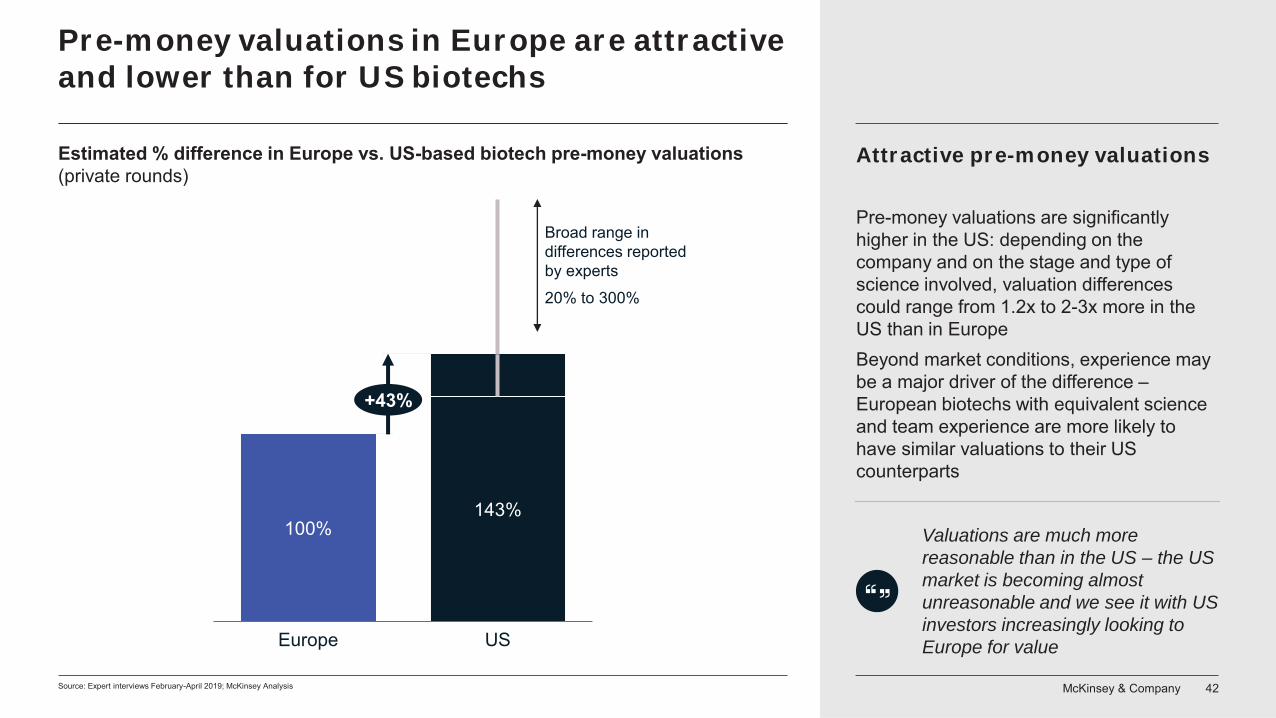
Pre-money valuations in Europe are attractive and lower than for US biotechs
Source: Expert interviews February-April 2019; McKinsey Analysis
USEurope
100%143%
+43%
Broad range in differences reported by experts 20% to 300%
Estimated % difference in Europe vs. US-based biotech pre-money valuations (private rounds)
Attractive pre-money valuations
Pre-money valuations are significantly higher in the US: depending on the company and on the stage and type of science involved, valuation differences could range from 1.2x to 2-3x more in the US than in EuropeBeyond market conditions, experience may be a major driver of the difference –European biotechs with equivalent science and team experience are more likely to have similar valuations to their US counterparts
Valuations are much more reasonable than in the US – the US market is becoming almost unreasonable and we see it with US investors increasingly looking to Europe for value
McKinsey & Company 43
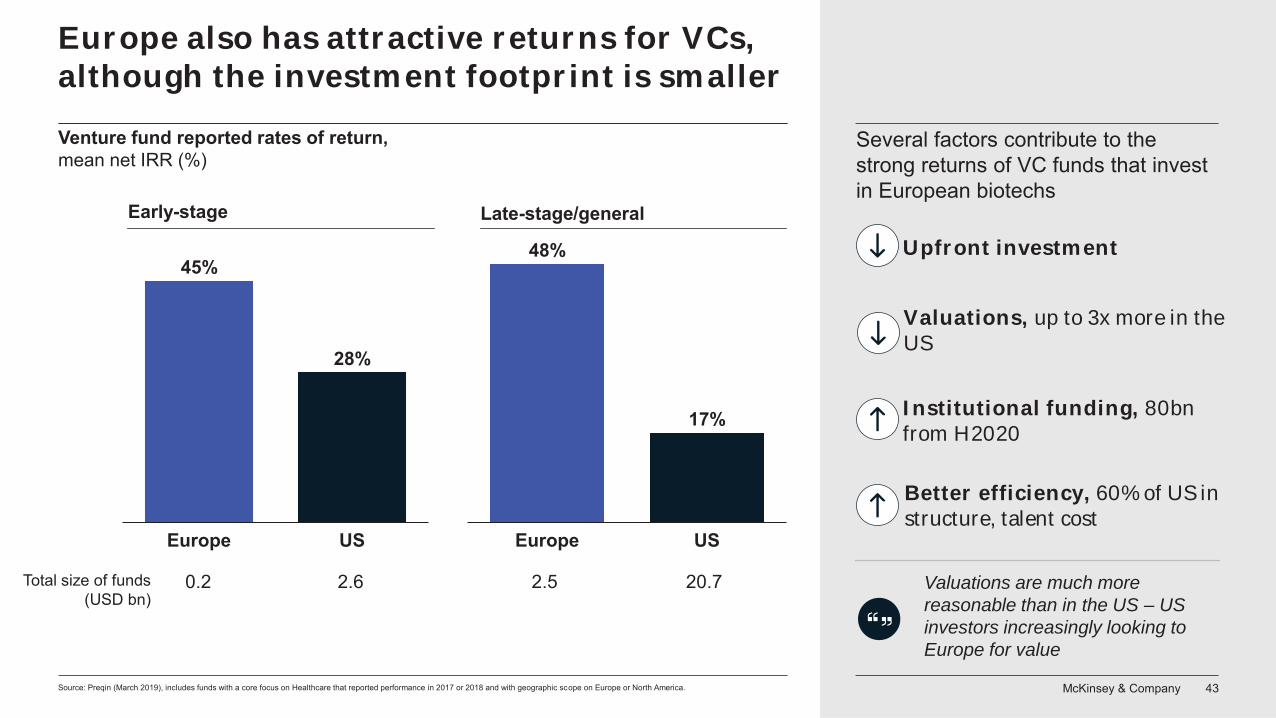
Europe also has attractive returns for VCs, although the investment footprint is smaller
Source: Preqin (March 2019), includes funds with a core focus on Healthcare that reported performance in 2017 or 2018 and with geographic scope on Europe or North America.
Venture fund reported rates of return, mean net IRR (%)
45%
28%
Europe US Europe US
48%
17%
Late-stage/generalEarly-stage
Total size of funds (USD bn)
0.2 2.6 2.5 20.7 Valuations are much more reasonable than in the US – US investors increasingly looking to Europe for value
Upfront investment
Institutional funding, 80bn from H2020
Valuations, up to 3x more in the US
Better efficiency, 60% of US in structure, talent cost
Several factors contribute to the strong returns of VC funds that invest in European biotechs
McKinsey & Company 44Source: Expert survey 2019; Expert interviews 2019; McKinsey Analysis
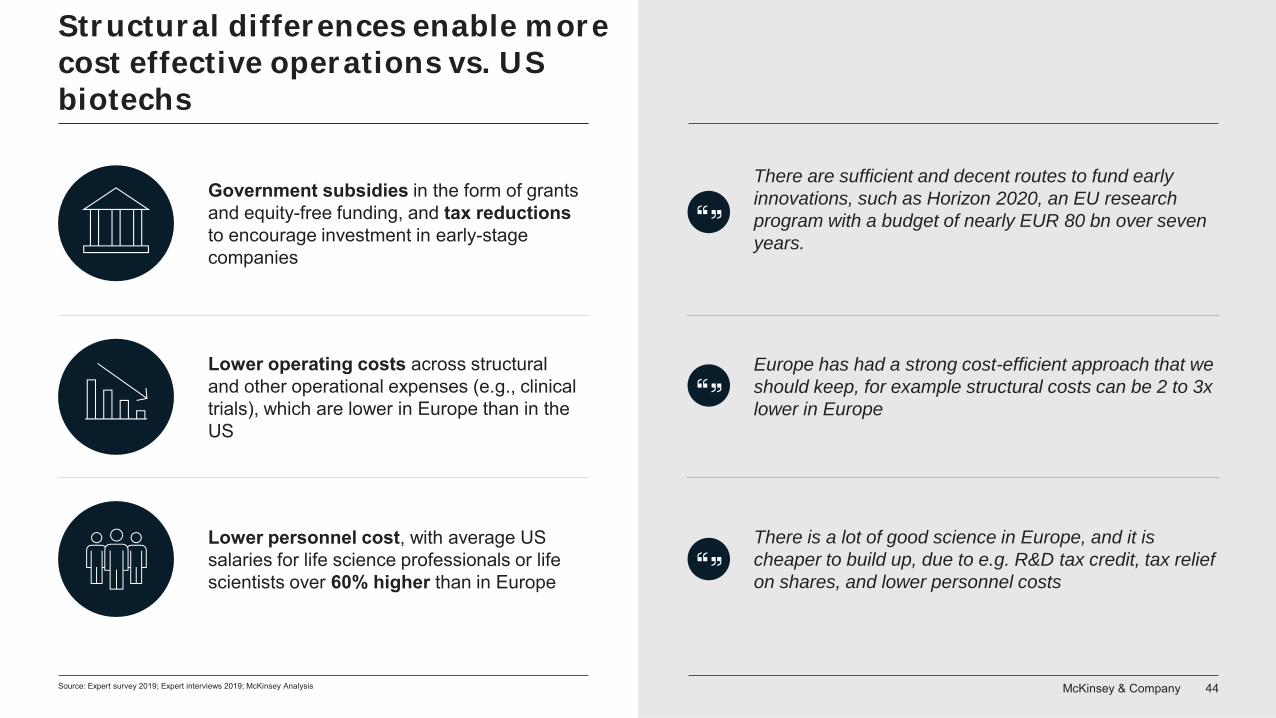
Structural differences enable more cost effective operations vs. US biotechs
Europe has had a strong cost-efficient approach that we should keep, for example structural costs can be 2 to 3x lower in Europe
There is a lot of good science in Europe, and it is cheaper to build up, due to e.g. R&D tax credit, tax relief on shares, and lower personnel costs
There are sufficient and decent routes to fund early innovations, such as Horizon 2020, an EU research program with a budget of nearly EUR 80 bn over seven years.
Government subsidies in the form of grants and equity-free funding, and tax reductions to encourage investment in early-stage companies
Lower operating costs across structural and other operational expenses (e.g., clinical trials), which are lower in Europe than in the US
Lower personnel cost, with average US salaries for life science professionals or life scientists over 60% higher than in Europe
McKinsey & Company 45
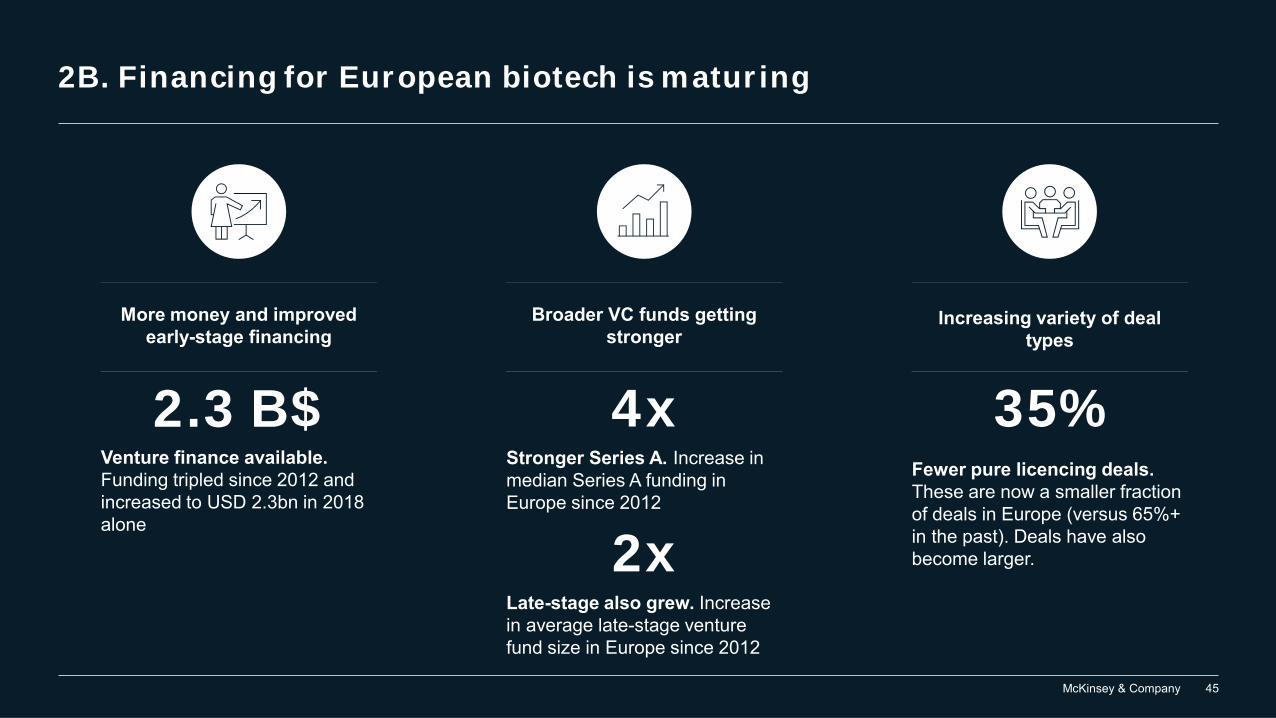
2B. Financing for European biotech is maturing
More money and improved early-stage financing
Venture finance available. Funding tripled since 2012 and increased to USD 2.3bn in 2018 alone
Broader VC funds getting stronger
2xLate-stage also grew. Increase in average late-stage venture fund size in Europe since 2012
4xStronger Series A. Increase in median Series A funding in Europe since 2012
Increasing variety of deal types
35%Fewer pure licencing deals.These are now a smaller fraction of deals in Europe (versus 65%+ in the past). Deals have also become larger.
2.3 B$
McKinsey & Company 46
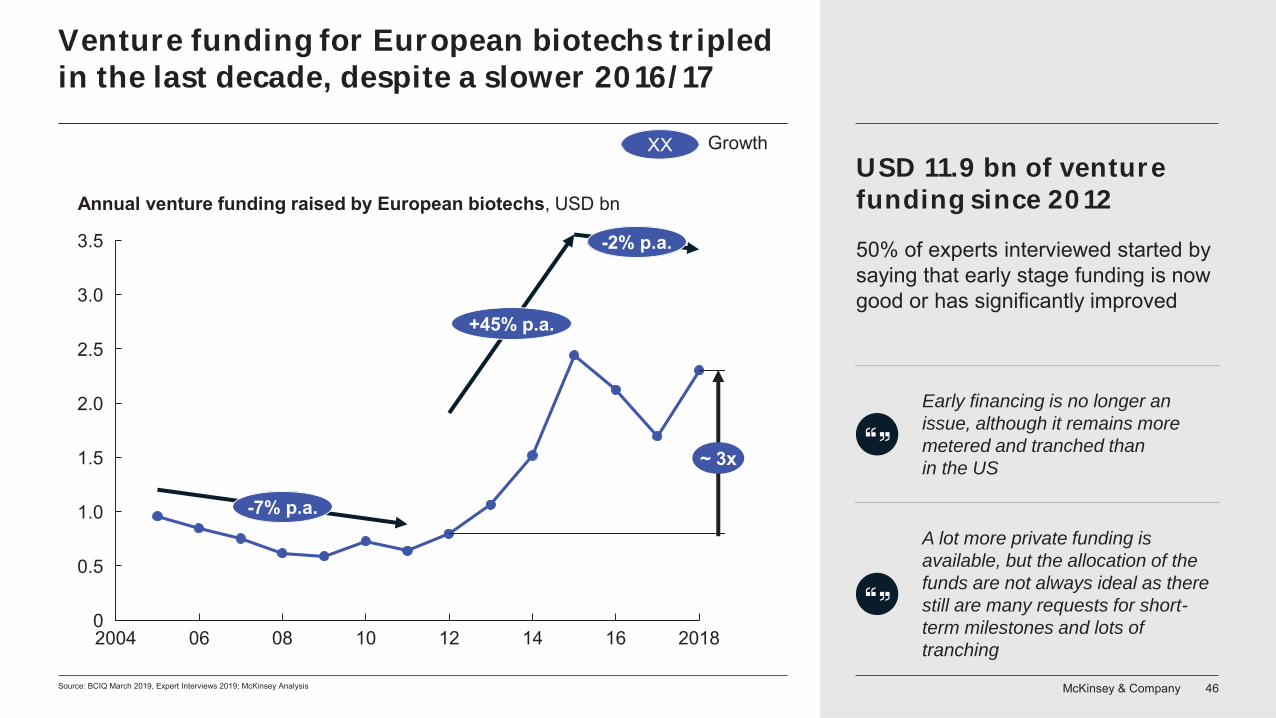
Venture funding for European biotechs tripled in the last decade, despite a slower 2016/17
Source: BCIQ March 2019, Expert Interviews 2019; McKinsey Analysis
2.0
2.5
2004 10
3.5
06 08 12 14 16 2018
3.0
0
0.5
1.0
1.5
Annual venture funding raised by European biotechs, USD bn
~ 3x
-7% p.a.
+45% p.a.
-2% p.a. 50% of experts interviewed started by saying that early stage funding is now good or has significantly improved
Early financing is no longer an issue, although it remains more metered and tranched than in the US
A lot more private funding is available, but the allocation of the funds are not always ideal as there still are many requests for short-term milestones and lots of tranching
USD 11.9 bn of venture funding since 2012
XX Growth
McKinsey & Company 47
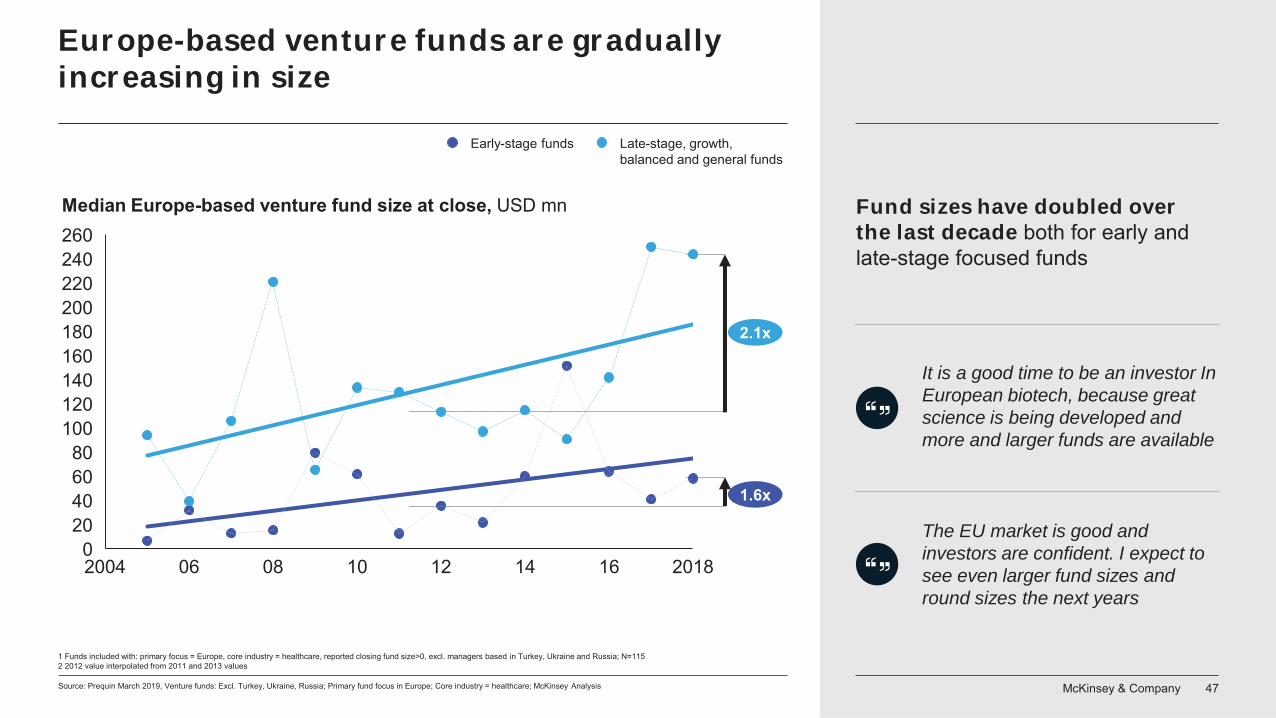
Europe-based venture funds are gradually increasing in size
Source: Prequin March 2019, Venture funds: Excl. Turkey, Ukraine, Russia; Primary fund focus in Europe; Core industry = healthcare; McKinsey Analysis
12 2018102004 0806 140
16
200
120
20406080
100
140160180
240220
260
Early-stage funds Late-stage, growth,balanced and general funds
Median Europe-based venture fund size at close, USD mn Fund sizes have doubled over the last decade both for early and late-stage focused funds
1 Funds included with: primary focus = Europe, core industry = healthcare, reported closing fund size>0, excl. managers based in Turkey, Ukraine and Russia; N=1152 2012 value interpolated from 2011 and 2013 values
2.1x
1.6x
It is a good time to be an investor In European biotech, because great science is being developed and more and larger funds are available
The EU market is good and investors are confident. I expect to see even larger fund sizes and round sizes the next years
McKinsey & Company 48
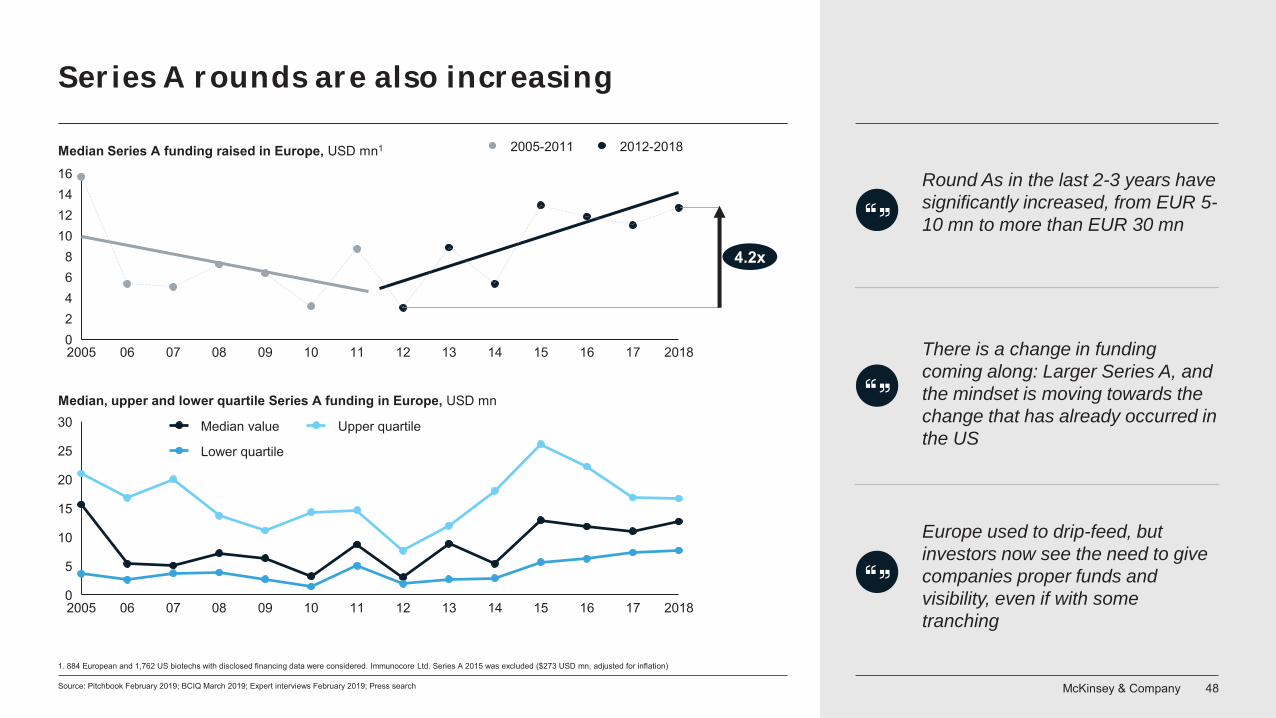
Series A rounds are also increasing
Source: Pitchbook February 2019; BCIQ March 2019; Expert interviews February 2019; Press search
07 142005
20
5
060
08 201809 12 1710 11 13 15 16
10
15
25
30
2005 09 11 1306 1207 08 10 14 15 16 17 201802468
10121416
2005-2011 2012-2018
Median value
Lower quartile
Upper quartile
1. 884 European and 1,762 US biotechs with disclosed financing data were considered. Immunocore Ltd. Series A 2015 was excluded ($273 USD mn, adjusted for inflation)
4.2x
Round As in the last 2-3 years have significantly increased, from EUR 5-10 mn to more than EUR 30 mn
There is a change in funding coming along: Larger Series A, and the mindset is moving towards the change that has already occurred in the US
Europe used to drip-feed, but investors now see the need to give companies proper funds and visibility, even if with some tranching
Median Series A funding raised in Europe, USD mn1
Median, upper and lower quartile Series A funding in Europe, USD mn
McKinsey & Company 49
82%
0%6%13%2012 2018
10%0%
55%
35%
14
64%
15%3%
19%
16
35%
23%
13%
29%
4.5
10.211.8
16.3
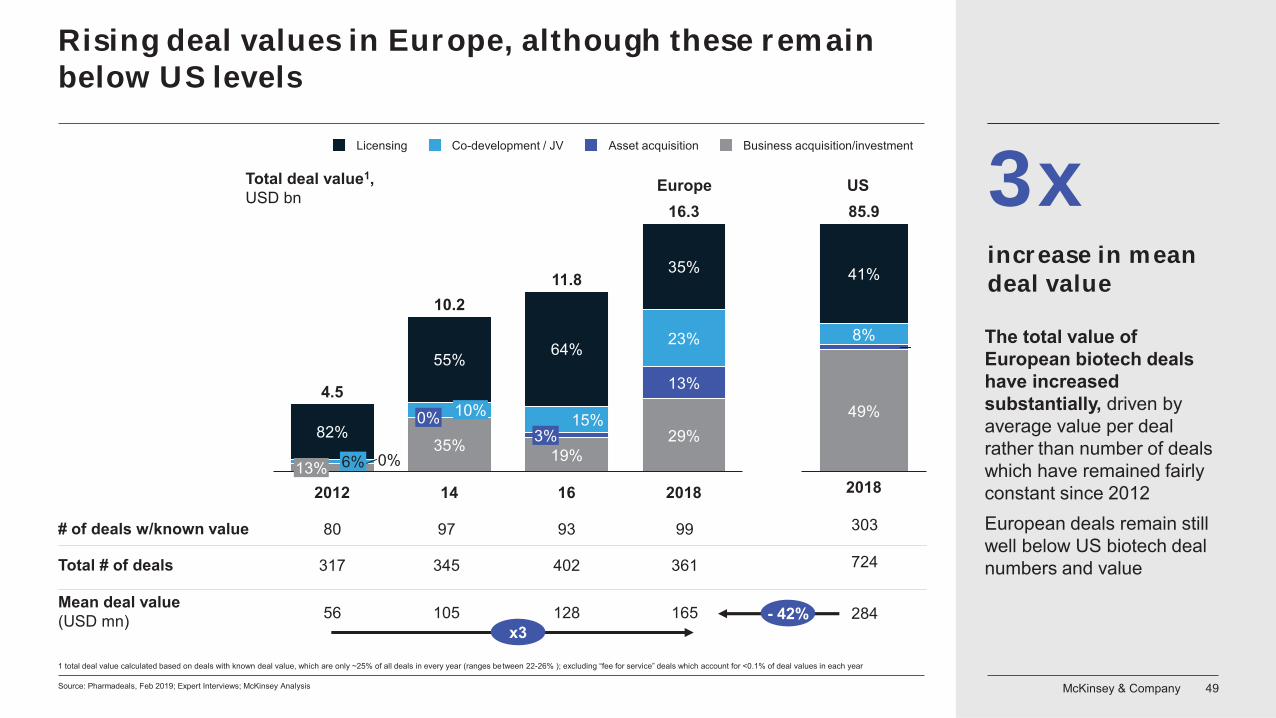
Rising deal values in Europe, although these remain below US levels
80 97 93 99# of deals w/known value
1 total deal value calculated based on deals with known deal value, which are only ~25% of all deals in every year (ranges between 22-26% ); excluding “fee for service” deals which account for <0.1% of deal values in each year
Source: Pharmadeals, Feb 2019; Expert Interviews; McKinsey Analysis
Total deal value1, USD bn
Licensing Co-development / JV Asset acquisition Business acquisition/investment
Europe
41%
8%
85.9
2%
49%
2018
US
317 345 402 361Total # of deals 724
303
increase in mean deal value
3x
56 105 128 165 284Mean deal value (USD mn) - 42%
x3
The total value of European biotech deals have increased substantially, driven by average value per deal rather than number of dealswhich have remained fairly constant since 2012European deals remain still well below US biotech deal numbers and value
McKinsey & Company 50
4
16
14
12
10
18
8
6
0
2
55%
29%
13%
82%
14
3%6%
10.2
35%0%
2012
10%0%
64%
15%
19%
16
35%
23%
13%
2018
4.5
11.8
16.3
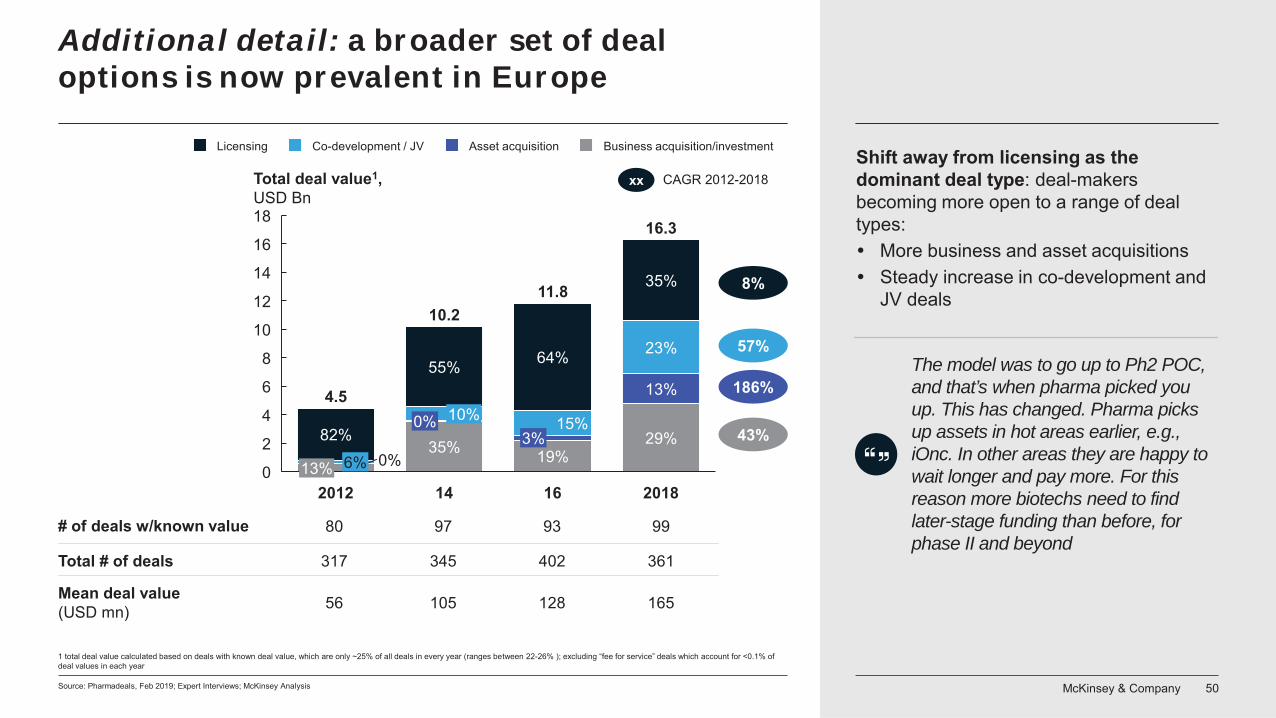
Mean deal value (USD mn) 56 105 128 165
317 345 402 361Total # of deals
Total deal value1, USD Bn
Licensing Business acquisition/investmentCo-development / JV Asset acquisition
xx CAGR 2012-2018
80 97 93 99# of deals w/known value
8%
57%
43%
186%The model was to go up to Ph2 POC, and that’s when pharma picked you up. This has changed. Pharma picks up assets in hot areas earlier, e.g., iOnc. In other areas they are happy to wait longer and pay more. For this reason more biotechs need to find later-stage funding than before, for phase II and beyond
1 total deal value calculated based on deals with known deal value, which are only ~25% of all deals in every year (ranges between 22-26% ); excluding “fee for service” deals which account for <0.1% of deal values in each year
Shift away from licensing as the dominant deal type: deal-makers becoming more open to a range of deal types:
More business and asset acquisitionsSteady increase in co-development and JV deals
Additional detail: a broader set of deal options is now prevalent in Europe
Source: Pharmadeals, Feb 2019; Expert Interviews; McKinsey Analysis
McKinsey & Company 51
2.90.8
4.0
1.3
1.0
2.6
4.2 5.0
3.9
12
4
0
8
2
6
10
5.6
142012
0.6
11.8
0.516 2018
2.9
6.5
4.1x
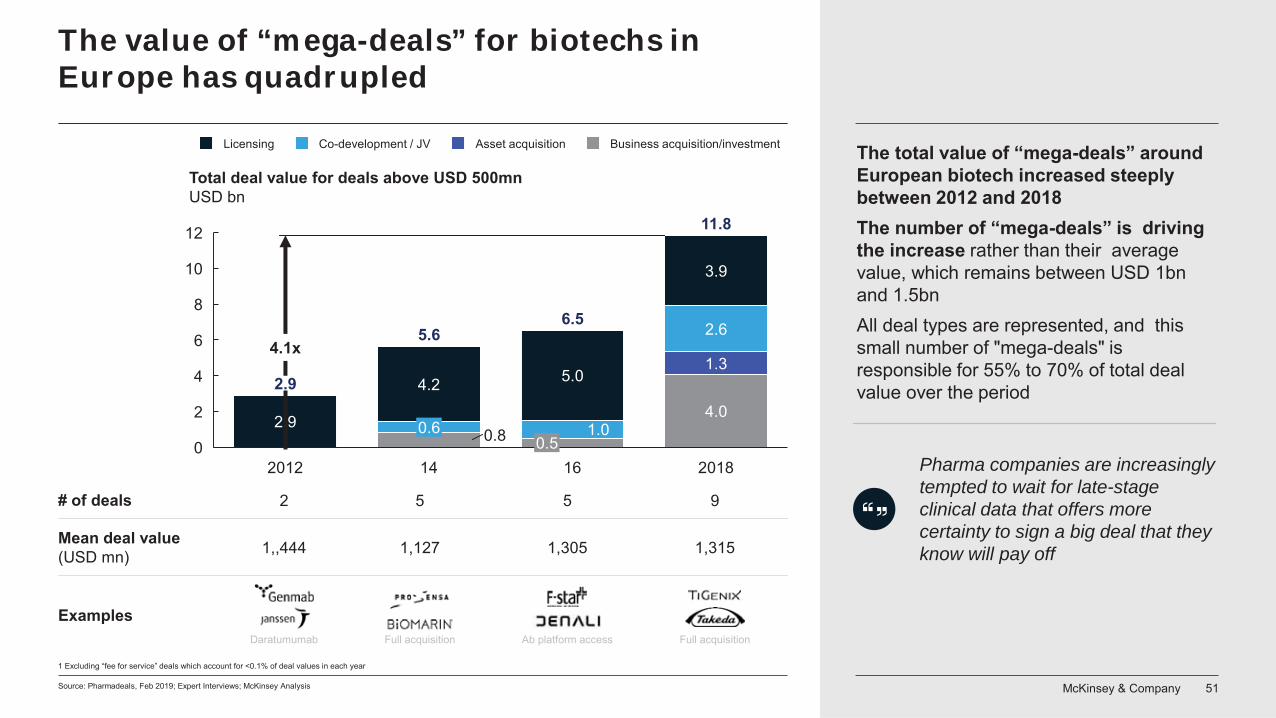
The value of “mega-deals” for biotechs in Europe has quadrupled
Licensing Co-development / JV Business acquisition/investmentAsset acquisition
Total deal value for deals above USD 500mn USD bn
1 Excluding “fee for service” deals which account for <0.1% of deal values in each year
Pharma companies are increasingly tempted to wait for late-stage clinical data that offers more certainty to sign a big deal that they know will pay off
The total value of “mega-deals” around European biotech increased steeply between 2012 and 2018The number of “mega-deals” is driving the increase rather than their average value, which remains between USD 1bn and 1.5bnAll deal types are represented, and this small number of "mega-deals" is responsible for 55% to 70% of total deal value over the period
Mean deal value (USD mn) 1,,444 1,127 1,305 1,315
# of deals 2 5 5 9
ExamplesDaratumumab Full acquisition Ab platform access Full acquisition
Source: Pharmadeals, Feb 2019; Expert Interviews; McKinsey Analysis
McKinsey & Company 52
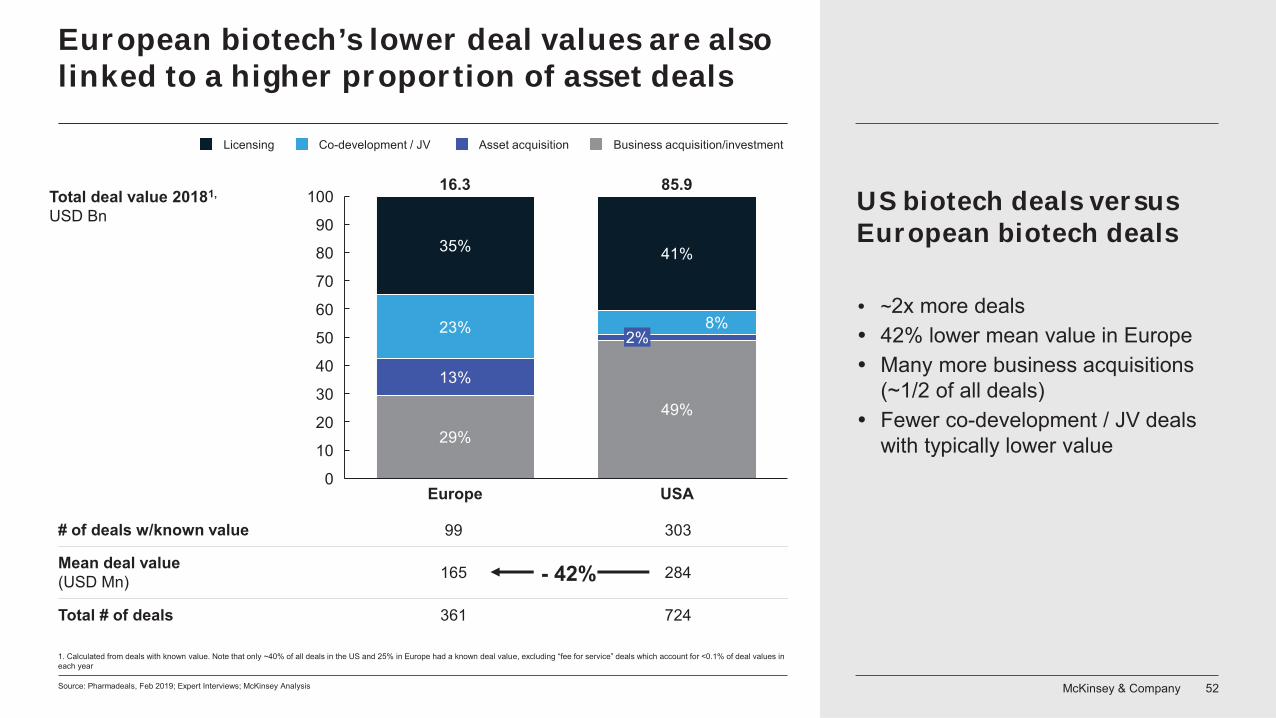
European biotech’s lower deal values are also linked to a higher proportion of asset deals
29%
49%
13%
23% 8%
35% 41%
0
20
10
30
60
50
40
70
80
90
100Total deal value 20181,
USD Bn
Europe
2%
USA
16.3 85.9
Business acquisition/investmentLicensing Co-development / JV Asset acquisition
Total # of deals 361 724
# of deals w/known value 99 303
Mean deal value (USD Mn) 165 284- 42%
US biotech deals versus European biotech deals
~2x more deals42% lower mean value in EuropeMany more business acquisitions (~1/2 of all deals)Fewer co-development / JV deals with typically lower value
1. Calculated from deals with known value. Note that only ~40% of all deals in the US and 25% in Europe had a known deal value, excluding “fee for service” deals which account for <0.1% of deal values in each year
Source: Pharmadeals, Feb 2019; Expert Interviews; McKinsey Analysis
McKinsey & Company 53
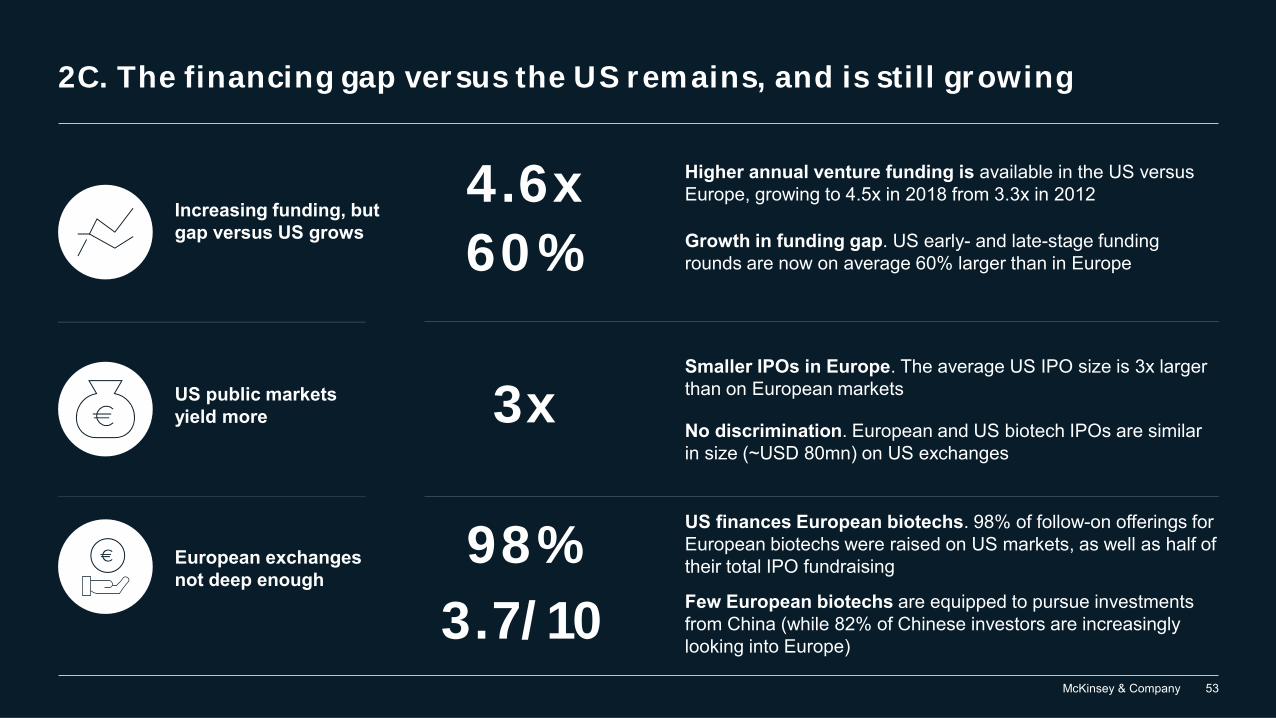
2C. The financing gap versus the US remains, and is still growing
European exchanges not deep enough
US finances European biotechs. 98% of follow-on offerings for European biotechs were raised on US markets, as well as half of their total IPO fundraising 98%
3.7/10
US public markets yield more
Smaller IPOs in Europe. The average US IPO size is 3x larger than on European markets3xNo discrimination. European and US biotech IPOs are similar in size (~USD 80mn) on US exchanges
Higher annual venture funding is available in the US versus Europe, growing to 4.5x in 2018 from 3.3x in 20124.6x
60% Growth in funding gap. US early- and late-stage funding rounds are now on average 60% larger than in Europe
Increasing funding, but gap versus US grows
Few European biotechs are equipped to pursue investments from China (while 82% of Chinese investors are increasingly looking into Europe)
McKinsey & Company 54
082005 06 07 20181709 10
2
11 12
4
15 1613
3
141
~ 4x
~ 3x
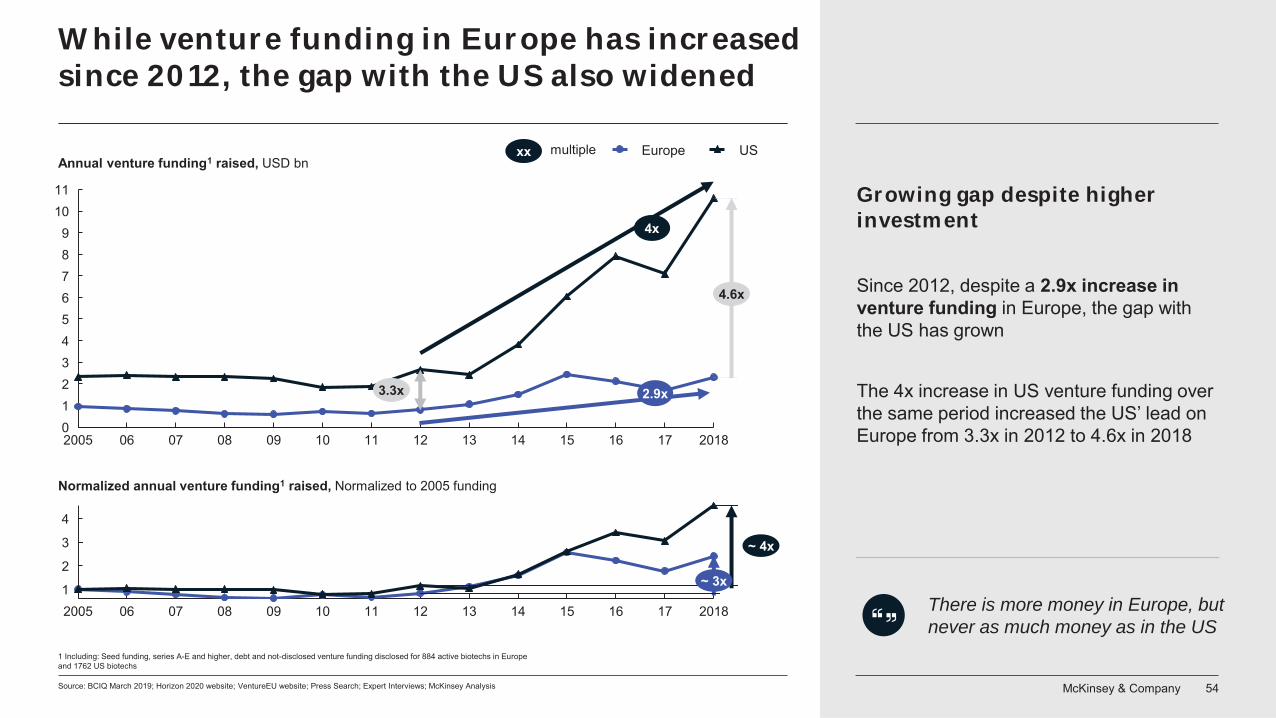
While venture funding in Europe has increased since 2012, the gap with the US also widened
Source: BCIQ March 2019; Horizon 2020 website; VentureEU website; Press Search; Expert Interviews; McKinsey Analysis
Normalized annual venture funding1 raised, Normalized to 2005 funding
Annual venture funding1 raised, USD bn
07 08 1409 10
4
11 1312
9
15 16 17
6
2018062005
123
5
7
0
1011
8
4.6x
3.3x
Europe US
1 Including: Seed funding, series A-E and higher, debt and not-disclosed venture funding disclosed for 884 active biotechs in Europe and 1762 US biotechs
xx multiple
Growing gap despite higher investment
Since 2012, despite a 2.9x increase in venture funding in Europe, the gap with the US has grown
The 4x increase in US venture funding over the same period increased the US’ lead on Europe from 3.3x in 2012 to 4.6x in 2018
There is more money in Europe, but never as much money as in the US
2.9x
4x
McKinsey & Company 55
6.96.2
5.44.9 4.6
Series C and higher
Series A Follow-on offerings
Series B IPO
Source: Expert survey and Interviews 2019 ; McKinsey Analysis
8.0
5.4 5.7
9
2
1
0
3
4
5
6
7
8
10
ChinaUS Europe
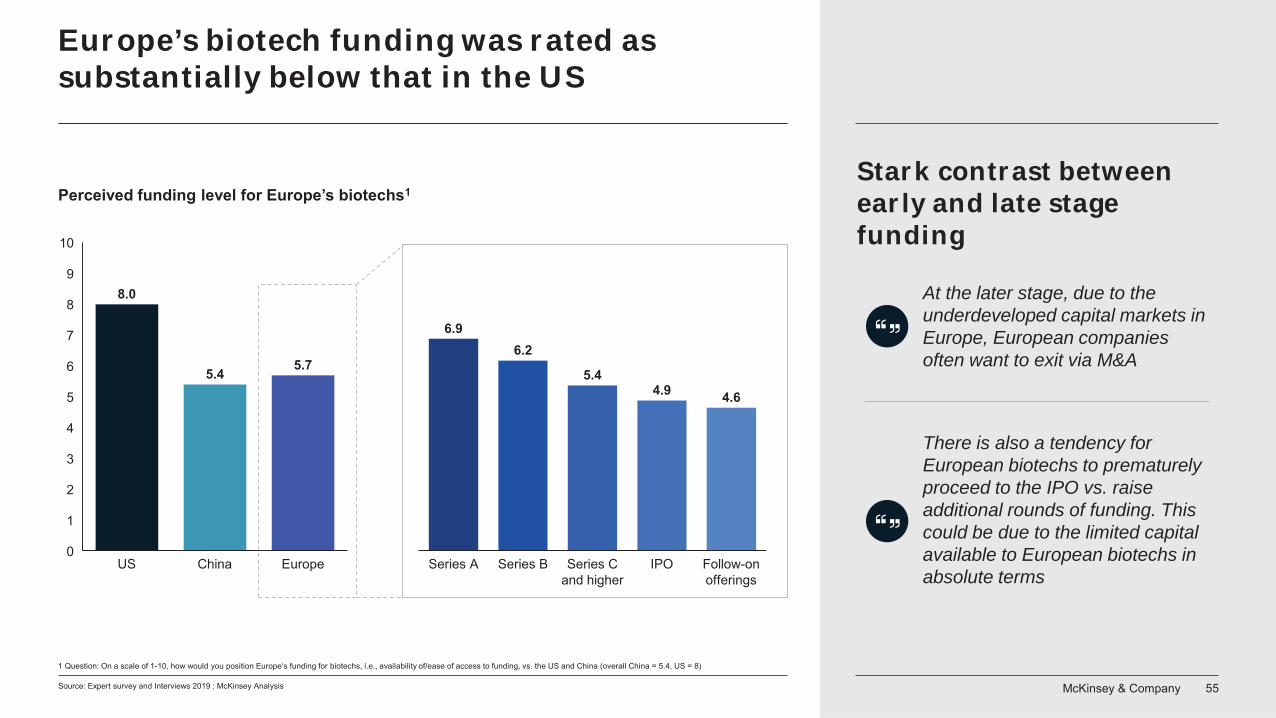
Perceived funding level for Europe’s biotechs1Stark contrast between early and late stage funding
1 Question: On a scale of 1-10, how would you position Europe‘s funding for biotechs, i.e., availability of/ease of access to funding, vs. the US and China (overall China = 5.4, US = 8)
At the later stage, due to the underdeveloped capital markets in Europe, European companies often want to exit via M&A
There is also a tendency for European biotechs to prematurely proceed to the IPO vs. raise additional rounds of funding. This could be due to the limited capital available to European biotechs in absolute terms
Europe’s biotech funding was rated as substantially below that in the US
McKinsey & Company 56
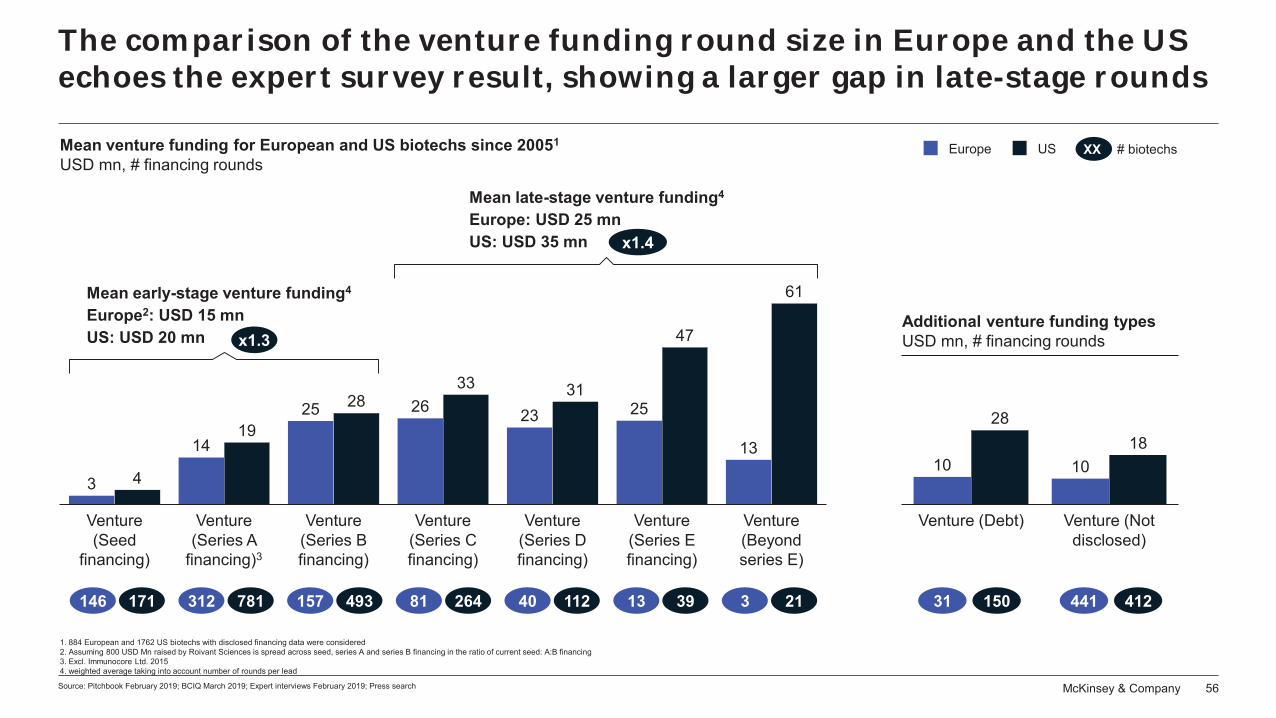
The comparison of the venture funding round size in Europe and the US echoes the expert survey result, showing a larger gap in late-stage rounds
Source: Pitchbook February 2019; BCIQ March 2019; Expert interviews February 2019; Press search
441 412 31 150
Mean venture funding for European and US biotechs since 20051
USD mn, # financing roundsXXx # biotechs
146 171 312 781 157 493 81 264 40 112 13 39 3 21
4
Venture (Series A
financing)3
3
Venture (Seed
financing)
Venture (Series B financing)
Venture (Series C financing)
Venture (Series D financing)
Venture (Beyond series E)
Venture (Series E financing)
1419
2525 28 2633
2331
47
13
61
Europe US
1018
10
Venture (Debt)
28
Venture (Not disclosed)
1. 884 European and 1762 US biotechs with disclosed financing data were considered2. Assuming 800 USD Mn raised by Roivant Sciences is spread across seed, series A and series B financing in the ratio of current seed: A:B financing3. Excl. Immunocore Ltd. 20154. weighted average taking into account number of rounds per lead
Mean early-stage venture funding4
Europe2: USD 15 mnUS: USD 20 mn x1.3
Mean late-stage venture funding4
Europe: USD 25 mnUS: USD 35 mn x1.4
Additional venture funding typesUSD mn, # financing rounds
McKinsey & Company 57
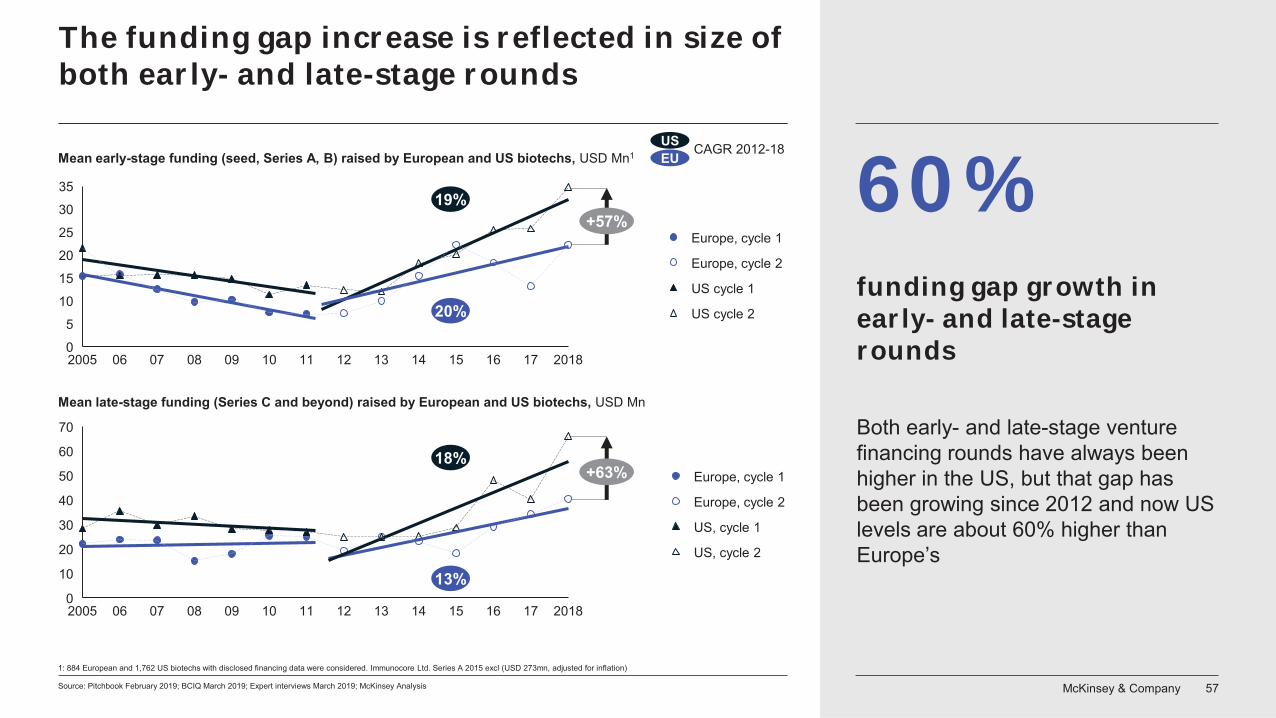
The funding gap increase is reflected in size of both early- and late-stage rounds
Source: Pitchbook February 2019; BCIQ March 2019; Expert interviews March 2019; McKinsey Analysis
10
20
2005 1206 07 0908 11 13 14 15 16
70
50
17 20180
10
30
40
60
12112005 07
15
060
1008 09 13 14 1615 17 2018
5
10
20
25
30
35
Europe, cycle 1
US cycle 1
Europe, cycle 2
US cycle 2
Europe, cycle 1
Europe, cycle 2
US, cycle 1
US, cycle 2
19%
20%
13%
18%
Mean early-stage funding (seed, Series A, B) raised by European and US biotechs, USD Mn1
Mean late-stage funding (Series C and beyond) raised by European and US biotechs, USD Mn
+57%
CAGR 2012-18USEU
+63%
1: 884 European and 1,762 US biotechs with disclosed financing data were considered. Immunocore Ltd. Series A 2015 excl (USD 273mn, adjusted for inflation)
funding gap growth in early- and late-stage rounds
Both early- and late-stage venture financing rounds have always been higher in the US, but that gap has been growing since 2012 and now US levels are about 60% higher than Europe’s
60%
McKinsey & Company 58
3.37.7
1.2 2.74.7
0.52.4
6.7
1.0 1.53.8 2.6
0
5
10
Ratio of early- to late-stage funding2
2.7: Europe avrg.1.9: US avrg.
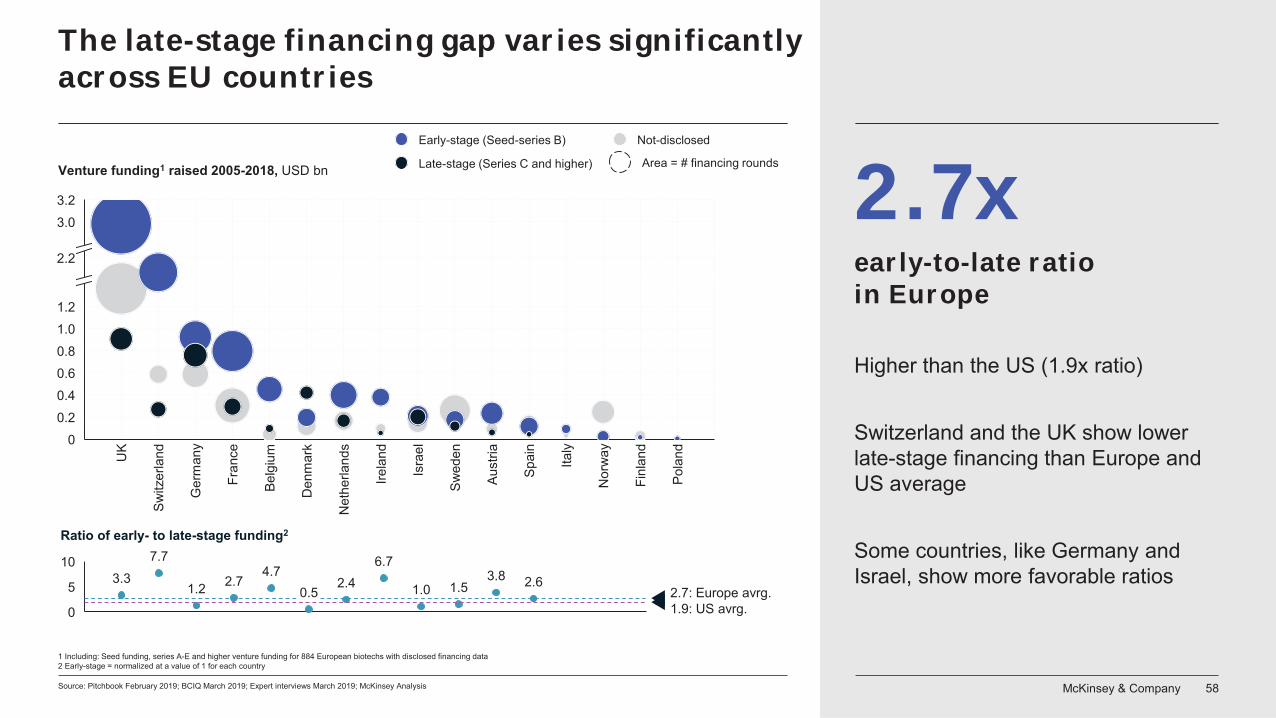
The late-stage financing gap varies significantly across EU countries
Source: Pitchbook February 2019; BCIQ March 2019; Expert interviews March 2019; McKinsey Analysis
Irela
nd
1.0
2.2
3.03.2
UK
Switz
erla
nd
0.6
1.2
Net
herla
nds
Pola
nd
Finl
and
Aust
ria
Den
mar
k
Belg
ium
Italy
Nor
way
Ger
man
y
Fran
ce
0
0.8
0.20.4
Isra
el
Spai
n
Swed
en
Area = # financing rounds
Early-stage (Seed-series B) Not-disclosed
Late-stage (Series C and higher)
1 Including: Seed funding, series A-E and higher venture funding for 884 European biotechs with disclosed financing data2 Early-stage = normalized at a value of 1 for each country
Venture funding1 raised 2005-2018, USD bn 2.7x early-to-late ratio in Europe
Higher than the US (1.9x ratio)
Switzerland and the UK show lower late-stage financing than Europe and US average
Some countries, like Germany and Israel, show more favorable ratios
McKinsey & Company 59
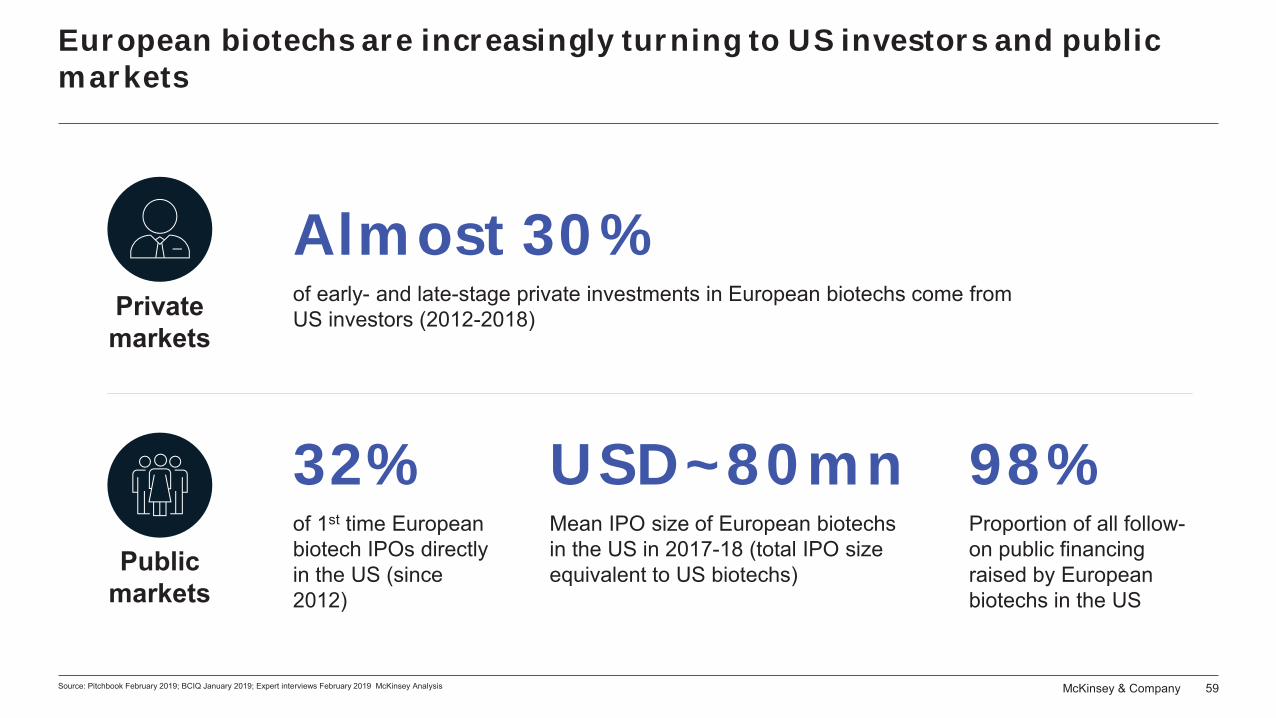
European biotechs are increasingly turning to US investors and public markets
Almost 30%of early- and late-stage private investments in European biotechs come from US investors (2012-2018) Private
markets
98%Proportion of all follow-on public financing raised by European biotechs in the US
USD~80mnMean IPO size of European biotechs in the US in 2017-18 (total IPO size equivalent to US biotechs)
32%of 1st time European biotech IPOs directly in the US (since 2012)
Public markets
Source: Pitchbook February 2019; BCIQ January 2019; Expert interviews February 2019 McKinsey Analysis
McKinsey & Company 60
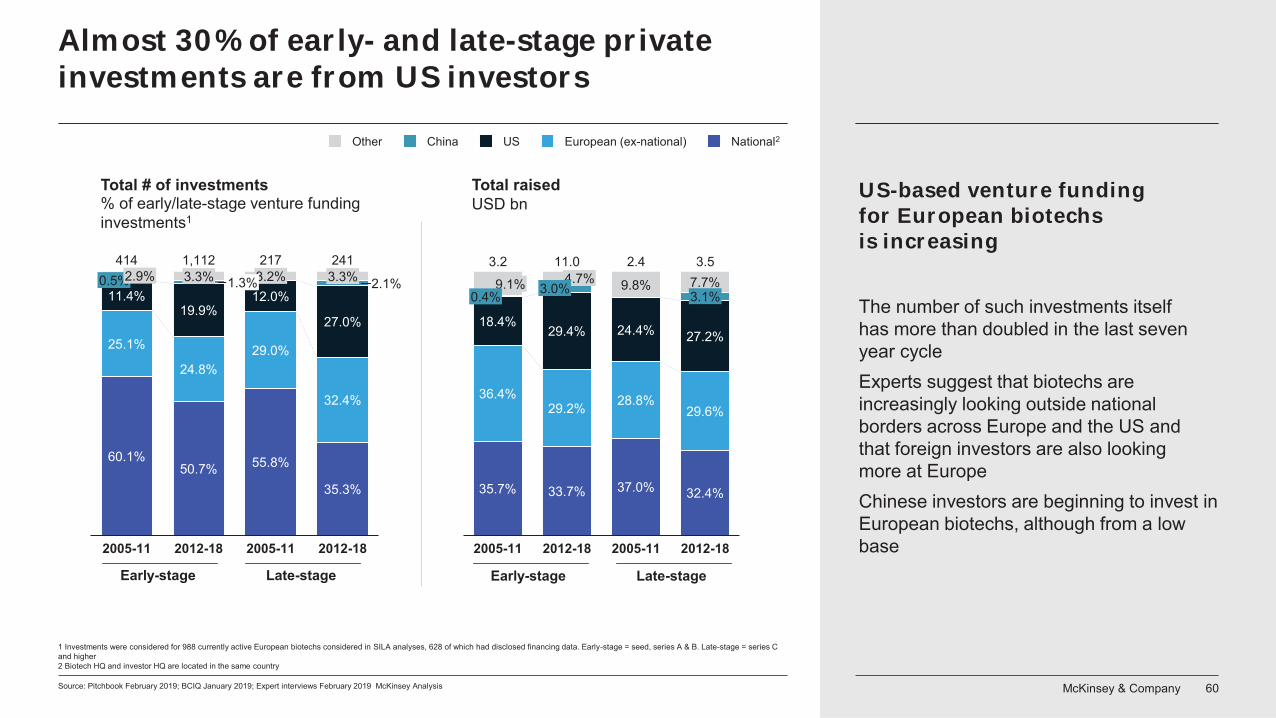
Almost 30% of early- and late-stage private investments are from US investors
Source: Pitchbook February 2019; BCIQ January 2019; Expert interviews February 2019 McKinsey Analysis
60.1%50.7% 55.8%
35.3%
25.1%
24.8%29.0%
32.4%
11.4%19.9%
12.0%
27.0%
2.1%0.5%2.9%
2005-11
3.3%241
3.2%1.3%
2012-18 2005-11
3.3%
2012-18
414 1,112 217
Other National2China US European (ex-national)
% of early/late-stage venture funding investments1
35.7% 33.7% 37.0% 32.4%
36.4%29.2% 28.8%
29.6%
18.4%29.4% 24.4% 27.2%
9.8% 7.7%3.1%
2012-182005-11
9.1% 4.7%0.4% 3.0%
2005-11 2012-18
3.2 2.411.0 3.5
Total raised USD bn
1 Investments were considered for 988 currently active European biotechs considered in SILA analyses, 628 of which had disclosed financing data. Early-stage = seed, series A & B. Late-stage = series C and higher2 Biotech HQ and investor HQ are located in the same country
Total # of investments US-based venture funding for European biotechsis increasing
The number of such investments itself has more than doubled in the last seven year cycleExperts suggest that biotechs are increasingly looking outside national borders across Europe and the US and that foreign investors are also looking more at EuropeChinese investors are beginning to invest in European biotechs, although from a low base
Early-stage Late-stage Early-stage Late-stage
McKinsey & Company 61
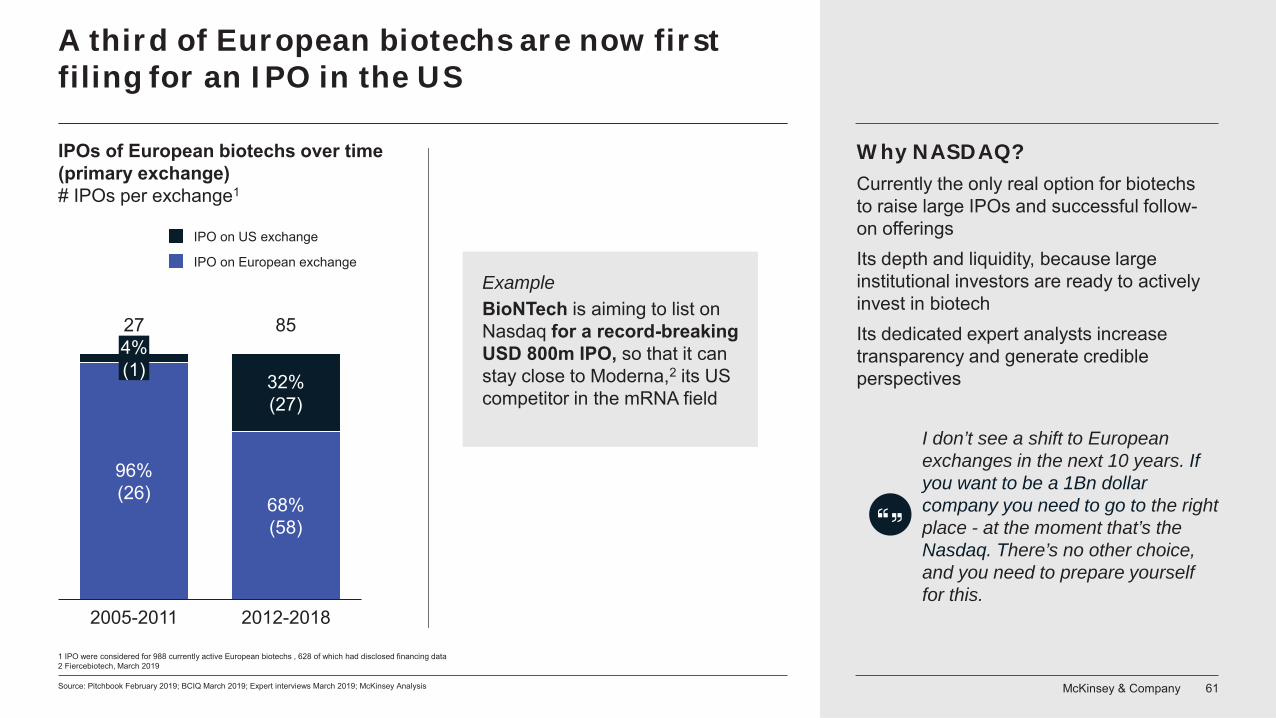
A third of European biotechs are now first filing for an IPO in the US
Source: Pitchbook February 2019; BCIQ March 2019; Expert interviews March 2019; McKinsey Analysis
1 IPO were considered for 988 currently active European biotechs , 628 of which had disclosed financing data2 Fiercebiotech, March 2019
IPOs of European biotechs over time(primary exchange)# IPOs per exchange1
854%(1)
96%(26)
2005-2011
68%(58)
32%(27)
2012-2018
27
IPO on US exchange
IPO on European exchangeExampleBioNTech is aiming to list on Nasdaq for a record-breaking USD 800m IPO, so that it can stay close to Moderna,2 its US competitor in the mRNA field
Why NASDAQ?Currently the only real option for biotechsto raise large IPOs and successful follow-on offeringsIts depth and liquidity, because largeinstitutional investors are ready to actively invest in biotechIts dedicated expert analysts increase transparency and generate credible perspectives
I don’t see a shift to European exchanges in the next 10 years. If you want to be a 1Bn dollar company you need to go to the right place - at the moment that’s the Nasdaq. There’s no other choice, and you need to prepare yourself for this.
McKinsey & Company 62
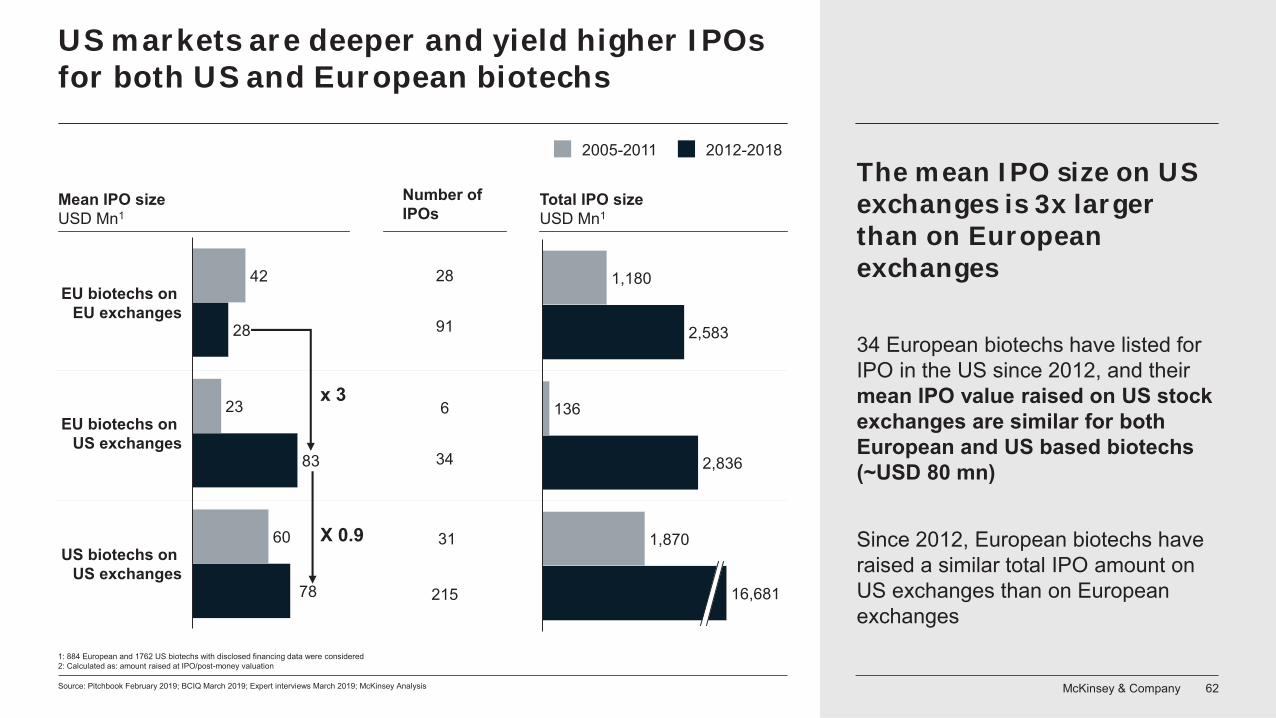
US markets are deeper and yield higher IPOs for both US and European biotechs
Source: Pitchbook February 2019; BCIQ March 2019; Expert interviews March 2019; McKinsey Analysis
EU biotechs on EU exchanges
23EU biotechs on
US exchanges
US biotechs on US exchanges
83
42
28
60
78
2005-2011 2012-2018
1: 884 European and 1762 US biotechs with disclosed financing data were considered2: Calculated as: amount raised at IPO/post-money valuation
1,870
2,583
1,180
136
2,836
16,681
Mean IPO size USD Mn1
Total IPO size USD Mn1
x 3
X 0.9
28
91
6
34
31
215
Number of IPOs
The mean IPO size on US exchanges is 3x larger than on European exchanges
34 European biotechs have listed for IPO in the US since 2012, and their mean IPO value raised on US stock exchanges are similar for both European and US based biotechs (~USD 80 mn)
Since 2012, European biotechs have raised a similar total IPO amount on US exchanges than on European exchanges
McKinsey & Company 63
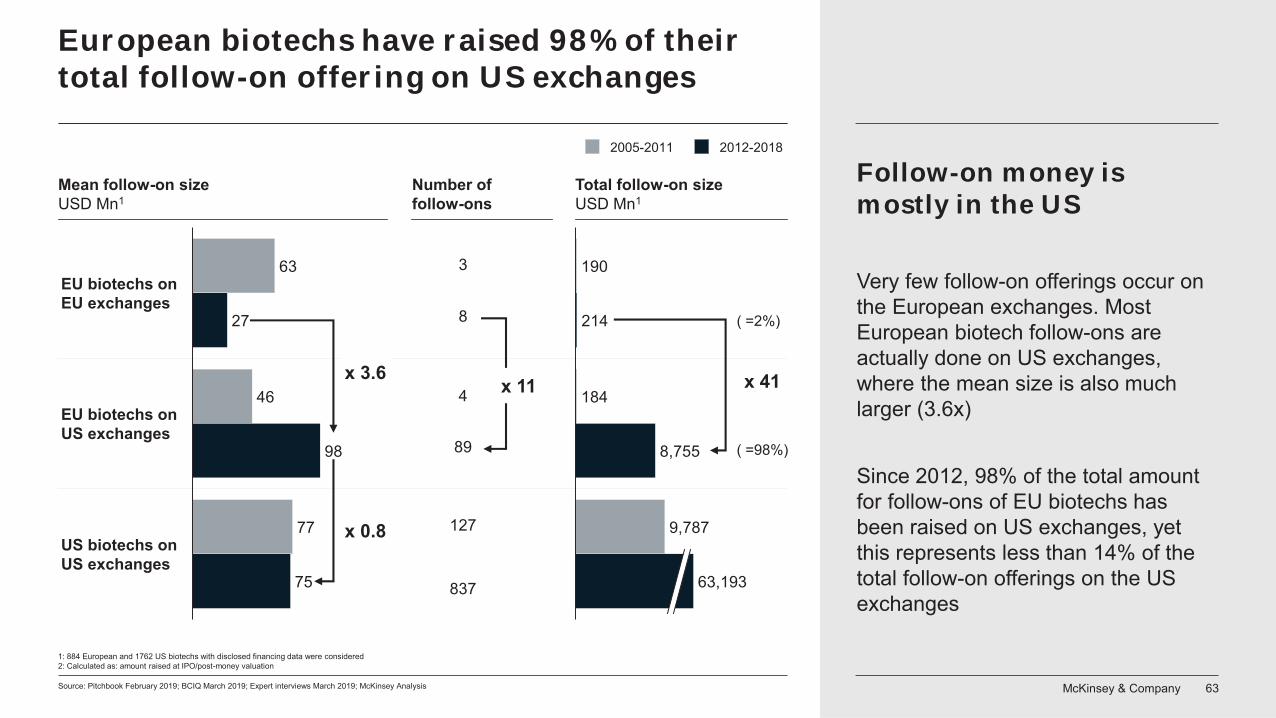
European biotechs have raised 98% of their total follow-on offering on US exchanges
Source: Pitchbook February 2019; BCIQ March 2019; Expert interviews March 2019; McKinsey Analysis
1: 884 European and 1762 US biotechs with disclosed financing data were considered2: Calculated as: amount raised at IPO/post-money valuation
EU biotechs on EU exchanges
98
US biotechs on US exchanges
EU biotechs on US exchanges
75
63
27
46
77
Mean follow-on size USD Mn1
2005-2011 2012-2018
9,787
184
214
8,755
190
63,193
Total follow-on size USD Mn1
Follow-on money is mostly in the US
Very few follow-on offerings occur on the European exchanges. Most European biotech follow-ons are actually done on US exchanges, where the mean size is also much larger (3.6x)
Since 2012, 98% of the total amount for follow-ons of EU biotechs has been raised on US exchanges, yet this represents less than 14% of the total follow-on offerings on the US exchanges
x 41
x 0.8
8
4
89
127
837
Number of follow-ons
3
x 11x 3.6
( =2%)
( =98%)
McKinsey & Company 64
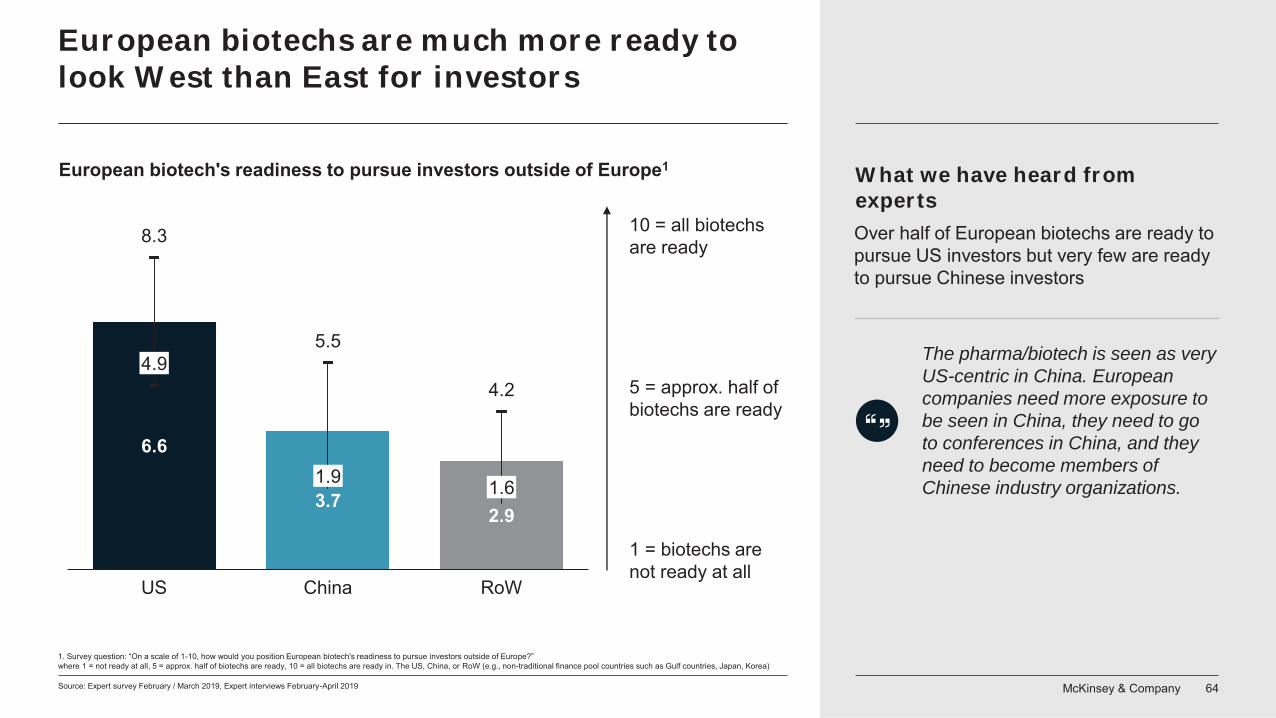
European biotechs are much more ready to look West than East for investors
Source: Expert survey February / March 2019, Expert interviews February-April 2019
1. Survey question: “On a scale of 1-10, how would you position European biotech's readiness to pursue investors outside of Europe?”where 1 = not ready at all, 5 = approx. half of biotechs are ready, 10 = all biotechs are ready in. The US, China, or RoW (e.g., non-traditional finance pool countries such as Gulf countries, Japan, Korea)
6.6
8.3
5.5
4.2
ChinaUS
4.9
1.93.7
2.91.6
RoW
10 = all biotechs are ready
5 = approx. half of biotechs are ready
1 = biotechs are not ready at all
What we have heard from experts
The pharma/biotech is seen as very US-centric in China. European companies need more exposure to be seen in China, they need to go to conferences in China, and they need to become members of Chinese industry organizations.
Over half of European biotechs are ready to pursue US investors but very few are ready to pursue Chinese investors
European biotech's readiness to pursue investors outside of Europe1
McKinsey & Company 65
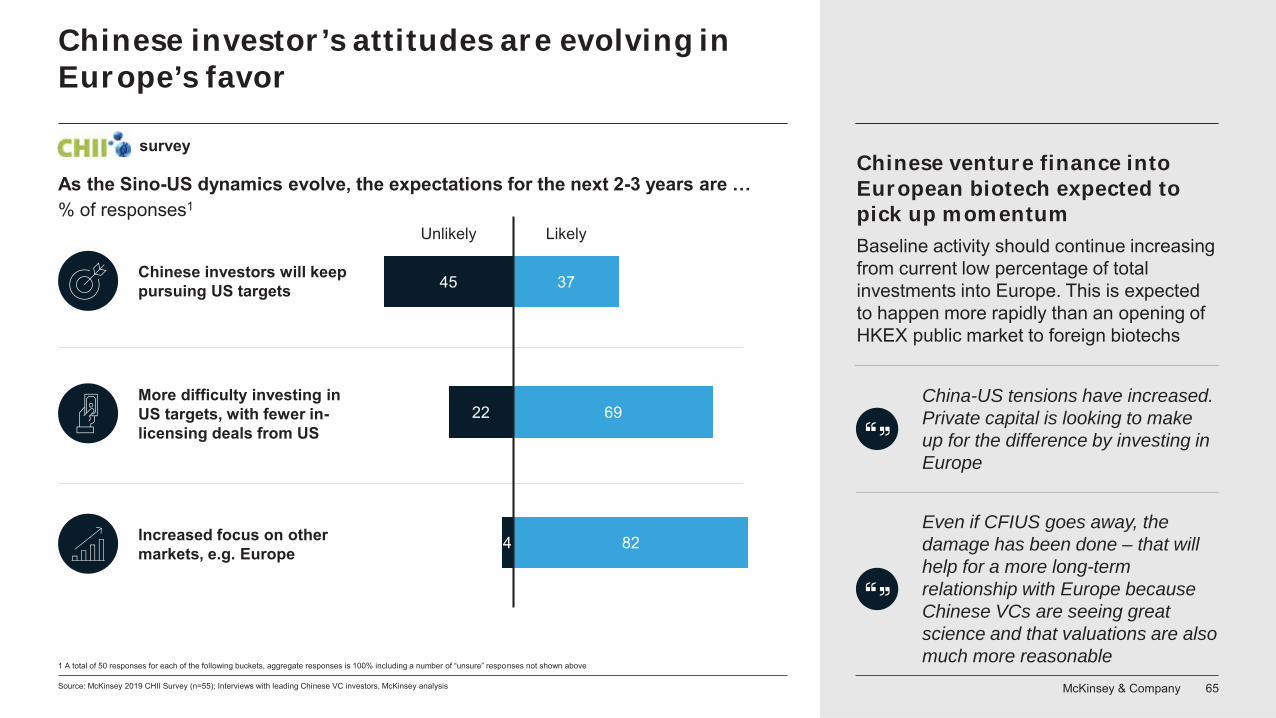
Chinese investor’s attitudes are evolving in Europe’s favor
1 A total of 50 responses for each of the following buckets, aggregate responses is 100% including a number of “unsure” responses not shown above
survey
As the Sino-US dynamics evolve, the expectations for the next 2-3 years are …% of responses1
China-US tensions have increased. Private capital is looking to make up for the difference by investing in Europe
Even if CFIUS goes away, the damage has been done – that will help for a more long-term relationship with Europe because Chinese VCs are seeing great science and that valuations are also much more reasonable
Chinese venture finance into European biotech expected to pick up momentumBaseline activity should continue increasing from current low percentage of total investments into Europe. This is expected to happen more rapidly than an opening of HKEX public market to foreign biotechs
Source: McKinsey 2019 CHII Survey (n=55); Interviews with leading Chinese VC investors, McKinsey analysis
Chinese investors will keep pursuing US targets
More difficulty investing in US targets, with fewer in-licensing deals from US
Increased focus on other markets, e.g. Europe
45
22
4
37
69
82
Unlikely Likely
McKinsey & Company 66
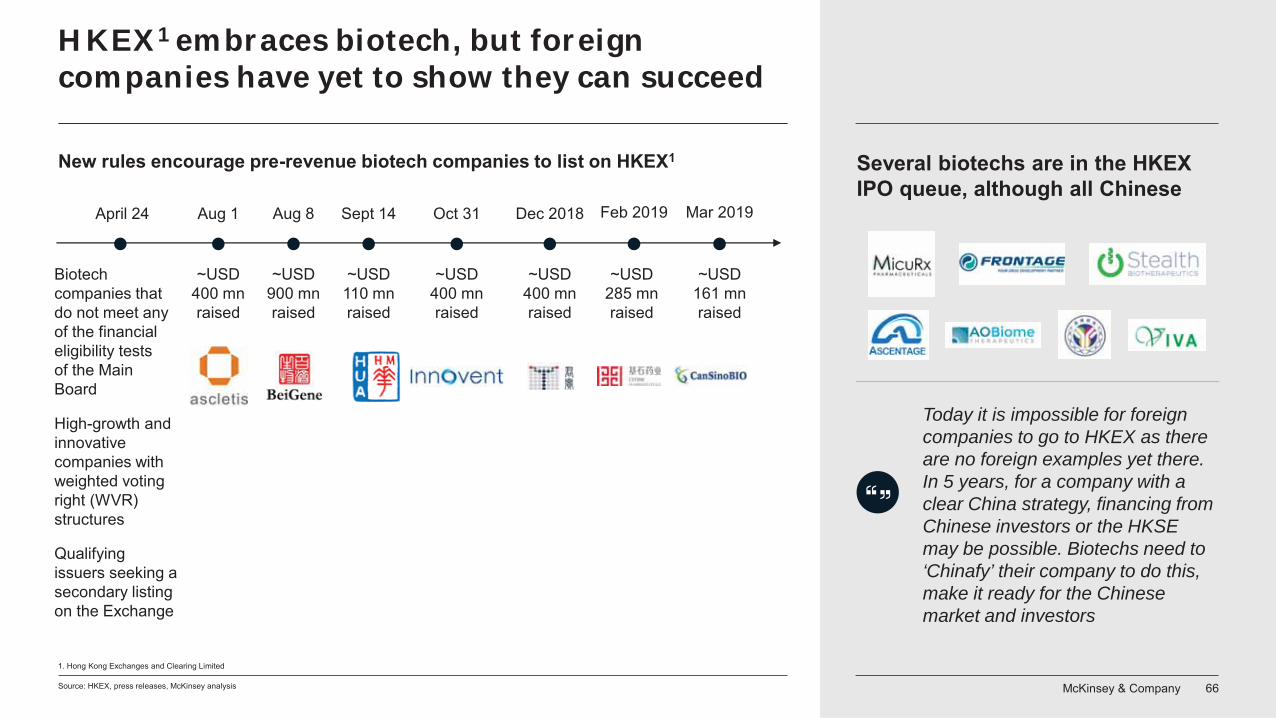
HKEX1 embraces biotech, but foreign companies have yet to show they can succeed
Source: HKEX, press releases, McKinsey analysis
1. Hong Kong Exchanges and Clearing Limited
New rules encourage pre-revenue biotech companies to list on HKEX1
Biotech companies that do not meet any of the financial eligibility tests of the Main Board
High-growth and innovative companies with weighted voting right (WVR) structures
Qualifying issuers seeking a secondary listing on the Exchange
April 24
~USD 400 mnraised
Dec 2018
~USD 285 mnraised
Feb 2019
~USD 161 mnraised
Mar 2019Aug 1
~USD 400 mnraised
Aug 8
~USD 900 mnraised
~USD 110 mnraised
Sept 14 Oct 31
~USD 400 mnraised
Today it is impossible for foreign companies to go to HKEX as there are no foreign examples yet there. In 5 years, for a company with a clear China strategy, financing from Chinese investors or the HKSE may be possible. Biotechs need to ‘Chinafy’ their company to do this, make it ready for the Chinese market and investors
Several biotechs are in the HKEX IPO queue, although all Chinese
McKinsey & Company 67
Looking forward: How can leaders and investors succeed?
A. Build your global competitiveness
B. Prepare for success
C. From East to West – open the lens
03
McKinsey & Company 68Source: Expert surveys; McKinsey interviews; McKinsey & Company Pharmaceuticals and Medical Products Practice
Think of global competitiveness, from the get-go
One bird in the hand
Global marketplace
Biotechs need to be better at developing products that will get market access in 10-15 years time and need to consider whether their product will be differentiated enough to be reimbursed by health systems
Smaller trials, committed patient organizations, niche segments, open minded payors: these open new possibilities for biotechs to build a well-defined business. We are seeing more and more going down that route (e.g., rare diseases)
Market access in 10 years
Plan for the future when you will get actual access and reimbursement, across markets
Think of areas of uniqueness and define perimeters where you can win and win big
Story building should come after Ph II. Before that, it is premature. It means you are hoping the science will live up to the story. At the right time, it means you can combine highly differentiated products with high-value development strategies
What industry leaders say
Pitch your innovation and products against your global competition, when it matters
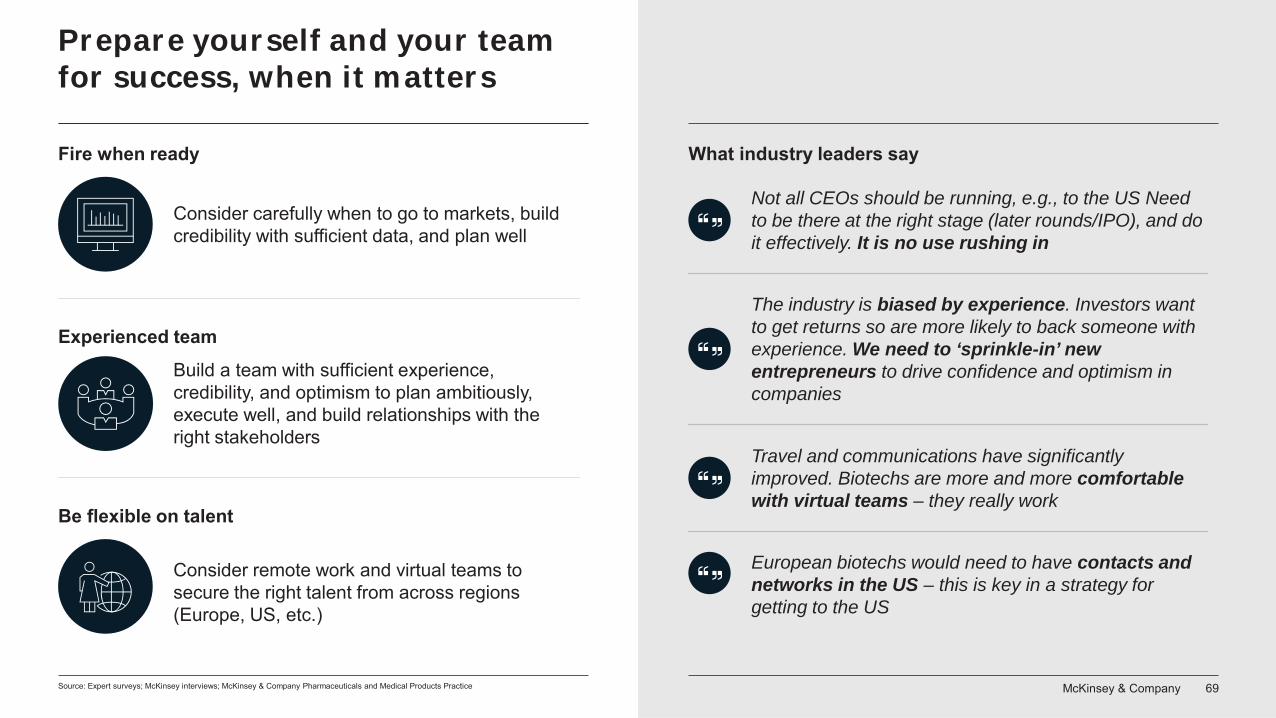
McKinsey & Company 69Source: Expert surveys; McKinsey interviews; McKinsey & Company Pharmaceuticals and Medical Products Practice
Prepare yourself and your team for success, when it matters
Be flexible on talent
Fire when ready
Experienced teamBuild a team with sufficient experience, credibility, and optimism to plan ambitiously, execute well, and build relationships with the right stakeholders
Consider remote work and virtual teams to secure the right talent from across regions (Europe, US, etc.)
Consider carefully when to go to markets, build credibility with sufficient data, and plan well
The industry is biased by experience. Investors want to get returns so are more likely to back someone with experience. We need to ‘sprinkle-in’ new entrepreneurs to drive confidence and optimism in companies
Travel and communications have significantly improved. Biotechs are more and more comfortable with virtual teams – they really work
Not all CEOs should be running, e.g., to the US Need to be there at the right stage (later rounds/IPO), and do it effectively. It is no use rushing in
What industry leaders say
European biotechs would need to have contacts and networks in the US – this is key in a strategy for getting to the US
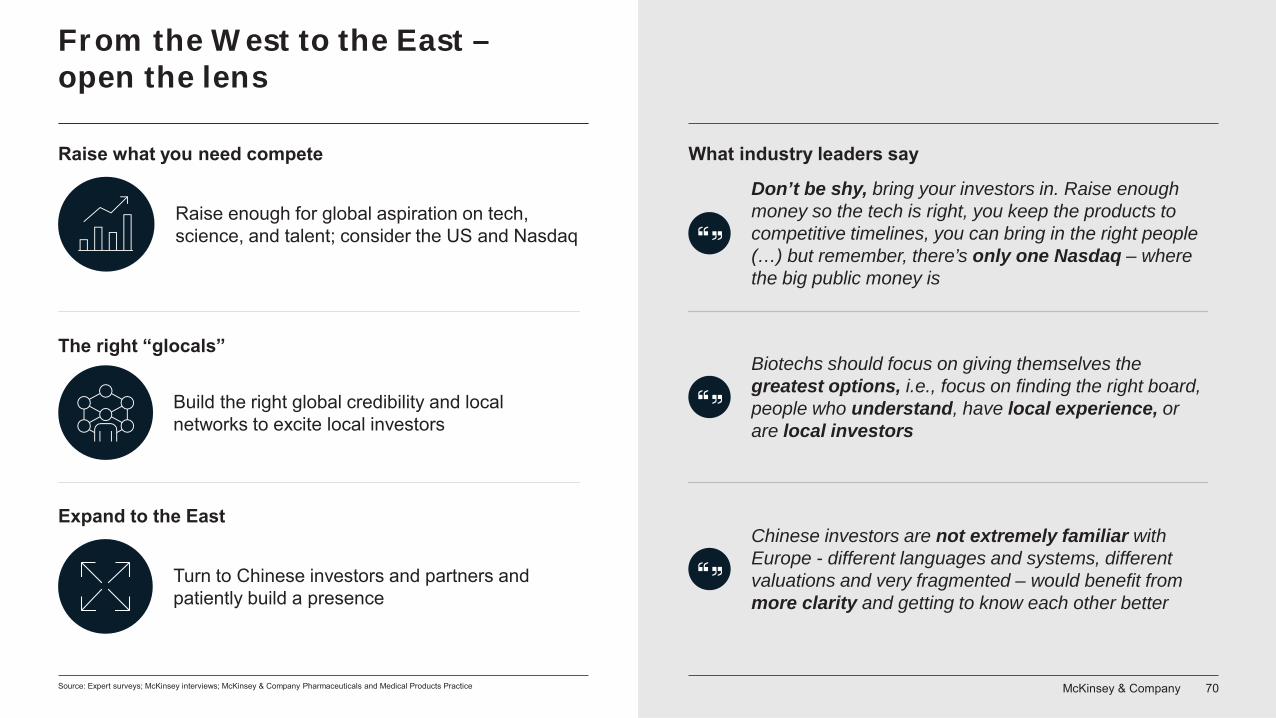
McKinsey & Company 70
From the West to the East –open the lens
Source: Expert surveys; McKinsey interviews; McKinsey & Company Pharmaceuticals and Medical Products Practice
Raise what you need compete
The right “glocals”
Build the right global credibility and local networks to excite local investors
Biotechs should focus on giving themselves the greatest options, i.e., focus on finding the right board, people who understand, have local experience, or are local investors
Don’t be shy, bring your investors in. Raise enough money so the tech is right, you keep the products to competitive timelines, you can bring in the right people (…) but remember, there’s only one Nasdaq – where the big public money is
What industry leaders say
Raise enough for global aspiration on tech, science, and talent; consider the US and Nasdaq
Chinese investors are not extremely familiar with Europe - different languages and systems, different valuations and very fragmented – would benefit from more clarity and getting to know each other better
Expand to the East
Turn to Chinese investors and partners and patiently build a presence
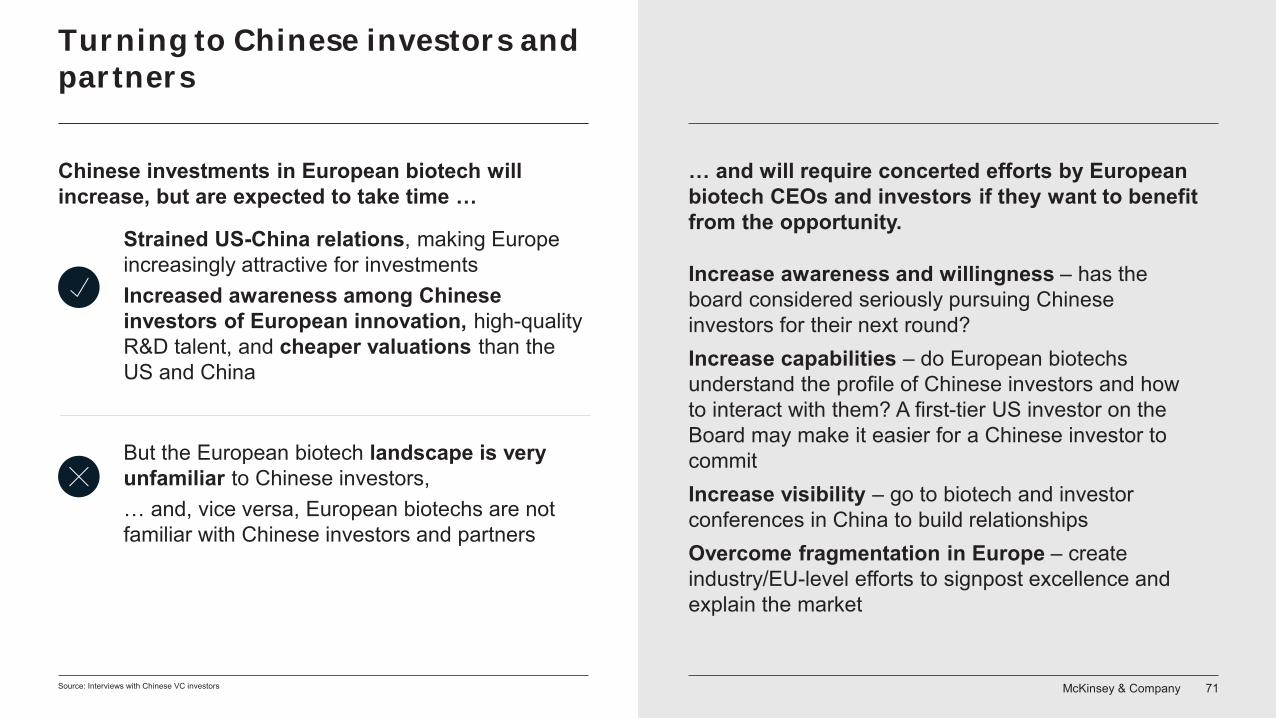
McKinsey & Company 71Source: Interviews with Chinese VC investors
Turning to Chinese investors and partners
Strained US-China relations, making Europe increasingly attractive for investmentsIncreased awareness among Chinese investors of European innovation, high-quality R&D talent, and cheaper valuations than the US and China
But the European biotech landscape is very unfamiliar to Chinese investors, … and, vice versa, European biotechs are not familiar with Chinese investors and partners
Increase awareness and willingness – has the board considered seriously pursuing Chinese investors for their next round?Increase capabilities – do European biotechs understand the profile of Chinese investors and how to interact with them? A first-tier US investor on the Board may make it easier for a Chinese investor to commitIncrease visibility – go to biotech and investor conferences in China to build relationshipsOvercome fragmentation in Europe – create industry/EU-level efforts to signpost excellence and explain the market
Chinese investments in European biotech will increase, but are expected to take time …
… and will require concerted efforts by European biotech CEOs and investors if they want to benefit from the opportunity.
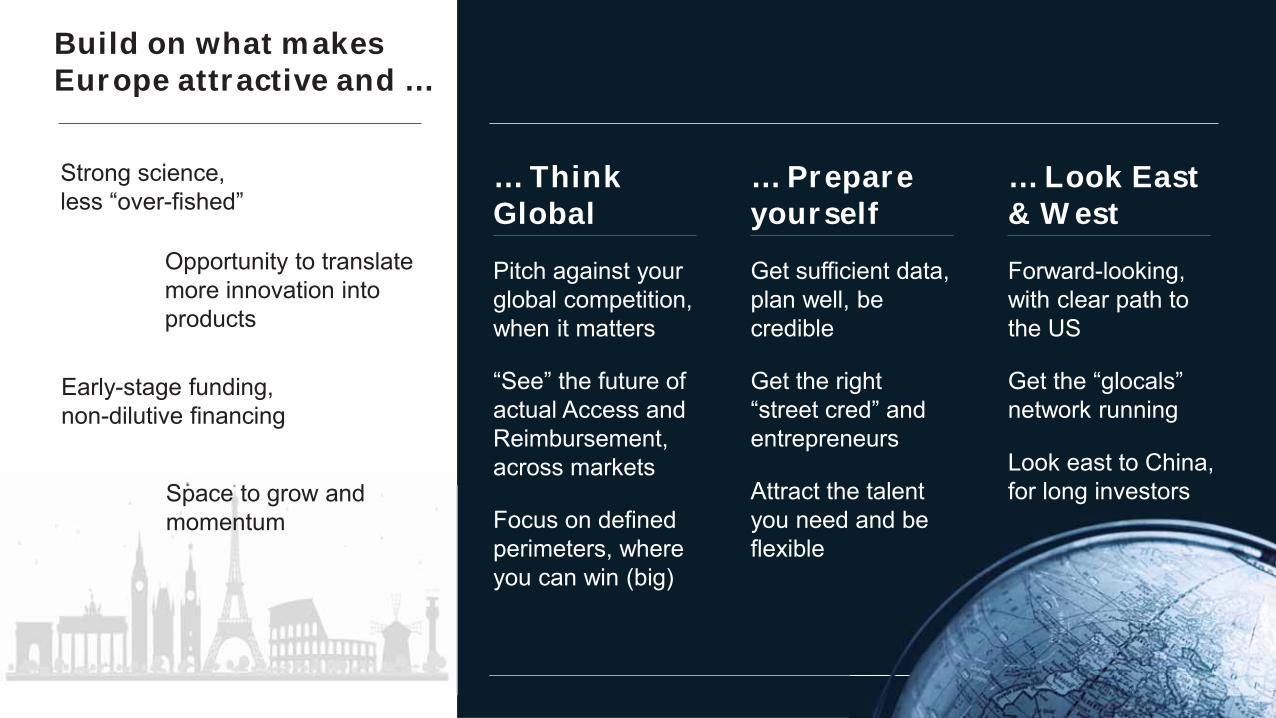
McKinsey & Company 72
Early-stage funding, non-dilutive financing
Opportunity to translate more innovation into products
Build on what makes Europe attractive and …
Strong science, less “over-fished”
McMcMcMcMcMcMcMcMcMcMcMcMcMcMcMcMMcMcMcMcMcMcMcMcMMcMcMcMcMcMcMcMcMcMcMcMMcMcMcMcMcMcMMcMcMcMcMcMMcMccMcMcMMcMccMcMMMMMMMccccccMMMccMMccMccMMMccMcMMMccMcMMMccccccMMMcMccccMMMcMcMccMcMccMMMcMccccMccccMMMMcMccMccMcMccMcMMMcccMMM KiKKKiKiKiKiKiKiKiKiKiKiKKKKiKiKiKiKiKiiKiKiKiKKiKiKKiKiKiiKKiKKKiiiKiKKiKKKKiKiKiKiKiKiKKKiKiKiKiKKKKKKKiKiiKKiKKKiKKKiiKiKiKKiKiiKiKKKKKiKKKKiKKKiKKKKiKKKKKKKKKKKKKKKKiiKKKKKKKKKiKKKKKKKKKKKKKKKKiKKK nnnnnnsnsnsnsnnsnsnssnsnsnssnsnsnsnsnsnnnsnnnnsnnsnnnnsnsnsnsnsnsnnnsnnnnsnsnsnnsnsnsssnsnnnnsnsnsssnsnssnnnssnsnnsnsnsnsnsnnsnnnsnssnnnnnnnnnnnsnnseyeyeyeyeyeyeyeeyeyeyeyeeeyeyeyeyeyeyeeyeyeyeyeyeyeyeyeyeyeyeyyyeyyeyeeyeyeeyeyyeyeeyeyyyeyeyyeeeyeyeyeeyeyeyeyeyeyeyeyyyyeyyyeyyeyyyyyyyyyeeeyeyyyyyyyeyyeyeyeyeyyyeyyeeyeyyyyyyyyyy &&&&&&&&&&&&&&&&&&&&&&&&&&&&&&&&&&&&&&&&&&&&&&&&&&&&&&&&&&&&&&&&&&&&&&&&&&&&&&&&&&&&&&&&&&&&&&&&&&&&&&&&&&&&&&&&&&&&&&&&&&&&&&&&&& CCCCCCCCCCCCCCCCCCCCCCCCCCCCCCCCCCCCCCCCCCCCCCCCCCCCCCCCCCCCCCCCCCCCCCCCCCCCCCCCCCCCCCCCCCCCCCCCCCCCCCCCCCComomomomomomoomomomomomoomomomomomomomomomomomomomommomomomomomomoooomommmomomommomoooomoomomooooomomoomooomooomooommpapapapapapapapapapapapapapaaapapapapapapapapaaapapaapapapapapapaappapapapappaaaaaappaaapaapapaapappapaaapapaapapp nnynynynynynynynynynynynynynynynynynyyynnynynynynynnynynynynnynynyynynnnnynyynynynynyyynynynnnnnynynynyynyynynnnynnnynnnnnnynnnnnnnnnynyyyy 72727272727272727272727272727272722727222727272222727222722227272227272727227272772272727272777277277727777727777777777772277
Space to grow and momentum
… Think Global
Pitch against your global competition, when it matters
“See” the future of actual Access and Reimbursement, across markets
Focus on defined perimeters, where you can win (big)
… Prepare yourself
Get sufficient data, plan well, be credible
Get the right “street cred” and entrepreneurs
Attract the talent you need and be flexible
… Look East & West
Forward-looking, with clear path to the US
Get the “glocals” network running
Look east to China, for long investors

McKinsey & Company 73MMMMMMMcccMMMMMMMMMcMMMMMMMMMMMMMMMccMMMMMcMMMMMMMMMMMMcMMMMcMcMMMMMMMMMMMMMMMMMMMMMMMMMMMM KKiKKiKiiiiinnnnnnnnnnnnnnsnsssnsnssnsnsnsnsnsnnnsnnsnnsnsnssnnsnsnsssnnssnsnsssnssnsseeeeeeeeeyeyeyeyeyeyyyyyyeeeeeeeyeeyeeyeeeeeeeeeyeyeeeeeeyeeeyeeeyeeeeeeee &&&& CCCCCCCCCCCCCCCCCCCCCCCCCCCComomomomomomomomomommmmmmmmooomomomomommooommmommmmommoooooo papapaappp nynynynynynynnnynynnnynnnnnnnnnnnnnnnnnnnnnnnnnynnnnnnnnynnnnnnnnnnnnnnnynnnnnnynnnnnnnynnnnnnnnnnynnnnnnnnny 777737337333737333773737373733733777773737373733737373377777373337373733737377373373773737373773773373337733333373333
Appendix
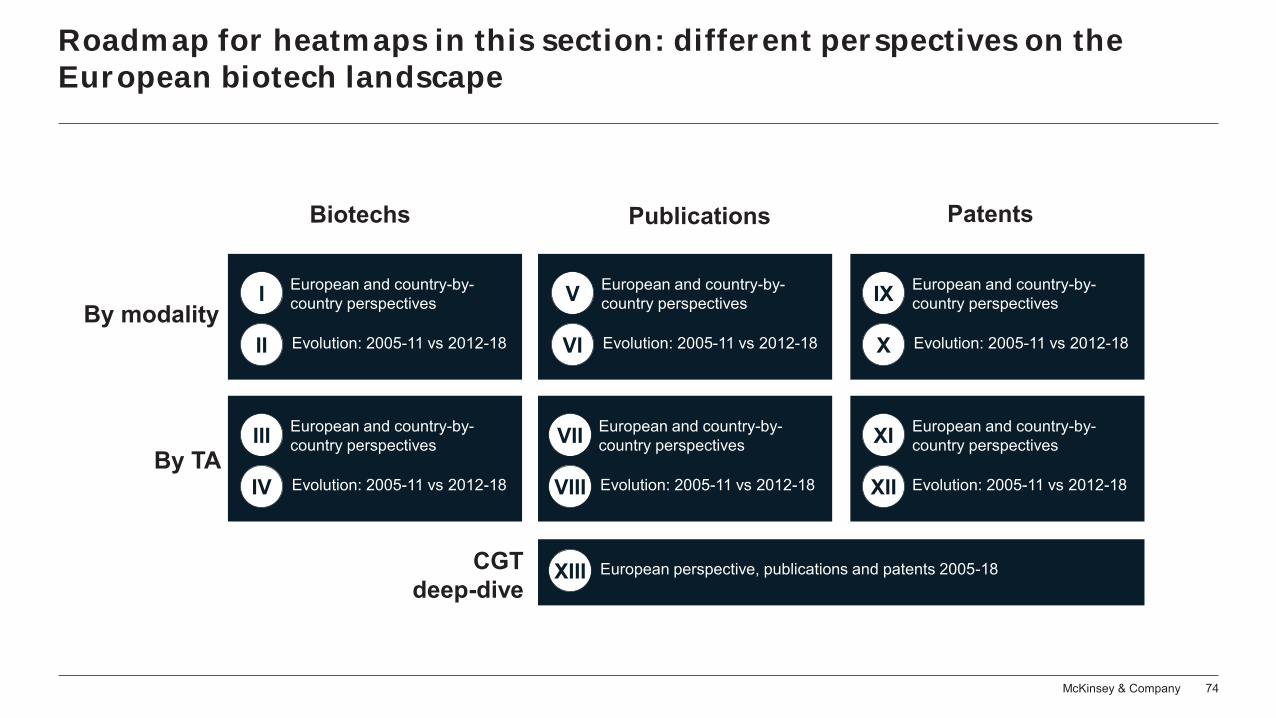
McKinsey & Company 74
Roadmap for heatmaps in this section: different perspectives on the European biotech landscape
Biotechs
European and country-by-country perspectivesI
Evolution: 2005-11 vs 2012-18II
European and country-by-country perspectivesIII
Evolution: 2005-11 vs 2012-18IV
Publications Patents
By modality
By TA
European and country-by-country perspectivesV
Evolution: 2005-11 vs 2012-18VI
European and country-by-country perspectivesIX
Evolution: 2005-11 vs 2012-18X
European and country-by-country perspectivesXI
European perspective, publications and patents 2005-18XIII
European and country-by-country perspectivesVII
Evolution: 2005-11 vs 2012-18VIII
CGT deep-dive
Evolution: 2005-11 vs 2012-18XII
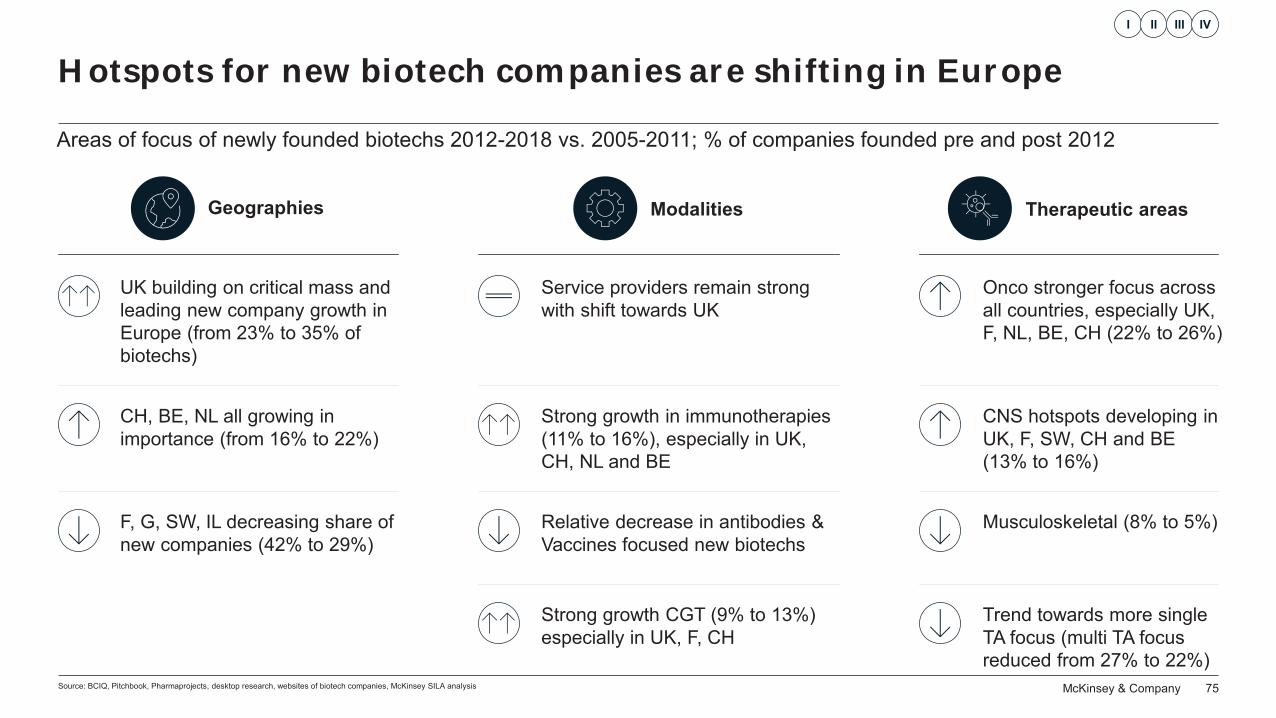
McKinsey & Company 75
Hotspots for new biotech companies are shifting in Europe
Source: BCIQ, Pitchbook, Pharmaprojects, desktop research, websites of biotech companies, McKinsey SILA analysis
Geographies
CH, BE, NL all growing in importance (from 16% to 22%)
F, G, SW, IL decreasing share of new companies (42% to 29%)
UK building on critical mass and leading new company growth in Europe (from 23% to 35% of biotechs)
Modalities
Strong growth in immunotherapies (11% to 16%), especially in UK, CH, NL and BE
Relative decrease in antibodies & Vaccines focused new biotechs
Strong growth CGT (9% to 13%) especially in UK, F, CH
Service providers remain strong with shift towards UK
Therapeutic areas
CNS hotspots developing in UK, F, SW, CH and BE (13% to 16%)
Musculoskeletal (8% to 5%)
Trend towards more single TA focus (multi TA focus reduced from 27% to 22%)
Onco stronger focus across all countries, especially UK, F, NL, BE, CH (22% to 26%)
I II III IV
Areas of focus of newly founded biotechs 2012-2018 vs. 2005-2011; % of companies founded pre and post 2012
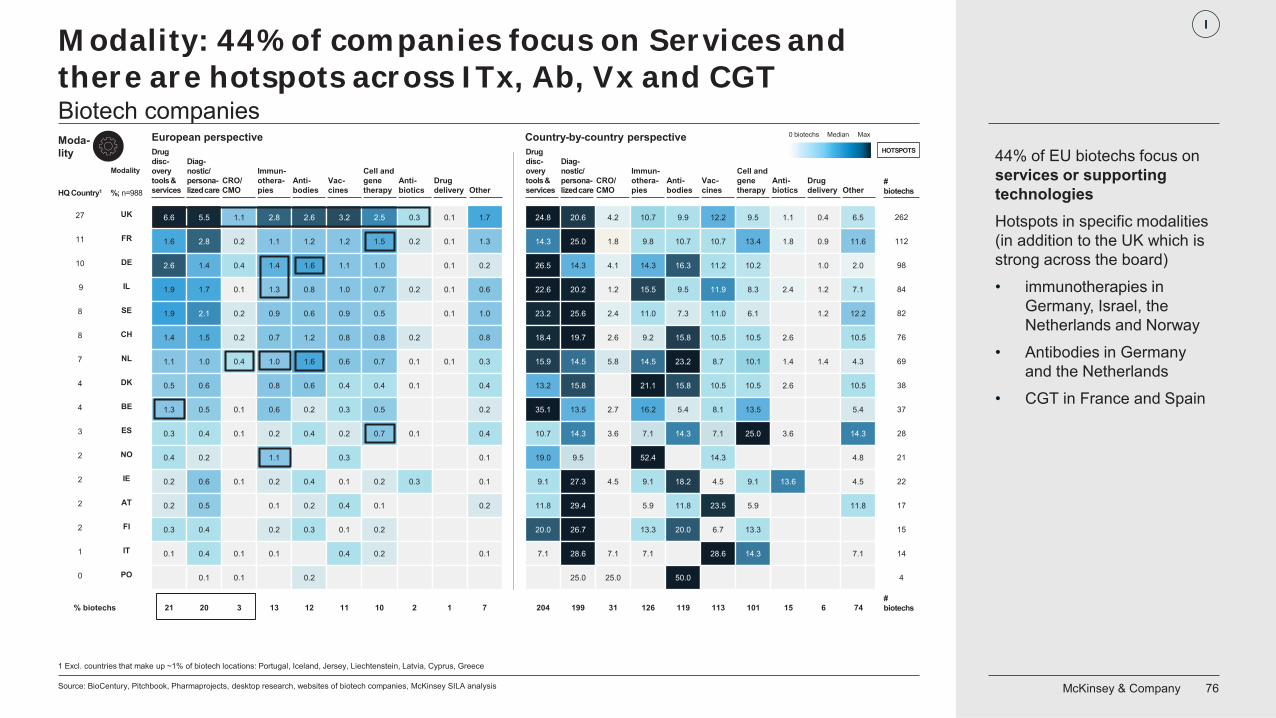
McKinsey & Company 76
Modality: 44% of companies focus on Services andthere are hotspots across ITx, Ab, Vx and CGT
Source: BioCentury, Pitchbook, Pharmaprojects, desktop research, websites of biotech companies, McKinsey SILA analysis
44% of EU biotechs focus on services or supporting technologiesHotspots in specific modalities (in addition to the UK which is strong across the board)• immunotherapies in
Germany, Israel, the Netherlands and Norway
• Antibodies in Germany and the Netherlands
• CGT in France and Spain
21 20 3 13 12 11 10 2 7# biotechs1 204 199 31 126 119 113 101 15 746% biotechs
HQ Country1 %; n=988
Diag-nostic/ persona-lized care
CRO/ CMO
Immun-othera-pies
Anti-bodies
Vac-cines
Cell and gene therapy
Anti-biotics
Drug delivery Other
Drug disc-overy tools & services
Diag-nostic/ persona-lized care
CRO/ CMO
Immun-othera-pies
Anti-bodies
Vac-cines
Cell and gene therapy
Anti-biotics
Drug delivery Other
Country-by-country perspectiveEuropean perspective
# biotechs
Drug disc-overytools & services
HOTSPOTS
Max0 biotechs Median
27
11
10
9
8
8
7
4
4
3
2
2
2
2
1
0
UK
FR
DE
IL
SE
CH
NL
DK
BE
ES
NO
IE
AT
FI
IT
PO
262
112
98
84
82
76
69
38
37
28
21
22
17
15
14
4
24.8 20.6 4.2 10.7 9.9 12.2 9.5 1.1 0.4
14.3 25.0 1.8 9.8 10.7 10.7 13.4 1.8 0.9 11.6
26.5 14.3 4.1 14.3 16.3 11.2 10.2 1.0 2.0
22.6 20.2 1.2 15.5 9.5 11.9 8.3 2.4 1.2 7.1
23.2 25.6 2.4 11.0 7.3 11.0 6.1 1.2 12.2
18.4 19.7 2.6 9.2 15.8 10.5 10.5 2.6 10.5
15.9 14.5 5.8 14.5 23.2 8.7 10.1 1.4 1.4 4.3
13.2 15.8 21.1 15.8 10.5 10.5 2.6 10.5
35.1 13.5 2.7 16.2 5.4 8.1 13.5 5.4
10.7 14.3 3.6 7.1 14.3 7.1 25.0 3.6 14.3
19.0 9.5 52.4 14.3 4.8
9.1 27.3 4.5 9.1 18.2 4.5 9.1 13.6 4.5
11.8 29.4 5.9 11.8 23.5 5.9 11.8
20.0 26.7 13.3 20.0 6.7 13.3
7.1 28.6 7.1 7.1 28.6 14.3 7.1
25.0 25.0 50.0
6.55.5 1.1 2.8 2.6 3.2 2.56.6 0.3 0.1 1.7
1.6 2.8 0.2 1.1 1.2 1.2 0.2 0.1 1.3
2.6 1.4 0.4 1.6 1.1 1.0 0.1 0.2
1.9 1.7 0.1
1.4
1.3 0.8 1.0 0.7 0.2 0.1 0.6
1.9 2.1 0.2 0.9 0.6 0.9 0.5 0.1 1.0
1.4 1.5 0.2 0.7 1.2 0.8 0.8 0.2 0.8
1.1 1.0 0.4 1.0 1.6 0.6 0.7 0.1 0.1 0.3
0.5 0.6 0.8 0.6 0.4 0.4 0.1 0.4
1.3 0.5 0.1 0.6 0.2 0.3 0.5 0.2
0.3 0.4 0.1 0.2 0.4 0.2 0.7 0.1 0.4
0.4 0.2 1.1 0.3 0.1
0.2 0.6 0.1 0.2 0.4 0.1 0.2 0.3 0.1
0.2 0.5 0.1 0.2 0.4 0.1 0.2
0.3 0.4 0.2 0.3 0.1 0.2
0.1 0.4 0.1 0.1 0.4 0.2 0.1
0.1 0.1 0.2
1.5
Modality
Moda-lity
1 Excl. countries that make up ~1% of biotech locations: Portugal, Iceland, Jersey, Liechtenstein, Latvia, Cyprus, Greece
I
Biotech companies
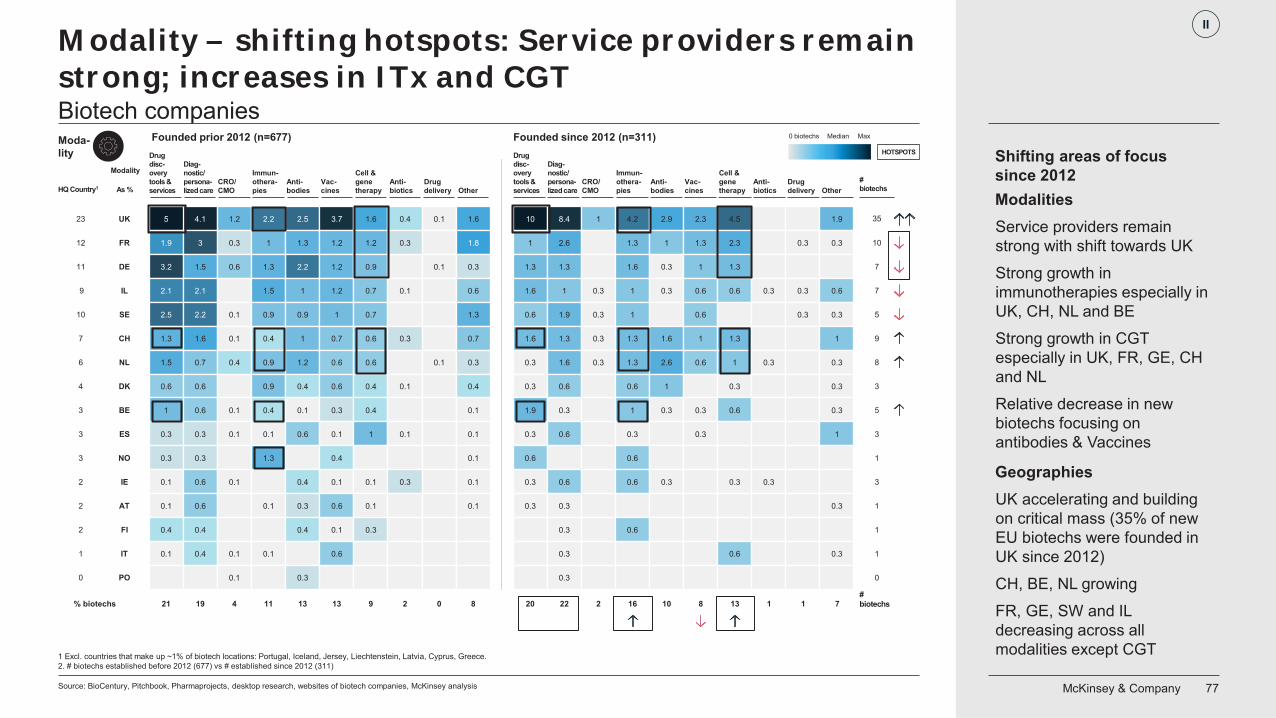
McKinsey & Company 77
Modality – shifting hotspots: Service providers remain strong; increases in ITx and CGT
Source: BioCentury, Pitchbook, Pharmaprojects, desktop research, websites of biotech companies, McKinsey analysis
1 Excl. countries that make up ~1% of biotech locations: Portugal, Iceland, Jersey, Liechtenstein, Latvia, Cyprus, Greece. 2. # biotechs established before 2012 (677) vs # established since 2012 (311)
ModalitiesService providers remain strong with shift towards UKStrong growth in immunotherapies especially in UK, CH, NL and BEStrong growth in CGT especially in UK, FR, GE, CH and NLRelative decrease in new biotechs focusing on antibodies & Vaccines
GeographiesUK accelerating and building on critical mass (35% of new EU biotechs were founded in UK since 2012)CH, BE, NL growingFR, GE, SW and IL decreasing across all modalities except CGT
Shifting areas of focus since 2012
% biotechs 21 19 4 11 13 13 9 2 80# biotechs20 22 2 16 10 8 13 1 71
Modality
HQ Country1 As %
Diag-nostic/ persona-lized care
CRO/ CMO
Immun-othera-pies
Anti-bodies
Vac-cines
Cell & gene therapy
Anti-biotics
Drug delivery
Drug disc-overytools & services Other
Drug disc-overy tools & services
Diag-nostic/ persona-lized care
CRO/ CMO
Immun-othera-pies
Anti-bodies
Vac-cines
Cell & gene therapy
Anti-biotics
Drug delivery Other
# biotechs
Founded since 2012 (n=311)Founded prior 2012 (n=677) Max0 biotechs Median
HOTSPOTS
UK
FR
DE
IL
SE
CH
NL
DK
BE
ES
NO
IE
AT
FI
IT
PO
4.1 1.2 2.2 2.5 3.7 1.65 0.4 0.1 1.6
1.9 3 0.3 1 1.3 1.2 1.2 0.3 1.8
3.2 1.5 0.6 2.2 1.2 0.9 0.1 0.3
2.1 2.1
1.3
1.5 1 1.2 0.7 0.1 0.6
2.5 2.2 0.1 0.9 0.9 1 0.7 1.3
1.3 1.6 0.1 0.4 1 0.7 0.6 0.3 0.7
1.5 0.7 0.4 0.9 1.2 0.6 0.6 0.1 0.3
0.6 0.6 0.9 0.4 0.6 0.4 0.1 0.4
1 0.6 0.1 0.4 0.1 0.3 0.4 0.1
0.3 0.3 0.1 0.1 0.6 0.1 1 0.1 0.1
0.3 0.3 1.3 0.4 0.1
0.1 0.6 0.1 0.4 0.1 0.1 0.3 0.1
0.1 0.6 0.1 0.3 0.6 0.1 0.1
0.4 0.4 0.4 0.1 0.3
0.1 0.4 0.1 0.1 0.6
0.1 0.3
23
12
11
9
10
7
6
4
3
3
3
2
2
2
1
0
10 8.4 1 4.2 2.9 2.3 4.5 1.9
1 2.6 1.3 1 1.3 2.3 0.3 0.3
1.3 1.3 1.6 0.3 1 1.3
1.6 1 0.3 1 0.3 0.6 0.6 0.3 0.3 0.6
0.6 1.9 0.3 1 0.6 0.3 0.3
1.6 1.3 0.3 1.3 1.6 1 1.3 1
0.3 1.6 0.3 1.3 2.6 0.6 1 0.3 0.3
0.3 0.6 0.6 1 0.3 0.3
1.9 0.3 1 0.3 0.3 0.6 0.3
0.3 0.6 0.3 0.3 1
0.6 0.6
0.3 0.6 0.6 0.3 0.3 0.3
0.3 0.3 0.3
0.3 0.6
0.3 0.6 0.3
0.3
10
7
7
5
9
8
3
5
3
1
3
1
1
1
0
35
Moda-lity
II
Biotech companies
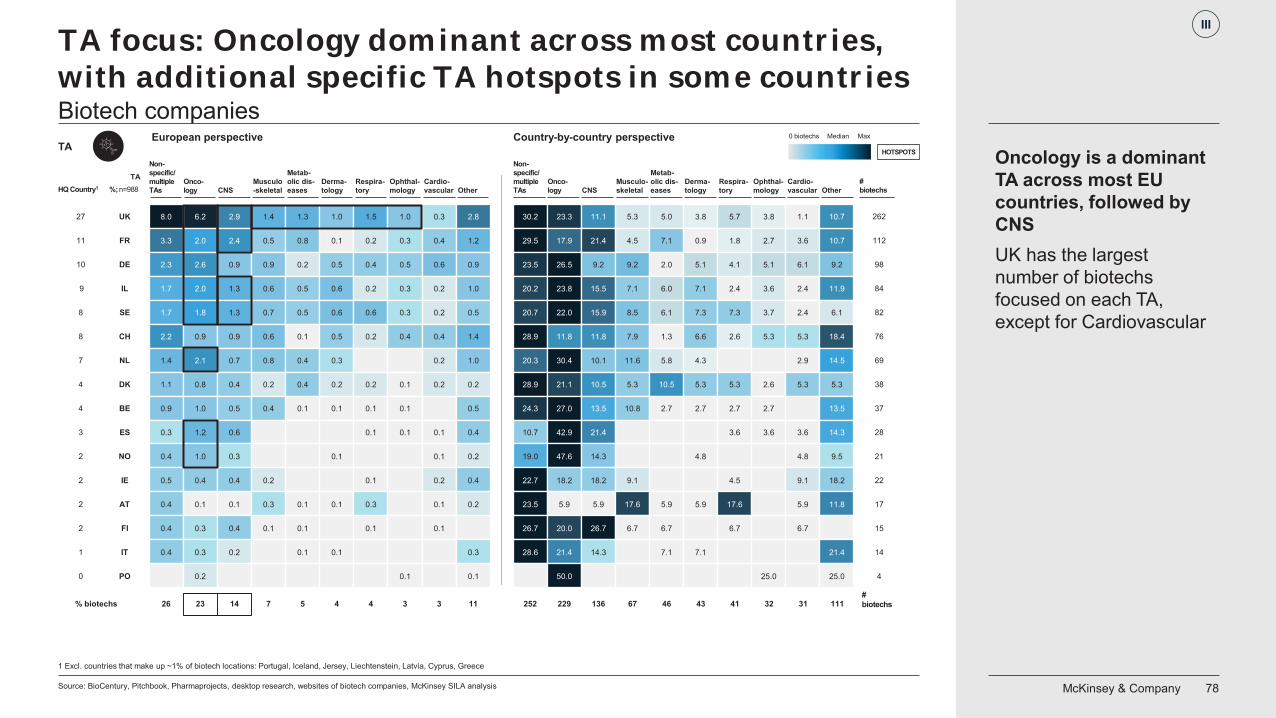
McKinsey & Company 78
TA focus: Oncology dominant across most countries, with additional specific TA hotspots in some countries
Source: BioCentury, Pitchbook, Pharmaprojects, desktop research, websites of biotech companies, McKinsey SILA analysis
1 Excl. countries that make up ~1% of biotech locations: Portugal, Iceland, Jersey, Liechtenstein, Latvia, Cyprus, Greece
26 23 14 7 5 4 4 3 113% biotechs# biotechs252 229 136 67 46 43 41 32 11131
27
11
10
9
8
8
7
4
4
3
2
2
2
2
1
0
UK
FR
DE
IL
SE
CH
NL
DK
BE
ES
NO
IE
AT
FI
IT
PO
6.2 2.9 1.4 1.3 1.0 1.58.0 1.0 0.3 2.8
3.3 2.0 2.4 0.5 0.8 0.1 0.2 0.3 0.4 1.2
2.3 2.6 0.9 0.2 0.5 0.4 0.5 0.6 0.9
1.7 2.0
0.9
0.6 0.5 0.6 0.2 0.3 0.2 1.0
1.7 1.8
1.3
1.3 0.7 0.5 0.6 0.6 0.3 0.2 0.5
2.2 0.9 0.9 0.6 0.1 0.5 0.2 0.4 0.4 1.4
1.4 2.1 0.7 0.8 0.4 0.3 0.2 1.0
1.1 0.8 0.4 0.2 0.4 0.2 0.2 0.1 0.2 0.2
0.9 1.0 0.5 0.4 0.1 0.1 0.1 0.1 0.5
0.3 0.6 0.1 0.1 0.1 0.4
0.4
1.2
1.0 0.3 0.1 0.1 0.2
0.5 0.4 0.4 0.2 0.1 0.2 0.4
0.4 0.1 0.1 0.3 0.1 0.1 0.3 0.1 0.2
0.4 0.3 0.4 0.1 0.1 0.1 0.1
0.4 0.3 0.2 0.1 0.1 0.3
0.2 0.1 0.1
262
112
98
84
82
76
69
38
37
28
21
22
17
15
14
4
30.2 23.3 11.1 5.3 5.0 3.8 5.7 3.8 1.1
29.5 17.9 21.4 4.5 7.1 0.9 1.8 2.7 3.6 10.7
23.5 26.5 9.2 9.2 2.0 5.1 4.1 5.1 6.1 9.2
20.2 23.8 15.5 7.1 6.0 7.1 2.4 3.6 2.4 11.9
20.7 22.0 15.9 8.5 6.1 7.3 7.3 3.7 2.4 6.1
28.9 11.8 11.8 7.9 1.3 6.6 2.6 5.3 5.3 18.4
20.3 30.4 10.1 11.6 5.8 4.3 2.9 14.5
28.9 21.1 10.5 5.3 10.5 5.3 5.3 2.6 5.3 5.3
24.3 27.0 13.5 10.8 2.7 2.7 2.7 2.7 13.5
10.7 42.9 21.4 3.6 3.6 3.6 14.3
19.0 47.6 14.3 4.8 4.8 9.5
22.7 18.2 18.2 9.1 4.5 9.1 18.2
23.5 5.9 5.9 17.6 5.9 5.9 17.6 5.9 11.8
26.7 20.0 26.7 6.7 6.7 6.7 6.7
28.6 21.4 14.3 7.1 7.1 21.4
50.0 25.0
10.7
25.0
HQ Country1
TA%; n=988
Onco-logy CNS
Musculo-skeletal
Metab-olic dis-eases
Derma-tology
Respira-tory
Ophthal-mology
Cardio-vascular
Non-specific/multiple TAs Other Other
# biotechs
Onco-logy CNS
Musculo-skeletal
Metab-olic dis-eases
Derma-tology
Respira-tory
Ophthal-mology
Cardio-vascular
Non-specific/multiple TAs
Max0 biotechs Median
HOTSPOTS
Country-by-country perspectiveEuropean perspectiveTA
III
Oncology is a dominant TA across most EU countries, followed by CNSUK has the largest number of biotechsfocused on each TA, except for Cardiovascular
Biotech companies
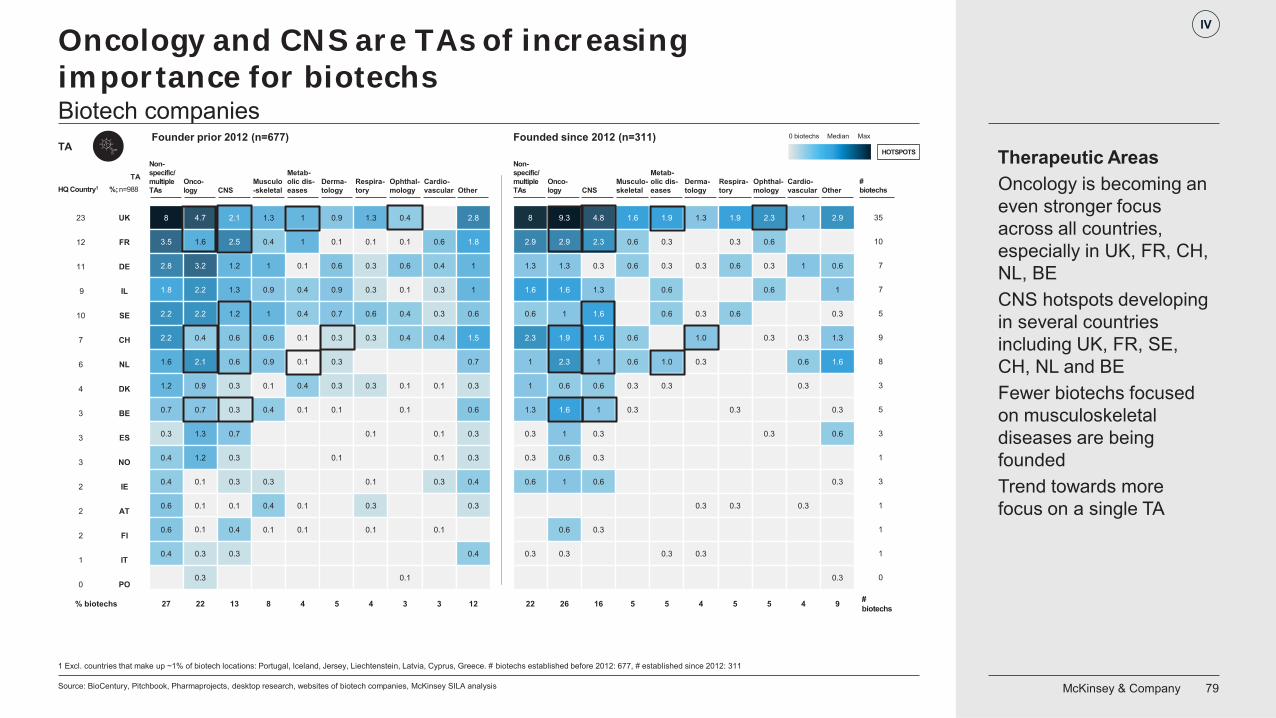
McKinsey & Company 79
Oncology and CNS are TAs of increasing importance for biotechs
Source: BioCentury, Pitchbook, Pharmaprojects, desktop research, websites of biotech companies, McKinsey SILA analysis
1 Excl. countries that make up ~1% of biotech locations: Portugal, Iceland, Jersey, Liechtenstein, Latvia, Cyprus, Greece. # biotechs established before 2012: 677, # established since 2012: 311
27 22 13 8 4 5 4 3 123 22 26 16 5 5 4 5 5 94% biotechs # biotechs
Founded since 2012 (n=311)Founder prior 2012 (n=677)
TA%; n=988
Onco-logy CNS
Musculo-skeletal
Metab-olic dis-eases
Derma-tology
Respira-tory
Ophthal-mology
Cardio-vascular
Non-specific/multiple TAs Other Other
# biotechs
Onco-logy CNS
Musculo-skeletal
Metab-olic dis-eases
Derma-tology
Respira-tory
Ophthal-mology
Cardio-vascular
Non-specific/multiple TAsHQ Country1
Max0 biotechs Median
HOTSPOTS
4.7 2.1 1.3 1 0.9 1.38 0.4 2.8
3.5 1.6 2.5 0.4 1 0.1 0.1 0.1 0.6 1.8
2.8 3.2 1.2 0.1 0.6 0.3 0.6 0.4 1
1.8 2.2 1.3
1
0.9 0.4 0.9 0.3 0.1 0.3 1
2.2 2.2 1.2 1 0.4 0.7 0.6 0.4 0.3 0.6
2.2 0.4 0.6 0.6 0.1 0.3 0.3 0.4 0.4 1.5
1.6 2.1 0.6 0.9 0.1 0.3 0.7
1.2 0.9 0.3 0.1 0.4 0.3 0.3 0.1 0.1 0.3
0.7 0.7 0.3 0.4 0.1 0.1 0.1 0.6
0.3 1.3 0.7 0.1 0.1 0.3
0.4 1.2 0.3 0.1 0.1 0.3
0.4 0.1 0.3 0.3 0.1 0.3 0.4
0.6 0.1 0.1 0.4 0.1 0.3 0.3
0.6 0.1 0.4 0.1 0.1 0.1 0.1
0.4 0.3 0.3 0.4
0.3 0.1
8 9.3 4.8 1.6 1.9 1.3 1.9 2.3 1
2.9 2.9 2.3 0.6 0.3 0.3 0.6
1.3 1.3 0.3 0.6 0.3 0.3 0.6 0.3 1 0.6
1.6 1.6 1.3 0.6 0.6 1
0.6 1 1.6 0.6 0.3 0.6 0.3
2.3 1.9 1.6 0.6 1.0 0.3 0.3 1.3
1 2.3 1 0.6 1.0 0.3 0.6 1.6
1 0.6 0.6 0.3 0.3 0.3
1.3 1.6 1 0.3 0.3 0.3
0.3 1 0.3 0.3 0.6
0.3 0.6 0.3
0.6 1 0.6 0.3
0.3 0.3 0.3
0.6 0.3
0.3 0.3 0.3 0.3
2.9
0.3
10
7
7
5
9
8
3
5
3
1
3
1
1
1
0
35UK
FR
DE
IL
SE
CH
NL
DK
BE
ES
NO
IE
AT
FI
IT
PO
23
12
11
9
10
7
6
4
3
3
3
2
2
2
1
0
Therapeutic AreasOncology is becoming an even stronger focus across all countries, especially in UK, FR, CH, NL, BECNS hotspots developing in several countries including UK, FR, SE, CH, NL and BEFewer biotechs focused on musculoskeletal diseases are being foundedTrend towards more focus on a single TA
TA
IV
Biotech companies
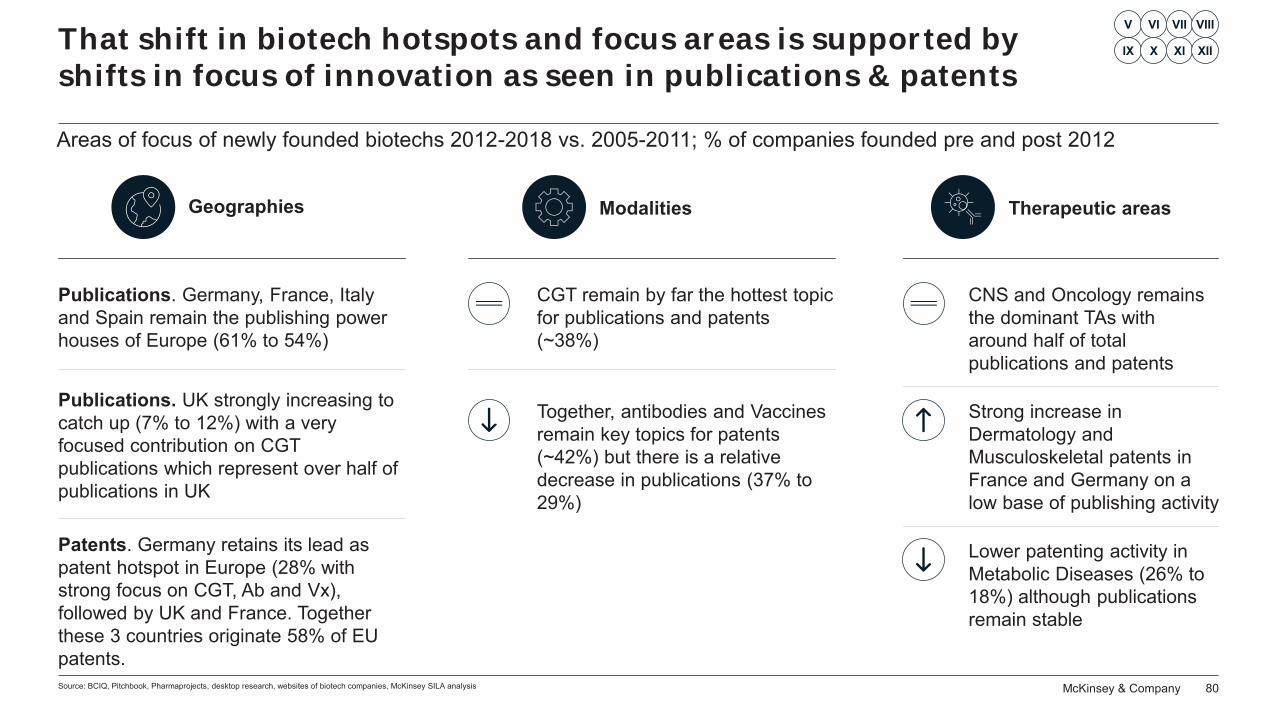
McKinsey & Company 80
That shift in biotech hotspots and focus areas is supported by shifts in focus of innovation as seen in publications & patents
Source: BCIQ, Pitchbook, Pharmaprojects, desktop research, websites of biotech companies, McKinsey SILA analysis
Publications. Germany, France, Italy and Spain remain the publishing power houses of Europe (61% to 54%)
CGT remain by far the hottest topic for publications and patents (~38%)
CNS and Oncology remains the dominant TAs with around half of total publications and patents
Publications. UK strongly increasing to catch up (7% to 12%) with a very focused contribution on CGT publications which represent over half of publications in UK
Together, antibodies and Vaccines remain key topics for patents (~42%) but there is a relative decrease in publications (37% to 29%)
Lower patenting activity in Metabolic Diseases (26% to 18%) although publications remain stable
Patents. Germany retains its lead as patent hotspot in Europe (28% with strong focus on CGT, Ab and Vx), followed by UK and France. Together these 3 countries originate 58% of EU patents.
Strong increase in Dermatology and Musculoskeletal patents in France and Germany on a low base of publishing activity
V VI VII VIII
IX X XI XII
ModalitiesGeographies Therapeutic areas
Areas of focus of newly founded biotechs 2012-2018 vs. 2005-2011; % of companies founded pre and post 2012
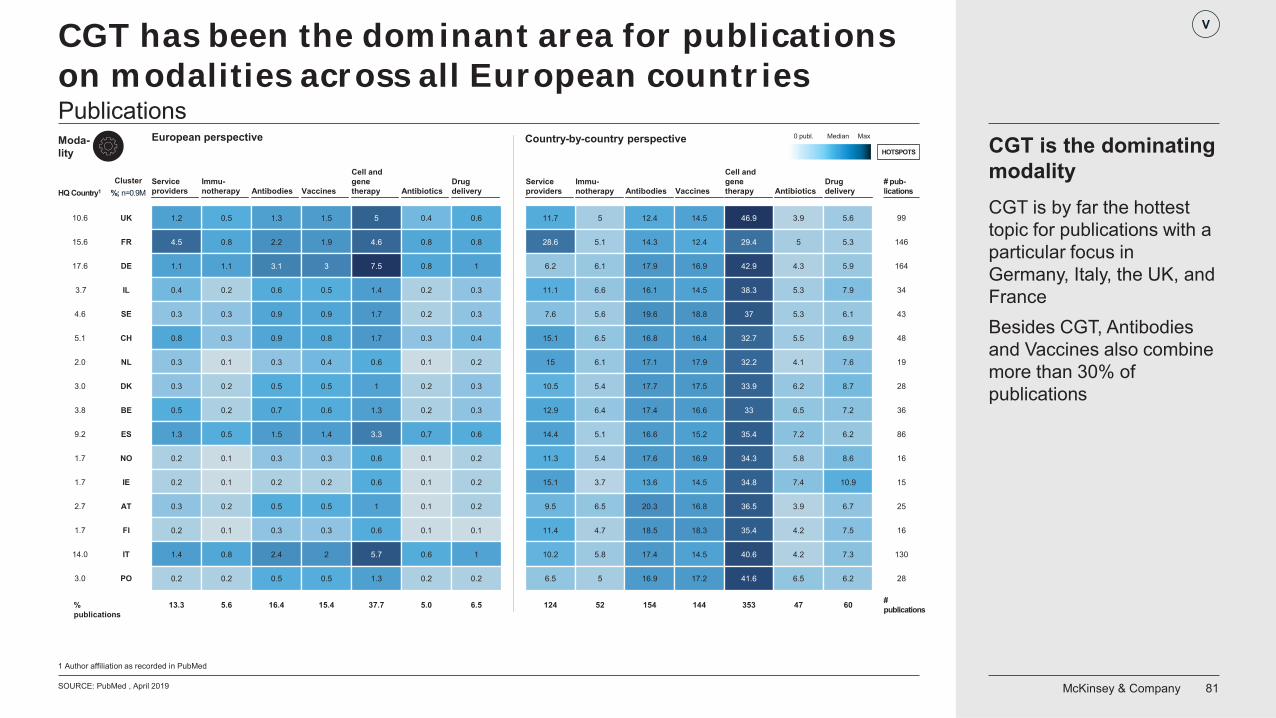
McKinsey & Company 81
CGT has been the dominant area for publications on modalities across all European countries
SOURCE: PubMed , April 2019
Cluster
HOTSPOTS
HQ Country1
10.6
15.6
17.6
3.7
4.6
5.1
2.0
3.0
3.8
9.2
1.7
1.7
2.7
1.7
14.0
3.0
%; n=0.9M
UK
FR
DE
IL
SE
CH
NL
DK
BE
ES
NO
IE
AT
FI
IT
PO
0.5 1.3 1.5 5 0.4 0.61.2
4.5 0.8 2.2 1.9 4.6 0.8 0.8
1.1 1.1 3.1 7.5 0.8 1
0.4 0.2 0.6
3
0.5 1.4 0.2 0.3
0.3 0.3 0.9 0.9 1.7 0.2 0.3
0.8 0.3 0.9 0.8 1.7 0.3 0.4
0.3 0.1 0.3 0.4 0.6 0.1 0.2
0.3 0.2 0.5 0.5 1 0.2 0.3
0.5 0.2 0.7 0.6 1.3 0.2 0.3
1.3 0.5 1.5 1.4 3.3 0.7 0.6
0.2 0.1 0.3 0.3 0.6 0.1 0.2
0.2 0.1 0.2 0.2 0.6 0.1 0.2
0.3 0.2 0.5 0.5 1 0.1 0.2
0.2 0.1 0.3 0.3 0.6 0.1 0.1
1.4 0.8 2.4 2 5.7 0.6 1
0.2 0.2 0.5 0.5 1.3 0.2 0.2
Immu-notherapy VaccinesAntibodies
Cell and gene therapy Antibiotics
Drug delivery
Service providers
13.3 5.6 16.4 15.4 37.7 5.0 6.5% publications
5 12.4 14.5 46.9 3.9 5.611.7
28.6 5.1 14.3 12.4 29.4 5 5.3
6.2 6.1 17.9 42.9 4.3 5.9
11.1 6.6 16.1
16.9
14.5 38.3 5.3 7.9
7.6 5.6 19.6 18.8 37 5.3 6.1
15.1 6.5 16.8 16.4 32.7 5.5 6.9
15 6.1 17.1 17.9 32.2 4.1 7.6
10.5 5.4 17.7 17.5 33.9 6.2 8.7
12.9 6.4 17.4 16.6 33 6.5 7.2
14.4 5.1 16.6 15.2 35.4 7.2 6.2
11.3 5.4 17.6 16.9 34.3 5.8 8.6
15.1 3.7 13.6 14.5 34.8 7.4 10.9
9.5 6.5 20.3 16.8 36.5 3.9 6.7
11.4 4.7 18.5 18.3 35.4 4.2 7.5
10.2 5.8 17.4 14.5 40.6 4.2 7.3
6.5 5 16.9 17.2 41.6 6.5 6.2
Immu-notherapy VaccinesAntibodies
Cell and gene therapy Antibiotics
Drug delivery
Service providers
124 52 154 144 353 47 60 # publications
# pub-lications
99
146
164
34
43
48
19
28
36
86
16
15
25
16
130
28
Max0 publ. Median
1 Author affiliation as recorded in PubMed
Moda-lity
Country-by-country perspectiveEuropean perspective
Publications
V
CGT is the dominating modalityCGT is by far the hottest topic for publications with a particular focus in Germany, Italy, the UK, and FranceBesides CGT, Antibodies and Vaccines also combine more than 30% of publications
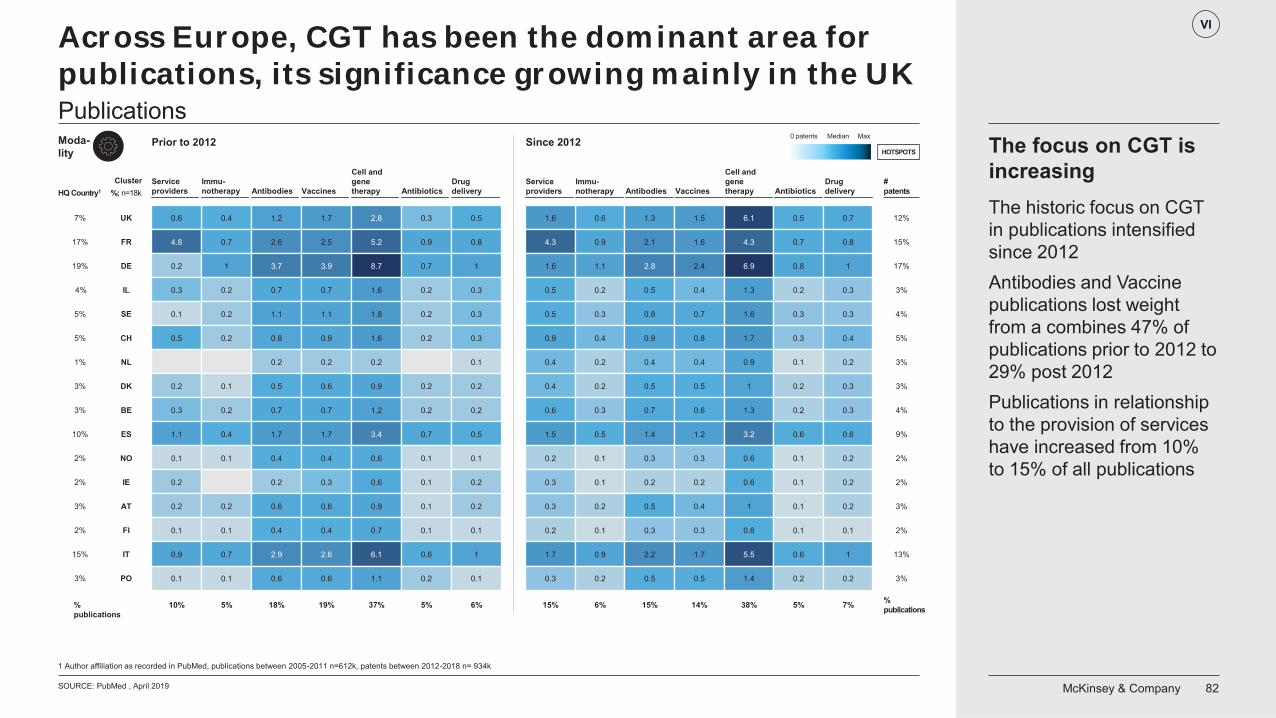
McKinsey & Company 82
Across Europe, CGT has been the dominant area for publications, its significance growing mainly in the UK
SOURCE: PubMed , April 2019
1 Author affiliation as recorded in PubMed, publications between 2005-2011 n=612k, patents between 2012-2018 n= 934k
Cluster
HOTSPOTSSince 2012
HQ Country1
7%
17%
19%
4%
5%
5%
1%
3%
3%
10%
2%
2%
3%
2%
15%
3%
%; n=18k
UK
FR
DE
IL
SE
CH
NL
DK
BE
ES
NO
IE
AT
FI
IT
PO
0.4 1.2 1.7 2.8 0.3 0.50.6
4.8 0.7 2.6 2.5 5.2 0.9 0.8
0.2 1 3.7 8.7 0.7 1
0.3 0.2 0.7
3.9
0.7 1.6 0.2 0.3
0.1 0.2 1.1 1.1 1.8 0.2 0.3
0.5 0.2 0.8 0.9 1.6 0.2 0.3
0.2 0.2 0.2 0.1
0.2 0.1 0.5 0.6 0.9 0.2 0.2
0.3 0.2 0.7 0.7 1.2 0.2 0.2
1.1 0.4 1.7 1.7 3.4 0.7 0.5
0.1 0.1 0.4 0.4 0.6 0.1 0.1
0.2 0.2 0.3 0.6 0.1 0.2
0.2 0.2 0.6 0.6 0.9 0.1 0.2
0.1 0.1 0.4 0.4 0.7 0.1 0.1
0.9 0.7 2.9 2.6 6.1 0.6 1
0.1 0.1 0.6 0.6 1.1 0.2 0.1
Immu-notherapy VaccinesAntibodies
Cell and gene therapy Antibiotics
Drug delivery
Service providers
10% 5% 18% 19% 37% 5% 6%
Prior to 2012
% publications
0.6 1.3 1.5 6.1 0.5 0.71.6
4.3 0.9 2.1 1.6 4.3 0.7 0.8
1.6 1.1 2.8 6.9 0.8 1
0.5 0.2 0.5
2.4
0.4 1.3 0.2 0.3
0.5 0.3 0.8 0.7 1.6 0.3 0.3
0.9 0.4 0.9 0.8 1.7 0.3 0.4
0.4 0.2 0.4 0.4 0.9 0.1 0.2
0.4 0.2 0.5 0.5 1 0.2 0.3
0.6 0.3 0.7 0.6 1.3 0.2 0.3
1.5 0.5 1.4 1.2 3.2 0.6 0.6
0.2 0.1 0.3 0.3 0.6 0.1 0.2
0.3 0.1 0.2 0.2 0.6 0.1 0.2
0.3 0.2 0.5 0.4 1 0.1 0.2
0.2 0.1 0.3 0.3 0.6 0.1 0.1
1.7 0.9 2.2 1.7 5.5 0.6 1
0.3 0.2 0.5 0.5 1.4 0.2 0.2
Immu-notherapy VaccinesAntibodies
Cell and gene therapy Antibiotics
Drug delivery
Service providers
15% 6% 15% 14% 38% 5% 7% % publications
#patents
12%
15%
17%
3%
4%
5%
3%
3%
4%
9%
2%
2%
3%
2%
13%
3%
Max0 patents MedianModa-lity
Publications
VI
The historic focus on CGT in publications intensified since 2012Antibodies and Vaccine publications lost weight from a combines 47% of publications prior to 2012 to 29% post 2012Publications in relationship to the provision of services have increased from 10% to 15% of all publications
The focus on CGT is increasing
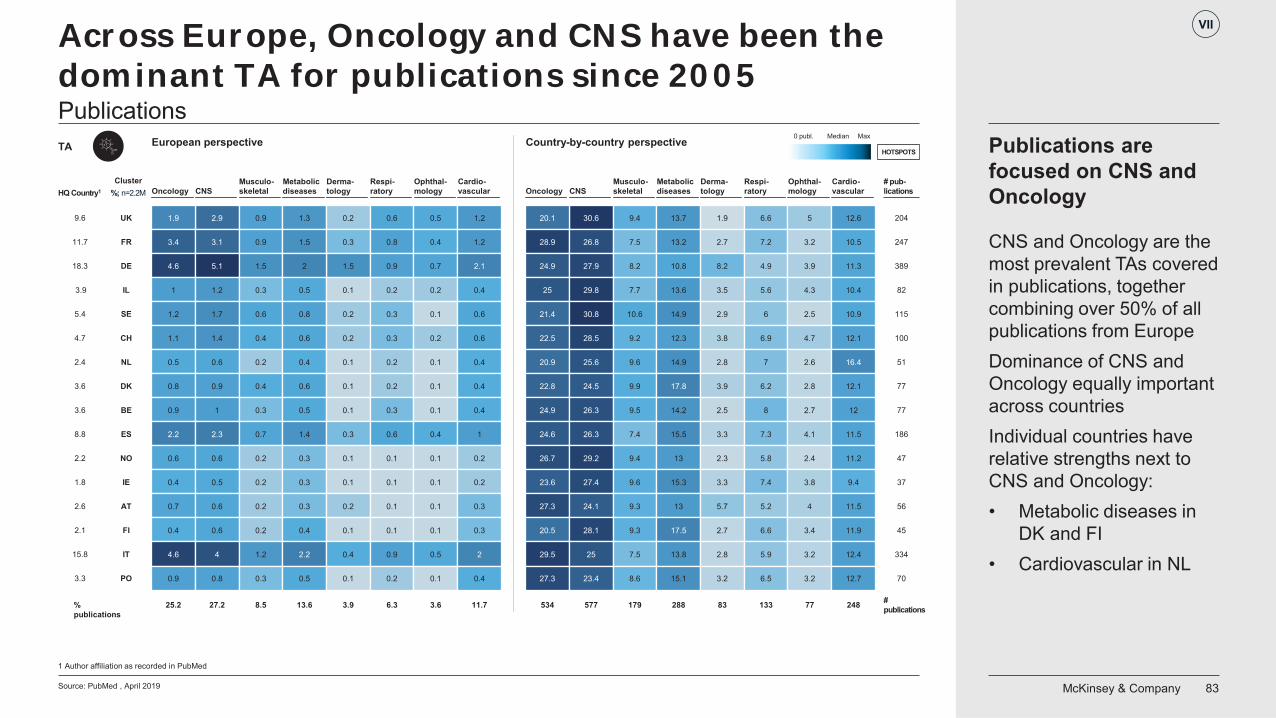
McKinsey & Company 83
Across Europe, Oncology and CNS have been the dominant TA for publications since 2005
Source: PubMed , April 2019
1 Author affiliation as recorded in PubMed
Cluster
HOTSPOTSCountry-by-country perspective
HQ Country1
9.6
11.7
18.3
3.9
5.4
4.7
2.4
3.6
3.6
8.8
2.2
1.8
2.6
2.1
15.8
3.3
%; n=2.2M
UK
FR
DE
IL
SE
CH
NL
DK
BE
ES
NO
IE
AT
FI
IT
PO
European perspective
% publications
# publications
# pub-lications
204
247
389
82
115
100
51
77
77
186
47
37
56
45
334
70
Max0 publ. Median
2.9 0.9 1.3 0.2 0.61.9
3.4 3.1 0.9 1.5 0.3 0.8
4.6 5.1 1.5 1.5 0.9
1 1.2 0.3
2
0.5 0.1 0.2
1.2 1.7 0.6 0.8 0.2 0.3
1.1 1.4 0.4 0.6 0.2 0.3
0.5 0.6 0.2 0.4 0.1 0.2
0.8 0.9 0.4 0.6 0.1 0.2
0.9 1 0.3 0.5 0.1 0.3
2.2 2.3 0.7 1.4 0.3 0.6
0.6 0.6 0.2 0.3 0.1 0.1
0.4 0.5 0.2 0.3 0.1 0.1
0.7 0.6 0.2 0.3 0.2 0.1
0.4 0.6 0.2 0.4 0.1 0.1
4.6 4 1.2 2.2 0.4 0.9
0.9 0.8 0.3 0.5 0.1 0.2
CNSMetabolic diseases
Musculo-skeletal
Derma-tology
Respi-ratoryOncology
0.5
0.4
0.7
0.2
0.1
0.2
0.1
0.1
0.1
0.4
0.1
0.1
0.1
0.1
0.5
0.1
Ophthal-mology
1.2
1.2
2.1
0.4
0.6
0.6
0.4
0.4
0.4
1
0.2
0.2
0.3
0.3
2
0.4
Cardio-vascular
25.2 27.2 8.5 13.6 3.9 6.3 3.6 11.7
30.6 9.4 13.7 1.9 6.620.1
28.9 26.8 7.5 13.2 2.7 7.2
24.9 27.9 8.2 8.2 4.9
25 29.8 7.7
10.8
13.6 3.5 5.6
21.4 30.8 10.6 14.9 2.9 6
22.5 28.5 9.2 12.3 3.8 6.9
20.9 25.6 9.6 14.9 2.8 7
22.8 24.5 9.9 17.8 3.9 6.2
24.9 26.3 9.5 14.2 2.5 8
24.6 26.3 7.4 15.5 3.3 7.3
26.7 29.2 9.4 13 2.3 5.8
23.6 27.4 9.6 15.3 3.3 7.4
27.3 24.1 9.3 13 5.7 5.2
20.5 28.1 9.3 17.5 2.7 6.6
29.5 25 7.5 13.8 2.8 5.9
27.3 23.4 8.6 15.1 3.2 6.5
CNSMetabolic diseases
Musculo-skeletal
Derma-tology
Respi-ratoryOncology
5
3.2
3.9
4.3
2.5
4.7
2.6
2.8
2.7
4.1
2.4
3.8
4
3.4
3.2
3.2
Ophthal-mology
12.6
10.5
11.3
10.4
10.9
12.1
16.4
12.1
12
11.5
11.2
9.4
11.5
11.9
12.4
12.7
Cardio-vascular
534 577 179 288 83 133 77 248
TA
Publications
VII
CNS and Oncology are the most prevalent TAs covered in publications, together combining over 50% of all publications from EuropeDominance of CNS and Oncology equally important across countriesIndividual countries have relative strengths next to CNS and Oncology:• Metabolic diseases in
DK and FI• Cardiovascular in NL
Publications are focused on CNS and Oncology
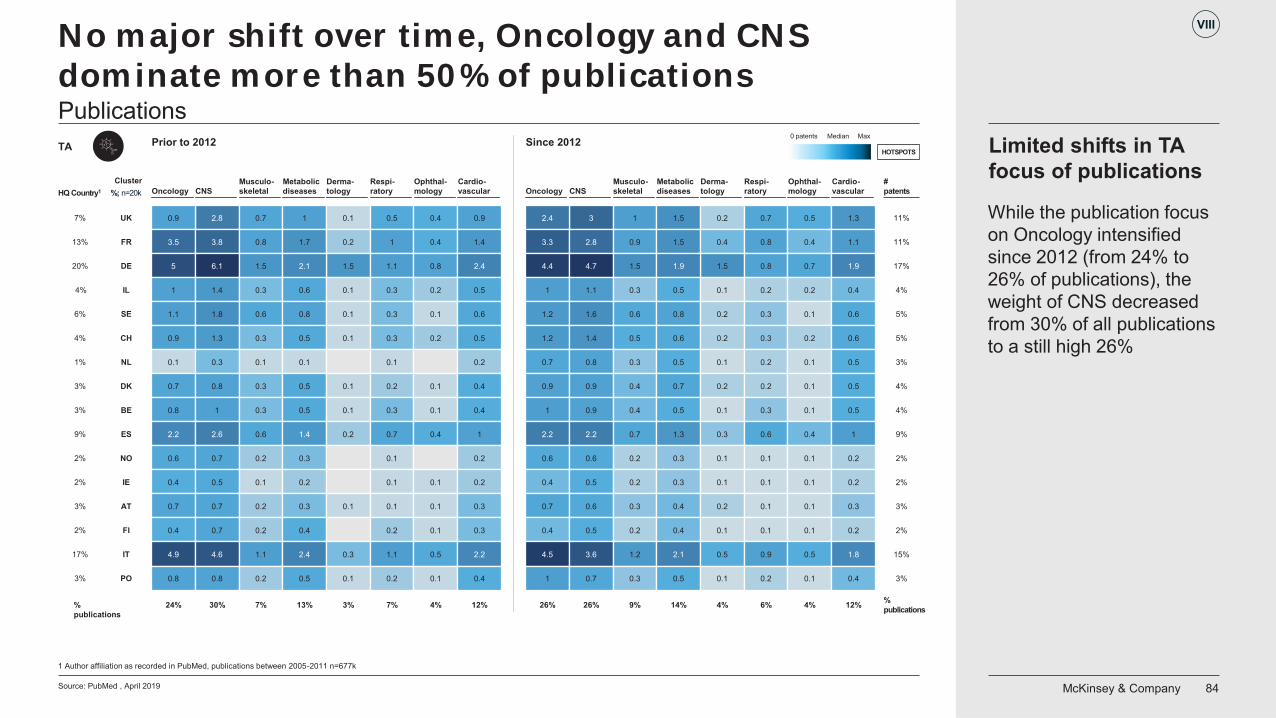
McKinsey & Company 84
No major shift over time, Oncology and CNS dominate more than 50% of publications
Source: PubMed , April 2019
1 Author affiliation as recorded in PubMed, publications between 2005-2011 n=677k
HOTSPOTS
HQ Country1
7%
13%
20%
4%
6%
4%
1%
3%
3%
9%
2%
2%
3%
2%
17%
3%
% publications
% publications
#patents
11%
11%
17%
4%
5%
5%
3%
4%
4%
9%
2%
2%
3%
2%
15%
3%
Max0 patents Median
Cluster
Since 2012
%; n=20k
UK
FR
DE
IL
SE
CH
NL
DK
BE
ES
NO
IE
AT
FI
IT
PO
Prior to 2012
2.8 0.7 1 0.1 0.50.9
3.5 3.8 0.8 1.7 0.2 1
5 6.1 1.5 1.5 1.1
1 1.4 0.3
2.1
0.6 0.1 0.3
1.1 1.8 0.6 0.8 0.1 0.3
0.9 1.3 0.3 0.5 0.1 0.3
0.1 0.3 0.1 0.1 0.1
0.7 0.8 0.3 0.5 0.1 0.2
0.8 1 0.3 0.5 0.1 0.3
2.2 2.6 0.6 1.4 0.2 0.7
0.6 0.7 0.2 0.3 0.1
0.4 0.5 0.1 0.2 0.1
0.7 0.7 0.2 0.3 0.1 0.1
0.4 0.7 0.2 0.4 0.2
4.9 4.6 1.1 2.4 0.3 1.1
0.8 0.8 0.2 0.5 0.1 0.2
CNSMetabolic diseases
Musculo-skeletal
Derma-tology
Respi-ratoryOncology
0.4
0.4
0.8
0.2
0.1
0.2
0.1
0.1
0.4
0.1
0.1
0.1
0.5
0.1
Ophthal-mology
0.9
1.4
2.4
0.5
0.6
0.5
0.2
0.4
0.4
1
0.2
0.2
0.3
0.3
2.2
0.4
Cardio-vascular
3 1 1.5 0.2 0.72.4
3.3 2.8 0.9 1.5 0.4 0.8
4.4 4.7 1.5 1.5 0.8
1 1.1 0.3
1.9
0.5 0.1 0.2
1.2 1.6 0.6 0.8 0.2 0.3
1.2 1.4 0.5 0.6 0.2 0.3
0.7 0.8 0.3 0.5 0.1 0.2
0.9 0.9 0.4 0.7 0.2 0.2
1 0.9 0.4 0.5 0.1 0.3
2.2 2.2 0.7 1.3 0.3 0.6
0.6 0.6 0.2 0.3 0.1 0.1
0.4 0.5 0.2 0.3 0.1 0.1
0.7 0.6 0.3 0.4 0.2 0.1
0.4 0.5 0.2 0.4 0.1 0.1
4.5 3.6 1.2 2.1 0.5 0.9
1 0.7 0.3 0.5 0.1 0.2
CNSMetabolic diseases
Musculo-skeletal
Derma-tology
Respi-ratoryOncology
0.5
0.4
0.7
0.2
0.1
0.2
0.1
0.1
0.1
0.4
0.1
0.1
0.1
0.1
0.5
0.1
Ophthal-mology
1.3
1.1
1.9
0.4
0.6
0.6
0.5
0.5
0.5
1
0.2
0.2
0.3
0.2
1.8
0.4
Cardio-vascular
24% 30% 7% 13% 3% 7% 4% 12% 26% 26% 9% 14% 4% 6% 4% 12%
TA
Publications
VIII
While the publication focus on Oncology intensified since 2012 (from 24% to 26% of publications), the weight of CNS decreased from 30% of all publications to a still high 26%
Limited shifts in TA focus of publications
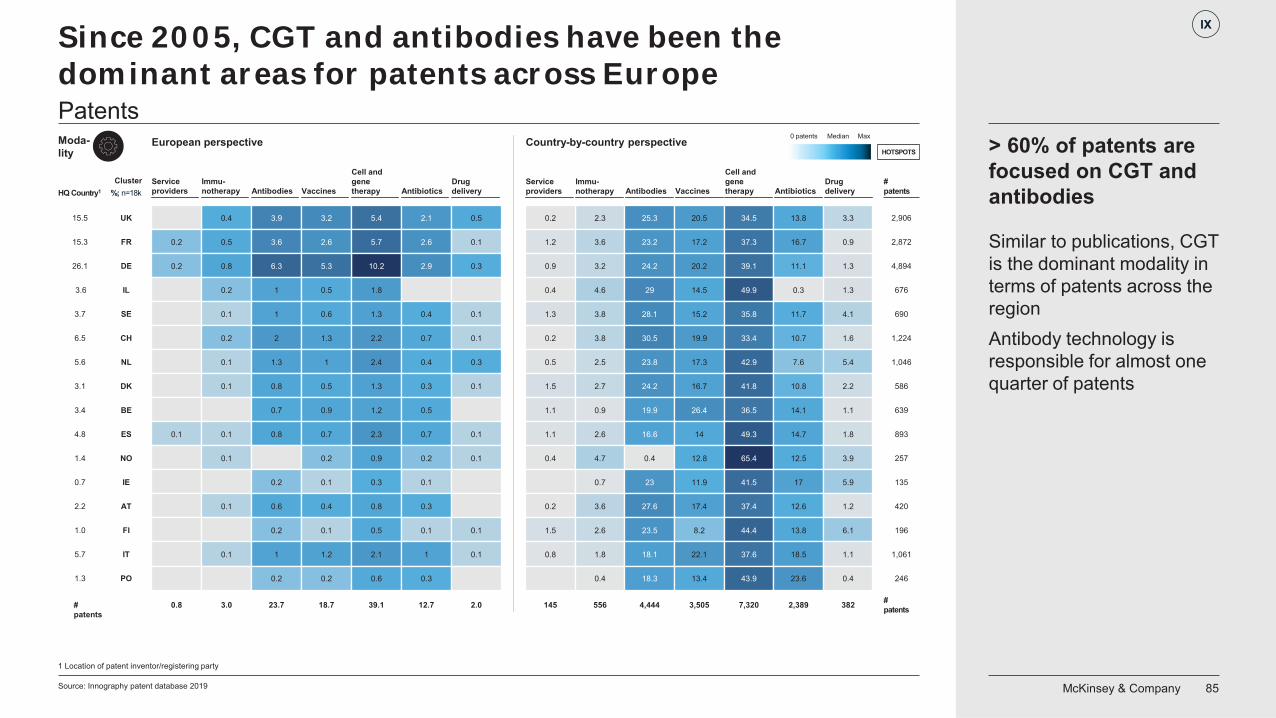
McKinsey & Company 85
Since 2005, CGT and antibodies have been the dominant areas for patents across Europe
Source: Innography patent database 2019
1 Location of patent inventor/registering party
Cluster
HOTSPOTSCountry-by-country perspective
HQ Country1
15.5
15.3
26.1
3.6
3.7
6.5
5.6
3.1
3.4
4.8
1.4
0.7
2.2
1.0
5.7
1.3
%; n=18k
UK
FR
DE
IL
SE
CH
NL
DK
BE
ES
NO
IE
AT
FI
IT
PO
0.4 3.9 3.2 5.4 2.1 0.5
0.2 0.5 3.6 2.6 5.7 2.6 0.1
0.2 0.8 6.3 10.2 2.9 0.3
0.2 1
5.3
0.5 1.8
0.1 1 0.6 1.3 0.4 0.1
0.2 2 1.3 2.2 0.7 0.1
0.1 1.3 1 2.4 0.4 0.3
0.1 0.8 0.5 1.3 0.3 0.1
0.7 0.9 1.2 0.5
0.1 0.1 0.8 0.7 2.3 0.7 0.1
0.1 0.2 0.9 0.2 0.1
0.2 0.1 0.3 0.1
0.1 0.6 0.4 0.8 0.3
0.2 0.1 0.5 0.1 0.1
0.1 1 1.2 2.1 1 0.1
0.2 0.2 0.6 0.3
Immu-notherapy VaccinesAntibodies
Cell and gene therapy Antibiotics
Drug delivery
Service providers
0.8 3.0 23.7 18.7 39.1 12.7 2.0
European perspective
# patents
2.3 25.3 20.5 34.5 13.8 3.30.2
1.2 3.6 23.2 17.2 37.3 16.7 0.9
0.9 3.2 24.2 39.1 11.1 1.3
0.4 4.6 29
20.2
14.5 49.9 0.3 1.3
1.3 3.8 28.1 15.2 35.8 11.7 4.1
0.2 3.8 30.5 19.9 33.4 10.7 1.6
0.5 2.5 23.8 17.3 42.9 7.6 5.4
1.5 2.7 24.2 16.7 41.8 10.8 2.2
1.1 0.9 19.9 26.4 36.5 14.1 1.1
1.1 2.6 16.6 14 49.3 14.7 1.8
0.4 4.7 0.4 12.8 65.4 12.5 3.9
0.7 23 11.9 41.5 17 5.9
0.2 3.6 27.6 17.4 37.4 12.6 1.2
1.5 2.6 23.5 8.2 44.4 13.8 6.1
0.8 1.8 18.1 22.1 37.6 18.5 1.1
0.4 18.3 13.4 43.9 23.6 0.4
Immu-notherapy VaccinesAntibodies
Cell and gene therapy Antibiotics
Drug delivery
Service providers
145 556 4,444 3,505 7,320 2,389 382 # patents
#patents
2,906
2,872
4,894
676
690
1,224
1,046
586
639
893
257
135
420
196
1,061
246
Max0 patents MedianModa-lity
Patents
IX
Similar to publications, CGT is the dominant modality in terms of patents across the regionAntibody technology is responsible for almost one quarter of patents
> 60% of patents are focused on CGT and antibodies
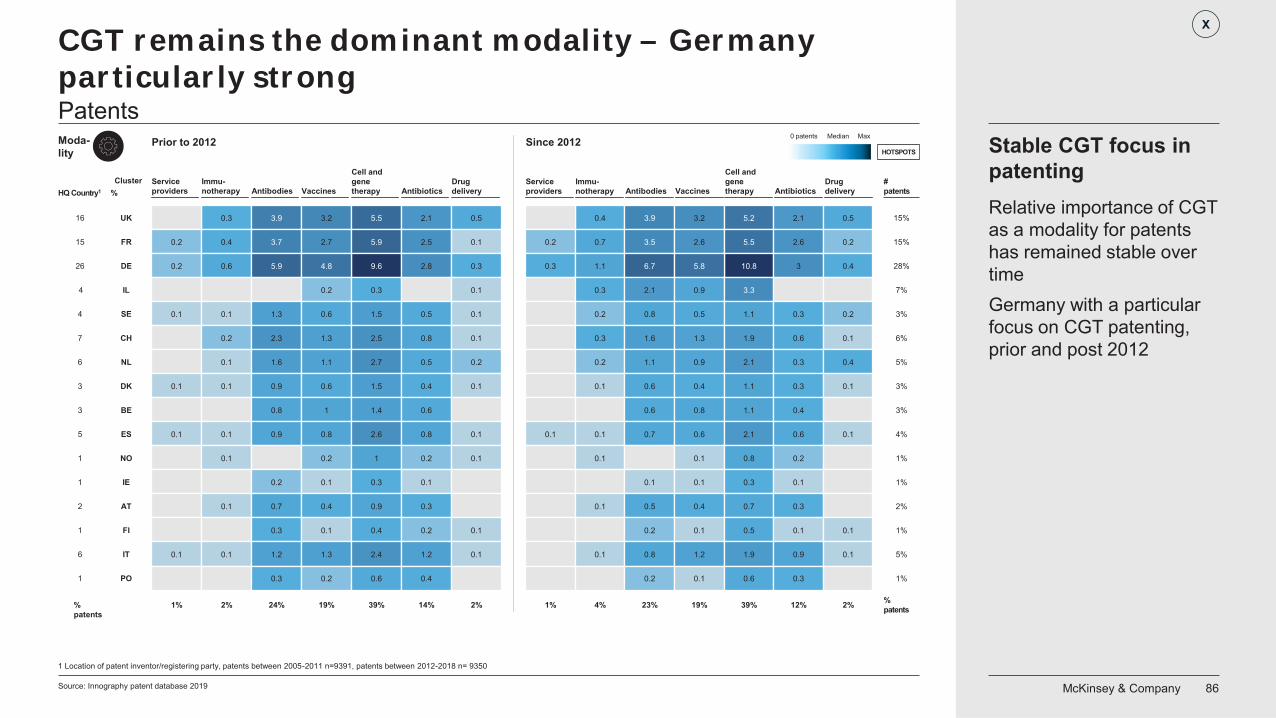
McKinsey & Company 86Source: Innography patent database 2019
1 Location of patent inventor/registering party, patents between 2005-2011 n=9391, patents between 2012-2018 n= 9350
Cluster
HOTSPOTSSince 2012
HQ Country1
16
15
26
4
4
7
6
3
3
5
1
1
2
1
6
1
%
UK
FR
DE
IL
SE
CH
NL
DK
BE
ES
NO
IE
AT
FI
IT
PO
0.3 3.9 3.2 5.5 2.1 0.5
0.2 0.4 3.7 2.7 5.9 2.5 0.1
0.2 0.6 5.9 9.6 2.8 0.34.8
0.2 0.3 0.1
0.1 0.1 1.3 0.6 1.5 0.5 0.1
0.2 2.3 1.3 2.5 0.8 0.1
0.1 1.6 1.1 2.7 0.5 0.2
0.1 0.1 0.9 0.6 1.5 0.4 0.1
0.8 1 1.4 0.6
0.1 0.1 0.9 0.8 2.6 0.8 0.1
0.1 0.2 1 0.2 0.1
0.2 0.1 0.3 0.1
0.1 0.7 0.4 0.9 0.3
0.3 0.1 0.4 0.2 0.1
0.1 0.1 1.2 1.3 2.4 1.2 0.1
0.3 0.2 0.6 0.4
Immu-notherapy VaccinesAntibodies
Cell and gene therapy Antibiotics
Drug delivery
Service providers
1% 2% 24% 19% 39% 14% 2%
Prior to 2012
% patents
0.4 3.9 3.2 5.2 2.1 0.5
0.2 0.7 3.5 2.6 5.5 2.6 0.2
0.3 1.1 6.7 10.8 3 0.4
0.3 2.1
5.8
0.9 3.3
0.2 0.8 0.5 1.1 0.3 0.2
0.3 1.6 1.3 1.9 0.6 0.1
0.2 1.1 0.9 2.1 0.3 0.4
0.1 0.6 0.4 1.1 0.3 0.1
0.6 0.8 1.1 0.4
0.1 0.1 0.7 0.6 2.1 0.6 0.1
0.1 0.1 0.8 0.2
0.1 0.1 0.3 0.1
0.1 0.5 0.4 0.7 0.3
0.2 0.1 0.5 0.1 0.1
0.1 0.8 1.2 1.9 0.9 0.1
0.2 0.1 0.6 0.3
Immu-notherapy VaccinesAntibodies
Cell and gene therapy Antibiotics
Drug delivery
Service providers
1% 4% 23% 19% 39% 12% 2% % patents
#patents
15%
15%
28%
7%
3%
6%
5%
3%
3%
4%
1%
1%
2%
1%
5%
1%
Max0 patents MedianModa-lity
Patents
CGT remains the dominant modality – Germany particularly strong
X
Relative importance of CGT as a modality for patents has remained stable over timeGermany with a particular focus on CGT patenting, prior and post 2012
Stable CGT focus in patenting
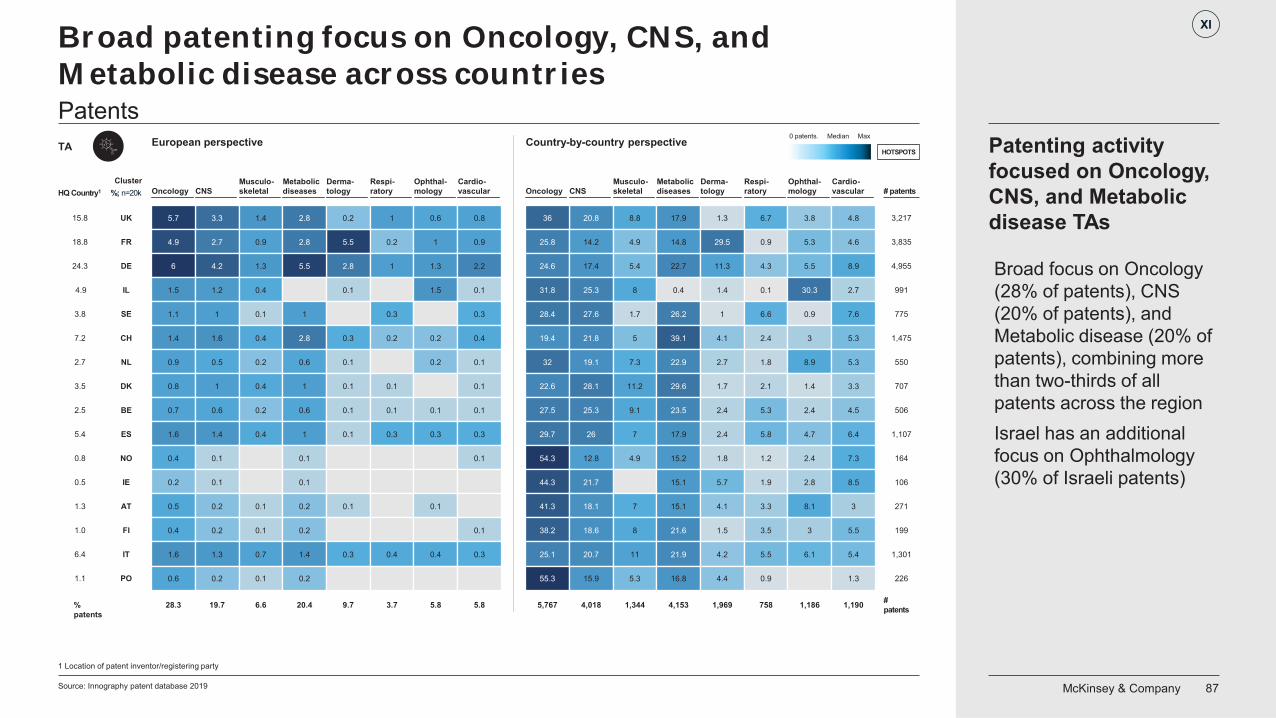
McKinsey & Company 87
5.5
22.7
Broad patenting focus on Oncology, CNS, and Metabolic disease across countries
Source: Innography patent database 2019
1 Location of patent inventor/registering party
Cluster
HOTSPOTSCountry-by-country perspective
HQ Country1
15.8
18.8
24.3
4.9
3.8
7.2
2.7
3.5
2.5
5.4
0.8
0.5
1.3
1.0
6.4
1.1
%; n=20k
UK
FR
DE
IL
SE
CH
NL
DK
BE
ES
NO
IE
AT
FI
IT
PO
European perspective
% patents
# patents
# patents
3,217
3,835
4,955
991
775
1,475
550
707
506
1,107
164
106
271
199
1,301
226
Max0 patents. Median
3.3 1.4 2.8 0.2 15.7
4.9 2.7 0.9 2.8 0.2
6 4.2 1.3 2.8 1
1.5 1.2 0.4
5.5
0.1
1.1 1 0.1 1 0.3
1.4 1.6 0.4 2.8 0.3 0.2
0.9 0.5 0.2 0.6 0.1
0.8 1 0.4 1 0.1 0.1
0.7 0.6 0.2 0.6 0.1 0.1
1.6 1.4 0.4 1 0.1 0.3
0.4 0.1 0.1
0.2 0.1 0.1
0.5 0.2 0.1 0.2 0.1
0.4 0.2 0.1 0.2
1.6 1.3 0.7 1.4 0.3 0.4
0.6 0.2 0.1 0.2
CNSMetabolic diseases
Musculo-skeletal
Derma-tology
Respi-ratoryOncology
0.6
1
1.3
1.5
0.2
0.2
0.1
0.3
0.1
0.4
Ophthal-mology
0.8
0.9
2.2
0.1
0.3
0.4
0.1
0.1
0.1
0.3
0.1
0.1
0.3
Cardio-vascular
28.3 19.7 6.6 20.4 9.7 3.7 5.8 5.8
20.8 8.8 17.9 1.3 6.736
25.8 14.2 4.9 14.8 29.5 0.9
24.6 17.4 5.4 11.3 4.3
31.8 25.3 8 0.4 1.4 0.1
28.4 27.6 1.7 26.2 1 6.6
19.4 21.8 5 39.1 4.1 2.4
32 19.1 7.3 22.9 2.7 1.8
22.6 28.1 11.2 29.6 1.7 2.1
27.5 25.3 9.1 23.5 2.4 5.3
29.7 26 7 17.9 2.4 5.8
54.3 12.8 4.9 15.2 1.8 1.2
44.3 21.7 15.1 5.7 1.9
41.3 18.1 7 15.1 4.1 3.3
38.2 18.6 8 21.6 1.5 3.5
25.1 20.7 11 21.9 4.2 5.5
55.3 15.9 5.3 16.8 4.4 0.9
CNSMetabolic diseases
Musculo-skeletal
Derma-tology
Respi-ratoryOncology
3.8
5.3
5.5
30.3
0.9
3
8.9
1.4
2.4
4.7
2.4
2.8
8.1
3
6.1
Ophthal-mology
4.8
4.6
8.9
2.7
7.6
5.3
5.3
3.3
4.5
6.4
7.3
8.5
3
5.5
5.4
1.3
Cardio-vascular
5,767 4,018 1,344 4,153 1,969 758 1,186 1,190
TA
Patents
XI
Broad focus on Oncology (28% of patents), CNS (20% of patents), and Metabolic disease (20% of patents), combining more than two-thirds of all patents across the regionIsrael has an additional focus on Ophthalmology (30% of Israeli patents)
Patenting activity focused on Oncology, CNS, and Metabolic disease TAs
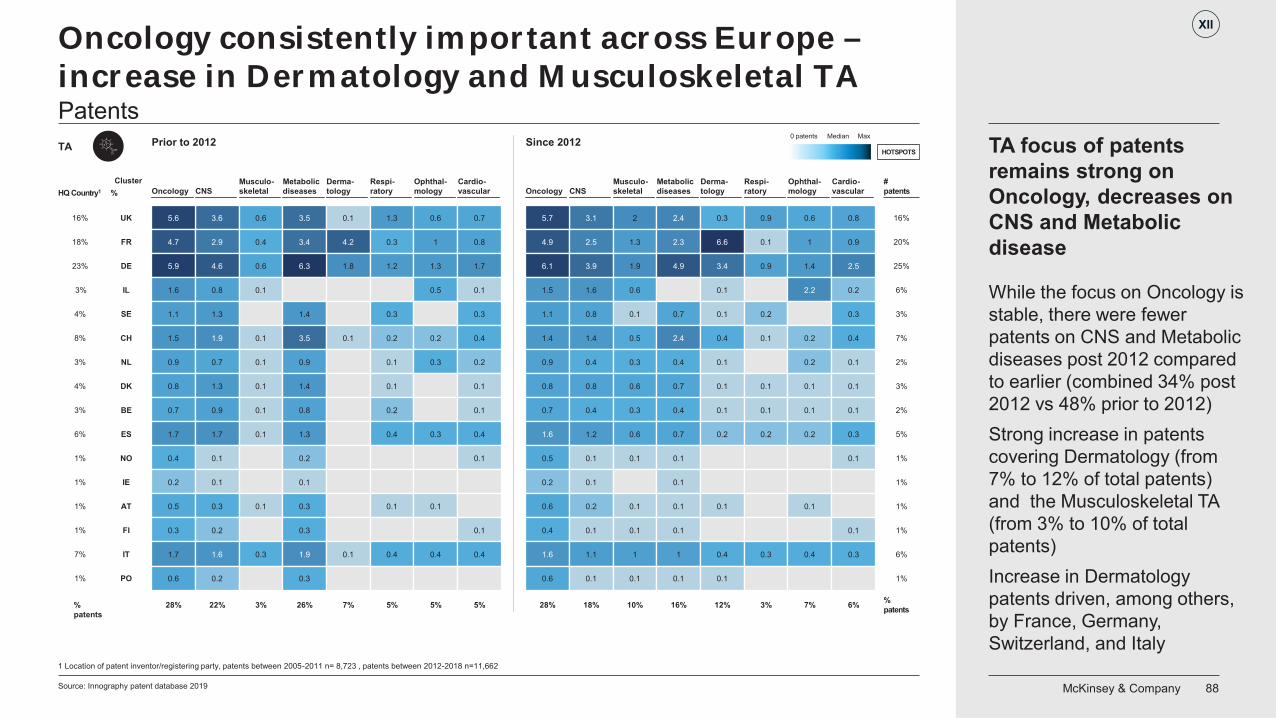
McKinsey & Company 88Source: Innography patent database 2019
1 Location of patent inventor/registering party, patents between 2005-2011 n= 8,723 , patents between 2012-2018 n=11,662
HOTSPOTS
HQ Country1
16%
18%
23%
3%
4%
8%
3%
4%
3%
6%
1%
1%
1%
1%
7%
1%
% patents
%patents
#patents
16%
20%
25%
6%
3%
7%
2%
3%
2%
5%
1%
1%
1%
1%
6%
1%
Max0 patents Median
Cluster
Since 2012
%
UK
FR
DE
IL
SE
CH
NL
DK
BE
ES
NO
IE
AT
FI
IT
PO
Prior to 2012
3.6 0.6 3.5 0.1 1.35.6
4.7 2.9 0.4 3.4 4.2 0.3
5.9 4.6 0.6 1.8 1.2
1.6 0.8 0.1
6.3
1.1 1.3 1.4 0.3
1.5 1.9 0.1 3.5 0.1 0.2
0.9 0.7 0.1 0.9 0.1
0.8 1.3 0.1 1.4 0.1
0.7 0.9 0.1 0.8 0.2
1.7 1.7 0.1 1.3 0.4
0.4 0.1 0.2
0.2 0.1 0.1
0.5 0.3 0.1 0.3 0.1
0.3 0.2 0.3
1.7 1.6 0.3 1.9 0.1 0.4
0.6 0.2 0.3
CNSMetabolic diseases
Musculo-skeletal
Derma-tology
Respi-ratoryOncology
0.6
1
1.3
0.5
0.2
0.3
0.3
0.1
0.4
Ophthal-mology
0.7
0.8
1.7
0.1
0.3
0.4
0.2
0.1
0.1
0.4
0.1
0.1
0.4
Cardio-vascular
3.1 2 2.4 0.3 0.95.7
4.9 2.5 1.3 2.3 6.6 0.1
6.1 3.9 1.9 3.4 0.9
1.5 1.6 0.6
4.9
0.1
1.1 0.8 0.1 0.7 0.1 0.2
1.4 1.4 0.5 2.4 0.4 0.1
0.9 0.4 0.3 0.4 0.1
0.8 0.8 0.6 0.7 0.1 0.1
0.7 0.4 0.3 0.4 0.1 0.1
1.6 1.2 0.6 0.7 0.2 0.2
0.5 0.1 0.1 0.1
0.2 0.1 0.1
0.6 0.2 0.1 0.1 0.1
0.4 0.1 0.1 0.1
1.6 1.1 1 1 0.4 0.3
0.6 0.1 0.1 0.1 0.1
CNSMetabolic diseases
Musculo-skeletal
Derma-tology
Respi-ratoryOncology
0.6
1
1.4
2.2
0.2
0.2
0.1
0.1
0.2
0.1
0.4
Ophthal-mology
0.8
0.9
2.5
0.2
0.3
0.4
0.1
0.1
0.1
0.3
0.1
0.1
0.3
Cardio-vascular
28% 22% 3% 26% 7% 5% 5% 5% 28% 18% 10% 16% 12% 3% 7% 6%
TA
Patents
Oncology consistently important across Europe –increase in Dermatology and Musculoskeletal TA
XII
While the focus on Oncology is stable, there were fewer patents on CNS and Metabolic diseases post 2012 compared to earlier (combined 34% post 2012 vs 48% prior to 2012)Strong increase in patents covering Dermatology (from 7% to 12% of total patents) and the Musculoskeletal TA (from 3% to 10% of total patents)Increase in Dermatology patents driven, among others, by France, Germany, Switzerland, and Italy
TA focus of patents remains strong on Oncology, decreases on CNS and Metabolic disease
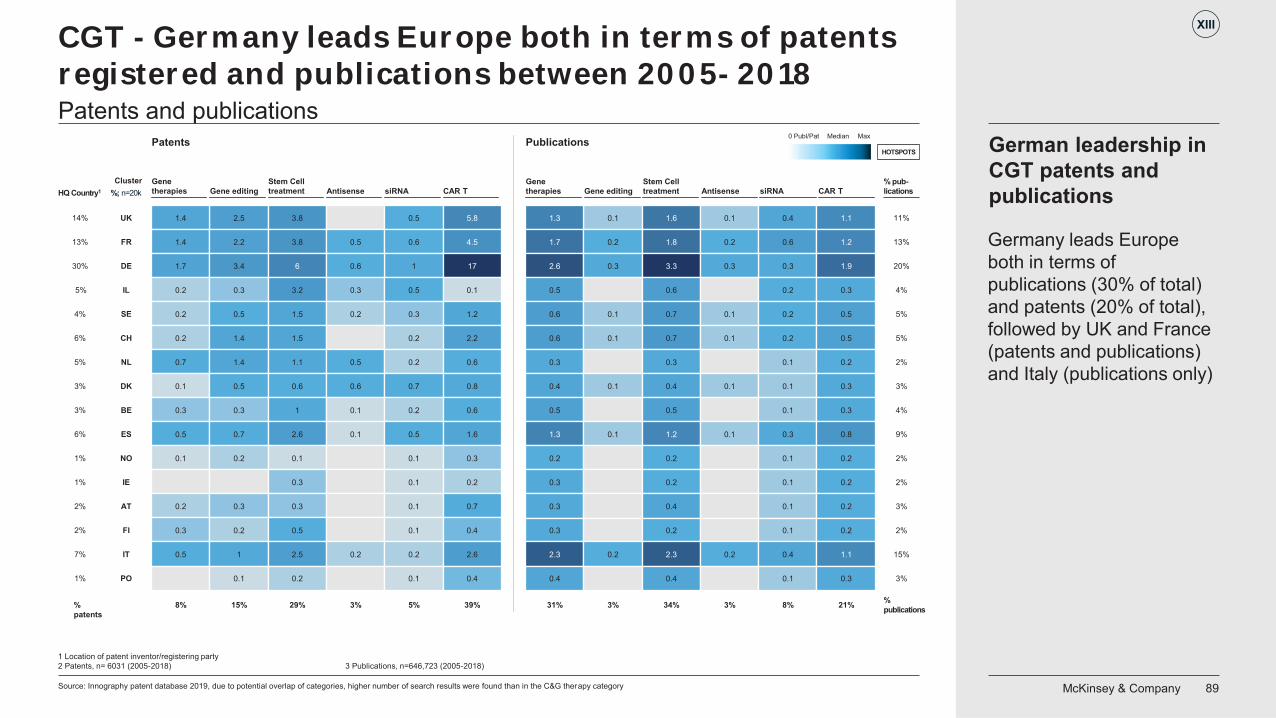
McKinsey & Company 89
CGT - Germany leads Europe both in terms of patents registered and publications between 2005- 2018
Source: Innography patent database 2019, due to potential overlap of categories, higher number of search results were found than in the C&G therapy category
1 Location of patent inventor/registering party2 Patents, n= 6031 (2005-2018) 3 Publications, n=646,723 (2005-2018)
Cluster
HOTSPOTSPublications
HQ Country1
14%
13%
30%
5%
4%
6%
5%
3%
3%
6%
1%
1%
2%
2%
7%
1%
%; n=20k
UK
FR
DE
IL
SE
CH
NL
DK
BE
ES
NO
IE
AT
FI
IT
PO
2.5 3.8 0.5 5.81.4
1.4 2.2 3.8 0.5 0.6 4.5
1.7 3.4 6 1 17
0.2 0.3 3.2
0.6
0.3 0.5 0.1
0.2 0.5 1.5 0.2 0.3 1.2
0.2 1.4 1.5 0.2 2.2
0.7 1.4 1.1 0.5 0.2 0.6
0.1 0.5 0.6 0.6 0.7 0.8
0.3 0.3 1 0.1 0.2 0.6
0.5 0.7 2.6 0.1 0.5 1.6
0.1 0.2 0.1 0.1 0.3
0.3 0.1 0.2
0.2 0.3 0.3 0.1 0.7
0.3 0.2 0.5 0.1 0.4
0.5 1 2.5 0.2 0.2 2.6
0.1 0.2 0.1 0.4
Gene editing AntisenseStem Cell treatment siRNA CAR T
Gene therapies
8% 15% 29% 3% 5% 39%
Patents
% patents
0.1 1.6 0.1 0.4 1.11.3
1.7 0.2 1.8 0.2 0.6 1.2
2.6 0.3 3.3 0.3 1.9
0.5 0.6
0.3
0.2 0.3
0.6 0.1 0.7 0.1 0.2 0.5
0.6 0.1 0.7 0.1 0.2 0.5
0.3 0.3 0.1 0.2
0.4 0.1 0.4 0.1 0.1 0.3
0.5 0.5 0.1 0.3
1.3 0.1 1.2 0.1 0.3 0.8
0.2 0.2 0.1 0.2
0.3 0.2 0.1 0.2
0.3 0.4 0.1 0.2
0.3 0.2 0.1 0.2
2.3 0.2 2.3 0.2 0.4 1.1
0.4 0.4 0.1 0.3
Gene editing AntisenseStem Cell treatment siRNA CAR T
Gene therapies
31% 3% 34% 3% 8% 21% %publications
% pub-lications
11%
13%
20%
4%
5%
5%
2%
3%
4%
9%
2%
2%
3%
2%
15%
3%
Max0 Publ/Pat Median
Patents and publications
XIII
Germany leads Europe both in terms of publications (30% of total) and patents (20% of total), followed by UK and France (patents and publications) and Italy (publications only)
German leadership in CGT patents and publications
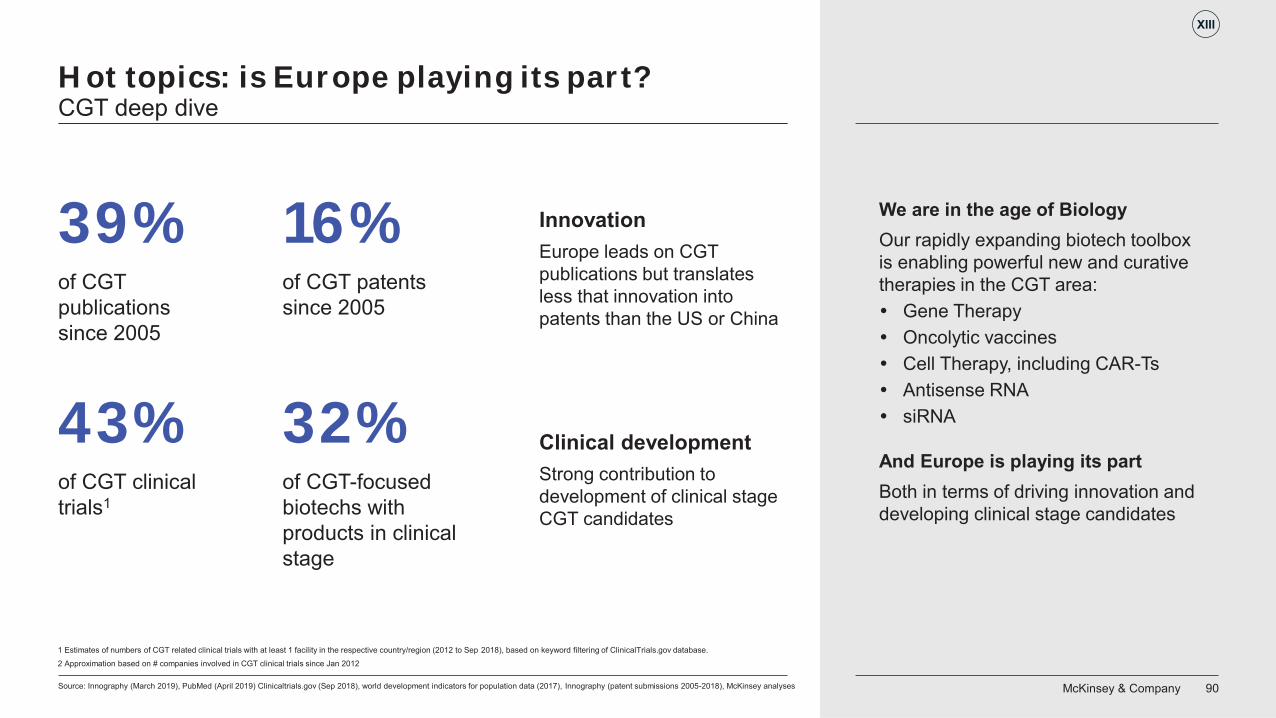
McKinsey & Company 90
Hot topics: is Europe playing its part?
Source: Innography (March 2019), PubMed (April 2019) Clinicaltrials.gov (Sep 2018), world development indicators for population data (2017), Innography (patent submissions 2005-2018), McKinsey analyses
CGT deep dive
1 Estimates of numbers of CGT related clinical trials with at least 1 facility in the respective country/region (2012 to Sep 2018), based on keyword filtering of ClinicalTrials.gov database. 2 Approximation based on # companies involved in CGT clinical trials since Jan 2012
We are in the age of BiologyOur rapidly expanding biotech toolbox is enabling powerful new and curative therapies in the CGT area:
Gene TherapyOncolytic vaccinesCell Therapy, including CAR-TsAntisense RNAsiRNA
And Europe is playing its partBoth in terms of driving innovation and developing clinical stage candidates
43%of CGT clinical trials1
32%of CGT-focused biotechs with products in clinical stage
Clinical developmentStrong contribution to development of clinical stage CGT candidates
39%of CGT publications since 2005
16%of CGT patents since 2005
InnovationEurope leads on CGT publications but translates less that innovation into patents than the US or China
XIII
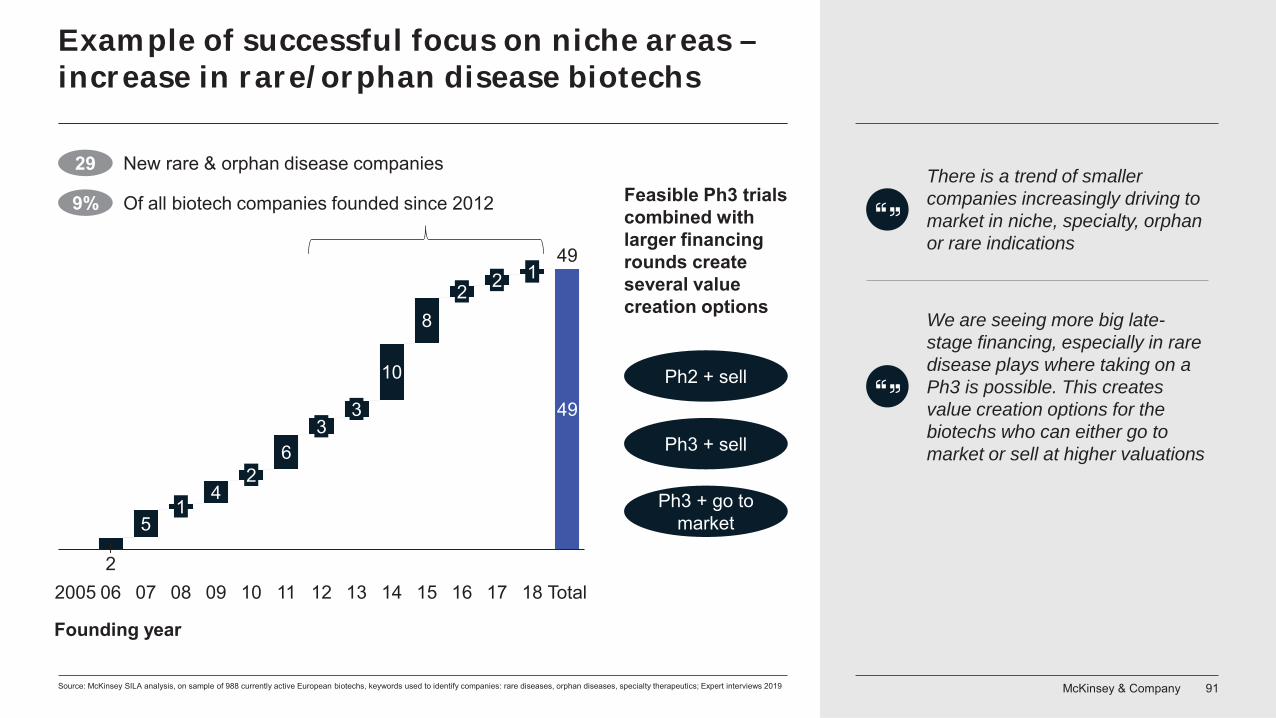
McKinsey & Company 91
Example of successful focus on niche areas –increase in rare/orphan disease biotechs
Source: McKinsey SILA analysis, on sample of 988 currently active European biotechs, keywords used to identify companies: rare diseases, orphan diseases, specialty therapeutics; Expert interviews 2019
2
49
54
6
10
8
11
3
12 14
Founding year
2
08 16
2
2005 17
1
Total07
49
1306
1
1809
2
10
3
15
29
9%
Ph2 + sell
Ph3 + sell
Feasible Ph3 trials combined with larger financing rounds create several value creation options
Ph3 + go to market
We are seeing more big late-stage financing, especially in rare disease plays where taking on a Ph3 is possible. This creates value creation options for the biotechs who can either go to market or sell at higher valuations
There is a trend of smaller companies increasingly driving to market in niche, specialty, orphan or rare indications
New rare & orphan disease companies
Of all biotech companies founded since 2012
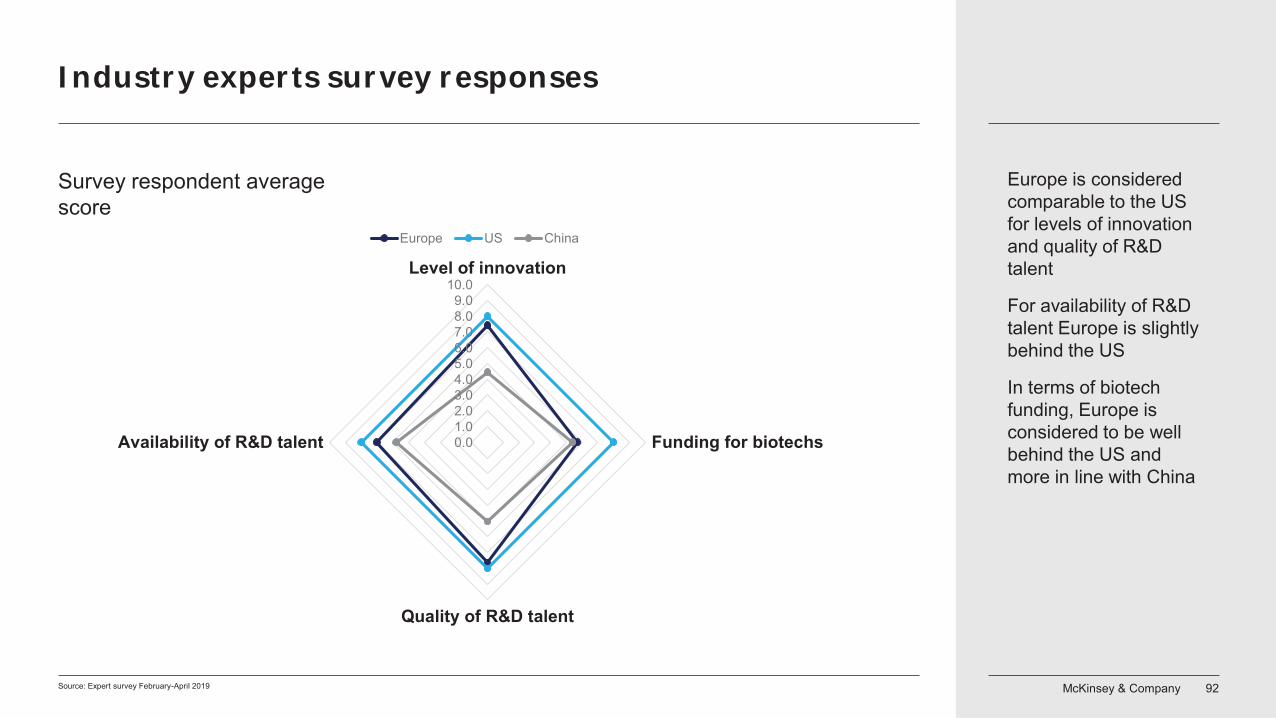
McKinsey & Company 92Source: Expert survey February-April 2019
Survey respondent average score
0.01.02.03.04.05.06.07.08.09.0
10.0Level of innovation
Funding for biotechs
Quality of R&D talent
Availability of R&D talent
Europe US China
Europe is considered comparable to the US for levels of innovation and quality of R&D talent
For availability of R&D talent Europe is slightly behind the US
In terms of biotech funding, Europe is considered to be well behind the US and more in line with China
Industry experts survey responses
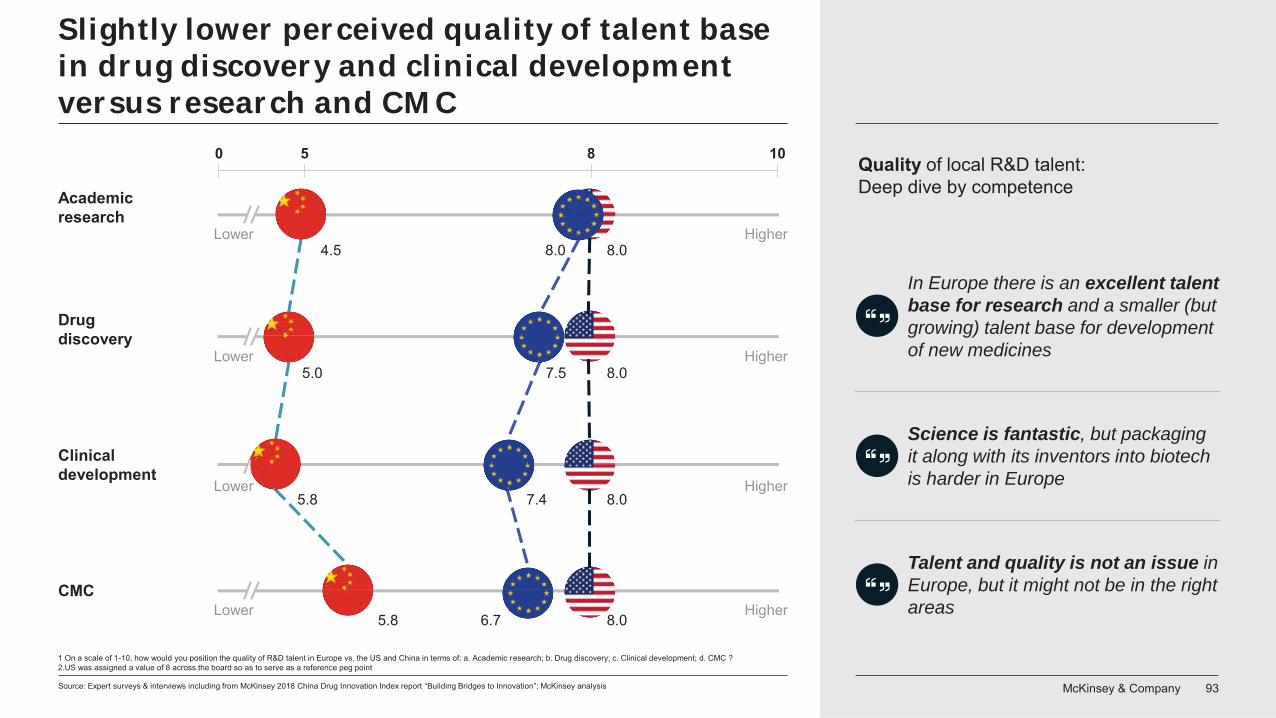
McKinsey & Company 93
Slightly lower perceived quality of talent base in drug discovery and clinical development versus research and CMC
In Europe there is an excellent talent base for research and a smaller (but growing) talent base for development of new medicines
Science is fantastic, but packaging it along with its inventors into biotech is harder in Europe
1 On a scale of 1-10, how would you position the quality of R&D talent in Europe vs. the US and China in terms of: a. Academic research; b. Drug discovery; c. Clinical development; d. CMC ? 2.US was assigned a value of 8 across the board so as to serve as a reference peg point
Quality of local R&D talent:Deep dive by competence
Talent and quality is not an issue in Europe, but it might not be in the right areas
CMCHigherLower
Drug discovery
Lower Higher
Academic research
Clinical development
HigherLower
0 105 8
HigherLower4.5
5.0
5.8
5.8
8.0
7.5
7.4
6.7
8.0
8.0
8.0
8.0
Source: Expert surveys & interviews including from McKinsey 2018 China Drug Innovation Index report “Building Bridges to Innovation”; McKinsey analysis
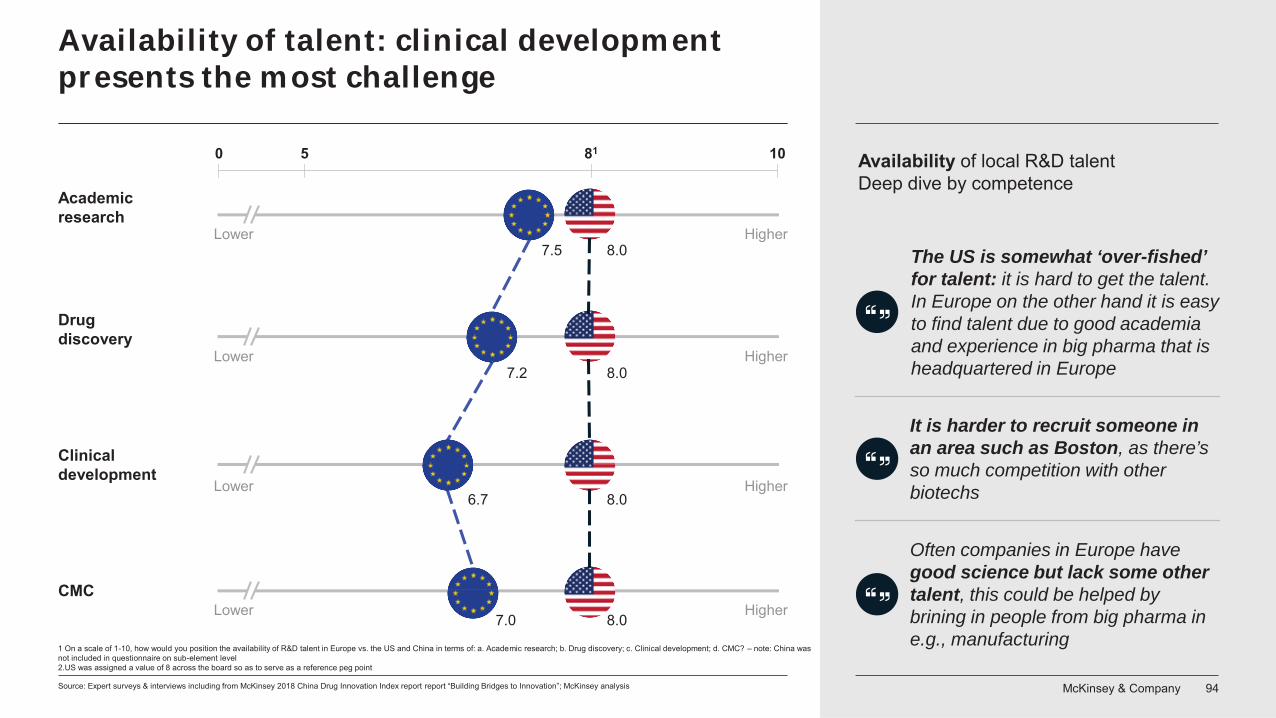
McKinsey & Company 94
Availability of talent: clinical development presents the most challenge
The US is somewhat ‘over-fished’ for talent: it is hard to get the talent. In Europe on the other hand it is easy to find talent due to good academia and experience in big pharma that is headquartered in Europe
It is harder to recruit someone in an area such as Boston, as there’s so much competition with other biotechs
1 On a scale of 1-10, how would you position the availability of R&D talent in Europe vs. the US and China in terms of: a. Academic research; b. Drug discovery; c. Clinical development; d. CMC? – note: China was not included in questionnaire on sub-element level2.US was assigned a value of 8 across the board so as to serve as a reference peg point
Availability of local R&D talentDeep dive by competence
Often companies in Europe have good science but lack some other talent, this could be helped by brining in people from big pharma in e.g., manufacturing
CMCHigherLower
Drug discovery
Lower Higher
Academic research
Clinical development
HigherLower
0 105 81
HigherLower7.5
7.2
6.7
7.0
8.0
8.0
8.0
8.0
Source: Expert surveys & interviews including from McKinsey 2018 China Drug Innovation Index report report “Building Bridges to Innovation”; McKinsey analysis
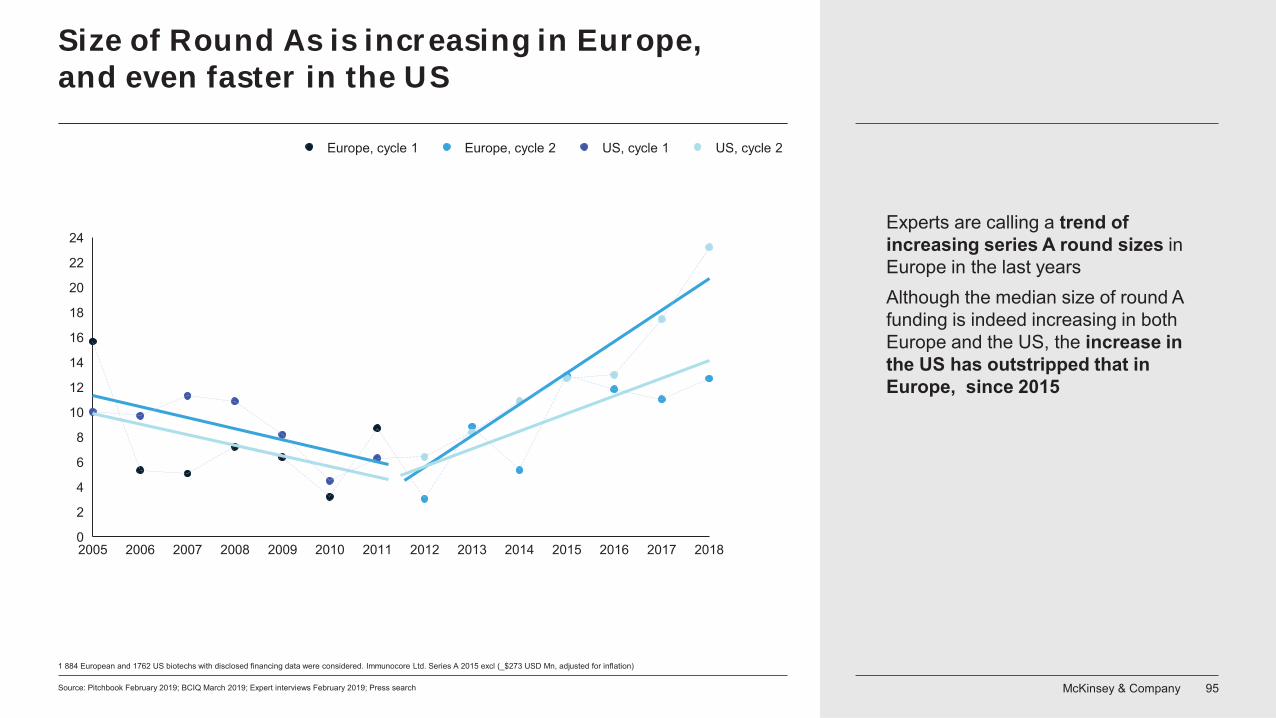
McKinsey & Company 95
Size of Round As is increasing in Europe, and even faster in the US
Source: Pitchbook February 2019; BCIQ March 2019; Expert interviews February 2019; Press search
20182005 20132006 2009
22
4
2007 20112008 2010 2012 2014 2015 2016 20170
2
6
20
8
10
12
14
16
18
24
US, cycle 2Europe, cycle 2Europe, cycle 1 US, cycle 1
1 884 European and 1762 US biotechs with disclosed financing data were considered. Immunocore Ltd. Series A 2015 excl (_$273 USD Mn, adjusted for inflation)
Experts are calling a trend of increasing series A round sizes in Europe in the last yearsAlthough the median size of round A funding is indeed increasing in both Europe and the US, the increase in the US has outstripped that in Europe, since 2015
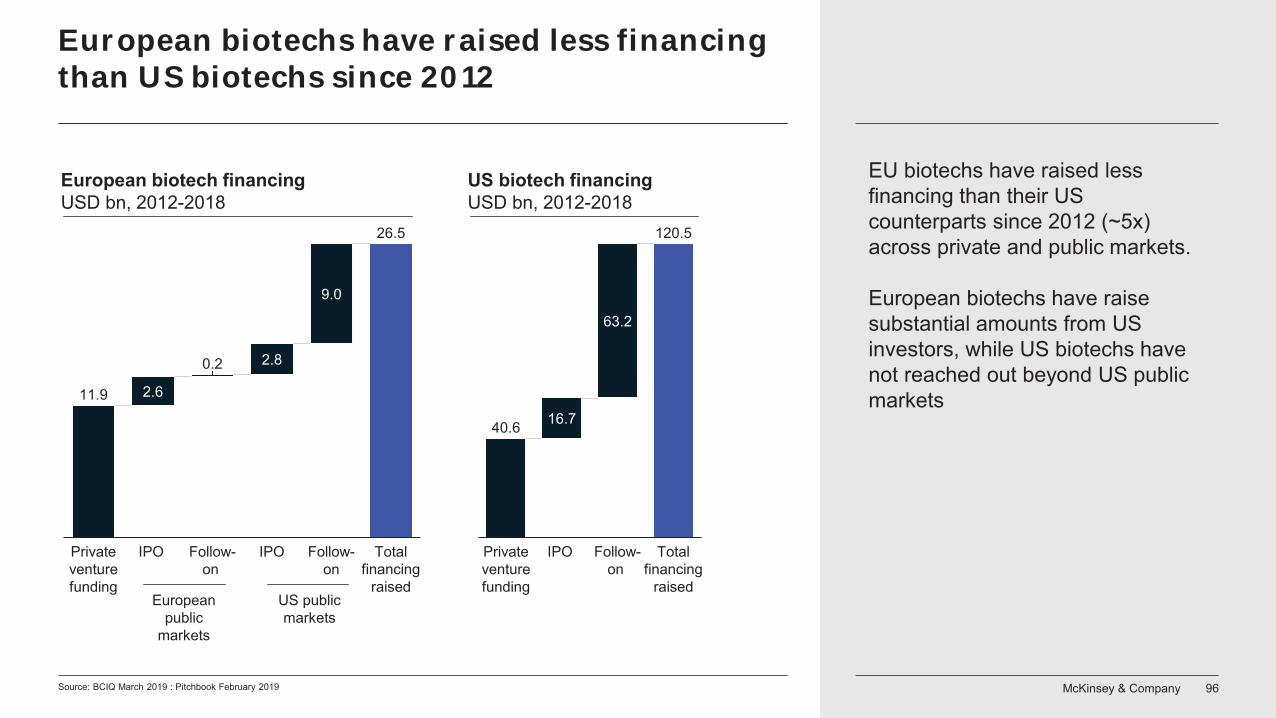
McKinsey & Company 96
European biotechs have raised less financing than US biotechs since 2012
Source: BCIQ March 2019 : Pitchbook February 2019
EU biotechs have raised less financing than their US counterparts since 2012 (~5x) across private and public markets.
European biotechs have raise substantial amounts from US investors, while US biotechs have not reached out beyond US public markets11.9
26.5
2.6
0.2 2.8
9.0
Private venture funding
Total financing
raised
IPOIPO Follow-on
Follow-on
European public
markets
US public markets
40.6
120.5
16.7
63.2
Private venture funding
IPO Follow-on
Total financing
raised
European biotech financing USD bn, 2012-2018
US biotech financing USD bn, 2012-2018
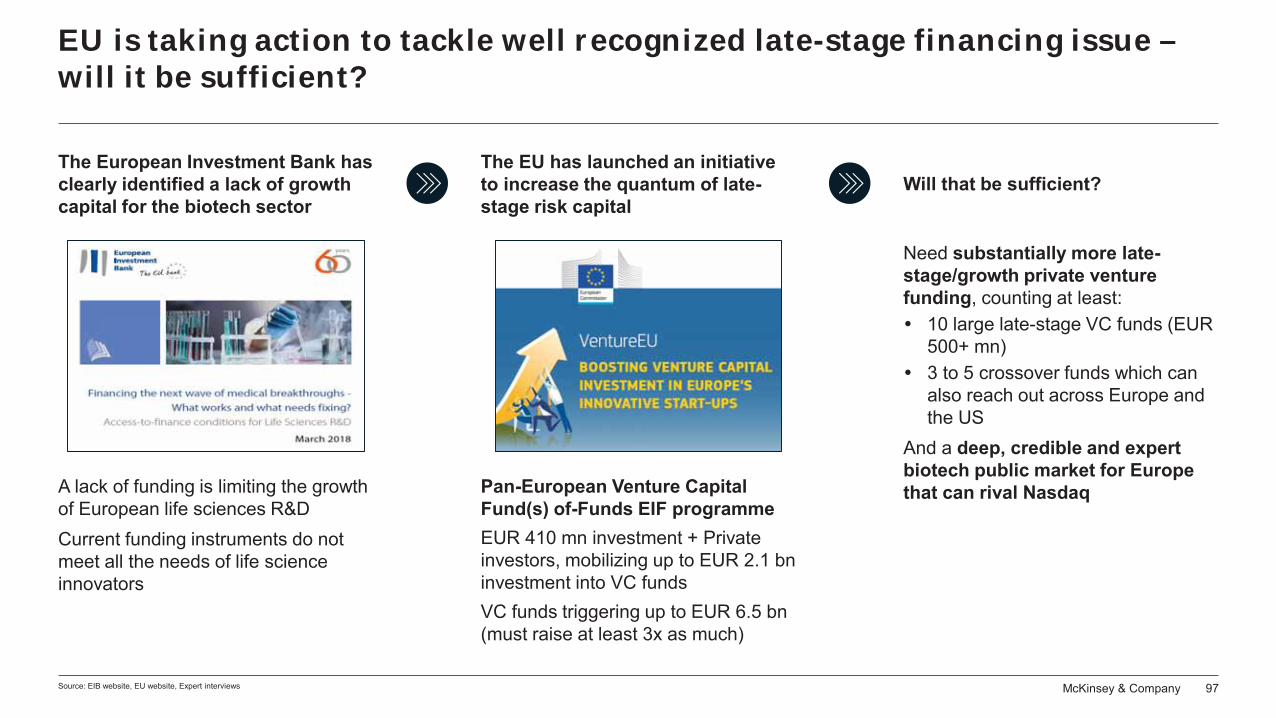
McKinsey & Company 97
EU is taking action to tackle well recognized late-stage financing issue –will it be sufficient?
Source: EIB website, EU website, Expert interviews
Will that be sufficient?
Need substantially more late-stage/growth private venture funding, counting at least:
10 large late-stage VC funds (EUR 500+ mn)3 to 5 crossover funds which can also reach out across Europe and the US
And a deep, credible and expert biotech public market for Europe that can rival Nasdaq
The European Investment Bank has clearly identified a lack of growth capital for the biotech sector
A lack of funding is limiting the growth of European life sciences R&DCurrent funding instruments do not meet all the needs of life science innovators
The EU has launched an initiative to increase the quantum of late-stage risk capital
Pan-European Venture Capital Fund(s) of-Funds EIF programme
VC funds triggering up to EUR 6.5 bn (must raise at least 3x as much)
EUR 410 mn investment + Private investors, mobilizing up to EUR 2.1 bn investment into VC funds
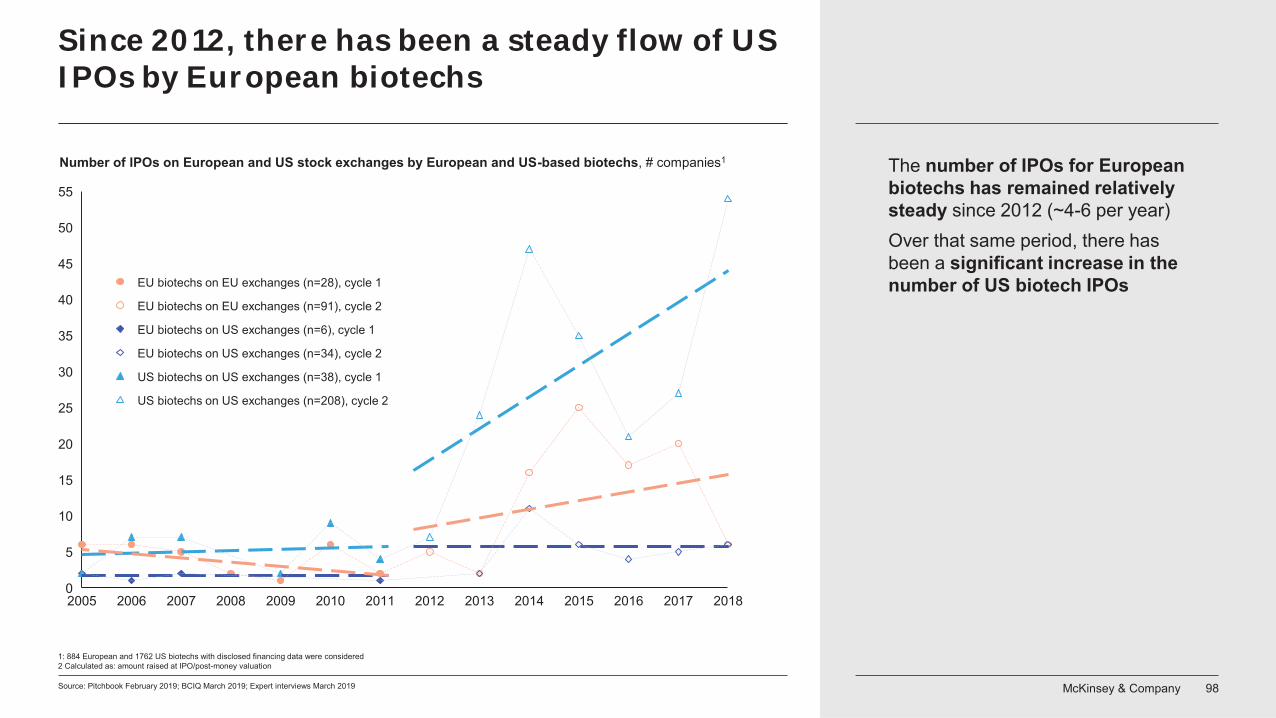
McKinsey & Company 98
Since 2012, there has been a steady flow of US IPOs by European biotechs
Source: Pitchbook February 2019; BCIQ March 2019; Expert interviews March 2019
20082005
50
2007
25
20152006
5
20112009 2010 2012 2013 2014 2016
30
2017
40
20180
10
15
20
35
45
55
Number of IPOs on European and US stock exchanges by European and US-based biotechs, # companies1
US biotechs on US exchanges (n=38), cycle 1
EU biotechs on EU exchanges (n=28), cycle 1
EU biotechs on EU exchanges (n=91), cycle 2
EU biotechs on US exchanges (n=6), cycle 1
US biotechs on US exchanges (n=208), cycle 2
EU biotechs on US exchanges (n=34), cycle 2
1: 884 European and 1762 US biotechs with disclosed financing data were considered2 Calculated as: amount raised at IPO/post-money valuation
The number of IPOs for European biotechs has remained relatively steady since 2012 (~4-6 per year)Over that same period, there has been a significant increase in the number of US biotech IPOs
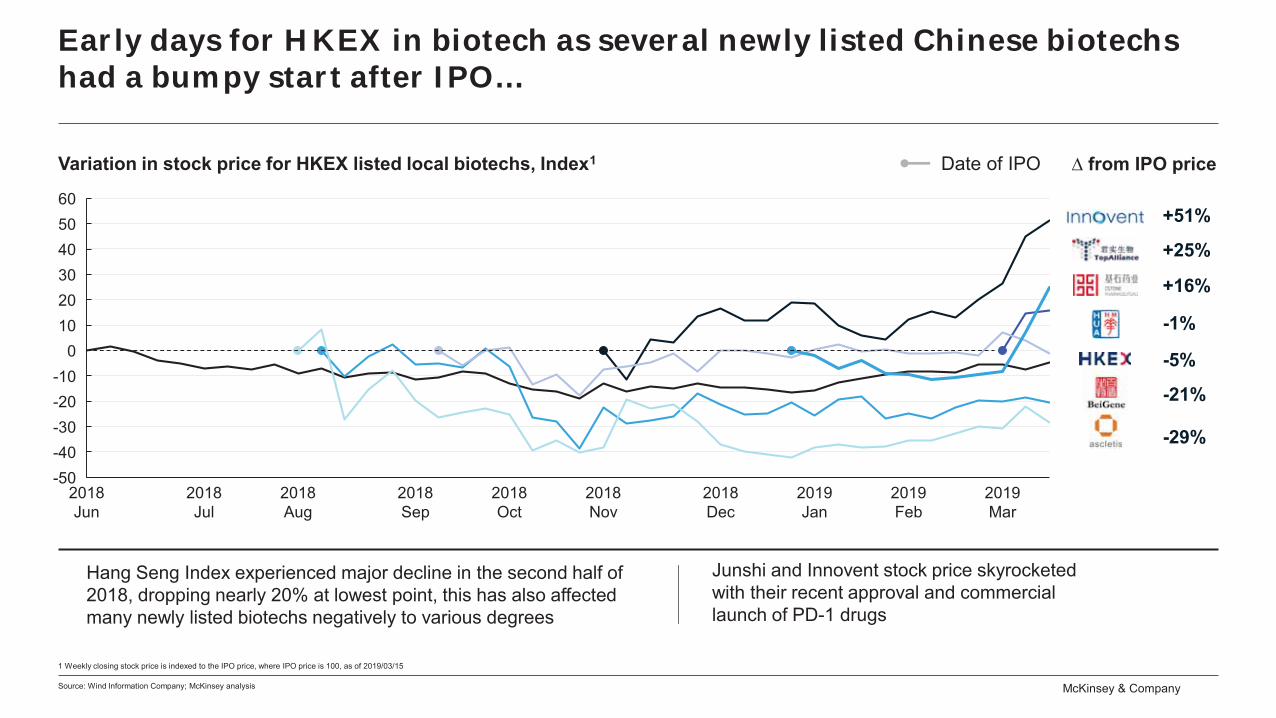
McKinsey & Company
Variation in stock price for HKEX listed local biotechs, Index1
-40
-20-10
102030
-30
0
50
-50
60
40
2019 Feb
2018 Jun
2018 Jul
2018 Aug
2018 Sep
2018 Oct
2018 Nov
2018 Dec
2019 Jan
2019 Mar
Date of IPO ∆ from IPO price
-5%
+25%
+16%
+51%
-21%
-1%
-29%
Early days for HKEX in biotech as several newly listed Chinese biotechs had a bumpy start after IPO…
1 Weekly closing stock price is indexed to the IPO price, where IPO price is 100, as of 2019/03/15
Source: Wind Information Company; McKinsey analysis
Hang Seng Index experienced major decline in the second half of 2018, dropping nearly 20% at lowest point, this has also affected many newly listed biotechs negatively to various degrees
Junshi and Innovent stock price skyrocketed with their recent approval and commercial launch of PD-1 drugs
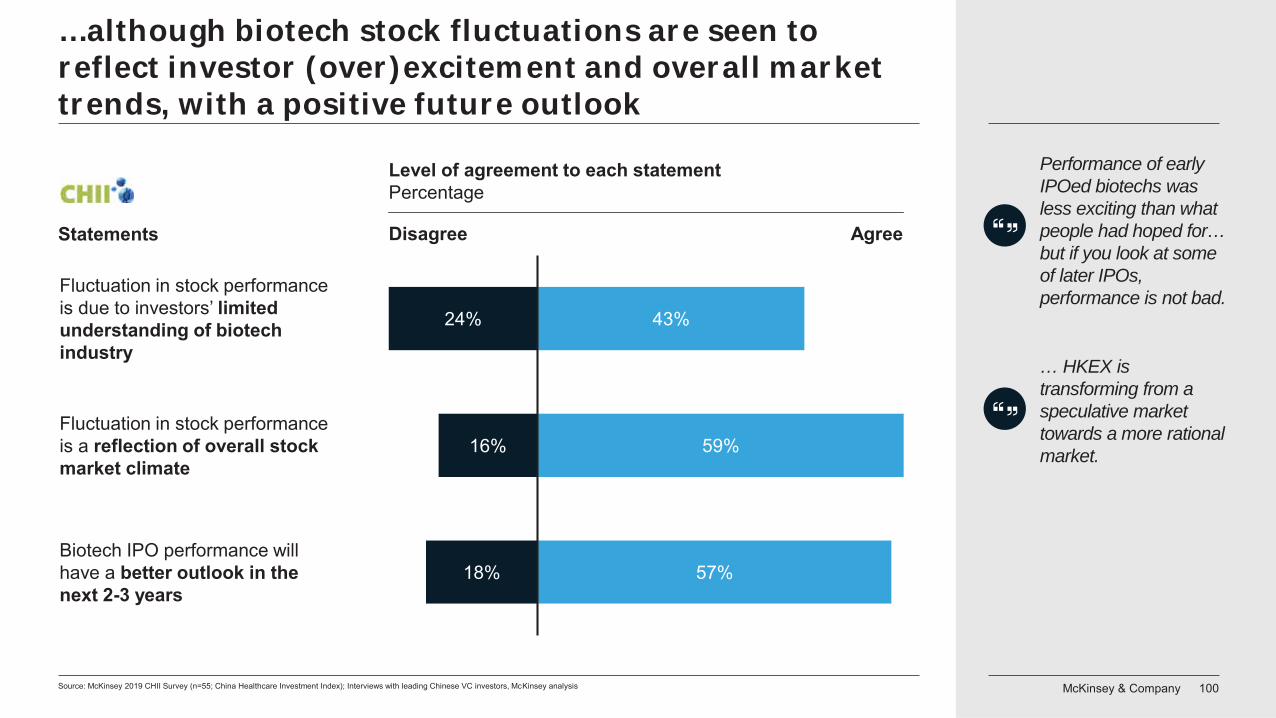
McKinsey & Company 100
…although biotech stock fluctuations are seen to reflect investor (over)excitement and overall market trends, with a positive future outlook
Source: McKinsey 2019 CHII Survey (n=55; China Healthcare Investment Index); Interviews with leading Chinese VC investors, McKinsey analysis
Statements
Level of agreement to each statement Percentage
Disagree
43%
59%
57%
16%
18%
24%
Fluctuation in stock performanceis due to investors’ limited understanding of biotech industry
Biotech IPO performance will have a better outlook in the next 2-3 years
Fluctuation in stock performance is a reflection of overall stock market climate
Agree
Performance of early IPOed biotechs was less exciting than what people had hoped for… but if you look at some of later IPOs, performance is not bad.
… HKEX is transforming from a speculative market towards a more rational market.

McKinsey & Company 101MMMMMMMcccMMMMMMMMMcMMMMMMMMMMMMMMMccMMMMMcMMMMMMMMMMMMcMMMMcMcMMMMMMMMMMMMMMMMMMMMMMMMMMMM KKiKKiKiiiiinnnnnnnnnnnnnnsnsssnsnssnsnsnsnsnsnnnsnnsnnsnsnssnnsnsnsssnnssnsnsssnssnsseeeeeeeeeyeyeyeyeyeyyyyyyeeeeeeeyeeyeeyeeeeeeeeeyeyeeeeeeyeeeyeeeyeeeeeeee &&&& CCCCCCCCCCCCCCCCCCCCCCCCCCCComomomomomomomomomommmmmmmmooomomomomommooommmommmmommoooooo papapaappp nynynynynynynnnynynnnynnnnnnnnnnnnnnnnnnnnnnnnnynnnnnnnnynnnnnnnnnnnnnnnynnnnnnynnnnnnnynnnnnnnnnnynnnnnnnnny 111010101010010010010000100001000000000000010101000000010010000010110100000011111111111111111111111111111111111111111111111111111111
Overview of methodology
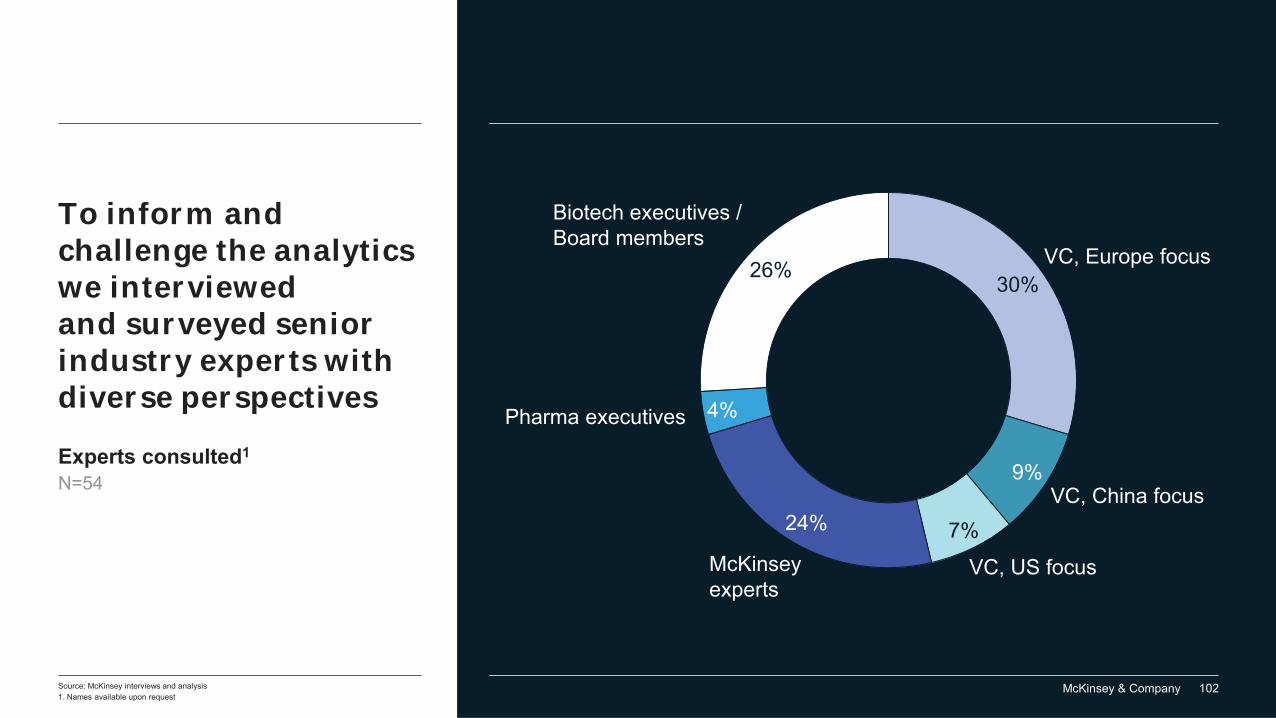
McKinsey & Company 102
To inform and challenge the analytics we interviewed and surveyed senior industry experts with diverse perspectives
Source: McKinsey interviews and analysis
30%
9%
7%24%
4%
26%
Pharma executives
McKinseyexperts
VC, Europe focus
VC, China focus
VC, US focus
Biotech executives / Board members
Experts consulted1
N=54
1. Names available upon request
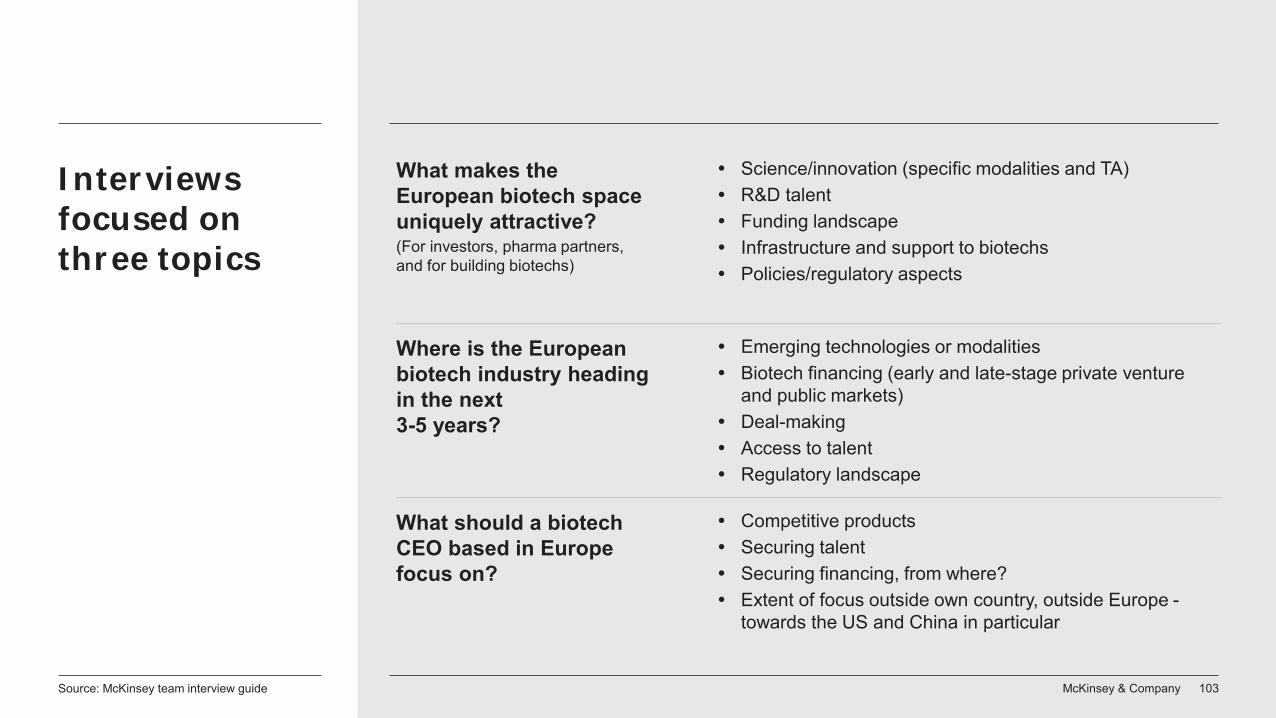
McKinsey & Company 103
Interviews focused on three topics
What should a biotech CEO based in Europe focus on?
Competitive productsSecuring talentSecuring financing, from where?Extent of focus outside own country, outside Europe -towards the US and China in particular
Where is the European biotech industry heading in the next 3-5 years?
Emerging technologies or modalitiesBiotech financing (early and late-stage private venture and public markets)Deal-makingAccess to talentRegulatory landscape
What makes the European biotech space uniquely attractive?
Science/innovation (specific modalities and TA) R&D talentFunding landscapeInfrastructure and support to biotechsPolicies/regulatory aspects
(For investors, pharma partners, and for building biotechs)
Source: McKinsey team interview guide
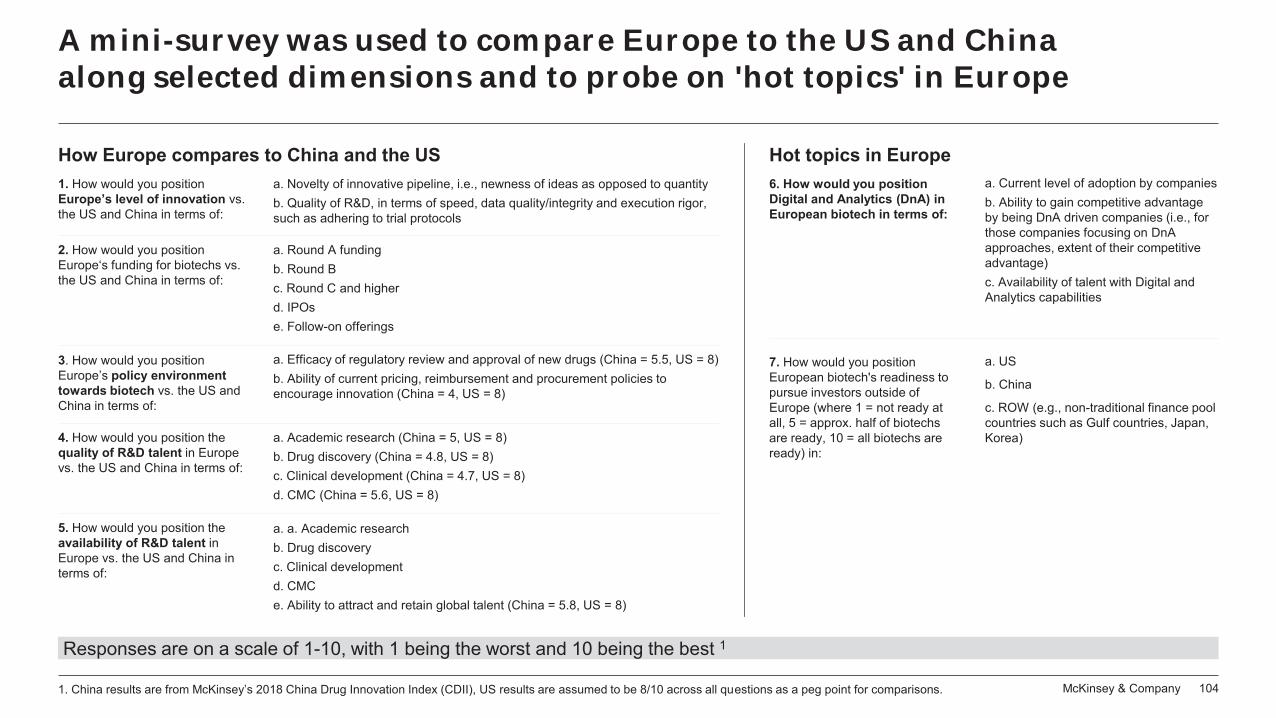
McKinsey & Company 104
A mini-survey was used to compare Europe to the US and China along selected dimensions and to probe on 'hot topics' in Europe
1. China results are from McKinsey’s 2018 China Drug Innovation Index (CDII), US results are assumed to be 8/10 across all questions as a peg point for comparisons.
Responses are on a scale of 1-10, with 1 being the worst and 10 being the best 1
Hot topics in Europe1. How would you position Europe’s level of innovation vs. the US and China in terms of:
a. Novelty of innovative pipeline, i.e., newness of ideas as opposed to quantityb. Quality of R&D, in terms of speed, data quality/integrity and execution rigor, such as adhering to trial protocols
2. How would you position Europe‘s funding for biotechs vs. the US and China in terms of:
a. Round A fundingb. Round Bc. Round C and higherd. IPOse. Follow-on offerings
3. How would you position Europe’s policy environment towards biotech vs. the US and China in terms of:
a. Efficacy of regulatory review and approval of new drugs (China = 5.5, US = 8)b. Ability of current pricing, reimbursement and procurement policies to encourage innovation (China = 4, US = 8)
4. How would you position the quality of R&D talent in Europe vs. the US and China in terms of:
a. Academic research (China = 5, US = 8)b. Drug discovery (China = 4.8, US = 8)c. Clinical development (China = 4.7, US = 8)d. CMC (China = 5.6, US = 8)
5. How would you position the availability of R&D talent in Europe vs. the US and China in terms of:
How Europe compares to China and the US
a. a. Academic researchb. Drug discoveryc. Clinical developmentd. CMCe. Ability to attract and retain global talent (China = 5.8, US = 8)
7. How would you position European biotech's readiness to pursue investors outside of Europe (where 1 = not ready at all, 5 = approx. half of biotechsare ready, 10 = all biotechs are ready) in:
6. How would you position Digital and Analytics (DnA) in European biotech in terms of:
a. Current level of adoption by companiesb. Ability to gain competitive advantage by being DnA driven companies (i.e., for those companies focusing on DnAapproaches, extent of their competitive advantage)c. Availability of talent with Digital and Analytics capabilities
a. US
b. China
c. ROW (e.g., non-traditional finance pool countries such as Gulf countries, Japan, Korea)
McKinsey & Company 105
Main data and information sources
DatabasesPitchbook, February 2019, BioCentury BCIQ, February/March 2019Pharmaprojects, March 2019 PubMed, April 2019Innography patents, March 2019Clinicaltrials.gov, October 2018Evaluate Pharma database April 2019IQVIA Pharmadeals, February 2019Preqin, March 2019
Other sourcesThe Times World University rankings 2019 - Life SciencesCWTS Leiden Ranking 2018 – ranking of University publications (2013-2016); Company websites Jan-April 2019BioCentury – Innovation DistilleryMcKinsey report “Building Bridges to Innovation”, China Healthcare Summit 2018McKinsey CHII Survey 2019 (China Healthcare Investment Index)Horizon 2020 and Venture EU websites (EIB and EU)HKEX websiteWind Information Company
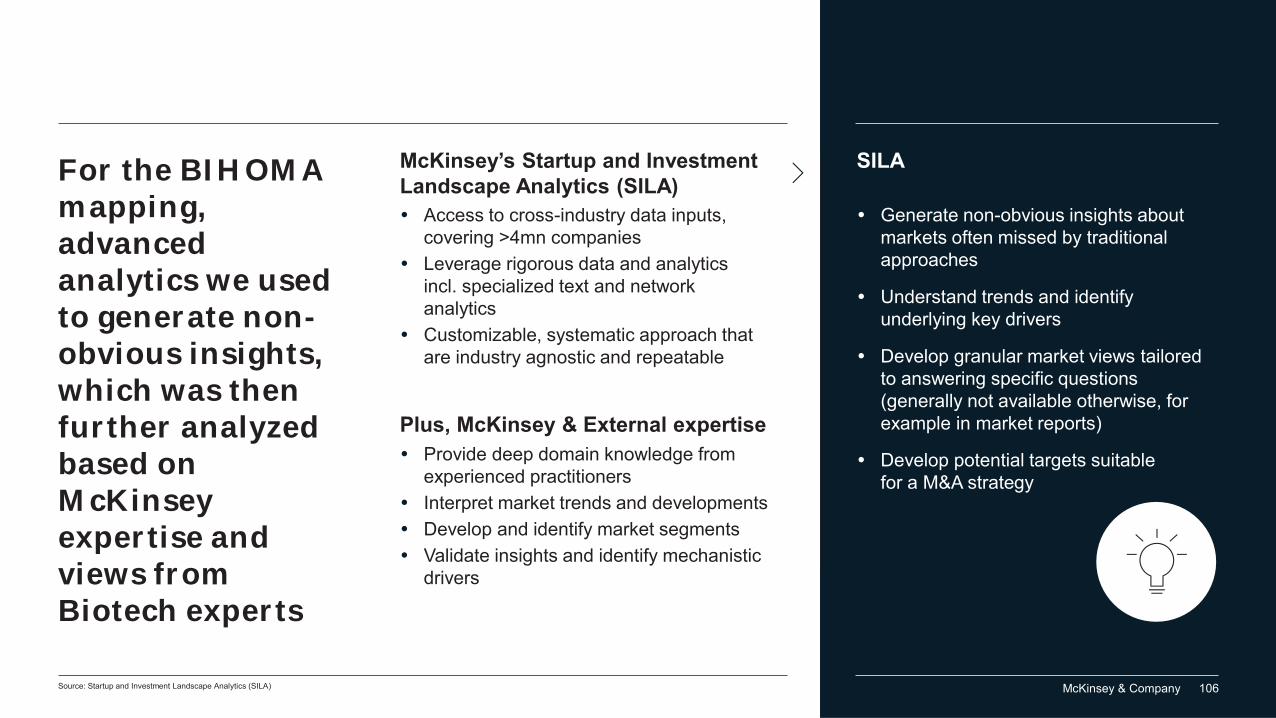
McKinsey & Company 106
For the BIHOMA mapping, advanced analytics we used to generate non-obvious insights, which was then further analyzed based on McKinsey expertise and views from Biotech experts
Plus, McKinsey & External expertiseProvide deep domain knowledge from experienced practitionersInterpret market trends and developmentsDevelop and identify market segments Validate insights and identify mechanistic drivers
1. Includes sources such as Pitchbook, S&P Capital IQ, Crunchbase, CB Insights, patent data (e.g., Innography, Thomson Reuters) news, and other specialized data sets as relevant
Generate non-obvious insights about markets often missed by traditional approaches
Understand trends and identify underlying key drivers
Develop granular market views tailored to answering specific questions(generally not available otherwise, for example in market reports)
Develop potential targets suitable for a M&A strategy
Access to cross-industry data inputs, covering >4mn companiesLeverage rigorous data and analytics incl. specialized text and network analyticsCustomizable, systematic approach that are industry agnostic and repeatable
McKinsey’s Startup and Investment Landscape Analytics (SILA)
SILA
Source: Startup and Investment Landscape Analytics (SILA)
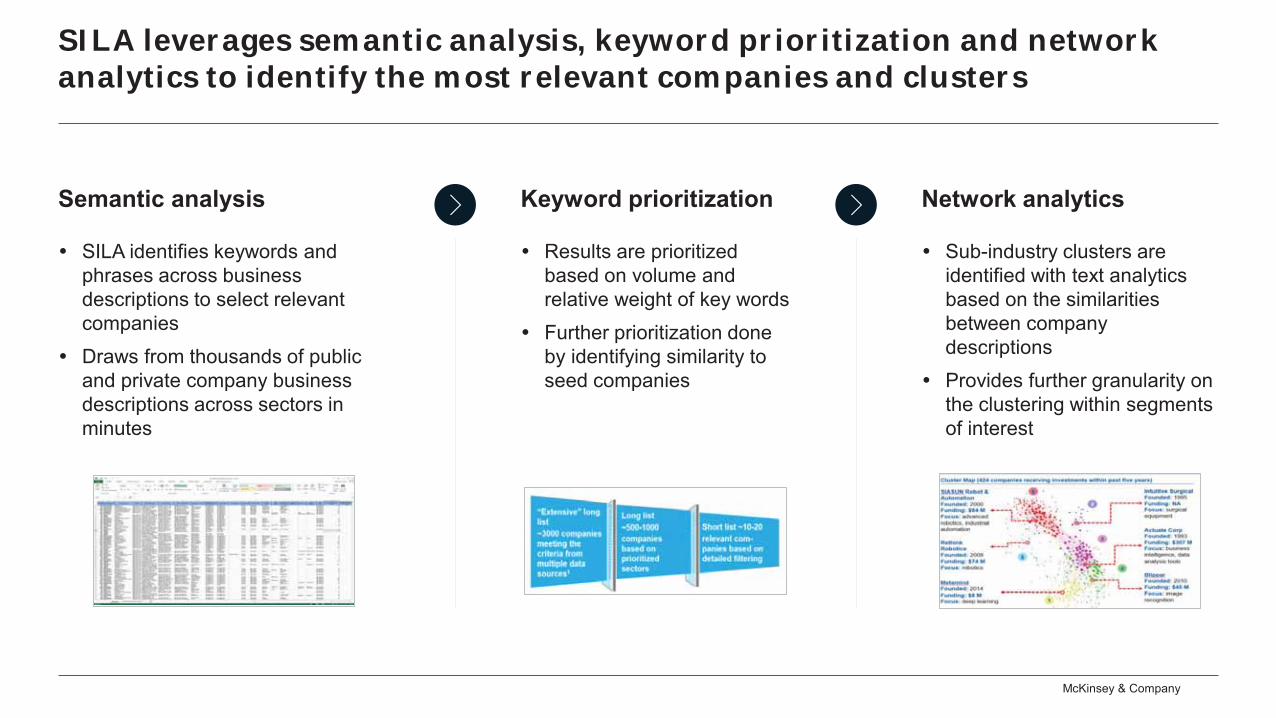
McKinsey & Company
SILA leverages semantic analysis, keyword prioritization and network analytics to identify the most relevant companies and clusters
Results are prioritized based on volume and relative weight of key words Further prioritization done by identifying similarity to seed companies
Keyword prioritization
SILA identifies keywords and phrases across business descriptions to select relevant companiesDraws from thousands of public and private company business descriptions across sectors in minutes
Semantic analysis
Sub-industry clusters are identified with text analytics based on the similarities between company descriptions Provides further granularity on the clustering within segments of interest
Network analytics
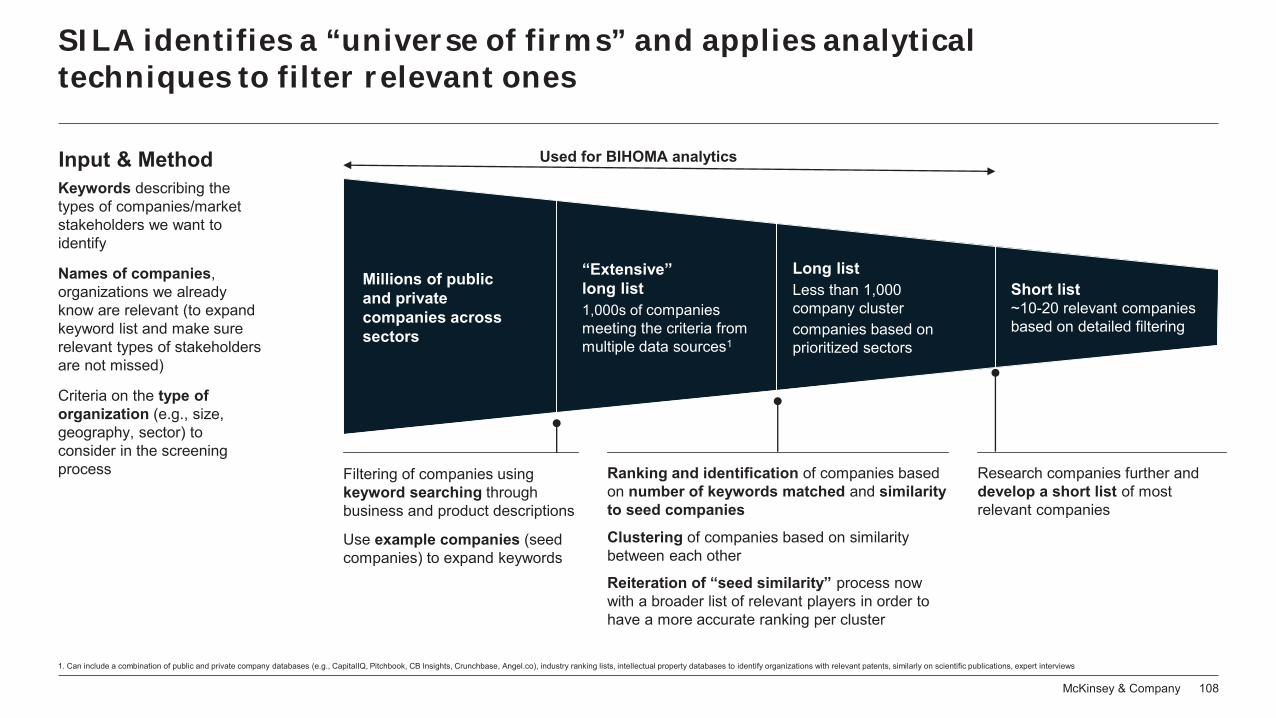
McKinsey & Company 108
SILA identifies a “universe of firms” and applies analytical techniques to filter relevant ones
Input & MethodKeywords describing the types of companies/market stakeholders we want to identify
Names of companies, organizations we already know are relevant (to expand keyword list and make sure relevant types of stakeholders are not missed)
Criteria on the type of organization (e.g., size, geography, sector) to consider in the screening process
Short list ~10-20 relevant companies based on detailed filtering
Long listLess than 1,000company clustercompanies based on prioritized sectors
“Extensive” long list 1,000s of companies meeting the criteria from multiple data sources1
Millions of public and private companies across sectors
Research companies further and develop a short list of most relevant companies
Ranking and identification of companies based on number of keywords matched and similarity to seed companies
Clustering of companies based on similarity between each other
Reiteration of “seed similarity” process now with a broader list of relevant players in order to have a more accurate ranking per cluster
Filtering of companies using keyword searching through business and product descriptions
Use example companies (seed companies) to expand keywords
1. Can include a combination of public and private company databases (e.g., CapitalIQ, Pitchbook, CB Insights, Crunchbase, Angel.co), industry ranking lists, intellectual property databases to identify organizations with relevant patents, similarly on scientific publications, expert interviews
Used for BIHOMA analytics
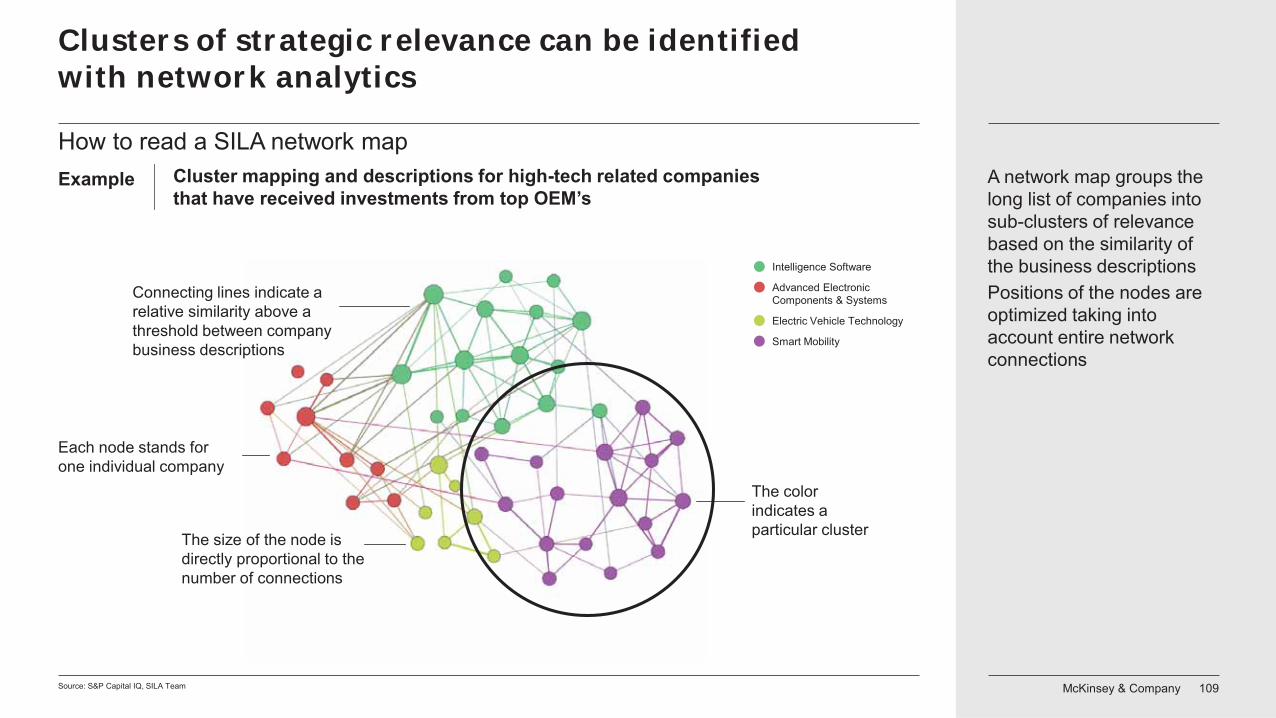
McKinsey & Company 109
Clusters of strategic relevance can be identified with network analytics
Source: S&P Capital IQ, SILA Team
How to read a SILA network mapA network map groups the long list of companies into sub-clusters of relevance based on the similarity of the business descriptionsPositions of the nodes are optimized taking into account entire network connections
Cluster mapping and descriptions for high-tech related companies that have received investments from top OEM’s
Intelligence Software
Advanced Electronic Components & Systems
Electric Vehicle Technology
Smart Mobility
Connecting lines indicate a relative similarity above a threshold between company business descriptions
The color indicates a particular clusterThe size of the node is
directly proportional to the number of connections
Each node stands for one individual company
Example
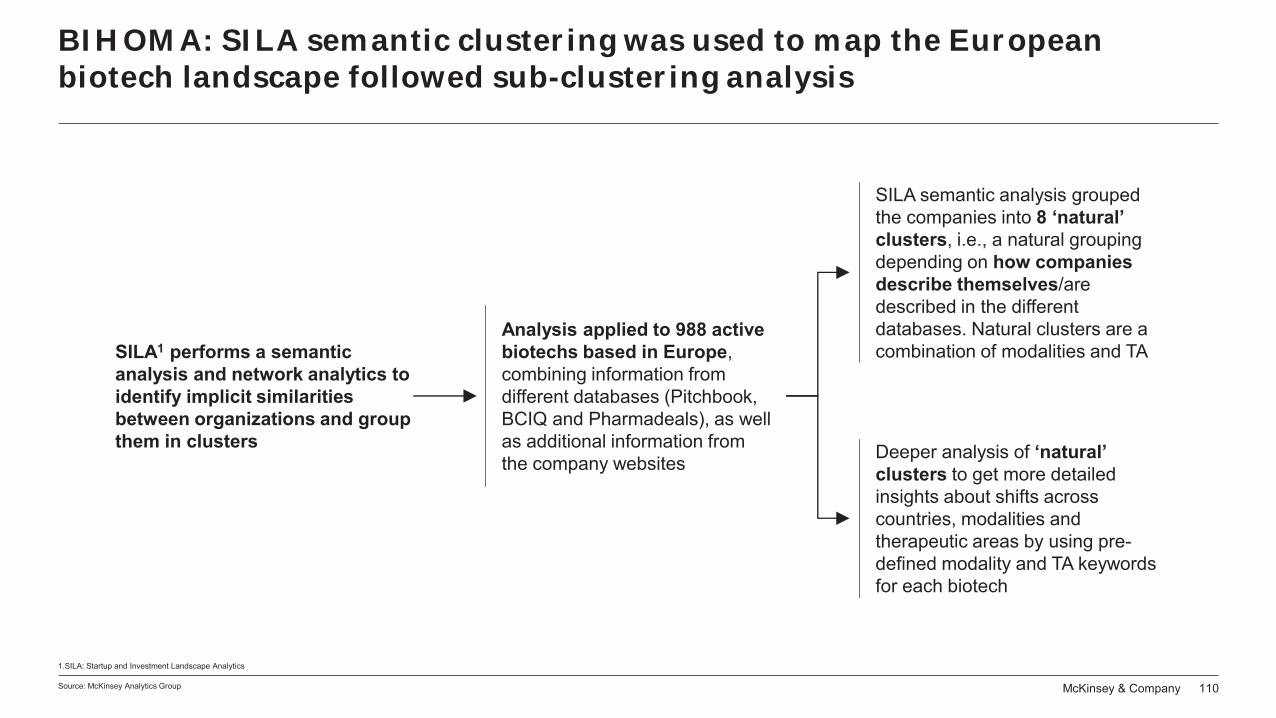
McKinsey & Company 110
BIHOMA: SILA semantic clustering was used to map the European biotech landscape followed sub-clustering analysis
Source: McKinsey Analytics Group
1.SILA: Startup and Investment Landscape Analytics
SILA semantic analysis grouped the companies into 8 ‘natural’ clusters, i.e., a natural grouping depending on how companies describe themselves/are described in the different databases. Natural clusters are a combination of modalities and TA
Deeper analysis of ‘natural’ clusters to get more detailed insights about shifts across countries, modalities and therapeutic areas by using pre-defined modality and TA keywords for each biotech
Analysis applied to 988 active biotechs based in Europe, combining information from different databases (Pitchbook, BCIQ and Pharmadeals), as well as additional information from the company websites
SILA1 performs a semantic analysis and network analytics to identify implicit similarities between organizations and group them in clusters

CONFIDENTIAL AND PROPRIETARYAny use of this material without specific permission of McKinsey & Company is strictly prohibited
Company
Main contacts
Jorge Santos da [email protected]
Franck Le [email protected]
Antony [email protected]
Robert [email protected]