BioSpec-mini - Mason Technology
8
BioSpec-mini Shimadzu Nucleic Acid & Protein Spectrophotometer C101-E093A Checking the Concentration Checking the Concentration of PCR Products of PCR Products Primer Primer Concentration Concentration Measurement Measurement For Checking For Checking Concentration Before Concentration Before Electrophoresis Electrophoresis Counting of Cloned E. Counting of Cloned E. coil Bacteria coil Bacteria Checking the Purity of Checking the Purity of Nucleic Acid Nucleic Acid Protein Quantitation Protein Quantitation Checking the Concentration of PCR Products Primer Concentration Measurement For Checking Concentration Before Electrophoresis Counting of Cloned E. coil Bacteria Checking the Purity of Nucleic Acid Protein Quantitation A Best-suited for Life Science Research Compact, Easy-to-use, for Life Science Sophisicated software functions and the class-beyond spectral performance!
Transcript of BioSpec-mini - Mason Technology

BioSpec-mini
Shimadzu Nucleic Acid & Protein Spectrophotometer
C101-E093A
Checking the ConcentrationChecking the Concentrationof PCR Productsof PCR Products
PrimerPrimerConcentrationConcentrationMeasurementMeasurement
For CheckingFor CheckingConcentration BeforeConcentration Before
ElectrophoresisElectrophoresis
Counting of Cloned E.Counting of Cloned E.coil Bacteriacoil Bacteria
Checking the Purity ofChecking the Purity ofNucleic AcidNucleic Acid
Protein QuantitationProtein Quantitation
Checking the Concentrationof PCR Products
PrimerConcentrationMeasurement
For CheckingConcentration Before
Electrophoresis
Counting of Cloned E.coil Bacteria
Checking the Purity ofNucleic Acid
Protein Quantitation
A Best-suited for Life Science Research
Compact, Easy-to-use, for Life ScienceSophisicated software functions and
the class-beyond spectral performance!
2
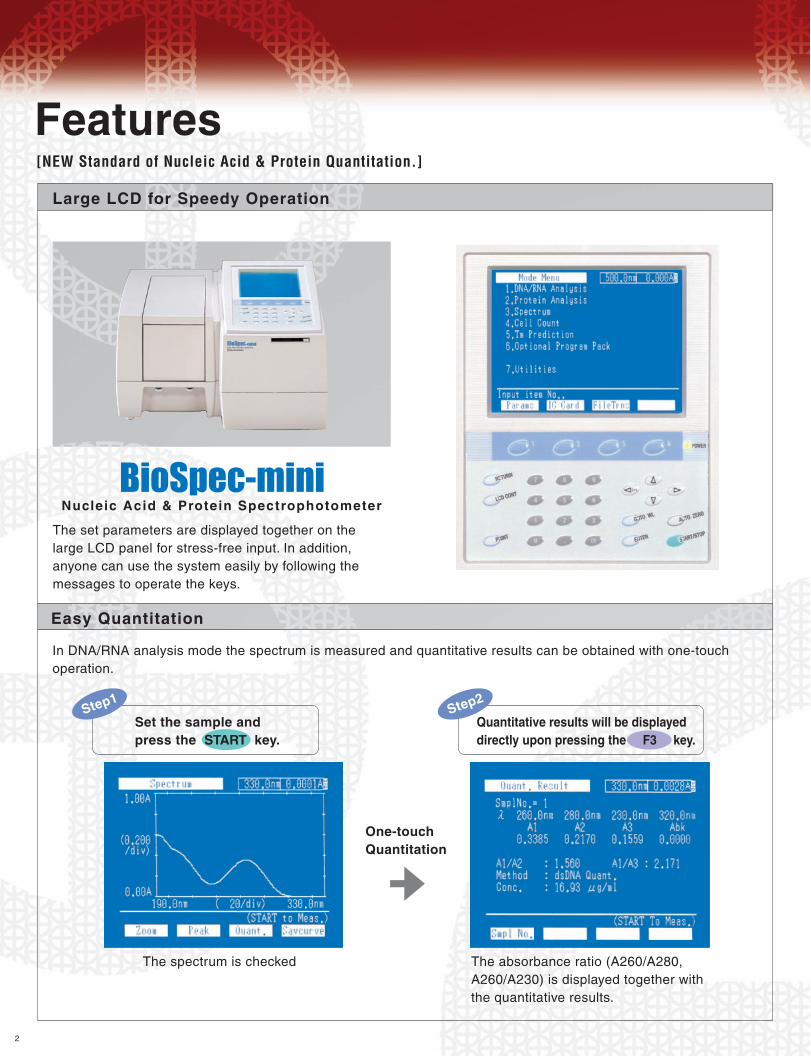
The set parameters are displayed together on the large LCD panel for stress-free input. In addition, anyone can use the system easily by following the messages to operate the keys.
The spectrum is checked
Set the sample and press the START key.
One-touchQuantitation
The absorbance ratio (A260/A280, A260/A230) is displayed together with the quantitative results.
In DNA/RNA analysis mode the spectrum is measured and quantitative results can be obtained with one-touch operation.
Nucleic Acid & Protein Spectrophotometer
Features[NEW Standard of Nucleic Acid & Protein Quantitation.]
Large LCD for Speedy Operation
Easy Quantitation
µ
Step1
Quantitative results will be displayed directly upon pressing the F3 key.
Step2
3
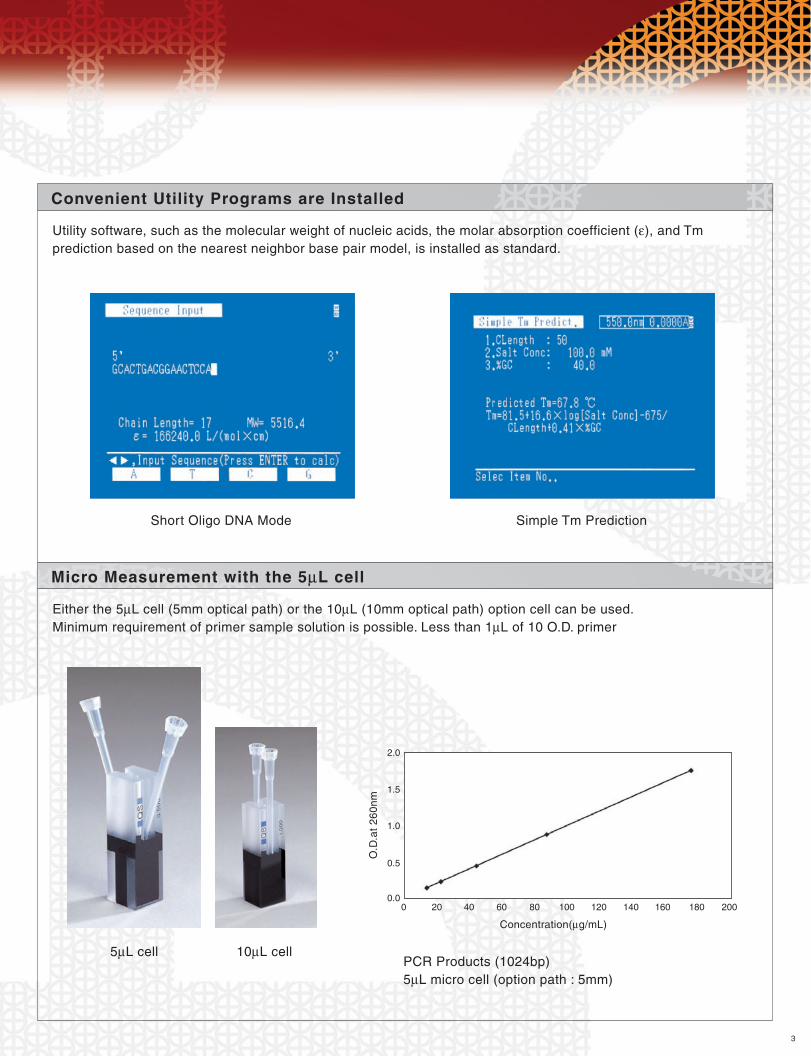
Utility software, such as the molecular weight of nucleic acids, the molar absorption coefficient (ε), and Tm prediction based on the nearest neighbor base pair model, is installed as standard.
Either the 5µL cell (5mm optical path) or the 10µL (10mm optical path) option cell can be used.Minimum requirement of primer sample solution is possible. Less than 1µL of 10 O.D. primer
Short Oligo DNA Mode Simple Tm Prediction
PCR Products (1024bp)5µL micro cell (option path : 5mm)
5µL cell 10µL cell
Convenient Utility Programs are Installed
Micro Measurement with the 5µL cell
2.0
1.5
1.0
0.5
0.00 20 40 60 80 100 120 140 160 180 200
O.D
.at
260n
m
Concentration(µg/mL)

4
The concentration is obtained by multiplying the absorbance at 260nm with a preset coefficient. Preset factors for the dsDNA, ssDNA, RNA, OligoDNA quantitation are changeable.
4 types of quantitative methods that measure protein concentration using coloring reagents are supported, as well as the quantitative method that utilize UV absorption at 280nm. Quantitative measurement using coloring reagents is carried out by creating calibration curves.
Simple Quantitation Mode
Performs quantitation of single-stranded OligoDNA, OligoRNA. Enter either the base composition (Long Oligo Mode) or the base sequence (Short Oligo Mode) to automatically calculate the molecular weight and molar absorption coefficient (ε), and calculate the concentration from the absorbance at 260nm.
Oligo Quantitation Mode
Performs quantitation of either proteins or nucleic acids from the absorbance of two wavelengths, at either 260nm and 280nm, or 260nm and 230nm.
Warburg-Christian Quantitation Mode
Contamination of the protein can be checked by measuring the spectrum (190nm to 330nm) before quantitative calculations.
Spectrum Measurement
Lowry Method BCA Method (Method employing Bicinchoninic Acid) CBB Method (Bradford Method, method employing Coomassie Brilliant Blue G-250) Biuret Method UV Absorption Method (280nm)
Method of Quantitation
Functions[Packed full with long-awaited functions,from routine to high-end uses.]
Nucleic Acid Quantitation
Protein Quantitation

5
The absorbance at 600nm is measured to calculate the cell count from the entered coefficient and dilution ratio.
Wide-range spectrum measurement (190nm to 1,100nm) can be obtained. Zoom in/ zoom out of the spectrum, and peak detection etc. are possible.
Cell Count
Spectrum Measurement
Nearest Neighbor Base Pair Model Calculation
Calculations of the Tm and thermodynamic parameters ( ∆H, ∆S, ∆G ) of double strand formation DNA/DNA and RNA/RNA duplexes that do not include mismatches are supported. The nearest neighbor base pair model allows to predict the more accurate values.
Simple Tm Prediction
Simple Tm Prediction with the inputting of chain length, salt conc., and GC content (%). Estimated Tm value = 81.5 +16.6 x log[ Salt conc.] -675 / Chain length+0.41 x %GC
∆H =∆Hinit +∑∆Hpair +∆Hcorr ∆S =∆Sinit +∑∆Spair +∆Scorr +∆Sself +0.368 x (Chain length-1)x In [Salt conc.] ∆G =∆H -(T +273.15)x ∆ S Tm =(∆H /(∆S +1.987 x In([Nucleic acid conc.] /α)))-273.15
Tm Prediction

6
AccessoriesMicro cell for nucleic acid quantitation (5µL,10µL),Black micro cell (70µL)
The optimal micro cell for quantitation of nucleic acids. Micro cell for nucleic acid quantitation (5µL, optical path 5mm) (Cat.No.046-25302-12) Micro cell for nucleic acid quantitation (10µL, optical path 10mm) (Cat.No.046-25302-02) Micro cell for protein quantitation. Black micro cell (70µL, optical path 10mm) (Cat. No.046-25302-11)
*Use with the standard cell holder provided. It cannot be used together with the multicell holder, the
sample compartment unit, the thermoelectrically temperature-controlled cell holder TCC-240A, or
the 6-cell type thermoelectrically temperature-controlled cell positioner CPS-240A.
*We recommend that these micro cells be used within the absorbance range of 0.2 to 1.0.
*As the quantity of light passing will be reduced when using the micro cell, the optical
specifications of the system may not be met.
*Insert a cell containing the buffer before measuring samples, and carry out baseline correction.
*Output will be in monochrome even when a color printer is used.
Kinetics Program Pack (Cat. No.206-89756-92)
Calculation and recalculation of the activity value is possible through linear regression using the least-squares method. The coefficients used in the activity value calculation can be set to a maximum of four types. The setting range for measuring is from 1 to 6550 seconds (minutes). Measuring of two wavelengths is possible. Absorbance time change can be recorded while absorbance at the background wavelength is being extracted from absorbance at the measured wavelength. Data processing function for reaction curves: Expansion and compression (Note that compression is possible only in the vertical axis.) Data readout with the cursor key Reaction curve storing and recall Measurement results (chart data) can be stored and recalled.
This software is used for measuring change depending on the time absorbance at a constant wavelenth and calculatin enzyme activity values.
Data Pack (Cat. No. 206-80700)
The maximum number of measurement condition files that can be stored in one data pack is 46. The maximum number of data files that can be stored in one data pack is 21.
Dimensions:W160 x D170 x H66.5mmTharmal paper (10 rolls) : (Cat.No.088-58907-04)The printer cable is included with DPU-414.
Measurement conditions and data can be stored in the data pack.
DPU-414 Screen Copy Printer (Cat. No.206-55215-**)Prints hard copies screens, including numeric data. A printout is made after each measurement. spectra, kinetics reaction data, and quantitation calibration curves displayed on the screen are output in the screen print. A hard copy can be printed at any time, making it simple to record measurement parameters.
Centronics interface Cable (Cat. No.088-50904-20)
RS-232C Cable(for DOS/V compatibles) (Cat. No.200-86408)
This is a cable used to print out on commercially available printers (limited to ESC/P specification only). Color printers: EPSON MJ-800C, MJ-810C, MJ-930C, EM-900C Monochrome printers: EPSON LP-1600, LP-1700, LP-1800, LP-1900 compatible can be used.
5µL cell 10µL cell 70µL cell

7
Software Specifictionsµ µ µ DNA/RNA analysis mode
Protein analysis mode
Spectrum mode
Cell count mode
Tm prediction mode
Quantitation function Quantitation wavelengths Single-wavelength quantitation Simple quantitation mode
Oligo quantitation mode
Dual-wavelength quantitation Warburg-Christian quantitation mode Background correction Optical path length correction Dilution factor correction Absorption ratio calculation Calculated concentration display Simple quantitation, Warburg-Christian quantitation mode Oligo quantitation mode One-touch quantitation Molecular weight, molar absorption coefficient (ε) calculation Long OligoDNA, Long OligoRNA quantitation mode
Short OligoDNA, Short OligoRNA quantitation mode Molecular weight calculation Counter ion calibration End phosphate group number correction Spectrum measurement Spectrum data processing function
3(preset wavelengths are 260.0nm, 280.0nm, 230.0nm) λ1 absorbance (A1) used for quantitation calculation dsDNA (50.0), ssDNA (37.0), RNA (40.0), OligoDNA (33.0); coefficients changeable (preset coefficients in parentheses) Long OligoDNA, Short OligoDNA, Long OligoRNA, Short OligoRNA Concentration calculated using A1, molecular weight and molar absorption coefficient (ε) λ1. λ2(λ3) absorbance used for quantitation calculation, coefficients changeable Protein 1(λ1 /λ2), protein 2(λ1 /λ3), nucleic acid 1 (λ1/λ2), nucleic acid 2 (λ1/ λ3) ON/OFF selectable, preset wavelength 320.0nm (changeable) Possible, input range: (0.01 to 20.00mm) Possible, input range: (1.00 to 9999.9) Automatic calculation of A1/A2, A1/A3
Automatic switching of units (µg/mL, ng/mL , mg/mL) Automatic switching of units (µg/mL, ng/mL, mg/mL) and units(pmol/µL, nmol/µL,fmol/µL) Execute quantitation calqulatjon from spectrum screen
Input base composition (number of A, T(U), C, G, X base pairs) to calculate molecular weight and ε. ε of A, T(U), C, G and X changeable Input base sequence to calculate molecular weight and ε by nearest neighbor base pair model. Molecular weight input possible for A, T(U), C, G and X Select Na+ or H+ Select 0.1 or 2 ON/OFF selectable, execution possible prior to quantitation, 190.0nm to 330.0nm (fixed) Conforms to spectrum mode(note that data recall is not possible)
Quantitation Functions related to calibration curve Calculation method Number of standard samples Calibration curve Repeated measurement of standard Measurement Repeated measurement Saving and recalling tabular data Automatic printout of data, automatic output to RS-232C port Multi cell measurement support
method Lowry, BCA, CBB (Bradford), Biuret, UV absorption Creates calibration curves except for UV absorption method Automatic calculation by K factor, single-point calibration curve and multiple-point calibration curve methods 2 to 10 linear, quadratic and cubic regression calibration curves, choice of zero or non-zero intercept sample 1 to 10
1 to 10 Possible Possible measurement of up to 6 cells possible (when optional CPS-240 is used)
Spectrum measurement Wavelength range Measuring mode Scan speed Number of repeat scan Spectrum display Spectrum data processing function Peak/valley detection Zoom in & out Readout of data using cursor keys Data saving and recalling Spectrum data transfer
190.0nm to 1100.0nm ABS, T%, E Ultra fast, fast, medium, Iow, or ultra low 1 to 99 Overlay or sequential selectable
Up to 20 for each Possible Zoom out in vertical axis only Possible Main unit: 6, Data pack: 21 Via RS232C
Bacteria number calculated from preset wavelength 600.0nm (changeable), coefficient and dilution ratio
Simple Tm prediction Calculation by nearest neighbor base pair model (DNA and RNA duplex)
Input chain length, salt level and %GC to predict Tm of dsDNA Tm, ∆G, ∆H and ∆S for formation of DNA/DNA (RNA/RNA) double strand excluding mismatches calculated by nearest neighbor base pair model. Input base sequence, nucleic acid concentration, concentration calibration, salt concentration and ∆G calculated temperature.
1
1
2
2
3
3
1
1
2
2
3
5
6
7
4

Printed in Japan 3295-08604-30A-NS
The contents of this brochure are subject to change without notice.
JQA-0376
SHIMADZU CORPORATION. International Marketing Division3. Kanda-Nishikicho 1-chome, Chiyoda-ku, Tokyo 101-8448, Japan Phone: 81(3)3219-5641 Fax. 81(3)3219-5710Cable Add.:SHIMADZU TOKYO
SHIMADZU SCIENTIFIC INSTRUMENTS, INC.7102 Riverwood Drive, Columbia, Maryland 21046, U.S.A.Phone: 1(410)381-1227 Fax. 1(410)381-1222 Toll Free: 1(800)477-1227
SHIMADZU EUROPA GmbHAlbert-Hahn-Strasse 6-10, 47269 Duisburg, F.R. Germany Phone: 49(203)7687-0 Fax. 49(203)766625
SHIMADZU (ASIA PACIFIC) PTE LTD.16 Science Park Drive #01-01 Singapore Science Park, Singapore 118227, Republic of SingaporePhone: 65-6778-6280 Fax. 65-6779-2935
SHIMADZU SCIENTIFIC INSTRUMENTS (OCEANIA) PTY. LTD.Units F, 10-16 South Street Rydalmere N.S.W. 2116, AustraliaPhone: 61(2)9684-4200 Fax. 61(2)9684-4055
SHIMADZU DO BRASIL COMÉRCIO LTDA.Avenida Marquês de São Vicente, 1771. Barra Funda CEP : 01139-003-São Paulo-SP, BrasilPhone: (55)11-3611-1688 Fax. (55)11-3611-2209
SHIMADZU (HONG KONG) LIMITEDSuite 1028 Ocean Center, Harbour City, Tsim Sha Tsui, Kowloon HONG KONGPhone: (852)2375-4979 Fax. (852)2199-7438
SHIMADZU INTERNATIONAL TRADING (SHANGHAI) Co., LTD. SHANGHAI OFFICE24th Floor, Shanghai Xin Hualian Building, No.755 Huaihai Zhong Lu, Shanghai, ChinaPhone: 86-21-6472-8442 Fax. 86-21-6472-8648
Overseas OfficesIstanbul, Moscow
URL http://www.shimadzu.com
Hardware Specif ications
Item
Spectral Bandwidth
Wavelength Range
Wavelength Settings
Wavelength Accuracy
Scan Speed
Stray Light
Photometric System
Recording Range
Photometric Accuracy
Noise Level
Light Source
Monochromator
Detector Device
Display
Power Supply
Size
Weight
Ambient Temperature,Humidity Requirments
BioSpec-mini Specifications
5nm
190.0 to 1100.0nm
0.1nm increments (1nm increments when setting the wavelength scanning range)
±1.0nm
Change: Approx. 3800nm/min
Wavelength Scan: Approx.24 to 1400nm/min
Less than 0.05% (220.0nm NaI, 340.0nm NaNO2 and UV-39)
Single beam optics
Absorbance: -3.99 to 3.99Abs
Transmittance: -399 to 399%
±0.005Abs (at 1.0Abs), using the NIST 930D filter
±0.003Abs (at 0.5Abs), using the NIST 930D filter
Less than 0.002Abs, Peak to Peak
Less than 0.0005Abs, RMS, Air Blank
20W Halogen lamp (2000H long life model)
Deuterium lamp (socket type), with built-in automatic adjustment of maximum sensitivity.
Aberration-correcting concave holographic grating is used.
Silicon photodiode
6 inch LCD (320 x 240 dots), with backlight and contrast adjustment.
100 to 120V, 50/60Hz, 160VA (Cat.No.241-06250-92)
220 to 240V, 50/60Hz, 160A (Cat.No.241-06250-38)
W416xD379xH274mm
11kg
Room temperature 15°C to 35°C, Humidity 45% to 80%.
The humidity should be less than 70% if it is over 30 °C.
Checking the Concentrationof PCR Products
PrimerConcentrationMeasurement
For CheckingConcentration Before
Electrophoresis
Counting of Cloned E.coil Bacteria
Checking the Purity ofNucleic Acid
Protein Quantitation
Use only dedicated Shimadzu repair parts and consumables for this inst rument.* Specifications are subject to change for reasons of improvement without notice.
*Make sure to always use a 3 wire plug (with an earth wire).