Biosorptive Removal of Cu(II) from Aqueous Solutions by Using Carissa carandas … · ·...
14
http://www.e-journals.in Chemical Science Transactions DOI:10.7598/cst2014.884 2014, 3(4), 1228-1241 Biosorptive Removal of Cu(II) from Aqueous Solutions by Using Carissa carandas and Syzygium aromaticum SURESH MAHIYA, GIUSY LOFRANO and S K SHARMA 1 Green Chemistry & Sustainability Research Group, Department of Chemistry, JECRC University, Jaipur-303905, India 2 Department of Chemistry and Biology, University of Salerno, Via Giovanni Paolo II, 13284084 Fisciano (Salerno), Italy [email protected] Received 8 July 2014 / Accepted 26 July 2014 Abstract: Biosorption of copper from aqueous solutions by Carissa carandas and Syzygium aromaticum was investigated in batch mode. Biosorptivity of both of these biosorbents has been correlated with the pH change, agitation time and dose of adsorbent and concentration of metal ions in the solution. Biosorbent Carissa carandas leaf powder showed higher sorption efficiency than that of biosorbent Syzygium arometicum powder under identical experimental conditions. Also, the adsorption of Cu(II) onto Syzygium arometicum was best described by the Langmuir isotherm model. The maximum adsorption capacities estimated from Langmuir isotherm model for Cu(II) were 54.2 mg/g and 76.61 mg/g for Carissa carandas and Syzygium arometicum respectively. Keywords: Green Chemistry, Heavy metals, Adsorption, Biosorption, Carissa carandas, Syzygium aromaticum, Langmuir isotherm, Frenduilich isotherm Introduction Heavy metals 1 are prior toxic pollutants existent in industrial wastewater, while they also constitute common groundwater contaminants. Many different definitions have been proposed for defining the heavy metals, some based on density, some on atomic weight or atomic number and some on chemical properties or toxicity. Ming-Ho 1 defined that heavy metal is the generic term for metallic elements having an atomic weight higher than 40.04u and heavy metals are chemical elements with a specific gravity that is at least 5 times the specific gravity of water, such as cadmium (8.65), iron (7.9), lead (11.34), mercury (13.5). There are 92 elements which are occurring naturally, approximately 30 out of these metals and metalloids are potentially toxic to humans such as Be, B, Li, Ti, Al, V, Mn, Cr, Co, Ni, Cu, As, Se, Sr, Mo, Pd, Ag, Cd, Sn, Sb, Te, Cs, Ba, Pt, W, Au, Hg, Pb and Bi. Living organisms also require some varying amounts of heavy metals like cobalt, copper, zinc, Iron, molybdenum and manganese but excessive levels of these metals can be damaging to the RESEARCH ARTICLE
Transcript of Biosorptive Removal of Cu(II) from Aqueous Solutions by Using Carissa carandas … · ·...

http://www.e-journals.in Chemical Science Transactions DOI:10.7598/cst2014.884 2014, 3(4), 1228-1241
Biosorptive Removal of Cu(II) from Aqueous Solutions by Using Carissa carandas and Syzygium aromaticum
SURESH MAHIYA, GIUSY LOFRANO and S K SHARMA
1Green Chemistry & Sustainability Research Group, Department of Chemistry, JECRC University, Jaipur-303905, India 2Department of Chemistry and Biology, University of Salerno, Via Giovanni Paolo II, 13284084 Fisciano (Salerno), Italy [email protected]
Received 8 July 2014 / Accepted 26 July 2014
Abstract: Biosorption of copper from aqueous solutions by Carissa carandas and Syzygium aromaticum was investigated in batch mode. Biosorptivity of both of these biosorbents has been correlated with the pH change, agitation time and dose of adsorbent and concentration of metal ions in the solution. Biosorbent Carissa carandas leaf powder showed higher sorption efficiency than that of biosorbent Syzygium arometicum powder under identical experimental conditions. Also, the adsorption of Cu(II) onto Syzygium arometicum was best described by the Langmuir isotherm model. The maximum adsorption capacities estimated from Langmuir isotherm model for Cu(II) were 54.2 mg/g and 76.61 mg/g for Carissa carandas and Syzygium arometicum respectively.
Keywords: Green Chemistry, Heavy metals, Adsorption, Biosorption, Carissa carandas, Syzygium aromaticum, Langmuir isotherm, Frenduilich isotherm
Introduction
Heavy metals1 are prior toxic pollutants existent in industrial wastewater, while they also constitute common groundwater contaminants. Many different definitions have been proposed for defining the heavy metals, some based on density, some on atomic weight or atomic number and some on chemical properties or toxicity. Ming-Ho1 defined that heavy metal is the generic term for metallic elements having an atomic weight higher than 40.04u and heavy metals are chemical elements with a specific gravity that is at least 5 times the specific gravity of water, such as cadmium (8.65), iron (7.9), lead (11.34), mercury (13.5). There are 92 elements which are occurring naturally, approximately 30 out of these metals and metalloids are potentially toxic to humans such as Be, B, Li, Ti, Al, V, Mn, Cr, Co, Ni, Cu, As, Se, Sr, Mo, Pd, Ag, Cd, Sn, Sb, Te, Cs, Ba, Pt, W, Au, Hg, Pb and Bi. Living organisms also require some varying amounts of heavy metals like cobalt, copper, zinc, Iron, molybdenum and manganese but excessive levels of these metals can be damaging to the
RESEARCH ARTICLE
1229 Chem Sci Trans., 2014, 3(4), 1228-1241
organism2. As they pose serious environmental problems and are dangerous to human health, considerable attention has been given to the methods for their removal from industrial wastewaters1.
Researchers all over the world are doing tireless efforts to address this big ‘issue’ with best of their abilities and capabilities. We also contributed a large volume of work in last one and half decade in the field of water pollution, its prevention and remediation by adopting Green Chemistry principles3,4.
Green Chemistry plays a very important role and many green techniques including bioremediation, phytoremediation, photocatalytic processes, use of functionalized magnetic nanoparticles and use of alternative adsorbents produced by industrial and agricultural waste have been developed. Adsorption, a physicochemical process where the substance called adsorbate accumulates at the interface of solid called adsorbent, has become a useful green technique and attracts eyes of researchers worldwide and biosorption has certain advantages in this regard including low cost and high efficiency. However the major advantages of biosorption over conventional treatment methods include minimization of chemical and biological sludge, regeneration of biosorbent and possibility of metal recovery5.
Biosorption of metal ions is strongly affected by the properties of the water to be treated, such as pH, ionic strength, coexisting ions and suspended solids. Optimal pH for biosorption of metal cations is generally around neutral and their adsorbed amounts would decrease as solution pH is lowered because of diminishing of negatively charged sites on the biosorbents due to protonation. On the other hand, acidic pH favours biosorption of metal anions. Mine drainage and industrial wastewater usually contain more than one heavy metal species and these metal ions would compete with each other for the binding sites on biosorbents5.
In this era of rapid industrialization copper is one of the most common pollutants found in industrial effluents. Copper is commonly considered as micronutrient but at higher concentrations it is extremely toxic to living organisms and plants. It has many commercial uses because of its versatility. Copper is mainly used in making electrical wire, pipes, coins, valves, fittings, cooking utensils and building materials2. The main sources of copper pollution are fertilizer industry, metal cleaning and plating baths, paints and pigments, wood pulp production and the paper board mills6.
The World Health Organization (WHO) recommends a maximum acceptable concentration of Cu(II) as 1.5 mg.L−1 in drinking water7. The extreme consumption of copper leads to gastrointestinal problems, kidney damage, anaemia and lung cancer8.Copper is lethal for human in the range from 4 to 400 mg/kg of body weight9. Lower doses of copper ions can cause symptoms typical of food poisoning (headache, nausea, vomiting, and diarrhoea)10,11. In humans, the liver is the primary organ of copper-induced toxicity. Researchers reported copper toxicity causes Wilson’s disease in humans12.
A number of methods for the removal of copper(II) from aqueous solutions are available, including chemical precipitation13, ion exchange14, adsorption, coagulation, oxidation or reduction, membrane filtration technology, reverse osmosis15, solvent extraction and evaporation2. However, these conventional methods have many disadvantages including incomplete metal removal, requirement of expensive equipment and monitoring systems1,3,16. As a result of the expensive nature of the use of the conventional methods, in recent years, attention has been focused on the potential of Green Chemistry for removal of copper from aqueous solution using adsorbents derived from low-cost materials. Many researchers have used

Chem Sci Trans., 2014, 3(4), 1228-1241 1230
low-cost materials17 as a viable biosorbent for copper(II) removal, namely, rice husk18-20,
sugarcane, banana peel21-22, peanut shells23, activated sludge24, brewery biomass25, ipomoea carnea26, cassava27, tea waste28 fly ash29, tree fern30, cashew nut shell31, mansonia wood sawdust32 , mushroom biomass33
, activated carbon34-35, pomegranate pulp36, leaves of neem37, wheat straw38-39, sawdust (Dalbargiasissoo)40, pine fruit41 , orange peel21, 42 and pine cone shell43.
In the present study Carissa carandas and Syzygium arometicum leaves were used for biosorption of copper(II) from aqueous solutions. Batch adsorption experiments were carried out at ambient temperature (300 K) as a function of solution pH (2-12), biosorbent dosage (20-100 g/L), contact time (60 min interval and up to 360 min), initial metal ion concentration and stirring speed (100-1000 rpm). Then, equilibrium isotherms and kinetic data parameters were evaluated.
Experimental Carissa carandas (better known as Karunda) belongs to Apocynaceae and is a rank-growing, straggly, wood, climbing shrub usually growing to 3-5 m high. Its leaves are evergreen, opposite, oval or elliptic, 2.5-7.5 cm long, dark green, leathery, glossy on the upper surface, lighter green and dull on the underside. It has fragrant flowers and green to puplish-red bitter juicy small fruits exuding flecks of latex44.
Syzygium arometicum (Cloves) are the aromatic dried flower buds of a tree in the family Myrtaceae, harvested primarily in Indonesia and Madagacar; it is also grown in Zanzibar, India and SriLanka. It is used as spice throughout Europe and Asia. The clove tree is an evergreen which grows to a height ranging from 10-20 m, having large oval leaves and crimson flowers in numerous groups of terminal clusters. Cloves are harvested when 1.5-2 cm long and consist of a long calyx, terminating in four spreading sepals, and four unopened petals which form a small ball in the center45,46.
The leaves of Carissa carandas and buds of Syzygium arometicum were collected from local field of Pushkar (India) and from local market of Jaipur (India), respectively. These were washed with distilled water, dried in sunlight, then 60 0C for 24 h in hot air oven. Finally, the dried leaves of Carissa carandas and Syzygium arometicum were grinded in clean electric mixer and stored in a dry and clean plastic bag.
Instrumentation The concentration of Cu(II) was determined by measuring the adsorption on the Atomic Absorption Spectrometer (Thermo Scientific SOLAAR S-series AA Spectrometer) at range 185-760 nm. The pH of the solution was measured with Toshniwal, CL54+ (range 0-14) pH meter. Analytical Scanning Electron Microscope, JEOL, JSM 6360A was used for scanning Electron Microscopy (SEM). Frontier Transform Infrared (FTIR) Spectrometer technique was used mainly to identify functional groups, that are capable of adsorbing metal ions. The spectra were collected by Shimadzu FTIR-8400 Spectrophotometer model with in the range 400-4000 cm-1 using KBr window.
Adsorption experiments and measurements The stock solution of Cu(II) ion was prepared by dissolving 3.924 g of CuSO4.5H2O in 1000 mL volumetric flask and make up to the mark with double distilled water. All the required working solutions were prepared by diluting the stock solution with double distilled water. Batch adsorption studies were performed at room temperature. The adsorption equilibrium experiments for Cu(II) solution were carried out by taking 100 mL of copper solution in 250 mL
1231 Chem Sci Trans., 2014, 3(4), 1228-1241
conical flask. After a defined time interval of 60 min., samples were withdrawn from the shaker, filtered by Whatman filter paper No. 1 and the supernatant solutions were analysed for Cu(II) ion concentration using an Atomic Absorption Spectrometer (Thermo scientific Solar S-series AA Spectrometer).
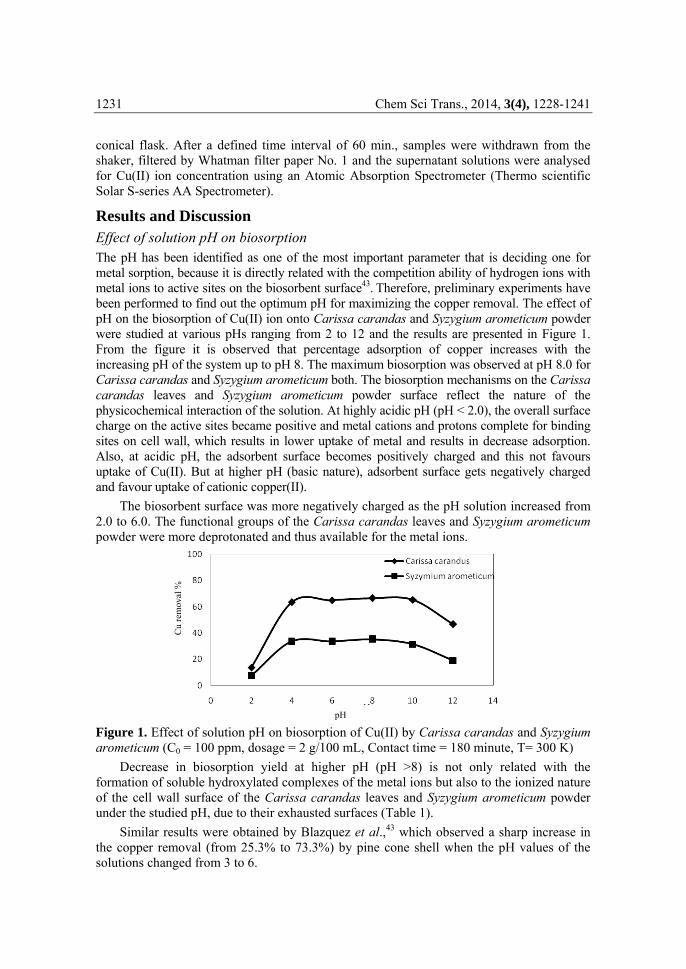
Results and Discussion Effect of solution pH on biosorption The pH has been identified as one of the most important parameter that is deciding one for metal sorption, because it is directly related with the competition ability of hydrogen ions with metal ions to active sites on the biosorbent surface43. Therefore, preliminary experiments have been performed to find out the optimum pH for maximizing the copper removal. The effect of pH on the biosorption of Cu(II) ion onto Carissa carandas and Syzygium arometicum powder were studied at various pHs ranging from 2 to 12 and the results are presented in Figure 1. From the figure it is observed that percentage adsorption of copper increases with the increasing pH of the system up to pH 8. The maximum biosorption was observed at pH 8.0 for Carissa carandas and Syzygium arometicum both. The biosorption mechanisms on the Carissa carandas leaves and Syzygium arometicum powder surface reflect the nature of the physicochemical interaction of the solution. At highly acidic pH (pH < 2.0), the overall surface charge on the active sites became positive and metal cations and protons complete for binding sites on cell wall, which results in lower uptake of metal and results in decrease adsorption. Also, at acidic pH, the adsorbent surface becomes positively charged and this not favours uptake of Cu(II). But at higher pH (basic nature), adsorbent surface gets negatively charged and favour uptake of cationic copper(II).
The biosorbent surface was more negatively charged as the pH solution increased from 2.0 to 6.0. The functional groups of the Carissa carandas leaves and Syzygium arometicum powder were more deprotonated and thus available for the metal ions.
Figure 1. Effect of solution pH on biosorption of Cu(II) by Carissa carandas and Syzygium arometicum (C0 = 100 ppm, dosage = 2 g/100 mL, Contact time = 180 minute, T= 300 K)
Decrease in biosorption yield at higher pH (pH >8) is not only related with the formation of soluble hydroxylated complexes of the metal ions but also to the ionized nature of the cell wall surface of the Carissa carandas leaves and Syzygium arometicum powder under the studied pH, due to their exhausted surfaces (Table 1).
Similar results were obtained by Blazquez et al.,43 which observed a sharp increase in the copper removal (from 25.3% to 73.3%) by pine cone shell when the pH values of the solutions changed from 3 to 6.
pH
Cu
rem
oval
%

Chem Sci Trans., 2014, 3(4), 1228-1241 1232
Table 1. Effect of solution pH on biosorption of Cu(II) by Carissa carandas and Syzygium arometicum (C0= 100 ppm, dosage = 2 g/100 mL, contact time = 180 min, T= 300 K)
S. No. pH Removal of Cu(II), %
Carissa carandas Syzygium arometicum 1 2 13.77 7.37 2 4 63.36 33.50 3 6 64.95 33.50 4 8 66.51 35.22 5 10 65.3 31.5 6 12 46.62 19.0
Effect of contact time on biosorption The rate of biosorption is important for designing batch biosorption experiments. As shown in Figure 2, the biosorption efficiency of Cu(II) increased considerably until the contact time reached 180 min. Further increase in contact time did not enhance the biosorption, so, the optimum contact time was selected as 180 minutes for further experiments.
Figure 2. Effect of contact time on biosorption for Cu(II) by Carissa carandas and Syzygium arometicum (C0 = 100 ppm, dosage = 2 g/100 mL, pH = 4, T= 300 K)
The copper(II) adsorption rate at the initial stage (first 200 mins) may be explained by an increased availability in the number of active binding sites on the adsorbent surface. The sorption rapidly occurs and normally controlled by the diffusion process from the bulk to the surface. In this later stage, no sorption takes place due to non-availability of sorption sites. The equilibrium time was independent of adsorbent type. Therefore, further experiments were carried out at 60 min as a significant contact time for Cu(II) adsorption (Table 2).
Table 2. Effect of contact time on biosorption for Cu(II) by Carissa carandas and Syzygium arometicum (C0 = 100 ppm, dosage = 2 g/100 mL, pH = 4, temp = 300 K)
S. No.
Contact time, min
Removal of Cu(II), % Carissa carandas Syzygium arometicum
1 60 44.27 40.73 2 120 50.64 44.84 3 180 62.89 59.94 4 240 62.89 59.94 5 300 62.89 59.94 6 360 62.89 59.94
Time, min
Cu
rem
oval
, %
1233 Chem Sci Trans., 2014, 3(4), 1228-1241
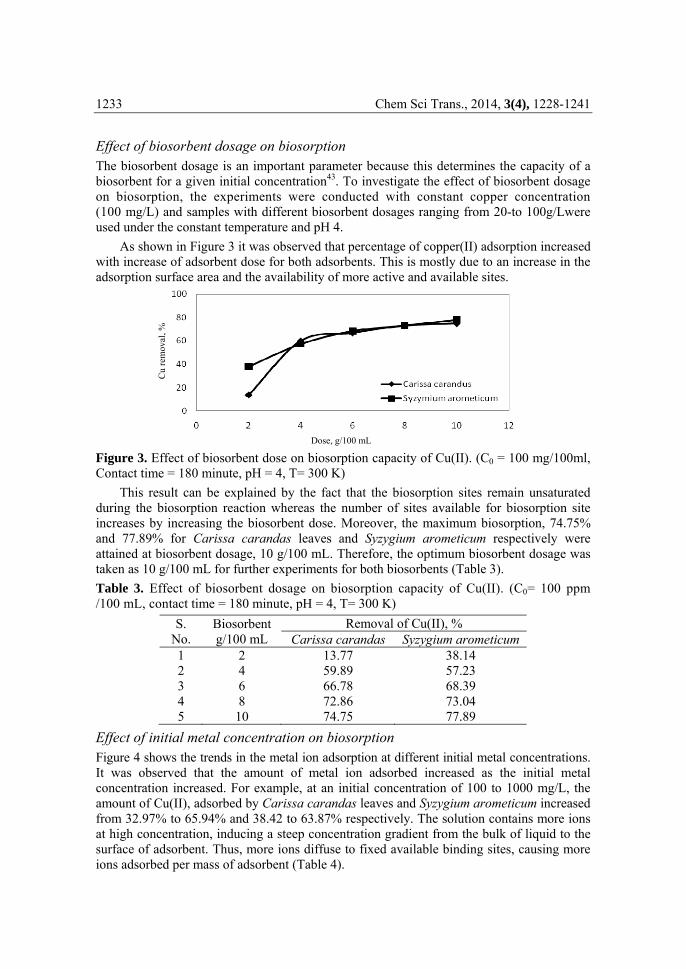
Effect of biosorbent dosage on biosorption The biosorbent dosage is an important parameter because this determines the capacity of a biosorbent for a given initial concentration43. To investigate the effect of biosorbent dosage on biosorption, the experiments were conducted with constant copper concentration (100 mg/L) and samples with different biosorbent dosages ranging from 20-to 100g/Lwere used under the constant temperature and pH 4.
As shown in Figure 3 it was observed that percentage of copper(II) adsorption increased with increase of adsorbent dose for both adsorbents. This is mostly due to an increase in the adsorption surface area and the availability of more active and available sites.
Figure 3. Effect of biosorbent dose on biosorption capacity of Cu(II). (C0 = 100 mg/100ml, Contact time = 180 minute, pH = 4, T= 300 K)
This result can be explained by the fact that the biosorption sites remain unsaturated during the biosorption reaction whereas the number of sites available for biosorption site increases by increasing the biosorbent dose. Moreover, the maximum biosorption, 74.75% and 77.89% for Carissa carandas leaves and Syzygium arometicum respectively were attained at biosorbent dosage, 10 g/100 mL. Therefore, the optimum biosorbent dosage was taken as 10 g/100 mL for further experiments for both biosorbents (Table 3).
Table 3. Effect of biosorbent dosage on biosorption capacity of Cu(II). (C0= 100 ppm /100 mL, contact time = 180 minute, pH = 4, T= 300 K)
S. No.
Biosorbent g/100 mL
Removal of Cu(II), % Carissa carandas Syzygium arometicum
1 2 13.77 38.14 2 4 59.89 57.23 3 6 66.78 68.39 4 8 72.86 73.04 5 10 74.75 77.89
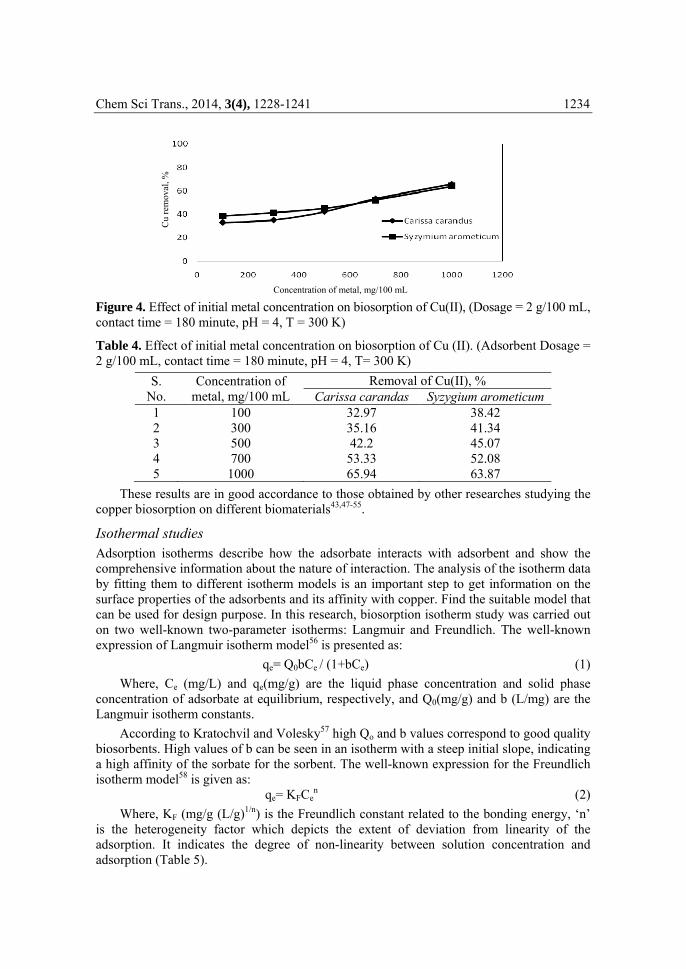
Effect of initial metal concentration on biosorption Figure 4 shows the trends in the metal ion adsorption at different initial metal concentrations. It was observed that the amount of metal ion adsorbed increased as the initial metal concentration increased. For example, at an initial concentration of 100 to 1000 mg/L, the amount of Cu(II), adsorbed by Carissa carandas leaves and Syzygium arometicum increased from 32.97% to 65.94% and 38.42 to 63.87% respectively. The solution contains more ions at high concentration, inducing a steep concentration gradient from the bulk of liquid to the surface of adsorbent. Thus, more ions diffuse to fixed available binding sites, causing more ions adsorbed per mass of adsorbent (Table 4).
Dose, g/100 mL
Cu
rem
oval
, %
Chem Sci Trans., 2014, 3(4), 1228-1241 1234
Figure 4. Effect of initial metal concentration on biosorption of Cu(II), (Dosage = 2 g/100 mL, contact time = 180 minute, pH = 4, T = 300 K)
Table 4. Effect of initial metal concentration on biosorption of Cu (II). (Adsorbent Dosage = 2 g/100 mL, contact time = 180 minute, pH = 4, T= 300 K)
S. No.
Concentration of metal, mg/100 mL
Removal of Cu(II), % Carissa carandas Syzygium arometicum
1 100 32.97 38.42 2 300 35.16 41.34 3 500 42.2 45.07 4 700 53.33 52.08 5 1000 65.94 63.87
These results are in good accordance to those obtained by other researches studying the copper biosorption on different biomaterials43,47-55.
Isothermal studies Adsorption isotherms describe how the adsorbate interacts with adsorbent and show the comprehensive information about the nature of interaction. The analysis of the isotherm data by fitting them to different isotherm models is an important step to get information on the surface properties of the adsorbents and its affinity with copper. Find the suitable model that can be used for design purpose. In this research, biosorption isotherm study was carried out on two well-known two-parameter isotherms: Langmuir and Freundlich. The well-known expression of Langmuir isotherm model56 is presented as:
qe= Q0bCe / (1+bCe) (1)
Where, Ce (mg/L) and qe(mg/g) are the liquid phase concentration and solid phase concentration of adsorbate at equilibrium, respectively, and Q0(mg/g) and b (L/mg) are the Langmuir isotherm constants.
According to Kratochvil and Volesky57 high Qo and b values correspond to good quality biosorbents. High values of b can be seen in an isotherm with a steep initial slope, indicating a high affinity of the sorbate for the sorbent. The well-known expression for the Freundlich isotherm model58 is given as:
qe= KFCen (2)
Where, KF (mg/g (L/g)1/n) is the Freundlich constant related to the bonding energy, ‘n’ is the heterogeneity factor which depicts the extent of deviation from linearity of the adsorption. It indicates the degree of non-linearity between solution concentration and adsorption (Table 5).
Cu
rem
oval
, %
Concentration of metal, mg/100 mL
1235 Chem Sci Trans., 2014, 3(4), 1228-1241
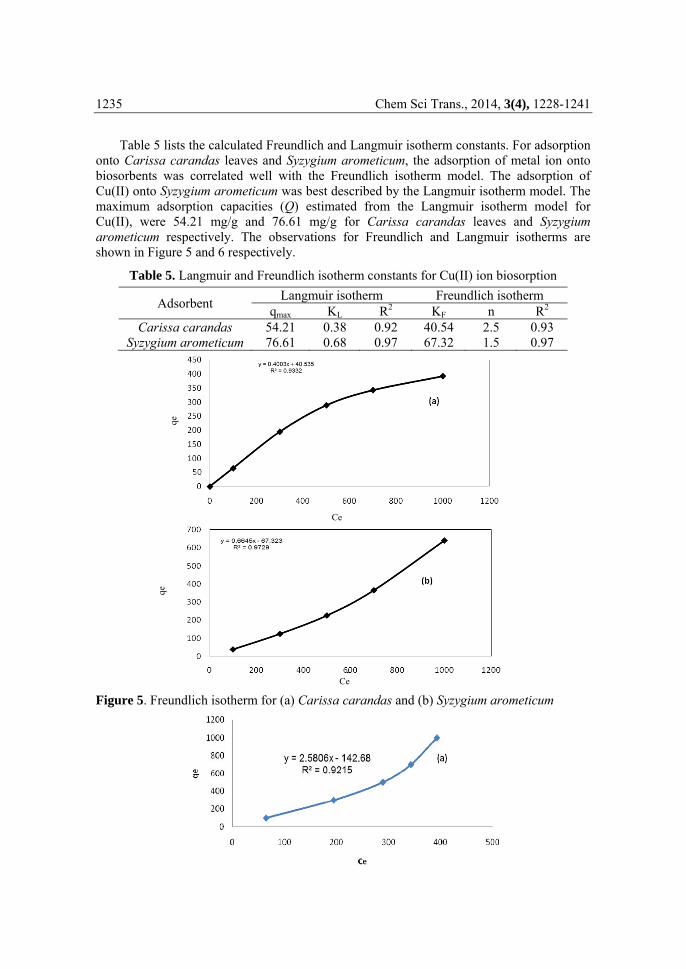
Table 5 lists the calculated Freundlich and Langmuir isotherm constants. For adsorption onto Carissa carandas leaves and Syzygium arometicum, the adsorption of metal ion onto biosorbents was correlated well with the Freundlich isotherm model. The adsorption of Cu(II) onto Syzygium arometicum was best described by the Langmuir isotherm model. The maximum adsorption capacities (Q) estimated from the Langmuir isotherm model for Cu(II), were 54.21 mg/g and 76.61 mg/g for Carissa carandas leaves and Syzygium arometicum respectively. The observations for Freundlich and Langmuir isotherms are shown in Figure 5 and 6 respectively.
Table 5. Langmuir and Freundlich isotherm constants for Cu(II) ion biosorption
Adsorbent Langmuir isotherm Freundlich isotherm
qmax KL R2 KF n R2 Carissa carandas 54.21 0.38 0.92 40.54 2.5 0.93
Syzygium arometicum 76.61 0.68 0.97 67.32 1.5 0.97
Figure 5. Freundlich isotherm for (a) Carissa carandas and (b) Syzygium arometicum
qe
Ce
Ce
qe
Chem Sci Trans., 2014, 3(4), 1228-1241 1236
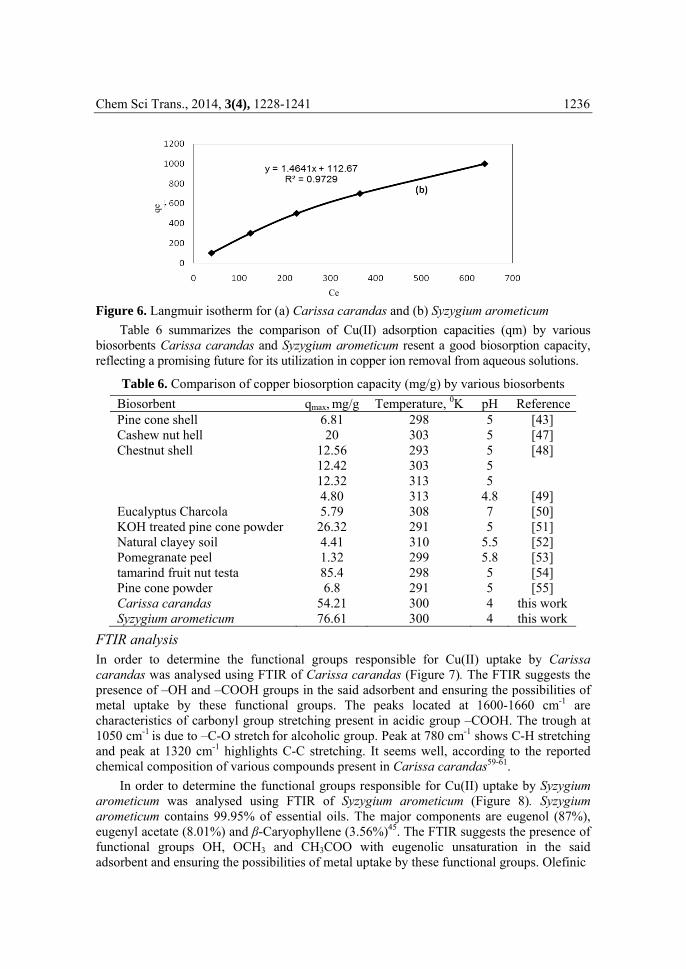
Figure 6. Langmuir isotherm for (a) Carissa carandas and (b) Syzygium arometicum
Table 6 summarizes the comparison of Cu(II) adsorption capacities (qm) by various biosorbents Carissa carandas and Syzygium arometicum resent a good biosorption capacity, reflecting a promising future for its utilization in copper ion removal from aqueous solutions.
Table 6. Comparison of copper biosorption capacity (mg/g) by various biosorbents
Biosorbent qmax, mg/g Temperature, 0K pH Reference Pine cone shell 6.81 298 5 [43] Cashew nut hell 20 303 5 [47] Chestnut shell 12.56 293 5 [48]
12.42 303 5 12.32 313 5 4.80 313 4.8 [49]
Eucalyptus Charcola 5.79 308 7 [50] KOH treated pine cone powder 26.32 291 5 [51] Natural clayey soil 4.41 310 5.5 [52] Pomegranate peel 1.32 299 5.8 [53] tamarind fruit nut testa 85.4 298 5 [54] Pine cone powder 6.8 291 5 [55] Carissa carandas 54.21 300 4 this work Syzygium arometicum 76.61 300 4 this work
FTIR analysis In order to determine the functional groups responsible for Cu(II) uptake by Carissa carandas was analysed using FTIR of Carissa carandas (Figure 7). The FTIR suggests the presence of –OH and –COOH groups in the said adsorbent and ensuring the possibilities of metal uptake by these functional groups. The peaks located at 1600-1660 cm-1 are characteristics of carbonyl group stretching present in acidic group –COOH. The trough at 1050 cm-1 is due to –C-O stretch for alcoholic group. Peak at 780 cm-1 shows C-H stretching and peak at 1320 cm-1 highlights C-C stretching. It seems well, according to the reported chemical composition of various compounds present in Carissa carandas59-61.
In order to determine the functional groups responsible for Cu(II) uptake by Syzygium arometicum was analysed using FTIR of Syzygium arometicum (Figure 8). Syzygium arometicum contains 99.95% of essential oils. The major components are eugenol (87%), eugenyl acetate (8.01%) and β-Caryophyllene (3.56%)45. The FTIR suggests the presence of functional groups OH, OCH3 and CH3COO with eugenolic unsaturation in the said adsorbent and ensuring the possibilities of metal uptake by these functional groups. Olefinic
Ce
qe

1237 Chem Sci Trans., 2014, 3(4), 1228-1241
unsaturation present may be due to C-C bending vibrations occur at very low frequencies (660 cm-1), while C-C stretching vibrations are weak and appear in the broad region of 1010-750 cm-1. The most informative bands in the spectra of aromatic compounds occur in the low frequency range between 1000-800 cm-1, which result from the out of plane bending of the ring C-H bonds. In plane bending bands appear in the 1500-1200 cm-1 region. Skeletal vibrations involving C-C stretching within the ring absorb in 1600-1510 cm-1. The phenolic group shows a broad absorption band in 900-750 cm-1 region because of out of plane bending of the bonded O-H group. An asymmetric C-O-C stretching band at 1260-1200 cm-1 with symmetrical stretching near 1100 cm-1 suggests the presence of OCH3 group.
Figure 7. FTIR of Carissa carandas
Figure 8. FTIR of Syzygium arometicum
The whole FTIR discussion seems well, according to the reported absorption data of various expected groups present in Carissa carandas and Syzygium arometicum62.
However, the exact functional groups, their nature, adsorption mechanism and sites of bonding between various functional groups present and Cu(II) ions are yet to be explored for better understanding of the whole story of this adsorption process, which we’ll surely try to unfold in our future papers.

Chem Sci Trans., 2014, 3(4), 1228-1241 1138
SEM images The SEM images of adsorbents before and after adsorption are given in Figure 9 and 10 respectively for Carissa carandas and Syzygium arometicum. From these images, it is clear that there is significant difference in the appearance of the adsorbent surfaces. Images clearly highlight the action of adsorption on the surfaces of both the adsorbents and strengthen the view point of the researchers.
(a.) (b.)
Figure 9. SEM image of Carissa carandas (a.) before Adsorption; (b.) after Adsorption
(a.) (b.)
Figure 10. SEM image of Syzygium arometicum (a.) before Adsorption; (b.) after Adsorption
Conclusion The present study focused on the use Carissa carandas leaves and Syzygium arometicum powder as biosorbents for the removal of copper(II) from aqueous solutions. Biosorbent preparation, agitation, characterization and their uses for Cu(II) removal at different operating conditions are reported well.
Biosorbent Carissa carandas leaf powder showed higher sorption efficiency than that of biosorbent Syzygium arometicum powder under identical experimental conditions. Also, the adsorption of Cu(II) onto Syzygium arometicum was best described by the Langmuir isotherm model. The maximum adsorption capacities estimated from Langmuir isotherm model for Cu(II) were 54.21 mg/g and 76.61 mg/g for Carissa carandas and Syzygium arometicum respectively.
However, we suggest that it is also necessary to investigate the efficacy of Carissa carandas leaves powder to treat real industrial effluents. There is a ready supply of agricultural wastes worldwide. The use of such materials will not only convert into low-cost effective adsorbents, but also provide a green solution to their disposal.
1239 Chem Sci Trans., 2014, 3(4), 1228-1241
Since, several parameters including migration of metal ions from bulk solution to the surface of the adsorbent through bulk diffusion and the adsorption of metal ions at an active site on the surface of the adsorbent by chemical reactions play very important role in deciding the adsorption kinetics and adsorption mechanism; the actual adsorption mechanism is yet to be discussed and explained.
Acknowledgement Author (SM) thankfully acknowledge the scholarship given by President, JECRC University for his PhD work. He is also grateful to USIC, University of Rajasthan, Jaipur, Amol Pharmaceuticals Pvt. Ltd., Jaipur and The Team Institute of Science and Technology, Jaipur for providing analytical help for the work presented in this paper and to Dr. K.C. Soni for useful discussions.
Reference 1. (a) Xu M, Yin P, Liu X, Tang Q, Qu R. and Xu Q, Bioresource Technology, 2013, 149,
420-424; DOI:10.1016/j.biortech.2013.09.075; (b) Demirbas A, J Hazardous Mater., 2008 157, 220-229; DOI: 10.1016/j.jhazmat.2008.01.024; (c) Vijayaraghavan K, Joseph R J, Kandasamy P and Manickam V, Electronic J Biotechnology, 7, 61-71; DOI: 10.2225/vol7-issue1-fulltext-4; (d) Ming-Ho Y, Environmental Toxicology: Biological and Health Effects of Pollutants, 2nd Edition, CRC Press LLC, Boca Raton, USA.2005, Chap.12.
2. Mahiya S, Lofrano G and Sharma S K, Int J Chem., 2014, 3, 132-149. 3. (a) Chandrawat M P S, Gupta J, Mudhoo A and Sharma S K, Asian J Water, Environ
Pollut., 2009, 6, 101; (b) Mudhoo A, Munbodh V P, Ragen A K, Garg V K and Sharma S K, Int J Proc Waste Treatment, 2009, 1, 83; (c) Chandrawat M P S, Gupta J, Sharma S K and Mudhoo A, Int J Proc Wastes Treatment, 2009, 1, 27; (d) Yadav R, Yadav R N, Chandrawat M P Sand Sharma S K, RASÂYAN J Chem., 2008, 1(4), 929-935; (e) Sharma S K, Choudhary A and Singh R V, RASAYAN J Chem., 2008, 1, 68; (f) Kaushik N, Kaushik C P, Sharma S K and Sharma J K, Curr World Environ., 2007, 2(2), 175-182; (g) Kulshrestha S, Sharma S K and Singh R V, Int J Chem Sci., 2004, 2(1), 27-36; (h) Sharma S K, Nature, Environ Pollu Techniq., 2003, 2(4), 493-496.
4. (a) Sharma S K, Mudhoo A and Zhang W, Green Chemistry and Engineering: A Versatile Research Perspective, In: Green Chemistry for Environmental Sustainability (Eds. Sharma S K and Mudhoo A), Taylor & Francis Group, LLC, Florida, Boca Raton, USA,2010, p1-52; (b) Gautam R K, Chatopadhyay M C and Sharma S K, Biosorption of Heavy Metals: Recent Trends and Challenges; In: Waste Water Reuse and Management (Eds. Sharma S K and Sanghi R), Springer, UK, 2012, p.305-322; (c) Sharma S K, Sanghi R and Mudhoo A, Green Practices to Save our Precious ‘Water Resource’; In: Advances in Water Treatment and Pollution Prevention (Eds. Sharma S K and Sanghi R), Springer, UK,2012,p.1-36; (d) Sanghi R, Singh Vand Sharma S K, Environment and the Role of Green Chemistry; In: Green Chemistry for Environmental Remediation (Eds. Sanghi R and Singh V), Scrivener Publishing LLC, Massachusetts, USA, 2011, p. 3-34; (e) Rani R, Jain S and Sharma S K, Nano- Catalyst: A Second Generation tool for Green Chemistry; In: Green Chemistry for Environmental Remediation (Eds. Sanghi R. and Singh V), Scrivener Publishing LLC, Massachusetts, USA, 2011, p. 357-378; (f) Mudhoo A and Sharma S K, Crit Rev Environm Sci Technol., 2011, 41(11), 999-1066; DOI:10.1080/10643380903392767 (g) Yadav A K, Khan P, Ojha K G and Sharma S K, Water: Res Develop., 2011, 1, 20; (h) Ozha D D and Sharma S K, Water: Res Develop., 2011, 1, 45; (i) Yadav A K, Khan P and Sharma S K, J Chem., 2010, 7(S1), S428-S432.

Chem Sci Trans., 2014, 3(4), 1228-1241 1240
5. (a) Kratochvil D and Volesky B, Trends Biotechnol., 1998, 16(7), 291-300; DOI:10.1016/S0167-7799(98)01218-9 (b) Mondal D K, Nandi B K, Purkait M K, J Environ Chem Eng., 2013, 1(4), 891-898; DOI:10.1016/j.jece.2013.07.034
6. Landner L and Lindestrom L, Copper in society and in the environment. Vasteras, Swedish Environmental Research Group, 1999, SCDA S-721 88.
7. World Health Organization, Guidelines for Drinking-Water Quality. Recommendations, 2nd Ed. Geneva, Switzerland, 1993, Vol. 1.
8. Richard F U and Shuttleworth K L, Curr Opin Biotechnol., 1996, 7(2), 307–310; DOI:10.1016/S0958-1669(96)80035-8
9. Agarwal S K, Tiwari S C and Dash S C, Int J Artificial Organs., 1993, 16(1), 20–22. 10. US EPA, Drinking water criteria document for copper. Cincinnati, OH, US
Environmental Protection Agency, Office of Health and Environmental Assessment, Environmental Criteria and Assessment Office, 1987.
11. Stenhammar L, Eur J Med Res., 1999, 4(6), 217–218. 12. Gitlin J D, Gastroenterology, 2003, 125(6), 1868–1877;
DOI:10.1053/j.gastro.2003.05.010 13. Kaur R, Singh J, Khare R, Cameotra S S and Ali A, Appl Wat Sci., 2013, 3, 207-218;
DOI: 10.1007/s13201-012-0073-y 14. Bhatnagar A and Sillanpaa M, Chem Eng J., 2010, 157(2-3), 277-296;
DOI:10.1016/j.cej.2010.01.007 15. Ning R Y, Desalination, 2002, 143(3), 237-241; DOI:10.1016/S0011-9164(02)00262-X 16. Mulligan C N, Yong R N and Gibbs B F, Eng Geol., 2001, 60(1-4), 193-207;
DOI:10.1016/S0013-7952(00)00101-0 17. Ngah W S W and Hanafiah M A K M, Bioresour Technol., 2008, 99(10), 3935-3948;
DOI:10.1016/j.biortech.2007.06.011 18. Woranan N, Bernard G A and Paitip T, Colloids Surfaces A, Physicochem Eng
Aspects, 2007, 304(1-3), 7-13; DOI:10.1016/j.colsurfa.2007.04.013 19. Naeem S, Zahra N and Zafar U, Bangladesh J Sci Ind Res., 2010, 45(4), 367-370;
DOI:10.3329/bjsir.v45i4.7382 20. Chockalingam E and Subramanian S, Chemosphere, 2006, 62(5), 699-708;
DOI:10.1016/j.chemosphere.2005.05.013 21. Hossain M A, Ngo H H, Guo W S and Nguyen T V, J Water Sustainab., 2012, 2(1), 87-104. 22. Annadurai G, Juang R S and Lee D J, Water Sci Technol., 2002, 47, 185–190. 23. Johnson P D, Watson M A, Brown J and Jefcoat I A, Waste Manag., 2002, 22, 471-
480; DOI: 10.1016/S0956-053X(01)00036-8 24. Monser L and Adhoum N, Sep Purif Technol., 2002, 26, 137-146; DOI:
10.1016/S1383-5866(01)00155-1 25. Kim T Y, Park S K, Cho S Y, Kim H B, Kang Y, Kim S D and Kim S J, Korean J
Chem Eng., 2005, 22, 91-98; DOI: 10.1007/BF02701468 26. Pandian P, Arivoli S, Marimuthu V and Peter Pascal Regis A, Prabaharan T, Int J
Eng Innovat Technol., 2013, 3, 156-162. 27. Horsfall M J, Abia A A, Spiff A I, Bioresour Technol., 2006, 97, 283-291; DOI:
10.1016/j.biortech.2005.02.016. 28. Amara singhe B M W P K and Williams R A, Chem Eng J., 2007, 132, 299-309. 29. Gupta V K, Ali I, Sep Purif Technol., 2000.18, 131-140. 30. Ho Y S, Water Res., 2003, 37, 2323–2330. 31. SenthilKumara P, Ramalingamb S, Sathyaselvabalac V, Dinesh Kiruphac S,
Sivanesanc S, Desalination, 2011, 266, 63-71. 32. Ofomajaa A E, Unuabonahb E I and Oladojac N A, Bioresour Technol., 2010, 101,
3844–3852; DOI: 10.1016/j.biortech.2009.10.064.
1241 Chem Sci Trans., 2014, 3(4), 1228-1241
33. Ertugay N and Bayhan Y K, Desalination, 2010, 255, 137–142. 34. Bouhamed F, Elouear Z and Bouzid J, J Taiwan Instit Chem Eng., 2012, 43, 741-749. 35. Issabayeva G and Aroua M K, World Acad Sci, Eng Technol., 2011, 7, 259-262; 36. Güzel F, Aksoy O and Akkaya G, J Dispers Sci Technol., 2014, 35, 482-493; DOI:
10.1080/01932691.2013.796481 37. Ang X W, Sethu V S, Andresen J M and Sivakumar M, Clean Technol Environ
Policy, 2013, 15, 401-407; DOI: 10.1007/s10098-012-0523-0. 38. Li Y, Zhao B, Zhang L and Han R, Desalination Water Treatment, 2013, 51, 5735-
5745; DOI: 10.1080/19443994.2012.762945. 39. Ahamed A J and Begum A S, Archives of Appl Sci Res., 2012, 4, 1532-1539. 40. Larous S, Meniai A H and Lehocine M B, Desalination, 2005, 185, 483-490; DOI:
10.1016/j.desal.2005.03.090 41. Najim S T, Nazik J E and Alya A D, J Chem., 2009, 6, 161. 42. Marta I, Paula M and Piet N L L, Water Air Soil Pollu., 2013, 224, 1507; DOI:
10.1007/s11270-013-1507-3. 43. Bla´Zquez, Martı´N-Lara M A, Dionisio-Ruiz E, Tenorio G and Calero M, J Ind
Eng Chem., 2012, 18, 1741–1750; DOI: 10.1016/j.jiec.2012.03.018. 44. Devmurari V, Shiva P and Jivani N P, Int J Chem Sci., 2010, 8(1), 81-87. 45. Silverstein R M, Bassler G C and Morrill T C, Spectrometric Identification of
Organic Compounds, 1981, John Wiley & Sons, pp. 95-105. 46. Kim H M, Lee E.H, Hong S H, Song H J, Shin M K, Kim S H and Shin T Y, J
Ethanopharmacology, 1998, 60, 125-131; DOI: 10.1016/S0378-8741(97)00143-8. 47. Senthil Kumar P, Ramalingam S, Sathyaselvabala V, Kirupha S D and Sivanesan S,
Desalination, 2011, 266, 63; DOI:10.1016/j.desal.2010.08.003. 48. Yao Z Y, Qi J H and Wang L H, J Hazard Mater., 2010, 174, 137; DOI:
10.1016/j.jhazmat.2009.09.027. 49. Va´ Zquez G, Calvo M, Freire M S, Gonza´ lez-Alvarez J, Antorrena G, J Hazard
Mater., 2009, 172 ,1402; DOI: 10.1016/j.jhazmat.2009.08.006 50. Mulgund M G, Dabeer S P, Dhar S, Makani V and Jadhav B, Aust J Basic Appl Sci.,
2011, 5(4), 135-142. 51. Ofomaja A E, Naidoo E B and Modise S J, J Environ Manage., 2010, 91, 1674; DOI:
10.1016/j.jenvman.2010.03.005 52. Saha P, Datta S and Sanyai S.K, J Environ Eng ASCE., 2010, 136, 1409;
DOI:10.1061/(ASCE)EE.1943-7870.0000289 53. El-Ashtoukhy E S Z, Amin N K and Abdelwahab O, Desalination, 2008, 223,162;
DOI:10.1016/j.desal.2007.01.206 54. Priya A J, Gajulapalli S R, Abburi K and Boddu V M, Biorem J., 2008, 12, 145-155;
DOI:10.1080/10889860802261935 55. Ofojama A E, Naidoo E B and Modise S J, J Hazard Mater., 2009, 168,909. 56. Langmuir I, J Am Chem Soc., 1918, 40, 1361–1403; DOI: 10.1021/ja02242a004. 57. Kratochvil D and Volesky B, Trends Biotechnol., 1998, 16, 291; DOI:
10.1016/S0167-7799(98)01218-9. 58. Freundlich H, Z. Physik Chem., 1907, 57, 385-470. 59. Inamullah Singh S, Rai J, Choudhary N and Sharma S, Int J Pharm Natural Med.,
2013, 1, 63-70. 60. Sharma A, Tiwari R K, Kaushik A, Tyagi L K And Shankar K, Virmani T, Yadav S,
Parvez N, Continental J Pharmaceutical Sciences, 2007, 1, 9-14. 61. Motwani S M, Pandey E P, Sonchhatra N P, Desai T R, Patel V L, Pandya D J, Int J
Biolog Pharm Res., 2012, 3, 75-81. 62. Alma M H, Ertas M, Nitz S and Kollmannsberger H, BioResour., 2007, 2(2), 265-269.