
Biosensors and Bioelectronics · 2020-01-10 · require time-consuming sample preparation...
9
www.spm.com.cn A simple strategy for the immobilization of catalase on multi-walled carbon nanotube/poly (L-lysine) biocomposite for the detection of H 2 O 2 and iodate A.T. Ezhil Vilian a , Shen-Ming Chen a,n , Bih-Show Lou b,nn a Electroanalysis and Bioelectrochemistry Lab, Department of Chemical Engineering and Biotechnology, National Taipei University of Technology, No.1, Section 3, Chung-Hsiao East Road, Taipei 106, Taiwan, ROC b Chemistry Division, Center for Education, Chang Gung University, 259, Wen-Hwa 1st Road, Kwei-Shan, Tao-Yuan 333, Taiwan, ROC article info Article history: Received 27 February 2014 Received in revised form 8 May 2014 Accepted 10 May 2014 Available online 2 June 2014 Keywords: Multiwall carbon nanotubes Catalase Direct electrochemistry Biosensor abstract Herein, we report a novel third-generation H 2 O 2 and IO 3 biosensor, which was fabricated by loading catalase (CAT) onto L-lysine/multiwalled carbon nanotube (PLL/f-MWCNT) film modified glassy carbon electrode (GCE). The UV–visible (UV–vis) and Fourier-transform infrared (FTIR) spectra show that the catalase encapsulated in the PLL/f-MWCNT film can effectively retain its bioactivity. The immobilized CAT retained its bioactivity with a high protein loading of 4.072 10 10 mol cm 2 , thus exhibiting a surface-controlled reversible redox reaction, with a fast heterogeneous electron transfer rate of 5.48 s 1 . The immobilized CAT shows a couple of reversible and well-defined cyclic voltammetry peaks with a formal potential (E 0 ) of 0.471 V (vs. Ag/AgCl) in a pH 6.5 phosphate buffer solution (PBS). Moreover, the modified film exhibited high electrocatalytic activity for the reduction of hydrogen peroxide (H 2 O 2 ). It exhibited a wide linear response to H 2 O 2 in the concentration range of 1 10 6 –3.6 10 3 , with higher sensitivity (392 mA cm 2 M 1 ) and a lower Michaelis–Menten constant (0.224 mM). It provided high-catalytic activity towards H 2 O 2 in a shorter time (5 s), with a detection limit of 8 nM. These results indicate great improvement in the electrochemical and electrocatalytic properties of the CAT/PLL/ f-MWCNT biosensor, offering a new idea for the design of third-generation electrochemical biosensors. & 2014 Elsevier B.V. All rights reserved. 1. Introduction In recent years, hydrogen peroxide (H 2 O 2 ) has been widely used in various fields, including food production, textile industry, pulp and paper bleaching, manufacturing of antiseptic and disinfecting agents, pharmaceutical research, clinical, biological and environmental ana- lysis (Wagenaar and Snijders, 2004; Mistik and Yukseloglu, 2005; Tsiafoulis et al., 2005; Prakash et al., 2009a, 2009b). H 2 O 2 is generated as a by-product in the classic biochemical reactions using enzymes such as glucose oxidase, cholesterol oxidase, glutamate oxidase, urate oxidase, lactate oxidase, alcohol oxidase, lysine oxi- dase, oxalate oxidase, and horseradish peroxidase (Chen et al., 2013). H 2 O 2 did play significant roles in regulating diverse biological processes such as immune cell activation, vascular remodeling, apoptosis, stomatal closure and root growth (Wael et al., 2012). However, high concentrations of H 2 O 2 affect the human health by causing irritation to the eyes and the skin. Hence, determination of H 2 O 2 in trace levels in biological and various water samples are of great importance. Various techniques, including chromatography, photometry, fluorescence and electrochemical methods have been employed for the detection of H 2 O 2 (Huang et al., 2011). Among these, electrochemical techniques have the advantages of good selectivity and sensitivity, short assay times, and low cost of analysis (Chen et al., 2012). Iodine, a micronutrient present in the thyroid gland, is considered to be a significant biomolecule for physiological processes in human metabolism (Yang et al., 1991), and is commonly regarded as a micronutrient in food, beverages, and pharmaceutical formulations. However, abnormal concentrations of iodine lead to several diseases and disorders. While, its deficiency causes cretinism, stunted growth and hypothyroidism (Das et al., 2004). At the same time, an excess intake of iodine may lead to thyrotoxicosis (Fujiwara et al., 2000). Therefore, determination of the most suitable amount of iodine is very important for successful iodine supplementation. In the past, a variety of methods, such as spectrophotometry, chromatography coupled spectrophotometry, mass spectrometry, chemiluminescence and electrochemical methods have been employed for the detection Contents lists available at ScienceDirect journal homepage: www.elsevier.com/locate/bios Biosensors and Bioelectronics http://dx.doi.org/10.1016/j.bios.2014.05.023 0956-5663/& 2014 Elsevier B.V. All rights reserved. n Corresponding author. Tel.: þ886 2270 17147; fax: þ886 2270 25238. nn Corresponding author. Tel.: +886 3 2118800x5018; fax: +886 2118700. E-mail addresses: [email protected] (S.-M. Chen), [email protected] (B.-S. Lou). Biosensors and Bioelectronics 61 (2014) 639–647
Transcript of Biosensors and Bioelectronics · 2020-01-10 · require time-consuming sample preparation...

www.spm
.com
.cn
A simple strategy for the immobilization of catalase on multi-walledcarbon nanotube/poly (L-lysine) biocomposite for the detection of H2O2
and iodate
A.T. Ezhil Vilian a, Shen-Ming Chen a,n, Bih-Show Lou b,nn
a Electroanalysis and Bioelectrochemistry Lab, Department of Chemical Engineering and Biotechnology, National Taipei University of Technology,No. 1, Section 3, Chung-Hsiao East Road, Taipei 106, Taiwan, ROCb Chemistry Division, Center for Education, Chang Gung University, 259, Wen-Hwa 1st Road, Kwei-Shan, Tao-Yuan 333, Taiwan, ROC
a r t i c l e i n f o
Article history:Received 27 February 2014Received in revised form8 May 2014Accepted 10 May 2014Available online 2 June 2014
Keywords:Multiwall carbon nanotubesCatalaseDirect electrochemistryBiosensor
a b s t r a c t
Herein, we report a novel third-generation H2O2 and IO3� biosensor, which was fabricated by loading
catalase (CAT) onto L-lysine/multiwalled carbon nanotube (PLL/f-MWCNT) film modified glassy carbonelectrode (GCE). The UV–visible (UV–vis) and Fourier-transform infrared (FTIR) spectra show that thecatalase encapsulated in the PLL/f-MWCNT film can effectively retain its bioactivity. The immobilizedCAT retained its bioactivity with a high protein loading of 4.072�10�10 mol cm�2, thus exhibiting asurface-controlled reversible redox reaction, with a fast heterogeneous electron transfer rate of 5.48 s�1.The immobilized CAT shows a couple of reversible and well-defined cyclic voltammetry peaks with aformal potential (E0) of �0.471 V (vs. Ag/AgCl) in a pH 6.5 phosphate buffer solution (PBS). Moreover, themodified film exhibited high electrocatalytic activity for the reduction of hydrogen peroxide (H2O2).It exhibited a wide linear response to H2O2 in the concentration range of 1�10�6–3.6�10�3, withhigher sensitivity (392 mA cm�2 M�1) and a lower Michaelis–Menten constant (0.224 mM). It providedhigh-catalytic activity towards H2O2 in a shorter time (5 s), with a detection limit of 8 nM. These resultsindicate great improvement in the electrochemical and electrocatalytic properties of the CAT/PLL/f-MWCNT biosensor, offering a new idea for the design of third-generation electrochemical biosensors.
& 2014 Elsevier B.V. All rights reserved.
1. Introduction
In recent years, hydrogen peroxide (H2O2) has been widely usedin various fields, including food production, textile industry, pulp andpaper bleaching, manufacturing of antiseptic and disinfecting agents,pharmaceutical research, clinical, biological and environmental ana-lysis (Wagenaar and Snijders, 2004; Mistik and Yukseloglu, 2005;Tsiafoulis et al., 2005; Prakash et al., 2009a, 2009b). H2O2 isgenerated as a by-product in the classic biochemical reactions usingenzymes such as glucose oxidase, cholesterol oxidase, glutamateoxidase, urate oxidase, lactate oxidase, alcohol oxidase, lysine oxi-dase, oxalate oxidase, and horseradish peroxidase (Chen et al., 2013).H2O2 did play significant roles in regulating diverse biologicalprocesses such as immune cell activation, vascular remodeling,apoptosis, stomatal closure and root growth (Wael et al., 2012).However, high concentrations of H2O2 affect the human health by
causing irritation to the eyes and the skin. Hence, determination ofH2O2 in trace levels in biological and various water samples are ofgreat importance. Various techniques, including chromatography,photometry, fluorescence and electrochemical methods have beenemployed for the detection of H2O2 (Huang et al., 2011). Amongthese, electrochemical techniques have the advantages of goodselectivity and sensitivity, short assay times, and low cost of analysis(Chen et al., 2012).
Iodine, a micronutrient present in the thyroid gland, is consideredto be a significant biomolecule for physiological processes in humanmetabolism (Yang et al., 1991), and is commonly regarded as amicronutrient in food, beverages, and pharmaceutical formulations.However, abnormal concentrations of iodine lead to several diseasesand disorders. While, its deficiency causes cretinism, stunted growthand hypothyroidism (Das et al., 2004). At the same time, an excessintake of iodine may lead to thyrotoxicosis (Fujiwara et al., 2000).Therefore, determination of the most suitable amount of iodine isvery important for successful iodine supplementation. In the past, avariety of methods, such as spectrophotometry, chromatographycoupled spectrophotometry, mass spectrometry, chemiluminescenceand electrochemical methods have been employed for the detection
Contents lists available at ScienceDirect
journal homepage: www.elsevier.com/locate/bios
Biosensors and Bioelectronics
http://dx.doi.org/10.1016/j.bios.2014.05.0230956-5663/& 2014 Elsevier B.V. All rights reserved.
n Corresponding author. Tel.: þ886 2270 17147; fax: þ886 2270 25238.nn Corresponding author. Tel.: +886 3 2118800x5018; fax: +886 2118700.E-mail addresses: [email protected] (S.-M. Chen),
[email protected] (B.-S. Lou).
Biosensors and Bioelectronics 61 (2014) 639–647
www.spm
.com
.cn
of iodine (Huang et al., 2008; Arena et al., 2002). Though thesemethods provide satisfactory results, they are expensive and oftenrequire time-consuming sample preparation techniques.
Catalase (CAT) is a heme protein, which is considered as one of themost efficient oxidoreductase enzymes containing Fe (III)-protopor-phyrin as a prosthetic group at the redox center (Murthy et al., 1981).It acts a biocatalyst and is having the ability to catalyze the dispro-portionation of hydrogen peroxide into oxygen and water (Lai andBergel, 2002). Interestingly, in the immobilized state it has enormouspotential applications in the food industry for food production andpasteurization, and textile industry. In the medical field it is used as acomponent in biosensor systems for the analysis of hydrogen peroxide(Wang et al., 1993). Though electrochemical techniques are proven tobe the most valuable tools for the study of heme proteins (Wang et al.,2005), it is difficult to achieve the direct electron transfer (DET) of CATat the bare electrode surface. To achieve the DET for CAT, variousmodified electrodes, such as chitosan, polyacrylammide hydrogel,methylcellulose, agarose hydrogel, collagen, and silica sol–gel electro-des have been proposed (Ammam and Fransaer, 2011; Salimi et al.,2007a, 2007b, 2007c). The stability of these electrodes and the use ofhighly expensive cross-linking agents are however problematic.
The rapid development of new nanomaterials and nano-technologies has provided many new techniques for electroana-lysis (Rivas et al., 2007). In recent years, functionalized MWCNTs(f-MWCNTs) have attracted special interest owing to their excel-lent properties such as large specific surface area, high mechanicalstrength, excellent conductivity and low production cost. f-MWCNTshave been used in wide range of applications, including electricaldevices such as batteries, field-effect transistors, electrochemilu-minescent sensors, electro mechanic resonators and electroche-mical biosensors (Wang et al., 2005; Wu et al., 2007; Gradzkaet al., 2013). Several methods have been developed for thecovalent functionalization of CNTs through acid treatments, oxida-tion, esterification, amidation, radial coupling, anionic coupling,and cycloaddition reactions. The oxidation of carbon nanotubes inacidic solution creates negatively charged carboxyl groups at itssurface, enabling the chemical attachment of molecules bearingamine groups (Kumar et al., 2012; Gebhardt et al., 2011;Balasubramanian and Burghard, 2005; Wang et al., 2006.
L-lysine is an essential α-amino acid with basic properties.L-lysine modified electrodes have the advantages of stability andpositive surfaces, which provide sufficient number of activecenters for wide application in electrocatalytic processes (Pereiraet al., 2003; Anson et al., 1983). These positively charged biomo-lecules are very useful for improving the microenvironmentaround the enzyme and providing fast electron transfer(Mizutami et al., 1995; Haladjian et al., 1996).
In this work, a simple strategy to immobilize catalase (CAT)onto PLL modified f-MWCNT surface for the development of anamperometric hydrogen peroxide biosensor has been demon-strated for the first time. The development of a simple electro-deposition method is attractive in electrochemistry for thepreparation of PLL films on f-MWCNT. We have described a simpleand less time consuming approach to immobilize CAT onto thePLL/f-MWCNT surface without using any cross-linking agents. Theresults revealed that CAT retained its specific enzyme activity atthe PLL/f-MWCNT surface without any denaturation. Highly bio-compatible PLL film provides favorable microenvironment for CAT,allowing it to have direct electron transfer with the electrodesurface through highly conductive f-MWCNT networks. Underoptimum conditions, CAT/PLL/f-MWCNT/GCE provided high cata-lytic activity towards H2O2 and IO3
� . The linear range for H2O2
and IO3� were 1�10�6–3.6�10�3 and 0.1�10�6–4.48�10�3,
respectively. The limit of detection (LOD) for H2O2 and IO3� limit
are 8 nM and 0.02 μM, respectively. Having the advantages ofexcellent electrocatalytic activity, simple and less-time consuming
fabrication steps, high stability and sensitivity, and biocompat-ibility, the as-developed biosensor holds great potential for variousbiosensing applications.
2. Experiments
2.1. Apparatus
Electrochemical experiments were carried out using a CHI405Aelectrochemical workstation (Chen Hua instruments Co., Shanghai,China). The three-electrode system consisted of a bare GCE(0.079 cm�2 geometrical surface area) or CAT/PLL/f-MWCNTs/GCE modified film as the working electrode, an Ag/AgCl as areference electrode (saturated KCl) and a platinum wire as acounter electrode. Amperometric i�t curve studies were carriedout using a rotating disk electrode (RDE) with an analytical rotatorAFMSRX (PINE instruments, USA). The morphology of the filmswas analyzed using a Hitachi S-3000 H scanning electron micro-scope (SEM) (Hitachi, Japan) and Being nano-instruments CSPM4000, atomic force microscope (AFM). Elemental composition ofthe films was determined through Energy dispersive X-ray analy-sis (EDX) by using a HORIBA EMAX X-ACT (Model 51-ADD0009).UV–vis absorption spectroscopy measurements were carried outusing a Hitachi U-3300 spectrophotometer. Fourier transforminfrared (FTIR) spectra were obtained using a Perkin Elmer RXIspectrometer. X-ray photoelectron spectroscopy (XPS) was per-formed using a PHI 5000 Versa Probe equipped with an Al Kα X-ray source (1486.6 eV). Electrochemical impedance spectroscopy(EIS) analysis was performed in the frequency range of 100 mHz to100 kHz using an electrochemical impedance analyzer (ZAHNER,Kroanch, Germany).
2.2. Materials
MWCNTs (O.D. 10–15 nm, I.D. 2–6 nm, length 0.1–10 μm) andcatalase from bovine liver (4540 units mg�1) were purchased fromSigma-Aldrich. L-lysine, H2O2 (30%), potassium iodate and 5 wt%Nafion were purchased from Shanghai Bio Life Science andTechnology Co., Ltd. (Shanghai, China). The phosphate buffersolution (PBS) was prepared by mixing stock solutions of NaH2PO4
and Na2HPO4 and adjusting the pH values with either 0.1 M HCl orNaOH solutions. The stock solution for catalase was prepared in0.05 M PBS (pH 6.5) and stored at 4 1C. All other reagents were ofanalytical reagent grade. Double distilled (DD) water was obtainedfrom a Milli-Q system.
2.3. Acid treatment of MWCNTs
0.5 g of crude MWCNTs and 60 mL of 0.4 M HCl aqueoussolution were mixed and sonicated in a water bath for 4 h. Then60 mL of a 3:1 concentrated H2SO4/HNO3 solution was added tothe mixture and stirred for 4 h under reflux (Cao et al., 2012). Aftercooling to room temperature, the solution was diluted with400 mL of DD water and vacuum-filtered through a 0.22 μmpolycarbonate membrane. The obtained f-MWCNT solid waswashed repeatedly with DD water until the pH of the filtratebecame 7. The as-purified solid was dried in an oven for 12 h at60 1C.
2.4. Fabrication of CAT/PLL/f-MWCNTs/GCE
GCE (3 mm diameter) was polished to a mirror-like surfaceusing 0.05 μm alumina slurry followed by rinsing with water forseveral times. Then the GCE was cleaned in ethanol and water for5 min using ultrasonic treatment, and dried at room temperature.
A.T. Ezhil Vilian et al. / Biosensors and Bioelectronics 61 (2014) 639–647640
zhk
铅笔
zhk
铅笔

www.spm
.com
.cn
Prior to use, f-MWCNTs (1 mg/mL) were dispersed in DMF throughultrasonication for 20 min. Schematic representation showing thestep-wise fabrication of CAT/PLL/f-MWCNT/GCE is provided inScheme 1. 5 μL of the f-MWCNTs dispersion was dropped ontothe pre-cleaned GCE and dried at room temperature. The modifiedGCE was then rinsed with water to remove loosely adsorbedf-MWCNTs. Higher amounts of f-MWCNTs could agglomerate onthe electrode surface, affecting the catalytic activity and stability.So, we used an optimal concentration of 1 mg/mL. The f-MWCNT/GCE was subsequently transferred to an electrochemical cellcontaining 1 mM of PLL in 10 mL of PBS (pH 6). Lysine waselectro-polymerized onto the f-MWCNT surface as reported else-where (Yu et al., 2012; Li et al., 2012). Ten consecutive cyclicvoltammograms were obtained in the potential range �1.5 toþ2.5 V (vs. Ag/AgCl reference electrode) at a scan rate of100 mV s�1. In Fig. S1, one can see an oxidation peak (þ1.65 V)and a reduction peak (�0.7 V). In subsequent scans, a newoxidation peak (IIpa) appeared at þ0.15 V, and a larger peak wasobserved when the scanning cycles were increased, indicating thecontinuous growth of the film. When scanning at high positivepotential, the monomer PLL oxidized into α-amino free radicals,which initiated the polymerization. Prior to immobilization, CATsolution was prepared by dissolving 15.0 mg of CAT in 1 mL of PBS(pH 6.5). It has to be noted that CAT (pI¼5.6) bears a net negativecharge at this pH, which allow immobilization of CAT onto thepositively charged PLL surfaces through electrostatic interactions.10 μL of the CAT solution was dropped onto the PLL/f-MWCNTs/GCE and the resulting modified electrode was allowed to dry at anambient temperature. The optimal CAT loading was determined tobe 5 mg/mL by observing its redox peak current for various CATloadings. Finally, 1.5 μL of the 0.5% Nafion solution was droppedonto the CAT surface and dried. The as-prepared CAT/PLL/f-MWCNT/GCE modified GCE was stored at 4 1C in a refrigeratorunder dry conditions when not in use.
3. Results and discussion
3.1. Morphology and elemental composition
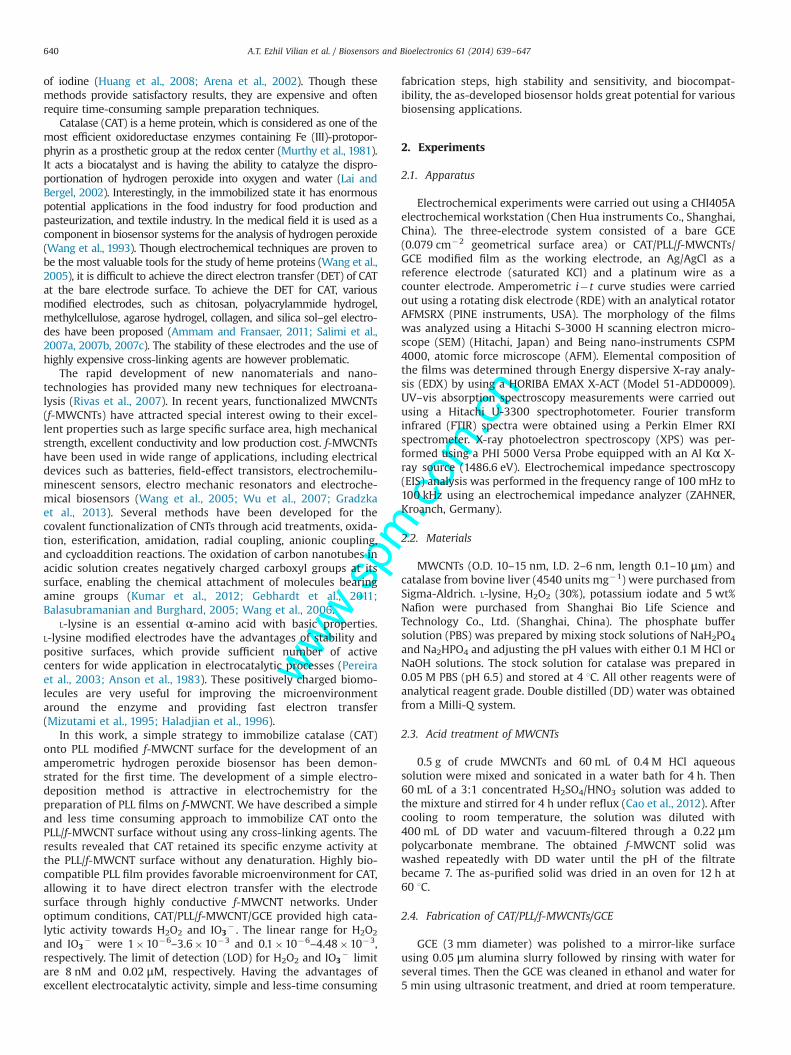
Fig. 1 shows SEM and EDX images of f-MWCNT, PLL/f-MWCNT,and CAT/PLL/f-MWCNTs/ITO. It can be seen in Fig. 1A that theconducting surface of the ITO electrode is covered with definednanotubular networks of f-MWCNTs. The nanotubes interconnect3-dimensionally to form mat like structures. As displayed inFig. 1B, thin flat sheet like PLL structures are deposited on thesurface of f-MWCNTs. EDX results reveal that CAT/PLL/f-MWCNTs
film is composed of nitrogen (20%) oxygen (50%) and carbon (30%)(Fig. S2). As can be seen in Fig. 1C, globular/bead like structures ofCAT are more densely immobilized on the film surface, as a resultf-MWCNTs and PLL structures are not identified.
XPS analysis was used to identify the elements present in PLLencapsulated f-MWCNTs. Fig. 1D shows the XPS spectrum of PLL/f-MWCNTs film. It is evident that defined signals are observed for theelements, C and O, which are assigned for f-MWCNTs and PLL. C 1sand O 1s peaks are found at 284.79 eV and 532.92 eV in the oxidizedf-MWCNTs. Due to the presence of amino groups in PLL, an N 1s peakemerged at 400.83 eV (Xu et al., 2000). XPS results reveal that PLL iscoated onto the surfaces of f-MWCNTs. The morphology and theroughness of the f-MWCNT electrodes surface without and with PLLfilms deposited during different cycles was imaged using AFMtechnique, with results showing that these MWCNT sheets couldfunction as effective electrodes for the electrodeposition of PLL films(see Fig. S12 and the text for more detailed explanation).
3.2. FTIR, UV–vis spectra and EIS analysis
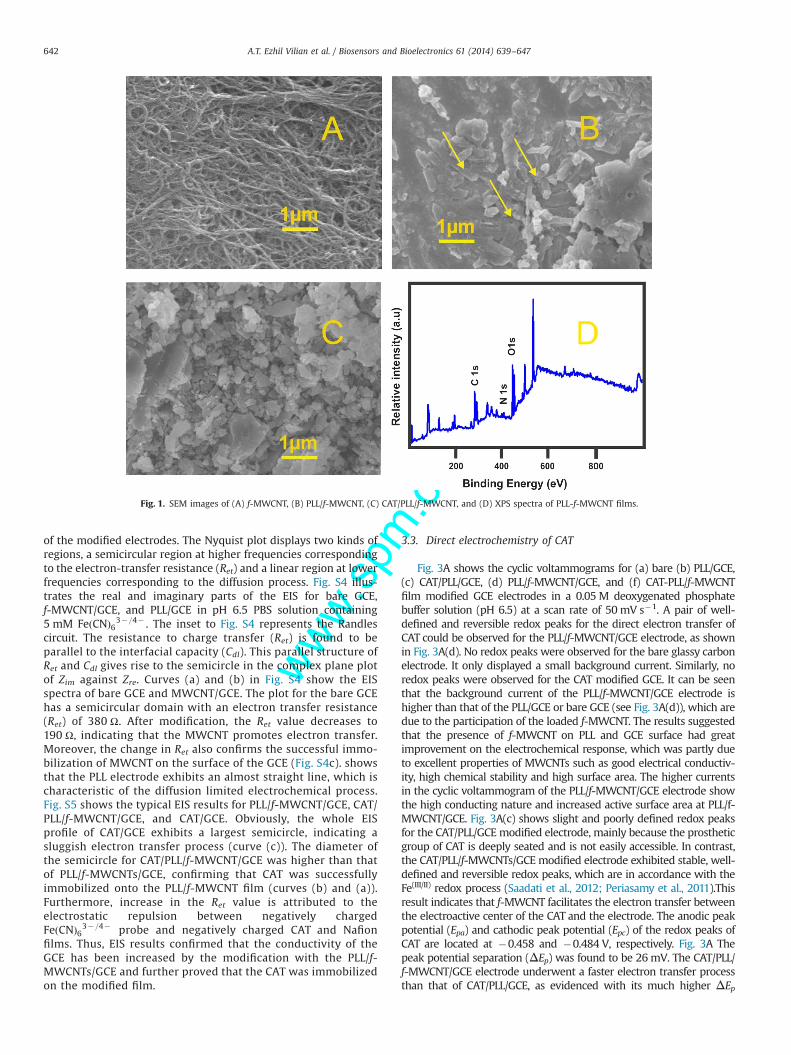
FTIR spectra results were used to access the nature of theinteractions between the CAT and PLL/f-MWCNTs. As can be seenin Fig. 2A(c), characteristic peaks of amide I (1620–1680 cm�1),amide II (1480–1580 cm�1) and amide III (1225–1300 cm�1) forCAT are found in the FTIR spectra of PLL/f-MWCNTs and native CAT.This indicates that CAT retains its native structure even afterimmobilized on the PLL/f-MWCNT film. The good biocompatibilityof the CAT entrapped in the PLL/f-MWCNT film can be attributed toits high surface area, and highly active sites, which are useful forbinding the CAT (Eberhardt et al., 2004; Song et al., 2011;Periasamy et al., 2011). FTIR spectra of f-MWCNTs and PLL/f-MWCNTs further confirm that f-MWCNTs were successfully func-tionalized with carboxyl groups and further it was combined withPLL via strong imide bond linkage (Fig. S3).
UV–vis spectroscopy is another effective technique used tostudy the positions and shapes of the Soret absorption bands,which provide information regarding possible denaturation of theheme proteins. Fig. 2B shows the UV–vis spectra of (a) CAT,(b) CAT/PLL, (c) CAT/f-MWCNT and (d) CAT/PLL/f-MWCNT. TheSoret absorption band of CAT is observed at 395 nm for CAT/PLL/f-MWCNT (Salimi et al., 2007a, 2007b, 2007c; Lu et al., 2003) andnative CAT, showing that CAT entrapped in the PLL/f-MWCNTs filmretained its bioactivity. CAT immobilized at PLL and f-MWCNTfilms exhibit similar Soret band, without any shifts, revealing thatCAT retains its bioactivity at these films.
Electrochemical impedance spectroscopy (EIS) is an importanttechnique used to monitor the changes in the electrical properties
Scheme 1. Schematic illustration of the preparation of CAT/PLL/f-MWCNT film modified glassy carbon electrode.
A.T. Ezhil Vilian et al. / Biosensors and Bioelectronics 61 (2014) 639–647 641
www.spm
.com
.cnof the modified electrodes. The Nyquist plot displays two kinds ofregions, a semicircular region at higher frequencies correspondingto the electron-transfer resistance (Ret) and a linear region at lowerfrequencies corresponding to the diffusion process. Fig. S4 illus-trates the real and imaginary parts of the EIS for bare GCE,f-MWCNT/GCE, and PLL/GCE in pH 6.5 PBS solution containing5 mM Fe CNð Þ63�=4� . The inset to Fig. S4 represents the Randlescircuit. The resistance to charge transfer (Ret) is found to beparallel to the interfacial capacity (Cdl). This parallel structure ofRet and Cdl gives rise to the semicircle in the complex plane plotof Zim against Zre. Curves (a) and (b) in Fig. S4 show the EISspectra of bare GCE and MWCNT/GCE. The plot for the bare GCEhas a semicircular domain with an electron transfer resistance(Ret) of 380 Ω. After modification, the Ret value decreases to190 Ω, indicating that the MWCNT promotes electron transfer.Moreover, the change in Ret also confirms the successful immo-bilization of MWCNT on the surface of the GCE (Fig. S4c). showsthat the PLL electrode exhibits an almost straight line, which ischaracteristic of the diffusion limited electrochemical process.Fig. S5 shows the typical EIS results for PLL/f-MWCNT/GCE, CAT/PLL/f-MWCNT/GCE, and CAT/GCE. Obviously, the whole EISprofile of CAT/GCE exhibits a largest semicircle, indicating asluggish electron transfer process (curve (c)). The diameter ofthe semicircle for CAT/PLL/f-MWCNT/GCE was higher than thatof PLL/f-MWCNTs/GCE, confirming that CAT was successfullyimmobilized onto the PLL/f-MWCNT film (curves (b) and (a)).Furthermore, increase in the Ret value is attributed to theelectrostatic repulsion between negatively chargedFe CNð Þ63�=4� probe and negatively charged CAT and Nafionfilms. Thus, EIS results confirmed that the conductivity of theGCE has been increased by the modification with the PLL/f-MWCNTs/GCE and further proved that the CAT was immobilizedon the modified film.
3.3. Direct electrochemistry of CAT
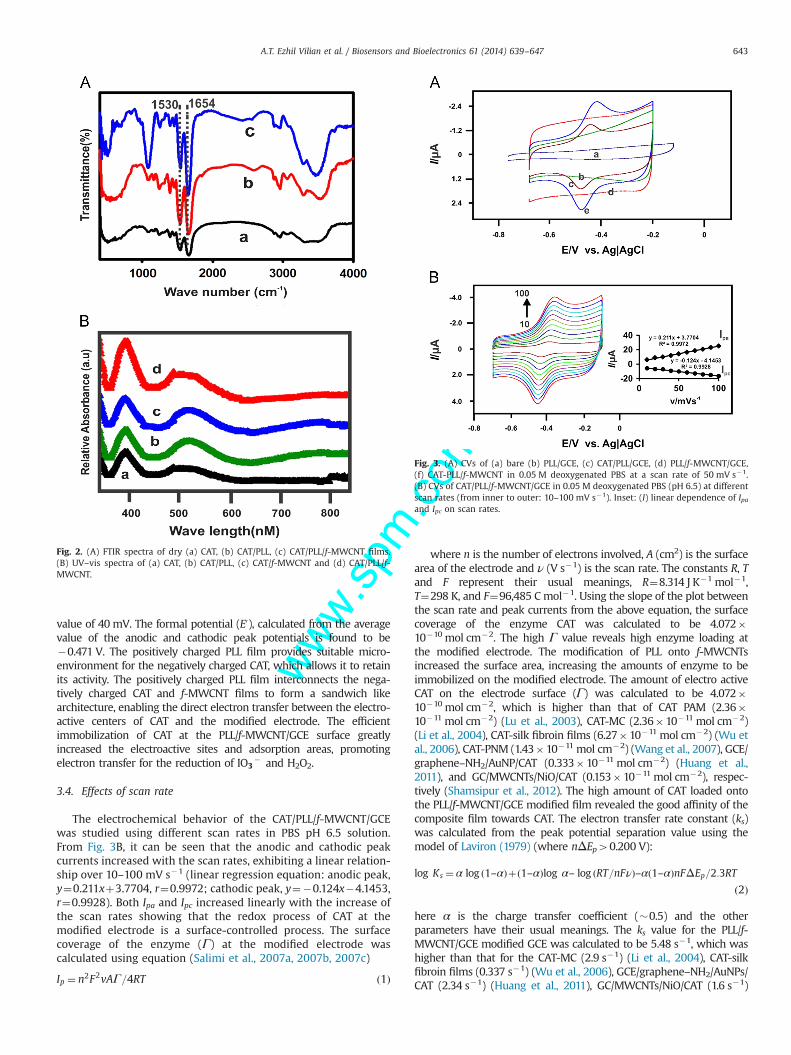
Fig. 3A shows the cyclic voltammograms for (a) bare (b) PLL/GCE,(c) CAT/PLL/GCE, (d) PLL/f-MWCNT/GCE, and (f) CAT-PLL/f-MWCNTfilm modified GCE electrodes in a 0.05 M deoxygenated phosphatebuffer solution (pH 6.5) at a scan rate of 50mV s�1. A pair of well-defined and reversible redox peaks for the direct electron transfer ofCAT could be observed for the PLL/f-MWCNT/GCE electrode, as shownin Fig. 3A(d). No redox peaks were observed for the bare glassy carbonelectrode. It only displayed a small background current. Similarly, noredox peaks were observed for the CAT modified GCE. It can be seenthat the background current of the PLL/f-MWCNT/GCE electrode ishigher than that of the PLL/GCE or bare GCE (see Fig. 3A(d)), which aredue to the participation of the loaded f-MWCNT. The results suggestedthat the presence of f-MWCNT on PLL and GCE surface had greatimprovement on the electrochemical response, which was partly dueto excellent properties of MWCNTs such as good electrical conductiv-ity, high chemical stability and high surface area. The higher currentsin the cyclic voltammogram of the PLL/f-MWCNT/GCE electrode showthe high conducting nature and increased active surface area at PLL/f-MWCNT/GCE. Fig. 3A(c) shows slight and poorly defined redox peaksfor the CAT/PLL/GCEmodified electrode, mainly because the prostheticgroup of CAT is deeply seated and is not easily accessible. In contrast,the CAT/PLL/f-MWCNTs/GCE modified electrode exhibited stable, well-defined and reversible redox peaks, which are in accordance with theFe(III/II) redox process (Saadati et al., 2012; Periasamy et al., 2011).Thisresult indicates that f-MWCNT facilitates the electron transfer betweenthe electroactive center of the CAT and the electrode. The anodic peakpotential (Epa) and cathodic peak potential (Epc) of the redox peaks ofCAT are located at �0.458 and �0.484 V, respectively. Fig. 3A Thepeak potential separation (ΔEp) was found to be 26mV. The CAT/PLL/f-MWCNT/GCE electrode underwent a faster electron transfer processthan that of CAT/PLL/GCE, as evidenced with its much higher ΔEp
Fig. 1. SEM images of (A) f-MWCNT, (B) PLL/f-MWCNT, (C) CAT/PLL/f-MWCNT, and (D) XPS spectra of PLL-f-MWCNT films.
A.T. Ezhil Vilian et al. / Biosensors and Bioelectronics 61 (2014) 639–647642
www.spm
.com
.cn
value of 40 mV. The formal potential (E0), calculated from the averagevalue of the anodic and cathodic peak potentials is found to be�0.471 V. The positively charged PLL film provides suitable micro-environment for the negatively charged CAT, which allows it to retainits activity. The positively charged PLL film interconnects the nega-tively charged CAT and f-MWCNT films to form a sandwich likearchitecture, enabling the direct electron transfer between the electro-active centers of CAT and the modified electrode. The efficientimmobilization of CAT at the PLL/f-MWCNT/GCE surface greatlyincreased the electroactive sites and adsorption areas, promotingelectron transfer for the reduction of IO3
� and H2O2.
3.4. Effects of scan rate
The electrochemical behavior of the CAT/PLL/f-MWCNT/GCEwas studied using different scan rates in PBS pH 6.5 solution.From Fig. 3B, it can be seen that the anodic and cathodic peakcurrents increased with the scan rates, exhibiting a linear relation-ship over 10–100 mV s�1 (linear regression equation: anodic peak,y¼0.211xþ3.7704, r¼0.9972; cathodic peak, y¼�0.124x�4.1453,r¼0.9928). Both Ipa and Ipc increased linearly with the increase ofthe scan rates showing that the redox process of CAT at themodified electrode is a surface-controlled process. The surfacecoverage of the enzyme (Γ) at the modified electrode wascalculated using equation (Salimi et al., 2007a, 2007b, 2007c)
Ip ¼ n2F2vAΓ=4RT ð1Þ
where n is the number of electrons involved, A (cm2) is the surfacearea of the electrode and ν (V s�1) is the scan rate. The constants R, Tand F represent their usual meanings, R¼8.314 J K�1 mol�1,T¼298 K, and F¼96,485 Cmol�1. Using the slope of the plot betweenthe scan rate and peak currents from the above equation, the surfacecoverage of the enzyme CAT was calculated to be 4.072�10�10 mol cm�2. The high Γ value reveals high enzyme loading atthe modified electrode. The modification of PLL onto f-MWCNTsincreased the surface area, increasing the amounts of enzyme to beimmobilized on the modified electrode. The amount of electro activeCAT on the electrode surface (Г) was calculated to be 4.072�10�10 mol cm�2, which is higher than that of CAT PAM (2.36�10�11 mol cm�2) (Lu et al., 2003), CAT-MC (2.36�10�11 mol cm�2)(Li et al., 2004), CAT-silk fibroin films (6.27�10�11 mol cm�2) (Wu etal., 2006), CAT-PNM (1.43�10�11 mol cm�2) (Wang et al., 2007), GCE/graphene–NH2/AuNP/CAT (0.333�10�11 mol cm�2) (Huang et al.,2011), and GC/MWCNTs/NiO/CAT (0.153�10�11 mol cm�2), respec-tively (Shamsipur et al., 2012). The high amount of CAT loaded ontothe PLL/f-MWCNT/GCE modified film revealed the good affinity of thecomposite film towards CAT. The electron transfer rate constant (ks)was calculated from the peak potential separation value using themodel of Laviron (1979) (where nΔEp40.200 V):
log Ks ¼ α log ð1–αÞþð1–αÞlog α– log ðRT=nFνÞ–αð1–αÞnFΔEp=2:3RT
ð2Þ
here α is the charge transfer coefficient (�0.5) and the otherparameters have their usual meanings. The ks value for the PLL/f-MWCNT/GCE modified GCE was calculated to be 5.48 s�1, which washigher than that for the CAT-MC (2.9 s�1) (Li et al., 2004), CAT-silkfibroin films (0.337 s�1) (Wu et al., 2006), GCE/graphene–NH2/AuNPs/CAT (2.34 s�1) (Huang et al., 2011), GC/MWCNTs/NiO/CAT (1.6 s�1)
Fig. 2. (A) FTIR spectra of dry (a) CAT, (b) CAT/PLL, (c) CAT/PLL/f-MWCNT films.(B) UV–vis spectra of (a) CAT, (b) CAT/PLL, (c) CAT/f-MWCNT and (d) CAT/PLL/f-MWCNT.
Fig. 3. (A) CVs of (a) bare (b) PLL/GCE, (c) CAT/PLL/GCE, (d) PLL/f-MWCNT/GCE,(f) CAT-PLL/f-MWCNT in 0.05 M deoxygenated PBS at a scan rate of 50 mV s�1.(B) CVs of CAT/PLL/f-MWCNT/GCE in 0.05 M deoxygenated PBS (pH 6.5) at differentscan rates (from inner to outer: 10–100 mV s�1). Inset: (I) linear dependence of Ipaand Ipc on scan rates.
A.T. Ezhil Vilian et al. / Biosensors and Bioelectronics 61 (2014) 639–647 643

www.spm
.com
.cn
(Shamsipur et al., 2012). The high ks value indicates faster electrontransfer between the active sites of CAT and the PLL/f-MWCNT/GCEmodified electrode.
3.5. Electrocatalysis of H2O2
Apparently, the good biocompatibility and abundant edge sitesof the CAT/PLL/f-MWCNTs/GCE composite film offer great advan-tages for the fabrication of a mediator-free biosensor. Fig. 4Ashows the electrocatalytic activity of the CAT/PLL/f-MWCNT/GCEtowards H2O2 in pH 6.5 PBS. Upon adding H2O2 into PBS, thereduction peak current increased linearly with increase in H2O2
concentrations (0–3 mM), which confirmed the excellent catalyticactivity of the CAT/PLL/f-MWCNT/GCE modified electrode for H2O2
reduction. This suggests the obvious electrocatalytic behaviors ofCAT entrapped in PLL/f-MWCNT/GCE films for the reduction ofH2O2. The catalytic responses of (a) CAT/GCE, (b) CAT/PLL/GCE,(c) CAT/f-MWCNT/GCE, and (d) CAT-PLL/f-MWCNT/GCE for 3 mMH2O2 in N2-saturated 0.05 M PBS (pH 6.5) at the scan rate of100 mV s�1 are shown in Fig. S6. As we know, the reduction ofH2O2 requires very high negative over potentials at CAT/GCE andthus no obvious redox peaks were observed in this electrochemi-cal window (curve (a)). When the surface of the electrode wasmodified with the CAT/PLL/GCE electrode, an electrocatalyticreduction peak for H2O2 was found at 0.42 V (curve (b)). The peakwas rather broad due to the slow electron transfer kinetics of H2O2
reduction process. In comparison with those on the CAT/GCE andCAT/PLL/GCE, a remarkable increase in reduction current andpositive shift of the peak potential can be observed at the CAT/f-MWCNT/GCE (curve (c)), however it have less electrocatalyticactivity than that of CAT/PLL/f-MWCNT modified GCE. All theseobservations indicate the excellent electrocatalytic capability ofthe CAT/PLL/f-MWCNT modified GCE toward the reduction ofH2O2 (Fig. S6, curve (d)). The reduction peak current of the CAT/PLL/f-MWCNT modified GCE was 2-fold higher than that of theCAT/f-MWCNT/GCE. We speculate that the high surface area ofPLL/f-MWCNT films increased the CAT immobilization, facilitatingfaster electron-transfer kinetics of the H2O2 reduction reaction andthe electrocatalytic activity. Furthermore, Fig. S7 shows the stabi-lity results for CAT/PLL/f-MWCNT/GCE. The reduction peak currentat the CAT/PLL/f-MWCNT/GCE was measured after recording 100cycles in 10 μM H2O2. There is only a 3% decrease in the currentdensity even after 100 cycles, indicating the good stability of CAT/PLL/f-MWCNT/GCE.
The amperometric detection of H2O2 at the CAT/PLL/f-MWCNT/GCE was carried out under optimal conditions. Fig. 4B shows theamperometric detection of H2O2 at the CAT/PLL/f-MWCNT modifiedrotating disc electrode at a rotation speed of 1200 rpm. An applied
Fig. 4. Bioelectrocatalysis of the CAT/PLL/f-MWCNT/GCE towards H2O2 in PBS at ascan rate of 0.5 mV s�1. H2O2 concentrations: (b) 0; (c) 1; (d) 2, and (e) 3 mM.(a) Bare GCE in the presence of 3 mM H2O2. Inset: calibration curve of thebiosensor. (B) Typical current–time response curves of the CAT/PLL/f-MWCNT/GCE upon successive additions of H2O2 into pH 6.5 PBS. Applied potential: �0.45 V(vs. Ag/AgCl). Inset: calibration curve of the biosensor for H2O2 determination.
Table 1Comparison of electroanalytical values for various CAT modified electrodes for H2O2 reduction using different techniques.
Modified electrodes Linear range (mM) Sensitivity (μA/mM) LOD (nM) References
CATa/AuNPb/graphene–NH2/GCE 0.3–0.6 13.4 50 Huang et al. (2011)CAT/NiOc/GCE 0.001–1.0 15.9 600 Salimi et al. (2007a, 2007b, 2007c)MWCNTd/GCE 0.01–0.1 3.3 4000 Salimi et al. (2005)GCE/TiNnpe/(CAT-IL)7f 0.001–2.1 380 100 Saadati et al. (2012)GCE/NFg/CAT/ERGOh 0.05–1.91 7.76 – Ting et al. (2011)CAT/SWNTi-CHIj/GCE 0.005–0.05 6.32 2000.5 Jiang et al. (2008)MWCNT-NF-(DDABk/CAT) 0.7–4.633 101.74 600 Prakash et al. (2009a, 2009b)CAT/PLL/f-MWCNT/GCE 1�10�6–3.6�10�3 392 8 This work
a Catalase.b Gold nanoparticles.c Nickel oxide.d Multi-wall carbon nanotubes.e Titanium nitride nanoparticles.f Ionic liquid.g Nafion.h Electrochemically reduced graphene oxide.i Single-walled carbon nanotubes.j Chitosan.k Didodecyl dimethyl ammonium bromide.
A.T. Ezhil Vilian et al. / Biosensors and Bioelectronics 61 (2014) 639–647644
www.spm
.com
.cn
potential of �0.45 V was used. H2O2 was sequentially injected into0.05 M deoxygenated PBS (pH 6.5) solution (Fig. 4B). The CAT/PLL/f-MWCNTs/GCE modified electrode showed a good linear responsetowards H2O2. The steady-state current was reached in 5 s, indicatingthe fast amperometric response of the modified electrode. Thecalibration curve for the H2O2 sensor is presented in the inset toFig. 4B. The linear range was found to be 1�10�6–3.6�10�3. Thesensitivity and the LOD are 392 μA cm�2 mM�1, and 8 nM (S/N¼3),respectively. The response gradually becomes saturated at a higherH2O2 concentration. The detection limit, and sensitivity, obtainedin this work are comparable with that of previously reportedresults (see Table 1). There is a linear relationship between thereciprocal of the current response (1/I) and the reciprocal of theH2O2 concentration (1/C) (Fig. 4B). The apparent Michaelis–Men-ten constant (KM) was calculated from the Lineweaver–Burkequation (Salimi et al., 2007a, 2007b, 2007c; Periasamy et al.,2011) as follows:
1Iss
¼ 1Imax
þ KM
Imax
1C
ð3Þ
where Iss is the steady state current, C is the bulk concentration ofthe substrate and Imax is the maximum current under saturatedsubstrate conditions. With the Lineweaver–Burk equation, theslope of the linear fit is used to evaluate KM. The KM value wascalculated to be 0.224 mM, which is much smaller than that of CATimmobilized in CAT-agarose (31.7 mM) (Okuma and Watanabe,2002), CAT-MWCNTs (1.7 mM) (Salimi et al., 2005), GCE/gra-phene–NH2/AuNPs/CAT (2.81 mM) (Huang et al., 2011), and GC/TiNnp/(CAT-IL)7 electrodes (1.1 mM) (Saadati et al., 2012). Thisresult clearly suggests that CAT displays a higher affinity for H2O2
in the developed system.
3.6. Electrocatalytic activity of IO3� in PLL/f-MWCNTs
The electrocatalytic response of the PLL/f-MWCNT film mod-ified GCE in pH 6.5 PBS towards IO3
� was investigated. As shownin Fig. S8, with the addition of IO3
� , there is a dramatic change inthe electrochemical behavior of the PLL/f-MWCNT film modifiedGCE. There is an obvious increase in the reduction peak current(Ipc). It increased with increasing concentrations of IO3
� (Fig. S8),showing a typical electrocatalytic reduction process of IO3
� .However, no similar peak corresponding to the reduction ofIO3
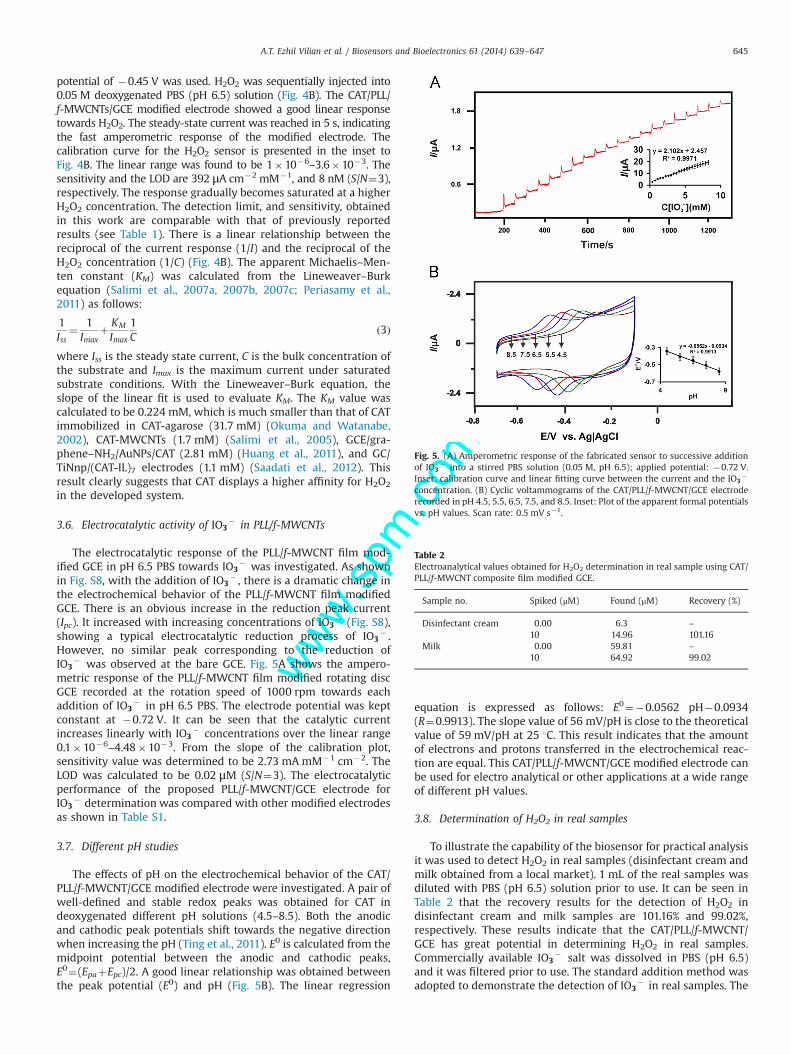
� was observed at the bare GCE. Fig. 5A shows the ampero-metric response of the PLL/f-MWCNT film modified rotating discGCE recorded at the rotation speed of 1000 rpm towards eachaddition of IO3
� in pH 6.5 PBS. The electrode potential was keptconstant at �0.72 V. It can be seen that the catalytic currentincreases linearly with IO3
� concentrations over the linear range0.1�10�6–4.48�10�3. From the slope of the calibration plot,sensitivity value was determined to be 2.73 mA mM�1 cm�2. TheLOD was calculated to be 0.02 μM (S/N¼3). The electrocatalyticperformance of the proposed PLL/f-MWCNT/GCE electrode forIO3
� determination was compared with other modified electrodesas shown in Table S1.
3.7. Different pH studies
The effects of pH on the electrochemical behavior of the CAT/PLL/f-MWCNT/GCE modified electrode were investigated. A pair ofwell-defined and stable redox peaks was obtained for CAT indeoxygenated different pH solutions (4.5–8.5). Both the anodicand cathodic peak potentials shift towards the negative directionwhen increasing the pH (Ting et al., 2011). E0 is calculated from themidpoint potential between the anodic and cathodic peaks,E0¼(EpaþEpc)/2. A good linear relationship was obtained betweenthe peak potential (E0) and pH (Fig. 5B). The linear regression
equation is expressed as follows: E0¼�0.0562 pH�0.0934(R¼0.9913). The slope value of 56 mV/pH is close to the theoreticalvalue of 59 mV/pH at 25 1C. This result indicates that the amountof electrons and protons transferred in the electrochemical reac-tion are equal. This CAT/PLL/f-MWCNT/GCE modified electrode canbe used for electro analytical or other applications at a wide rangeof different pH values.
3.8. Determination of H2O2 in real samples
To illustrate the capability of the biosensor for practical analysisit was used to detect H2O2 in real samples (disinfectant cream andmilk obtained from a local market). 1 mL of the real samples wasdiluted with PBS (pH 6.5) solution prior to use. It can be seen inTable 2 that the recovery results for the detection of H2O2 indisinfectant cream and milk samples are 101.16% and 99.02%,respectively. These results indicate that the CAT/PLL/f-MWCNT/GCE has great potential in determining H2O2 in real samples.Commercially available IO3
� salt was dissolved in PBS (pH 6.5)and it was filtered prior to use. The standard addition method wasadopted to demonstrate the detection of IO3
� in real samples. The
Fig. 5. (A) Amperometric response of the fabricated sensor to successive additionof IO3
� into a stirred PBS solution (0.05 M, pH 6.5); applied potential: �0.72 V.Inset: calibration curve and linear fitting curve between the current and the IO3
�
concentration. (B) Cyclic voltammograms of the CAT/PLL/f-MWCNT/GCE electroderecorded in pH 4.5, 5.5, 6.5, 7.5, and 8.5. Inset: Plot of the apparent formal potentialsvs. pH values. Scan rate: 0.5 mV s�1.
Table 2Electroanalytical values obtained for H2O2 determination in real sample using CAT/PLL/f-MWCNT composite film modified GCE.
Sample no. Spiked (μM) Found (μM) Recovery (%)
Disinfectant cream 0.00 6.3 –
10 14.96 101.16Milk 0.00 59.81 –
10 64.92 99.02
A.T. Ezhil Vilian et al. / Biosensors and Bioelectronics 61 (2014) 639–647 645
www.spm
.com
.cn
obtained results are shown in Table S2. The good recovery results(100% and 99.96%) clearly reveal the great potential of PLL/f-MWCNT/GCE modified electrode for the detection of IO3
� in realsamples.
3.9. Reproducibility, repeatability and stabilityof CAT/PLL/f-MWCNT/GCE
To investigate the reproducibility of the proposed sensor, sixCAT/PLL/f-MWCNT modified GCE electrodes were prepared inde-pendently and their electrocatalytic responses towards 10 μMH2O2 solution were measured under identical experimental con-ditions. The relative standard deviation (RSD) was found to be3.26%, showing its excellent reproducibility. The repeatability ofthe CAT/PLL/f-MWCNT modified GCE examined in the presence of10 μM H2O2 provided an RSD value of 3.46% (n¼8), revealing itsgood repeatability. We also checked the long-term stability of theCAT/PLL/f-MWCNT modified GCE stored at 4 1C in pH 6.5 PBS bymonitoring its response every week. The sensor retained 94.4% ofits original response after 10 days, and it decreased to 89.0% after30 days, showing its good stability. All the results reveal that theCAT/PLL/f-MWCNT modified GCE electrode has acceptable repro-ducibility and long-term stability, which make it attractive for thepreparation of biosensors.
4. Conclusion
In conclusion, we developed a simple and cost-effectivemethod for the immobilization of CAT at PLL/f-MWCNTs, withoutusing any cross-linkers. The proposed PLL/f-MWCNT compositefilm provided a suitable microenvironment for the direct electro-chemistry of CAT and it helps to maintain its bioactivity. The PLL/f-MWCNTs exhibited a large surface area and good biocompatibilitywith improved conductivity for the redox activity of CAT. The CATimmobilized PLL/f-MWCNT composite film exhibited promisingcatalytic activity towards H2O2 and IO3
� , with higher sensitivity,lower detection limit, wide linear range and high stability.
Novelty statement
A rapid and reliable amperometric sensor for H2O2 and IO3�
assessment was constructed through the direct electron trans-fer between CAT onto PLL/f-MWCNT/GCE.We have used CAT/PLL/f-MWCNT/GCE and PLL/f-MWCNT/GCEmodified electrode for the determination of H2O2 and IO3
�
using an amperometric method.PLL was formed by simpleelectrochemical deposition and the thickness of the PLL filmwas optimized through AFM.The fabricated biosensor shows well good electrochemicalcatalytic activities toward the reaction of H2O2 and IO3
� withexcellent performance.This sensor detected H2O2 and IO3
�
over the linear range 1�10–6 to 3.6�10–3 and 0.1�10–6 to4.48�10–3, respectively. The limit of detection for H2O2 andIO3
� are 8 nM and 0.02 mM, respectively.Satisfactory stability and bioactivity were obtained for the CATimmobilized on the PLL/f-MWCNT/GCE modified electrode.The proposed electrochemical sensor detected the H2O2 andIO3
� in real samples with good recoveries.Relative to the reported strategies, including the immobiliza-tion of CAT onto amidoxime polyacrylonitrile nanofibrousmembranes (Feng et al., 2013) and covalent encapsulation ofCAT onto (3-aminopropyl) trimethoxysilane (APTS) and silicananoparticles (Yang et al., 2012), our approach is simple, lesstime consuming and it does not require any cross-linking
reagents. It also has the advantages of enhanced operationalstability, thermal stability and storage stability. PLL is relativelymore biocompatible than these polymers and is having highstability in neutral pH. With more positive charges on itssurface, PLL makes the negatively charged CAT to get easilyimmobilized on its surface.
Acknowledgment
This work was supported by the Ministry of Science andTechnology, Taiwan (ROC).
Appendix A. Supplementary information
Supplementary data associated with this article can be found inthe online version at http://dx.doi.org/10.1016/j.bios.2014.05.023.
References
Arena, M., Porter, M.D., Fritz, J.S., 2002. J. Anal. Chem. 74, 185–190.Ammam, M., Fransaer, J., 2011. Sens. Actuators: B 160, 1063–1069.Anson, F., Saveant, J., Shigehara, K., 1983. J. Am. Chem. Soc. 105, 1096–1106.Balasubramanian, K., Burghard, M., 2005. Small 1, 180–192.Chen, W., Cai, S., Ren, Q., Zhao, W., 2012. Analyst 137, 49–58.Chen, S., Yuan, R., Chai, Y., Hu, F., 2013. Microchim. Acta 180, 15–32.Cao, Q., Zhao, H., Yang, Y., He, Y., He, Y., Ding, N., Wang, J., Wu, Z., Xiang, K., Wang, G.,
2012. Biosens. Bioelectron. 26, 3469–3474.Das, P., Gupta, M., Jain, A., Verma, K., 2004. J. Chromatogr. A 1023, 33–39.Eberhardt, A., Pedroni, V., Volpe, M., Ferreira, M., 2004. Appl. Catal. B: Environ. 47,
153–163.Fujiwara, T., Mohammadzai, I., Inoue, H., Kumamaru, T., 2000. Analyst 125,
759–763.Feng, Q., Wang, Q., Tang, B., Wei, A., Wang, X., Wei, Q., Huang, F., Cai, Y., Hou, D., Bi,
S., 2013. Polym. Int. 62, 251–256.Gradzka, E., Winklera, K., Borowska, M., Brzezinska, M., Echegoyen, L., 2013.
Electrochim. Acta 96, 274–284.Gebhardt, B., Syrgiannis, Z., Backes, C., Graupner, R., Hauke, F., Hirsch, A., 2011. J.
Am. Chem. Soc. 133, 7985–7995.Huang, K., Niu, D., Liu, X., Wu, Z., Fan, Y., Chang, Y., Wu, Y., 2011. Electrochim. Acta
56, 2947–2953.Huang, X., Li, Y., Chen, Y., Wang, L., 2008. Sens. Actuators: B 134, 780–786.Haladjian, J., Chef, I., Bianco, P., 1996. Talanta 43, 1125–1130.Jiang, H., Yang, H., Akins, D., 2008. J. Electroanal. Chem. 623, 181–186.Kumar, S., Kaur, I., Dharamvir, K., Bharadwaj, M., 2012. J. Colloid Interface Sci. 369,
23–27.Lai, M., Bergel, A., 2002. Bioelectrochemistry 55, 157–160.Li, Y., Ye, Z., Zhou, J., Liu, J., Song, G., Zhang, K., Ye, B., 2012. J. Electroanal. Chem. 687,
51–57.Lu, H., Li, Z., Hu, N., 2003. Biophys. Chem. 104, 623–632.Li, Y., Chen, X., Li, J., Liu, H., 2004. Electrochim. Acta 49, 3195–3200.Laviron, E., 1979. J. Electroanal. Chem. 101, 19–28.Mistik, S., Yukseloglu, S., 2005. Ultrasonics 43, 811–814.Murthy, M., Reid, T., Sicignano, A., Tanaka, N., Rossmann, M., 1981. J. Mol. Biol. 152,
465–499.Mizutami, F., Yabuki, S., Hirata, Y., 1995. Anal. Chim. Acta 314, 233–239.Okuma, H., Watanabe, E., 2002. Biosens. Bioelectron. 17, 367–372.Prakash, P., Yogeswaran, U., Chen, S., 2009a. Sensors 91, 1821–1844.Prakash, P., Yogeswaran, U., Chen, S., 2009b. Talanta 78, 1414–1421.Pereira, F., Fogg, A., Zanoni, M., 2003. Talanta 60, 1023–1032.Periasamy, A., Ho, Y., Chen, S., 2011. Biosens. Bioelectron. 29, 151–158.Rivas, G., Rubianes, M., Rodrıguez, M., Ferreyra, N., Luque, G., Pedano, M., Miscoria,
S., Parrado, C., 2007. Talanta 74, 291–307.Salimi, A., Noorbakhsh, A., Ghadermarzi, M., 2007a. Sens. Actuators: B 123,
530–537.Salimi, A., Sharifi, E., Noorbakhsh, A., Soltanian, S., 2007b. Biophys. Chem. 125,
540–548.Salimi, A., Hallaj, R., Soltanian, S., 2007c. Biophys. Chem. 130, 122–131.Song, N., Chen, S., Huang, X., Liao, X., Shia, B., 2011. Process Biochem. 46, 2187–2193.Shamsipur, M., Asgari, M., Mousavi, M., Davarkhah, R., 2012. Electroanalysis 24,
357–367.Salimi, A., Noorbakhsh, A., Ghadermarz, M., 2005. Anal. Biochem. 344, 16–24.Saadati, S., Salimi, A., Hallaj, R., Rostami, A., 2012. Anal. Chim. Acta 753, 32–41.Tsiafoulis, C., Trikalitis, P., Prodromidis, M., 2005. Electrochem. Commun. 7,
1398–1404.Ting, S., Periasamy, A., Chen, S., Saraswathi, R., 2011. Int. J. Electrochem. Sci. 6,
4438–4453.
A.T. Ezhil Vilian et al. / Biosensors and Bioelectronics 61 (2014) 639–647646

www.spm
.com
.cn
Wagenaar, C., Snijders, J., 2004. Int. J. Food Microbiol. 91, 205–208.Wael, K., Belder, S., Pilehar, S., Steenberge, G., Herrebout, W., Heering, H., 2012.
Biosensors 2, 101–113.Wang, J., Lin, Y., Chen, L., 1993. Analyst 118, 277–280.Wang, S., Chen, T., Zhang, Z., Shen, X., Lu, Z., Pang, D., Wong, K., 2005. Langmuir 21,
9260–9266.Wu, B., Hou, S., Yin, F., Zhao, Z., Wang, Y., Wang, X., Chen, Q., 2007. Biosens.
Bioelectron. 22, 2854–2860.Wang, C., Zhou, G., Liu, H., Wu, J., Qiu, Y., Gu, B., Duan, W., 2006. J. Phys. Chem. B 110,
10266–10271.
Wu, Y., Shen, Q., Hu, S., 2006. Anal. Chim. Acta 558, 179–186.Wang, S., Chen, T., Zhang, Z., Pang, D., Wong, K., 2007. Electrochem. Commun. 9,
1709–1714.Xu, S., Kumar, S., Li, Y., Jiang, N., Lee, S., 2000. J. Phys.: Condens. Matter 12,
L121–L126.Yang, S., Fu, S., Wang, M., 1991. Anal. Chem. 63, 2970–2973.Yu, S., Cao, X., Yu, M., Yu, S., Cao, X., Yu, M., 2012. Microchem. J. 103, 125–130.Yang, X., Cai, Z., Ye, Z., Chen, S., Yang, Y., Wang, H., Liu, Y., Cao, A., 2012. Nanoscale 4,
414–416.
A.T. Ezhil Vilian et al. / Biosensors and Bioelectronics 61 (2014) 639–647 647