BIOS 35502 Practicum in Environmental Field Biology … metrics that relate to the diversity and...
26
Soundscape Analysis as a tool for monitoring songbird diversity BIOS 35502 Practicum in Environmental Field Biology Jack McLaren Mentor: Erica Kistner 2013
-
Upload
phungthuan -
Category
Documents
-
view
219 -
download
1
Transcript of BIOS 35502 Practicum in Environmental Field Biology … metrics that relate to the diversity and...

Soundscape Analysis as a tool for monitoring songbird diversity
BIOS 35502 Practicum in Environmental Field Biology
Jack McLaren
Mentor: Erica Kistner
2013

McLaren 1
Abstract
The first goal of this project is to conduct a baseline study to determine, via traditional
fieldwork methods, if songbird diversity and richness varies across the three grazing regimes
(bison-grazed, wildlife-without-bison-grazed, and cattle-grazed) present in the Palouse Prairie
region, an intermountain bunch-grass prairie in Northwestern Montana. The second goal of this
project is to analyze the soundscape of the Palouse Prairie in Northwestern Montana and to
determine if soundscape analysis is an effective method for monitoring diversity and abundance
of songbirds. Soundscape analysis and the recording devices it uses are far less invasive than
traditional methods, collect more high-quality data, and can be immediately uploaded to the
internet for long-term storage and further analysis. The study found significant differences in
bird diversity and richness among habitat types, with cattle-grazed grassland having significantly
less bird richness or diversity than bison- and wildlife-grazed grassland. In addition, the
soundscape metrics Recorded richness, Total Energy, Biophony, and Normalized Difference
Soundscape Index (NDSI) were significantly and positively related to bird diversity and richness,
while Acoustic Evenness and Technophony were significantly and negatively related to bird
diversity and richness. Acoustic Diversity showed no relationships with bird diversity or
richness. Finally, through model selection, we found Biophony, and Recorded Richness to be the
two most powerful explanatory variables for bird diversity and richness. The link established
between point count diversity and soundscape data could allow scientists to use recording
devices to non-invasively monitor diversity, an important fact considering grassland bird
diversity is declining at an alarming rate.
Introduction

McLaren 2
The precipitous decline in grassland birds has become one of the West’s most
challenging conservation issues (Brennan and Kuvlesky 2005). The pressure of livestock grazing
and other agricultural activity has caused grassland bird species to decline at an alarming rate.
One study found declines in 75% of grassland bird species in the period between 1966 and 1993,
with more than 50% of those bird populations declining more than 50% over that time period
(Herkert 1994). Differential grazing pressures by wild ungulates like Bison (Bison bison) were a
major historical driver in maintaining a diverse grassland bird communities (Ammon and Stacey
1997, Askins et al. 2007). The introduction of regulated livestock grazing removed this historical
differential grazing pressure and altered bird community compositions (Askins et al. 2007,
Fleischner 1994). The severity of the problem is difficult to fully quantify, since no grassland
Bird Breeding Surveys (BBS) exist before 1966—well after the beginning of ranching and
farming in the West. Therefore, ecological monitoring, especially monitoring the differences
between native-gazed and livestock-grazed grasslands, is necessary in order to help quantify the
problem of grassland bird declines and inform future management strategies. This study will
examine the efficacy of a relatively new method of ecological monitoring called soundscape
analysis for monitoring grassland bird diversity and abundance.
The first goal of this project is to conduct a baseline study to determine, via traditional
fieldwork methods, if songbird diversity and richness varies over the three grazing regimes
present in the Palouse Prairie region, an intermountain bunch-grass prairie in Northwestern
Montana. These three regimes are bison-grazed, wildlife-grazed, and cattle-grazed. Past studies
have indicated that there is a difference in bird species richness and diversity between wildlife-
grazed sites and cattle grazed sites (Ammon and Stacey 1997). In addition, birds prefer to nest in
sites that are bison-grazed (Fondell and Ball 2004, Powell 2006). Based on these previous
McLaren 3
studies, I hypothesize that there will be a higher diversity and abundance of birds in bison-grazed
sites, followed by wildlife-grazed sites, followed by cattle-grazed sites.
The second goal of this project is to analyze the soundscape of the Palouse Prairie in
Northwestern Montana and to determine if soundscape analysis is an effective method for
monitoring diversity and abundance of songbirds. A “soundscape” is defined by Pijanowski et al.
2011b as the “collection of biological, geophysical, and anthropogenic sounds that emanate from
a landscape and which vary over space and time, reflecting important ecosystem processes and
human activities”. The soundscape can be captured by recording sound using recording stations
scattered throughout the landscape. This study defines “soundscape analysis” as the process of
calculating numerical metrics from those acoustic recordings and statistically analyzing those
metrics. By analyzing the soundscape over spatial scales it is possible to study and monitor an
ecosystem and how human activities affect that ecosystem (Pijanowski et al. 2011a). As
ecological processes are changed by human activity and grazing, bird populations will change,
and it is expected that those changes will be reflected as differences in both songbird diversity
and acoustic activity between the three habitat types. I hypothesize that there will be
relationships between the soundscape metrics and data collected in the baseline study using
traditional methods.
Additionally, songbirds prey upon numerous agricultural pests. Understanding how
humans impact songbird diversity through grazing practices could lead to better range
management with the goal of increasing the number of valuable bird species. Additionally, the
soundscape metrics that relate to the diversity and species richness found in the point counts
could potentially be used as surrogates for bird richness and diversity. Soundscape analysis could
conceivably be used over a longer period of time and using less effort than traditional point

McLaren 4
counts. If soundscape metrics are effective at predicting diversity and richness, then soundscape
analysis could be used as a new, easier tool for monitoring bird diversity and richness. This could
greatly increase the efficiency of monitoring programs across the United States and help quantify
the extent of grassland bird declines.
Methods
Study Area
The Palouse prairie is an intermountain bunchgrass prairie in Northwestern Montana with
low incidence of fire and precipitation. Like other short-grass and bunch-grass prairies in the
west, the Palouse Prairie is threatened by agriculture and cattle ranching (Daubenmire 1970).
The National Bison Range (Moiese, MT, USA), a US Fish and Wildlife Refuge, is comprised of
rare, native Palouse Prairie for the purpose of conserving American Bison (Bison Bison). The
Palouse prairie contains three different grazing regimes: bison-grazed, cattle-grazed, and
wildlife-grazed. In conjunction with the Remote Environmental Assessment Laboratory (REAL),
this project consists of three study sites in each grazing regime (bison grazed, wildlife grazed,
cattle grazed), for a total of 9 study sites (Kistner et al 2011). Each study site has a single
Wildlife Acoustics Soundmeter 2 provided by REAL mounted to a metal fencepost (Wildlife
Acoustics 2012). The soundmeter is programmed to record one minute of sound every 30
minutes at 22,050 Hz (Gage 2008). The resulting recording is called a “soundfile”, and is stored
in an on-board memory chip in .wav format.
Bison-grazed grassland on the National Bison Range is very similar to the native
grassland habitat that would have been widespread before settlement by Euro-Americans. The
study sites are located at (47.33953N, 114.16370W); (47.36837N, 114.19209W); and
(47.36946N, 114.23014W). Cattle-grazed grassland is a livestock-grazed rangeland just outside
McLaren 5
of the National Bison Range. The study sites are located at (47.2851N, 114.16785W);
(47.28596N, 114.15056W); and (47.27865N, 114.159W). Wildlife-grazed lands are the patches
of land on the National Bison Range that are free from the effects of cattle and Bison and are
therefore only grazed by small ungulates and mammals like Whitetail Deer (Odocoileus
virginianus) and Meadow Voles (Microtus pennsylvanicus). The study sites are located at
(47.35065N 114.17297W); (47.37241N, 114.23923W); (47.36824N, 114.25839W). This study
will examine differences in bird diversity and soundscapes between these three grazing regimes.
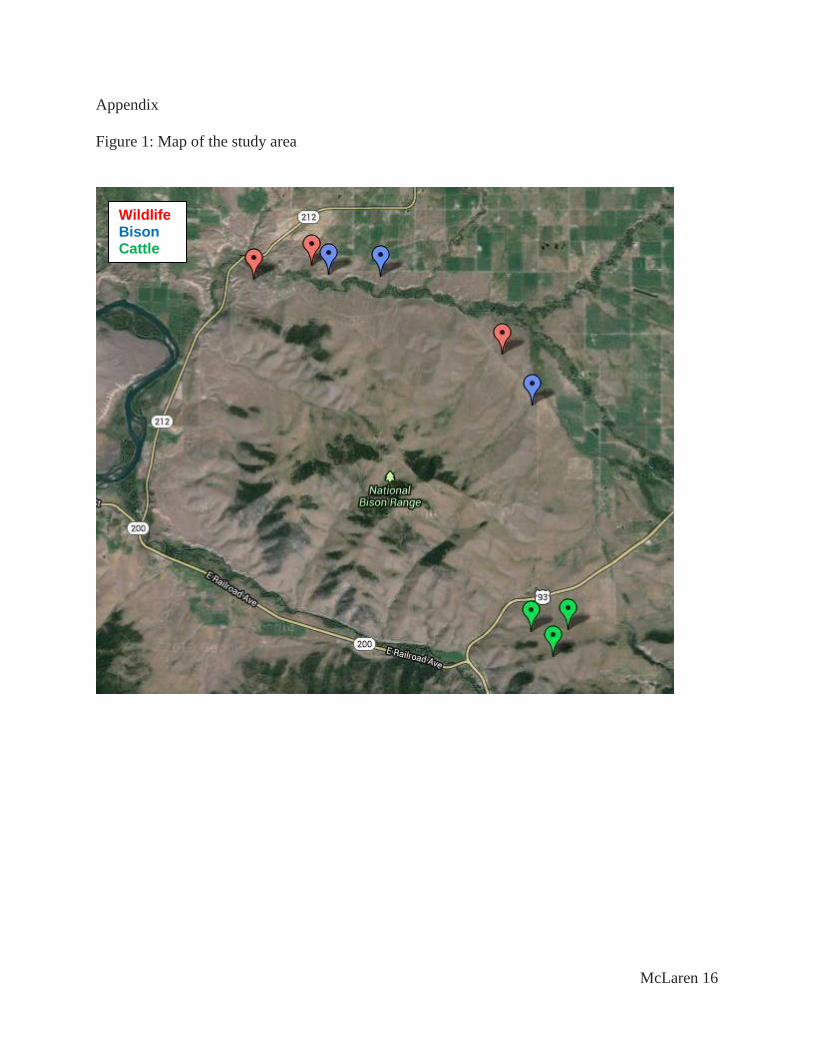
See Figure 1 for a map of the study area.
Point Counts
Daily point counts occurred at the locations of the soundmeters with the purpose of
measuring bird diversity and abundance. Specific point count methodology followed the
protocol established by Ralph et al. (1995). Each count was conducted for 3 three minute
intervals for a total of nine minutes. Number and species of birds was recorded for each count.
Shannon’s diversity index and species richness was calculated for each point count using the R
statistical programs reshape and vegan (Wickham 2007; Oksanen et al. 2012). Point counts nine
minutes in length would allow for comparisons with the more standard 10 minute lengths used in
other studies (Ralph et al. 1995; Sutherland 1996); however, for all of the subsequent analyses,
only the first 3 minute interval of the point count was used so that direct comparisons could be
made to recorded sound files. Point counts took place during the morning (5 am-8 am) and
evening choruses (7 pm-10pm) in order to maximize bird observations to provide a more
accurate depiction of the diversity of birds in the area. A total of 110 point counts were
conducted throughout the breeding season from July 3rd
to July 26th
.
Data Analysis

McLaren 6
First, each 1 minute recording (n=330) was listened to by J. McLaren to determine
recorded species richness. Next, the R-based program Seewave was used to calculate Shannon’s
diversity of sound and Acoustic Evenness for each recording (Sueur J et al. 2008, Pijanowski et
al 2011b, Villanueva-Rivera et al. 2011). Finally, the soundscape was analyzed using the
“Normalized Difference Soundscape Index” (NDSI), “Technophony”, and “Biophony” metrics
developed by the Remote Environmental Assessment Laboratory (REAL) at Michigan State.
Soundfiles were sent to Stuart Gage at REAL. Once in the database, the REAL lab utilized
MATLAB to split each sound file into eleven frequency bins from 0-11 kHz (Gilat 2004). The
value in each bin was calculated from the recording using the Power Spectral Density (PSD) via
the Welch method (Welch 1967). These values were in turn used to calculate biophony,
technophony, and NDSI. “Biophony”, or biological-based sound, is the sum of the PSD values
from 2-11 kHz. “Technophony”, or sound produced by human activity, is the PSD value from 1-
2 kHz (S. Gage, personal communication 2012). Finally, NDSI is a simple calculation that
normalizes the PSD data into a usable ratio. The calculation is as follows:
. [eq. 1]
NDSI values range from -1 (all technophony) to +1 (all biophony) (S. Gage, personal
communication 2012).
Statistical analysis
All of the metrics, Shannon’s diversity of Sound, Acoustic Evenness, Total Energy,
Biophony, Technophony, and NDSI were compared among study sites using Analysis of
Variance (ANOVA) and Tukey’s HSD test to parse out differences among habitats. In addition,
McLaren 7
linear models were used to compare all soundscape metrics with observed bird diversity and
richness. Multiple regression models used both time of day (AM/PM) and soundscape metrics
like biophony, technophony, and NDSI as factors to explain observed diversity and richness
values. Because of the large number of potential explanatory variables, backward/forward
stepping, Akaike Information Criterion (AIC) based model-selection tests were conducted to
determine which of the variables, or combination of variables, best relates to the point count
data.
When performing these comparisons between point count data and soundscape metrics, I
used the averaged metrics for the three soundfiles that aligned with the same date and time as the
point count. For example, if I did a point count on 7-15-2013 at 7 am, I averaged the soundfiles
metrics from the same site and date at 6:30 am, 7 am, and 7:30 am. Since there were 110 point
counts, there were 110 corresponding averaged sound file data points. To eliminate pseudo-
replication, both the point count and sound file data was further averaged by site and time of day
(a categorical variable indicating morning vs. evening). The final dataset consisted of 9 morning
and 9 evening average values of Shannon’s diversity index, Species richness, NDSI, biophony,
technophony, total energy, sound file species richness value, Shannon’s diversity of sound, and
Acoustic Evenness.
Results
Shannon’s Diversity index for the point counts significantly varied across habitat types
(df=2, F=11.23, p=0.00178), with a Tukey’s HSD test and a boxplot (Figure 2) showing that
cattle-grazed plots had a lower Shannon’s Diversity Index than wildlife- or bison-grazed plots
(HSD= 0.7067858). Observed species richness also significantly varied (df=2, F=6.527,
p=0.0121), and cattle-grazed plots were again less species-rich than bison- or wildlife-grazed
McLaren 8
plots (Figure 3). NDSI (df=2, F=4.14, p=0.0429), Total Energy (df=2, F=6.904, p=0.0101), and
Biophony (df=2, F=6.119, p=0.0147) also varied significantly among habitat types. For each of
these metrics, Tukey’s HSD test showed cattle-grazed plots had lower levels of these respective
metrics then bison- and wildlife-grazed plots. The other soundfile metrics, Technophony (df=2,
F=3.213, p=0.0763), Shannon’s Diversity of Sound (df=2, F=1.323, p=0.303), Acoustic
Evenness (df=2, F=2.447, p=0.128), and Soundfile species richness (df=2, F=3.459, p=0.0651)
did not show significant differences among habitat types.
For the study period starting on July 3rd
2013 and ending July 26th
, 2012, a total of 330
minutes of sound was recorded for a total of 5.5 hours of recording time. 42 total species were
detected in the recordings while 69 were detected during point counts. Despite this discrepancy,
linear regression revealed that observed species richness (during point counts) significantly
predicted sound file species richness (β=0.86274, , p<0.0001, R2=0.8752, Figure 4).
In addition, observed species diversity also significantly and positively related to soundfile
species richness (β= 0.21079, , p<0.0001, R2= 0.7611, Figure 5).
Multiple regression model results can be seen in Table 1 in the appendix. They are
summarized here. Total Energy, Biophony, NDSI were positively and significantly related to
bird diversity and richness (Table 1, Figure 6, 7, 8, respectively). Technophony was negatively
and significantly related to bird diversity, but showed no significant relationship with bird
richness (Table 1, Figure 9). Acoustic Evenness was negatively and significantly related to both
bird diversity and richness. Only Shannon’s Diversity Index of Sound showed no significant
relationship to bird diversity or richness (Table 1). In addition to explaining overall bird diversity
and richness, Total Energy, Biophony, and NDSI also varied by time of day, with values being
greater in the AM than in the PM choruses (Table 1, Figures 6, 7, 8).
McLaren 9
With so many potential explanatory variables, I used model selection to attempt to
determine which variables related the most to Species Richness and Shannon’s Diversity. The
model selection method used was backward/forward with AIC as the criterion. The resulting
linear model shows Biophony, NDSI, and Recorded Species Richness explain Shannon’s
Diversity Index values (R2= 0.8348, F= 24.59, p= 3.53e-05). The same model selection process
found that Biophony and Recorded Species Richness explain Species Richness (R2= 0.8892, F=
57.15, p= 7.354e-07).
Discussion
As expected, there is a difference in bird richness and diversity among habitat types.
Bison- and wildlife-grazed areas had higher bird diversity and richness than cattle-grazed areas.
This confirms what has been shown in previous studies, that grassland bird diversity is closely
coupled with landscape use (Brennan and Kuvlesky 2005, Askins et al. 2007, Fleischner 1994).
Corresponding differences in soundscape metrics begin to differentiate which soundscape
metrics are useful for predicting bird diversity and richness and which ones are not. The
implications of this finding are that cattle-grazing is, in this study, the biggest factor limiting bird
diversity. Additionally, Bison- and Wildlife-grazed areas exhibit very similar species richness
and diversity. Bison do not seem to be a necessity for maintaining diversity or richness, which
runs contrary to most studies. Bison are associated with increased diversity of just about every
taxa (Fleischner 1994). However, another study from the Konza Prairie in Kansas showed that
bird responses to bison grazing are very species-specific, and what is more important to
maintaining diversity is creation and maintenance of a patchy, heterogeneous grassland through
smart management of grassland disturbances like fire and grazing (Powell 2006). In the future, it

McLaren 10
will be valuable to parse out the differences in bird diversity within habitats in order to further
test this hypothesis. One potential study could compare differences among grazing pressures.
Another important result was that richness on recordings corresponds with richness on
point counts. This relationship serves as a proof-of-concept. Three minutes of sound recordings
should match up with three minutes of field observations, and because this relationship exists,
then the methods used to compare soundscape metrics are sound.
Soundscape metrics NDSI, Biophony, and Total energy, are, as predicted, related to
Shannon’s diversity index and species richness. This is another important step in determining
which of the soundscape metrics are effective in predicting real-world conditions. None of the
relationships are particularly strong, but they are showing the significant, positive relationships
that I hypothesized. These metrics also show differences between the dawn and evening chorus,
so these metrics can be quite sensitive to even minor changes in the soundscape.
A surprising find was that Shannon’s diversity index of sound is not related to Shannon’s
diversity or species richness. Shannon’s Diversity Index of Sound is a commonly-used metric in
other soundscape studies (Pijanowski et al. 2011b, Villanueava Rivera et al. 2011). However,
these studies do not compare the soundscape to traditional, accepted measurements. The findings
in this study indicate that Shannon’s Diversity Index of Sound may not be a good metric to use
when analyzing the soundscape. Another commonly-used soundscape metric that did not behave
as strongly as expected was Acoustic evenness. Acoustic evenness displayed the expected
negative trend: more biological sound should mean less evenness in the recording so it should be
negatively related to Shannon’s diversity and species richness. However, it was only weakly
related to bird diversity and richness when compared to other metrics and it did not show up in
McLaren 11
the model selection process. Therefore, this study finds that Acoustic Evenness may not be an
effective metric for analyzing the soundscape.
Another surprising result was that Technophony was not significantly related to bird
richness, and while significantly related to bird diversity, it was much weaker than other
variables. I expected that high levels of technophony would indicate a lower richness or diversity
since more human activity and disturbance can affect bird diversity. The lack of significance
could be due to the fact that Technophony can vary drastically from day to day, preventing a
solid trend from developing in the short time period for this study.
The model selection procedure found that NDSI, Biophony, and recorded richness are the
strongest factors for determining bird diversity. Biophony and recorded species richness are the
strongest factors for determining bird richness. The fact that the models are made up of more
than one variable means that the variables are imperfect surrogates, as could be guessed from the
mediocre R square values. However, the fact that recorded richness and biophony were selected
for both models indicates that they are particularly strong and could be the key to creating a
model for accurately determining richness and diversity from recordings. Going forward, more
data collection paired with model creation could create an appropriate, more accurate model to
determine diversity and richness from soundscape recordings. This model could, in the future,
make soundscape analysis as effective as fieldwork for monitoring bird diversity. Soundscape
analysis already has an advantage in that it is less labor-intensive than fieldwork and can be used
over very long periods of time with minimal upkeep. The link established between point count
diversity and soundscape data could allow scientists to use recording devices to non-invasively
monitor diversity. Soundscape analysis could be used to monitor the effects long-term
phenomena, like Climate Change, or Livestock use, on bird diversity.

McLaren 12
Acknowledgments
The Bernard J. Hank Family Endowment for their support of this program
The University of Notre Dame
Dr. Gary Belovsky
My mentor, Erica Kistner for her patience and help
Kerri Citterbart
Stuart Gage at REAL MSU for assistance with computing and understanding soundscape metrics
The Confederated Salish and Kootenai Tribes
The US Fish and Wildlife Service and the National Bison Range
The students at UNDERC-west

McLaren 13
Literature Cited
Ammon E and Stacey P. 1997. Avian nest success in relation to past grazing regimes in a
montane riparian system. Condor 99(1):7-13.
Askins, R. A., Chávez-Ramírez, F., Dale, B. C., Haas, C. A., Herkert, J. R., Knopf, F. L., &
Vickery, P. D. 2007. Conservation of Grassland Birds in North America: Understanding
Ecological Processes in Different Regions:" Report of the AOU Committee on
Conservation". Ornithological Monographs, iii-46.
Brennan, L. A., and W. P. Kuvlesky. 2005. North American grassland birds: An unfolding
conservation crisis? Journal of Wildlife Management 69:1-13.
Herkert, J. R. 1995. Analysis of Midwestern Breeding Bird Population Trends - 1966-1993.
American Midland Naturalist 134:41-50.
Daubenmire 1970. :Steppe Vegetation of Washington.” Wash. Agric. Expt. Sta. Tech. Bull.
No.62
Fleischner, T. L. (1994). Ecological costs of livestock grazing in western North
America. Conservation Biology, 8(3), 629-644.
Fondell T and Ball I. 2004. Density and success of bird nests relative to grazing on western
montana grasslands. Biol Conserv 117(2):203-13.
Gage, S., G. Belovsky, and E. Kasten. 2008. The Upper Great Lakes Soundscape Project
Description. Remote Environmental Assessment Laboratory. University of Notre Dame,
Michigan State University. <http://www.real.msu.edu/projects/one_proj.php?proj=nd>.
Gilat, A. 2004. MATLAB: an introduction with applications, 2nd edn. John Wiley & Sons,
Hoboken
McLaren 14
Kistner E, Belovsky GE, Citterbart K, Gage S. 2011. "The Northwestern MT Intermountain
Prairie Soundscape." Remote Environmental Assessment Laboratory.
<http://www.real.msu.edu/projects/one_proj.php?proj=im>.
Oksanen, J; F.G. Blanchet, R. Kindt, P. Legendre, P.R. Minchin, R.B. O'Hara, G.L. Simpson, P.
Solymos, M. Henry, H. Stevens, and H. Wagner 2012. vegan: Community Ecology
Package. R package version 2.0-4. http://CRAN.R-project.org/package=vegan
Pijanowski (a) BC, Farina A, Gage SH, Dumyahn SL, Krause BL. 2011. What is soundscape
ecology? An introduction and overview of an emerging new science. Landscape Ecol
26(9):1213-32.
Pijanowski (b) BC, Villanueva-Rivera LJ, Dumyahn SL, Farina A, Krause BL, Napoletano BM,
Gage SH, Pieretti N. 2011. Soundscape ecology: The science of sound in the landscape.
Bioscience 61(3):203-16.
Powell A. 2006. Effects of prescribed burns and bison (bos bison) grazing on breeding bird
abundances in tallgrass prairie. Auk 123(1):183-97.
Ralph, J., S. Droege, and J. R. Sauer. 1995. Managing and Monitoring Birds Using Point Counts:
Standards and Applications. USDA Forest Service, Washington D.C., PSW-GTR-149
Sueur J, Aubin T, Simonis C. 2008. Seewave: a free modular tool for sound analysis and
synthesis. Bioacoustics 18: 213-226
Sutherland, W.J. (Ed.), 1996. Ecological Census Techniques, A Handbook. Cambridge
University Press, Cambridge.
Villanueva-Rivera LJ, Pijanowski BC, Doucette J, Pekin B. 2011. A primer of acoustic analysis
for landscape ecologists. Landscape Ecol 26(9):1233-46.

McLaren 15
Welch, P.D. 1967. The Use of Fast Fourier Transform for the Estimation of Power Spectra: A
Method Based on Time Averaging Over Short, Modified Periodograms, IEEE
Transactions on Audio Electroacoustics, AU-15, 70–73.
Wickham, H. 2007. Reshaping data with the reshape package. Journal of Statistical Software,
21(12).
Wildlife Acoustics, 2012. Wildlife Acoustics, Inc.—Bioacoustics Software and Field Recording
Equipment. http://www.wildlifeacoustics.com/ (accessed 7-19-2012.).
McLaren 16
Appendix
Figure 1: Map of the study area
Wildlife Bison Cattle

McLaren 17
Figure 2: Boxplot of means of Shannon’s Diversity Index among Habitat types

McLaren 18
Figure 3: Boxplot of means of Species Richness among Habitat types

McLaren 19
Figure 4: Relationship between species richness observed during point counts and richness from
sound files

McLaren 20
Figure 5: Relationship between species diversity observed during point counts and richness from
sound files

McLaren 21
Table 1: Regression results for Soundscape Metrics vs. Point Count observations
Shannon's
Diversity
Difference
between AM/PM
Species
Richness
Differences
between AM/PM
Recorded Richness 0.21079*** 0 0.86274*** 0
p (-1.35E-05) (1.89E-07)
R2
0.7611 0.8752
Total Energy 1.6418*** -0.7027* 5.523* -2.831*
p (0.00331) (0.01548) (0.0118) (0.0179)
R2 0.5059 0.5059 0.4248 0.4248
Biophony 1.0326** -0.6367* 3.5771* -2.6321*
p (0.00512) (0.02712) (0.0122) (0.0236)
R2 0.4709 0.4709 0.4219 0.4219
Technophony -1.8778* 0 -6.89 0
p (0.0451) (0.051087)
R2 0.2636 0.2836
NDSI 1.5146* -0.5931* 5.465* -2.508*
p (0.013) (0.0483) (0.01833) (0.03278)
Rsquare 0.3887 0.3887 0.3849 0.3849
Acoustic Diversity 4.86 0 18.8507 0
p (0.174) (0.159)
Rsquare 0.1113 0.1612
Acoustic Evenness -1.64467 0 -6.145 0
p (0.090419) (0.09206)
Rsquare 0.1865 0.2209 * p<0.05 ** p<0.01
*** p<0.001

McLaren 22
Figure 6: Relationship between Total Energy values and Shannon’s diversity values from point
counts for both morning (open circles, dashed line) and evening (closed circle, solid line).

McLaren 23
Figure 7: Relationship between Biophony values and Shannon’s diversity values from point
counts for both morning (open circles, dashed line) and evening (closed circle, solid line).

McLaren 24
Figure 8: Relationship between NDSI values and Shannon’s diversity values from point counts
for both morning (open circles, dashed line) and evening (closed circle, solid line).

McLaren 25
Figure 9: Relationship between Technophony values and Shannon’s diversity values from point
counts for both morning (open circles, dashed line) and evening (closed circle, solid line).