Synergy of the antibiotic colistin with echinocandin antifungals in

Biophysical Journal, Volume 114
Supplemental Information
Selective Interaction of Colistin with Lipid Model Membranes
Fernando G. Dupuy, Isabella Pagano, Kathryn Andenoro, Maria F. Peralta, YasmeneElhady, Frank Heinrich, and Stephanie Tristram-Nagle

S1
SUPPORTING MATERIAL for
Selective interaction of colistin with lipid model membranes
Fernando G. Dupuy1,2, Isabella Pagano1, Kathryn Andenoro1, Maria F. Peralta1,3,
Yasmene Elhady1, Frank Heinrich1,4 and Stephanie Tristram-Nagle1
1Biological Physics Group, Physics Department, Carnegie Mellon University, Pittsburgh, PA 15213 2Instituto de Química Biológica, National University of Tucumán, San Miguel de Tucumán, Argentina 3Instituto de Investigación Médica M y M Ferreyra, CONICET-National University of Córdoba,
Córdoba, Argentina 4National Institute of Standards and Technology Center for Neutron Research, Gaithersburg, MD 20899
1. Details of CD spectroscopy
Figure S1. Light microscopy images of thin lipid films on the inner wall of a CD quartz cuvette before hydration.
Samples contained colistin mixed with lipid mimics. As shown, samples were not well oriented (homogeneous) and
colistin sometimes crystallized out. A. LPS model/colistin, B. G(+) mimic/colistin C. G(-) mimic/colistin D.
Eukaryotic (Euk) mimic/colistin. Scale bar represents 500 microns.
S2
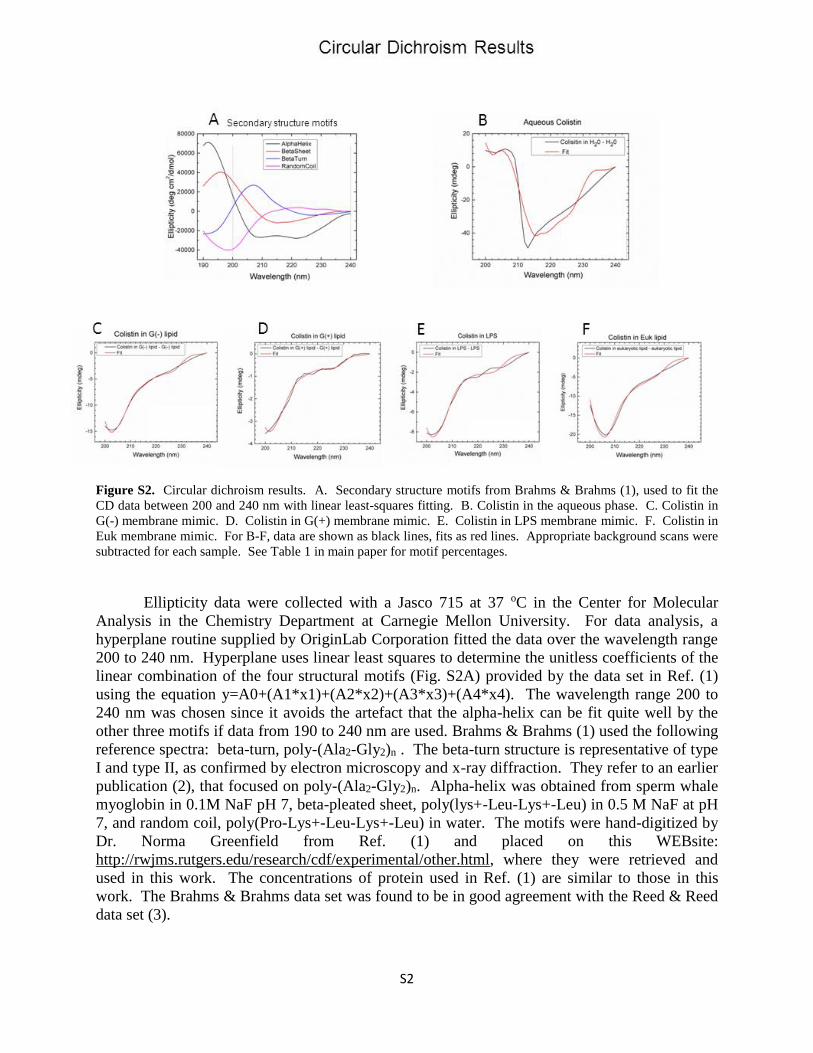
Figure S2. Circular dichroism results. A. Secondary structure motifs from Brahms & Brahms (1), used to fit the
CD data between 200 and 240 nm with linear least-squares fitting. B. Colistin in the aqueous phase. C. Colistin in
G(-) membrane mimic. D. Colistin in G(+) membrane mimic. E. Colistin in LPS membrane mimic. F. Colistin in
Euk membrane mimic. For B-F, data are shown as black lines, fits as red lines. Appropriate background scans were
subtracted for each sample. See Table 1 in main paper for motif percentages.
Ellipticity data were collected with a Jasco 715 at 37 oC in the Center for Molecular
Analysis in the Chemistry Department at Carnegie Mellon University. For data analysis, a
hyperplane routine supplied by OriginLab Corporation fitted the data over the wavelength range
200 to 240 nm. Hyperplane uses linear least squares to determine the unitless coefficients of the
linear combination of the four structural motifs (Fig. S2A) provided by the data set in Ref. (1)
using the equation y=A0+(A1*x1)+(A2*x2)+(A3*x3)+(A4*x4). The wavelength range 200 to
240 nm was chosen since it avoids the artefact that the alpha-helix can be fit quite well by the
other three motifs if data from 190 to 240 nm are used. Brahms & Brahms (1) used the following
reference spectra: beta-turn, poly-(Ala2-Gly2)n . The beta-turn structure is representative of type
I and type II, as confirmed by electron microscopy and x-ray diffraction. They refer to an earlier
publication (2), that focused on poly-(Ala2-Gly2)n. Alpha-helix was obtained from sperm whale
myoglobin in 0.1M NaF pH 7, beta-pleated sheet, poly(lys+-Leu-Lys+-Leu) in 0.5 M NaF at pH
7, and random coil, poly(Pro-Lys+-Leu-Lys+-Leu) in water. The motifs were hand-digitized by
Dr. Norma Greenfield from Ref. (1) and placed on this WEBsite:
http://rwjms.rutgers.edu/research/cdf/experimental/other.html, where they were retrieved and
used in this work. The concentrations of protein used in Ref. (1) are similar to those in this
work. The Brahms & Brahms data set was found to be in good agreement with the Reed & Reed
data set (3).
S3
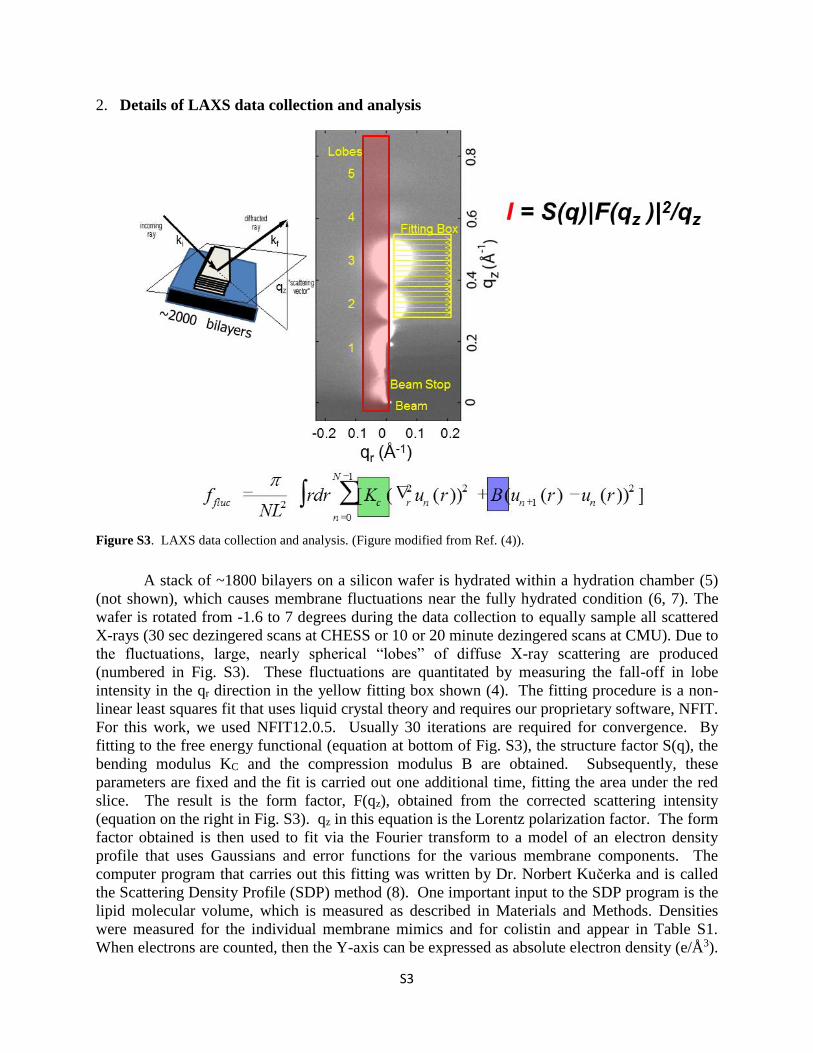
2. Details of LAXS data collection and analysis
Figure S3. LAXS data collection and analysis. (Figure modified from Ref. (4)).
A stack of ~1800 bilayers on a silicon wafer is hydrated within a hydration chamber (5)
(not shown), which causes membrane fluctuations near the fully hydrated condition (6, 7). The
wafer is rotated from -1.6 to 7 degrees during the data collection to equally sample all scattered
X-rays (30 sec dezingered scans at CHESS or 10 or 20 minute dezingered scans at CMU). Due to
the fluctuations, large, nearly spherical “lobes” of diffuse X-ray scattering are produced
(numbered in Fig. S3). These fluctuations are quantitated by measuring the fall-off in lobe
intensity in the qr direction in the yellow fitting box shown (4). The fitting procedure is a non-
linear least squares fit that uses liquid crystal theory and requires our proprietary software, NFIT.
For this work, we used NFIT12.0.5. Usually 30 iterations are required for convergence. By
fitting to the free energy functional (equation at bottom of Fig. S3), the structure factor S(q), the
bending modulus KC and the compression modulus B are obtained. Subsequently, these
parameters are fixed and the fit is carried out one additional time, fitting the area under the red
slice. The result is the form factor, F(qz), obtained from the corrected scattering intensity
(equation on the right in Fig. S3). qz in this equation is the Lorentz polarization factor. The form
factor obtained is then used to fit via the Fourier transform to a model of an electron density
profile that uses Gaussians and error functions for the various membrane components. The
computer program that carries out this fitting was written by Dr. Norbert Kučerka and is called
the Scattering Density Profile (SDP) method (8). One important input to the SDP program is the
lipid molecular volume, which is measured as described in Materials and Methods. Densities
were measured for the individual membrane mimics and for colistin and appear in Table S1.
When electrons are counted, then the Y-axis can be expressed as absolute electron density (e/Å3).

S4
The headgroup molecular volume is estimated by adding fractional volumes of a PC lipid (9), a
PE lipid (10), a PG lipid(11), a TOCL lipid(12), Lipid A(13) and components (10) (see Table
S1). The constraints used in the SDP fitting were the Gaussian width of the methyl trough (2-5
Å) and the distance between the carbonyl group position and the hydrocarbon edge (DC) (1.3 Å).
The SDP program yields many structural parameters, including bilayer thickness (DHH, 2DC) and
area/lipid AL.
Figure S4. LAXS data collected at 55 oC at CHESS (A), 37 oC at CHESS (B) and 37 oC at CMU (C-H) of
membrane mimics with 100:1 lipid:colistin molar ratio. A. KDO2, B. LPS model, C. G(-) IM, D. typical
background scan, E. IM – background, F. IM control (no colistin) – background, G. G(+) membrane, H. Euk model.
In A, the beam stop (dark rectangle) covers the beam and the first two lamellar orders, while in B-H, the beamstop
covers only the beam near the bottom center of each image. The thin, white vertical line in A and B is the X-ray
reflectivity from the underlying silicon wafer. Greyscale has been chosen to highlight the diffuse scatter in order to
compare samples. All of these samples were fully hydrated as judged by the fact that the D-spacings were either
very large (sample is unbinding) or had reached the largest value. The D-spacings for these samples are: A. 144 Å,
B. 230 Å, C. 240 Å, E. 240 Å, F. 124 Å, G. 116 Å, H. 67 Å.

S5
Fig. S4 shows typical raw LAXS data from oriented, fully-hydrated stacks of membrane
mimics containing colistin. The concentration of lipid:peptide molar ratio (100:1) was chosen
for this comparison. For data analysis, backgrounds were first subtracted and the images were
symmetrized. An example of a background file is also shown in S4D. The background file was
collected by setting the angle of X-ray incidence α = -2.4 degrees. At this angle, the data result
from all extraneous scatter from the chamber including the beam overflowing the beamstop.
Two examples of files with background subtracted are S4E and S4F. An image of a control
sample (S4F), G(-) IM without added colistin, is shown for comparison. Visually, there is little
difference between S4E and S4F, but their KC values are different.
Figure S5. Fits to the liquid crystal diffuse scattering theory shown in Fig. 3 for the five samples in Fig. 4. A.
KDO2/colistin (100:1), B. LPS model/colistin (100:1), C. IM:colistin (100:1), D. G(+)/colistin (100:1), E.
Euk/colistin (100:1). The 2D images in the red boxes are the fits to the X-ray data in the fitting box shown in Fig.
S3. The black open circles result from taking a qr slice (width 20) at the same position as the highest intensity in the
fitted boxes above (red outline). The fits to the data are shown as red lines, which overlay the intensity data fairly
well. The chi-square, or goodness of fit, is shown in the legends on the graphs. These fits are typical of most of the
data in this study.

S6
Table S1. Volumes of membrane mimic controls and resulting area/lipid AL.
aThese volumes were calculated based on LipidA volume from MD simulation (13) plus additional component
groups with known volumes (10, 14). bIncludes cholesterol. cLipid area (no cholesterol).
Sample VL (Å3) VHG (Å3) AL (Å2)
KDO2 3420a 1371a 169
LPS model 3705a 1686a 223
G(-) IM 1194 259 63.1
Eukaryotic 1108b 318 55.2c
G(+) 1213 274 66.3
Colistin (aqueous) 1573

S7
3. Details of WAXS data collection and analysis
Figure S6. WAXS data collection and analysis. A. Scattering geometry, B. WAXS scattering from a well-ordered
sample with background subtracted, C. WAXS intensity as a function of φ angle in 10 degree increments starting at
the equator, D. Continuous WAXS intensity as a function of φ angle integrated from 1.2 to 2.2 Å-1 in qr, E. Chain
scattering model used to fit to WAXS intensity in D., F. Equation for determination of Sxray. Figure adapted from
Mills et al. Ref. (15).
C E
B A
F
qr (Å-1)
𝑆𝑥𝑟𝑎𝑦 =1
2(3 ⟨𝑐𝑜𝑠2𝛽⟩-1)
S8
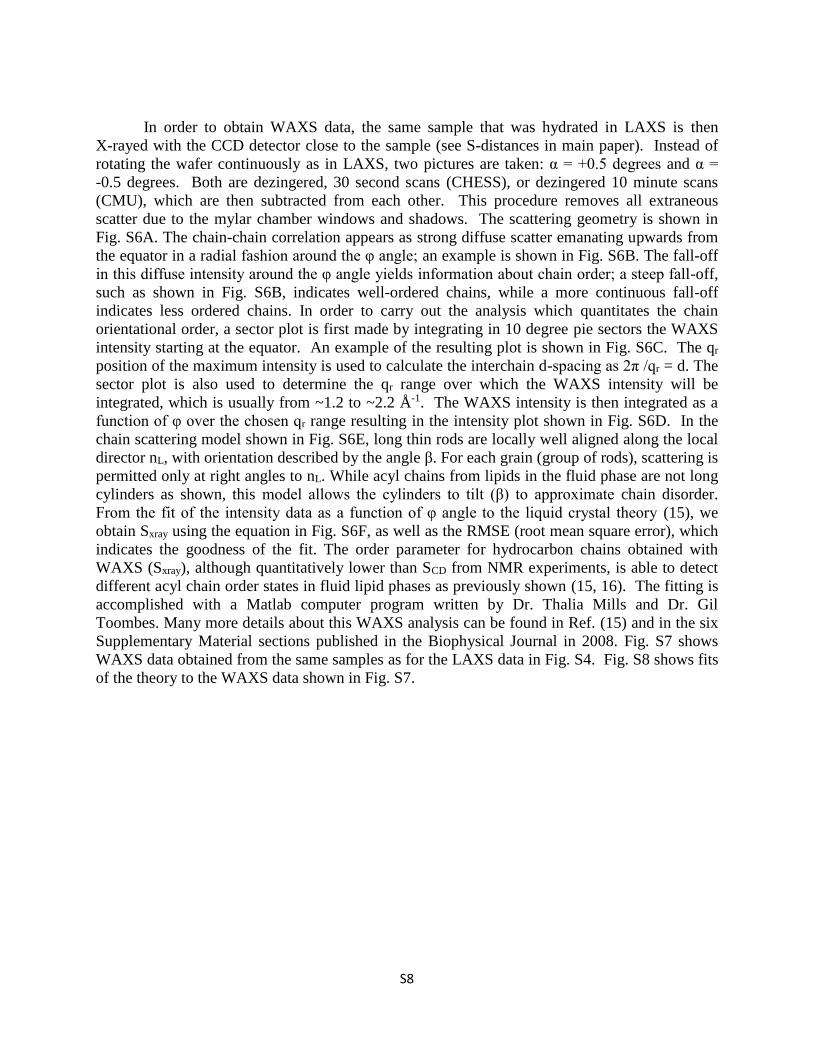
In order to obtain WAXS data, the same sample that was hydrated in LAXS is then
X-rayed with the CCD detector close to the sample (see S-distances in main paper). Instead of
rotating the wafer continuously as in LAXS, two pictures are taken: α = +0.5 degrees and α =
-0.5 degrees. Both are dezingered, 30 second scans (CHESS), or dezingered 10 minute scans
(CMU), which are then subtracted from each other. This procedure removes all extraneous
scatter due to the mylar chamber windows and shadows. The scattering geometry is shown in
Fig. S6A. The chain-chain correlation appears as strong diffuse scatter emanating upwards from
the equator in a radial fashion around the φ angle; an example is shown in Fig. S6B. The fall-off
in this diffuse intensity around the φ angle yields information about chain order; a steep fall-off,
such as shown in Fig. S6B, indicates well-ordered chains, while a more continuous fall-off
indicates less ordered chains. In order to carry out the analysis which quantitates the chain
orientational order, a sector plot is first made by integrating in 10 degree pie sectors the WAXS
intensity starting at the equator. An example of the resulting plot is shown in Fig. S6C. The qr
position of the maximum intensity is used to calculate the interchain d-spacing as 2π /qr = d. The
sector plot is also used to determine the qr range over which the WAXS intensity will be
integrated, which is usually from ~1.2 to ~2.2 Å-1. The WAXS intensity is then integrated as a
function of φ over the chosen qr range resulting in the intensity plot shown in Fig. S6D. In the
chain scattering model shown in Fig. S6E, long thin rods are locally well aligned along the local
director nL, with orientation described by the angle β. For each grain (group of rods), scattering is
permitted only at right angles to nL. While acyl chains from lipids in the fluid phase are not long
cylinders as shown, this model allows the cylinders to tilt (β) to approximate chain disorder.
From the fit of the intensity data as a function of φ angle to the liquid crystal theory (15), we
obtain Sxray using the equation in Fig. S6F, as well as the RMSE (root mean square error), which
indicates the goodness of the fit. The order parameter for hydrocarbon chains obtained with
WAXS (Sxray), although quantitatively lower than SCD from NMR experiments, is able to detect
different acyl chain order states in fluid lipid phases as previously shown (15, 16). The fitting is
accomplished with a Matlab computer program written by Dr. Thalia Mills and Dr. Gil
Toombes. Many more details about this WAXS analysis can be found in Ref. (15) and in the six
Supplementary Material sections published in the Biophysical Journal in 2008. Fig. S7 shows
WAXS data obtained from the same samples as for the LAXS data in Fig. S4. Fig. S8 shows fits
of the theory to the WAXS data shown in Fig. S7.
S9
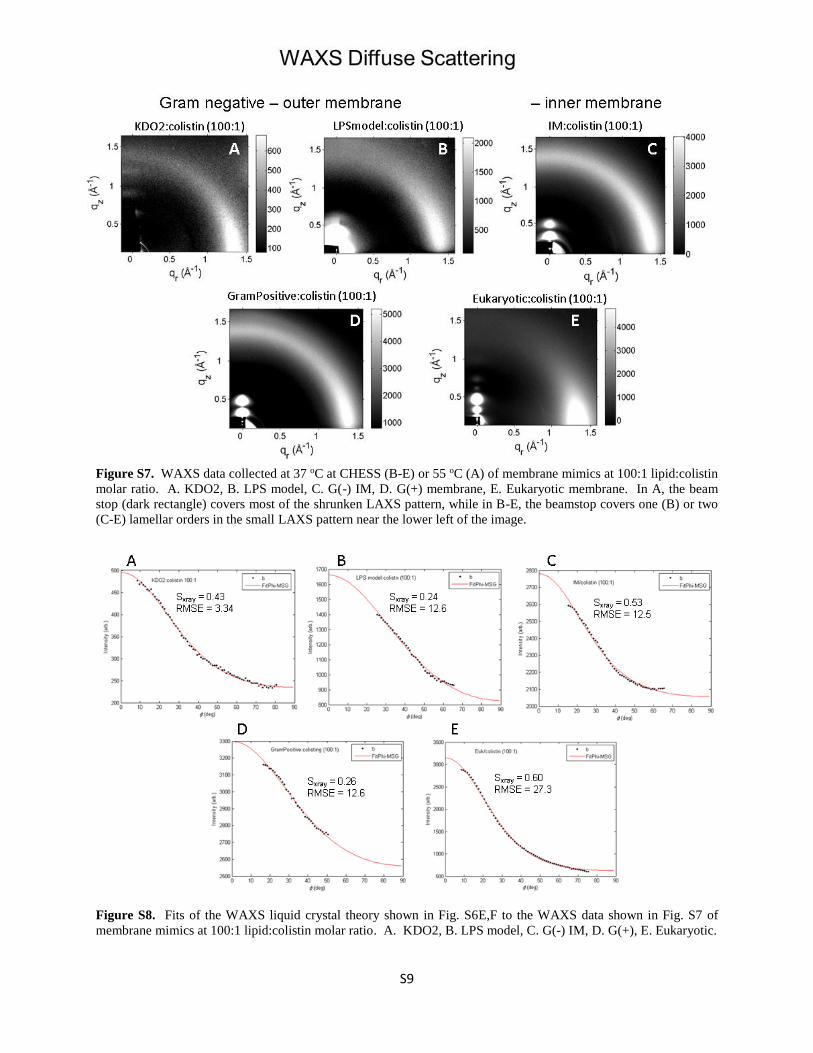
Figure S7. WAXS data collected at 37 oC at CHESS (B-E) or 55 oC (A) of membrane mimics at 100:1 lipid:colistin
molar ratio. A. KDO2, B. LPS model, C. G(-) IM, D. G(+) membrane, E. Eukaryotic membrane. In A, the beam
stop (dark rectangle) covers most of the shrunken LAXS pattern, while in B-E, the beamstop covers one (B) or two
(C-E) lamellar orders in the small LAXS pattern near the lower left of the image.
Figure S8. Fits of the WAXS liquid crystal theory shown in Fig. S6E,F to the WAXS data shown in Fig. S7 of
membrane mimics at 100:1 lipid:colistin molar ratio. A. KDO2, B. LPS model, C. G(-) IM, D. G(+), E. Eukaryotic.

S10
Details of neutron reflectivity
Details of the vesicle fusion method were described in the main paper. Basically,
osmotic pressure causes the small unilamellar vesicles (SUVs) that are attached to the 3” silicon
wafer to burst, thus forming the single bilayer shown in Fig. S9A. Rinsing completely removes
the salt solution. The resulting bilayer is termed a sparsely tethered bilayer (17) since the tethers
from the gold substrate are separated by 2-3 lipid molecules.
Figure S9. A. Sparsely tethered bilayer without peptide, cartoon adapted from Ref. (18). B. G(-) inner membrane
mimic POPE:POPG:TOCL (7:2:1), neutron reflectivity curves (open circles) and best fits (solid lines). Legend
indicates contrast solvents used, where CM4 is 67% D2O and 33% H2O with nSLD of 4e-6 Å-2. (Inset: Best fit
neutron scattering length density profile). C. G(+) membrane mimic POPG:POPE:DOTAP:TOCL (6:1.5:1.5:1),
neutron reflectivity curves at two solvent contrasts and corresponding profile in inset. Both samples contained 50:1
lipid:colistin molar ratios.

S11
Figure S10. Component volume occupancy vs. distance from substrate of A. G(-) inner membrane and B. G(+)
membrane mimics with 50:1 lipid:colistin molar ratio. The 1D-structural profile along the lipid bilayer normal was
modeled using a composition space model (19). Median bilayer distributions and median protein profile with 68%
confidence limits are shown. These data are also shown in a different format in Fig. 4 in the main paper.
Table S2. Fitting parameters for G(-) membrane mimic with colistin (50:1 molar ratio).
Table S3. Fitting parameters for G(+) membrane mimic with colistin (50:1 molar ratio).
Selected median model parameters and 68% confidence limits are shown in Tables S2 and S3.
Parameter Median ± 68% confidence
Tether thickness 9 ± 1 Å
Average hydrocarbon thickness per lipid leaflet 14 ± 3 Å
Area per lipid, outer leaflet 70 ± 20 Å2
Bilayer completeness 99 ± 1 %
Amount of membrane-associated protein 10.1 ± 0.8 Å3/Å2
Fraction of protein in hydrocarbons 0.43± 0.04
Fraction of protein in outer headgroups 0.21 ± 0.03
Fraction of protein in bulk solvent 0.31 ± 0.03
Parameter Median ± 68% confidence
Tether thickness 8.5 ± 0.3 Å
Average hydrocarbon thickness per lipid leaflet 14 ± 3 Å
Average area per lipid 80 ± 20 Å2
Bilayer completeness 99 ± 1 %
Amount of membrane-associated protein 6.7 ± 0.8 Å3/Å2
Fraction of protein in hydrocarbons 0.31± 0.06
Fraction of protein in outer headgroups 0.23 ± 0.05
Fraction of protein in bulk solvent 0.45 ± 0.05

S12
4. Comparing experimental area/lipid AL with MD simulation.
It is of interest to compare AL determined using diffuse scattering methods to AL
determined by MD simulation, where many molecular details are observed. In Table S4,
experimental AL’s are compared to AL’s obtained from MD simulations. As shown, there is a
wide variability, which could be due to experimental conditions, and duration and parameters of
the simulations. Another investigation simulated the binding of the related polymyxin B to both
Lipid A and KDO2 bilayers, but AL’s were not published (20). AL remains a central quantity for
comparing simulation to experiment.
Table S4. Comparison of Experimental and Simulated AL
Reference AL (Å2)
X-ray (this work) (KDO2) 169
MD simulation (21) (lipid A) 168
X-ray (22) (LPS) 156
MD simulation (13) (lipid A) 151.5
MD simulation (23) (LPS) 130

S13
SUPPORTING REFERENCES
1. Brahms, S., and J. Brahms. 1980. Determination of protein secondary structure in
solution by vacuum ultraviolet circular-dichroism. J Mol Biol 138:149-178.
2. Brahms, S., J. Brahms, G. Spach, and A. Brack. 1977. Identification of beta, beta-turns
and unordered conformations in polypeptide-chains by vacuum UV circular-dichroism. P
Natl Acad Sci USA 74:3208-3212.
3. Reed, J., and T. A. Reed. 1997. A set of constructed type spectra for the practical
estimation of peptide secondary structure from circular dichroism. Anal Biochem 254:36-
40.
4. Tristram-Nagle, S., and J. F. Nagle. 2004. Lipid bilayers: thermodynamics, structure,
fluctuations, and interactions. Chem Phys Lipids 127:3-14.
5. Kucerka, N., Y. F. Liu, N. J. Chu, H. I. Petrache, S. T. Tristram-Nagle, and J. F. Nagle.
2005. Structure of fully hydrated fluid phase DMPC and DLPC lipid bilayers using X-ray
scattering from oriented multilamellar arrays and from unilamellar vesicles. Biophys J
88:2626-2637.
6. Liu, Y. F., and J. F. Nagle. 2004. Diffuse scattering provides material parameters and
electron density profiles of biomembranes. Phys Rev E 69:040901(R).
7. Lyatskaya, Y., Y. Liu, S. Tristram-Nagle, J. Katsaras, and J. F. Nagle. 2001. Method for
obtaining structure and interactions from oriented lipid bilayers. Physical review. E,
Statistical, nonlinear, and soft matter physics 63:011907.
8. Kucerka, N., J. F. Nagle, J. N. Sachs, S. E. Feller, J. Pencer, A. Jackson, and J. Katsaras.
2008. Lipid bilayer structure determined by the simultaneous analysis of neutron and X-
ray scattering data. Biophys J 95:2356-2367.
9. Tristram-Nagle, S., Y. F. Liu, J. Legleiter, and J. F. Nagle. 2002. Structure of gel phase
DMPC determined by X-ray diffraction. Biophys J 83:3324-3335.
10. Nagle, J. F., and S. Tristram-Nagle. 2000. Structure of lipid bilayers. Bba-Rev
Biomembranes 1469:159-195.
11. Pan, J. J., F. A. Heberle, S. Tristram-Nagle, M. Szymanski, M. Koepfinger, J. Katsaras,
and N. Kucerka. 2012. Molecular structures of fluid phase phosphatidylglycerol bilayers
as determined by small angle neutron and X-ray scattering. Bba-Biomembranes
1818:2135-2148.
12. Boscia, A. L., B. W. Treece, D. Mohammadyani, J. Klein-Seetharaman, A. R. Braun, T.
A. Wassenaar, B. Klosgen, and S. Tristram-Nagle. 2014. X-ray structure,
thermodynamics, elastic properties and MD simulations of
cardiolipin/dimyristoylphosphatidylcholine mixed membranes. Chem Phys Lipids 178:1-
10.
13. Murzyn, K., and M. Pasenkiewicz-Gierula. 2015. Structural properties of the
water/membrane interface of a bilayer built of the E. coli lipid A. J Phys Chem B
119:5846-5856.
14. Molecular Modeling Pro
15. Mills, T. T., G. E. S. Toombes, S. Tristram-Nagle, D. M. Smilgies, G. W. Feigenson, and
J. F. Nagle. 2008. Order parameters and areas in fluid-phase oriented lipid membranes
using wide angle x-ray scattering. Biophys J 95:669-681.
16. Mills, T. T., S. Tristram-Nagle, F. A. Heberle, N. F. Morales, J. Zhao, J. Wu, G. E. S.
Toombes, J. F. Nagle, and G. W. Feigenson. 2008. Liquid-liquid domains in bilayers
detected by wide angle x-ray scattering. Biophys J 95:682-690.

S14
17. Barros, M., F. Heinrich, S. A. Datta, A. Rein, I. Karageorgos, H. Nanda, and M. Lösche.
2016. Membrane Binding of HIV-1 Matrix Protein: Dependence on Bilayer Composition
and Protein Lipidation. Journal of virology 90:4544-4555.
18. McGillivray, D. J., G. Valincius, D. J. Vanderah, W. Febo-Ayala, J. T. Woodward, F.
Heinrich, J. J. Kasianowicz, and M. Lösche. 2007. Molecular-scale structural and
functional characterization of sparsely tethered bilayer lipid membranes. Biointerphases
2:21-33.
19. Heinrich, F., and M. Lösche. 2014. Zooming in on disordered systems: Neutron reflection
studies of proteins associated with fluid membranes. Bba-Biomembranes 1838:2341-
2349.
20. Berglund, N. A., T. J. Piggot, D. Jefferies, R. B. Sessions, P. J. Bond, and S. Khalid.
2015. Interaction of the antimicrobial peptide polymyxin B1 with both membranes of E.
coli: a molecular dynamics study. PLoS computational biology 11:e1004180.
21. Wu, E. L., O. Engstrom, S. Jo, D. Stuhlsatz, M. S. Yeom, J. B. Klauda, G. Widmalm, and
W. Im. 2013. Molecular dynamics and NMR spectroscopy studies of E. coli
lipopolysaccharide structure and dynamics. Biophys J 105:1444-1455.
22. Snyder, S., D. Kim, and T. J. McIntosh. 1999. Lipopolysaccharide bilayer structure:
effect of chemotype, core mutations, divalent cations, and temperature. Biochemistry-Us
38:10758-10767.
23. Soares, T. A., Straatsma, T.P. 2008. Assessment of the convergence of molecular
dynamics simulations of lipopolysaccharide membranes. Molecular Simulations 34:295-
307.


![KPC-Producing Klebsiella pneumoniae Strains: A Threat to ... · were susceptible to amikacin, tigecycline, gentamicin or colistin [49,50,17,46]. This leaves colistin as the sole therapeutic](https://static.fdocuments.in/doc/165x107/6096566836f3ec021f08deb2/kpc-producing-klebsiella-pneumoniae-strains-a-threat-to-were-susceptible-to.jpg)