Biophysical Characterization of Reactions Associated … · Biophysical Characterization of...
175
Biophysical Characterization of Reactions Associated with Reverse Cholesterol Transport INAUGURALDISSERTATION zur Erlangung der Würde eines Doktors der Philosophie vorgelegt der Philosophisch-Naturwissenschaftlichen Fakultät der Universität Basel von Fabian Zehender aus Freiburg, Deutschland Basel, 2012
Transcript of Biophysical Characterization of Reactions Associated … · Biophysical Characterization of...
Biophysical Characterization of Reactions Associated with
Reverse Cholesterol Transport
INAUGURALDISSERTATION
zur
Erlangung der Würde eines Doktors der Philosophie
vorgelegt der Philosophisch-Naturwissenschaftlichen Fakultät
der Universität Basel
von
Fabian Zehender
aus
Freiburg, Deutschland
Basel, 2012

Genehmigt von der Philosophisch-Naturwissenschaftlichen Fakultät auf Antrag von
Prof. Dr. Joachim Seelig
Prof. Dr. Anna Seelig
Prof. Dr. Jörg Huwyler
Basel, den 21. Februar 2012
________________________________
Prof. Dr. Martin Spiess (Dekan)


Index
5 | P a g e
1. Summery and Rationale ......................................................................... 7
2. Thermodynamics of protein self-association and unfolding. The case
of Apolipoprotein A-I ................................................................................ 11
Published Article .......................................................................................................... 12
Appendix: Dynamic light scattering and analytical ultracentrifugation with
Apo A-1 ......................................................................................................................... 61
Dynamic light scattering (DLS) ................................................................................. 61
Analytical ultracentrifugation .................................................................................... 64
3. Lipid binding of Apo A-1 mimetic peptides ....................................... 75
Introduction .................................................................................................................. 75
Materials and Methods ................................................................................................ 79
Materials .................................................................................................................... 79
Methods ...................................................................................................................... 79
Results ........................................................................................................................... 83
Association behavior of peptides 4F and P ................................................................ 83
Binding of peptides 4F and P to lipid membranes ..................................................... 92
References ................................................................................................................... 122
Appendix ..................................................................................................................... 127
4. Towards understanding of the allocritee specificity of the lipid
floppase ABCA1 ......................................................................................... 133
Preliminary manuscript ............................................................................................ 134
5. Acknowledgements ............................................................................. 171
6. Curriculum vitae ................................................................................. 173
7. Declaration ........................................................................................... 175


1. Summery and Rationale
7 | P a g e
1. Summery and Rationale
This thesis aimed at improving our understanding of reactions relevant in the reverse
cholesterol transport (RCT). RCT facilitates cholesterol homeostasis and is the most
important pathway involved in cardiovascular disease. For this purpose three different
projects were chosen. Thermodynamics of protein self-association and unfolding was
characterized in detail at the example of Apolipoprotein A-1 (Apo A-1). Lipid binding
was characterized by means of small peptides that mimic Apo A-1 function. The third
project gained insight about the molecular mechanisms of ABCA1`s allocritee flopping.
Apo A-1 is the main protein constituent of high density lipoprotein (HDL) and is
together with ABCA1 a key player of the RCT.
Apolipoprotein A-1
Protein self-association and unfolding are two processes whose understanding is of
utmost importance for the development of biological phamaceuticals as oligomerisation
may alter functional properties of proteins. Apo A-1 is a perfect candidate for these
investigations as it undergoes a concentration dependent self-association process and
has high physiological relevance. Even though Apo A-1 is a highly investigated
macromolecule, self-association was not investigated in such a comprehensive
approach. Additionally, we used highly purified recombinant human Apo A-1, which
was generously provided by H.-J. Schönfeld. For analyzing thermodynamics of self-
association and thermal unfolding we introduced new theoretical and experimental
methods
1. Summery and Rationale
8 | P a g e
Self-association data was obtained by a combination of high sensitivity micro
calorimetry and analytical ultracentrifugation. The dissociation reaction of highly
concentrated and thus oligomeric Apo A-1 was followed by injection into buffer in an
isothermal titration calorimeter (ITC). Dilution of the sample moved the chemical
equilibrium towards monomers. Complementary, this equilibrium was analyzed by data
obtained from analytical ultracentrifugation in a sedimentation equilibrium mode. If
any, self-association was described in former studies as equilibrium between distinct
species, for example between monomers and dimers. We introduced a cooperative self-
association model that describes the equilibrium of the protein between each possible
oligomer in a concentration dependent manner. Furthermore, we introduced a “binding
partition function” that represents the sum of all concentrations found in the system.
Together with a dissociation degree of the protein we found a link between
thermodynamic data and theory of self-association. The binding partition function
describes the statistical properties of the system in thermodynamic equilibrium. Hence,
it is independent of the theoretical model that is utilized to describe the reaction.
Thermal unfolding of Apo A-1 was followed by circular dichroism spectroscopy (CD)
and differential scanning calorimetry (DSC). We found that melting of Apo A-1 caused
a transition of α–helix to β–sheet and random coiled secondary structure and appeared
to be highly reversibly up to 75 °C. Thermal unfolding of Apo A-1 and in general of
proteins is analyzed almost exclusively with an all-or-none model. As a powerful
alternative for higly α–helical proteins such as Apo A-1, we introduced the cooperative
Zimm-Bragg theory. Zimm-Bragg theory is commonly used for thermal unfolding of
peptides, but fits well to our data and to data of other proteins obtained from literature.

1. Summery and Rationale
9 | P a g e
Apo A-1 mimetic peptides
Apo A-1 was proposed as drug against cardiovascular disease. However, Apo A-1
mimetic peptides are more promising as they have to be administered in much lower
dosage and are produced more easily. Understanding their lipid binding properties is
essential for the estimation of in vivo effects as well as for formulation and dosage of
possible drugs with these peptides. Apo A-1 structure is featured by several amphiphatic
class A motif α-helices. Even though it is the main protein component of HDL,
thermodynamic characterization of its lipid binding has not been achieved in detail. As a
model of Apo A-1 we used two peptides (4F and P), which are featured by class A
amphipathic α-helical sequences. 4F showed Apo A-1 mimetic properties in animal
models and clinical studies. We used isothermal titration calorimetry to determine
thermodynamic parameters of binding to POPC lipid vesicles. In order to understand
this reaction several other experimental methods were used. Static and dynamic light
scattering illustrated the ability of the peptides to rupture unilamellar vesicles and form
micellar-like particles. In contrast, many other peptides such as cell penetrating peptides
(CPPs) only partition into the membrane. This finding is in agreement with a 1:1 lipid-
to-peptide stochiometry yielded from ITC data analyzed with a model of n identical
binding sites. This behavior might have high physiological relevance as possible rupture
of cell membranes is unwanted. Circular dichroism experiments yielded insight into
structural transitions as part of the driving force of lipid binding. Associated with lipid
binding is a transition of the peptide from β–sheet and random coiled to α-helical
secondary structure. Tryptophan fluorescence measurements complemented the studies
indicating binding to lipids as well. Thermodynamic calculation proved the structural
transition of β–sheet and random coiled to α-helix as well as hydrophobic interactions
as driving forces of the reaction.

1. Summery and Rationale
10 | P a g e
Further, we studied binding of the peptide 4F to cholesterol by means of ITC. Our
results suggested affinity of 4F towards cholesterol but with lower affinity compared to
POPC. This might explain the formation of HDL like particles, mainly consisting of
phosphocholine lipids. These particles, in turn, could bind to cholesterol with high
affinity.
ABCA1
ABCA1 is an ATP binding cassette transporter that flops excess lipids of a cell to the
outer membrane leaflet, where it can be picked up by Apo A-1 or HDL particles.
Research in the field of ABCA1 is mainly focused on studies in cell culture and in
animal models and is therefore rather indirect. Cholesterol efflux by ABCA1 was
assumed to be controlled by the copy number of the transporter. The possibility of a
direct modulation of the transporter activity by allocrites like in P-glycoprotein (Pgp) as
well as the proposed allocrite specificity was rarely investigated in previous studies.
Here, we measured the ATPase activity of inside-out vesicles prepared from ABCA1
transfected Human Embryonic Kidney 293 cells by means of a spectroscopic phosphate
release assay. Aluminum fluorides were found as strong inhibitor of the nucleotide
binding sites (NBD) of ABCA1 in contrast to vanadate. Furthermore, a screening for
putative allocrites interacting with the transmembrane domains (TMDs) was performed
with numerous compounds. Therewith we found that all compounds with a pegylated
chain, a heterocyclic group and a hydrocarbon tail indicated activation of the ABCA1
ATPase.

2. Thermodynamics of protein self-association and unfolding
11 | P a g e
Manuscript accepted for Biochemistry
2. Thermodynamics of protein self-association and
unfolding.
The case of Apolipoprotein A-I
F. Zehender1, A. Ziegler1, H.-J. Schönfeld2, and J. Seelig1*
1Biozentrum, University of Basel, Div. of Biophysical Chemistry, Klingelbergstrasse
50/70, CH-4056 Basel, Switzerland
and
2F. Hoffman-La Roche Ltd., Pharmaceutical Research, CH-4070 Basel, Switzerland
* To whom correspondence should be addressed:
Tel. +41-61-267 2190, Fax. +41-61-267 2189, e-mail: [email protected]
Supported by the Swiss National Science Foundation grant # 31003A-129701
2. Thermodynamics of protein self-association and unfolding
12 | P a g e
Published Article
Abstract
Protein self-association and protein unfolding are two temperature-dependent
processes whose understanding is of utmost importance for the development of
biological pharmaceuticals since protein association may stabilize or destabilize protein
structure and function. Here we present new theoretical and experimental methods to
analyze the thermodynamics of self-association and unfolding. We used isothermal
dilution calorimetry and analytical ultracentrifugation to measure protein self-
association and introduced binding partition functions to analyze the cooperative
association equilibria. In a second type of experiment we monitored thermal protein
unfolding with differential scanning calorimetry and circular dichroism spectroscopy
and used the Zimm-Bragg theory to analyze the unfolding process. For α-helical
proteins the cooperative Zimm-Bragg theory appears to be a powerful alternative to the
classical two-state model. As a model protein we chose highly purified human
recombinant apolipoprotein A-I. Self-association of Apo A-1 showed a maximum at
21 °C with an association constant Ka = 5.6 × 10⁵ M-1, a cooperativity parameter σ =
0.003, and a maximum association number N = 8. The association enthalpy was linearly
dependent on temperature and changed from endothermic at low temperatures to
exothermic above 21 °C with a molar heat capacity 0pC∆ = -2.76 kJ/molK. Above 45 °C
the association could no longer be measured because of the onset of unfolding.
Unfolding occurred between 45 °C and 65 °C and was reversible and independent of
protein concentration up to 160 μM. The midpoint of unfolding as measured by DSC

2. Thermodynamics of protein self-association and unfolding
13 | P a g e
was T0 = 52-53 °C, the enthalpy of unfolding UNH∆ = 420 kJ/mol. The molar heat
capacity increased by UN pC∆ = 5.0 ± 0.5 kJ/molK upon unfolding corresponding to a
loss of 80 to 85 helical segments, as was confirmed by CD spectroscopy. Unfolding was
highly cooperative with a nucleation parameter σ = 4.4 × 10⁻⁵.
Introduction
In situ, biological molecules are confronted with a spectrum of structures,
concentrations, ions, etc., a situation thermodynamically distinct from dilute solutions in
vitro. Macromolecular crowding may lead to non-specific homo- or hetero-association
and an understanding of functional mechanisms requires quantitative analysis of protein
association equilibria. The thermodynamic treatment of coupled reactions with many
intermediates is a complex process, as temperature changes influence both the
association equilibrium and protein stability. Here we consider protein association and
protein unfolding as two independent cooperative processes. The protein
association/dissociation equilibrium is described as a multi-state process using binding
partition functions. Protein unfolding is analyzed with the nearest-neighbor Zimm-
Bragg theory and compared to the classical two-state N U model. We apply these
theoretical models to experimental data obtained with Apolipoprotein A-I (Apo A-I).
Apo A-I, a 28.2 kDa protein, reduces cardiovascular risks by promoting the
reverse transport and metabolism of cholesterol. Its structural and functional properties
with and without lipid have been intensively investigated (for reviews see [40] and
[41]). X-ray diffraction and CD spectroscopy demonstrate that Apo A-I contains long
stretches of α-helical structure [42-47]. α-Helix is enhanced after lipid binding [48].
Analysis of the thermodynamics of lipid binding reveal that the association number [49]

2. Thermodynamics of protein self-association and unfolding
14 | P a g e
and lipid-to-protein ratio [50] markedly influence the shape of reconstituted particles
suggestive of functional differences. The association equilibrium of lipid-free Apo A-I
is however an area of ambiguity with diverging reports on its association number and
association mechanism (for a recent survey see [51]).
We investigated the above mentioned variability with highly purified recombinant
human Apo A-I. The monomer-oligomer equilibrium was investigated with high
sensitivity titration calorimetry (ITC). By diluting concentrated Apo A-I solutions in the
calorimeter cell it was possible to determine the association enthalpy, 0aH∆ , association
constant, Ka, and association number, n, of oligomer formation as a function of
temperature. Sedimentation equilibrium runs in the analytical ultracentrifuge (AUC)
provided an independent approach to elucidate the association constant and
stoichiometry. We propose a cooperative association model and develop analytical
expressions for the degree of dissociation and molar heat capacity change upon
oligomer dissociation.
CD spectra were recorded as a function of protein concentration and temperature
to monitor structural changes. Differential scanning calorimetry was used to quantify
the thermodynamics of protein unfolding. Taking into account changes in molar heat
capacity upon unfolding and using the cooperative Zimm-Bragg model for α-helix-coil
transitions it was possible to correlate structural changes observed by CD spectroscopy
with thermodynamic DSC data. Apo A-I unfolding was found to thermodynamically
override Apo A-I association.
2. Thermodynamics of protein self-association and unfolding
15 | P a g e
Materials and Methods
Proteins. A detailed protocol fort medium scale preparation of recombinant
human Apo A-I will be published in different context (Schönfeld et al., manuscript in
preparation). Briefly, a fusion protein construct involving a hexahis purification tag, an
ubiquitin sequence, a granzyme B cleavage site (IEPD¦GG) and the human Apo A-I
sequence (N- to C-terminus) was recombinantly expressed in E.coli.
After opening of cells by French press treatment the recombinant fusion protein
was bound to a Ni-NTA column and then washed with alternating cycles of two buffers,
one containing 8 M urea and the other containing 60% isopropanol to remove bacterial
endotoxins. The fusion protein was eluted using EDTA, cleaved with Granzyme B and
the hexahis tag containing N-terminus was removed from the mixture by a second
NiNTA affinity step. Recombinant protein that did not bind to NiNTA contained the
authentic human Apo A-I sequence with two additional glycines at the N-terminus. The
Apo A-I protein was further purified by anion exchange chromatography and then
extensively dialyzed against PBS. Purified Apo A-I contained no significant amounts of
aggregates as analyzed by SEC with on-line static light scattering and no detectable
endotoxins as measured by limulus assay. Purified recombinant Apo A-I sequence
differed from human wild-type Apo A-I sequence by two additional N-terminal glycine
residues. Electrospray mass spectrometry revealed a molecular mass of 28192.3 Da
(theoretical value for wt Apo A-I + 2 Gly is 28192.7 Da). Comparison by size exclusion
chromatography (data not shown) and analytical ultracentrifugation (Figure 3C) did not
reveal any higher order structure differences between recombinant Apo A-I and Apo A-
I purified from human plasma, a generous gift from Dr. Tim Tetaz, Roche Basel.
2. Thermodynamics of protein self-association and unfolding
16 | P a g e
Circular dichroism (CD) spectroscopy. CD spectra were obtained with a CD
spectrometer Model 62 ADS (AVIV, Lakewood, N.J.) in the wavelength range of 190
nm - 260 nm using a total acquisition time of 25 min per spectrum. Measurements were
made with protein concentrations of 0.1 mg/mL and 0.5 mg/mL in 100 mM NaF, 10
mM sodium phosphate, pH 7.4. Quartz cuvettes with path lengths of d = 1 mm and 0.2
mm were used and a baseline with pure buffer was recorded for each cuvette and
subtracted from the protein spectra. The CD-spectra were simulated with the non-
commercial software CDpro [52] based on reference spectra of 56 proteins (data set #
10) and also with an Excel program based on a linear combination of reference spectra
[53]. The melting behavior of Apo A-I was studied in the range of 25 - 85 °C.
High sensitivity isothermal titration calorimetry (ITC). ITC was performed using
either the ITC-200 or the VP titration calorimeter from Microcal (Northampton, MA).
The cell volumes were 200 μL and 1.4 mL, respectively, and the injection volume
varied between 2 μL and 10 μL. Solutions were degassed under vacuum for about 10
min. The calorimeter cell contained buffer and the protein solution (80 μM or 160 μM)
was in the injection syringe. The injection of small amounts of a concentrated Apo A-I
solution into buffer led to the dissociation of Apo A-I complexes. The heat flow induced
by protein dissociation is recorded and analyzed by the software provided with the
instrument. The quantitative interpretation of the Apo A-I dissociation isotherm in terms
of thermodynamic parameters was not part of the commercial software and is discussed
below. All measurements were made in PBS buffer (137 mM NaCl, 10 mM sodium
phosphate, pH 7.4, 0.02% NaN3).

2. Thermodynamics of protein self-association and unfolding
17 | P a g e
Differential scanning calorimetry (DSC). DSC scans were made with a VP-DSC
(Microcal, Northampton, MA). Protein solutions were degassed and the reference cell
contained only buffer. The heating rate was 1 °C/min. DSC scans were made in PBS
buffer, pH 7.4, with 0.02% NaN3. Further evaluation of the DSC curves was performed
as described in the Results section.
Analytical ultracentrifugation (AUC). A Beckman XL-I ultracentrifuge (Beckman
Coulter, Indianapolis, IN) with UV- and Interference detection systems was used.
Protein solutions were measured in PBS buffer at concentrations from 0.5 to 2 mg/mL
with 0.02% NaN3. Sedimentation velocity (SV) and sedimentation equilibrium (SE)
measurements were done at 20 °C. Depending on protein concentration, the center piece
length was 1.4, 3, or 12 mm. Rotational speeds in SE runs were between 5 and l8 krpm.
Using a liquid column height of ~5 mm equilibria were reached within ca. 68 h, as
verified by comparison with subsequent radial scans.
Theory
Analysis of calorimetric protein unfolding experiments. The calorimetric enthalpy
of the unfolding process N U is temperature-dependent and can be calculated by
( )U 0 UN U N p 0H(T) f (T) H C T T ∆ = ⋅ ∆ + ∆ − (1)
fU= (1 - fN) is the fraction of unfolded protein (0 ≤ fU ≤ 1), ΔH0 is the unfolding
enthalpy, UN pC∆ is the difference in the molar heat capacity between the native and the
unfolded protein, and T0 is a reference temperature, usually the midpoint of the
unfolding curve. The heat capacity change measured in the DSC calorimeter is given by
2. Thermodynamics of protein self-association and unfolding
18 | P a g e
( )U U 0 U UN p U N p N p 0
df (T)C (T) f (T) C H C T TdT
∆ = ⋅∆ + ∆ + ∆ − (2)
In the following we use two models to calculate the extent of unfolding fU.
The classical model for protein unfolding is the N U two-state model. The
fraction of unfolded protein is related to the temperature-dependent equilibrium constant
[ ] [ ]UNK (T) U / N= according to
UN
U UN
K (T)f (T)1 K (T)
=+
(3)
At the midpoint T0 of the transition, enthalpy and entropy are equal. The free energy
change of unfolding, UNG(T)∆ , can be written
U 0 UN N p 0
0 0
T TG(T) H 1 C T T lnT T
∆ = ∆ − + ∆ − +
(4)
The temperature-dependence of the equilibrium constant is given by
UNG(T)
U RTNK (T) e
−∆
= (5)
The three independent parameters which need to be determined are 0 UN pH , C∆ ∆ , and
T0. The temperature T0 designates the midpoint of the N U transition where
UN 0G(T ) 0∆ = and U
N 0K (T ) 1= . ΔH0 is the van't Hoff enthalpy of the transition and must
be distinguished from the calorimetric enthalpy ΔHcal which is measured by the DSC
instrument. In an ideal fit of the N U model the two quantities are identical.
However, if ΔH0 and ΔHcal are different, the deviation of ΔH0/ΔHcal from unity is
2. Thermodynamics of protein self-association and unfolding
19 | P a g e
considered to be indicative of intermediates in the transition. The calorimetric curve is
then approximated by a superposition of several N U transitions.
The N U model does not completely reveal the molecular aspects of protein
unfolding. However, many proteins - such as Apo A-I - have a high α-helix content and
a specific molecular process of unfolding is the cooperative "melting" of the α-helix.
We therefore propose an alternative description of Apo A-I unfolding in terms of the
cooperative α-helix random coil transition and we will extend this model to include
β-structure formation. The degree of unfolding, fU (T), is calculated with the Zimm-
Bragg matrix method [54] and combined with equations (1) and (2). The Zimm-Bragg
model considers the α-helix random coil transition as the cooperative disruption of n
hydrogen bonds. It is an enthalpy-driven process and the enthalpy change in breaking a
single helical hydrogen bond is in the range of h = 3.8 kJ/mol (0.9 kcal/mol) to 5.4
kJ/mol (1.3 kcal/mol) [55-57]. While h itself is independent of temperature, the
temperature dependence of the equilibrium constant s(T) (growth parameter) follows
van't Hoff's law according to
1
h 1 1R T Ts(T) e
− = (6)
At T1 the growth parameter s is s(T1) =1. T1 defines the midpoint of the α-helix
random coil for a sufficiently long and highly cooperative polypeptide chain. Under
these conditions T1 is identical with the experimentally observed midpoint T0. However,
the chain length n has a dramatic effect on the melting behavior. Short chains melt at
lower temperatures than long chains and the theory then predicts the midpoint
temperature T0 at lower temperatures than T1.

2. Thermodynamics of protein self-association and unfolding
20 | P a g e
The second parameter in Zimm-Bragg theory is the nucleation factor σ which is
related to the probability of forming an α-helix nucleus within a random coil sequence.
σ determines the cooperativity of the system and is assumed to be temperature-
independent.
Zimm-Bragg theory defines conditional probabilities for extending a given
peptide chain by one additional segment where "segment" in the present context is
identical to a single amino acid in the protein sequence. Adding a helix segment to an
existing α-helix requires the growth parameter s; formation of an α-helix nucleus within
a random coil sequence is defined by the nucleation parameter σs. The occurrence of a
coil segment has the probability 1. In the nearest neighbor approximation these
conditional probabilities can be summarized in the probability matrix M [54, 58].
1 1M
s s
= σ (7)
The partition function of a chain of n segments is then given by
( ) n 1Z 1 1 M
0
=
(8)
Knowledge of the partition function allows the calculation of the α-helix fraction
according to
h1 ln Zfn s∂
=∂
(9)
As s is a function of temperature, M, Z, and fh are equally temperature-dependent. The
fraction of unfolded protein is
fU(T) = (1 - fh) (10)

2. Thermodynamics of protein self-association and unfolding
21 | P a g e
fU (T) can then be combined with equation (2) to calculate UN pC (T)∆ .
A convenient approach to calculate the helix-fraction is eq. (27) of reference [54]
which can easily be programmed.
Association/dissociation equilibrium of Apo A-I. The association of Apo A-I is a
separate process which must be distinguished from unfolding. It is described here by a
chemical model which includes cooperativity and growth and has been applied
successfully to describe surfactant association in micelles [59].
A + A → A2; A2 + A → A3; … →An
The formation of the dimer A + A A2 is the nucleation step
22
A a Ac K c= σ ⋅ (11)
which is followed by several growth steps
3 22 3
A a A A a Ac K c c K c= ⋅ = σ (12)
n n 1A a A Ac K c c−
= ⋅ ⋅ (13)
σ is the nucleation parameter (different from that of Zimm-Bragg theory) and cA is the
monomer equilibrium concentration. The equilibrium constant Ka is temperature-
dependent according to van't Hoff's law. The corresponding enthalpy of association,
0aH∆ , is also temperature-dependent and is written as
( )0 0 0a a p,a 0H (T) H C T T∆ = ∆ + ∆ − (14)

2. Thermodynamics of protein self-association and unfolding
22 | P a g e
T0 is an arbitrary reference temperature. 0p,aC∆ is the molar heat capacity change of the
association reaction. All numerical values refer to protein monomers.
If 0Ac is the total concentration of monomer A and q = KacA defined as growth
parameter, mass conservation requires
n0 j 1A A
j 2c c 1 j q −
=
= + σ
∑ (15)
We introduce a binding partition function Q which represents the sum of all
concentrations found in the system referenced to the monomer concentration cA (cf.
[60])
2 n
nj 1
A A A A Aj 2
c c ...c c 1 q c Q−
=
+ + = +σ = ⋅
∑ (16)
( )( )
Nnj 1
j 2
q qQ 1 q 1
1 q−
=
σ −= +σ = +
−∑ (17)
The degree of dissociation (fraction of monomers) at a given total concentration, 0Ac , is
given by
A0A
cc
α = (18)
and can be calculated as
1Qq Qq
− ∂
α = + ∂ (19)
The temperature-dependence of α is given by
10* * 0a
a A2 2H (T)d 1qQ Q K c
dT RT
−∆α = − − ⋅ α (20)

2. Thermodynamics of protein self-association and unfolding
23 | P a g e
where
2*
2Q QQ 2 qq q
∂ ∂= +
∂ ∂ (21)
We now consider a thought experiment where the protein is locked in its native
conformation and a change in temperature influences only the association equilibrium
but not the protein conformation. If performed in the DSC instrument the molar heat
capacity change is predicted as:
0p,a p,a a
dC (T) C H (T)dTα
∆ = ∆ ⋅α + ∆ ⋅ (22)
Knowing the temperature dependence of ΔHa and Ka, the degree of dissociation, α, and
the molar heat capacity change, ΔCp,a, can be predicted.
For completeness we mention two alternative association models which are
discussed in the literature in connection with Apo A-I. The first is the all-or-none model
nA An (23)
which can be described by
nn n 1
A A ac / c K −= (24)
Defining again
q = cA Ka (25)
this leads to the binding partition function

2. Thermodynamics of protein self-association and unfolding
24 | P a g e
Q = 1 + qn-1 (26)
where the degree of dissociation can again be calculated with eq. 19.
The second model suggests a monomer-dimer-tetramer-hexamer-octamer
equilibrium [61]. In the present notation the binding partition function of this model is
given by
( )2n 1n 1
2 j 12
j 1
q qQ n = 1+ σ q 11 q
−−−
=
−= + σ
−∑ (27)
The nucleation parameter is included for generality and must be defined as σ = 1 to
make eq. (27) equivalent to the above mentioned model of reference [61]. Again eq.
(19) can be used to derive the degree of dissociation α.
Results
Isothermal titration calorimetry (ITC) of Apo A-I monomer oligomer
equilibrium. Apo A-I self-associates in solution even at low protein concentrations [51,
61, 62], but thermodynamic aspects of Apo A-I self-association have not yet been
investigated in detail. The availability of high-sensitivity titration calorimetry now
permits the deduction of the enthalpy of association, ∆Ha, binding constant, Ka, and
association number, n, from dilution experiments. The calorimetric titration sequence is
analogous to detergent demicellization experiments determining the critical micellar
concentration [59, 63]. In the present study, the dilution involves oligomers of different
size and the stoichiometry is not known. Also not known is the effect of temperature on
the association-dissociation equilibrium.

2. Thermodynamics of protein self-association and unfolding
25 | P a g e
Figure 1A displays the heat flow in a dilution experiment where Apo A-I (160
μM) was injected into PBS buffer. At 40 °C the heat of dissociation was endothermic
but changed to exothermic when the experiment was performed below 20 °C.
Integration of the calorimetric response peaks yielded the heats of reaction, δhi (Fig.
1B). The first protein injection corresponded to a more than 100 fold dilution of the
starting solution and resulted in a
Figure 1
complete dissociation of the Apo A-I complex. The molar heat of dissociation is then
given by
1hHn
δ∆ =
δ (28)
where δh1 is the measured heat of dissociation of the first injection and δn is the molar
amount of injected Apo A-I.
However, the experimentally derived ΔH is not the full molar heat of dissociation,
0DH∆ . The thermodynamic and statistical analysis discussed below shows that the 160
μM Apo A-I solution is composed of Apo A-I complexes (~95%) and a small fraction
of monomers (~5%). The true heat of dissociation, 0DH∆ is thus larger than the
measured value ΔH. The correct value follows from the theoretical analysis of the
dissociation isotherm as described in more detail below. Table 1 shows the measured
ΔH and the corrected heat of association, 0 0a DH H∆ = −∆ . 0
aH∆ has the opposite sign of

2. Thermodynamics of protein self-association and unfolding
26 | P a g e
the heat of dissociation. Taking into account the fraction of monomers, α, 0aH∆ is given
by
0aH∆ = -ΔH/(1 – α) (29)
Table 1
Continued addition of Apo A-I to the calorimeter cell causes dissociation to stop.
The degree of dissociation, αi, after i injections is given by
ii
i1
h
i h
δα =
δ
∑ (30)
The nominator is the cumulative heat measured for the first i injections, the
denominator is the predicted maximum heat, i · δh1, expected for complete dissociation
after i injections. The ITC dilution experiment thus provides both the dissociation
enthalpy, 0DH∆ , and the dissociation isotherm ( )0
pf cα = . 0pc is the total concentration
of protein in the calorimeter cell and increases with each injection.
ITC measurements were performed between 5 and 45 °C and Fig 2A displays the
temperature dependence of the association enthalpy 0aH∆ . The enthalpy changes its sign
at
Figure 2

2. Thermodynamics of protein self-association and unfolding
27 | P a g e
about 20 °C and the slope of the straight line yields the molar heat capacity change for
the association reaction as 0pC∆ = -2.76 kJ mol-1K-1 (-0.66 kcal mol-1K-1). Apo A-I
self-association is thermodynamically similar to the partitioning of hydrophobic
substances between water and an organic phase [64]. The enthalpy of dissolving
hydrophobic substances such as hexane in water is close to zero at room temperature
while the heat capacity increment for the transfer from water into pure organic phase is
large and negative. Apo A-I self-association paralleled this behavior, as the enthalpy of
Apo A-I self-association was zero at room temperature and the heat capacity change
strongly negative. Calorimetric experiments at 15-30 °C were not feasible because 0aH∆
~ 0 kcal/mol.
Apo A-I dissociation as measured by ITC was analyzed with the cooperative
association model. The result is shown in Fig. 1B (solid line) which simulates the
dilution measurement at 40 °C and was calculated with an association constant Ka = 3.5
× 105 M-1, a nucleation factor σ = 0.003 and a maximum association number n = 8. An
excellent fit between theory and experiment was obtained.
The cooperative model was further applied to investigate the influence of the
association number 'n' on the quality of the simulation. A minimum of n = 6 was
required to generate a good fit of the ITC data over the whole temperature range. An
increase in n from 6 to 20 provided simulations of similar quality, but reduced the
values of the nucleation parameter σ and the association constant Ka. At n = 20 a
'plateau' was reached where an increase in n had no further effect on σ or Ka. However,
analytical ultracentrifugation data discussed below argue against an association number
larger than n = 8.
2. Thermodynamics of protein self-association and unfolding
28 | P a g e
Fig. 2B shows the temperature dependence of the Apo A-I association constant Ka
(addition of a monomer to an existing complex) for n = 8. The solid line is the predicted
temperature dependence of Ka calculated with the van't Hoff equation and a
temperature-dependent 0aH∆ (Fig. 2A). The simulations also showed that a nucleation
parameter σ << 1 was essential for the correct interpretation of the experimental data.
Initial dimer formation is thermodynamically less favored than the addition of
monomers to an existing complex.
As an alternative model we also evaluated the all-or-none model. A fit of the ITC
data was possible with n = 6. However, the model assumes only monomers and
hexamers without intermediates, is kinetically impossible, and disagrees with the results
of analytical ultracentrifugation.
Analytical ultracentrifugation (AUC) analysis of Apo A-I self-association.
Previous studies on Apo A-I self-association used AUC measurements of serum-
purified Apo A-I [61, 65]. We therefore compared the recombinant Apo A-I (with two
additional C-terminal glycines) used in this study with serum-purified Apo A-I also
using AUC. Fig. 3A shows sedimentation equilibrium runs at 6, 8 and 10 krpm for
recombinant Apo A-I (160 μM) in PBS buffer. The protein concentration increases with
increasing radius r, and thus each point in the concentration, c, vs. radius, r, profile
corresponds to a different equilibrium between monomers and Apo A-I complexes.
Quantitative analysis is possible by calculating both the total Apo A-I concentration at a
given radius r and the slope of the ln(c) vs. r2 curve at the same position. We determined
local slopes of the ln(c) vs. r2 function by linearization of 8-10 consecutive data points,
computing the slope of this linearized interval, and then shifting the interval to the next

2. Thermodynamics of protein self-association and unfolding
29 | P a g e
data point. Figure 3B shows the apparent molecular mass, Mapp, as a function of the
corresponding total Apo A-I concentration. We assumed that monomeric and
oligomeric Apo A-I molecules have the same specific optical absorption at 280 nm.
Figure 3B summarizes data obtained for Apo A-I solutions at initial concentrations of 3,
40, and 160 μM measured at 6 different rotor speeds between 4 krpm to 15 krpm. Data
scatter is considerable but the semi-logarithmic plot clearly shows a horizontal lag
phase up to ~3 μM where no association occurs and where Mapp is identical to the
molecular mass of monomeric Apo A-I. Above 3 μM Mapp increases sigmoidially. The
solid line in Fig. 3B corresponds to the best fit using the cooperative model with Ka =
3.5 × 10⁵ M-1, n = 8, and σ = 0.003. Calorimetric measurements yielded Ka = 5.6 × 10⁵
M-1at 20 °C (represented by the dahsed line in Fig. 3B) indicating a good agreement
between AUC and ITC. The nucleation parameter σ determines the length of the
monomeric lag phase as well as the steepness of the transition curve.
Figure 3C compares recombinant Apo A-I with Apo A-I purified from blood
serum. It shows the degree of dissociation, α, as determined by AUC measurements at
20 °C and 37 °C.
Figure 3
The data allow two conclusions. (i) Recombinant and serum-derived Apo A-I yield
identical results within experimental error. (ii) The AUC data can be described
quantitatively by the cooperative association model as displayed by the solid lines in
Fig. 3C. At 37 °C the simulation yielded Ka = 4 × 10⁵ M-1, σ = 0.003, n = 8 which
agrees perfectly with the ITC data. At 20 °C the AUC data predicted Ka = 8 × 10⁵ M-1
which was slightly higher than expected on the basis of ITC measurements.
2. Thermodynamics of protein self-association and unfolding
30 | P a g e
Differential scanning calorimetry (DSC) analysis of Apo A-I unfolding. The
thermodynamics of Apo A-I unfolding was quantified by measuring dilute solutions of
Apo A-I with differential scanning calorimetry. Fig. 4 shows the melting curves for Apo
A-I concentrations from 0.5 to 4.5 mg/mL. The maximum of the molar heat capacity
occurred at T0 = 52.6 °C for all three samples and was independent of protein
concentration. The heat of transition, UNH∆ , was 422 kJ/mol (101 kcal/mol) and was
also independent of the protein concentration, at least at 70.9 µM and 160 µM as the
DSC scans were superimposable within experimental error. DSC scans were fully
reversible if heating did not exceed 75 °C. Previous work on Apo A-I yielded DSC
maxima between 57 and 63 °C and melting enthalpies between 58 to 200 kcal/mol [44,
45, 66]. The differences may be caused by differences in protein preparations and salt
conditions and also by neglecting the difference between initial and final Cp values. (In
differential scanning calorimetry the sharpness of a transition is an indicator of the
purity of the substance, the homogeneity of the probe, and the cooperativity of the
transition. The recombinant Apo A-1 (with 2 additional C- terminal glycines) used here
yielded the sharpest transition compared to all published DSC data on Apo A-I. A
survey of DSC data on Apo A-I of different origin reveals a complex situation.
Unfolding curves composed of three consecutive non-two state transitions [44, 45], two
consecutive two-state transitions [66] or just one broad transition [51] were reported.
Likewise, the unfolding enthalpy U 0NH∆ was 200 kcal/mol [44], 48 kcal/mol ([45],
main peak), 84 kcal/mol [66], and estimated 200 kcal/mol [51]. The width of the
melting curve at half-height was 14.3 °C in the present measurements, but ranged from
14 °C ([45], main peak) over 20 °C [66], 22 °C [45] to 25 °C [51]. In the latter case [51]

2. Thermodynamics of protein self-association and unfolding
31 | P a g e
the MALDI mass of the recombinant wild-type Apo A-1 is given as 29798 Da which is
1719 Da (ca. 14 amino acids) larger than the authentic human Apo A-1. This could
explain the differences observed in association behavior and differential scanning
calorimetry between the present study and reference [51].)
As Apo A-I unfolding was independent of protein concentration above 17 μM, the
association process described in the previous section did not influence unfolding. This is
discussed below in the context of a quantitative comparison of the two different
equilibria.
Figure 4
A general problem in evaluating DSC thermograms is the definition of the
baseline [67]. In the present studies the baseline was defined by the linear part of the
calorimetric scan at low temperature and was extrapolated beyond the main transition as
shown in detail in Fig. 5. This appeared to be justified as it led to constant Cp values
before and after the transition. The difference between the two linear parts is the molar
heat capacity change UN pC∆ = 5.0 kJ/molK (1.2 kcal/molK). A change in U
N pC∆ was not
reported in the earlier DSC experiments [44, 45, 51, 66]. However UN pC∆ changes of
several kJ/molK are found for other proteins (e.g. T4 Lysozyme, 164 aa, UN pC∆ = 5.1
kJ/molK [68], human growth hormone, 192 aa, UN pC∆ = 8 kJ/molK [69].
Figure 5

2. Thermodynamics of protein self-association and unfolding
32 | P a g e
Knowledge of UN pC∆ provides insight into the molecular nature of Apo A-I
unfolding. At low temperatures (T ≤ 20 °C) amide hydrogens are well protected by
hydrogen bonds in the native protein structure. This is true whether the site in question
is deeply buried or at the solvent-exposed surface [70]. Hydrogen-deuterium exchange
was thus used to determine the α-helical segments of Apo A-I [70]. Thermal unfolding
of Apo A-I increases the molecular fluctuations and H-bonds are transiently broken and
brought in contact with solvent. While the increase in heat capacity is generally
assigned to the exposure of apolar groups, a systematic study on cyclic peptides led to
the conclusion: "The large apolar contribution suggests that a liquid hydrocarbon model
of the hydrophobic effect does not accurately represent the apolar contribution to ΔH0
of denaturation. Rather, significant enthalpic stabilizing contributions are found to arise
from peptide groups (hydrogen bonding)" [71]. The heat capacity change upon water
exposure of a single amide group has been estimated as UN pC∆ = 60 ± 6 Jmol-1K-1 [71].
The increase of UN pC∆ = 5.0 ± 0.5 kJ mol-1K-1 (1.22 kcal/molK) observed for Apo A-I
could thus be caused by the exposure of about 83 amino acids, in agreement with the
CD spectroscopy results to be discussed below.
Figure 5 shows the temperature-dependence of the heat capacity and compares the
experimental data with the predictions of cooperative model (fig. 5A) and the N U
two-state model (fig. 5B). An improved fit of figure 5B could be obtained by
superimposing several N U two-state transitions. 2 or 3 N U two-state transitions
were combined to simulate previous experimental DSC data as discussed above. The
increase in the molar heat capacity between the fully folded and the unfolded protein
was not considered in these earlier analyses.
2. Thermodynamics of protein self-association and unfolding
33 | P a g e
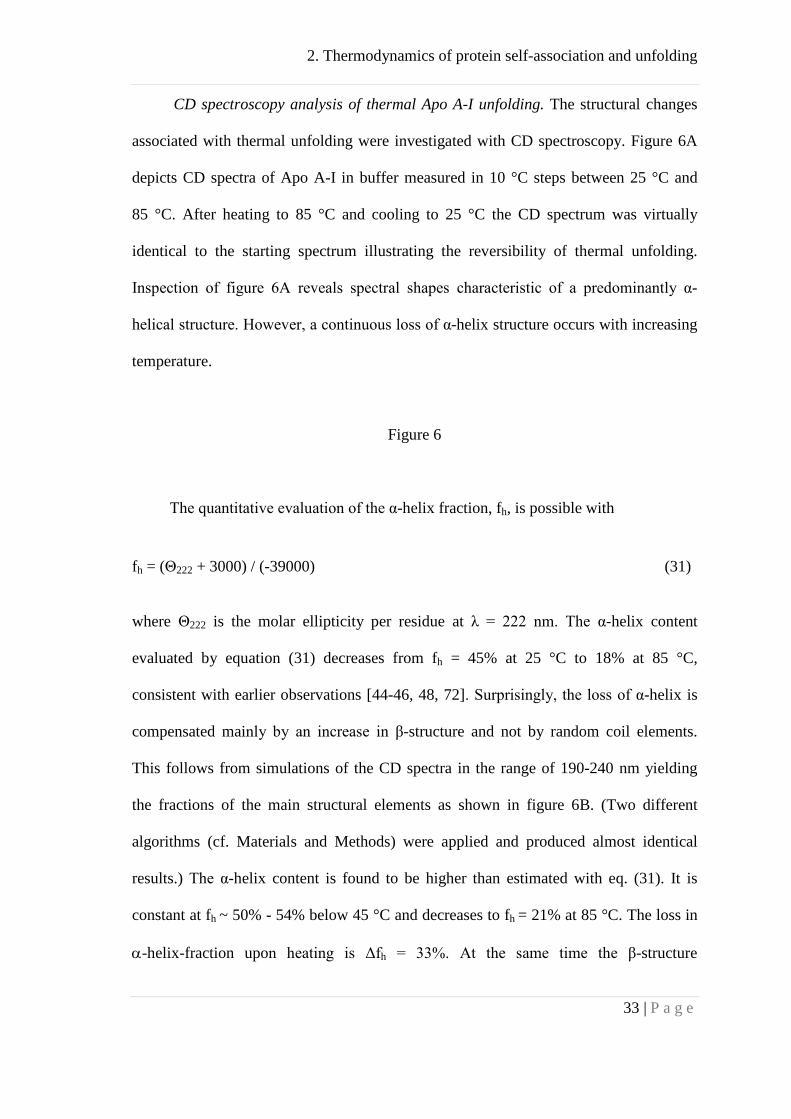
CD spectroscopy analysis of thermal Apo A-I unfolding. The structural changes
associated with thermal unfolding were investigated with CD spectroscopy. Figure 6A
depicts CD spectra of Apo A-I in buffer measured in 10 °C steps between 25 °C and
85 °C. After heating to 85 °C and cooling to 25 °C the CD spectrum was virtually
identical to the starting spectrum illustrating the reversibility of thermal unfolding.
Inspection of figure 6A reveals spectral shapes characteristic of a predominantly α-
helical structure. However, a continuous loss of α-helix structure occurs with increasing
temperature.
Figure 6
The quantitative evaluation of the α-helix fraction, fh, is possible with
fh = (Θ222 + 3000) / (-39000) (31)
where Θ222 is the molar ellipticity per residue at λ = 222 nm. The α-helix content
evaluated by equation (31) decreases from fh = 45% at 25 °C to 18% at 85 °C,
consistent with earlier observations [44-46, 48, 72]. Surprisingly, the loss of α-helix is
compensated mainly by an increase in β-structure and not by random coil elements.
This follows from simulations of the CD spectra in the range of 190-240 nm yielding
the fractions of the main structural elements as shown in figure 6B. (Two different
algorithms (cf. Materials and Methods) were applied and produced almost identical
results.) The α-helix content is found to be higher than estimated with eq. (31). It is
constant at fh ~ 50% - 54% below 45 °C and decreases to fh = 21% at 85 °C. The loss in
α-helix-fraction upon heating is Δfh = 33%. At the same time the β-structure
2. Thermodynamics of protein self-association and unfolding
34 | P a g e
contribution rises from 26% to 50% which has escaped notice in previous studies. The
percentage of random coil segments increases modestly from 19% to 28%. The CD
spectral simulations show that (i) the melting of Apo A-I is a multi-state process and (ii)
the spectroscopic change of Δfh = 33% corresponds to the loss of (243 + 2) × 0.33 = 81
helical segments. This result is in excellent agreement with the thermodynamic analysis
given above (i.e. 83 helical segments) based on the change of the molar heat capacity
UN pC∆ . The solid line through the α-helix data is the prediction of the Zimm-Bragg
model.
Hydrogen bond enthalpy in a β-structure is much lower than that in an α-helix.
For the membrane-binding peptide (KIGAKI)3, composed of 18 amino acids, hβ is 0.96
kJ/mol (0.26 kcal/mol) for breaking a hydrogen bond in long stretches (n ≥ 18) of β-
structure [73]. For shorter arrays of β-structure, hβ can be 0 kJ/mol or be even slightly
negative [74]. Thus from a thermodynamic point of view the α-helix β-structure
transition can be similar or identical to the α-helix random coil transition, and β- and
random coil-elements will be considered as thermodynamically equivalent in the present
context. Significant differences between the enthalpies of β- and rc-segment formation
should be reflected in the parameters of the Zimm-Bragg theory. However, for Apo A-I,
and other proteins which we investigated, the enthalpy of helix disruption (h-value used
in eq. (6)) was always in the range of 800 cal/mol to 1300 cal/mol.
As an aside it should be noted that a plot of the λ = 222 nm ellipticity versus
temperature (data of figure 6A) has its midpoint at 61 °C which is 8 °C higher than T0
of the caloric transition. The discrepancy between CD spectroscopy and DSC is also
obvious from inspection of figure 6B. CD spectroscopy monitors changes of the
secondary structure only, while DSC includes also the melting of the tertiary structure.
2. Thermodynamics of protein self-association and unfolding
35 | P a g e
Discussion
The present analysis is of general relevance for the understanding of the
thermodynamic behavior of oligomeric systems. Our experimental and theoretical
results shed light on two different problems, that is, the thermodynamics of (i) unfolding
an α-helical protein and (ii) the temperature- and concentration-dependence of a
monomer oligomer equilibrium. Cooperativity was found to play an essential role in
both processes. The Zimm-Bragg theory was introduced as an alternative to the classical
N U two-state model for a consistent analysis of calorimetric and spectroscopic data
on Apo A-I unfolding. The isodesmic self-association model was employed to describe
the oligomerization of Apo A-I. The free energy for the addition of a monomer to any
oligomer was assumed to be constant but the initial dimerization was less favorable by
the nucleation factor σ, introducing cooperativity. Maximum self-association occurred
at 21 °C whereas the mid-point of unfolding was at 52.6 °C. The measured heat of
unfolding was ca. 100 kcal/mol and by a factor 5-10 larger than the heat of self-
association. The unfolding enthalpy was independent of concentration up to 160 μM. In
the following we compare the temperature course of unfolding with that of Apo A-I
dissociation. We provide a model calculation for the temperature- and concentration-
depencence of 0pC for a cooperative monomer oligomer equilibrium.
Thermodynamics of Apo A-I unfolding. Crystal structure [42] and protein
sequence analysis [75] predict that the Apo A-I region between residues 44 and 241 is
largely α-helical. The 2.2 Å crystal structure of C-terminal truncated Apo A-I (184 N-
terminal residues) reveals an approximate half-circle (80% helix) with the N-terminal

2. Thermodynamics of protein self-association and unfolding
36 | P a g e
arranged in a loose bundle composed of four helices and an extended segment [42].
Unfolding of Apo A-I corresponds essentially to a disruption of α-helical regions and, to
a minor extent, to the unfolding of the four-helix tertiary structure. As a new approach
we describe the Apo A-I unfolding with the cooperative Zimm-Bragg theory. Figure 5A
compares the experimental DSC scan with the prediction of the cooperative h β, rc
model. The parameters used were: H-bond stability h = 4.6 kJ/mol (1100 cal/mol),
nucleation factor σ = 4.4 × 10⁻⁵, T1 = 339.7 °K and n = 85. The predicted mid-point
temperature for this short α-helix was T0 = 325.6 °K, in agreement with the maximum
of the measured pC vs. T curve. Attempts to simulate the DSC curves with distinctly
shorter chain lengths than n = 85 were unsuccessful as the width of the transition region
became too broad. Hydrogen exchange experiments indicate long stretches of α-helix
secondary structure between Apo A-1 residues 7 and 115 with a total of 95 α-helical
residues [70]. It is the unfolding of this region which is most likely monitored in the
DSC experiment. A second α-helical region of 32 residues is found at positions 147 –
178 [70]. As Apo A-1 has an α-helical content of 18% even at 85 °C (corresponding to
ca. 40 residues) this α-helix could account for the residual ellipticity observed in CD-
spectroscopy (cf. figure 6).
The enthalpy per hydrogen bond can also be derived directly from the transition
enthalpy without resorting to a particular model. As the unfolding enthalpy is UNH∆ =
422 kJ/mol (101 kcal/mol) and as CD spectroscopy suggests that ~85 segments are
involved in the transition, an α-helix stability of h = 422/85 ≈ 5.0 kJ/mol (1188 cal/mol)
can be estimated, in good agreement with the value used in Zimm-Bragg theory.
Figure 5B displays the related calculations with the N U model. The
experimental transition temperature was T0 = 325.6 K, as defined by the maximum of

2. Thermodynamics of protein self-association and unfolding
37 | P a g e
the Cp curve. The unfolding enthalpy UNH∆ required for an optimum fit was 285 kJ/mol
(68.2 kcal/mol). This value is much lower than the experimental result of 422 kJ/mol
(101 kcal/mol). The N U model also predicts a sharper transition than observed
experimentally.
The theoretical transition enthalpy characterizing the two-state N U equilibrium
is often denoted with van't Hoff enthalpy, ΔHvH, and derived from CD-measurements.
For Apo A-I ΔHvH is much smaller than the calorimetric transition enthalpy, U 0NH∆ ,
and the ratio U 0vH NH / H 1∆ ∆ < is considered to reflect the low cooperativity of the Apo
A-I unfolding [44, 45, 66]. In contrast, a high cooperativity index ncoop = 7.8 was
defined by applying the Hill equation to describe the sigmoidicity of the thermal
denaturation curve [46]. The Zimm-Bragg theory finally describes cooperativity in
terms of the steepness of the transition curve. The smaller the nucleation parameter σ
and the larger the number of hydrogen bonds to be broken, the more cooperative is the
transition and the steeper the transition curve. In terms of the Zimm-Bragg theory Apo
A-I unfolding is a highly cooperative process.
Thermodynamics of Apo A-I self-association and monomer-oligomer
probabilities. Both AUC and ITC demonstrate that self-association of Apo A-I is a
concentration-dependent process. Fig. 3B indicated that Apo A-I is monomeric below
~3 μM and self-associates at higher concentrations. The cooperative association model
with n = 8 and σ = 0.003 gave the best fit to both the ITC and AUC data. Knowledge of
Ka as deduced from the dissociation isotherm permits the calculation of the free energy,
0aG∆ , and entropy 0
aT S∆ (see Table 1). At room temperature the enthalpy of
2. Thermodynamics of protein self-association and unfolding
38 | P a g e
association, 0aH∆ , is close to zero while the Gibbs free energy, 0
aG∆ , is large and
negative. This means that the entropy of association is large and positive and is the
driving force for the association at temperatures below 20 °C. As the temperature
increases, the reaction becomes exothermic and the contribution of entropy gradually
decreases.
The Apo A-I solution contains states of oligomerization 1, 2, ..,j. The probability
of their occurrence can be calculated with the partition function Q. If pj is defined as the
probability of j-mers in solution, i.e. the number of oligomers of size j divided by the
total number of species in solution, then
jj
jj
np
n=∑
(32)
For the cooperative model one finds
p1 = Q-1 and ( ) j 1j a Ap K c / Q−= σ (33)
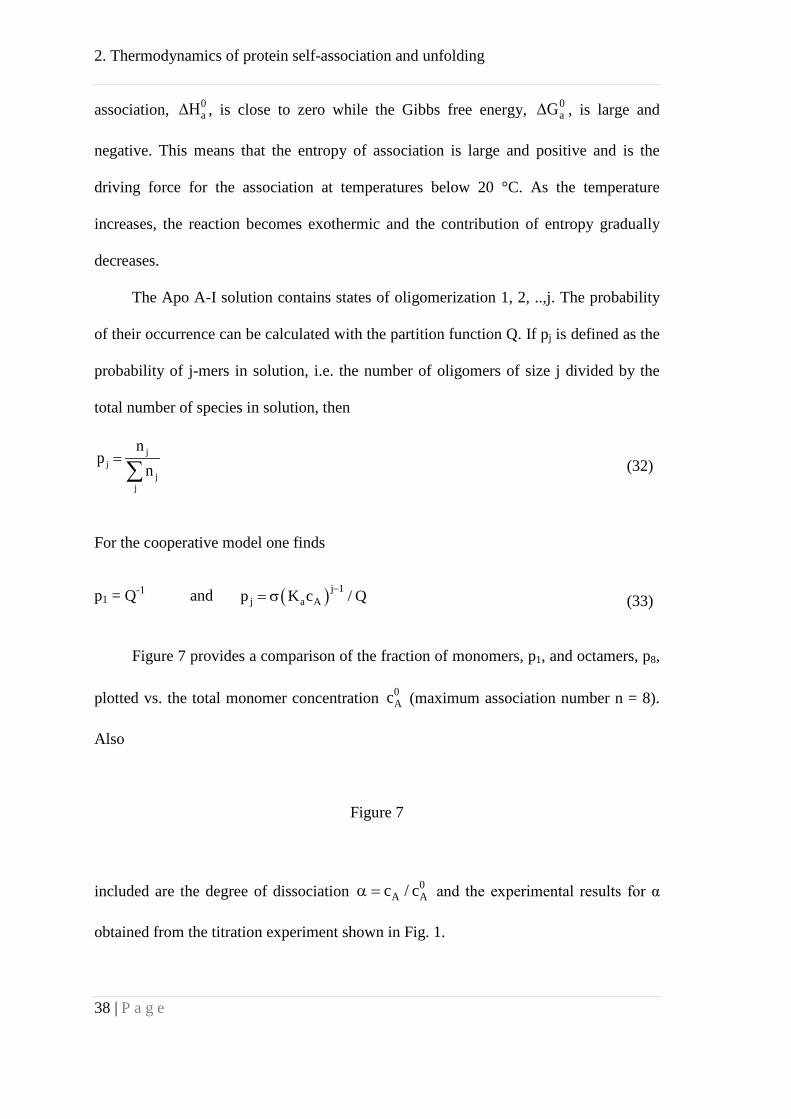
Figure 7 provides a comparison of the fraction of monomers, p1, and octamers, p8,
plotted vs. the total monomer concentration 0Ac (maximum association number n = 8).
Also
Figure 7
included are the degree of dissociation 0A Ac / cα = and the experimental results for α
obtained from the titration experiment shown in Fig. 1.
2. Thermodynamics of protein self-association and unfolding
39 | P a g e
Figure 7 reveals that the degree of dissociation, α, decreases faster than the
monomer probability, p1. This follows because only one A8 molecule is generated when
eight monomers associate, and the loss of monomers thus proceeds faster than the
growth in the number of oligomers. Monomers and octamers are the predominant
species in solution. However, the sum p1 + p8 goes through a minimum at a total Apo
A-I concentration of ca. 6.7 × 10⁻⁴ M, with monomers and octamers accounting for only
70% of the total species. This indicates that the solution contains additional
intermediates.
Earlier studies on Apo A-I self-association primarily relied on AUC
measurements where a monomer-dimer-tetramer-octamer model was assumed [61, 62].
Separate association constants were defined for each association step. However, when
applied to the present ITC data, this model did not provide satisfactory quantitative
results.
Apo A-I association has also been reported in terms of an 'apparent molecular
weight' [65]. Mapp can be calculated in the present notation as
nA
app j Wj 1
M jp M=
= ⋅∑ (34)
AWM is the molecular mass of the Apo A-I monomer. Eq. (34) was used to simulate the
data in Fig. 3B. Excellent agreement with the ITC experiments was obtained.
We have also analyzed previous Mapp results for Apo A-I with the cooperative model
discussed above. For example, simulating the Mapp data given in reference [65] (figure
2, 0.13 M KCl) with the cooperative model required σ = 0.003 and K = 6 × 10⁵ M-1 for
n = 8. These are exactly the values predicted by the present ITC experiments for the
self-association at 20 °C.
2. Thermodynamics of protein self-association and unfolding
40 | P a g e
Apo A-I unfolding vs. Apo A-I dissociation. Protein association and denaturation
can be tightly connected processes as demonstrated for a 54 amino acid fragment of
GCN4 [76]. Increasing the protein concentration by a factor of 100 in this example
shifts the midpoint of the unfolding transition by about 20 °C towards higher
temperatures. In contrast, Apo A-I unfolding was independent of the protein
concentration (up to 160 μM). Self-association reached its maximum at 21 °C and
decreased both at lower and higher temperatures, while Apo A-I unfolding had its
maximum change in the heat capacity (midpoint of unfolding transition) at 52.6 °C.
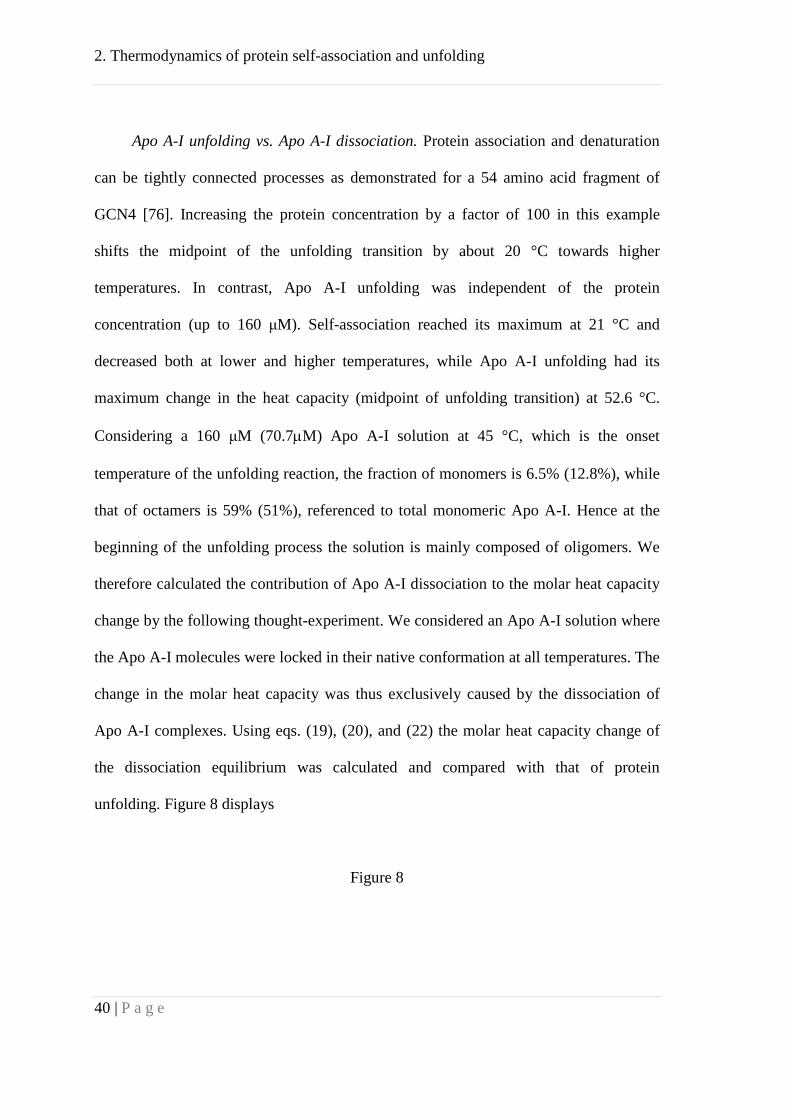
Considering a 160 μM (70.7µM) Apo A-I solution at 45 °C, which is the onset
temperature of the unfolding reaction, the fraction of monomers is 6.5% (12.8%), while
that of octamers is 59% (51%), referenced to total monomeric Apo A-I. Hence at the
beginning of the unfolding process the solution is mainly composed of oligomers. We
therefore calculated the contribution of Apo A-I dissociation to the molar heat capacity
change by the following thought-experiment. We considered an Apo A-I solution where
the Apo A-I molecules were locked in their native conformation at all temperatures. The
change in the molar heat capacity was thus exclusively caused by the dissociation of
Apo A-I complexes. Using eqs. (19), (20), and (22) the molar heat capacity change of
the dissociation equilibrium was calculated and compared with that of protein
unfolding. Figure 8 displays
Figure 8
2. Thermodynamics of protein self-association and unfolding
41 | P a g e
such calculations for three protein concentrations. As expected the heat capacity of the
dissociation equilibrium depended on the total Apo A-I concentration, 0Ac . The
maximum of the molar heat capacity shifted from 55 °C at 17 μM Apo A-I to 72 °C at
160 μM while the width of the transition was reduced. The predicted molar heat
capacity was 3.7 kJ/molK (1.98 kJ/molK) for 70 μM (160 μM) Apo A-I at 53 °C which
was much smaller than the molar heat capacity at the Cp maximum of the unfolding
reaction of 0pC = 24.6 kJ/molK. Figure 8 predicts that the dissociation of virtual, folded
Apo A-I complexes should occur at temperatures higher than that of Apo A-I unfolding.
An additional transition peak should appear in the Cp vs. T diagram. As this was not
observed experimentally it is safe to conclude that Apo A-I unfolding and dissociation
occur simultaneously. This is consistent with the observed concentration-independence
of the unfolding transition. As the heat capacity change of the dissociation reaction
makes only a small contribution (figure 8), the calorimetric UNH∆ is dominated by the
unfolding of secondary structural elements.
Concluding Remarks. We showed that protein self-association can be readily
analyzed by the method of binding partition functions. This approach allowed
comparison of different association models and provided analytic expressions to
analyze experimental AUC and ITC results. The thermodynamic parameters of Apo A-I
self-association are quite similar to those of other, more specific, protein-protein
interactions. For example, the interaction of stathmin, a 17 kDa protein, with tubulin
(~55 kDa) was investigated with ITC [77]. Similar to the present results the binding
constants of the binary complex were 106 - 107 M-1. Likewise, ΔH0 was also
endothermic at low temperatures and attained zero values at 28 °C. The fact that some

2. Thermodynamics of protein self-association and unfolding
42 | P a g e
biological systems have very small reaction enthalpies at ambient temperature
demonstrates that they minimize the temperature sensitivity of the corresponding
chemical equilibria, leading to temperature-independent concentrations of the involved
proteins. Another example supporting this conclusion is apolipoprotein C-1 showing a
maximum of self-association at room temperature which is also reduced upon heating or
cooling [78].
We further showed that the cooperative Zimm-Bragg model provided an accurate
description of Apo A-I unfolding and should be considered as an alternative to the
common two-state N U model, at least for proteins with a high α-helix content. For
comparison, we analyzed experimental DSC results for a 22-kDa (N-terminal) fragment
of Apo E2 which is about 50% α-helical at 20 °C ([79], Fig.1). An excellent fit of the
DSC curve was obtained with h = 5.02 kJ/mol (1200 cal/mol) and σ = 3 × 10⁻⁵,
parameters very similar to those of Apo A-I. As a second example we analyzed the
calorimetric trace of a 50-residue peptide (figure 3 in reference [57]) with the Zimm-
Bragg model and again obtained excellent agreement with experimental values using h
= 930 cal/mol and σ = 4 × 10⁻³. These results are consistent with a follow-up study of
the same peptide with CD-spectroscopy resulting in h = 960 ± 20 cal/mol and σ = (2.9 ±
0.3)× 10-3 [80]. Application of the N U model completely failed for this 50-residue
peptide.
Acknowledgement
We are indebted to Dr. Francis Müller and Eric André Kusznir, Roche, for
providing the AUC data for figure 3C. We are grateful to Howard Etlinger for carefully
reading the manuscript and valuable comments.

2. Thermodynamics of protein self-association and unfolding
43 | P a g e
Legends to figures
Figure 1: Dissociation reaction of Apo A-I measured with isothermal titration
calorimetry (ITC).
(A) Heat flow. A 160 μM solution of Apo A-I in PBS buffer (138 mM NaCl, 10
mM sodium phosphate, pH 7.4, 0.02 % NaN3) was injected at 2 μL aliquots into the
calorimeter cell (Vcell = 0.2 mL) containing only buffer. The heat of reaction, δhi, arises
from the dissociation reaction of Apo A-I oligomers as each injection corresponds to a
ca. hundred-fold dilution of protein concentration. The measurement was made at
40 °C. At room temperature the heat of dissociation is close to zero and the
disassociation reaction is not detectable by ITC.
(B) Integrated heats of reaction, δhi, as a function of injection number. The solid
line shows the theoretical analysis based on the cooperative association model.
Maximum association number n = 8, association constant Ka (40 °C) = 3.5 × 10⁵ M-1, σ
= 0.003, measured heat of dissociation ΔH = 49.1 kJ/mol (11.74 kcal/mol). The
corrected heat of dissociation was 51.3 kJ/mol (12.3 kcal/mol) as the starting solution
contained 4.4% monomers.
Figure 2: Thermodynamic parameters of Apo A-I self-association.
(A) Enthalpy, 0aH∆ , of Apo A-I self-association as determined with isothermal
titration calorimetry.
(B) Temperature-dependence of the association constant Ka. Ka was calculated by
fitting the dilution isotherms of the calorimetric titration experiments with the
cooperative association model using n = 8 and σ = 0.003. The solid line predicts the

2. Thermodynamics of protein self-association and unfolding
44 | P a g e
temperature dependence of Ka by combining the van't Hoff equation with the
temperature-dependent 0aH∆ of fig. 2A.
Figure 3: Apo A-I self-association measured with analytical ultracentrifugation (AUC).
(A) Sedimentation equilibrium experiments. Apo A-I at a concentration of 160
μM in PBS buffer was centrifuged for 96 hrs at 6 krpm (black line) , 8 krpm (red) and
10 krpm (blue) at 20 0C.
(B) Apparent molecular mass, Mapp, as a function of total Apo A-I concentration.
3 concentrations were simultaneously measured. 3 μM (blue data points, cuvette size 12
mm); 40 μM (green data points, cuvette size 3 mm); 160 μM (red data points, cuvette
size 1.4 mm). Measurements at 6 krpm (■), 8 krpm (▲), 10 krpm (♦), 12 krpm (●) and
15 krpm (). Analyses were limited to a maximum optical density of OD = 2. The solid
line was calculated with the cooperative association model using n = 8, σ = 0.003, Ka =
3.5 × 10⁵ M-1. The dashed line corresponds to Ka = 5.6 × 10⁵ M-1 predicted by ITC at
20 °C.
(C) Degree of dissociation, α, as a function of total protein concentration.
Recombinant Apo A-I (■) is compared with serum-purified Apo A-I (♦). Measurements
were made at 20 °C (blue points) and 37 °C (red points). The solid lines are the
predictions of the cooperative association model with n = 8, σ = 0.003, and Ka = 4.0 ×
105 M-1 (37 °C, red line) or Ka = 8 × 10⁵ M-1 (20 °C, blue line).
Figure 4: Differential scanning calorimetry (DSC) of recombinant Apo A-I.
Apo A-I unfolding reaction measured at 17.7, 70.9 and 160 μM. The transition
maximum occurred at 52 - 53 °C and was concentration independent. The normalized

2. Thermodynamics of protein self-association and unfolding
45 | P a g e
DSC scans at 70.9 and 160 μM are superimposable. The heating rate was 1 °C/min. All
measurements were made in buffer (10 mM sodium phosphate, 138 mM NaCl, pH 7.4,
0.02% NaN3). The measurement at 17.7 μM was at the limit of sensitivity and could not
be used for an evaluation of unfolding enthalpy.
Figure 5: Interpretation of Apo A-I thermal unfolding comparing two models.
The experimental result (black line) is the DSC scan of a 160 μM Apo A-I
solution in PBS buffer measured at a heating rate of 1 °C/min. (A) Zimm-Bragg model
(red line) using σ = 4.4 × 10⁻⁵, h = 1100 cal/mol, n = 85, U 0N pC∆ = 5.0 kJ/mol. Predicted
T0 = 325.6 K. The midpoint of the h → β, rc transition of an infinitely long α-helix is at
T1 = 339.7 K.
(B) N U 2 two-state model (red line) using UNH∆ = 285 kJ/mol (68.2 kcal/mol),
U 0N pC∆ = 5.0 kJ/mol, and T0 = 325.6 K
Figure 6: Thermal unfolding analysis of recombinant Apo A-I by CD spectroscopy.
(A) Far-UV-CD spectra of Apo A-I for temperatures between 25 °C (black line)
to 85 °C (blue line) recorded at 10 °C steps. Apo A-I concentration was 0.5 mg/mL
(17.7 μM) in buffer (100 mM NaF, 10 mM sodium phosphate, pH 7.4). Measurements
at a lower concentration of 0.1 mg/mL (3.6 μM) yielded similar spectra in the range of
25 - 65 °C.
(B) Deconvolution of the CD spectra in terms of 3 structural elements. (■) α-
helix, (●) β-sheet, (♦) random coil. The β-turn element is not shown as it was always
close to zero. Figure 6 demonstrates that the loss in α-helix content is mostly
compensated by an increase in β-structure. The solid line is the predicted α-helix
2. Thermodynamics of protein self-association and unfolding
46 | P a g e
content as calculated with the Zimm-Bragg theory using a nucleation parameter σ = 4.4
× 10-5, a hydrogen bond enthalpy per helix residue of h = 1100 cal/mol, and n =85 as
deduced from the DSC and CD unfolding experiments.
Figure 7: Self-association of Apo A-I. Probabilities of monomers and octamers.
(■) Apo A-I degree of dissociation, α, as derived from the ITC experiment shown
in figure 1. Solid lines: predicted probabilities (mole fractions) of monomers, p1, and
octamers, p8, as a function of the total protein monomer concentration, 0Ac , at 40°C .
Calculations with the cooperative association model σ = 0.003, Ka = 3.5 × 10⁵ M-1,
maximum association number n = 8.
Figure 8: Computed DSC scans for a solution containing virtual Apo A-I oligomers
which dissociate but remain folded.
Three different protein concentrations were compared. The melting curves were
calculated with the cooperative association model. The temperature dependence of the
association constant was ΔHa (kcal/mol) = -0.659 (T-273) + 13.288 and the association
constant at 273 K was 3.5 × 10⁵ M-1. The temperature dependence of Ka was identical to
that in figure 5B. The maximum association number is n = 8 and the cooperativity
parameter σ = 0.003. Blue line: 17.7 μM, red line 70.7 μM, magenta line 160 μM.
A) Molar heat capacity change, 0pC . The maximum of the dissociation reaction
shifts to higher temperatures with increasing protein concentration. B) Degree of
dissociation, α

2. Thermodynamics of protein self-association and unfolding
47 | P a g e
Table 1
Thermodynamic parameters of Apo A-I self-association equilibrium calculated with the
cooperative association model
Maximum association number N = 8
Tem
p cApo A-I ΔH a)
0aH∆ b) σ Ka
0aG∆ 0
aT S∆
C μM kcal/mol kcal/mol M-1 kcal/mol kcal/mol
5 160 -7.7 8.14 0.003 2.8E+05 -6.90 15.04
5 160 -8.51 9.03 0.003 2.6E+05 -6.86 15.89
10 160 -6.95 7.19 0.003 4.8E+05 -7.33 14.52
10 160 -7.03 7.31 0.003 4.0E+05 -7.23 14.55
35 160 7.34 -7.59 0.003 4.9E+05 -7.99 0.40
40 80 9.22 -10.1 0.003 3.3E+05 -7.87 -2.20
40 160 11.74 -12.3 0.003 3.5E+05 -7.91 -4.37
45 160 18.5 -19.8 0.003 2.4E+05 -7.80 -11.99
a) ΔH = heat of dissociation as measured in the calorimetric experiment. While the
precision of an individual calorimetric measurement is high (± 0.2 kcal/mol) the
reproducibility is determined by different factors and is of the order of ± 1.3 kcal/mol.
b) 0aH∆ is the enthalpy of protein association, 0
aH∆ = -ΔH/(1-α), where α is the fraction
of monomers in the starting solution.

2. Thermodynamics of protein self-association and unfolding
48 | P a g e
References
1. Segrest, J. P., Li, L., Anantharamaiah, G. M., Harvey, S. C., Liadaki, K. N., and
Zannis, V. (2000) Structure and function of apolipoprotein A-I and high-density
lipoprotein, Curr Opin Lipidol 11, 105-115.
2. Frank, P. G., and Marcel, Y. L. (2000) Apolipoprotein A-I: structure-function
relationships, J Lipid Res 41, 853-872.
3. Mei, X., and Atkinson, D. (2011) Crystal structure of C-terminal truncated
apolipoprotein A-I reveals the assembly of high density lipoprotein (HDL) by
dimerization, J Biol Chem 286, 38570-38582.
4. Borhani, D. W., Rogers, D. P., Engler, J. A., and Brouillette, C. G. (1997)
Crystal structure of truncated human apolipoprotein A-I suggests a lipid-bound
conformation, Proc Natl Acad Sci U S A 94, 12291-12296.
5. Gursky, O., and Atkinson, D. (1996) Thermal unfolding of human high-density
apolipoprotein A-1: Implications for a lipid-free molten globular state, Proc Natl
Acad Sci USA 93, 2991-2995.
6. Suurkuusk, M., and Hallen, D. (1999) Denaturation of apolipoprotein A-I and
the monomer form of apolipoprotein A-IMilano, Eur J Biochem 265, 346-352.
7. Saito, H., Dhanasekaran, P., Nguyen, D., Holvoet, P., Lund-Katz, S., and
Phillips, M. C. (2003) Domain structure and lipid interaction in human
apolipoproteins A-I and E, a general model, J Biol Chem 278, 23227-23232.
8. Silva, R. A., Hilliard, G. M., Fang, J., Macha, S., and Davidson, W. S. (2005) A
three-dimensional molecular model of lipid-free apolipoprotein A-I determined
2. Thermodynamics of protein self-association and unfolding
49 | P a g e
by cross-linking/mass spectrometry and sequence threading, Biochemistry 44,
2759-2769.
9. Arnulphi, C., Jin, L., Tricerri, M. A., and Jonas, A. (2004) Enthalpy-driven
apolipoprotein A-I and lipid bilayer interaction indicating protein penetration
upon lipid binding, Biochemistry 43, 12258-12264.
10. Silva, R. A., Huang, R., Morris, J., Fang, J., Gracheva, E. O., Ren, G., Kontush,
A., Jerome, W. G., Rye, K. A., and Davidson, W. S. (2008) Structure of
apolipoprotein A-I in spherical high density lipoproteins of different sizes, Proc
Natl Acad Sci U S A 105, 12176-12181.
11. Swaney, J. B. (1983) Reconstitution of apolipoprotein A-I from human high
density lipoprotein with bovine brain sphingomyelin, J Biol Chem 258, 1254-
1259.
12. Jayaraman, S., Abe-Dohmae, S., Yokoyama, S., and Cavigiolio, G. (2011)
Impact of self-association on function of apolipoprotein A-I, J Biol Chem 286,
35610-35623.
13. Sreerama, N., and Woody, R. W. (2004) On the analysis of membrane protein
circular dichroism spectra, Protein Sci 13, 100-112.
14. Reed, J., and Reed, T. A. (1997) A set of constructed type spectra for the
practical estimation of peptide secondary structure from circular dichroism, Anal
Biochem 254, 36-40.
15. Zimm, B. H., and Bragg, J. K. (1959) Theory of the phase transition between
helix and random coil in polypeptide chains, J Chem Phys 31, 526-535.
16. Chou, P. Y., and Scheraga, H. A. (1971) Calorimetric measurement of enthalpy
change in the isothermal helix--coil transition of poly-L-lysine in aqueous
solution, Biopolymers 10, 657-680.
2. Thermodynamics of protein self-association and unfolding
50 | P a g e
17. Rialdi, G., and Hermans, J., Jr. (1966) Calorimetric heat of the helix-coil
transition of poly-L-glutamic acid, J Am Chem Soc 88, 5719-5720.
18. Scholtz, J. M., Marqusee, S., Baldwin, R. L., York, E. J., Stewart, J. M.,
Santoro, M., and Bolen, D. W. (1991) Calorimetric determination of the
enthalpy change for the alpha-helix to coil transition of an alanine peptide in
water, Proc Natl Acad Sci U S A 88, 2854-2858.
19. Davidson, N. (1962) Statistical Mechanics, pp 385, McGraw-Hill, New York,
N.Y.
20. Beck, A., Li-Blatter, X., Seelig, A., and Seelig, J. (2010) On the interaction of
ionic detergents with lipid membranes. Thermodynamic comparison of n-alkyl-
+N(CH3)3 and n-alkyl-SO4-, J Phys Chem B 114, 15862-15871.
21. Wyman, J., and Gill, S. J. (1990) Binding and Linkage. Functional chemistry of
biological macromolecules, University Science Books, Mill Valley, CA.
22. Vitello, L. B., and Scanu, A. M. (1976) Studies on human serum high density
lipoproteins. Self-association of apolipoprotein A-I in aqueous solutions, J Biol
Chem 251, 1131-1136.
23. Swaney, J. B., and O'Brien, K. (1978) Cross-linking studies of the self-
association properties of apo-A-I and apo-A-II from human high density
lipoprotein, J Biol Chem 253, 7069-7077.
24. Heerklotz, H., and Seelig, J. (2000) Titration calorimetry of surfactant-
membrane partitioning and membrane solubilization, Biochim Biophys Acta
1508, 69-85.
25. Privalov, P. L., and Gill, S. J. (1989) The hydrophobic effect - a reappraisal,
Pure Appl Chem 61, 1097-1104.
2. Thermodynamics of protein self-association and unfolding
51 | P a g e
26. Formisano, S., Brewer, H. B., Jr., and Osborne, J. C., Jr. (1978) Effect of
pressure and ionic strength on the self-association of Apo-A-I from the human
high density lipoprotein complex, J Biol Chem 253, 354-359.
27. Brouillette, C. G., Dong, W. J., Yang, Z. W., Ray, M. J., Protasevich, II,
Cheung, H. C., and Engler, J. A. (2005) Forster resonance energy transfer
measurements are consistent with a helical bundle model for lipid-free
apolipoprotein A-I, Biochemistry 44, 16413-16425.
28. Privalov, P. L., and Dragan, A. I. (2007) Microcalorimetry of biological
macromolecules, Biophys Chem 126, 16-24.
29. Carra, J. H., Murphy, E. C., and Privalov, P. L. (1996) Thermodynamic effects
of mutations on the denaturation of T4 lysozyme, Biophys J 71, 1994-2001.
30. Kasimova, M. R., Milstein, S. J., and Freire, E. (1998) The conformational
equilibrium of human growth hormone, J Mol Biol 277, 409-418.
31. Chetty, P. S., Mayne, L., Lund-Katz, S., Stranz, D., Englander, S. W., and
Phillips, M. C. (2009) Helical structure and stability in human apolipoprotein A-
I by hydrogen exchange and mass spectrometry, Proc Natl Acad Sci U S A 106,
19005-19010.
32. Murphy, K. P., and Gill, S. J. (1991) Solid model compounds and the
thermodynamics of protein unfolding, J Mol Biol 222, 699-709.
33. Saito, H., Dhanasekaran, P., Nguyen, D., Deridder, E., Holvoet, P., Lund-Katz,
S., and Phillips, M. C. (2004) α-Helix formation is required for high affinity
binding of human apolipoprotein A-I to lipids, J Biol Chem 279, 20974-20981.
34. Meier, M., and Seelig, J. (2007) Thermodynamics of the coil <==> beta-sheet
transition in a membrane environment, J Mol Biol 369, 277-289.

2. Thermodynamics of protein self-association and unfolding
52 | P a g e
35. Meier, M., and Seelig, J. (2008) Length dependence of the coil <--> beta-sheet
transition in a membrane environment, J Am Chem Soc 130, 1017-1024.
36. Nolte, R. T., and Atkinson, D. (1992) Conformational analysis of apolipoprotein
A-I and E-3 based on primary sequence and circular dichroism, Biophys J 63,
1221-1239.
37. Thompson, K. S., Vinson, C. R., and Freire, E. (1993) Thermodynamic
characterization of the structural stability of the coiled-coil region of the bZIP
transcription factor GCN4, Biochemistry 32, 5491-5496.
38. Honnappa, S., Cutting, B., Jahnke, W., Seelig, J., and Steinmetz, M. O. (2003)
Thermodynamics of the Op18/stathmin-tubulin interaction, J Biol Chem 278,
38926-38934.
39. Gursky, O., and Atkinson, D. (1998) Thermodynamic analysis of human plasma
apolipoprotein C-1: high-temperature unfolding and low-temperature oligomer
dissociation, Biochemistry 37, 1283-1291.
40. Acharya, P., Segall, M. L., Zaiou, M., Morrow, J., Weisgraber, K. H., Phillips,
M. C., Lund-Katz, S., and Snow, J. (2002) Comparison of the stabilities and
unfolding pathways of human apolipoprotein E isoforms by differential scanning
calorimetry and circular dichroism, Biochim Biophys Acta 1584, 9-19.
41. Scholtz, J. M., Qian, H., York, E. J., Stewart, J. M., and Baldwin, R. L. (1991)
Parameters of helix-coil transition theory for alanine-based peptides of varying
chain lengths in water, Biopolymers 31, 1463-1470.

2. Thermodynamics of protein self-association and unfolding
53 | P a g e
Figures
Figure 1
0.00 8.33 16.67 25.00 33.33 41.67 50.003.05
3.10
3.15
3.20
3.25
3.30
3.35
time / min
hea
t flo
w / µ
cal s
-1
A
0.00 8.33 16.67 25.00 33.33 41.67 50.003.05
3.10
3.15
3.20
3.25
3.30
3.35
time / min
hea
t flo
w / µ
cal s
-1
A
0 5 10 15 20
0
1
2
3
4
heat
of d
isso
ciat
ion δh
i / µc
al
number of injections Ni
B
0 5 10 15 20
0
1
2
3
4
heat
of d
isso
ciat
ion δh
i / µc
al
number of injections Ni
B
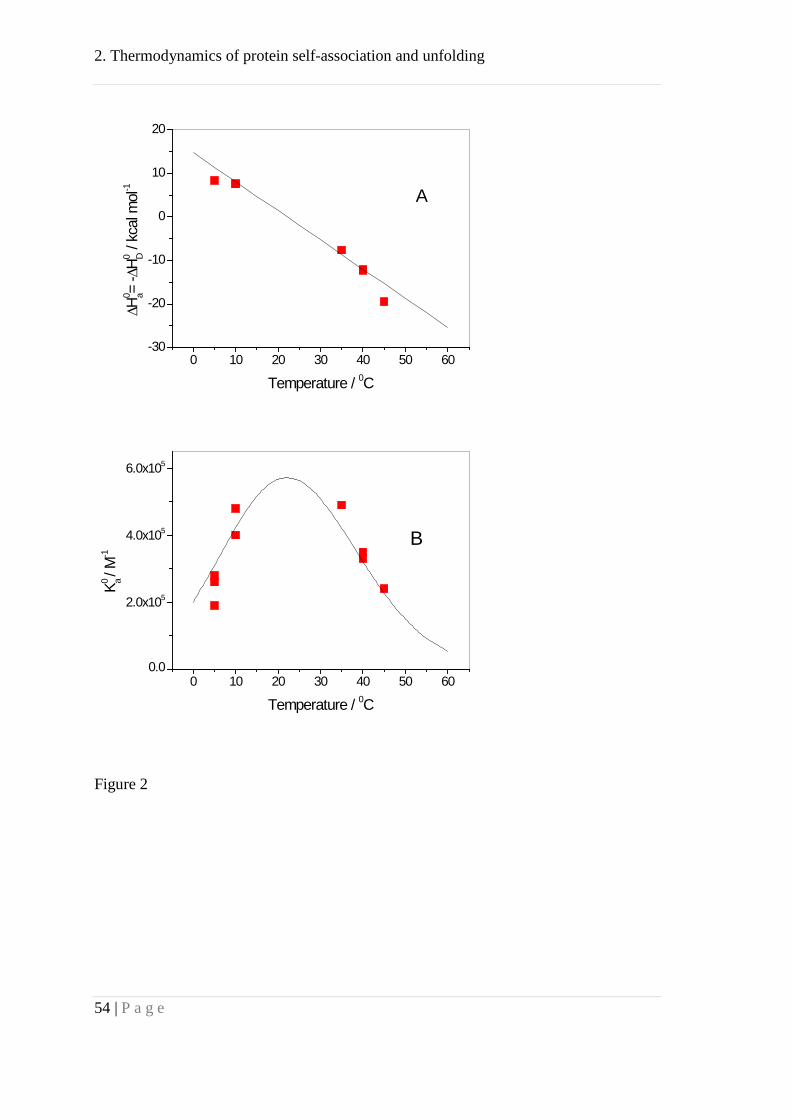
2. Thermodynamics of protein self-association and unfolding
54 | P a g e
0 10 20 30 40 50 60-30
-20
-10
0
10
20∆H
0 a= -∆
H0 D / k
cal m
ol-1
Temperature / 0C
A
0 10 20 30 40 50 600.0
2.0x10⁵
4.0x10⁵
6.0x10⁵
K0 a / M
-1
Temperature / 0C
B
Figure 2
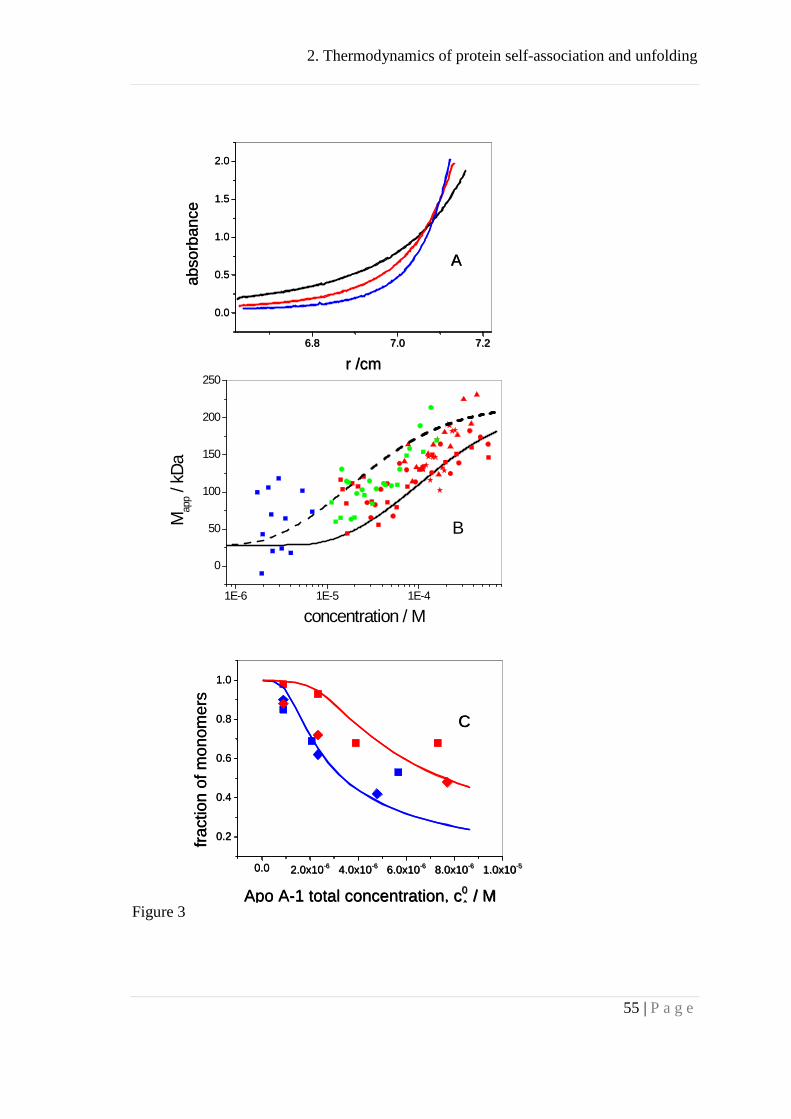
2. Thermodynamics of protein self-association and unfolding
55 | P a g e
Figure 3
6.8 7.0 7.2
0.0
0.5
1.0
1.5
2.0
abso
rban
ce
r /cm
A
6.8 7.0 7.2
0.0
0.5
1.0
1.5
2.0
abso
rban
ce
r /cm
A
1E-6 1E-5 1E-4
0
50
100
150
200
250
Map
p / k
Da
concentration / M
B
0.0 2.0x10⁻⁶ 4.0x10⁻⁶ 6.0x10⁻⁶ 8.0x10⁻⁶ 1.0x10⁻⁵
0.2
0.4
0.6
0.8
1.0
fract
ion
of m
onom
ers
Apo A-1 total concentration, c0A / M
C
0.0 2.0x10⁻⁶ 4.0x10⁻⁶ 6.0x10⁻⁶ 8.0x10⁻⁶ 1.0x10⁻⁵
0.2
0.4
0.6
0.8
1.0
fract
ion
of m
onom
ers
Apo A-1 total concentration, c0A / M
C
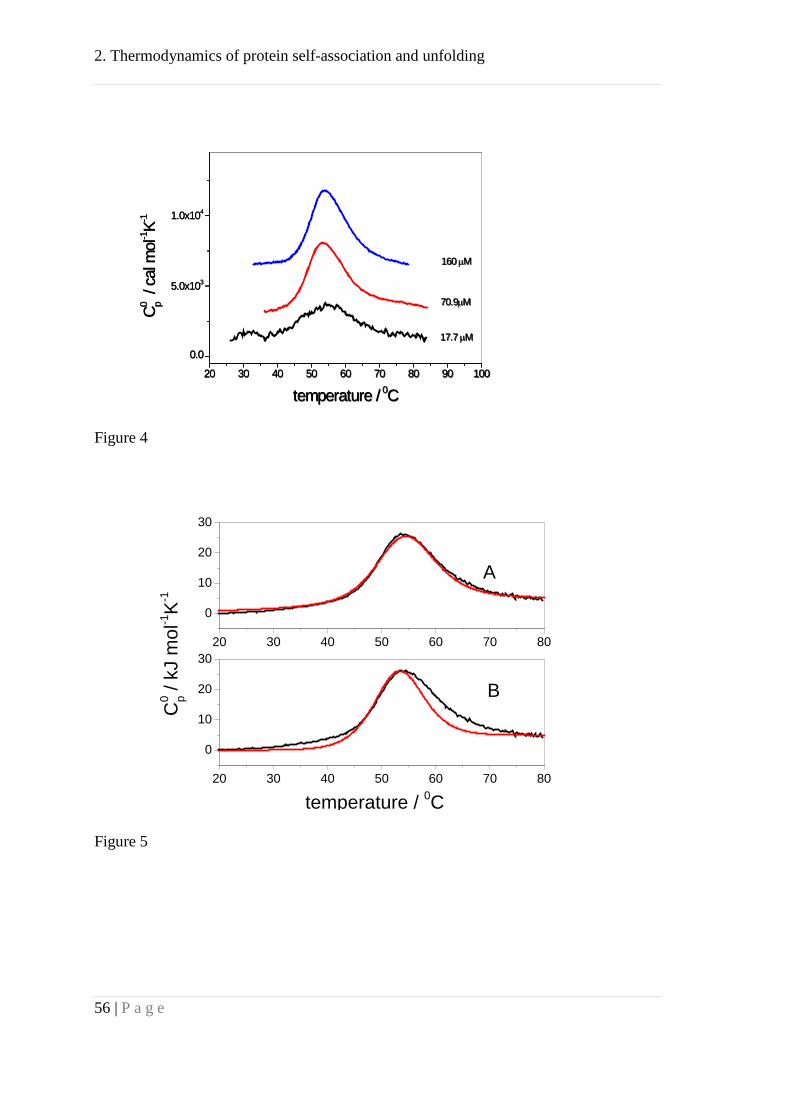
2. Thermodynamics of protein self-association and unfolding
56 | P a g e
20 30 40 50 60 70 80 90 100
0.0
5.0x10³
1.0x10⁴
C0 p
/ cal
mol
-1K-1
temperature / 0C
17.7 µM
70.9µM
160 µM
20 30 40 50 60 70 80 90 100
0.0
5.0x10³
1.0x10⁴
C0 p
/ cal
mol
-1K-1
temperature / 0C
17.7 µM
70.9µM
160 µM
Figure 4
Figure 5
20 30 40 50 60 70 80
0
10
20
30
B
C0 p /
kJ
mol
-1K
-1
temperature / 0C
20 30 40 50 60 70 80
0
10
20
30
A
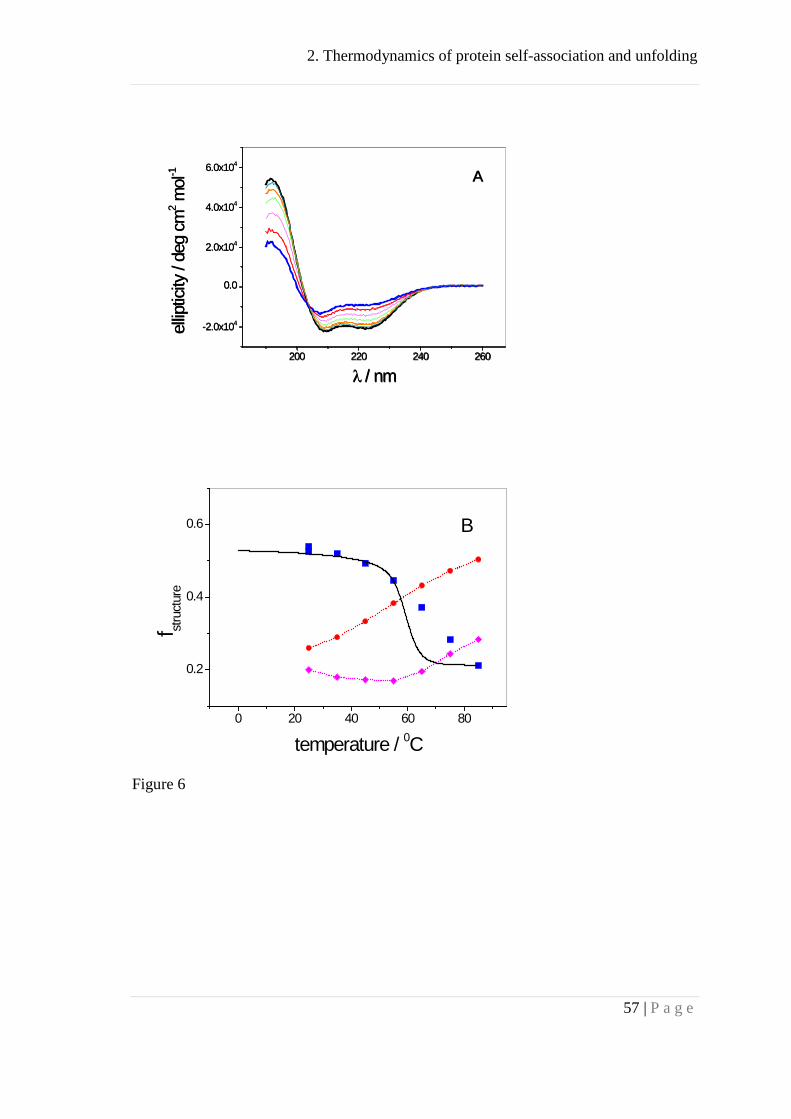
2. Thermodynamics of protein self-association and unfolding
57 | P a g e
200 220 240 260
-2.0x10⁴
0.0
2.0x10⁴
4.0x10⁴
6.0x10⁴
ellip
ticity
/ de
g cm
2 mol
-1
λ / nm
A
200 220 240 260
-2.0x10⁴
0.0
2.0x10⁴
4.0x10⁴
6.0x10⁴
ellip
ticity
/ de
g cm
2 mol
-1
λ / nm
A
0 20 40 60 80
0.2
0.4
0.6
f stru
ctur
e
temperature / 0C
B
Figure 6

2. Thermodynamics of protein self-association and unfolding
58 | P a g e
10-6 10-5 10-4 10-3 10-2
0.0
0.2
0.4
0.6
0.8
1.0α
, p1,
p 8
total concentration Apo A-1, c0A / M
α
p1
p8
p1+p8
10-6 10-5 10-4 10-3 10-2
0.0
0.2
0.4
0.6
0.8
1.0α
, p1,
p 8
total concentration Apo A-1, c0A / M
α
p1
p8
p1+p8
Figure 7

2. Thermodynamics of protein self-association and unfolding
59 | P a g e
40 50 60 70 80
0.0
0.5
1.0
α
B
40 50 60 70 80
0
5
10
Cp /
kJ
mol
-1K-1
A
temperature / 0C
Figure 8

2. Thermodynamics of protein self-association and unfolding
60 | P a g e
For Table of Contents Use Only
Thermodynamics of protein self-association and unfolding. The case of
Apolipoprotein A-I.
Fabian Zehender, André Ziegler, Hans-Joachim Schönfeld, and Joachim Seelig
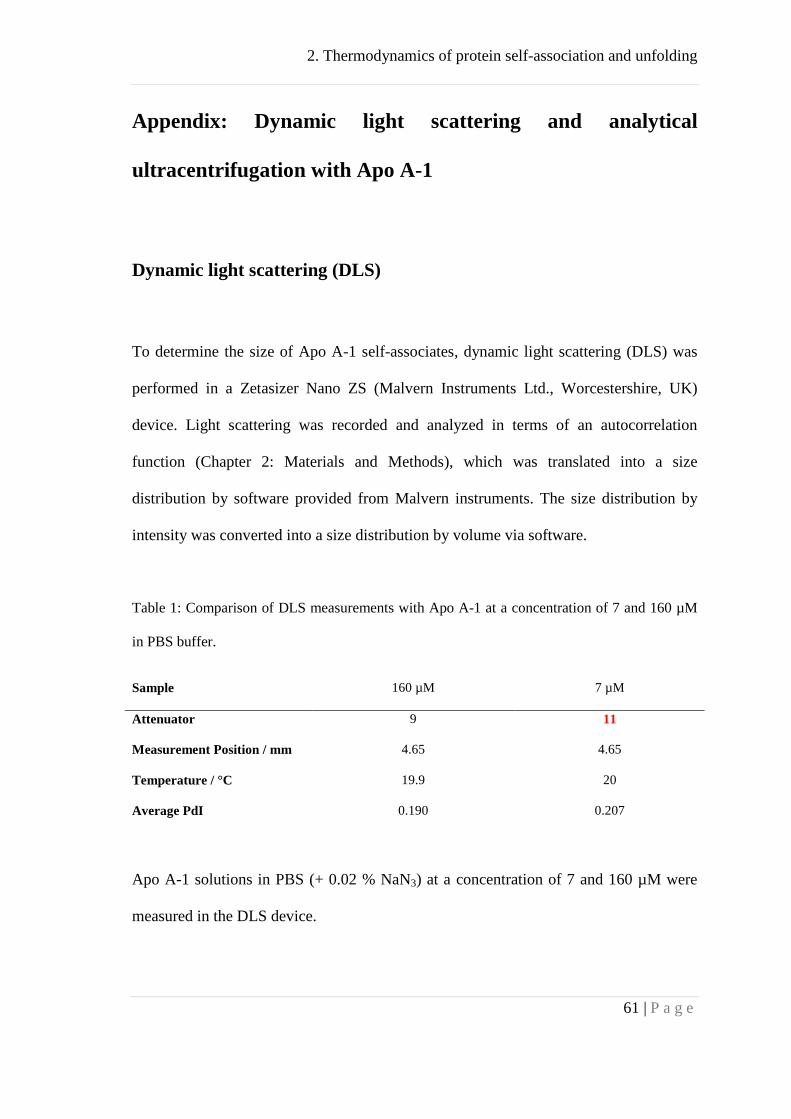
2. Thermodynamics of protein self-association and unfolding
61 | P a g e
Appendix: Dynamic light scattering and analytical
ultracentrifugation with Apo A-1
Dynamic light scattering (DLS)
To determine the size of Apo A-1 self-associates, dynamic light scattering (DLS) was
performed in a Zetasizer Nano ZS (Malvern Instruments Ltd., Worcestershire, UK)
device. Light scattering was recorded and analyzed in terms of an autocorrelation
function (Chapter 2: Materials and Methods), which was translated into a size
distribution by software provided from Malvern instruments. The size distribution by
intensity was converted into a size distribution by volume via software.
Table 1: Comparison of DLS measurements with Apo A-1 at a concentration of 7 and 160 µM
in PBS buffer.
Sample 160 µM 7 µM
Attenuator 9 11
Measurement Position / mm 4.65 4.65
Temperature / °C 19.9 20
Average PdI 0.190 0.207
Apo A-1 solutions in PBS (+ 0.02 % NaN3) at a concentration of 7 and 160 µM were
measured in the DLS device.

2. Thermodynamics of protein self-association and unfolding
62 | P a g e
The size distribution by volume is shown in Figure 1. Measurements at concentrations
of 7 µM were at the border of sensitivity of the device. The diameter of Apo A-1
oligomers was calculated to be the same for both (11 nm) concentrations contradicting
the results obtained by AUC and ITC where concentration dependent oligomerization
was found (Chapter 3: Published article). There, Apo A-1 was found to be mainly
monomeric at 7 µM and oligomeric (8 Apos) at a concentration of 160 µM.
The attenuator of the DLS device has already reached its highest value of 11 for
measurement at 7 µM Apo A-1 (Figure 1 and Table 1). Thus the question whether a
solution of 7 µM Apo A-1 has already reached the threshold of sensitivity is debatable.
On the other hand, the increased viscosity at 160 µM could lead to non-ideal effects that
could have falsified the results.
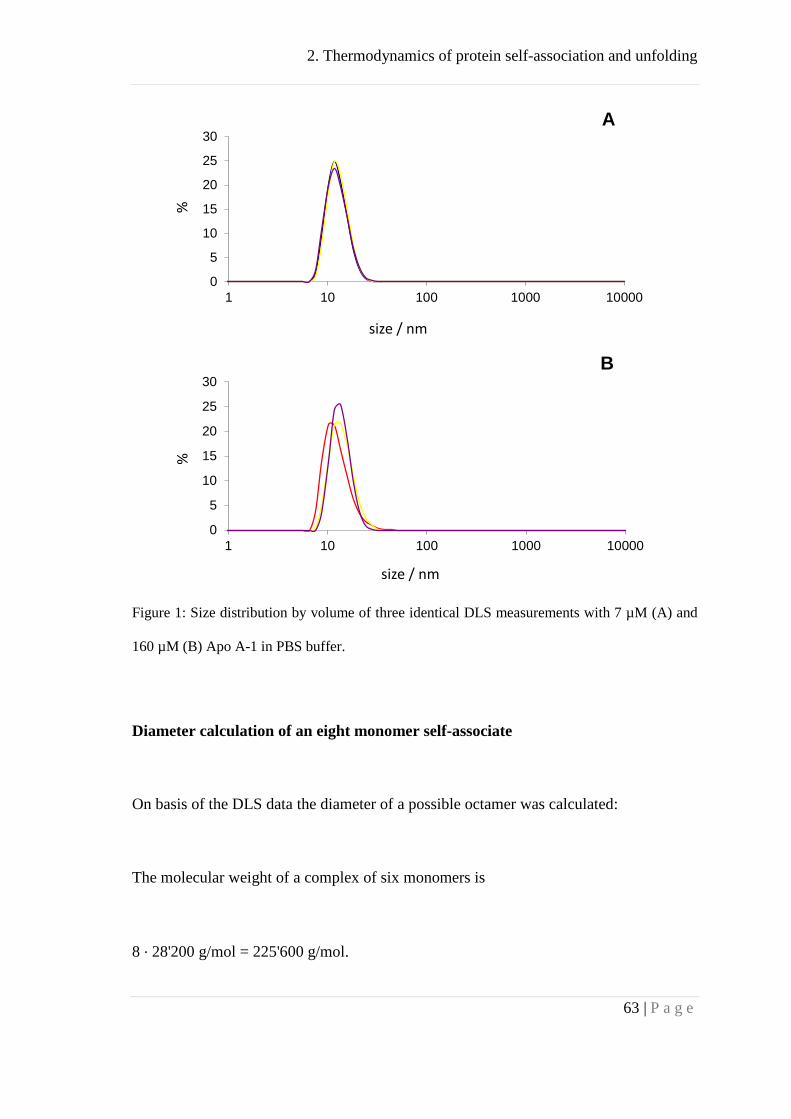
2. Thermodynamics of protein self-association and unfolding
63 | P a g e
Figure 1: Size distribution by volume of three identical DLS measurements with 7 µM (A) and
160 µM (B) Apo A-1 in PBS buffer.
Diameter calculation of an eight monomer self-associate
On basis of the DLS data the diameter of a possible octamer was calculated:
The molecular weight of a complex of six monomers is
8 · 28'200 g/mol = 225'600 g/mol.
0
5
10
15
20
25
30
1 10 100 1000 10000
%
size / nm
A
0
5
10
15
20
25
30
1 10 100 1000 10000
%
size / nm
B

2. Thermodynamics of protein self-association and unfolding
64 | P a g e
Mass 8 molecules: m = 3.7456 · 10-19 g
Volume 8 molecules: V = 3.7456 · 10-19 g / 0.73 g/cm3 = 5.1310 · 10-19 cm3
Radii: V = 4/3 πr3 = 5.1310 · 10-19 cm3
r = 4.9663 · 10-7 cm = 4.69 nm
Diameter: d = 9.93 nm
The result of almost 10 nm is in a similar range as the resulting size of 11.5 nm (160
µM) measured by DLS
Analogous the number of monomers in one oligomer was calculated via the measured
particle size. The calculation yielded 12 Apos per oligomer, which is in a similar range
to the assumption of eight Apos derived by AUC and ITC measurements for highly
concentrated samples, such as 160 µM.
Analytical ultracentrifugation
Additional measurements in a XL-I centrifuge (Beckman Coulter, Indianapolis, IN;
Rotor: Ati50) were performed with Apo A-1 and alternative models were used to
analyze the data.

2. Thermodynamics of protein self-association and unfolding
65 | P a g e
Apo A-1-solutions (10.8 mg/ml) were dialysed (Visiking, MWT 14000 cutoff, 3 days, 4
x 1:1000) against PBS buffer (+ 0.02 % NaN3). Subsequently the concentration was
determined by UV-VIS spectroscopy. The buffer of the last dialysis bath was used to fill
the reference compartments of the analytical ultracentrifuge cells.
Experimental determination of υbar
The specific partial volume, υbar which was used for analyzing AUC data in the
published article (Chapter 3) was calculated to be 0.736 ml/g as a sum of the specific
partial volume of each amino acid of Apo A-1. However, a calculated value can differ
from the real υbar of a protein due to possible cavities and hydration effects of the
macromolecule. When analyzing a sedimentation equilibrium run the resulting
molecular mass is very sensitive to changes in the specific partial volume. Hence υbar
was attempted to be found experimentally.
Apo A-1 was dissolved in PBS buffer (+ 0.02 % NaN3) with different D2O
concentrations in order to prepare buffers of different densities. The concentration of
Apo A-1 (3.5 µM) was chosen to exhibit a sufficient absorption (A0 ≈ 0.15) in a
centerpiece with 12 mm path length but at low enough protein concentration so that the
solution contains only monomers. The sedimentation equilibrium was measured at 8,
12, 15, 20, 25 und 30 krpm. The last five scans of measurements at 12, 15, 20 and
25 krpm were averaged and analyzed as described in as follows.
The concentration at a certain point in the cells a(r) is described by
, ( ) ( )
−⋅= rrMa RT
bra 20
2
2
0 2exp
ω
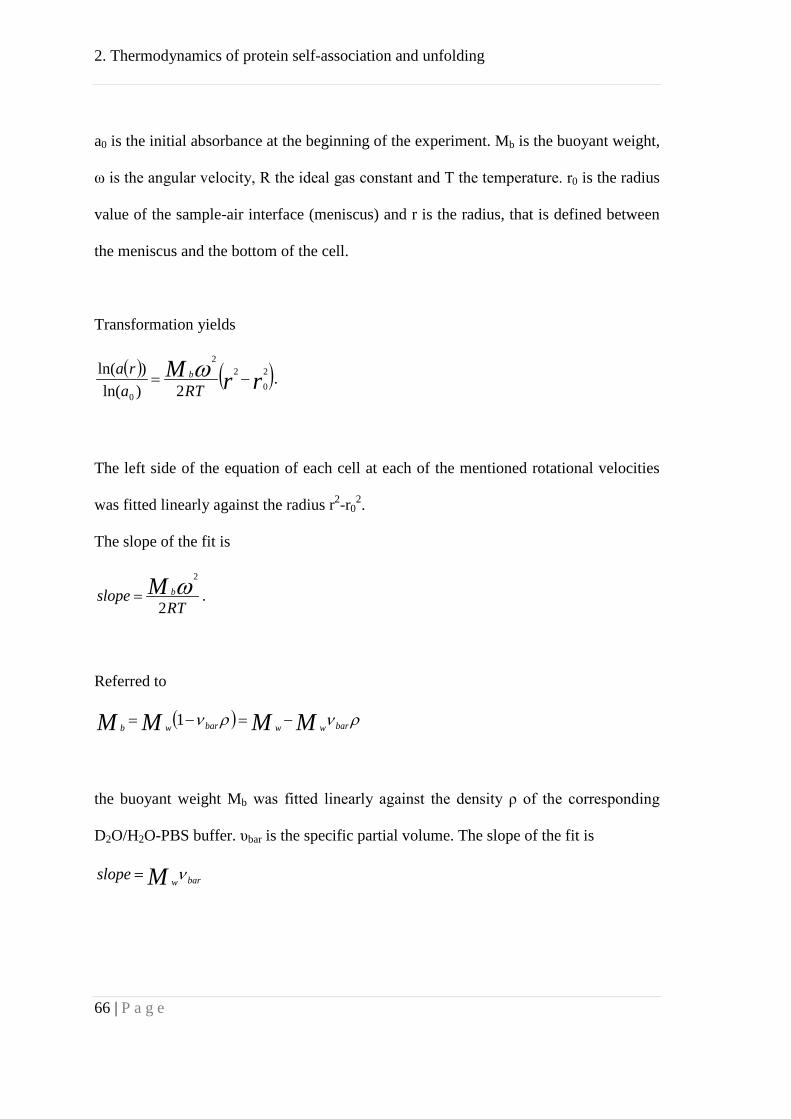
2. Thermodynamics of protein self-association and unfolding
66 | P a g e
a0 is the initial absorbance at the beginning of the experiment. Mb is the buoyant weight,
ω is the angular velocity, R the ideal gas constant and T the temperature. r0 is the radius
value of the sample-air interface (meniscus) and r is the radius, that is defined between
the meniscus and the bottom of the cell.
Transformation yields
.
The left side of the equation of each cell at each of the mentioned rotational velocities
was fitted linearly against the radius r2-r02.
The slope of the fit is
.
Referred to
the buoyant weight Mb was fitted linearly against the density ρ of the corresponding
D2O/H2O-PBS buffer. υbar is the specific partial volume. The slope of the fit is
( ) ( )rrMRTa
ra b 20
22
0 2)ln()ln(
−= ω
RTslope M b
2
2ω=
( ) ρνρν barwwbarwb MMMM −=−= 1
barwMslope ν=

2. Thermodynamics of protein self-association and unfolding
67 | P a g e
and the axes intercept equates to the molecular mass Mw. The slope was divided by
28.2 kDa in order to yield the specific partial volume υbar.
Table 2: Results of analytical ultracentrifugation measurements with Apo A-1 in PBS and
H2O/D2O solutions aiming to determine the specific partial volume υbar of the protein.
velocity krpm 12 15 20 25
intercept / Mw kDa 49.0 38.7 33.32 24.4
υbar ml/g 1.3 1.0 0.9 0.6
standard deviation ml/g 0.7 0.4 0.1 0.1
R2
0.40 0.58 0.93 0.90
Figure 2: Calculated υbar of Apo A-1 is shown as a function of the velocities of the equilibria
used for the calculation. The error of the results increased at lower velocities. υbar as a sum of
the υbars of each amino acid is depicted as a blue horizontal line.
0
0.5
1
1.5
2
2.5
8000 13000 18000 23000 28000
υ bar
/ m
l/g
Velocity / krpm
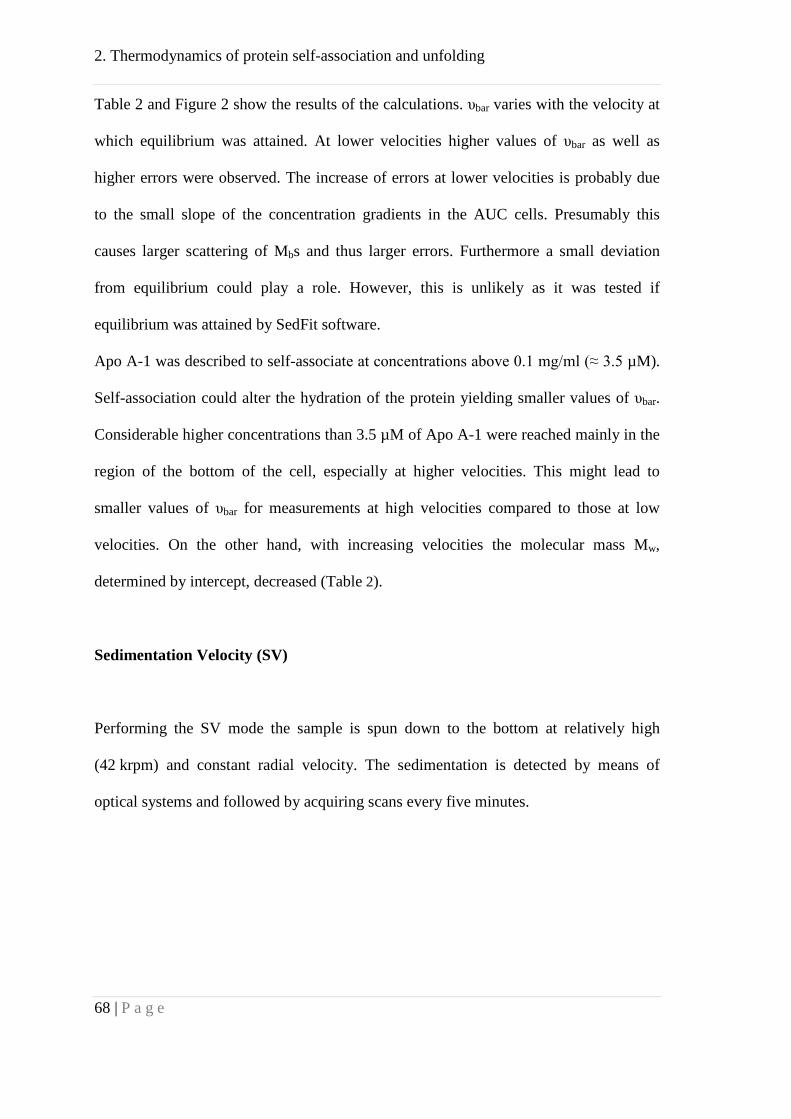
2. Thermodynamics of protein self-association and unfolding
68 | P a g e
Table 2 and Figure 2 show the results of the calculations. υbar varies with the velocity at
which equilibrium was attained. At lower velocities higher values of υbar as well as
higher errors were observed. The increase of errors at lower velocities is probably due
to the small slope of the concentration gradients in the AUC cells. Presumably this
causes larger scattering of Mbs and thus larger errors. Furthermore a small deviation
from equilibrium could play a role. However, this is unlikely as it was tested if
equilibrium was attained by SedFit software.
Apo A-1 was described to self-associate at concentrations above 0.1 mg/ml (≈ 3.5 µM).
Self-association could alter the hydration of the protein yielding smaller values of υbar.
Considerable higher concentrations than 3.5 µM of Apo A-1 were reached mainly in the
region of the bottom of the cell, especially at higher velocities. This might lead to
smaller values of υbar for measurements at high velocities compared to those at low
velocities. On the other hand, with increasing velocities the molecular mass Mw,
determined by intercept, decreased (Table 2).
Sedimentation Velocity (SV)
Performing the SV mode the sample is spun down to the bottom at relatively high
(42 krpm) and constant radial velocity. The sedimentation is detected by means of
optical systems and followed by acquiring scans every five minutes.

2. Thermodynamics of protein self-association and unfolding
69 | P a g e
Table 3: Sedimentation coefficients of Apo A-1 in PBS buffer at different concentrations.
Sedimentation coefficient distributions were obtained by SedFit software analysis. The main
peaks are written in bold red, others are in blue, whereas very small peaks are written italic and
black.
Table 3 shows sedimentation constants at different protein concentrations derived by
SedFit software analysis. If several peaks were observed, they are categorized into
small, normal, and main peaks. The main peaks are plotted as a function of protein
concentration in Figure 3. At concentrations above 0.28 mg/ml oligomers with a
sedimentation coefficient of 4.6 · 10-13 s are mainly populated. However, the results
suggest the existence of only two species with sedimentation coefficients S of
S ≈ 2· 10-13 s and S ≈ 4.6 · 10-13 s except one outlier at 2.25 mg/ml with a small peak at
S = 6.5 · 10-13 s. The presence of only two oligomeric states of Apo A-1 is contradicting
the results obtained by ITC and AUC SE measurements, where oligomers of different
detection concentration c
sedimentation - coefficient S
mg/ml
10-13s
interference 0.09 1.9 4.6
absorbance 0.09 2
interference 0.28 2.1 4.6
absorbance 0.28 2.2 4.6
interference 0.57 1.8 4.6
absorbance 0.57
4.8
interference 1.13
4.8
interference 2.25
4.6 6.5
interference 9.72
4.3
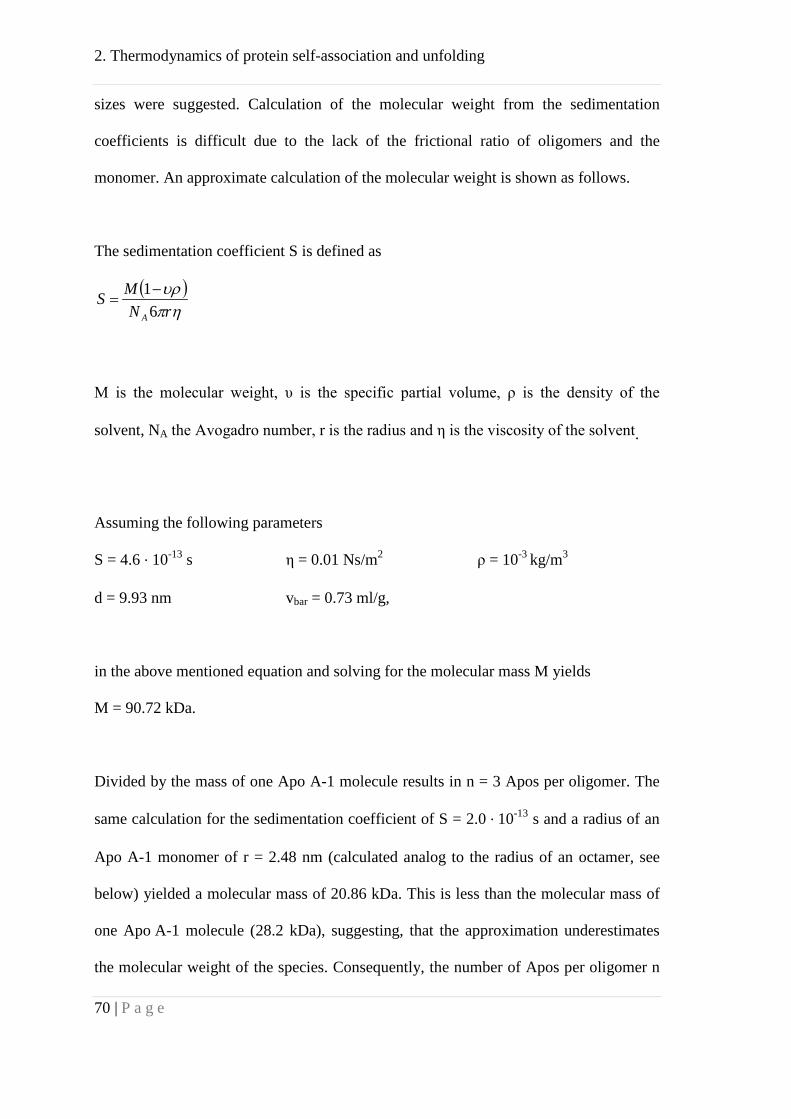
2. Thermodynamics of protein self-association and unfolding
70 | P a g e
sizes were suggested. Calculation of the molecular weight from the sedimentation
coefficients is difficult due to the lack of the frictional ratio of oligomers and the
monomer. An approximate calculation of the molecular weight is shown as follows.
The sedimentation coefficient S is defined as
M is the molecular weight, υ is the specific partial volume, ρ is the density of the
solvent, NA the Avogadro number, r is the radius and η is the viscosity of the solvent.
Assuming the following parameters
S = 4.6 · 10-13 s η = 0.01 Ns/m2 ρ = 10-3 kg/m3
d = 9.93 nm vbar = 0.73 ml/g,
in the above mentioned equation and solving for the molecular mass M yields
M = 90.72 kDa.
Divided by the mass of one Apo A-1 molecule results in n = 3 Apos per oligomer. The
same calculation for the sedimentation coefficient of S = 2.0 · 10-13 s and a radius of an
Apo A-1 monomer of r = 2.48 nm (calculated analog to the radius of an octamer, see
below) yielded a molecular mass of 20.86 kDa. This is less than the molecular mass of
one Apo A-1 molecule (28.2 kDa), suggesting, that the approximation underestimates
the molecular weight of the species. Consequently, the number of Apos per oligomer n
( )ηπ
υρrN
MSA 61−
=

2. Thermodynamics of protein self-association and unfolding
71 | P a g e
= 3 is less than suggested by Sedimentation equilibrium results in combination with ITC
results (n = 8, as discussed in Chapter 3: Published article). However, the approximation
indicated that Apo A-1 is oligomeric at least at concentrations beginning at 0.5 mg/ml.
Figure 3: Apo A-1`s main sedimentation coefficients of a sedimentation velocity measurement
is shown as a function of its concentration. The results suggest two different oligomeric states,
the larger at higher concentrations.
Sedimentation Equilibrium (SE)
SE measurements were analyzed by calculating the apparent molecular mass of short
intervals in the concentration gradient in the published article (Chapter 3). An
alternative approach of analyzing this data was done by means of SedPhat software with
different fitting models.
0
1
2
3
4
5
6
0.0625 0.125 0.25 0.5 1 2 4 8 16
Sedi
men
tatio
n co
effic
ient
S
/ 10-1
3 s
con(Apo A-1) / mg/ml
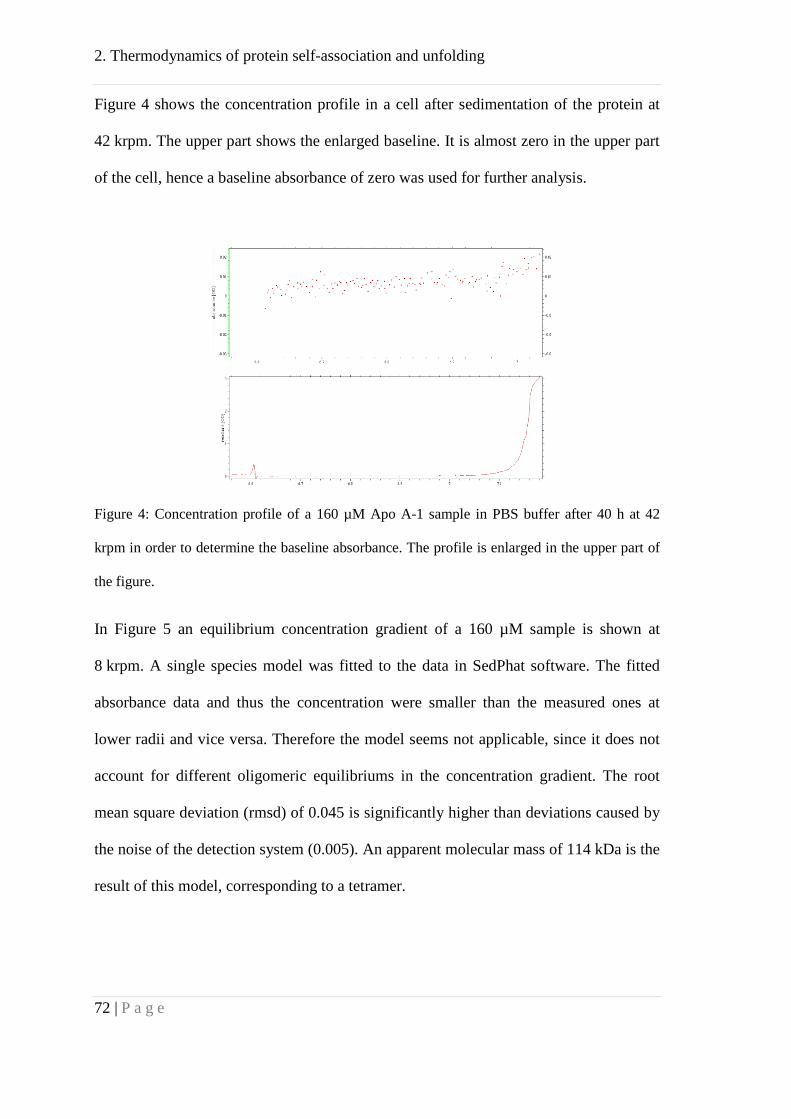
2. Thermodynamics of protein self-association and unfolding
72 | P a g e
Figure 4 shows the concentration profile in a cell after sedimentation of the protein at
42 krpm. The upper part shows the enlarged baseline. It is almost zero in the upper part
of the cell, hence a baseline absorbance of zero was used for further analysis.
Figure 4: Concentration profile of a 160 µM Apo A-1 sample in PBS buffer after 40 h at 42
krpm in order to determine the baseline absorbance. The profile is enlarged in the upper part of
the figure.
In Figure 5 an equilibrium concentration gradient of a 160 µM sample is shown at
8 krpm. A single species model was fitted to the data in SedPhat software. The fitted
absorbance data and thus the concentration were smaller than the measured ones at
lower radii and vice versa. Therefore the model seems not applicable, since it does not
account for different oligomeric equilibriums in the concentration gradient. The root
mean square deviation (rmsd) of 0.045 is significantly higher than deviations caused by
the noise of the detection system (0.005). An apparent molecular mass of 114 kDa is the
result of this model, corresponding to a tetramer.
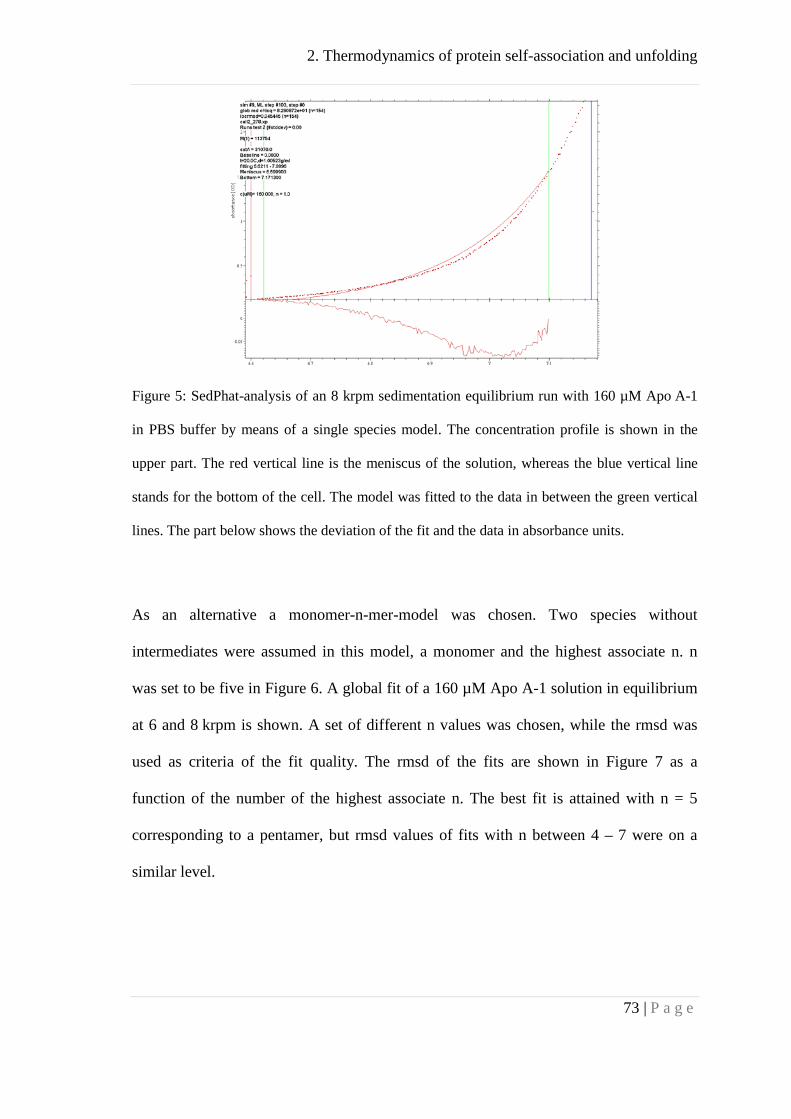
2. Thermodynamics of protein self-association and unfolding
73 | P a g e
Figure 5: SedPhat-analysis of an 8 krpm sedimentation equilibrium run with 160 µM Apo A-1
in PBS buffer by means of a single species model. The concentration profile is shown in the
upper part. The red vertical line is the meniscus of the solution, whereas the blue vertical line
stands for the bottom of the cell. The model was fitted to the data in between the green vertical
lines. The part below shows the deviation of the fit and the data in absorbance units.
As an alternative a monomer-n-mer-model was chosen. Two species without
intermediates were assumed in this model, a monomer and the highest associate n. n
was set to be five in Figure 6. A global fit of a 160 µM Apo A-1 solution in equilibrium
at 6 and 8 krpm is shown. A set of different n values was chosen, while the rmsd was
used as criteria of the fit quality. The rmsd of the fits are shown in Figure 7 as a
function of the number of the highest associate n. The best fit is attained with n = 5
corresponding to a pentamer, but rmsd values of fits with n between 4 – 7 were on a
similar level.

2. Thermodynamics of protein self-association and unfolding
74 | P a g e
Figure 6: SedPhat analysis of 160 µM Apo A-1 (in PBS buffer) in equilibrium at 6 and 8 krpm.
A monomer-n-mer model with n = 5 was used to fit to the data. The concentration profiles are
shown in the upper part. The red vertical line is the meniscus of the solution, whereas the blue
vertical line stands for the bottom of the cell. The model was fitted to the data in between the
green vertical lines. The part below shows the deviations of the fits and the data in absorbance
units.
Figure 7: An AUC SE run with 160 µM Apo A-1 in PBS buffer was analyzed with a
“monomer-n-mer” model in SedPhat software. A bar chart of the rmsd value of each fit with
different n values is depicted. Fits between n = 4 – 7 show a similar low rmsd values indicating
good quality of the fit.
3 4 5 6 7 80.00
0.01
0.02
0.03
0.04
0.05
rmsd
n
3. Lipid binding of Apo A-1 mimetic peptides
75 | P a g e
3. Lipid binding of Apo A-1 mimetic peptides
Introduction
Atherosclerosis is a clinical syndrome affecting a large number of people worldwide.
Low serum high-density lipoprotein (HDL) levels were identified as an independent risk
factor of cardiovascular disease. HDL is one of the key players in reverse cholesterol
transport (RCT). RCT is a multi-step process resulting in the net movement of
cholesterol from peripheral tissues back to the liver via the plasma [1]. The liver can
eliminate excess cholesterol by secreting cholesterol or bile acids into the bile.
Apo A-1 is a 28 kDa protein consisting of 10 repeating sequence homologies. It is the
main protein constitutent of HDL (70 % of protein in HDL) present in plasma at a
concentration of ≈ 35 µM in mice and humans.
Large parts of Apo A-1 are in an amphipathic α-helical secondary structure.
Amphipathic helices, a common feature of apolipoproteins, are grouped into seven
distinct classes: A, H, L,G, L, C and M [2]. They differ in charge, charge distribution
and charge density. Class A amphipathic helices are described by zwitterionic,
negatively charged residues at the center of the polar face and positively charged
residues clustering in the polar-nonpolar interface (Figure 1). The α-helices in Apo A-1
feature mainly a class A amphiphatic motif. This structural motif imparts hydrophilic
and hydrophobic regions and is found in many biologically active peptides and proteins.
The polar and nonpolar face is oriented along the long axis of the α-helix. This
distribution of physico-chemical properties forms a structural complement to that of

3. Lipid binding of Apo A-1 mimetic peptides
76 | P a g e
phospholipids and facilitates the interaction of the two types of molecules [2]. The
interaction of Apo A-1 related peptides with lipids in the aqueous environment was first
described by Segrest et al. [3].
Figure 1: Helical wheel presentation of the peptide 4F on
http://cti.itc.virginia.edu/~cmg/Demo/wheel/wheelApp.html. Nonpolar residues are depicted in yellow,
polar but uncharged are in green, acidic are in rose and basic residues are in blue. The closer the residues
are to the beholder the bigger are the circles. The amphiphatic character of the peptide is visible by the
seperation of the hydrophilic and charged residues on the upper side and the hydrophobic on the lower
part of the scheme. The criteria of class A amphiphilic helices are fulfilled with negatively charged
residues clustered at the center of the polar face of the helix and positively charged residues at the
polar/nonpolar unterface.
The amphipathic helix motif class A in Apo A-1 is responsible for lipid binding. Hence,
a 18 amino acid long model peptide of the amphipathic class A motif was designed and
designated 18A. The sequence DWLKAFYDKVAEKLKEAF of this peptide had no
sequence homology to Apo A-1 and is not present in any of the naturally occurring
proteins. Together with DMPG lipids, discoidal complexes were formed that showed

3. Lipid binding of Apo A-1 mimetic peptides
77 | P a g e
structural similarities to those of Apo A-1. The complexes mediated cellular cholesterol
efflux in cell culture similar to complexes with Apo A-1 [4]. The lipoprotein particles
were, analog to HDL, able to activate the lecithin-cholesterol acyltransferase (LCAT),
an important protein of the RCT. These and many other properties caused the
classification of 18A as Apo A-1 mimetic peptide. Refinement of the peptide design by
addition of an acetyl group to the amino terminus and an amide to the carboxyl terminus
yielded increased helicity of the peptide upon addition to lipids [5]. The blocking of the
termini also increased the cholesterol efflux and LCAT activation efficiency
significantly. Further detailed studies of the physical and chemical characteristics of
class A amphipathic peptides revealed that the hydrophobic region determines the
biological activity of the peptides. Hence exchange of nonpolar residues in 18A with
phenylalanine generated new peptides with increased hydrophobicity and increased
affinity to lipids. The new peptides were designated 3F, 4F, 5F, ... depending on the
total number of phenylalanines in the 18A sequence [6]. 4F showed highest activity in
arterial wall cell cultures and prevented lesions better than other 18A analogs when
tested in animal models [7]. Tandem helical peptides are obtained by an interruption of
the helical sequence with a proline residue. A molecule composed of two 18As bridged
by a proline (designated 37pA) was also investigated with respect to its Apo A-1
mimetic characteristics. 37pA exhibits greater lipid binding affinity and greater ability
to promote cholesterol efflux from cultured cells [4, 8-10]. The best studied Apo A-1
mimetic peptide however is 4F.
Apo A-1 and its mimetic peptides were tested extensively in vivo. Administration of
Apo A-1 and a mutant version Apo AMilano-1 resulted throughout all studies in healthful
changes in terms of cardiovascular disease. The requirement of intravenous

3. Lipid binding of Apo A-1 mimetic peptides
78 | P a g e
administration and large amounts of the protein ruled out the approach for
pharmacological application [11]. Therefore the hope lies in Apo A-1 mimetic peptides.
The plasma concentration of D-4F, the D enantionmer of L-4F used in our studies, was
measured to be maximal 130 nM after oral administration to mice and only 4 nM after a
single oral dose in humans. 4F was found to improve arterial vascoreactivity [12] and to
be antiatherogenic in diabetes [13]. The peptide also improved insulin resistance and
reduced adiposity in male obese mice [14, 15].
Clinical trials with 4F have not yet led to clear results. The peptide was always well
tolerated but the therapeutic results were ambiguous. Improvements of clinical markers
like LDL-induced monocyte chemotactic activity were achieved after oral
administration with a single dose of D-4F [16]. Though, intravenous and subcutaneous
administration of L-4F yielded no biomarker change of HDL function [17].
Most of the work with Apo A-1 mimetic peptides was done in cell culture and in animal
models. Doing so, cardio-protective effects of these peptides were proven empirically.
However, in vivo consequences of different peptide designs are still not predictable.
These peptides have high potential of improving cardiovascular disease but mechanistic
understanding and a detailed insight into lipid binding is lacking. We therefore studied
in detail the binding of 4F and partly 4F-Pro-4F (denoted P) to lipids.
3. Lipid binding of Apo A-1 mimetic peptides
79 | P a g e
Materials and Methods
Materials
The peptides 4F (Ac-DWFKAFYDKVAEKFKEAF-NH2) and P (Ac-
DWFKAFYDKVAEKFKEAFPDWFKAFYDKVAEKFKEAF-NH2) were obtained
from PEPTIDE 2.0 Inc. (Chantily, USA). Phosphate buffered saline (PBS), consisting
of 10 mM sodiumphosphate (Merck, Darmstadt, Germany) and 138 mM NaCl (Merck),
dissolved in Nanopure water and charged with 0.02 % NaN3 (Sigma) at pH 7.4 (25 °C)
was used to dissolve the peptides if not specified differently. Alternatively, a buffer
(HEPES) consisting of 10 mM HEPES (Roth) without any salt was used with and
without 10 % DMSO (Merck). Buffers were filtered through sterile 0.2 µM regenerated
cellulose and PTFE filters (Nano).
Methods
a. Dynamic light scattering (DLS)
Measurements were performed at 25 °C in a Zetasizer Nano ZS ZEN3600 (Malvern;
Worcestershire, UK), equipped with a HeNe laser (633 nm) and a backscattering
detector (scattering angle of 173°). Solutions (PBS + 0.02 % NaN3, pH 7.4; 10 mM
HEPES, pH 7.4 ± 10 % DMSO) were filtered (PES; 0.22 µm; Millipore; Billerica, MA)
and measured in rectangular cuvettes (1 cm). The intensity autocorrelation functions

3. Lipid binding of Apo A-1 mimetic peptides
80 | P a g e
were evaluated using a second-order cumulant analysis yielding the translational
diffusion coefficient D. The mean hydrodynamic diameter (DH) was calculated from D
by using the Stokes-Einstein equation. The size distributions were calculated from the
diffusion coefficient distribution using the CONTIN routine, and the resulting intensity
counts were volume-weighted [18].
b. High sensitivity isothermal titration calorimetry (ITC)
ITC was performed using either the ITC-200 or the VP titration calorimeter from
Microcal (Northampton, MA). The cell volumes were 200 μL and 1.4 mL, respectively,
and the injection volume varied between 2 μL and 10 μL. Solutions were degassed
under vacuum for about 10 min. Usually the calorimeter cell contained the peptide
solution and the lipid vesicles were in the injection syringe. The heat flow associated
with lipid binding was integrated by the software provided with the instrument and
analyzed with a multiside binding model [18-20].
c. Circular dichroism (CD)
CD spectra were obtained with a CD spectrometer Chirascan (Applied Photophysics
Ltd., Leatheread, UK) in the wavelength range of 180 nm - 260 nm using a total
acquisition time of 10 min per spectrum. Measurements were done at 25 °C with
peptide concentrations of 176 µM in 100 mM NaF, 10 mM sodium phosphate, pH 7.4 at
25 °C. Quartz platelets with path lengths of d = 0.1 mm were used and a baseline with
pure buffer was recorded and subtracted from the sample spectra. The CD-spectra were
3. Lipid binding of Apo A-1 mimetic peptides
81 | P a g e
simulated with the non-commercial software CDpro [21] based on reference spectra of
43 proteins (data set # 1).
d. Analytical ultracentrifugation (AUC)
A Beckman XL-I ultracentrifuge (Beckman Coulter, Indianapolis, IN USA) with UV-
and Interference detection was used. Peptide solutions were measured in PBS and
HEPES buffer at concentrations between 100 and 200 µM. Sedimentation velocity (SV)
measurements were done at 20 °C. Depending on the protein concentration, the center
piece length was 3 or 12 mm. The rotational speeds in the SV runs were 3, 10 and l8
krpm.
e. Static light scattering
Measurements were performed either in a black 96-well plate suitable for fluorescence
measurements (Corning) in a Spectramax M2 (Molecular Device, Sunnyvale, CA USA)
plate reader with a light source at 350 nm and detection at 360 nm or in a rectangular
2 mm cuvette in a FP 6500 Spectrofluorometer (JASCO Co., Tokyo, Japan) with
emission and detection at 360 nm.
f. Tryptophan fluorescence
Measurements were performed in a rectangular 5 mm cuvette in a FP 6500
Spectrofluorometer (JASCO Co., Tokyo, Japan). Emission spectra between 300 – 450
3. Lipid binding of Apo A-1 mimetic peptides
82 | P a g e
nm were collected with excitation at 290 nm. The samples were mixed and incubated at
room temperature for one hour, before measuring in the spectrometer.
g. Preparation of Lipid Vesicles
A defined amount of lipids in chloroform was first dried under a nitrogen stream and
subsequently overnight in high vacuum. Typically, 1-3 mL of buffer (PBS + 0.02 %
NaN3, pH 7.4 at 25 °C) were added to the lipids, and the suspension was rigorously
vortexed. For preparation of small unilamellar vesicles (SUVs), the lipid suspension
was kept in an ice bath and sonified under a constant nitrogen stream using a titanium
tip ultrasonicator until the solution became transparent (40 min without cholesterol and
60 min with Cholesterol). Titanium debris was removed by centrifugation (Eppendorf
tabletop centrifuge, 10 min at 12 000 rpm). The lipid concentration was calculated on
basis of the weight of the dried lipid. Large unilamellar vesicles (LUVs) were prepared
by the extrusion method [22]. After the dried lipid had been vortexed with buffer, six
freeze and thaw cycles were performed with the lipid suspension and extruded through
polycarbonate filters (13 times through 100 nm filters).
3. Lipid binding of Apo A-1 mimetic peptides
83 | P a g e
Results
Association behavior of peptides 4F and P
Apolipoprotein A-1 was shown to self-associate [22-25]. At concentrations below 3 µM
Apo A-1 is monomeric starting to oligomerize with increasing concentrations. The self-
association behavior of Apo A-1 is described in Chapter 3 with a model similar to those
used to describe the micellization of detergents [26]. Since the amphipathic character of
the helices in Apo A-1 are similar to those of Apo A-1 mimicking peptides 4F and P we
investigated if these peptides also self-associate.
Dynamic light scattering (DLS)
Self-association of the peptide 4F was studied with DLS. Figure 2 compares the
autocorrelation curves of a suspension of 100 nm phospholipid vesicles (lipid
concentration = 1.85 mM, in orange) with a solution of peptide 4F (cpep = 100 µM, in
blue). The curve describes the autocorrelation as a function of time. Autocorrelation is
the degree of similarity of the fluctuations in scattering intensity which arise from
Brownian motion of scattering particles. An initial scattering of a particle at the time t0
is compared with subsequent measurements of scattering after additional times
t0+t1(+t2+…). An autocorrelation value of 1 stands for perfect correlation and can only
occur at time zero. Since the particle is diffusing out of the detection volume a
sigmoidal decay of the autocorrelation is observed in a plot of the autocorrelation
against the logarithm of the time. The time it takes to diffuse out of the detected volume
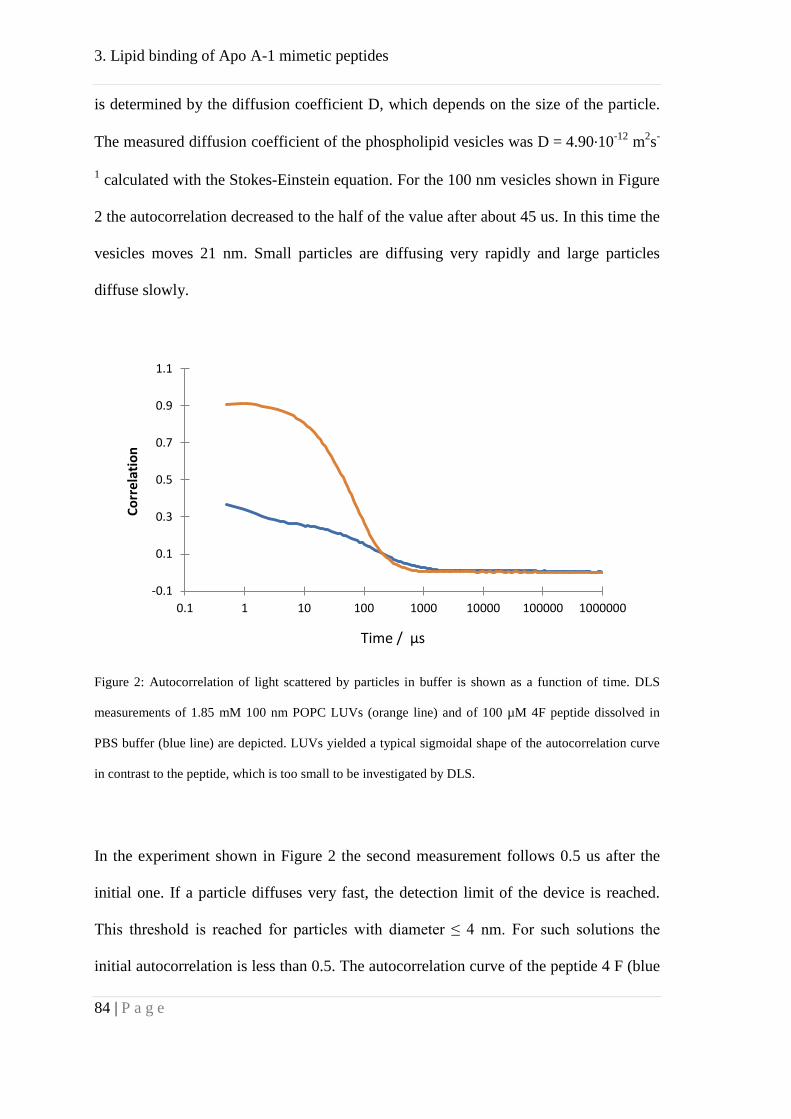
3. Lipid binding of Apo A-1 mimetic peptides
84 | P a g e
is determined by the diffusion coefficient D, which depends on the size of the particle.
The measured diffusion coefficient of the phospholipid vesicles was D = 4.90·10-12 m2s-
1 calculated with the Stokes-Einstein equation. For the 100 nm vesicles shown in Figure
2 the autocorrelation decreased to the half of the value after about 45 us. In this time the
vesicles moves 21 nm. Small particles are diffusing very rapidly and large particles
diffuse slowly.
Figure 2: Autocorrelation of light scattered by particles in buffer is shown as a function of time. DLS
measurements of 1.85 mM 100 nm POPC LUVs (orange line) and of 100 µM 4F peptide dissolved in
PBS buffer (blue line) are depicted. LUVs yielded a typical sigmoidal shape of the autocorrelation curve
in contrast to the peptide, which is too small to be investigated by DLS.
In the experiment shown in Figure 2 the second measurement follows 0.5 us after the
initial one. If a particle diffuses very fast, the detection limit of the device is reached.
This threshold is reached for particles with diameter ≤ 4 nm. For such solutions the
initial autocorrelation is less than 0.5. The autocorrelation curve of the peptide 4 F (blue
-0.1
0.1
0.3
0.5
0.7
0.9
1.1
0.1 1 10 100 1000 10000 100000 1000000
Corr
elat
ion
Time / µs

3. Lipid binding of Apo A-1 mimetic peptides
85 | P a g e
curve in Figure 2) does not show the typical sigmoidal shape and starts below 0.4.
Assuming a specific partial volume vbar = 0.73 g/cm3 of the peptide, a hexamer would
still be below the detection limit of the DLS device.
Figure 3: DLS measurements with 4F at different peptide and DMSO concentrations. To simplify the
graph, only the initial value of the autocorrelation curves is shown. Autocorrelation curves with
significant aggregates would yield initial autocorrelation values of approximately 1. Except of two
samples particles are too small to be investigated by DLS.
Analogous to the peptide measurements shown in Figure 2 a set of different conditions
were investigated. The peptides were dissolved in PBS buffer at five different
concentrations. For each concentration five different DMSO concentrations were chosen
in the range of 0 – 50 % resulting in a total of 25 different samples. In the following,
only the autocorrelation at t = t0 (ACt0, as average of three measurements with the same
sample) is shown in order to simplify the analysis. In Figure 3 the ACt0 is plotted
against the concentration of the peptide. The figure indicates that 4F in the presence of
DMSO exhibits ACt0 values below 0.4. In contrast, the two solutions without DMSO at
-0.2
0
0.2
0.4
0.6
0.8
1
-20 0 20 40 60
Aver
age
initi
al co
rrel
atio
n
Conc(peptide) / µM
0 % DMSO
12.5 % DMSO
25 % DMSO
50 % DMSO
100 % DMSO
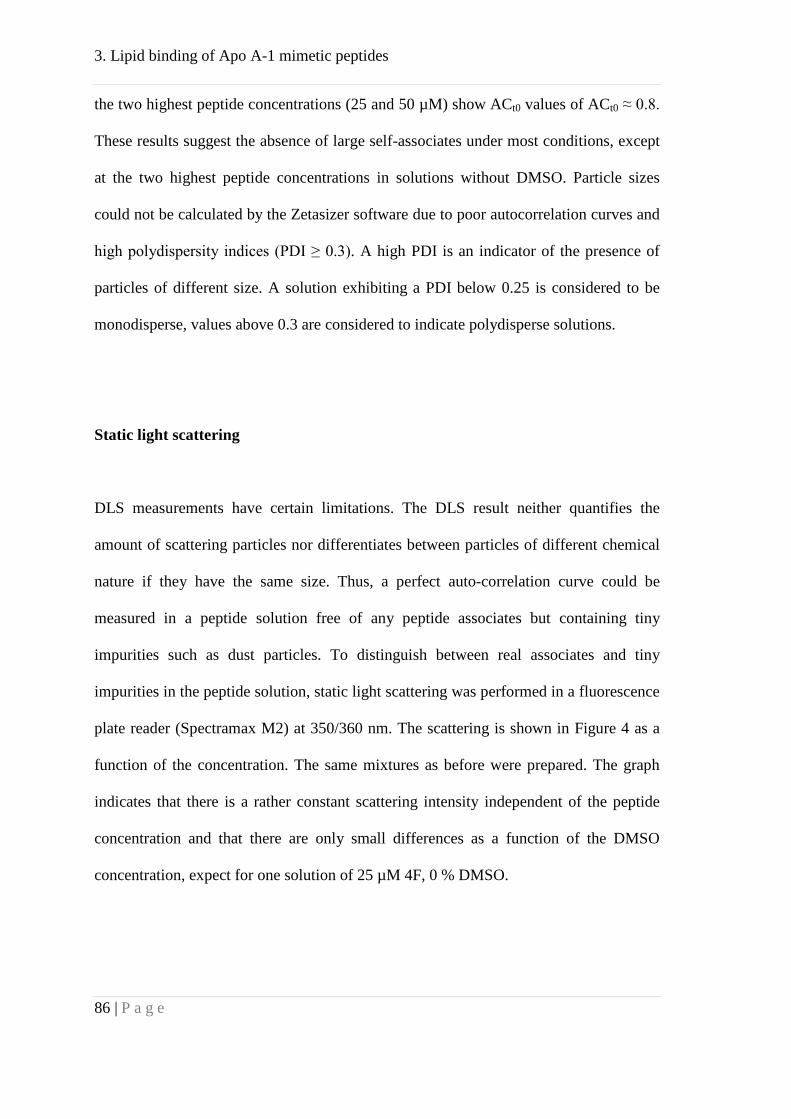
3. Lipid binding of Apo A-1 mimetic peptides
86 | P a g e
the two highest peptide concentrations (25 and 50 µM) show ACt0 values of ACt0 ≈ 0.8.
These results suggest the absence of large self-associates under most conditions, except
at the two highest peptide concentrations in solutions without DMSO. Particle sizes
could not be calculated by the Zetasizer software due to poor autocorrelation curves and
high polydispersity indices (PDI ≥ 0.3). A high PDI is an indicator of the presence of
particles of different size. A solution exhibiting a PDI below 0.25 is considered to be
monodisperse, values above 0.3 are considered to indicate polydisperse solutions.
Static light scattering
DLS measurements have certain limitations. The DLS result neither quantifies the
amount of scattering particles nor differentiates between particles of different chemical
nature if they have the same size. Thus, a perfect auto-correlation curve could be
measured in a peptide solution free of any peptide associates but containing tiny
impurities such as dust particles. To distinguish between real associates and tiny
impurities in the peptide solution, static light scattering was performed in a fluorescence
plate reader (Spectramax M2) at 350/360 nm. The scattering is shown in Figure 4 as a
function of the concentration. The same mixtures as before were prepared. The graph
indicates that there is a rather constant scattering intensity independent of the peptide
concentration and that there are only small differences as a function of the DMSO
concentration, expect for one solution of 25 µM 4F, 0 % DMSO.
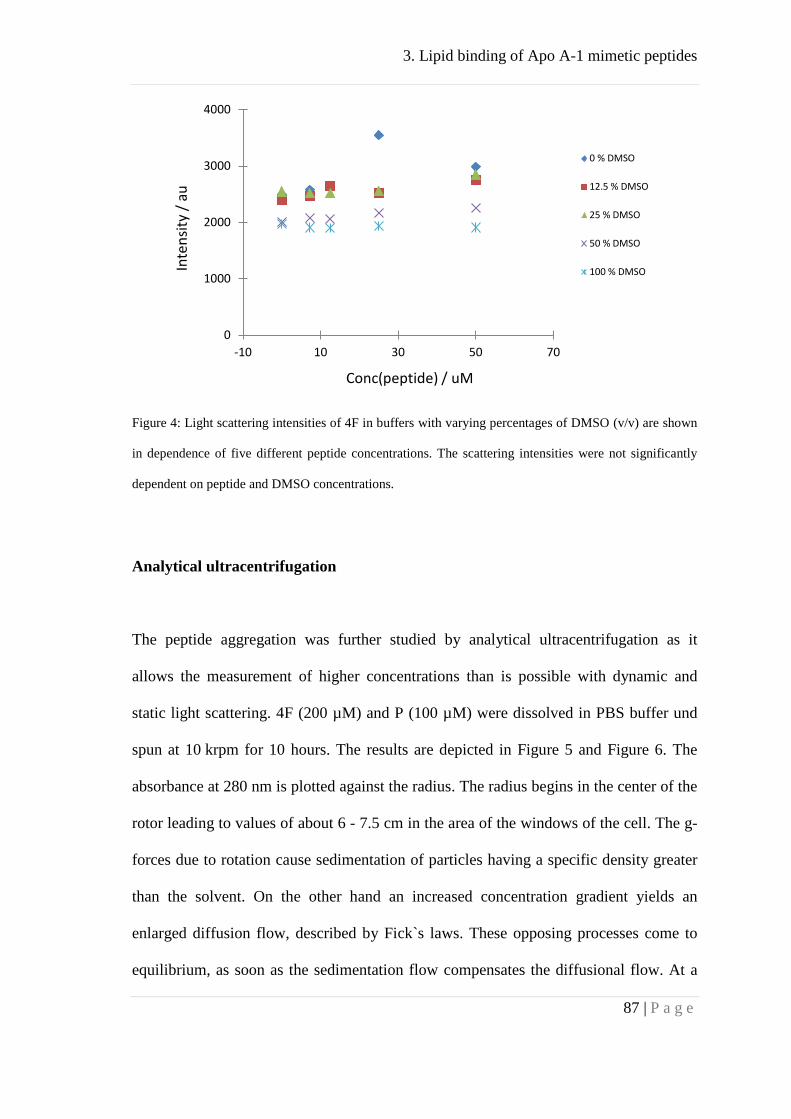
3. Lipid binding of Apo A-1 mimetic peptides
87 | P a g e
Figure 4: Light scattering intensities of 4F in buffers with varying percentages of DMSO (v/v) are shown
in dependence of five different peptide concentrations. The scattering intensities were not significantly
dependent on peptide and DMSO concentrations.
Analytical ultracentrifugation
The peptide aggregation was further studied by analytical ultracentrifugation as it
allows the measurement of higher concentrations than is possible with dynamic and
static light scattering. 4F (200 µM) and P (100 µM) were dissolved in PBS buffer und
spun at 10 krpm for 10 hours. The results are depicted in Figure 5 and Figure 6. The
absorbance at 280 nm is plotted against the radius. The radius begins in the center of the
rotor leading to values of about 6 - 7.5 cm in the area of the windows of the cell. The g-
forces due to rotation cause sedimentation of particles having a specific density greater
than the solvent. On the other hand an increased concentration gradient yields an
enlarged diffusion flow, described by Fick`s laws. These opposing processes come to
equilibrium, as soon as the sedimentation flow compensates the diffusional flow. At a
0
1000
2000
3000
4000
-10 10 30 50 70
Inte
nsity
/ au
Conc(peptide) / uM
0 % DMSO
12.5 % DMSO
25 % DMSO
50 % DMSO
100 % DMSO

3. Lipid binding of Apo A-1 mimetic peptides
88 | P a g e
given specific density large particles experience a large sedimentation rate and a small
diffusional rate. Consequently large self-associates sediment at lower rotational
velocities than small monomers. If a peptide is sedimented to the bottom of the AUC
cell, it is no longer detectable. In case of 4F, integrating the absorbance from meniscus
to bottom yielded the same value before and after the AUC run. This proves that the
protein was not sedimented to the bottom of the cell and lead to the conclusion, that no
big aggregates were formed. The experiment was repeated with 10 hours at 42 krpm,
again with 200 µM 4F in the AUC and still no sedimentation and meniscus depletion
was observed.
Trying to dissolve 100 µM P in PBS buffer led to huge aggregates, which were visible
even by eye. The solution with its aggregates was filled into AUC cells and spun at 3
and 10 krpm for 8 hours and 5 hours, respectively (Figure 7). The absorbance of
100 µM P at 280 nm the length of the centrifugation cell was constant 0.26 at the first as
well as at the last scan but should be 1.37. This means that over 90 % of the peptide was
sedimented to the cell bottom, while 10 % were kept in solution without any further
tendency to aggregate and sediment. Therefore 4F was used in PBS buffer, while P was
used in HEPES-buffer together with 10 % DMSO.

3. Lipid binding of Apo A-1 mimetic peptides
89 | P a g e
Figure 5: Analytical Ultracentrifugation scans of 200 µM 4F in PBS buffer at 10 krpm at the beginning of
the measurement (blue line) and after 10 hours (red line). Analysis confirmed mass conservation of the
peptide, meaning that all peptide is remained in solution.
Figure 6: Analytical ultracentrifugation run with 200 µM 4F in PBS at 42 krpm after 10 hours.
Sedimentation and meniscus depletion were not observed.
-1.00
-0.50
0.00
0.50
1.00
1.50
2.00
6 6.3 6.6 6.9 7.2 7.5
Abso
rban
ce (2
80)
radius / cm
t = 0 h
t = 10 h
-0.50
0.00
0.50
1.00
1.50
2.00
2.50
3.00
6 6.3 6.6 6.9 7.2 7.5
Abso
rban
ce (2
80)
radius / cm
3. Lipid binding of Apo A-1 mimetic peptides
90 | P a g e
Figure 7: Analytical ultracentrifugation runs with 100 µM P at 3 and 10 krpm. The initial and the last scan
after eigth hours at 3 krpm are depicted in blue, respectively in red. The last scan after 5 hours at 10 krpm
is depicted in green. The detected concentration is about 10 µM and does not tend to sediment. This
means that 90 % of the initial concentration is sedimented, which was visible even by eye.
Isothermal Titration calorimetry (ITC)
The self-association of Apo A-1 is described in Chapter 3. The dissociation reaction
was measured by diluting a concentrated Apo A-1 solution (160 µM) in the ITC device
and monitoring the heat changes.
Similar ITC dilution experiments were performed to test if reversible associates are also
present in 4F solutions (Figure 8). Concentrated solutions of 4F (200 µM) were injected
into PBS buffer at different temperatures. The titration experiments showed a small
endothermic reaction (≈ 1-3 kcal/mol), which could indicate dissociation. The
-0.25
0.25
0.75
1.25
1.75
2.25
5.8 6.1 6.4 6.7 7 7.3
Abso
rban
ce (2
80)
radius / cm
lastmeasurementat 3 krpmlastmeasurementat 10 krpm1.measurementat 3 krpm

3. Lipid binding of Apo A-1 mimetic peptides
91 | P a g e
0.00 0.01 0.02 0.03 0.040.00
2.00
-0.020.000.020.040.060.080.100.120.140.160.18
0 10 20 30 40
Time (min)
µcal
/sec
Molar Ratio
KCal
/Mol
e of
Inje
ctan
t
0.00 0.01 0.02 0.03 0.040.00
2.00
4.00-0.02
0.00
0.02
0.04
0.06
0.08
0.10
0.120 10 20 30 40 50
Time (min)
µcal
/sec
Molar Ratio
KCal
/Mol
e of
Inje
ctan
t
0.00 0.01 0.02 0.03 0.040.00
2.00
-0.04
-0.02
0.00
0.02
0.04
0.06
0.08
0 10 20 30 40
Time (min)
µcal
/sec
Molar Ratio
KCal
/Mol
e of
Inje
ctan
t
Figure 8: ITC measurements: Titration of 200 µM 4F into PBS buffer at 40 °C (first figure), 20°C (second
figure) and 10 °C (third figure). Reversible self-associates of a highly concentrated peptide solution could
dissociate by a dilution effect due to injection into pure buffer. The heat of reaction are slightly
decreasing , exept of the measurement at 40 °C. This could be a sign of a dissociation reaction, which is
not detectable at 40 °C either because there are no oligomers at this temperature, that could dissociate or
because the enthalpy of dissociation has its zero crossing at 40 °C.
heat peaks were almost constant at temperatures of 40 °C and decreased at lower
temperatures. The dependency on temperature might be a sign of different

3. Lipid binding of Apo A-1 mimetic peptides
92 | P a g e
monomer/oligomer equilibrium with the existence of more oligomers at lower
temperatures and vice versa. Another possibility could be that the enthalpy of
dissociation is zero at about 40 °C.
Binding of peptides 4F and P to lipid membranes
Binding of peptides to lipid membranes was investigated mainly by means of ITC.
However, ITC results do not give any information about detailed processes and the
driving force of the observed reactions. Therefore ITC experiments were compared with
several other methods to characterize the reaction in detail. Static and dynamic light
scattering were used to investigate the influence of the peptides on the vesicle structure.
Circular dichroism spectroscopy was performed to investigate secondary structural
changes of the peptides induced by lipid binding. Tryptophan fluorescence was
measured to get insight into the change of the environment of the tryptophans due to
lipid binding.
Static light scattering
Static light scattering measurements were performed to distinguish between insertion of
the peptides into vesicles or micellization of vesicles. In the first case the radius and the
scattering of the particles would slightly rise, in the second case scattering would almost
diminish due to dissolution of the 100 nm vesicles. Static light scattering measures the
intensity of light, scattered by particles in the solution of the cuvette. The scattering
intensity is proportional to the sixth power of the particles diameter.
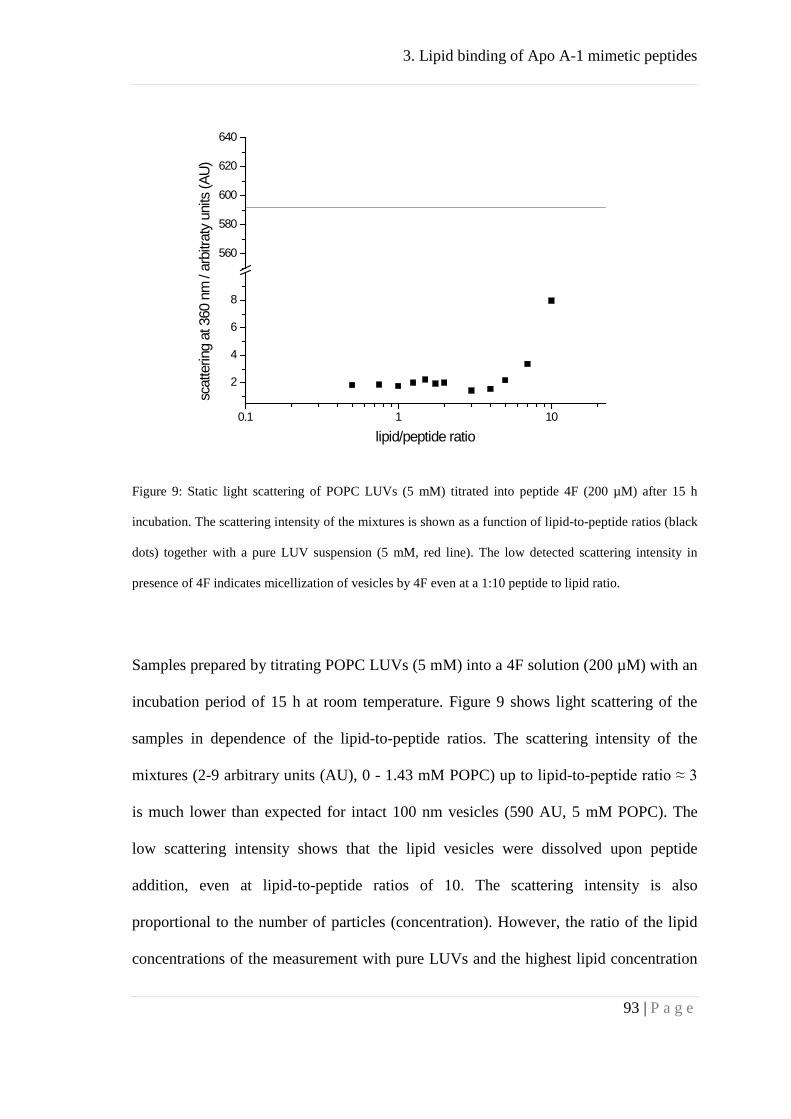
3. Lipid binding of Apo A-1 mimetic peptides
93 | P a g e
Figure 9: Static light scattering of POPC LUVs (5 mM) titrated into peptide 4F (200 µM) after 15 h
incubation. The scattering intensity of the mixtures is shown as a function of lipid-to-peptide ratios (black
dots) together with a pure LUV suspension (5 mM, red line). The low detected scattering intensity in
presence of 4F indicates micellization of vesicles by 4F even at a 1:10 peptide to lipid ratio.
Samples prepared by titrating POPC LUVs (5 mM) into a 4F solution (200 µM) with an
incubation period of 15 h at room temperature. Figure 9 shows light scattering of the
samples in dependence of the lipid-to-peptide ratios. The scattering intensity of the
mixtures (2-9 arbitrary units (AU), 0 - 1.43 mM POPC) up to lipid-to-peptide ratio ≈ 3
is much lower than expected for intact 100 nm vesicles (590 AU, 5 mM POPC). The
low scattering intensity shows that the lipid vesicles were dissolved upon peptide
addition, even at lipid-to-peptide ratios of 10. The scattering intensity is also
proportional to the number of particles (concentration). However, the ratio of the lipid
concentrations of the measurement with pure LUVs and the highest lipid concentration
0.1 1 10
2
4
6
8
560
580
600
620
640
scat
terin
g at
360
nm
/ ar
bitra
ty u
nits
(AU)
lipid/peptide ratio
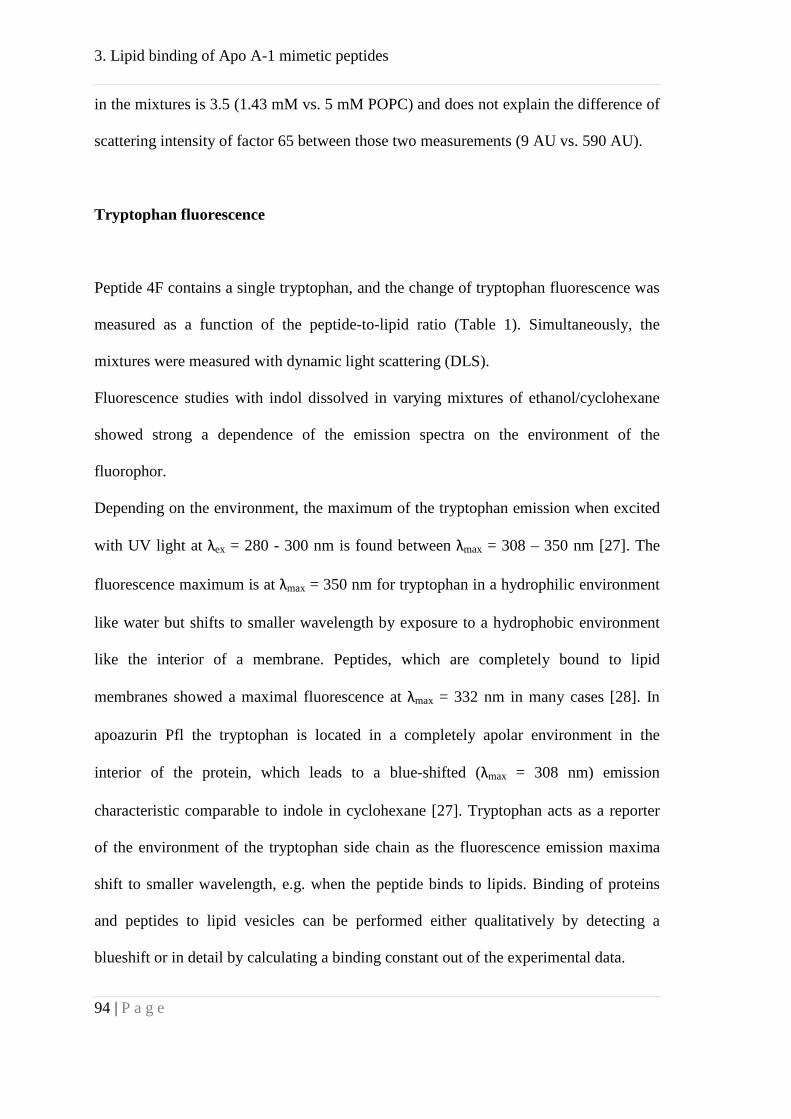
3. Lipid binding of Apo A-1 mimetic peptides
94 | P a g e
in the mixtures is 3.5 (1.43 mM vs. 5 mM POPC) and does not explain the difference of
scattering intensity of factor 65 between those two measurements (9 AU vs. 590 AU).
Tryptophan fluorescence
Peptide 4F contains a single tryptophan, and the change of tryptophan fluorescence was
measured as a function of the peptide-to-lipid ratio (Table 1). Simultaneously, the
mixtures were measured with dynamic light scattering (DLS).
Fluorescence studies with indol dissolved in varying mixtures of ethanol/cyclohexane
showed strong a dependence of the emission spectra on the environment of the
fluorophor.
Depending on the environment, the maximum of the tryptophan emission when excited
with UV light at λex = 280 - 300 nm is found between λmax = 308 – 350 nm [27]. The
fluorescence maximum is at λmax = 350 nm for tryptophan in a hydrophilic environment
like water but shifts to smaller wavelength by exposure to a hydrophobic environment
like the interior of a membrane. Peptides, which are completely bound to lipid
membranes showed a maximal fluorescence at λmax = 332 nm in many cases [28]. In
apoazurin Pfl the tryptophan is located in a completely apolar environment in the
interior of the protein, which leads to a blue-shifted (λmax = 308 nm) emission
characteristic comparable to indole in cyclohexane [27]. Tryptophan acts as a reporter
of the environment of the tryptophan side chain as the fluorescence emission maxima
shift to smaller wavelength, e.g. when the peptide binds to lipids. Binding of proteins
and peptides to lipid vesicles can be performed either qualitatively by detecting a
blueshift or in detail by calculating a binding constant out of the experimental data.

3. Lipid binding of Apo A-1 mimetic peptides
95 | P a g e
In Figure 10 the fluorescence emission spectra of the samples (Table 1) are shown. The
change of the emission maxima is depicted in Figure 11. The emission maxima shifted
to smaller wavelength (λmax = 335 nm) with increasing lipid-to-peptide ratios. This
indicates a binding of peptides to lipid membranes as eluded above. Assuming the
formation of an α-helix of all residues, the helical wheel representation suggests the
tryptophan to be located on the hydrophilic side, but near the interface of the
amphiphilic plane, which is going through the long axis of the helix Figure 1. Hence,
binding of the nonpolar side of the helix to lipid membranes would position this residue
in a nonpolar environment.
Table 1: Table of 4F and POPC lipid mixtures and resulting sizes used for tryptophan – fluorescence and
dynamic light scattering measurements. Sizes and the polydispersity indices (PDI) were measured by
DLS. Asterisks on the PDI values indicate bad quality of correlation diagrams, the sizes should be
interpreted with caution in these cases.
Sample Peptide POPC SUVs L-to-P ratio Fluor. max. Size by DLS PDI (DLS)
No µM mM nm nm
1 100 0 0 349 - -
2 100 0.25 2.5 339 10.8 0.47*
3 100 0.5 5 337 26.8 0.63
4 100 1 10 336 583.1 0.50*
5 100 1.85 18.5 334.5 655.4 0.54*
6 0 1.85 - - 35.0 0.21
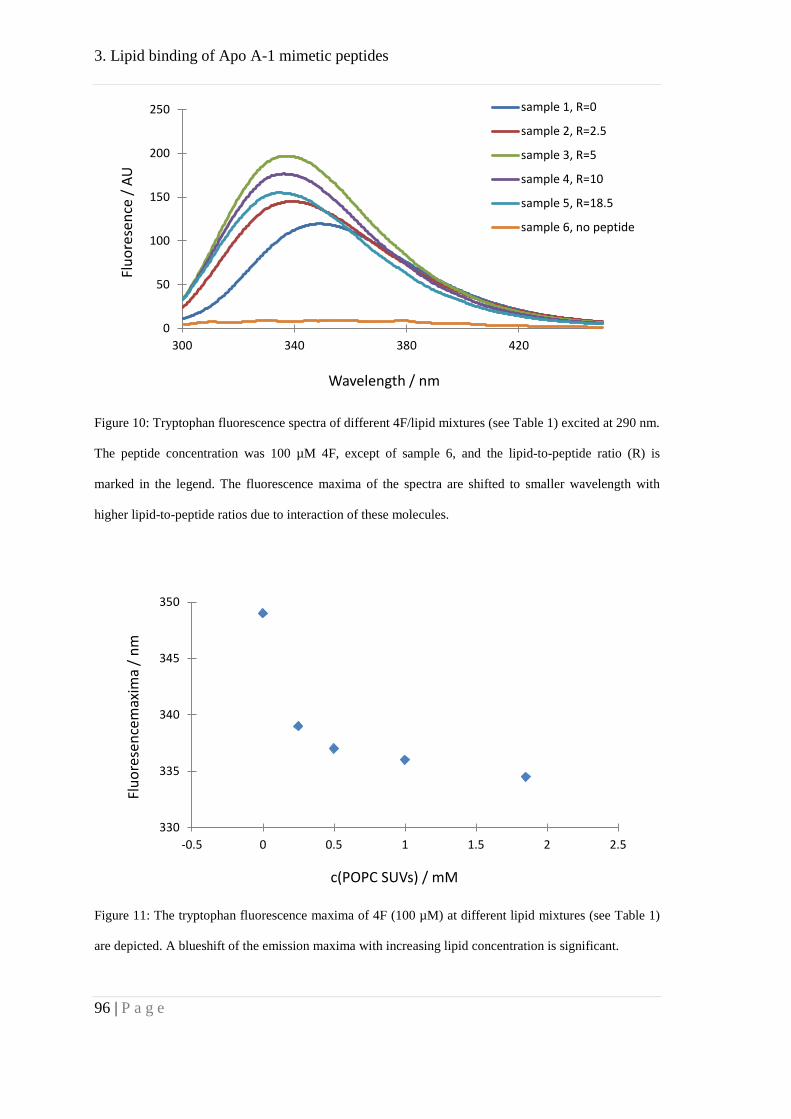
3. Lipid binding of Apo A-1 mimetic peptides
96 | P a g e
Figure 10: Tryptophan fluorescence spectra of different 4F/lipid mixtures (see Table 1) excited at 290 nm.
The peptide concentration was 100 µM 4F, except of sample 6, and the lipid-to-peptide ratio (R) is
marked in the legend. The fluorescence maxima of the spectra are shifted to smaller wavelength with
higher lipid-to-peptide ratios due to interaction of these molecules.
Figure 11: The tryptophan fluorescence maxima of 4F (100 µM) at different lipid mixtures (see Table 1)
are depicted. A blueshift of the emission maxima with increasing lipid concentration is significant.
0
50
100
150
200
250
300 340 380 420
Fluo
rese
nce
/ AU
Wavelength / nm
sample 1, R=0
sample 2, R=2.5
sample 3, R=5
sample 4, R=10
sample 5, R=18.5
sample 6, no peptide
330
335
340
345
350
-0.5 0 0.5 1 1.5 2 2.5
Fluo
rese
ncem
axim
a / n
m
c(POPC SUVs) / mM
3. Lipid binding of Apo A-1 mimetic peptides
97 | P a g e
Dynamic light scattering (DLS)
Figure 12 shows autocorrelation curves of various lipid-to-peptide ratios (Table 1, same
mixtures as used for Trp-fluorescence) by means of DLS measurements. The inflexion
point of autocorrelation curves gives a hint of the particle size. The higher the x-value of
the inflexion point the bigger are the particles. Table 1 contains volume weighted size
distributions. The particle size of the SUVs (35 nm) decreased at small lipid-to-peptide
ratios to 10.8 nm, but increased with increasing lipid-to-peptide ratios to 655.4 nm. This
was also easily observed by eye, as the slightly turbid SUV suspension turned into a
clear solution at a lipid-to-peptide ratio of 2.5, but got milky beginning at lipid-to-
peptide ratios of 10.
In comparison to results obtained by static light scattering the particle size at a lipid-to-
peptide ratio of ten must be different. While static light scattering indicate very small
particles like micelles, the size of the DLS measurement is calculated to be 583 nm.
This discrepancy might be explained by different reaction conditions. In the static light
scattering the concentration of 4F was 143 µM and LUVs were used, while dynamic
light scattering was performed with 100 µM 4F and SUVs.

3. Lipid binding of Apo A-1 mimetic peptides
98 | P a g e
Figure 12: Autocorrelation curves of 100 µM 4F and various POPC lipid concentrations (see Table 1)
used for tryptophan fluorescence were also measured by DLS. The peptide concentration was 100 µM 4F,
except for sample 6 (pure lipid), and the lipid-to-peptide ratio (R) is marked in the inset. The x-value of
the inflexion point correlates with the size of particles in solution. The orange line is a measurement of
the peptide without lipids. Small lipid concentrations decrease, whereas high concentrations increase the
size of the particles at a constant peptide concentration of 100 µM 4F.
Circular dichroism spectroscopy (CD)
The secondary structure of the peptide 4F was checked with CD spectroscopy, without
and with different amounts of POPC lipids (Table 2). In Figure 13 CD spectra at
different lipid-to-peptide ratios are shown for 4F. Analysis of the spectra with three
different algorithms of the software CDpro is depicted in Figure 14 as a function of the
lipid concentration. Free peptide consisted mostly of α-helix (≈ 40 %), about 35 % β-
sheet&β-turn and 25 % of random coil structure. The α-helical part of the peptides
increased with increasing lipid-to-peptide ratios at the expense of β-sheet&β-turn and
-0.2
0
0.2
0.4
0.6
0.8
1
0.1 10 1000 100000 10000000
Corr
elat
ion
Time / µs
sample 1, R=0
sample 2, R=2.5
sample 3, R=5
sample 4, R=10
sample 5, R=18.5
sample 6, no peptide

3. Lipid binding of Apo A-1 mimetic peptides
99 | P a g e
random coil fractions (Figure 14). The results suggest that binding of the peptide 4F to
lipids induce a random coil and β-sheet&β-turn to α-helix transition.
Table 2: Circular dichroism (CD) measurements with mixtures of the peptide 4F together with various
POPC LUV concentrations. Chloride ions of the PBS buffer were exchanged by fluoride.
Figure 13: Circular dichroism spectra of 4F at different peptide to lipid ratios (see Table 2). The peptide
concentration was 176 µM 4F, except of sample 1, and the lipid-to-peptide ratio (R) is marked in the
inset. The spectra suggest predominantly α-helical secondary structure, which even increased at higher
lipid-to-peptide ratios.
-40
-20
0
20
40
60
180 200 220 240 260
Mol
ar e
llipt
icity
/ °·c
m2·
dmol
-1
Wavelength / nm
sample 1, no peptide
sample 2, R=0.4
sample 3, R=1.7
sample 4, R=3.3
sample 5, R=0
Sample LUVs 4F L-to-P ratio
No µM µM
1 588 0 -
2 74 176 0.4
3 294 176 1.7
4 588 176 3.3
5 0 176 0
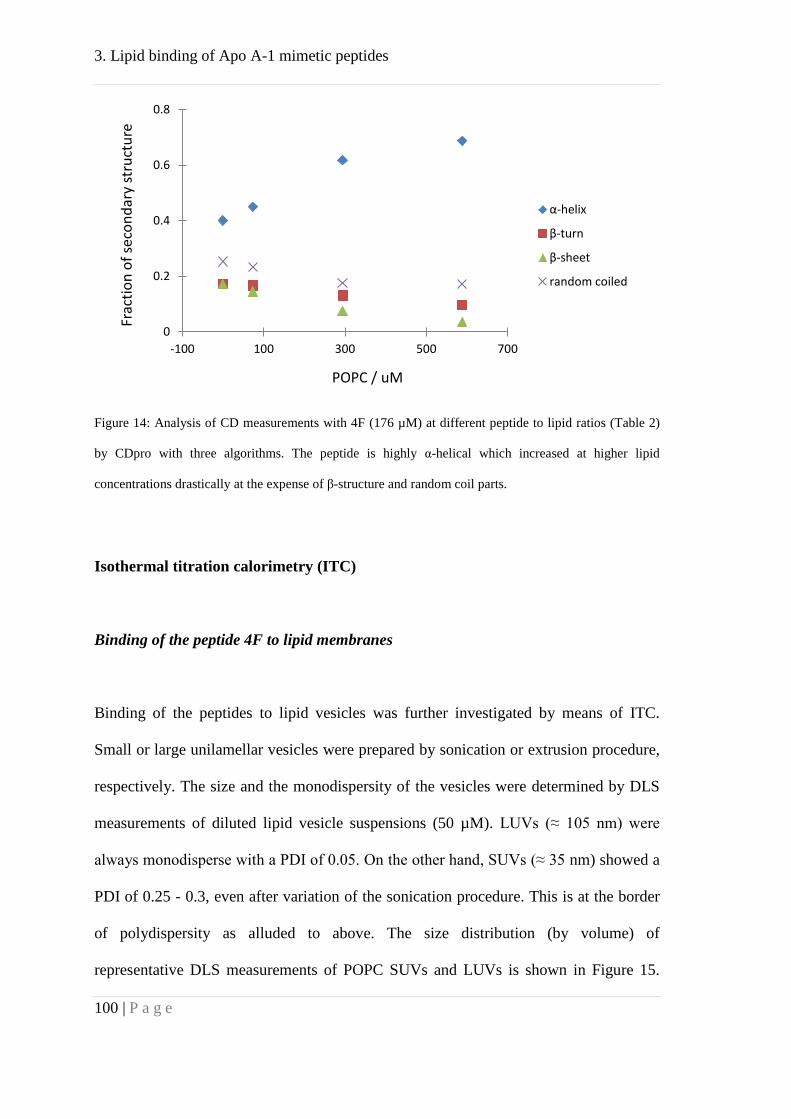
3. Lipid binding of Apo A-1 mimetic peptides
100 | P a g e
Figure 14: Analysis of CD measurements with 4F (176 µM) at different peptide to lipid ratios (Table 2)
by CDpro with three algorithms. The peptide is highly α-helical which increased at higher lipid
concentrations drastically at the expense of β-structure and random coil parts.
Isothermal titration calorimetry (ITC)
Binding of the peptide 4F to lipid membranes
Binding of the peptides to lipid vesicles was further investigated by means of ITC.
Small or large unilamellar vesicles were prepared by sonication or extrusion procedure,
respectively. The size and the monodispersity of the vesicles were determined by DLS
measurements of diluted lipid vesicle suspensions (50 µM). LUVs (≈ 105 nm) were
always monodisperse with a PDI of 0.05. On the other hand, SUVs (≈ 35 nm) showed a
PDI of 0.25 - 0.3, even after variation of the sonication procedure. This is at the border
of polydispersity as alluded to above. The size distribution (by volume) of
representative DLS measurements of POPC SUVs and LUVs is shown in Figure 15.
0
0.2
0.4
0.6
0.8
-100 100 300 500 700
Frac
tion
of se
cond
ary
stru
ctur
e
POPC / uM
α-helix
β-turn
β-sheet
random coiled

3. Lipid binding of Apo A-1 mimetic peptides
101 | P a g e
The distribution analysis with SUVs showed the main peak at ≈ 35 nm and a second
second small peak at ≈ 180 nm. In comparison, the analysis of LUVs indicated only the
main peak at ≈ 105 nm.
Figure 15: Size distribution by volume for POPC SUVs (A, 18.5 μM) and LUVs (B, 50 μM) determined
by dynamic light scattering.
A typical ITC titration is shown in Figure 16 A. Figure 16 A shows 2 µL injections
(19 times) of POPC LUVs (5 mM) into 203 µL of 200 µM 4F dissolved in PBS buffer
at 40 °C. The spacing of the injections was increased to a maximum of 300 s at lipid-to-
peptide ratios between 1 and 2 as a slow kinetics of this exothermic reaction was
observed in this range.
At the first injection probably most of the injected lipid was bound as 4F was in excess
over lipid. As more vesicles were injected, the concentration of free peptide decreased,
0
10
20
30
0.1 1 10 100 1000 10000
Volu
me
(%)
Size (d.nm)
0
10
20
30
0.1 1 10 100 1000 10000
Volu
me
(%)
Size (d.nm)
A
B

3. Lipid binding of Apo A-1 mimetic peptides
102 | P a g e
and the heats of reaction became progressively smaller until all peptide was bound to
lipid membranes. Further injections did not yield any significant heat changes.
Integration of the heat flow over time resulted in the heat of binding for each titration
step and is plotted as a function of the lipid-to-peptide ratio in Figure 16 B. The molar
binding enthalpy of 4F is then determined from the total heat released in the titration (≈
-216.7 μcal) and the amount of peptide in the calorimeter cell (40.6 nmol). Therefore
the heat of reaction is ΔH ≈ -5.34 kcal/mol for the experiment shown in Figure 16.
For a complete thermodynamic characterization of the binding process including the
binding constant, K, and the entropy, ΔS, the calorimetric data were analyzed with a
multisite binding model, which was also used to describe the binding equilibrium of
other peptides [20, 29]. In this model, the peptide is supposed to have n independent and
equivalent binding sites for a ligand such as POPC. The binding model is represented by
the following equation:
(1)
[P] and [P]b are the concentrations of free and bound peptide, respectively, [L]t is the
total concentration of ligand, that is POPC lipid. In the analysis, the lipid concentration
[L]t may differ from the nominal concentration. This is caused by a peptide binding only
to the vesicle outside (only 50 % of the lipid). In contrast 100 % lipid is available upon
micellization The concentration of the lipid vesicles was varied in order to give
consideration to the fact that only the outer lipid leaflet of intact vesicles is exposed to
the peptides, whereas all lipids are exposed after micellization of vesicles. Practically
this was done by to minimizing the mean square deviation of the fit at a fixed
stoichiometry of n = 1. K is the intrinsic binding constant, and the stochiometry n is the
[ ][ ]
[ ][ ]PKPnK
LP
t
b
+=
1

3. Lipid binding of Apo A-1 mimetic peptides
103 | P a g e
number of peptide molecules bound per ligand. The stoichiometry could also be derived
directly from the experimental binding isotherm by the ratio at the midpoint of the
transition. In consequence of mass conservation, the concentration of bound peptide can
be described by the following equation:
(2)
The index t denotes the total concentration of peptide and lipid in the calorimeter cell
after each injection step. The peptide concentration changes during the titration with
lipid vesicles due to dilution effects. The concentration of bound peptide is linked to the
calorimetric data by the following equation:
(3)
where δQi is the heat absorbed or released at the ith injection. ∆𝐻𝑝𝑒𝑝𝑡𝑖𝑑𝑒0 is the binding
enthalpy of peptide, δ[P]b,i is the change (increase) in bound peptide concentration upon
injection i, and V is the volume of the calorimeter cell. The solid line in Figure 16 is the
best least-squares fit to the data using 1-3 with the following set of parameters: n = 1, K
= 7.52 · 104 M-1, and ∆𝐻𝑝𝑒𝑝𝑡𝑖𝑑𝑒0 = -5.73 kcal/mol Table 3. ∆𝐻𝑝𝑒𝑝𝑡𝑖𝑑𝑒0 is consistent with
the simple calculations given above. The entropy ΔS is calculated by the binding
constant (calculated with K), the enthalpy of reaction and the temperature.
[ ] [ ] [ ] [ ] [ ] [ ] [ ]ttttttb PLnLnPK
LnPK
P 41211
21 2
−
++−
++=
[ ] VPHQ ibpeptidei ,0 δδ ∆=
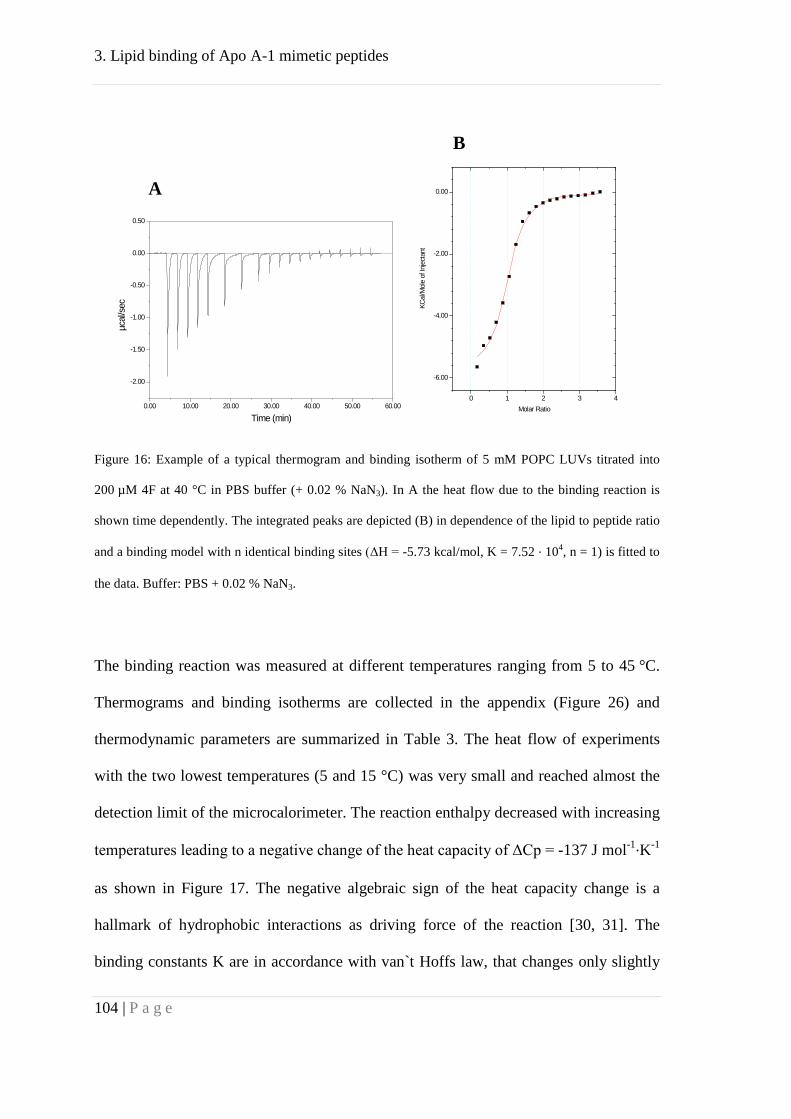
3. Lipid binding of Apo A-1 mimetic peptides
104 | P a g e
Figure 16: Example of a typical thermogram and binding isotherm of 5 mM POPC LUVs titrated into
200 µM 4F at 40 °C in PBS buffer (+ 0.02 % NaN3). In A the heat flow due to the binding reaction is
shown time dependently. The integrated peaks are depicted (B) in dependence of the lipid to peptide ratio
and a binding model with n identical binding sites (ΔH = -5.73 kcal/mol, K = 7.52 · 104, n = 1) is fitted to
the data. Buffer: PBS + 0.02 % NaN3.
The binding reaction was measured at different temperatures ranging from 5 to 45 °C.
Thermograms and binding isotherms are collected in the appendix (Figure 26) and
thermodynamic parameters are summarized in Table 3. The heat flow of experiments
with the two lowest temperatures (5 and 15 °C) was very small and reached almost the
detection limit of the microcalorimeter. The reaction enthalpy decreased with increasing
temperatures leading to a negative change of the heat capacity of ΔCp = -137 J mol-1·K-1
as shown in Figure 17. The negative algebraic sign of the heat capacity change is a
hallmark of hydrophobic interactions as driving force of the reaction [30, 31]. The
binding constants K are in accordance with van`t Hoffs law, that changes only slightly
0.00 10.00 20.00 30.00 40.00 50.00 60.00
-2.00
-1.50
-1.00
-0.50
0.00
0.50
Time (min)
µcal
/sec
0 1 2 3 4
-6.00
-4.00
-2.00
0.00
Molar Ratio
KCal
/Mol
e of
Inje
ctan
t
A
B

3. Lipid binding of Apo A-1 mimetic peptides
105 | P a g e
with the temperature in a range of K ≈ 5 • 104 M-1 within the errors of the measurement
(Figure 18). Hence, also the Gibbs free reaction enthalpy does not change significantly.
A decrease of enthalpy and entropy of reaction with increasing temperature at an almost
constant Gibbs free enthalpy was observed. This process is called enthalpy-entropy-
compensation and found in many other reactions. Remarkable is the increase in lipid
accessibility from about 70 to 90 % of the total lipid amount at 45 °C indicating almost
complete dissolution of the vesicles (Table 3).
Figure 17: Temperature dependency of the reaction enthalpy. Measurements of 5 mM POPC LUVs
titrated into 200 µM 4F are shown. The change of heat capacity of -137 cal mol-1 K-1 is derived by the
slope of the linear fit. The negative algebraic sign is a hallmark of hydrophobic interactions.
y = -137.34x + 255.49 R² = 0.9835
-7000
-5000
-3000
-1000
0 10 20 30 40 50
Enth
alpy
/ ca
l/mol
Temperature / °C
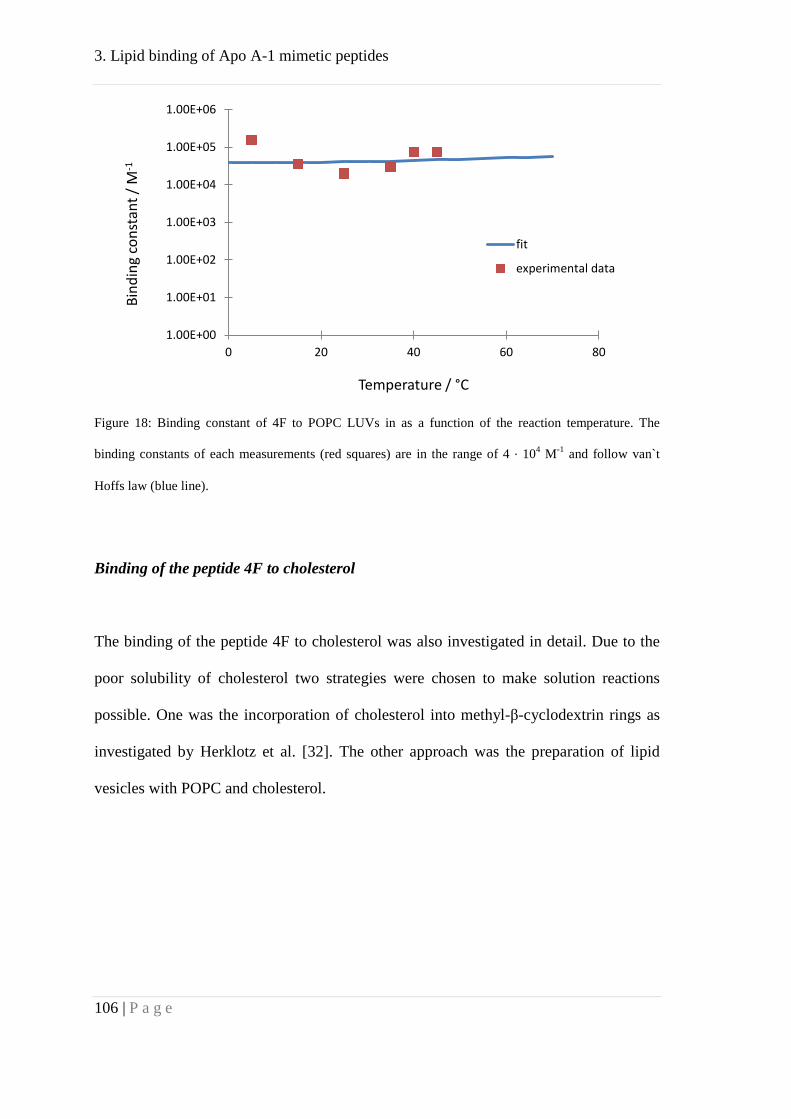
3. Lipid binding of Apo A-1 mimetic peptides
106 | P a g e
Figure 18: Binding constant of 4F to POPC LUVs in as a function of the reaction temperature. The
binding constants of each measurements (red squares) are in the range of 4 · 104 M-1 and follow van`t
Hoffs law (blue line).
Binding of the peptide 4F to cholesterol
The binding of the peptide 4F to cholesterol was also investigated in detail. Due to the
poor solubility of cholesterol two strategies were chosen to make solution reactions
possible. One was the incorporation of cholesterol into methyl-β-cyclodextrin rings as
investigated by Herklotz et al. [32]. The other approach was the preparation of lipid
vesicles with POPC and cholesterol.
1.00E+00
1.00E+01
1.00E+02
1.00E+03
1.00E+04
1.00E+05
1.00E+06
0 20 40 60 80
Bind
ing
cons
tant
/ M
-1
Temperature / °C
fit
experimental data

3. Lipid binding of Apo A-1 mimetic peptides
107 | P a g e
Cholesterol in m-β-Cyclodextrin
Cyclodextrins are cyclic oligosaccharides. In particular, β-cyclodextrin is composed of
seven glycopyranoside units, which are topologically organized as a toroid with a
smaller and a larger opening, exposing primary and secondary hydroxyl groups to the
solvent. Hence the molecules are well soluble in water. The ring interior is less
hydrophilic than the aqueous phase, facilitating the incorporation of hydrophobic
molecules such as cholesterol. The methylated m-β-cyclodextrin has an enhanced
affinity to cholesterol. In cell culture it is used together with cholesterol in order to load
cells with cholesterol.
Pure m-β-cyclodextrin (20 mM) or m-β-cyclodextrin (20 mM) containing 1 mM
cholesterol were filled into the syringe of the titration calorimeter and were injected into
a solution of 4F (100 µM) in the cell. Injection of pure m-β-cyclodextrin into peptide
yielded relatively high (≈ 20 µcal) and a linearly decreasing heat release. This is typical
for a dilution reaction and does not indicate direct binding of the peptide to m-β-
cyclodextrin (Figure 19, below). In contrast ITC experiments of m-β-cyclodextrin (20
mM) with incorporated cholesterol (1 mM) shows the sigmoidal shape of a multi-site
binding isotherm (Figure 19).
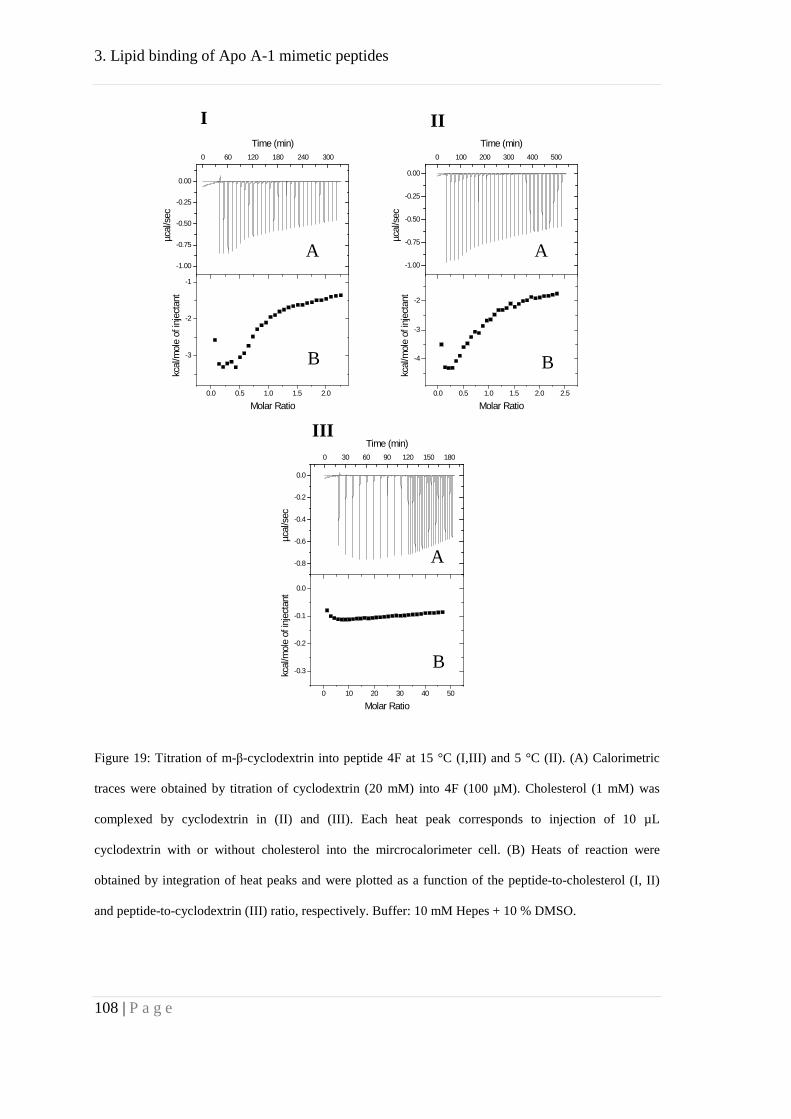
3. Lipid binding of Apo A-1 mimetic peptides
108 | P a g e
Figure 19: Titration of m-β-cyclodextrin into peptide 4F at 15 °C (I,III) and 5 °C (II). (A) Calorimetric
traces were obtained by titration of cyclodextrin (20 mM) into 4F (100 µM). Cholesterol (1 mM) was
complexed by cyclodextrin in (II) and (III). Each heat peak corresponds to injection of 10 µL
cyclodextrin with or without cholesterol into the mircrocalorimeter cell. (B) Heats of reaction were
obtained by integration of heat peaks and were plotted as a function of the peptide-to-cholesterol (I, II)
and peptide-to-cyclodextrin (III) ratio, respectively. Buffer: 10 mM Hepes + 10 % DMSO.
0.0 0.5 1.0 1.5 2.0
-3
-2
-1
-1.00
-0.75
-0.50
-0.25
0.00
0 60 120 180 240 300
Time (min)
µcal
/sec
Molar Ratio
kcal
/mol
e of
inje
ctan
t
0.0 0.5 1.0 1.5 2.0 2.5
-4
-3
-2
-1.00
-0.75
-0.50
-0.25
0.00
0 100 200 300 400 500
Time (min)
µcal
/sec
Molar Ratiokc
al/m
ole
of in
ject
ant
0 10 20 30 40 50
-0.3
-0.2
-0.1
0.0
-0.8
-0.6
-0.4
-0.2
0.0
0 30 60 90 120 150 180
Time (min)
µcal
/sec
Molar Ratio
kcal
/mol
e of
inje
ctan
t
I II
III
A A
A
B B
B
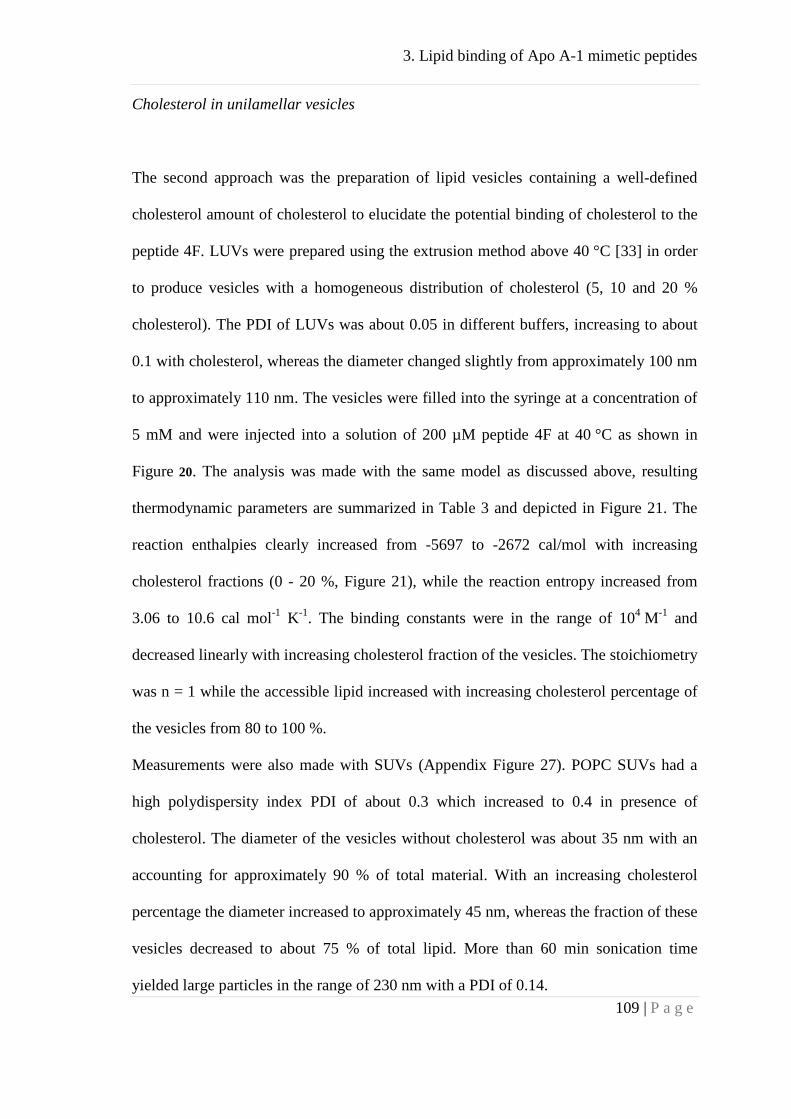
3. Lipid binding of Apo A-1 mimetic peptides
109 | P a g e
Cholesterol in unilamellar vesicles
The second approach was the preparation of lipid vesicles containing a well-defined
cholesterol amount of cholesterol to elucidate the potential binding of cholesterol to the
peptide 4F. LUVs were prepared using the extrusion method above 40 °C [33] in order
to produce vesicles with a homogeneous distribution of cholesterol (5, 10 and 20 %
cholesterol). The PDI of LUVs was about 0.05 in different buffers, increasing to about
0.1 with cholesterol, whereas the diameter changed slightly from approximately 100 nm
to approximately 110 nm. The vesicles were filled into the syringe at a concentration of
5 mM and were injected into a solution of 200 µM peptide 4F at 40 °C as shown in
Figure 20. The analysis was made with the same model as discussed above, resulting
thermodynamic parameters are summarized in Table 3 and depicted in Figure 21. The
reaction enthalpies clearly increased from -5697 to -2672 cal/mol with increasing
cholesterol fractions (0 - 20 %, Figure 21), while the reaction entropy increased from
3.06 to 10.6 cal mol-1 K-1. The binding constants were in the range of 104 M-1 and
decreased linearly with increasing cholesterol fraction of the vesicles. The stoichiometry
was n = 1 while the accessible lipid increased with increasing cholesterol percentage of
the vesicles from 80 to 100 %.
Measurements were also made with SUVs (Appendix Figure 27). POPC SUVs had a
high polydispersity index PDI of about 0.3 which increased to 0.4 in presence of
cholesterol. The diameter of the vesicles without cholesterol was about 35 nm with an
accounting for approximately 90 % of total material. With an increasing cholesterol
percentage the diameter increased to approximately 45 nm, whereas the fraction of these
vesicles decreased to about 75 % of total lipid. More than 60 min sonication time
yielded large particles in the range of 230 nm with a PDI of 0.14.
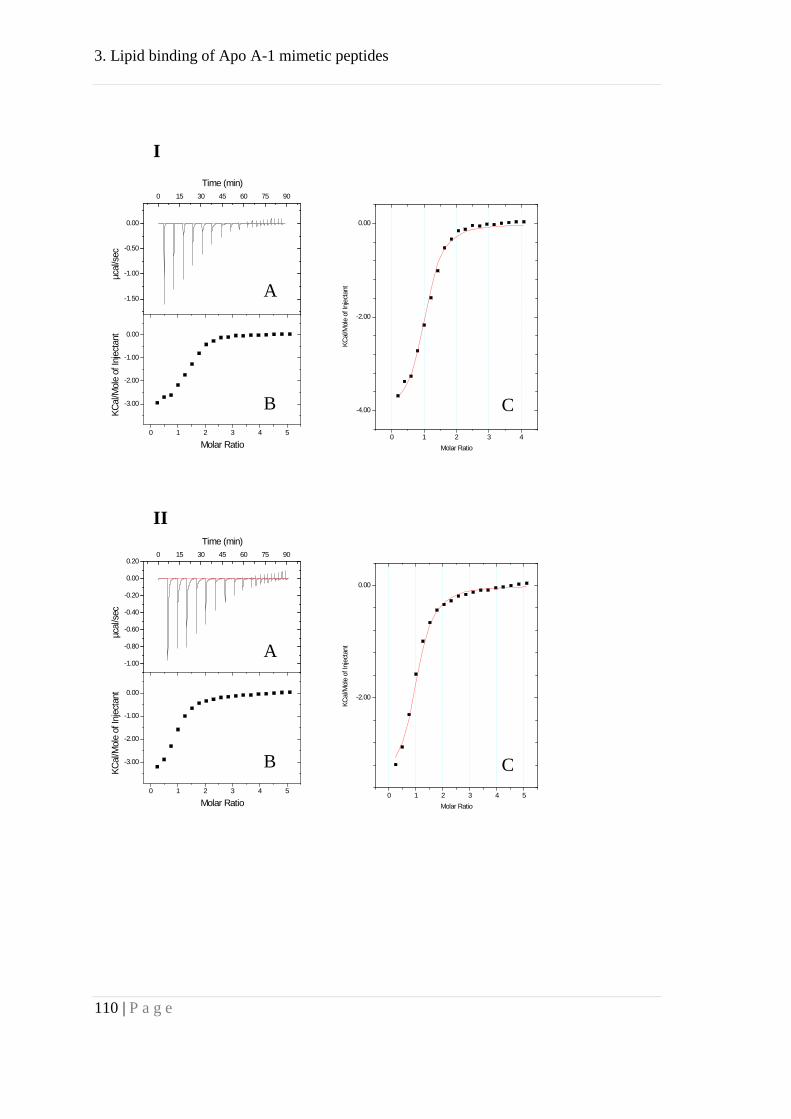
3. Lipid binding of Apo A-1 mimetic peptides
110 | P a g e
0 1 2 3 4 5
-3.00
-2.00
-1.00
0.00
-1.50
-1.00
-0.50
0.00
0 15 30 45 60 75 90
Time (min)
µcal
/sec
Molar Ratio
KCal
/Mol
e of
Inje
ctan
t
0 1 2 3 4
-4.00
-2.00
0.00
Molar Ratio
KCal
/Mol
e of
Inje
ctan
t
0 1 2 3 4 5
-3.00
-2.00
-1.00
0.00
-1.00
-0.80
-0.60
-0.40
-0.20
0.00
0.200 15 30 45 60 75 90
Time (min)
µcal
/sec
Molar Ratio
KCal
/Mol
e of
Inje
ctan
t
0 1 2 3 4 5
-2.00
0.00
Molar Ratio
KCal
/Mol
e of
Inje
ctan
t
B
B
A
A
C
C
I
II

3. Lipid binding of Apo A-1 mimetic peptides
111 | P a g e
0 1 2 3 4 5
-2.00
-1.00
0.00
1.00-0.60
-0.40
-0.20
0.00
0 15 30 45 60 75 90
Time (min)µc
al/s
ec
Molar Ratio
KCal
/Mol
e of
Inje
ctan
t
0 1 2 3 4 5
-2.00
0.00
Molar Ratio
KCal
/Mol
e of
Inje
ctan
t
Figure 20: Titration of POPC LUVs with cholesterol into peptide 4F at 40 °C. (A): Calorimetric traces
were obtained by titration of POPC LUVs (5 mM) with cholesterol (I: 5 %, II: 10 %, III: 20 %) into 4F
(200 µM). Each heat peak corresponds to injection of 2 µL lipids into the mircrocalorimeter cell. (B):
Heats of reaction were obtained by integration of heat peaks and were plotted as a function of the peptide-
to-lipid ratio. This experimentally obtained binding isotherm was fitted (I: ΔH = -4.06 kcal/mol, K = 6.40
· 104, n = 1; II: ΔH = -3.53 kcal/mol, K = 4.20 · 104, n = 1; III: ΔH = -2.67 kcal/mol, K = 1.49 · 104, n = 1)
with a multisite-binding model in (C). Buffer: PBS + 0.02 % NaN3.
B
A
C
III

3. Lipid binding of Apo A-1 mimetic peptides
112 | P a g e
Figure 21: Binding of peptide 4F to lipid vesicles (LUVs) containing cholesterol. Above: Reaction
enthalpy of 4F to POPC/cholesterol LUVs as a function of cholesterol content. Below: Binding constants
of 4F to POPC/cholesterol LUVs as a function of the cholesterol percentage. Multi-site binding model
with a POPC:4F stoichiometry of n = 1.
y = 141.12x - 5232.8 R² = 0.877
-7000
-5000
-3000
-1000
0 5 10 15 20 25
Enth
alpy
/ ca
l/mol
Cholesterol / %
y = -3098.9x + 76140 R² = 0.9894
0.00E+00
2.00E+04
4.00E+04
6.00E+04
8.00E+04
0 5 10 15 20 25
Bind
ing
cons
tant
/ M
-1
Cholesterol / %
3. Lipid binding of Apo A-1 mimetic peptides
113 | P a g e
Binding of the peptide P to lipid membranes
Peptide P corresponds to a 4F dimer covalently bridged by a proline. It exhibits a
greater in vivo HDL binding and anti-inflammatory potency [10]. In order to avoid
aggregation of peptide P 10 % DMSO was added to the buffer. The experiments were
performed with POPC LUVs as well as with SUVs. Lipid vesicles were filled into the
syringe at a concentration of 3 mM (LUVs) and 1 mM (SUVs) and titrated into a
solution of peptide P at a concentration of either 80 or 40 µM. The ITC titration results
at 40 °C and the integrated heat peaks are shown in Figure 22. Conspicuous is the
devolution of the heat flow during the first injection steps. The enthalpy first decreased,
increased for a short period and then decreased again. One may speculate that an initial
micellization reaction is reversed as more lipid is added. The experimental binding
isotherm of reactions with LUVs and SUVs at 40 °C led to a binding constant of the
order of 105 M-1 which was about one order of magnitude larger than that of the smaller
peptide 4F. However, the stoichiometry is quite different with 2 and 0.4 and also the
accessible lipid percentage of 65 and 100 % for LUVs and SUVs, respectively. In
comparison to 4F the enthalpy of reaction is much more exothermic in case of 4F
(4F/LUVs: ΔH = -5726 vs. P/LUVs: ΔH = -1751 kcal/mol, P/SUVs: ΔH = -3624
kcal/mol, Table 3).
However, reaction conditions were different, due to the presence of DMSO in solutions
of the peptide P. Therefore experiments were also done with 4F and POPC LUVs in
buffer with and without DMSO at 40 °C.

3. Lipid binding of Apo A-1 mimetic peptides
114 | P a g e
Figure 22: Titration of POPC LUVs and SUVs into peptide P at 40 °C. (A): Calorimetric traces were
obtained by titration of POPC LUVs (I: 3 mM) and SUVs (II: 1 mM) into P (I: 80 µM, II: 40 µM). Each
heat peak corresponds to injection of 10 µL (I) and 5 µL (II) lipids into the mircrocalorimeter cell. (B):
Heats of reaction were obtained by integration of heat peaks and were plotted as a function of the peptide-
to-lipid ratio. This experimentally obtained binding isotherm was fitted with a multisite-binding model (I:
ΔH = -1.75 kcal/mol, K = 9.87 · 104, n = 0.4; II: ΔH = -3.62 kcal/mol, K = 2.06 · 105, n = 2) in (C).
Buffer: 10 mM Hepes + 10 % DMSO
0.0 0.5 1.0-2
0
-1.5
-1.0
-0.5
0.0
0 100 200 300 400
Time (min)
µcal
/sec
Molar Ratio
kcal
/mol
e of
inje
ctan
t
0.0 0.2 0.4 0.6 0.8 1.0
-1.8
-1.6
-1.4
-1.2
-1.0
-0.8
-0.6
-0.4
-0.2
0.0
Molar Ratio
kcal
/mol
e of
inje
ctan
t
0 1 2 3 4 5 6
-2
0-0.5
-0.4
-0.3
-0.2
-0.1
0.0
0 100 200 300 400 500 600
Time (min)
µcal
/sec
Molar Ratio
kcal
/mol
e of
inje
ctan
t
0 1 2 3 4-4.0
-3.5
-3.0
-2.5
-2.0
-1.5
-1.0
-0.5
Molar Ratio
kcal
/mol
e of
inje
ctan
t
I
II
A
A
B
B
C
C

3. Lipid binding of Apo A-1 mimetic peptides
115 | P a g e
Figure 23: Titration of POPC LUVs into peptide 4F at 40 °C. (A): Calorimetric traces were obtained by
titration of POPC LUVs (3 mM) and into 4F (160 µM). Each heat peak corresponds to injection of 10 µL
lipids into the mircrocalorimeter cell. (B): Heats of reaction were obtained by integration of heat peaks
and were plotted as a function of the peptide-to-lipid ratio. This experimentally obtained binding isotherm
was fitted with a multisite-binding model (ΔH = -8.93 kcal/mol, K = 4.8 · 104, n = 1) in (C). Buffer: 10
mM Hepes + 10 % DMSO.
Titration isotherms of 4F in the presence or absence of DMSO were very similar (0 %
DMSO: K = 7.52 · 104 versus 10 % DMSO: K = 4.80 · 104 M-1) at a stoichiometry of
n = 1. The enthalpy was more exothermic in presence of DMSO in the buffer (-8926
versus -5726 kcal/mol), whereas the reaction entropy was dramatically smaller in the
measurement with DMSO and changed sign (-7.09 versus 4.02 cal mol-1 K-1).
Comparison of the same ITC experiments with SUVs and LUVs in buffer with 10 %
DMSO injected into a solution of 4F at 40 °C yielded similar binding constants (SUVs:
0 1 2 3 4
-6
-4
-2
0
-5
0
0 100 200 300 400 500
Time (min)µc
al/s
ec
Molar Ratio
kcal
/mol
e of
inje
ctan
t
0 1 2 3 4
-8
-7
-6
-5
-4
-3
-2
-1
0
Molar Ratio
kcal
/mol
e of
inje
ctan
t
III
A
B C
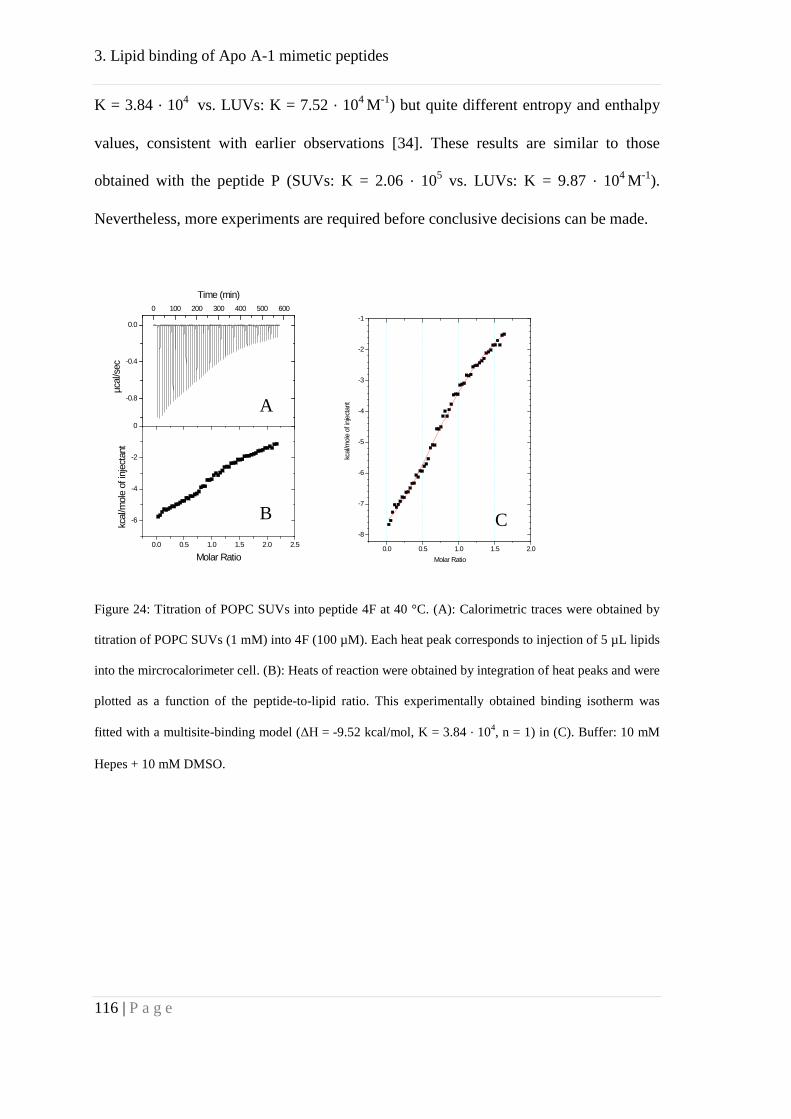
3. Lipid binding of Apo A-1 mimetic peptides
116 | P a g e
K = 3.84 · 104 vs. LUVs: K = 7.52 · 104 M-1) but quite different entropy and enthalpy
values, consistent with earlier observations [34]. These results are similar to those
obtained with the peptide P (SUVs: K = 2.06 · 105 vs. LUVs: K = 9.87 · 104 M-1).
Nevertheless, more experiments are required before conclusive decisions can be made.
Figure 24: Titration of POPC SUVs into peptide 4F at 40 °C. (A): Calorimetric traces were obtained by
titration of POPC SUVs (1 mM) into 4F (100 µM). Each heat peak corresponds to injection of 5 µL lipids
into the mircrocalorimeter cell. (B): Heats of reaction were obtained by integration of heat peaks and were
plotted as a function of the peptide-to-lipid ratio. This experimentally obtained binding isotherm was
fitted with a multisite-binding model (ΔH = -9.52 kcal/mol, K = 3.84 · 104, n = 1) in (C). Buffer: 10 mM
Hepes + 10 mM DMSO.
0.0 0.5 1.0 1.5 2.0 2.5
-6
-4
-2
0
-0.8
-0.4
0.0
0 100 200 300 400 500 600
Time (min)
µcal
/sec
Molar Ratio
kcal
/mol
e of
inje
ctan
t
0.0 0.5 1.0 1.5 2.0
-8
-7
-6
-5
-4
-3
-2
-1
Molar Ratio
kcal
/mol
e of
inje
ctan
t
C
A
B
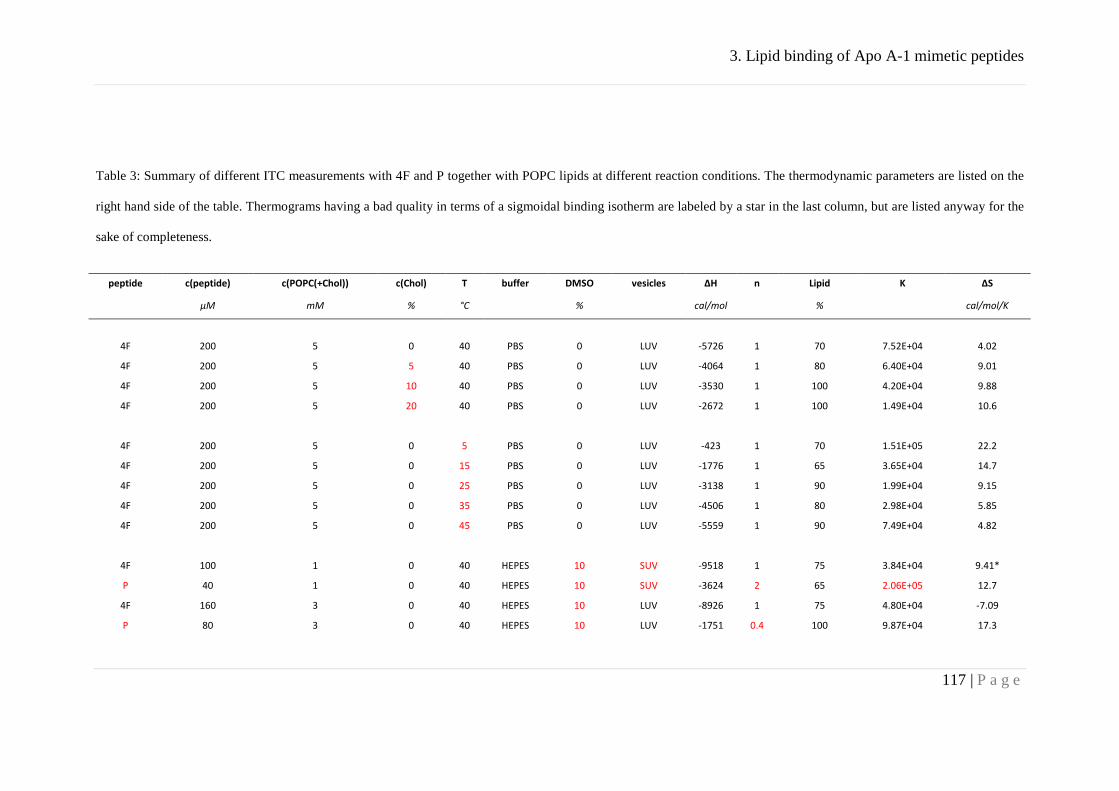
3. Lipid binding of Apo A-1 mimetic peptides
117 | P a g e
Table 3: Summary of different ITC measurements with 4F and P together with POPC lipids at different reaction conditions. The thermodynamic parameters are listed on the
right hand side of the table. Thermograms having a bad quality in terms of a sigmoidal binding isotherm are labeled by a star in the last column, but are listed anyway for the
sake of completeness.
peptide c(peptide) c(POPC(+Chol)) c(Chol) T buffer DMSO vesicles ΔH n Lipid K ΔS
µM mM % °C
%
cal/mol
%
cal/mol/K
4F 200 5 0 40 PBS 0 LUV -5726 1 70 7.52E+04 4.02
4F 200 5 5 40 PBS 0 LUV -4064 1 80 6.40E+04 9.01
4F 200 5 10 40 PBS 0 LUV -3530 1 100 4.20E+04 9.88
4F 200 5 20 40 PBS 0 LUV -2672 1 100 1.49E+04 10.6
4F 200 5 0 5 PBS 0 LUV -423 1 70 1.51E+05 22.2
4F 200 5 0 15 PBS 0 LUV -1776 1 65 3.65E+04 14.7
4F 200 5 0 25 PBS 0 LUV -3138 1 90 1.99E+04 9.15
4F 200 5 0 35 PBS 0 LUV -4506 1 80 2.98E+04 5.85
4F 200 5 0 45 PBS 0 LUV -5559 1 90 7.49E+04 4.82
4F 100 1 0 40 HEPES 10 SUV -9518 1 75 3.84E+04 9.41*
P 40 1 0 40 HEPES 10 SUV -3624 2 65 2.06E+05 12.7
4F 160 3 0 40 HEPES 10 LUV -8926 1 75 4.80E+04 -7.09
P 80 3 0 40 HEPES 10 LUV -1751 0.4 100 9.87E+04 17.3
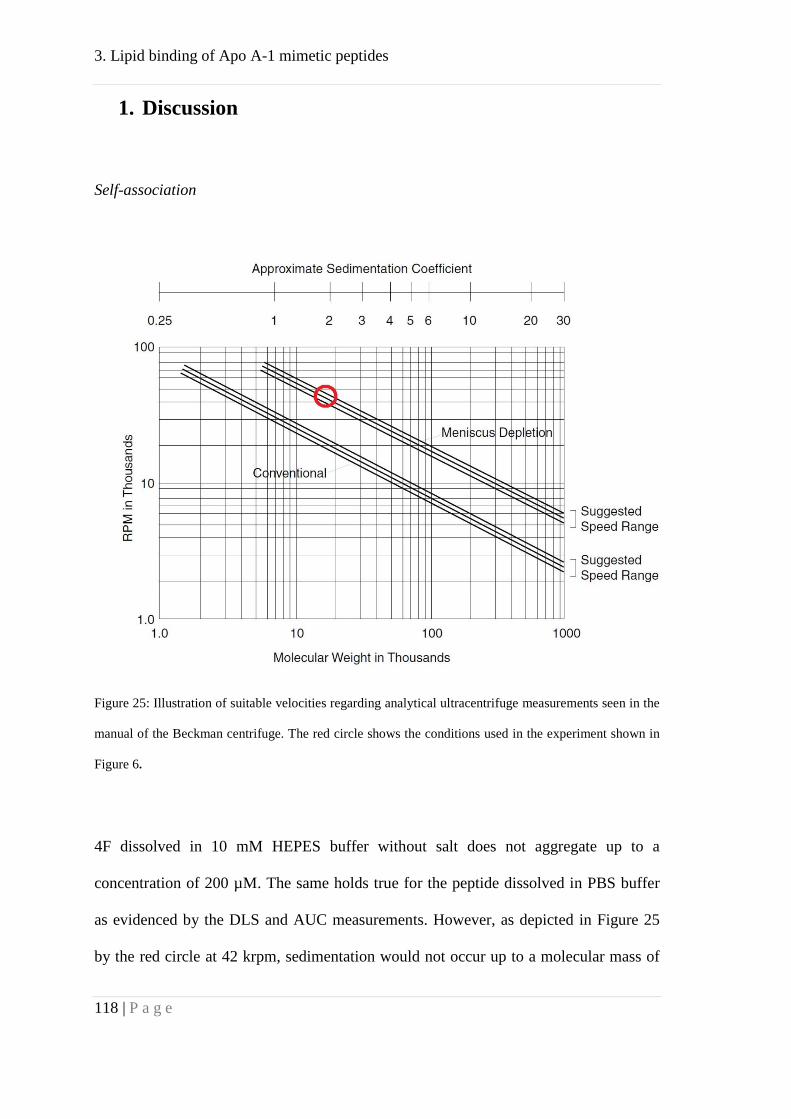
3. Lipid binding of Apo A-1 mimetic peptides
118 | P a g e
1. Discussion
Self-association
Figure 25: Illustration of suitable velocities regarding analytical ultracentrifuge measurements seen in the
manual of the Beckman centrifuge. The red circle shows the conditions used in the experiment shown in
Figure 6.
4F dissolved in 10 mM HEPES buffer without salt does not aggregate up to a
concentration of 200 µM. The same holds true for the peptide dissolved in PBS buffer
as evidenced by the DLS and AUC measurements. However, as depicted in Figure 25
by the red circle at 42 krpm, sedimentation would not occur up to a molecular mass of

3. Lipid binding of Apo A-1 mimetic peptides
119 | P a g e
approximately 18 kDa. Thus peptide associates up to the size of octamers could still be
present. This agrees with results obtained by DLS which excludes associates larger than
hexamers. There are two possible types of self-associates. Firstly it could be reversible
association equilibrium between monomers and oligomers depending on concentration
and secondly, it could be an irreversible aggregation of peptide molecules. By diluting a
reversible self-associate in a high sensitivity microcalorimeter, heat release of the
dissociation reaction can be detected, like it has been described for self-associated Apo
A-1 proteins (Chapter 3). Since most lipid binding experiments with ITC were
performed at 40 °C, where no dissociation reaction could be detected this could not
have biased our lipid binding results obtained by ITC.
Lipid binding
The binding of peptides 4F and P to POPC lipid vesicles was demonstrated by different
types of experiments. The blueshift of the tryptophan fluorescence, the circular
dichroism data as well as the ITC binding isotherms indicate consistently binding of the
peptides to lipid membranes. Binding constants are of the order of 104 M-1 for the
peptide 4F and ≈ 105 M-1 for peptide P.
The thermodynamic parameters of the two peptides 4F and P where derived under
slightly different conditions, due to the presence of DMSO in P-solutions. However, for
4F binding to POPC LUVs the binding isotherms and derived binding constants were
similar with or without DMSO in buffer (Table 3). In contrast, the reaction enthalpy and
entropy differed clearly. The thermodynamic parameter of peptide binding to LUVs and
SUVs were also different. This might be due to the less monodisperse characteristics of
our POPC SUVs (PDI about 0.3) compared to the LUV preparations (PDI about 0.025).

3. Lipid binding of Apo A-1 mimetic peptides
120 | P a g e
4F Experiments done in the same buffer with the same temperature showed slightly
smaller binding constants with lipids arranged in SUVs compared to those with LUVs.
The binding constants of 4F to LUVs decreased with the percentage of cholesterol,
while the reaction enthalpy was less exothermic (Figure 21). This is surprising since
Apo A-1 and mimetic peptides are involved in cholesterol transport and –turnover.
However, binding studies with cholesterol incorporated into cyclodextrin cavities,
suggested binding of the peptide to cholesterol (Figure 19). A possible explanation
would be that the affinity of the peptides to POPC lipids is strong to build HDL like
particles, which bind weakly to cholesterol in vivo. Weak binding could be necessary to
get rid of excess cholesterol for example at the liver to fulfill the function as a carrier
through the blood stream.
Thermodynamic interpretation
The measured overall enthalpy as derived from ITC measurements with 4F and POPC
LUVs is about -5.7 kcal/mol. Three different effects contribute to this measured value.
1. A random coil/β-sheet&turn to α-helical transition, 2. hydrophibic interactions and 3.
solvation of lipid vesicles. In the following each of these processes will be considered
energetically.
The results obtained by circular dichroism spectroscopy suggest a transition of random
coil/β-sheet&turn segments to α-helical segments as driving force of lipid binding, like
it is known from other peptides (penetratin [35], melittin [36]). Thermodynamically, we
assume β-sheet and β-turn structure to be the same. The random coil to α-helix
transition was investigated by Meier et al. and is known to be exothermic with
approximately -800 cal/mol·residue. The β-sheet to random coil transition releases

3. Lipid binding of Apo A-1 mimetic peptides
121 | P a g e
between 0 - -600 cal/mol·residue, depending on the length of the segments [37, 38].
Multiplication of the changed fraction of secondary structural elements (α-helix →
random coil; β-sheet → random coil) with the total residue number yields the number of
changed segments (n = 5.22). Together with the above mentioned enthalpies this results
in a transition enthalpy between -1.9 - -4.0 kcal/mol. The less exothermic the β-sheet to
random coil transition enthalpy is assumed the more exothermic is the sum of the
transition enthalpies.
The ITC-results of the temperature dependence of reaction enthalpy showed clearly a
negative change of heat capacity, meaning hydrophobic interactions are part of the
driving force leading to lipid binding.
The third process contributing to the measured reaction enthalpy is the micellization of
lipid vesicles as proven by static light scattering. In case of POPC LUVs the process is
endothermic with about 1.85 kcal/mol as investigated by Heerklotz et al. [39].
Subtracting this micellisation enthalpy of the measured reaction enthalpy
remains -7.55 kcal/mol for the enthalpy of hydrophobic interactions and the secondary
structural transition enthalpy. Subtraction of the transition enthalpy resulted in -3.55 - -
5.65 kcal/mol accounting for hydrophobic interactions.
The transition of random-coil and β-sheet to α-helical secondary structural elements and
hydrophobic interactions could clearly be addressed as driving force of 4F`s lipid
binding. Yet balancing the percentage of each process was not achieved.

3. Lipid binding of Apo A-1 mimetic peptides
122 | P a g e
References
1. Tall AR: An overview of reverse cholesterol transport. Eur Heart J 1998, 19
Suppl A:A31-35.
2. Segrest JP, Garber DW, Brouillette CG, Harvey SC, Anantharamaiah GM: The
amphipathic alpha helix: a multifunctional structural motif in plasma
apolipoproteins. Adv Protein Chem 1994, 45:303-369.
3. Segrest JP, Jackson RL, Morrisett JD, Gotto AM, Jr.: A molecular theory of
lipid-protein interactions in the plasma lipoproteins. FEBS Lett 1974,
38(3):247-258.
4. Mendez AJ, Anantharamaiah GM, Segrest JP, Oram JF: Synthetic amphipathic
helical peptides that mimic apolipoprotein A-I in clearing cellular
cholesterol. J Clin Invest 1994, 94(4):1698-1705.
5. Venkatachalapathi YV, Phillips MC, Epand RM, Epand RF, Tytler EM, Segrest
JP, Anantharamaiah GM: Effect of end group blockage on the properties of a
class A amphipathic helical peptide. Proteins 1993, 15(4):349-359.
6. Datta G, Chaddha M, Hama S, Navab M, Fogelman AM, Garber DW, Mishra
VK, Epand RM, Epand RF, Lund-Katz S et al: Effects of increasing
hydrophobicity on the physical-chemical and biological properties of a class
A amphipathic helical peptide. J Lipid Res 2001, 42(7):1096-1104.
7. Sherman CB, Peterson SJ, Frishman WH: Apolipoprotein A-I mimetic
peptides: a potential new therapy for the prevention of atherosclerosis.
Cardiol Rev 2010, 18(3):141-147.
3. Lipid binding of Apo A-1 mimetic peptides
123 | P a g e
8. Chung BH, Anatharamaiah GM, Brouillette CG, Nishida T, Segrest JP: Studies
of synthetic peptide analogs of the amphipathic helix. Correlation of
structure with function. J Biol Chem 1985, 260(18):10256-10262.
9. Yancey PG, Bielicki JK, Johnson WJ, Lund-Katz S, Palgunachari MN,
Anantharamaiah GM, Segrest JP, Phillips MC, Rothblat GH: Efflux of cellular
cholesterol and phospholipid to lipid-free apolipoproteins and class A
amphipathic peptides. Biochemistry 1995, 34(24):7955-7965.
10. Wool GD, Vaisar T, Reardon CA, Getz GS: An apoA-I mimetic peptide
containing a proline residue has greater in vivo HDL binding and anti-
inflammatory ability than the 4F peptide. J Lipid Res 2009, 50(9):1889-1900.
11. Nissen SE, Tsunoda T, Tuzcu EM, Schoenhagen P, Cooper CJ, Yasin M, Eaton
GM, Lauer MA, Sheldon WS, Grines CL et al: Effect of recombinant ApoA-I
Milano on coronary atherosclerosis in patients with acute coronary
syndromes: a randomized controlled trial. Jama 2003, 290(17):2292-2300.
12. Ou J, Ou Z, Jones DW, Holzhauer S, Hatoum OA, Ackerman AW, Weihrauch
DW, Gutterman DD, Guice K, Oldham KT et al: L-4F, an apolipoprotein A-1
mimetic, dramatically improves vasodilation in hypercholesterolemia and
sickle cell disease. Circulation 2003, 107(18):2337-2341.
13. Peterson SJ, Husney D, Kruger AL, Olszanecki R, Ricci F, Rodella LF,
Stacchiotti A, Rezzani R, McClung JA, Aronow WS et al: Long-term
treatment with the apolipoprotein A1 mimetic peptide increases
antioxidants and vascular repair in type I diabetic rats. J Pharmacol Exp
Ther 2007, 322(2):514-520.
14. Peterson SJ, Kim DH, Li M, Positano V, Vanella L, Rodella LF, Piccolomini F,
Puri N, Gastaldelli A, Kusmic C et al: The L-4F mimetic peptide prevents
3. Lipid binding of Apo A-1 mimetic peptides
124 | P a g e
insulin resistance through increased levels of HO-1, pAMPK, and pAKT in
obese mice. J Lipid Res 2009, 50(7):1293-1304.
15. Peterson SJ, Drummond G, Kim DH, Li M, Kruger AL, Ikehara S, Abraham
NG: L-4F treatment reduces adiposity, increases adiponectin levels, and
improves insulin sensitivity in obese mice. J Lipid Res 2008, 49(8):1658-1669.
16. Bloedon LT, Dunbar R, Duffy D, Pinell-Salles P, Norris R, DeGroot BJ, Movva
R, Navab M, Fogelman AM, Rader DJ: Safety, pharmacokinetics, and
pharmacodynamics of oral apoA-I mimetic peptide D-4F in high-risk
cardiovascular patients. J Lipid Res 2008, 49(6):1344-1352.
17. Watson CE, Weissbach N, Kjems L, Ayalasomayajula S, Zhang Y, Chang I,
Navab M, Hama S, Hough G, Reddy ST et al: Treatment of patients with
cardiovascular disease with L-4F, an apo-A1 mimetic, did not improve
select biomarkers of HDL function. J Lipid Res 2011, 52(2):361-373.
18. Ziegler A, Seelig J: Contributions of glycosaminoglycan binding and
clustering to the biological uptake of the nonamphipathic cell-penetrating
peptide WR9. Biochemistry 2011, 50(21):4650-4664.
19. Ziegler A, Seelig J: Binding and clustering of glycosaminoglycans: a
common property of mono- and multivalent cell-penetrating compounds.
Biophys J 2008, 94(6):2142-2149.
20. Klocek G, Seelig J: Melittin interaction with sulfated cell surface sugars.
Biochemistry 2008, 47(9):2841-2849.
21. Sreerama N, Woody RW: Estimation of protein secondary structure from
circular dichroism spectra: comparison of CONTIN, SELCON, and
CDSSTR methods with an expanded reference set. Anal Biochem 2000,
287(2):252-260.
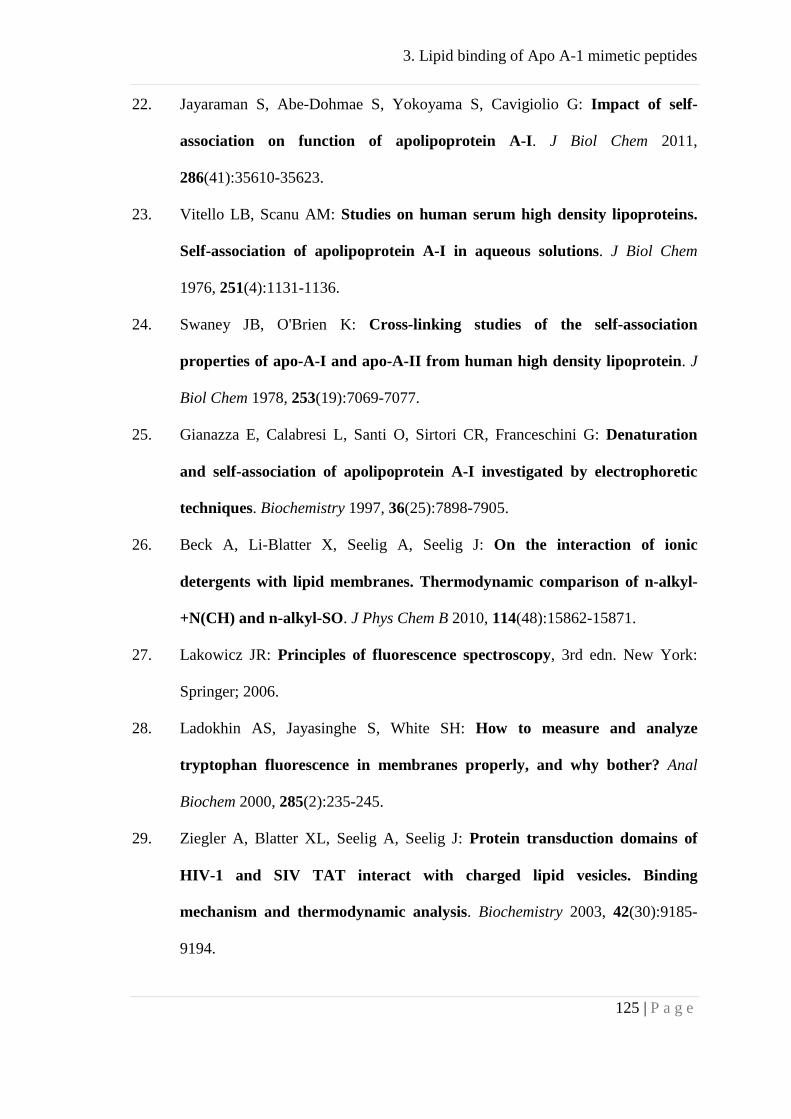
3. Lipid binding of Apo A-1 mimetic peptides
125 | P a g e
22. Jayaraman S, Abe-Dohmae S, Yokoyama S, Cavigiolio G: Impact of self-
association on function of apolipoprotein A-I. J Biol Chem 2011,
286(41):35610-35623.
23. Vitello LB, Scanu AM: Studies on human serum high density lipoproteins.
Self-association of apolipoprotein A-I in aqueous solutions. J Biol Chem
1976, 251(4):1131-1136.
24. Swaney JB, O'Brien K: Cross-linking studies of the self-association
properties of apo-A-I and apo-A-II from human high density lipoprotein. J
Biol Chem 1978, 253(19):7069-7077.
25. Gianazza E, Calabresi L, Santi O, Sirtori CR, Franceschini G: Denaturation
and self-association of apolipoprotein A-I investigated by electrophoretic
techniques. Biochemistry 1997, 36(25):7898-7905.
26. Beck A, Li-Blatter X, Seelig A, Seelig J: On the interaction of ionic
detergents with lipid membranes. Thermodynamic comparison of n-alkyl-
+N(CH) and n-alkyl-SO. J Phys Chem B 2010, 114(48):15862-15871.
27. Lakowicz JR: Principles of fluorescence spectroscopy, 3rd edn. New York:
Springer; 2006.
28. Ladokhin AS, Jayasinghe S, White SH: How to measure and analyze
tryptophan fluorescence in membranes properly, and why bother? Anal
Biochem 2000, 285(2):235-245.
29. Ziegler A, Blatter XL, Seelig A, Seelig J: Protein transduction domains of
HIV-1 and SIV TAT interact with charged lipid vesicles. Binding
mechanism and thermodynamic analysis. Biochemistry 2003, 42(30):9185-
9194.

3. Lipid binding of Apo A-1 mimetic peptides
126 | P a g e
30. Murphy KP, Privalov PL, Gill SJ: Common features of protein unfolding and
dissolution of hydrophobic compounds. Science 1990, 247(4942):559-561.
31. Connelly PR, Thomson JA: Heat capacity changes and hydrophobic
interactions in the binding of FK506 and rapamycin to the FK506 binding
protein. Proc Natl Acad Sci U S A 1992, 89(11):4781-4785.
32. Tsamaloukas A, Szadkowska H, Slotte PJ, Heerklotz H: Interactions of
cholesterol with lipid membranes and cyclodextrin characterized by
calorimetry. Biophys J 2005, 89(2):1109-1119.
33. Heerklotz H, Szadkowska H, Anderson T, Seelig J: The sensitivity of lipid
domains to small perturbations demonstrated by the effect of Triton. J Mol
Biol 2003, 329(4):793-799.
34. Seelig J: Thermodynamics of lipid-peptide interactions. Biochim Biophys
Acta 2004, 1666(1-2):40-50.
35. Persson D, Thoren PE, Lincoln P, Norden B: Vesicle membrane interactions
of penetratin analogues. Biochemistry 2004, 43(34):11045-11055.
36. Vogel H: Incorporation of melittin into phosphatidylcholine bilayers. Study
of binding and conformational changes. FEBS Lett 1981, 134(1):37-42.
37. Meier M, Seelig J: Length dependence of the coil <--> beta-sheet transition
in a membrane environment. J Am Chem Soc 2008, 130(3):1017-1024.
38. Meier M, Seelig J: Thermodynamics of the coil <==> beta-sheet transition in
a membrane environment. J Mol Biol 2007, 369(1):277-289.
39. Heerklotz H, Seelig J: Titration calorimetry of surfactant-membrane
partitioning and membrane solubilization. Biochim Biophys Acta 2000,
1508(1-2):69-85.
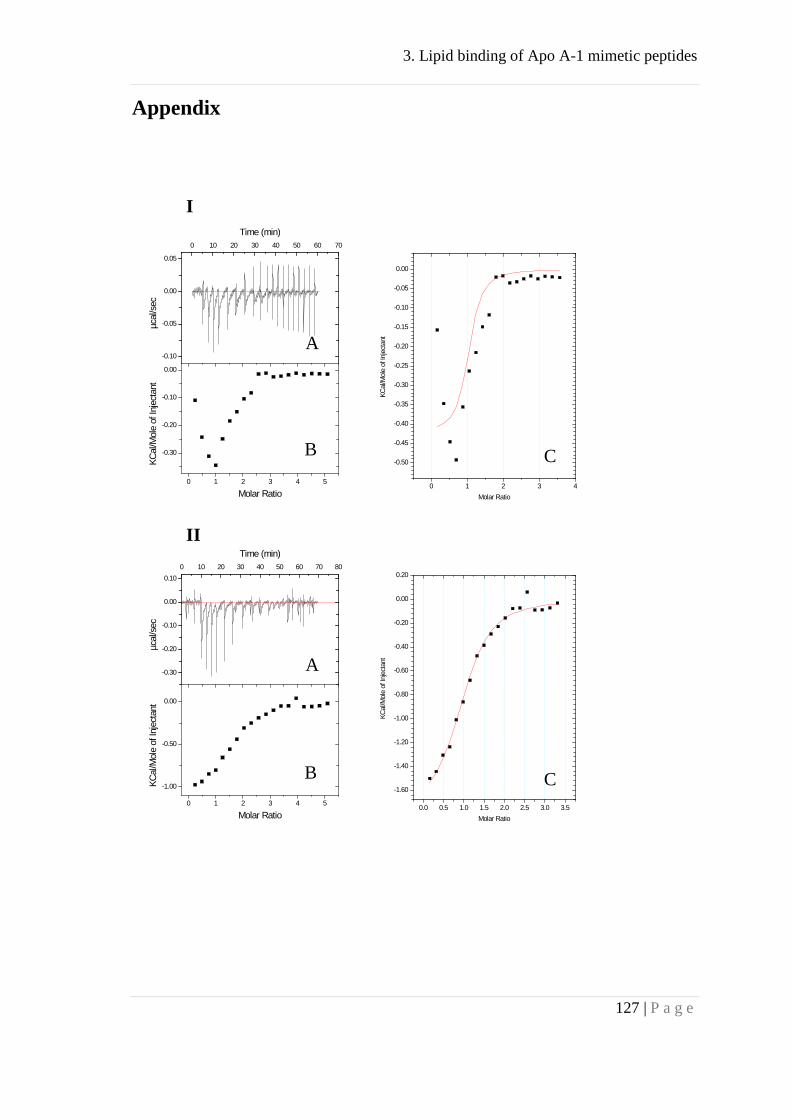
3. Lipid binding of Apo A-1 mimetic peptides
127 | P a g e
Appendix
0 1 2 3 4 5
-0.30
-0.20
-0.10
0.00
-0.10
-0.05
0.00
0.05
0 10 20 30 40 50 60 70
Time (min)
µcal
/sec
Molar Ratio
KCal
/Mol
e of
Inje
ctan
t
0 1 2 3 4
-0.50
-0.45
-0.40
-0.35
-0.30
-0.25
-0.20
-0.15
-0.10
-0.05
0.00
Molar Ratio
KCal
/Mol
e of
Inje
ctan
t
0 1 2 3 4 5
-1.00
-0.50
0.00
-0.30
-0.20
-0.10
0.00
0.100 10 20 30 40 50 60 70 80
Time (min)
µcal
/sec
Molar Ratio
KCal
/Mol
e of
Inje
ctan
t
0.0 0.5 1.0 1.5 2.0 2.5 3.0 3.5
-1.60
-1.40
-1.20
-1.00
-0.80
-0.60
-0.40
-0.20
0.00
0.20
Molar Ratio
KCal
/Mol
e of
Inje
ctan
t
C
C
A
A
B
B
I
II
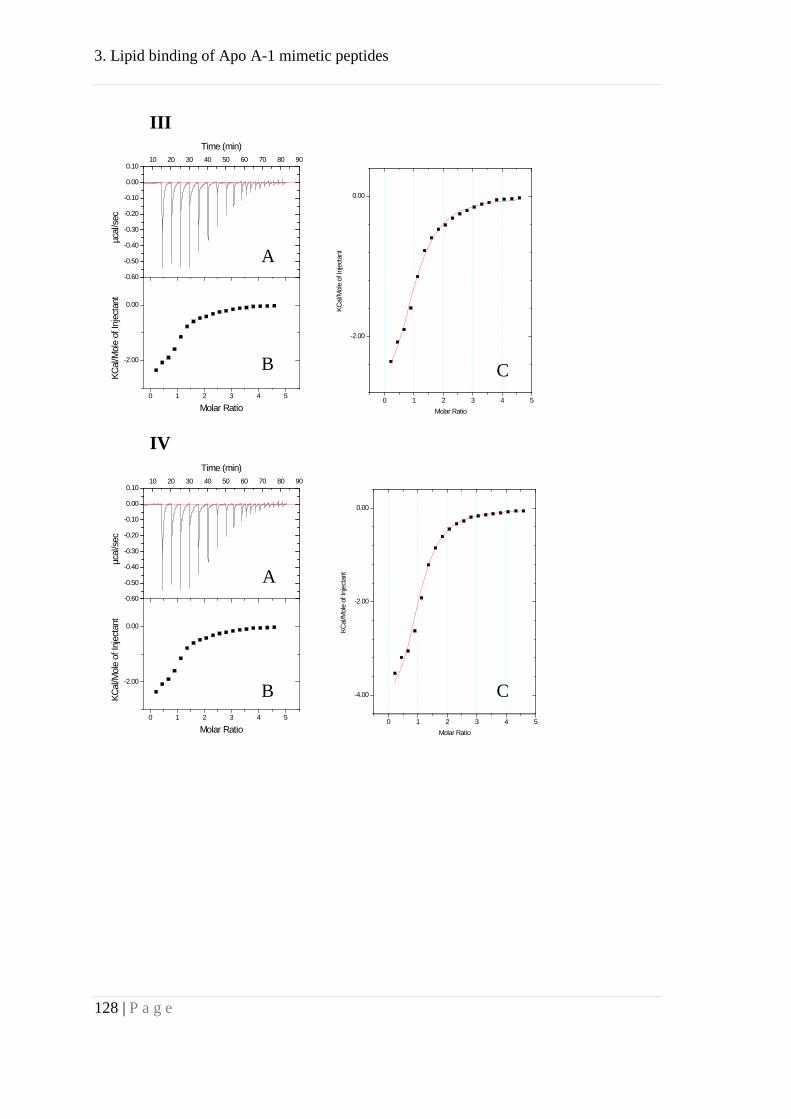
3. Lipid binding of Apo A-1 mimetic peptides
128 | P a g e
0 1 2 3 4 5
-2.00
0.00
-0.60
-0.50
-0.40
-0.30
-0.20
-0.10
0.00
0.1010 20 30 40 50 60 70 80 90
Time (min)
µcal
/sec
Molar Ratio
KCal
/Mol
e of
Inje
ctan
t
0 1 2 3 4 5
-2.00
0.00
Molar Ratio
KCal
/Mol
e of
Inje
ctan
t
0 1 2 3 4 5
-2.00
0.00
-0.60
-0.50
-0.40
-0.30
-0.20
-0.10
0.00
0.1010 20 30 40 50 60 70 80 90
Time (min)
µcal
/sec
Molar Ratio
KCal
/Mol
e of
Inje
ctan
t
0 1 2 3 4 5
-4.00
-2.00
0.00
Molar Ratio
KCal
/Mol
e of
Inje
ctan
t
C
C
A
A
B
B
III
IV
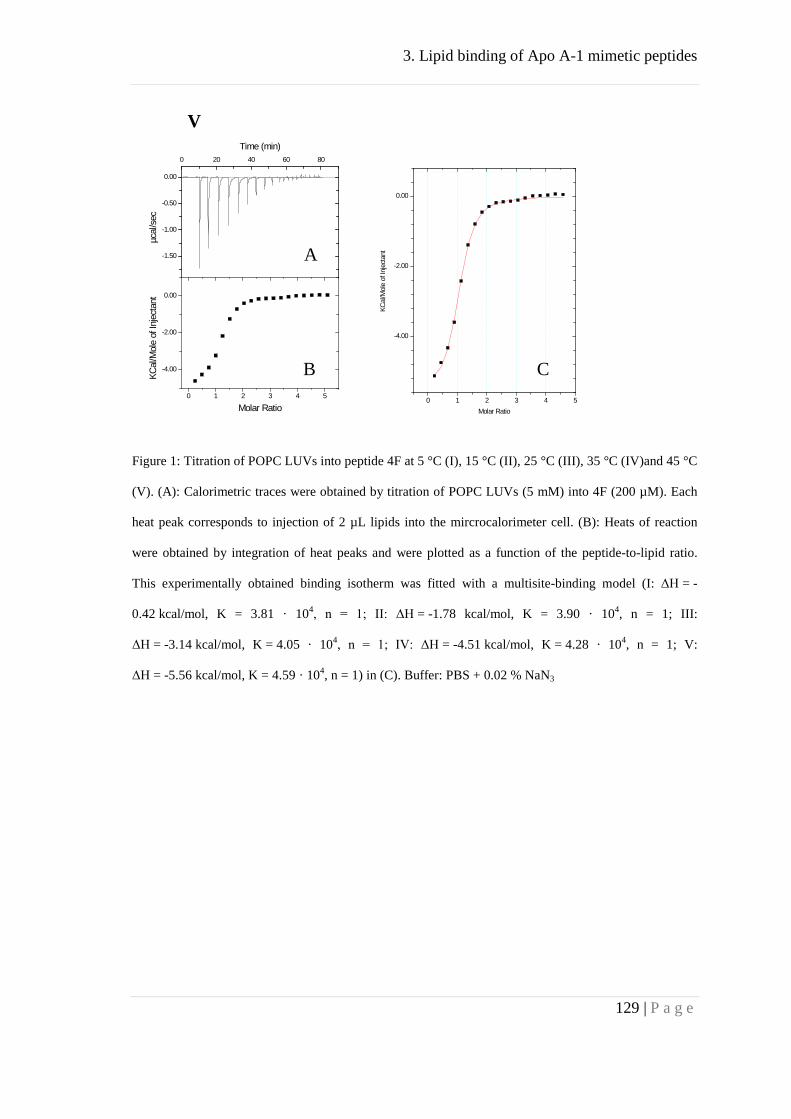
3. Lipid binding of Apo A-1 mimetic peptides
129 | P a g e
0 1 2 3 4 5
-4.00
-2.00
0.00
-1.50
-1.00
-0.50
0.00
0 20 40 60 80
Time (min)µc
al/s
ec
Molar Ratio
KCal
/Mol
e of
Inje
ctan
t
0 1 2 3 4 5
-4.00
-2.00
0.00
Molar Ratio
KCal
/Mol
e of
Inje
ctan
t
Figure 1: Titration of POPC LUVs into peptide 4F at 5 °C (I), 15 °C (II), 25 °C (III), 35 °C (IV)and 45 °C
(V). (A): Calorimetric traces were obtained by titration of POPC LUVs (5 mM) into 4F (200 µM). Each
heat peak corresponds to injection of 2 µL lipids into the mircrocalorimeter cell. (B): Heats of reaction
were obtained by integration of heat peaks and were plotted as a function of the peptide-to-lipid ratio.
This experimentally obtained binding isotherm was fitted with a multisite-binding model (I: ΔH = -
0.42 kcal/mol, K = 3.81 · 104, n = 1; II: ΔH = -1.78 kcal/mol, K = 3.90 · 104, n = 1; III:
ΔH = -3.14 kcal/mol, K = 4.05 · 104, n = 1; IV: ΔH = -4.51 kcal/mol, K = 4.28 · 104, n = 1; V:
ΔH = -5.56 kcal/mol, K = 4.59 · 104, n = 1) in (C). Buffer: PBS + 0.02 % NaN3
C
A
B
V

3. Lipid binding of Apo A-1 mimetic peptides
130 | P a g e
0 1 2
-6
-4
-2
0-1.2
-0.8
-0.4
0.0
0 200 400 600 800
Time (min)µc
al/s
ec
Molar Ratio
kcal
/mol
e of
inje
ctan
t
0 1 2 3
-2.0
-1.8
-1.6
-1.4
-0.4
-0.2
0.0
0 200 400 600 800
Time (min)
µcal
/sec
Molar Ratio
kcal
/mol
e of
inje
ctan
t
0 1 2
-3
-2
-1
-0.4
-0.2
0.0
0 200 400 600 800
Time (min)
µcal
/sec
Molar Ratio
kcal
/mol
e of
inje
ctan
t
0 1 2 3
-0.8
-0.7
-0.6
-0.1
0.0
0 200 400 600 800
Time (min)
µcal
/sec
Molar Ratio
kcal
/mol
e of
inje
ctan
t
I
II
A
A
A
A
B B
B B

3. Lipid binding of Apo A-1 mimetic peptides
131 | P a g e
0.0 0.5 1.0 1.5
-3
-2
-1
-0.4
-0.2
0.0
0 200 400 600 800
Time (min)µc
al/s
ec
Molar Ratio
kcal
/mol
e of
inje
ctan
t
0.0 0.1 0.2 0.3
-1.1
-1.0
-0.9
-0.8
-0.2
-0.1
0.0
0 200 400 600 800
Time (min)
µcal
/sec
Molar Ratio
kcal
/mol
e of
inje
ctan
t
Figure 2: Titration of POPC SUVs into peptide 4F and P at 40 °C. (A) Calorimetric traces were obtained
by titration of POPC SUVs (1 mM) into 4F (I: 100 µM, III: 125 µM, V: 160 µM) and P (II: 70 µM, IV:
65 µM, VI: 80 µM). Each heat peak corresponds to injection of 5 µL lipids into the mircrocalorimeter
cell. (B) Heats of reaction were obtained by integration of heat peaks and were plotted as a function of the
peptide-to-lipid ratio. Buffer: 10 mM Hepes + 10 % DMSO.
III
A A
B B


4. Towards understanding of the allocrite specificity of the lipid floppase ABCA1
133 | P a g e
4. Towards understanding of the allocrite specificity of
the lipid floppase ABCA1
Biozentrum, University of Basel, Div. of Biophysical Chemistry, Klingelbergstrasse
50/70, CH-4056 Basel, Switzerland

4. Towards understanding of the allocrite specificity of the lipid floppase ABCA1
134 | P a g e
Preliminary manuscript
Abstract
ATP binding cassette transporter A1 (ABCA1) plays a key role in reverse cholesterol
transport (RCT). Disorders of the RCT are affecting a large number of patients in form
of atherosclerosis. ABCA1 flopps cholesterol from the inner to the outer membrane
leaflet, where it is accepted by apolipoprotein A 1 (Apo A-1) and thus controls
cholesterol homeostasis. Furthermore the transporter was reported to transport
phosphocholines and vitamin E. This was mainly investigated in animal models and cell
culture experiments. To further explore the ABCA1/allocrite interaction, the ATPase
activity of inside-out vesicles obtained from ABCA1 transfected HEK293 cells was
measured by means of a quantitative phosphate release assay. The specificity of the
transporter was investigated by titration with putative allocrits of different chemical
classes. Amphipatic compounds that carried a polyethyleneglycol (PEG) chain, a
heterocyclic group and a hydrocarbon tail such as Tween80, Tween40 and the vitamin E
derivatives TPGS400 and TPGS1000 showed increased activity of ABCA1. On the
other hand, the stilbene derivatives DIDS and resveratrol decreased the activity of
ABCA1 in a concentration dependent manner. Basal activity could not be inhibited by
vanadate but aluminum fluorides were found to be strong inhibitors of the nucleotide
binding sites (NBDs) of ABCA1. The present data shows that the activity of ABCA1
can be enhanced or reduced in a concentration dependent manner with a relatively broad
variety of substances.
4. Towards understanding of the allocrite specificity of the lipid floppase ABCA1
135 | P a g e
Introduction
Atherosclerosis is a syndrome affecting a large number of people worldwide. Since
blood high-density lipoprotein (HDL) levels are inversely correlated to cardiovascular
disease, factors associated with HDL metabolism are athereoprotective. One of these
factors is the ATP-binding cassette transporter A1 (ABCA1). It is a 220 kDa integral
membrane protein consisting of two transmembrane domains (TMDs) and two
nucleotide-binding domains (NBDs). The catalytic cycle is assumed to be driven by
ATP binding and hydrolysis. ABCA1 plays an essential role in the handling of cellular
lipids. By promoting the transport of membrane phospholipids and cholesterol to lipid
poor apolipoprotein acceptors, ABCA1 controls the formation of HDL and thus the
whole process of cholesterol transport [1-3]. Cholesterol is an essential component of
eukaryotic cells, at the same time however, hyper-accumulation of cholesterol is
harmful. ABCA1 is mainly located on the plasma membrane but due to endocytosis and
resecretion (retroendocytosis) of Apolipoprotein A-1 (Apo A-1) the transporter might
also play a role in cellular lipid handling [4] and forming of HDL by pumping lipids
into the vesicular lumen in which Apo A-1 is captured [5].
Naturally occurring mutations in the ABCA1 gene cause Tangier disease, an autosomal
recessive disorder of lipid metabolism and familial HDL deficiency [1]. The latter is
mainly differentiated to Tangier disease by transmission as a dominant trait [1, 6-9].
Regulation of the transporter takes place on transcriptional and posttranscriptional
levels. The ABCA1 protein has a rapid turnover with a half-life of ABCA1 that was
reported to be less than one hour in murine macrophage cells [10]. So far ABCA1 is
mainly known to control lipid homeostasis by tight regulation of its protein level [11].

4. Towards understanding of the allocrite specificity of the lipid floppase ABCA1
136 | P a g e
In detail, induction of ABCA1 occurs by overloading cells with cholesterol through
activation of the nuclear receptors liver X receptor (LXR) and retinoid X receptor.
(RXR) [11]. ABCA1 protein levels also seem to be controlled by a degradation process
[12-14]. As many proteins with a short life time ABCA1 is characterized by PEST
sequences. The PEST motif features a proline (P), glutamate (E), serine (S), and
threonine (T) sequence, and is usually flanked by lysine (K), arginine (R), or histidine
(H) residues. A calpain protease seems to degrade the transporter via recognition of the
PEST motifs. However, ABCA1 protein seems to be stabilized by ligands such as
Apolipoprotein A-1 (Apo A-1). Apo A-1 binds directly to the transporter yielding
increased ABCA1 protein levels but not mRNA levels [15].
ABCA1 is expressed ubiquitously. However, cholesterol accumulation principally takes
place in macrophages in the case of ABCA1 dysfunction [1]. Macrophages having
accumulated plenty of cholesterol are called foam cells. Atheroma development and
foam cell formation are significantly influenced by the expression level of ABCA1 in
macrophages but largely independent of circulating HDL levels [1, 16, 17].
A large number of studies were performed with ABCA1 either in cell culture or in
clinical and animal trials. Nevertheless, detailed knowledge of the molecular function of
ABCA1 as a membrane floppase is still lacking. The knowledge on molecules likely to
be handled by the transporter was derived from experiments with polarized Caco-2 and
various other cell monolayers, respectively. In most studies merely transport of
cholesterol, phospholipids and vitamin E was investigated. The transport of
phospholipids and cholesterol by ABCA1 was either assessed by transport assays with
radioactively labeled compounds, detected in the extracellular medium or in acceptor
particles like Apolipoprotein A-1/HDL [1, 18-19]. Transport of vitamin E and A was
measured in bi-directional transport assays [1, 20]. While transport assays reveal the
4. Towards understanding of the allocrite specificity of the lipid floppase ABCA1
137 | P a g e
apparent or net transport ATPase measurements reflect the effective transport (flopping
rate) of ABCA1 [21]. Takahashi et al. present the only study of ABCA1 produced in
insect cells and reconstituted in model membranes [22]. The transporter showed
ATPase activity reconstituted in vesicles composed of different lipids and lipid mixtures
(e.g. PC, PS and PG) as well as in a detergent-soluble form. The effect of other sterol
compounds as well as cholesterol was tested by reconstituting ABCA1 in liposomes
with a single concentration of the sterol compounds (20 %) as membrane constitutent. A
mild inhibitory effect was observed for all investigated sterols.
Here, we investigated ABCA1 in inside-out plasma membrane vesicles of ABCA1-
transfected HEK293 cells using a spectroscopic phosphate assay. The advantage of
plasma membranes is that the protein remains embedded in its natural environment, in
the proper orientation and conformation. In order to get more insight into the allocrite
specificity of the transporter we chose a variety of different structures. The selected
molecules have either structural similarities to well-known ABCA1 substrates such as
cholesterol and phosphocholines (lyso-phosphocholines, phosphocholines, vitamin E,
TPGS, estradiol) or are allocrites of other ABC transporters like P-glycoprotein
(detergents). In some cases substances belong to both categories. In contrast to previous
studies we also used compounds of other chemical groups such as detergents.
Furthermore, all compounds were measured over a broad concentration range.
4. Towards understanding of the allocrite specificity of the lipid floppase ABCA1
138 | P a g e
Materials and methods
Cell lines and cell culture
The human embryo kidney cells Flp In HEK293 (HEK293-WT) transfected with the
human ABCA1 gene (HEK293-ABCA1) were generously provided by Matthew Wright
from F. Hoffmann-La Roche Ltd., Basel. The mRNA level of the ABCA1 transporter
was 21000 fold higher in transfected than in untransfected cells, in which the transporter
is essentially undetected. An ABCA1 protein level of transfected cells was estimated by
Wright et al. on basis of a cholesterol efflux activity assay. The pump rate was
approximated by one molecule cholesterol per transporter per second. The result is a
protein level of 105 ABCA1 transporters per cell.
Cells were maintained in monolayer culture in sterile culture flasks (Costar, 25–75 cm2)
at 37 °C in an air atmosphere containing CO2 (5 %) and featuring a humidity saturation
of 100 %. DMEM medium was supplemented with fetal bovine serum (10 % v/v),
penicillin (100 units/ml), streptomycin (100 ug/ml) and L-glutamine (146 mg/L). The
transfected cells were grown in presence of the selection antibiotic Hygromycin B
(100 ug/ml). Both cell lines were passaged every 3-4 days. Cell counting was performed
with a hemocytometer.
4. Towards understanding of the allocrite specificity of the lipid floppase ABCA1
139 | P a g e
Plasma Membrane Vesicle Preparation
Cells were washed with PBS buffer and scraped in ice-cold PBS, charged with protease
inhibitors (1 tablet/50 ml buffer). For lysis the cells were washed with hypotonic lysis
buffer (10 mM Tris-HCl, pH 7.5, 10 mM NaCl, 1 mM MgCl2, 1 protease inhibitor
cocktail tablet/50 mL) and were centrifuged at 2100 gmax for 10 min at 4 °C. The pellet
was resuspended in lysis buffer (1.25 ml per each 15 cm dish). Cell disruption was
performed at 400 bar in a “One Shot” cell disrupter (Constant Systems Ltd.,
Warwickshire, U.K.). The cell lysate was then diluted 1:1 with ice-cold isotonic buffer
(10 mM Tris-HCl, pH 7.4, 250 mM sucrose, 50 mM N-methyl-D-glucamine, NMDG, 1
protease inhibitor cocktail tablet/50 mL buffer). Unbroken cells and the nuclei were
precipitated by centrifugation at 800 gmax for 10 min at 4 °C. Afterwards mitochondria
were removed by centrifugation at 6000 gmax for 10 min at 4 °C. The crude membranes
were pelleted with the last centrifugation step at 100000 gmax for 1 hour at 4 °C. The
pellet was resuspended with the isotonic buffer and homogenized by aspiration and
dispension cycles with a 23-gauge syringe. The preparation was frozen rapidly in liquid
nitrogen and stored at -80 °C. The overall protein content of the membranes was
determined to be 8.6 ± 2.7 mg/ml (average of different preparations) by a BCA protein
assay with bovine serum albumin as standard.
Linearity of the ATP-hydrolysis
The linearity of the ATP hydrolysis was checked by a slightly modified phosphate
release assay. Three samples of each 4.5 ml phosphate release mixtures were placed in a
water bath at 37 °C and aliquots of 100 uL were removed at different times. The
4. Towards understanding of the allocrite specificity of the lipid floppase ABCA1
140 | P a g e
reaction of those aliquots was immediately quenched by cooling in an ice-bath and
addition of 333 uL stop solution. After subsequent incubation at room temperature at 37
°C for 30 min and transfer of 260 uL to a 96-well microtiter plate (Nunc F96 MicroWell
plate, nontreated) the formed phosphate molybdate complex was measured at 820 nm in
a Spectramax M2 (Molecular Device, Sunnyvale, CA).
Phosphate release assay
The inorganic phosphate release of the ABCA1 ATPase was measured according to
Litman et al. (1997) and Äänisma et al. (2008) [23-25] in 96-well microtiter plates
(Nunc F96 MicroWell plate, nontreated, wells at the border were not considered for
analysis) with small modifications. The crude membranes were thawed and diluted to
0.1 mg/ml protein concentration in ice-cold phosphate release assay buffer (25 mM
Tris-HCl including 50 mM KCl, 3 mM ATP, 2.5 mM MgSO4, 3 mM DTT, 0.5 mM
EGTA, 2 mM ouabain, and 3 mM sodium azide, pH 7.0). The total assay volume was
60 µL/well, containing 5 µg/well of protein. The reaction with and without possible
allocrites was started by transferring the plate into a water bath kept at 37 °C for 1 hour
and was quenched by rapidly cooling the plate on ice and the addition of an ice-cold
stopping solution (200 µL/well, ammonium molybdate (0.2% (w/v)), sulfuric acid
(1.43% (v/v)), freshly prepared ascorbic acid (1% (w/v)), and SDS (0.9% (w/v)). The
concentration of inorganic phosphate (Pi), resulting from the hydrolysis of ATP was
determined by colorimetric quantification after 30 min incubation at room temperature.
The formed phosphate molybdate complex was quantified at λ = 820 nm in a
Spectramax M2 (Molecular Device, Sunnyvale, CA). To inhibit the ABCA1 ATPase
selectively, samples were incubated either with aluminum fluorides (1.7 mM

4. Towards understanding of the allocrite specificity of the lipid floppase ABCA1
141 | P a g e
[ADP·Al·F]; prepared from aqueous solutions of 1 mM NaF, 100 mM AlCl3 and 91.1
mM ADP mixed in this order to gain 20.66 mM of the complex) or vanadate (0.5 mM)
to subtract from the measurements. As vanadate inhibited only partially control samples
without compounds were kept on ice and were subtracted from the measurements. The
colorimetric result was calibrated using reference phosphate standards included in each
microtiter plate. Compounds tested were obtained from Avanti lipids or Sigma-Aldrich.
Modified phosphate release assay
The inhibition assay is based on the phosphate release assay with some simplifications.
The mixtures were prepared in parallel on a 96-well microtiter plate (Nunc F96
MicroWell plate, nontreated). Crude membranes were thawed and diluted to 0.1 mg/ml
protein concentration in ice-cold phosphate release assay buffer (25 mM Tris-HCl
including 50 mM KCl, 3 mM ATP, 2.5 mM MgSO4, 3 mM DTT, 0.5 mM EGTA, 2
mM ouabain, and 3 mM sodium azide, pH 7.0). The total assay volume was 60 µL/well,
featuring 5 µg/well of protein. The absorbance of the molybdate complex was
determined at eight different concentrations of the inhibitor in presence and as a control
in absence of crude membranes. The reaction with and without possible allocrites was
started by transferring the plate into a water bath kept at 37 °C for 1 hour and was
quenched by rapidly cooling the plate on ice and the addition of an ice-cold stopping
solution (200 uL/well, ammonium molybdate (0.2% (w/v)), sulfuric acid (1.43% (v/v)),
freshly prepared ascorbic acid (1% (w/v)), and SDS (0.9% (w/v)). The absorbance of
the inorganic phosphate Pi, resulting from the hydrolysis of ATP was determined by a
colorimetric quantification after 30 min incubation at room temperature. The phosphate
molybdate complex formed was quantified at 820 nm in a Spectramax M2 (Molecular
4. Towards understanding of the allocrite specificity of the lipid floppase ABCA1
142 | P a g e
Device, Sunnyvale, CA). An absorbance value of samples with ATP, compound and
crude membranes at different concentrations was measured. The pH value of sample
solutions were checked and adjusted if necessary. Samples without membranes were
incubated in parallel in order to correct for unspecific ATPhydrolysis in all
measurements. Measurements were performed in duplicate on the microtiter plate. The
absorbance of the basal activity was calculated as an average of four samples with crude
membranes and ATP.

4. Towards understanding of the allocrite specificity of the lipid floppase ABCA1
143 | P a g e
Results
Linearity of the ATP-hydrolysis
The linearity of ATP hydrolysis of inside-out plasma membrane vesicles
(HEK293-ABCA1) over time was tested in order to optimize the reaction time of the
phosphate release assay. Experiments were performed in phosphate realase assay buffer
at 37°C without any compounds. The basal activity was measured up to two hours. In
Figure 1 the absorbance of the molybdate phosphate complex at λ = 820 nm is shown as
a function of time. The absorbance increased linearly from ~ 0.1 to ~ 0.9. The linear fit
to the absorbance versus time data is within the limit of error, proving the linearity of
the ATP hydrolysis.
Figure 1
Phosphate release assay
The compounds investigated can be divided into four main classes. (I) short chain
phosphocholines (PC) and lyso-phosphocholines (lyso-PC), (II) detergents, which
interact with Pgp [26, 27], (III) vitamin E [20] and its derivatives TPGS400 and
TPGS1000, and (IV) the stilbenes resveratrol, DIDS and estradiol. HEK-ABCA1-
inside-out vesicles were titrated at 37°C. The results for all experiments performed are
summarized in Table 1 and the fold of activation as a function of the putative allocrite
concentration is shown in the Appendix. Lyso-PC and PC lipids, the steroid hormone
4. Towards understanding of the allocrite specificity of the lipid floppase ABCA1
144 | P a g e
and vitamin E were tested below the critical micellar(/aggregation) concentration
(CMC) and showed no reproducible effects in the phosphate release assay. Repetition of
the assay with identical putative allocrites revealed significant deviating data (≤ 50 %)
in some cases.
Table 1
Effects on the ATPase activity were observed with compounds classified as detergents,
vitamin E derivatives and stilbenes.
Several detergents were used below and also above the CMC as shown in Table 1 and
in the appendix. Note that the CMC could change under different conditions. At the
CMC a small increase of activation (≤ 5 %) was observed occasionally (n-decyl-β-D-
glucopyranosid, CHAPS, C12EO8). The small increase in activity arises due to vesicle
lysis above the CMC and the concomitant exposure of originally occluded NBDs [28].
N-decyl-β-D-glucopyranosid showed contradicting effects (activation/inhibition) in
different assays at higher concentrations and was not further evaluated.
Further effects are grouped into compounds that caused (i) decreased activity below the
CMC, (ii) decreased activity above the CMC and (iii) increased activity above the CMC
in the phosphate release assay. Increased activity below the CMC was not observed
with any tested compound.
(i) Stilbenes tested (resveratrol and DIDS (4,4'-Diisothiocyano-2,2'-stilbenedisulfonic
acid)) decreased the activity in the phosphate release assay and in its modified version,
respectively (Figure 2, Table 1 and Appendix). DIDS decreased the activity to about
10 % of basal activity, whereas resveratrol inhibited only to about 75 %. In Figure 3 the
absorbance of the inhibition assay with DIDS is shown as a function of the
4. Towards understanding of the allocrite specificity of the lipid floppase ABCA1
145 | P a g e
concentration. While the absorbance of samples with membranes decreased, samples
without membranes did not show any decrease of absorbance with increasing DIDS
concentrations. Hence, an artifact due to interaction of the phosphate molybdate
complex with the compound could be ruled out. The absorbance of the samples without
membranes is due to the color complex, which was formed by traces of phosphate in the
ATP preparation.
Figure 2
Figure 3
(ii) The detergents CHAPS, Triton X-100 and C12EO8 showed decreasing activity above
their CMC in the phosphate release assay (Table 1 and Appendix). CHAPS decreased
the activity strongly down to ~ 10 %, whereas Triton X-100 and C12EO8 indicated
slightly decreased activity (~ 80 %). Inhibitory effects of detergents above the CMC are
generally assumed to be unspecific. However, the strong inhibiting effect of CHAPS
compared to other tested detergents above the CMC could be a hint of specific
interaction with ABCA1. A specific effect is confirmed by repetition of the experiment
(CHAPS and C12EO8) with inside-out-vesicles prepared from HEK293-WT cells that
did not show any effect.
(iii) The detergents Tween80 and Tween40 and the vitamin E derivatives TPGS400 and
TPGS1000 showed increased activity above its CMC in the phosphate release assay
(Table 1, Figure 4 and Appendix). The increased ATPase activity of the transfected
inside-out vesicles was ~ 140 % with Tween80, ~ 130 % with TPGS1000, ~ 140 % with
Tween40 and ~ 115 % with TPGS400. These compounds are all characterized by an
4. Towards understanding of the allocrite specificity of the lipid floppase ABCA1
146 | P a g e
amphiphillic structure composed of a hydrophilic polyethylene glycol (PEG) chain, a
heterocyclic group and a relatively long hydrophobic aliphatic hydrocarbon chain.
Activation above the CMC could be a sign of very low affinity of these allocrits to the
transporter, analogous to the ABC transporter SAV1866 (Andreas Beck, Päivi
Äänismaa and Anna Seelig; unpublished). Low affinity requires a high concentration of
the allocrite in the membrane, as it occurs above an allocrite`s CMC.
Figure 4
Modified phosphate release assay
Putative inhibitors of the NBDs of HEK293-ABCA1 cells were tested by means of a
modified phosphate release assay. Generally, vanadate and aluminum fluoride
complexes are inhibitors of nucleotide binding domains (NBDs) due to its chemical
analogy to phosphate. The result of the inhibition assay is illustrated in Figure 2. The
basal activity of the transfected inside-out vesicles is plotted against the logarithm of the
inhibitor concentration and shows a linear dependence. Therefore inhibition followed an
exponential rule. Vanadate, which is a capable inhibitor of the ATPase of P-glyco-
protein [30] did not fully inhibit ABCA1 ATPase activity (35 %). In contrast, aluminum
fluorides and DIDS showed inhibition to less than 10 %. Until now it is unclear whether
DIDS is interacting with the NBDs, whereas aluminum fluorides and vanadate are
known to inhibit the NBDs [31].

4. Towards understanding of the allocrite specificity of the lipid floppase ABCA1
147 | P a g e
Discussion and conclusions
The copy number of ABCA1 proteins per HEK293-ABCA1 cell is estimated to be 105.
This is ten times lower than in MDR1 transfected mouse embryo fibroblasts NIH-
MDR1-G185. Therefore, relatively small increasing effects on the activity were
measured in the phosphate release assay.
The small activating effect of less than 5 % after lysis of the inside-out vesicles at the
CMC of several detergents indicates a high percentage of inside-out vesicles compared
to right-side-out vesicles.
The endogenous allocrits PCs and vitamin E as well as Lyso-PCs did not show any
effect. This could either mean that these compounds are not transported or that they are
transported with basal activity.
DIDS and resveratrol, both carry a stilbene group. The compounds affected decreased
activity in the phosphate release assay and in its modified version, the inhibition assay,
respectively. The effect of resveratrol was also found for Pgp in inside-out vesicles
made of NIH cells transfected with Pgp (NIH-MDR1-G185). But the effect was not
observed with inside-out vesicles made of wildtype NIH cells (NIH-3T3) (PGP and
wiltype: Xiachun Li-Blatter and Anna Seelig; unpublished results) suggesting a specific
effect on ABCA1. Since the concentrations of half-maximum activation, K1, for the two
transporters Pgp and ABCA1 were virtually identical and DIDS (pKa: -3.21, -1.43, -
0.37, 0.23) does not insert into the lipid bilayer an interaction with the NBDs is more
likely than an interaction with the TMDs.
The activity of ABCA1 was decreased by many detergents near or above the CMC. This
is generally assumed to be an unspecific effect. Nevertheless, a specific effect cannot be

4. Towards understanding of the allocrite specificity of the lipid floppase ABCA1
148 | P a g e
excluded since detergents very often stabilize membrane proteins and have specific
effects to ABC transporters [26].
Tween and TPGS are amphiphillic compounds that are featured by a PEG chain, a
heterocyclic group and a hydrocarbon chain as common structural elements and showed
activation in the phosphate release assay with ABCA1 above the CMC. In contrast,
these substances inhibited Pgp activity below the CMC [26, 32]. Activation above the
CMC could be a sign of low affinity of the transporter to TPGS and Tween as eluded
above (chapter: results). Low affinity of ABCA1 to allocrits could be a general feature
of these interactions. Regarding the high concentrations of phospholipids and
cholesterol in lipid membranes, a low affinity of ABCA1 to these allocrites is probably
physiologically necessary to fulfill its function as efflux transporter. High affinity and
high concentrations would yield inhibition of the transporter [25]. Furthermore it is in
agreement with the study of Takahashi et al. [22] who measured compounds in mixed
vesicles at high concentrations (e.g. steroids at 20 % w/w). On the other hand, activation
above the CMC could also be an effect due to changed membrane parameters. However,
Tween80 yields a lower, whereas TPGS leads to higher packing density of the
membrane [33] but both compounds increased the activity in the phosphate release
assay suggesting a specific interaction with the transporter. The assumption of a specific
effect is also supported by the fact that all tested detergents changed membrane
parameters but most of them showed decreasing activity.
Compared to Pgp, which interacts with a lot of different molecules via hydrogen bond
formation [34, 35] ABCA1 seems to be more specific to its allocrits.
Aluminum fluorides and vanadate are typical inhibitors of NBDs due to their phosphate
mimicking characteristics. Several ABC transporters and other nucleotide triphosphate
hydrolysing proteins are known to be inhibited by aluminum fluorides (AtABCD1,

4. Towards understanding of the allocrite specificity of the lipid floppase ABCA1
149 | P a g e
MRP1, G-proteins) [30, 36, 37]. Vanadate is commonly used in the phosphate release
assay with Pgp overexpressing cells at a concentration of 0.5 mM in order to inhibit Pgp
ATPase activity almost completely. At this concentration ABCA1 was only inhibited to
~ 55 % by vanadate. This is in agreement with investigations of Takahashi et al. [22].
The lack of vandate sensitivity observed in our assays proves a specific measurement of
the ABCA1 ATPase. Vanadate and aluminum fluorides are both inhibitors arresting the
enzyme in similar ATP hydrolysis transition states [30]. Even though, different
vanadate sensitivity may mean that the NBDs of Pgp hydrolyze ATP on a different
mechanism than ABCA1.
4. Towards understanding of the allocrite specificity of the lipid floppase ABCA1
150 | P a g e
Legends to the figures
Figure 1: ATP hydrolysis of HEK-ABCA1 inside-out vesicles measured by
quantification of inorganic phosphate released. The absorbance of the molybdate-
phosphate complex was measured at 820 nm and is plotted against the time of
hydrolysis.
Figure 2: The graphs show inhibition of the basal activity of HEK293-ABCA1 inside-
out plasma membrane vesicles in a phosphate release assay as a function of the tested
compound concentration. Tested compounds were vanadate (A), aluminum fluorides
(B) and DIDS. The activity decreased linearly with the concentration for all three
substances in a semi logarithmic plot. However, vanadate decreased to about 30 %,
whereas aluminum fluorides and DIDS decreased the activity to less than 10 % in the
concentration range measured.
Figure 3: The absorbance of the molybdate-phosphate complex formed is shown in
dependence of the concentration of DIDS. The samples without inside-out vesicles
(blue points) show approximately constant absorbance values, whereas the difference of
absorbance of samples with ATP and without (see materials and methods) is decreasing
linearly in this semi logarithmic plot.
Figure 4: TPGS400 (A) and TPGS1000 (B) were measured with the phosphate release
assay. The normalized activity of one measurement is plotted as a function of the
compound concentration. The error bars represent the differences of duplicates. The

4. Towards understanding of the allocrite specificity of the lipid floppase ABCA1
151 | P a g e
CMC of both compounds lies at a concentration of. ~ 10 µM. Both compounds showed
slight activation at concentrations above the CMC.
Table 1: Summary of putative allocrites tested in phosphate release assays with inside-
out vesicles of ABCA1 transfected HEK293 cells. Ice samples were subtracted in
experiments in which vanadate was used to inhibit the ATPase. Critical micellar
concentrations (CMC) or critical aggregation concentrations were obtained from Li-
Blatter et al. [26] (#), Stafford et al. [29] (*) and the Avanti lipid hompage
(http://avantilipids.com/index.php?option=com_content&view=article&id=1703&Itemi
d=422) (+). The remaining CMCs are from unpublished results generously provided by
Xiachun Li-Blatter and Anna Seelig. Concentrations above the CMC are colored in red.
4. Towards understanding of the allocrite specificity of the lipid floppase ABCA1
152 | P a g e
Literature
1. Zarubica A, Trompier D, Chimini G: ABCA1, from pathology to membrane
function. Pflugers Arch 2007, 453(5):569-579.
2. Van Eck M, Pennings M, Hoekstra M, Out R, Van Berkel TJ: Scavenger
receptor BI and ATP-binding cassette transporter A1 in reverse cholesterol
transport and atherosclerosis. Curr Opin Lipidol 2005, 16(3):307-315.
3. Lee JY, Parks JS: ATP-binding cassette transporter AI and its role in HDL
formation. Curr Opin Lipidol 2005, 16(1):19-25.
4. Takahashi Y, Smith JD: Cholesterol efflux to apolipoprotein AI involves
endocytosis and resecretion in a calcium-dependent pathway. Proc Natl
Acad Sci U S A 1999, 96(20):11358-11363.
5. Boadu E, Francis GA: The role of vesicular transport in ABCA1-dependent
lipid efflux and its connection with NPC pathways. J Mol Med (Berl) 2006,
84(4):266-275.
6. Brooks-Wilson A, Marcil M, Clee SM, Zhang LH, Roomp K, van Dam M, Yu
L, Brewer C, Collins JA, Molhuizen HO et al: Mutations in ABC1 in Tangier
disease and familial high-density lipoprotein deficiency. Nat Genet 1999,
22(4):336-345.
7. Lawn RM, Wade DP, Garvin MR, Wang X, Schwartz K, Porter JG, Seilhamer
JJ, Vaughan AM, Oram JF: The Tangier disease gene product ABC1 controls
the cellular apolipoprotein-mediated lipid removal pathway. J Clin Invest
1999, 104(8):R25-31.
4. Towards understanding of the allocrite specificity of the lipid floppase ABCA1
153 | P a g e
8. Rust S, Rosier M, Funke H, Real J, Amoura Z, Piette JC, Deleuze JF, Brewer
HB, Duverger N, Denefle P et al: Tangier disease is caused by mutations in
the gene encoding ATP-binding cassette transporter 1. Nat Genet 1999,
22(4):352-355.
9. Rust S, Walter M, Funke H, von Eckardstein A, Cullen P, Kroes HY, Hordijk R,
Geisel J, Kastelein J, Molhuizen HO et al: Assignment of Tangier disease to
chromosome 9q31 by a graphical linkage exclusion strategy. Nat Genet
1998, 20(1):96-98.
10. Oram JF, Lawn RM, Garvin MR, Wade DP: ABCA1 is the cAMP-inducible
apolipoprotein receptor that mediates cholesterol secretion from
macrophages. J Biol Chem 2000, 275(44):34508-34511.
11. Oram JF, Heinecke JW: ATP-binding cassette transporter A1: a cell
cholesterol exporter that protects against cardiovascular disease. Physiol
Rev 2005, 85(4):1343-1372.
12. Schmitz G, Langmann T: Transcriptional regulatory networks in lipid
metabolism control ABCA1 expression. Biochim Biophys Acta 2005,
1735(1):1-19.
13. Wellington CL, Walker EK, Suarez A, Kwok A, Bissada N, Singaraja R, Yang
YZ, Zhang LH, James E, Wilson JE et al: ABCA1 mRNA and protein
distribution patterns predict multiple different roles and levels of
regulation. Lab Invest 2002, 82(3):273-283.
14. Wang N, Tall AR: Regulation and mechanisms of ATP-binding cassette
transporter A1-mediated cellular cholesterol efflux. Arterioscler Thromb
Vasc Biol 2003, 23(7):1178-1184.

4. Towards understanding of the allocrite specificity of the lipid floppase ABCA1
154 | P a g e
15. Wang N, Chen W, Linsel-Nitschke P, Martinez LO, Agerholm-Larsen B, Silver
DL, Tall AR: A PEST sequence in ABCA1 regulates degradation by calpain
protease and stabilization of ABCA1 by apoA-I. J Clin Invest 2003,
111(1):99-107.
16. Aiello RJ, Brees D, Francone OL: ABCA1-deficient mice: insights into the
role of monocyte lipid efflux in HDL formation and inflammation.
Arterioscler Thromb Vasc Biol 2003, 23(6):972-980.
17. Aiello RJ, Brees D, Bourassa PA, Royer L, Lindsey S, Coskran T, Haghpassand
M, Francone OL: Increased atherosclerosis in hyperlipidemic mice with
inactivation of ABCA1 in macrophages. Arterioscler Thromb Vasc Biol 2002,
22(4):630-637.
18. Liu L, Bortnick AE, Nickel M, Dhanasekaran P, Subbaiah PV, Lund-Katz S,
Rothblat GH, Phillips MC: Effects of apolipoprotein A-I on ATP-binding
cassette transporter A1-mediated efflux of macrophage phospholipid and
cholesterol: formation of nascent high density lipoprotein particles. J Biol
Chem 2003, 278(44):42976-42984.
19. Fielding PE, Nagao K, Hakamata H, Chimini G, Fielding CJ: A two-step
mechanism for free cholesterol and phospholipid efflux from human
vascular cells to apolipoprotein A-1. Biochemistry 2000, 39(46):14113-14120.
20. Reboul E, Trompier D, Moussa M, Klein A, Landrier JF, Chimini G, Borel P:
ATP-binding cassette transporter A1 is significantly involved in the
intestinal absorption of alpha- and gamma-tocopherol but not in that of
retinyl palmitate in mice. Am J Clin Nutr 2009, 89(1):177-184.
21. Seelig A: The role of size and charge for blood-brain barrier permeation of
drugs and fatty acids. J Mol Neurosci 2007, 33(1):32-41.

4. Towards understanding of the allocrite specificity of the lipid floppase ABCA1
155 | P a g e
22. Takahashi K, Kimura Y, Kioka N, Matsuo M, Ueda K: Purification and
ATPase activity of human ABCA1. J Biol Chem 2006, 281(16):10760-10768.
23. Litman T, Zeuthen T, Skovsgaard T, Stein WD: Competitive, non-competitive
and cooperative interactions between substrates of P-glycoprotein as
measured by its ATPase activity. Biochim Biophys Acta 1997, 1361(2):169-
176.
24. Litman T, Zeuthen T, Skovsgaard T, Stein WD: Structure-activity
relationships of P-glycoprotein interacting drugs: kinetic characterization
of their effects on ATPase activity. Biochim Biophys Acta 1997, 1361(2):159-
168.
25. Aanismaa P, Gatlik-Landwojtowicz E, Seelig A: P-glycoprotein senses its
substrates and the lateral membrane packing density: consequences for the
catalytic cycle. Biochemistry 2008, 47(38):10197-10207.
26. Li-Blatter X, Nervi P, Seelig A: Detergents as intrinsic P-glycoprotein
substrates and inhibitors. Biochim Biophys Acta 2009, 1788(10):2335-2344.
27. Seelig A, Gerebtzoff G: Enhancement of drug absorption by noncharged
detergents through membrane and P-glycoprotein binding. Expert Opin
Drug Metab Toxicol 2006, 2(5):733-752.
28. Lu P, Liu R, Sharom FJ: Drug transport by reconstituted P-glycoprotein in
proteoliposomes. Effect of substrates and modulators, and dependence on
bilayer phase state. Eur J Biochem 2001, 268(6):1687-1697.
29. Stafford RE, Fanni T, Dennis EA: Interfacial properties and critical micelle
concentration of lysophospholipids. Biochemistry 1989, 28(12):5113-5120.

4. Towards understanding of the allocrite specificity of the lipid floppase ABCA1
156 | P a g e
30. Kern A, Felfoldi F, Sarkadi B, Varadi A: Expression and characterization of
the N- and C-terminal ATP-binding domains of MRP1. Biochem Biophys
Res Commun 2000, 273(3):913-919.
31. Chabre M: Aluminofluoride and beryllofluoride complexes: a new
phosphate analogs in enzymology. Trends Biochem Sci 1990, 15(1):6-10.
32. Werle M: Natural and synthetic polymers as inhibitors of drug efflux
pumps. Pharm Res 2008, 25(3):500-511.
33. Rege BD, Kao JP, Polli JE: Effects of nonionic surfactants on membrane
transporters in Caco-2 cell monolayers. Eur J Pharm Sci 2002, 16(4-5):237-
246.
34. Seelig A: A general pattern for substrate recognition by P-glycoprotein. Eur
J Biochem 1998, 251(1-2):252-261.
35. Seelig A: How does P-glycoprotein recognize its substrates? Int J Clin
Pharmacol Ther 1998, 36(1):50-54.
36. Nyathi Y, De Marcos Lousa C, van Roermund CW, Wanders RJ, Johnson B,
Baldwin SA, Theodoulou FL, Baker A: The Arabidopsis peroxisomal ABC
transporter, comatose, complements the Saccharomyces cerevisiae pxa1
pxa2Delta mutant for metabolism of long-chain fatty acids and exhibits
fatty acyl-CoA-stimulated ATPase activity. J Biol Chem 2010,
285(39):29892-29902.
37. Strunecka A, Strunecky O, Patocka J: Fluoride plus aluminum: useful tools in
laboratory investigations, but messengers of false information. Physiol Res
2002, 51(6):557-564.

4. Towards understanding of the allocrite specificity of the lipid floppase ABCA1
157 | P a g e
Figures and Tables
Figure 1
0.0
0.2
0.4
0.6
0.8
1.0
-10 10 30 50 70 90 110 130
abso
rban
ce a
t 820
nm
time / min

4. Towards understanding of the allocrite specificity of the lipid floppase ABCA1
158 | P a g e
Figure 2
0
0.1
0.2
0.3
0.4
0.5
0.6
0.7
0.8
0.01 0.1 1 10 100
norm
alize
d ac
tivity
c(VO4) / mM
A
0.0
0.2
0.4
0.6
0.8
1.0
0.01 0.1 1 10
norm
alize
d ac
tivity
c(AlF4) / mM
B
0
0.1
0.2
0.3
0.4
0.5
0.6
0.7
0.01 0.1 1 10
norm
alize
d ac
tivity
c(DIDS) / mM
C

4. Towards understanding of the allocrite specificity of the lipid floppase ABCA1
159 | P a g e
Figure 3
Figure 4
0
0.1
0.2
0.3
0.4
0.5
0.01 0.1 1 10
abso
rban
ce a
t 820
nm
c(DIDS) / mM
0.6
0.8
1.0
1.2
1.4
1.E-01 1.E+00 1.E+01 1.E+02 1.E+03
norm
alize
d ac
tivity
Conc / µM
A
0.8
0.9
1.0
1.1
1.2
1.3
1.E-01 1.E+00 1.E+01 1.E+02
norm
alize
d ac
tivity
Conc / µM
B

4. Towards understanding of the allocrite specificity of the lipid floppase ABCA1
160 | P a g e
Table 1
group compound kinase inhibit.
approx.. max. activation
/ %
approx. max.
inhibition / %
conc. range /
µM
CMC / µM
Lyso PCs 8 Vanadate - - 5-5335 60000+
8 Vanadate - - 5-5335 60000+
10 Vanadate - - 7.3-2912 7000*
10 Vanadate - - 1.4-564 7000*
12 Vanadate + - 0.6-337 700*
12 Vanadate - - 0.6-334 700* PCs 8 Vanadate - - 0.6-380 270+
8 Vanadate - - 0.6-381 270+
8 Vanadate - - 0.6-382 270+
8 in DMSO Vanadate - - 2.1-4168 8 in DMSO Vanadate - - 2.1-4169 8 Vanadate - - 0.4-251 270+
8 Vanadate - - 0.4-251 270+
8 Vanadate - - 0.6-387 270+
9 Vanadate - - 0.1-58 29+
9 Vanadate - - 0.1-58 29+ Detergents C12EO8 Al·F- Δ≤ 5 at CMC 80 0.7-747 90#
C12EO8 Al·F- Δ ≤ 5 at CMC 80 0.7-747 90#
C12EO8 Vanadate Δ ≤ 5 at CMC 80 0.7-747 90#
C12EO8 Vanadate Δ ≤ 5 at CMC 90 0.7-747 90#
CHAPS low Vanadate - 2.8-5529 10000#
CHAPS low Vanadate - 2.8-5530 10000#
CHAPS high Vanadate Δ ≤ 5 at CMC 20 39-78823 10000#
CHAPS high Vanadate Δ ≤ 5 at CMC 5 39-78823 10000#
CHAPS high Al·F- Δ ≤ 5 at CMC 20 39-78823 10000#
n-decyl-β-
gylcopyranosid Vanadate Δ ≤ 5 at CMC 75 6.3-2542 2200#
n-decyl-β-
gylcopyranosid Vanadate 110 and ≤ 5 at CMC - 6.3-2543 2200#
Triton X-100 Vanadate - 80 2.2-886 300#
Triton X-100 Vanadate - 80 2.2-887 300# Tween40 Vanadate 120 - 0.3-105 27#
Tween 80 Vanadate 105 - 0.03-11.9 12#
Tween 80 Vanadate 105 - 0.03-11.10 12#
Tween 80 Vanadate 140 - 0.14-56 12# Vitamin E – (derivatives) Vitamin E Vanadate - - 0.1-77
Vitamin E Vanadate - - 0.1-78 TPGS 1000 Vanadate 140 - 0.1-81 ~ 10
TPGS 1000 Vanadate 125 - 0.1-81 ~ 10
TPGS 400 Vanadate 115 - 0.4-172 ~ 10
TPGS 400 Vanadate 115 - 0.4-172 ~ 10 Steroids Estradiol Vanadate - - 1.7-2000 ~ 1400
Estradiol Vanadate - - 4.6-5512 ~ 1400 Stilbenes Resveratrol Vanadate - 60 0.5-616 ~ 680
Resveratrol Vanadate - 70 0.5-610 ~ 680
DIDS modified assay - 10 25-3210

4. Towards understanding of the allocrite specificity of the lipid floppase ABCA1
161 | P a g e
Appendix
Fold vs. concentration plots of all measured compounds in the phosphate release assay.
Measurements of the lowest and the highest concentration should not be taken into
account as they are from wells at the edge of the 96-well plates.
0.50
1.00
1.50
1.E-01 1.E+00 1.E+01 1.E+02 1.E+03
fold
Conc / µM
Lyso PC12

4. Towards understanding of the allocrite specificity of the lipid floppase ABCA1
162 | P a g e
0.50
1.00
1.50
1.E+00 1.E+01 1.E+02 1.E+03 1.E+04
fold
Conc / µM
Lyso PC10
0.5
1.0
1.5
1.E+00 1.E+01 1.E+02 1.E+03 1.E+04
fold
Conc / µM
Lyso PC08
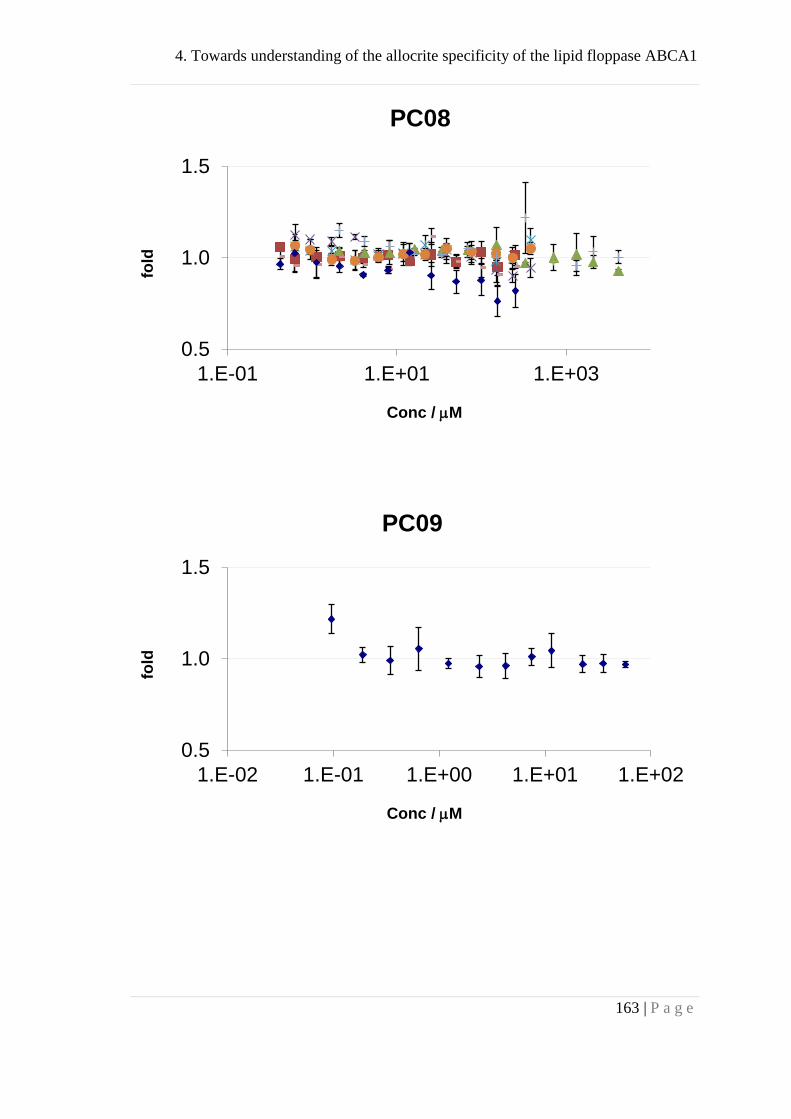
4. Towards understanding of the allocrite specificity of the lipid floppase ABCA1
163 | P a g e
0.5
1.0
1.5
1.E-01 1.E+01 1.E+03
fold
Conc / µM
PC08
0.5
1.0
1.5
1.E-02 1.E-01 1.E+00 1.E+01 1.E+02
fold
Conc / µM
PC09

4. Towards understanding of the allocrite specificity of the lipid floppase ABCA1
164 | P a g e
0.0
0.5
1.0
1.5
1.E+00 1.E+02 1.E+04
fold
Conc / µM
CHAPS
0.5
1.0
1.5
1.E-01 1.E+00 1.E+01 1.E+02 1.E+03
fold
Conc / µM
C12EO8
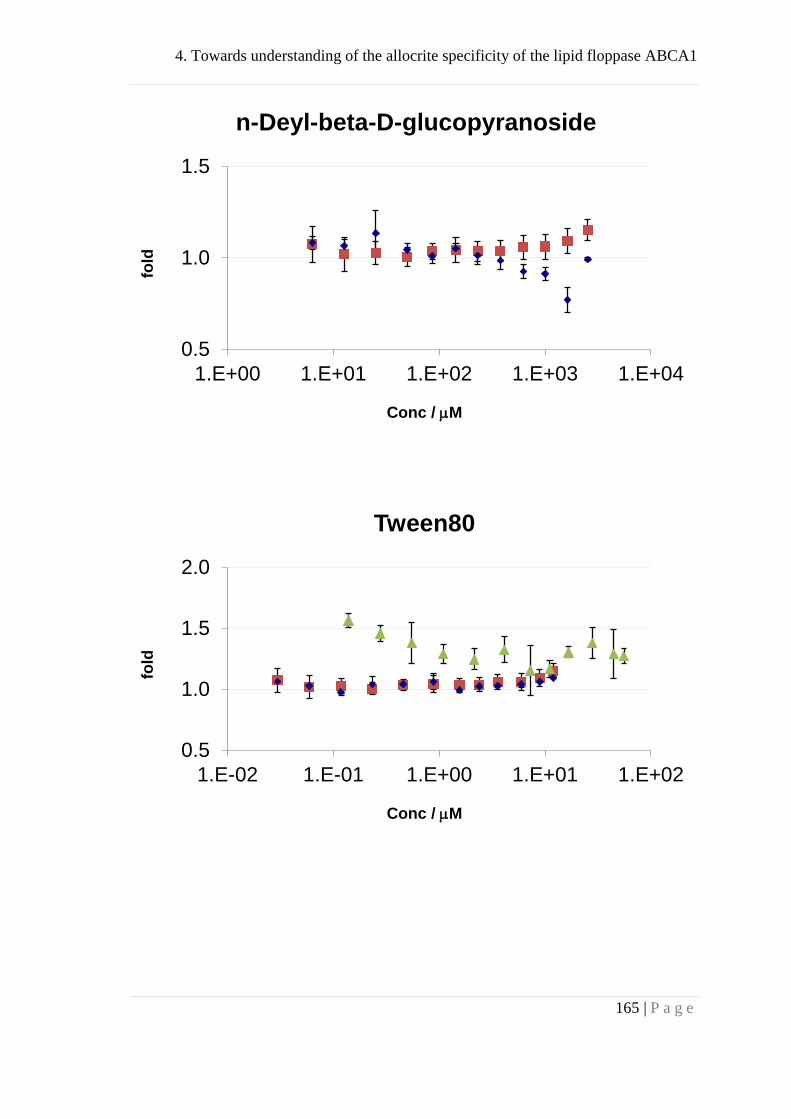
4. Towards understanding of the allocrite specificity of the lipid floppase ABCA1
165 | P a g e
0.5
1.0
1.5
1.E+00 1.E+01 1.E+02 1.E+03 1.E+04
fold
Conc / µM
n-Deyl-beta-D-glucopyranoside
0.5
1.0
1.5
2.0
1.E-02 1.E-01 1.E+00 1.E+01 1.E+02
fold
Conc / µM
Tween80

4. Towards understanding of the allocrite specificity of the lipid floppase ABCA1
166 | P a g e
0.5
1.0
1.5
1.E-01 1.E+00 1.E+01 1.E+02 1.E+03
fold
Conc / µM
Tween40
0.5
1.0
1.5
1.E+00 1.E+01 1.E+02 1.E+03
fold
Conc / µM
Triton X-100

4. Towards understanding of the allocrite specificity of the lipid floppase ABCA1
167 | P a g e
0.5
1.0
1.5
1.E-01 1.E+00 1.E+01 1.E+02
fold
Conc / µM
Vitamin E
0.5
1.0
1.5
1.E-01 1.E+00 1.E+01 1.E+02 1.E+03
fold
Conc / µM
TPGS400
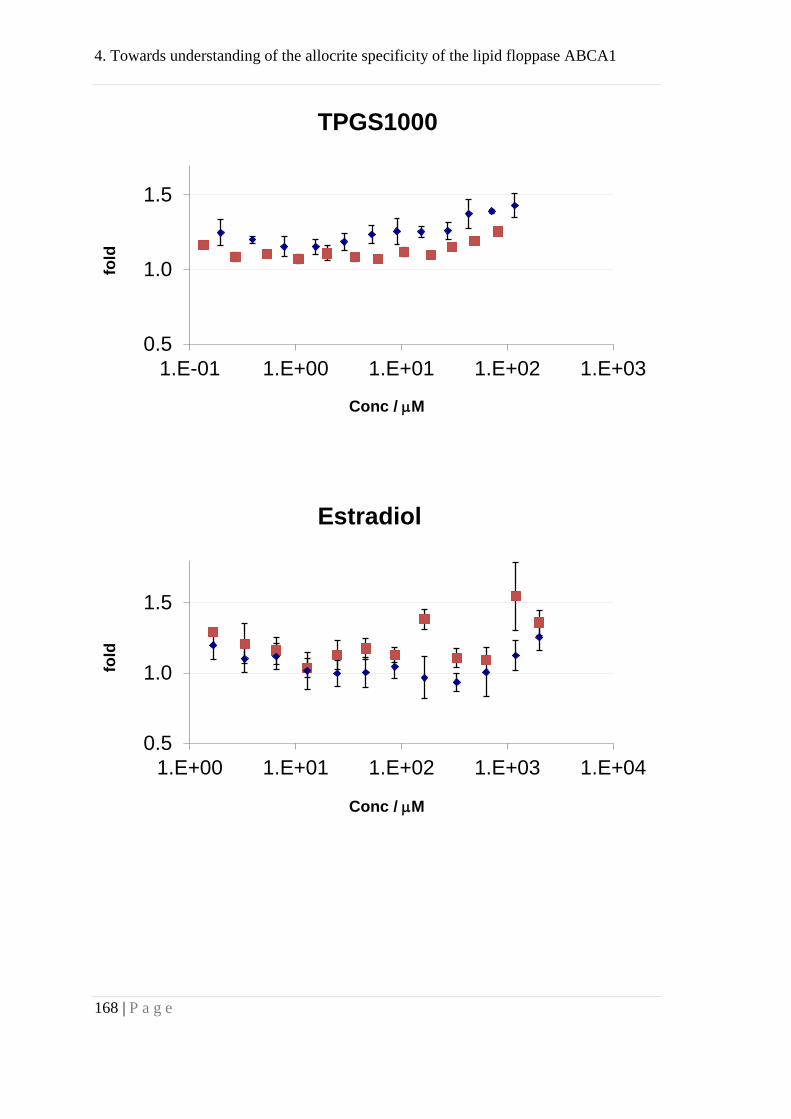
4. Towards understanding of the allocrite specificity of the lipid floppase ABCA1
168 | P a g e
0.5
1.0
1.5
1.E-01 1.E+00 1.E+01 1.E+02 1.E+03
fold
Conc / µM
TPGS1000
0.5
1.0
1.5
1.E+00 1.E+01 1.E+02 1.E+03 1.E+04
fold
Conc / µM
Estradiol
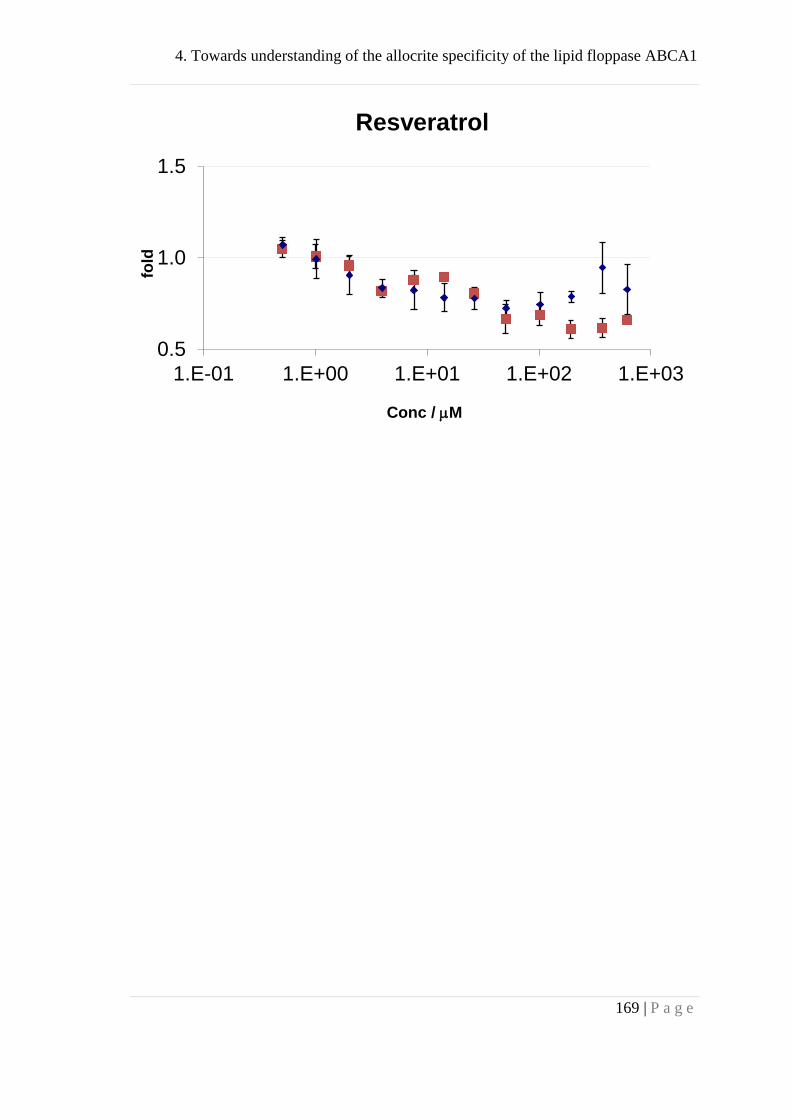
4. Towards understanding of the allocrite specificity of the lipid floppase ABCA1
169 | P a g e
0.5
1.0
1.5
1.E-01 1.E+00 1.E+01 1.E+02 1.E+03
fold
Conc / µM
Resveratrol

5. Acknowledgements
171 | P a g e
5. Acknowledgements
This work was carried out from October 2008 until February 2012 in the laboratories of
Prof. Dr. Joachim Seelig and Prof. Dr. Anna Seelig in the Department of Biophysical
Chemistry at the Biozentrum of the University of Basel.
First of all I would like to express my sincere gratitude to my supervisor, Professor
Joachim Seelig. His wide knowledge and his efficient modus operandi were of great
value to me. I am further grateful for the freedom I experienced in doing research and
choosing interesting projects.
I also want to thank Professor Anna Seelig for supervising me in my project about ABC
transporters. I learned a lot in inspiring discussions about research at the edge of
biophysics and pharmaceutical science. Her guidance in the beginning of my thesis was
a great help.
Thanks to Dr. Hans-Joachim Schönfeld for generously supplying us with plenty of
highly purified Apo A-1 and Dr. Matthew Wright for the transfected HEK293 cell lines.
I wish to express my thanks to Dr. André Ziegler for his support, competent advice and
time for discussion. He introduced me to most of the experimental methods I have
learned.
Also, I appreciate the work of Professor Jörg Huwyler as referee of this thesis.
Special thanks go to Therese Schulthess, whose experience, preciseness and helpfulness
in the lab made my lab-life easier. Analogous, Xiaochun Li-Blatter helped me with
important last-minute measurements.

5. Acknowledgement
172 | P a g e
Thanks to Dr. Andreas Beck, Christian Müller, Reto Sauder and Xiaochun Li-Blatter for
nice hours in the Mensa and discussions about interesting topics that went far beyond
the world of research.
Many thanks to present and former lab and floor mates for support and the friendly
working environment, in particular (if not already mentioned) Dr. Päivi Äänismaa,
Estefania Egido, Dr. Cinzia Esposito, Dr. Thomas Etzerodt, Dr. Sarah Güte, Dr.
Michael Hayley, Dr. Gabriela Klocek, Dr. Caroline Loew, Dr. Koiji Mochizuki, Rita
Müller, Susanna Notz, Dr. Samantha Persicace, Joseph Zolnerciks and Matthias Zwick.
Furthermore I experienced great support from Leo Faletti and Simon Sarner of the
technical workshop.
I owe my loving thanks to my family and friends.
6. Curriculum vitae
173 | P a g e
6. Curriculum vitae
Fabian Zehender
Institute of Biophysical Chemistry
Biozentrum, University of Basel
Klingelbergstrasse 50-70
CH-4056 Basel
Tel +41 612672192
Personal information
Date of birth: 14.04.1982
Place of birth: Freiburg, Germany
Nationality: german
Education
2008/10 – 2012/02
Graduate (Ph.D.) studies in Biophysics
Biozentrum, Biophysical Chemistry, University of Basel (CH)
Thesis supervisor: Prof. Joachim Seelig
PhD thesis: “Biophysical Characterization of Reactions Associated with Reverse
Cholesterol Transport”
2008/01 – 2008/07
Internship Novartis Pharma, Basel (CH)
10/2002 – 09/2007
Albert-Ludwigs-University Freiburg (D)
Diploma studies in chemistry
6. Curriculum vitae
174 | P a g e
Thesis supervisor: Prof. Peter Gräber
Thesis title: Korekonstitution der H+-ATPsynthase aus Cholorplasten mit
Bakteriorhodopsin aus Halobacterium salinarium.
2001/06
Abitur: Richard-Fehrenbach Gewerbeschule Freiburg (D)
Publikations
Fabian Zehender, A. Ziegler, H.-J. Schönfeld, and J. Seelig. Thermodynamics of
Protein Self-Association and Unfolding. The Case of Apolipoprotein A-I. Biochem.
Recently accepted manuscript. Publication date (web): 23.01.2012
Zehender F, Labahn A, Koslowski T: Detecting protein-protein interactions by
isotope-edited infrared spectroscopy: a numerical approach. J Phys Chem B 2005,
109(49):23674-23678.
Koslowski T, Zehender F: Towards a quantitative understanding of horizontal gene
transfer: a kinetic model. J Theor Biol 2005, 237(1):23-29.
7. Declaration
175 | P a g e
7. Declaration
I declare that I have written this thesis “Biophysical Characterization of Reactions
Associated with Reverse Cholesterol Transport” with the help indicated and that I have
only submitted it to the Faculty of Science of the University of Basel and to no other
faculty or university.
Basel, 07.02.2012 _______________________________
Fabian Zehender