BIOPAC Systems, Inc. - Oamkjjauhiai/opetus/fsk/biopac-ECG 1.pdf · Biopac Student Lab Lesson 5...
17
Physiology Lessons for use with the Biopac Student Lab Lesson 5 ELECTROCARDIOGRAPHY I Components of the ECG Richard Pflanzer, Ph.D. Associate Professor Emeritus Indiana University School of Medicine Purdue University School of Science William McMullen Vice President BIOPAC Systems, Inc. BIOPAC ® Systems, Inc. 42 Aero Camino, Goleta, CA 93117 (805) 685-0066, Fax (805) 685-0067 Email: [email protected] Web: www.biopac.com Manual Revision PL3.7.5 03162009 BIOPAC Systems, Inc.
Transcript of BIOPAC Systems, Inc. - Oamkjjauhiai/opetus/fsk/biopac-ECG 1.pdf · Biopac Student Lab Lesson 5...

Physiology Lessons
for use with the
Biopac Student Lab
Lesson 5
ELECTROCARDIOGRAPHY I
Components of the ECG
Richard Pflanzer, Ph.D.
Associate Professor Emeritus
Indiana University School of Medicine
Purdue University School of Science
William McMullen
Vice President
BIOPAC Systems, Inc.
BIOPAC® Systems, Inc. 42 Aero Camino, Goleta, CA 93117
(805) 685-0066, Fax (805) 685-0067
Email: [email protected]
Web: www.biopac.com
Manual Revision PL3.7.5
03162009
BIOPAC Systems, Inc.
Page 2 Biopac Student Lab 3.7.5
I. INTRODUCTION
The main function of the heart is to pump blood through two circuits:
1. Pulmonary circuit: through the lungs to oxygenate the blood and remove carbon dioxide; and
2. Systemic circuit: to deliver oxygen and nutrients to tissues and remove carbon dioxide.
Because the heart moves blood through two separate circuits, it is sometimes described as a dual pump.
In order to beat, the heart needs three types of cells:
1. Rhythm generators, which produce an electrical signal (SA node or normal pacemaker);
2. Conductors to spread the pacemaker signal; and
3. Contractile cells (myocardium) to mechanically pump blood.
The Electrical and Mechanical Sequence of a Heartbeat
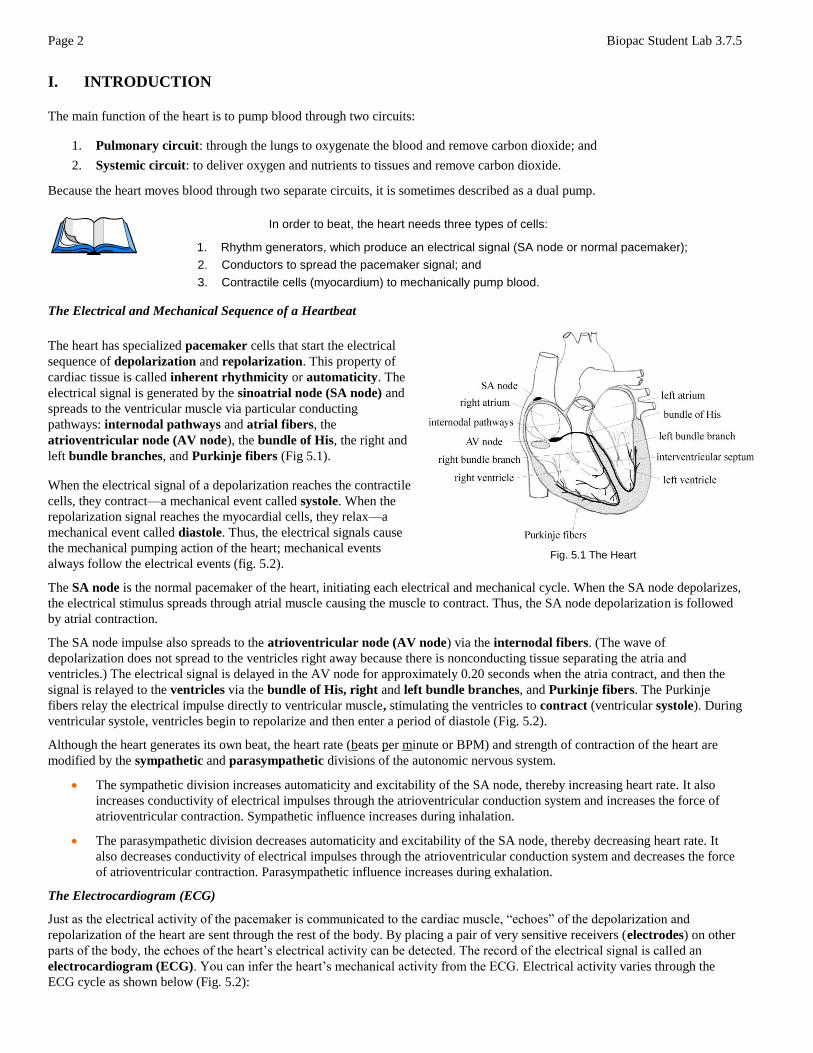
The heart has specialized pacemaker cells that start the electrical
sequence of depolarization and repolarization. This property of
cardiac tissue is called inherent rhythmicity or automaticity. The
electrical signal is generated by the sinoatrial node (SA node) and
spreads to the ventricular muscle via particular conducting
pathways: internodal pathways and atrial fibers, the
atrioventricular node (AV node), the bundle of His, the right and
left bundle branches, and Purkinje fibers (Fig 5.1).
When the electrical signal of a depolarization reaches the contractile
cells, they contract—a mechanical event called systole. When the
repolarization signal reaches the myocardial cells, they relax—a
mechanical event called diastole. Thus, the electrical signals cause
the mechanical pumping action of the heart; mechanical events
always follow the electrical events (fig. 5.2).
The SA node is the normal pacemaker of the heart, initiating each electrical and mechanical cycle. When the SA node depolarizes,
the electrical stimulus spreads through atrial muscle causing the muscle to contract. Thus, the SA node depolarization is followed
by atrial contraction.
The SA node impulse also spreads to the atrioventricular node (AV node) via the internodal fibers. (The wave of
depolarization does not spread to the ventricles right away because there is nonconducting tissue separating the atria and
ventricles.) The electrical signal is delayed in the AV node for approximately 0.20 seconds when the atria contract, and then the
signal is relayed to the ventricles via the bundle of His, right and left bundle branches, and Purkinje fibers. The Purkinje
fibers relay the electrical impulse directly to ventricular muscle, stimulating the ventricles to contract (ventricular systole). During
ventricular systole, ventricles begin to repolarize and then enter a period of diastole (Fig. 5.2).
Although the heart generates its own beat, the heart rate (beats per minute or BPM) and strength of contraction of the heart are
modified by the sympathetic and parasympathetic divisions of the autonomic nervous system.
The sympathetic division increases automaticity and excitability of the SA node, thereby increasing heart rate. It also
increases conductivity of electrical impulses through the atrioventricular conduction system and increases the force of
atrioventricular contraction. Sympathetic influence increases during inhalation.
The parasympathetic division decreases automaticity and excitability of the SA node, thereby decreasing heart rate. It
also decreases conductivity of electrical impulses through the atrioventricular conduction system and decreases the force
of atrioventricular contraction. Parasympathetic influence increases during exhalation.
The Electrocardiogram (ECG)
Just as the electrical activity of the pacemaker is communicated to the cardiac muscle, ―echoes‖ of the depolarization and
repolarization of the heart are sent through the rest of the body. By placing a pair of very sensitive receivers (electrodes) on other
parts of the body, the echoes of the heart’s electrical activity can be detected. The record of the electrical signal is called an
electrocardiogram (ECG). You can infer the heart’s mechanical activity from the ECG. Electrical activity varies through the
ECG cycle as shown below (Fig. 5.2):
Fig. 5.1 The Heart
Lesson 5: ECG I Page 3
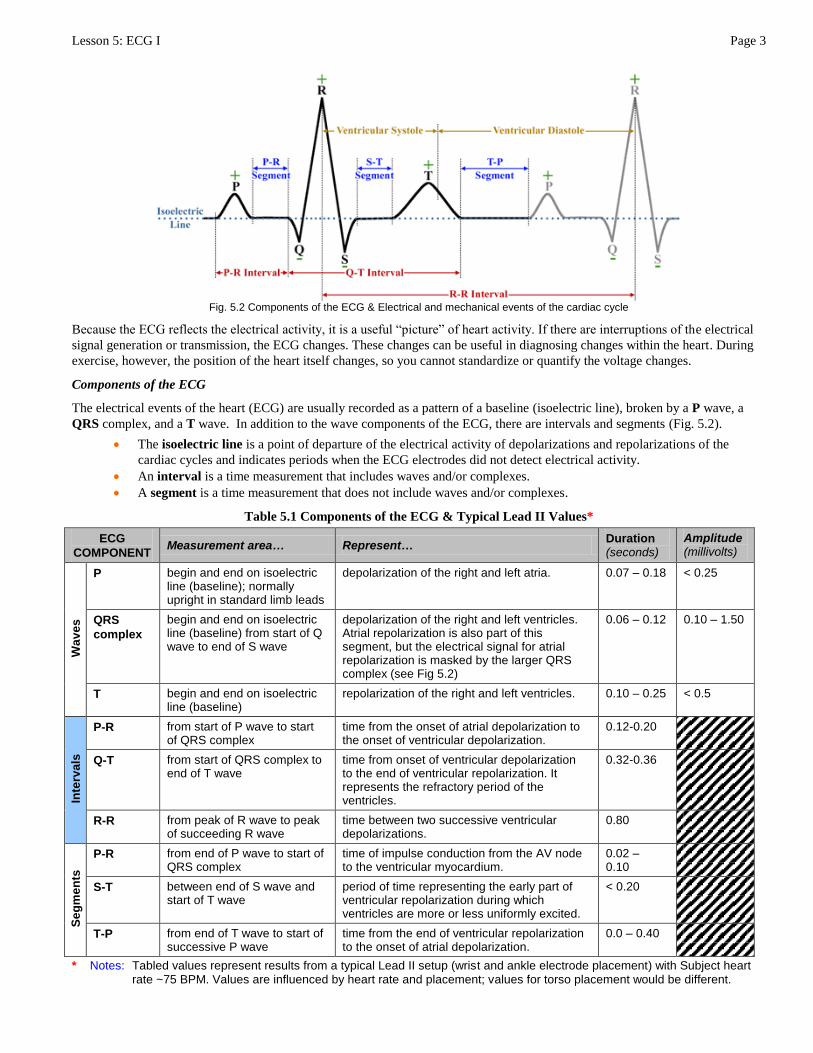
Fig. 5.2 Components of the ECG & Electrical and mechanical events of the cardiac cycle
Because the ECG reflects the electrical activity, it is a useful ―picture‖ of heart activity. If there are interruptions of the electrical
signal generation or transmission, the ECG changes. These changes can be useful in diagnosing changes within the heart. During
exercise, however, the position of the heart itself changes, so you cannot standardize or quantify the voltage changes.
Components of the ECG
The electrical events of the heart (ECG) are usually recorded as a pattern of a baseline (isoelectric line), broken by a P wave, a
QRS complex, and a T wave. In addition to the wave components of the ECG, there are intervals and segments (Fig. 5.2).
The isoelectric line is a point of departure of the electrical activity of depolarizations and repolarizations of the
cardiac cycles and indicates periods when the ECG electrodes did not detect electrical activity.
An interval is a time measurement that includes waves and/or complexes.
A segment is a time measurement that does not include waves and/or complexes.
Table 5.1 Components of the ECG & Typical Lead II Values*
ECG
COMPONENT Measurement area… Represent…
Duration (seconds)
Amplitude (millivolts)
Wa
ve
s
P begin and end on isoelectric line (baseline); normally upright in standard limb leads
depolarization of the right and left atria. 0.07 – 0.18 < 0.25
QRS
complex
begin and end on isoelectric line (baseline) from start of Q wave to end of S wave
depolarization of the right and left ventricles. Atrial repolarization is also part of this segment, but the electrical signal for atrial repolarization is masked by the larger QRS complex (see Fig 5.2)
0.06 – 0.12 0.10 – 1.50
T begin and end on isoelectric line (baseline)
repolarization of the right and left ventricles. 0.10 – 0.25 < 0.5
Inte
rva
ls
P-R from start of P wave to start of QRS complex
time from the onset of atrial depolarization to the onset of ventricular depolarization.
0.12-0.20
Q-T from start of QRS complex to end of T wave
time from onset of ventricular depolarization to the end of ventricular repolarization. It represents the refractory period of the ventricles.
0.32-0.36
R-R from peak of R wave to peak of succeeding R wave
time between two successive ventricular depolarizations.
0.80
Se
gm
en
ts
P-R from end of P wave to start of QRS complex
time of impulse conduction from the AV node to the ventricular myocardium.
0.02 – 0.10
S-T between end of S wave and start of T wave
period of time representing the early part of ventricular repolarization during which ventricles are more or less uniformly excited.
< 0.20
T-P from end of T wave to start of successive P wave
time from the end of ventricular repolarization to the onset of atrial depolarization.
0.0 – 0.40
* Notes: Tabled values represent results from a typical Lead II setup (wrist and ankle electrode placement) with Subject heart rate ~75 BPM. Values are influenced by heart rate and placement; values for torso placement would be different.
Page 4 Biopac Student Lab 3.7.5
Leads
The particular arrangement of two electrodes (one positive, one negative) with respect to a third electrode (the ground) is called
a lead. The electrode positions for the different leads have been standardized. For this lesson, you will record from Lead II, which
has a positive electrode on the left ankle, a negative electrode on the right wrist, and the ground electrode on the right ankle.
Typical Lead II values are shown in Table 5.1.
Proper electrode attachment to subject will influence the quality of data collected. In addition, many factors—normal and
abnormal—determine R wave amplitude.
Normal factors include body size (BSA) and distribution of body fat, heart size (ventricular mass), position of the heart in
the chest relative to lead locations, metabolic rate, and others.
Abnormal factors include hyper- and hypothyroidism, ventricular hypertrophy (observed for example, in chronic valvular
insufficiency), morbid obesity, essential hypertension and many other pathologic states.
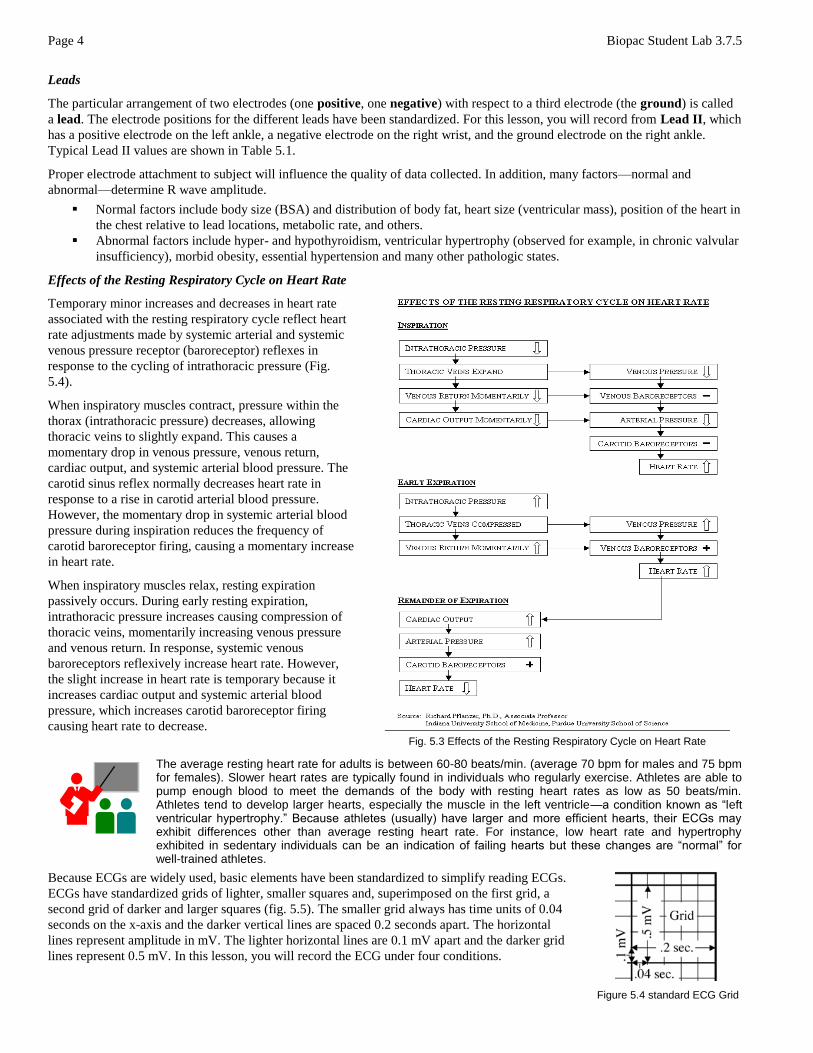
Effects of the Resting Respiratory Cycle on Heart Rate
Temporary minor increases and decreases in heart rate
associated with the resting respiratory cycle reflect heart
rate adjustments made by systemic arterial and systemic
venous pressure receptor (baroreceptor) reflexes in
response to the cycling of intrathoracic pressure (Fig.
5.4).
When inspiratory muscles contract, pressure within the
thorax (intrathoracic pressure) decreases, allowing
thoracic veins to slightly expand. This causes a
momentary drop in venous pressure, venous return,
cardiac output, and systemic arterial blood pressure. The
carotid sinus reflex normally decreases heart rate in
response to a rise in carotid arterial blood pressure.
However, the momentary drop in systemic arterial blood
pressure during inspiration reduces the frequency of
carotid baroreceptor firing, causing a momentary increase
in heart rate.
When inspiratory muscles relax, resting expiration
passively occurs. During early resting expiration,
intrathoracic pressure increases causing compression of
thoracic veins, momentarily increasing venous pressure
and venous return. In response, systemic venous
baroreceptors reflexively increase heart rate. However,
the slight increase in heart rate is temporary because it
increases cardiac output and systemic arterial blood
pressure, which increases carotid baroreceptor firing
causing heart rate to decrease. Fig. 5.3 Effects of the Resting Respiratory Cycle on Heart Rate
The average resting heart rate for adults is between 60-80 beats/min. (average 70 bpm for males and 75 bpm for females). Slower heart rates are typically found in individuals who regularly exercise. Athletes are able to pump enough blood to meet the demands of the body with resting heart rates as low as 50 beats/min. Athletes tend to develop larger hearts, especially the muscle in the left ventricle—a condition known as ―left ventricular hypertrophy.‖ Because athletes (usually) have larger and more efficient hearts, their ECGs may exhibit differences other than average resting heart rate. For instance, low heart rate and hypertrophy exhibited in sedentary individuals can be an indication of failing hearts but these changes are ―normal‖ for well-trained athletes.
Because ECGs are widely used, basic elements have been standardized to simplify reading ECGs.
ECGs have standardized grids of lighter, smaller squares and, superimposed on the first grid, a
second grid of darker and larger squares (fig. 5.5). The smaller grid always has time units of 0.04
seconds on the x-axis and the darker vertical lines are spaced 0.2 seconds apart. The horizontal
lines represent amplitude in mV. The lighter horizontal lines are 0.1 mV apart and the darker grid
lines represent 0.5 mV. In this lesson, you will record the ECG under four conditions.
Figure 5.4 standard ECG Grid
Lesson 5: ECG I Page 5
II. EXPERIMENTAL OBJECTIVES
1) To become familiar with the electrocardiograph as a primary tool for evaluating electrical events within the heart.
2) To correlate electrical events as displayed on the ECG with the mechanical events that occur during the cardiac
cycle.
3) To observe rate and rhythm changes in the ECG associated with body position and breathing.
III. MATERIALS
BIOPAC electrode lead set (SS2LA/L)
BIOPAC disposable vinyl electrodes (EL503), 3 electrodes per subject
BIOPAC electrode gel (GEL1) and abrasive pad (ELPAD) or Skin cleanser or alcohol prep
Biopac Student Lab System: BSL 3.7.5 software and MP45 data acquisition unit
Computer system
Cot or lab table and pillow
IV. EXPERIMENTAL METHODS
For further explanation, use the online support options under the Help Menu.
A. SETUP
FAST TRACK DETAILED EXPLANATION
1. Make sure the equipment is connected as
follows:
Electrode Lead Set (SS2LA/L)—CH 1
2. Make sure the BIOPAC MP45 unit is
plugged into your computer.
Fig. 5.5
3. Turn the computer ON. The desktop should appear on the monitor. If it does not appear, ask
the laboratory instructor for assistance.
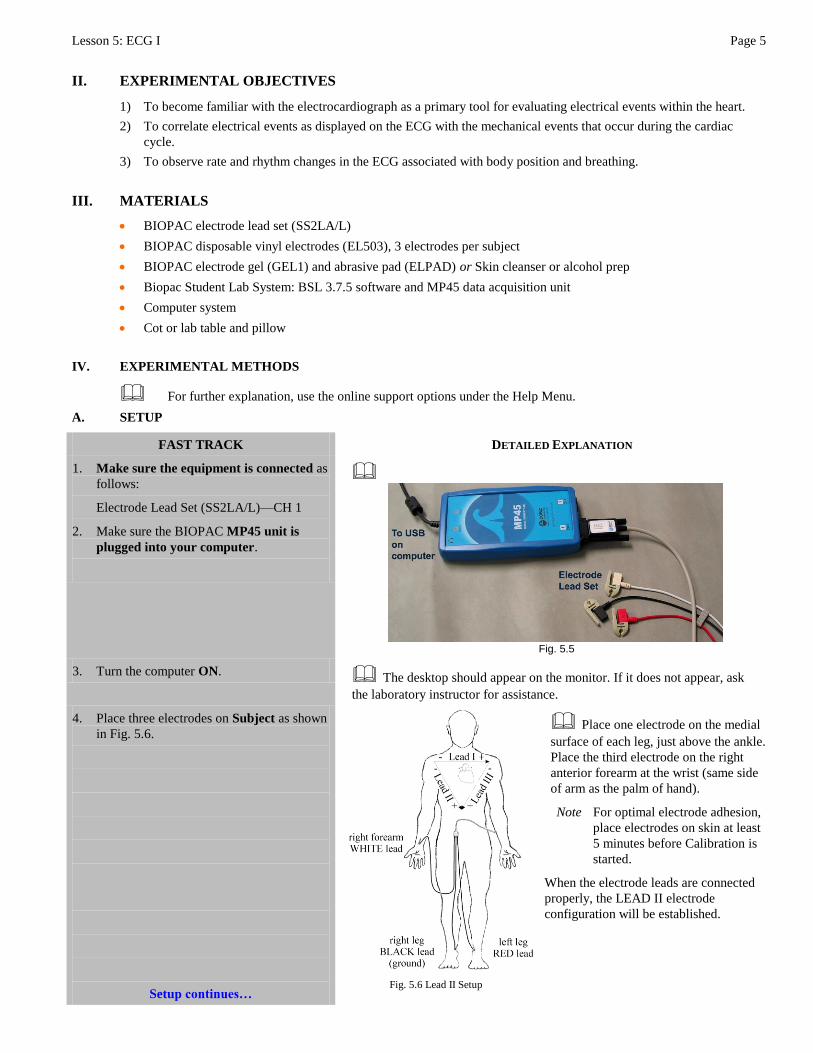
4. Place three electrodes on Subject as shown
in Fig. 5.6.
Setup continues…
Fig. 5.6 Lead II Setup
Place one electrode on the medial
surface of each leg, just above the ankle.
Place the third electrode on the right
anterior forearm at the wrist (same side
of arm as the palm of hand). Note For optimal electrode adhesion,
place electrodes on skin at least
5 minutes before Calibration is
started.
When the electrode leads are connected
properly, the LEAD II electrode
configuration will be established.
Page 6 Biopac Student Lab 3.7.5
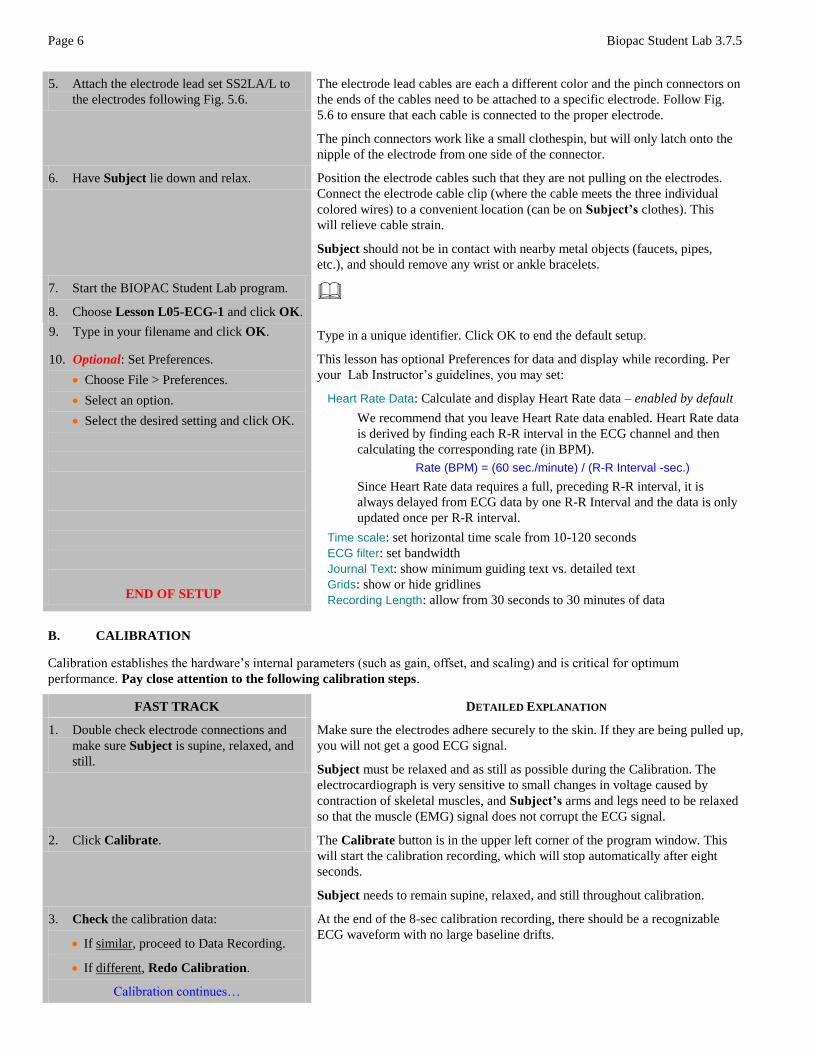
5. Attach the electrode lead set SS2LA/L to
the electrodes following Fig. 5.6.
The electrode lead cables are each a different color and the pinch connectors on
the ends of the cables need to be attached to a specific electrode. Follow Fig.
5.6 to ensure that each cable is connected to the proper electrode.
The pinch connectors work like a small clothespin, but will only latch onto the
nipple of the electrode from one side of the connector.
6. Have Subject lie down and relax. Position the electrode cables such that they are not pulling on the electrodes.
Connect the electrode cable clip (where the cable meets the three individual
colored wires) to a convenient location (can be on Subject’s clothes). This
will relieve cable strain.
Subject should not be in contact with nearby metal objects (faucets, pipes,
etc.), and should remove any wrist or ankle bracelets.
7. Start the BIOPAC Student Lab program.
8. Choose Lesson L05-ECG-1 and click OK.
9. Type in your filename and click OK.
10. Optional: Set Preferences.
Choose File > Preferences.
Select an option.
Select the desired setting and click OK.
END OF SETUP
Type in a unique identifier. Click OK to end the default setup.
This lesson has optional Preferences for data and display while recording. Per
your Lab Instructor’s guidelines, you may set:
Heart Rate Data: Calculate and display Heart Rate data – enabled by default
We recommend that you leave Heart Rate data enabled. Heart Rate data
is derived by finding each R-R interval in the ECG channel and then
calculating the corresponding rate (in BPM).
Rate (BPM) = (60 sec./minute) / (R-R Interval -sec.)
Since Heart Rate data requires a full, preceding R-R interval, it is
always delayed from ECG data by one R-R Interval and the data is only
updated once per R-R interval.
Time scale: set horizontal time scale from 10-120 seconds
ECG filter: set bandwidth
Journal Text: show minimum guiding text vs. detailed text
Grids: show or hide gridlines
Recording Length: allow from 30 seconds to 30 minutes of data
B. CALIBRATION
Calibration establishes the hardware’s internal parameters (such as gain, offset, and scaling) and is critical for optimum
performance. Pay close attention to the following calibration steps.
FAST TRACK DETAILED EXPLANATION
1. Double check electrode connections and
make sure Subject is supine, relaxed, and
still.
Make sure the electrodes adhere securely to the skin. If they are being pulled up,
you will not get a good ECG signal.
Subject must be relaxed and as still as possible during the Calibration. The
electrocardiograph is very sensitive to small changes in voltage caused by
contraction of skeletal muscles, and Subject’s arms and legs need to be relaxed
so that the muscle (EMG) signal does not corrupt the ECG signal.
2. Click Calibrate. The Calibrate button is in the upper left corner of the program window. This
will start the calibration recording, which will stop automatically after eight
seconds.
Subject needs to remain supine, relaxed, and still throughout calibration.
3. Check the calibration data:
If similar, proceed to Data Recording.
If different, Redo Calibration.
Calibration continues…
At the end of the 8-sec calibration recording, there should be a recognizable
ECG waveform with no large baseline drifts.
Lesson 5: ECG I Page 7
END OF CALIBRATION
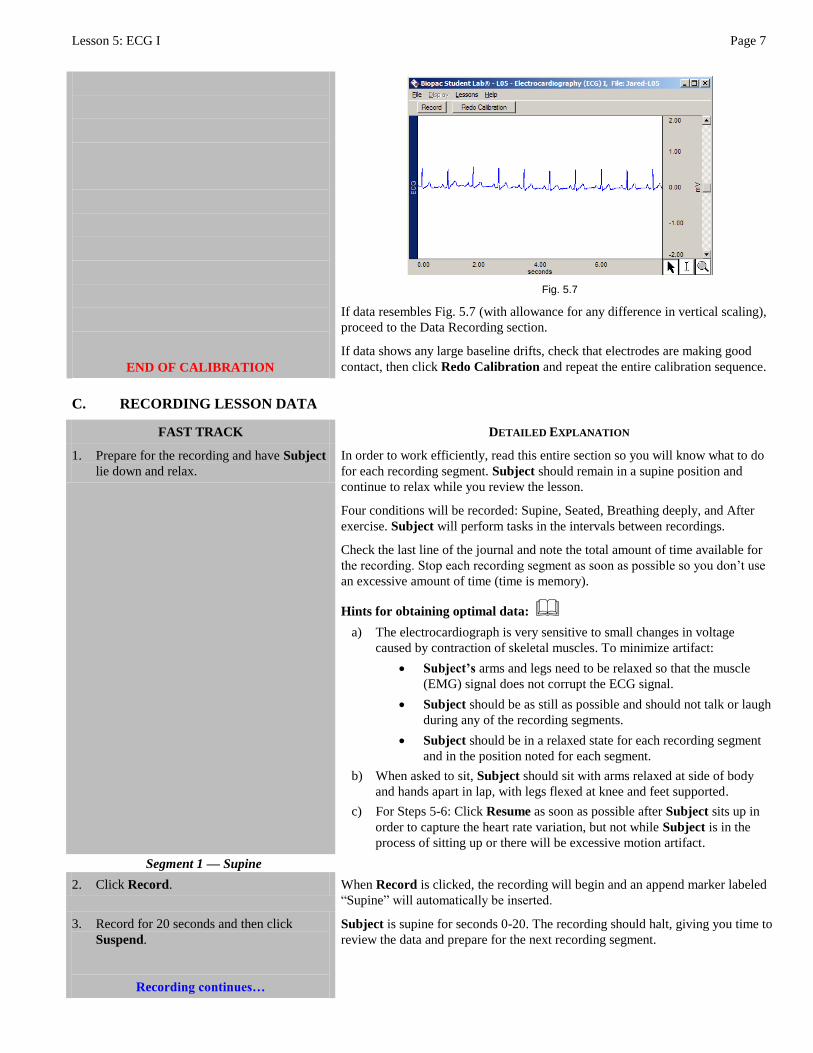
Fig. 5.7
If data resembles Fig. 5.7 (with allowance for any difference in vertical scaling),
proceed to the Data Recording section.
If data shows any large baseline drifts, check that electrodes are making good
contact, then click Redo Calibration and repeat the entire calibration sequence.
C. RECORDING LESSON DATA
FAST TRACK DETAILED EXPLANATION
1. Prepare for the recording and have Subject
lie down and relax.
In order to work efficiently, read this entire section so you will know what to do
for each recording segment. Subject should remain in a supine position and
continue to relax while you review the lesson.
Four conditions will be recorded: Supine, Seated, Breathing deeply, and After
exercise. Subject will perform tasks in the intervals between recordings.
Check the last line of the journal and note the total amount of time available for
the recording. Stop each recording segment as soon as possible so you don’t use
an excessive amount of time (time is memory).
Hints for obtaining optimal data:
a) The electrocardiograph is very sensitive to small changes in voltage
caused by contraction of skeletal muscles. To minimize artifact:
Subject’s arms and legs need to be relaxed so that the muscle
(EMG) signal does not corrupt the ECG signal.
Subject should be as still as possible and should not talk or laugh
during any of the recording segments.
Subject should be in a relaxed state for each recording segment
and in the position noted for each segment.
b) When asked to sit, Subject should sit with arms relaxed at side of body
and hands apart in lap, with legs flexed at knee and feet supported.
c) For Steps 5-6: Click Resume as soon as possible after Subject sits up in
order to capture the heart rate variation, but not while Subject is in the
process of sitting up or there will be excessive motion artifact.
Segment 1 — Supine
2. Click Record. When Record is clicked, the recording will begin and an append marker labeled
―Supine‖ will automatically be inserted.
3. Record for 20 seconds and then click
Suspend.
Recording continues…
Subject is supine for seconds 0-20. The recording should halt, giving you time to
review the data and prepare for the next recording segment.
Page 8 Biopac Student Lab 3.7.5
4. Review the data on the screen.
If correct, go to Step 6.
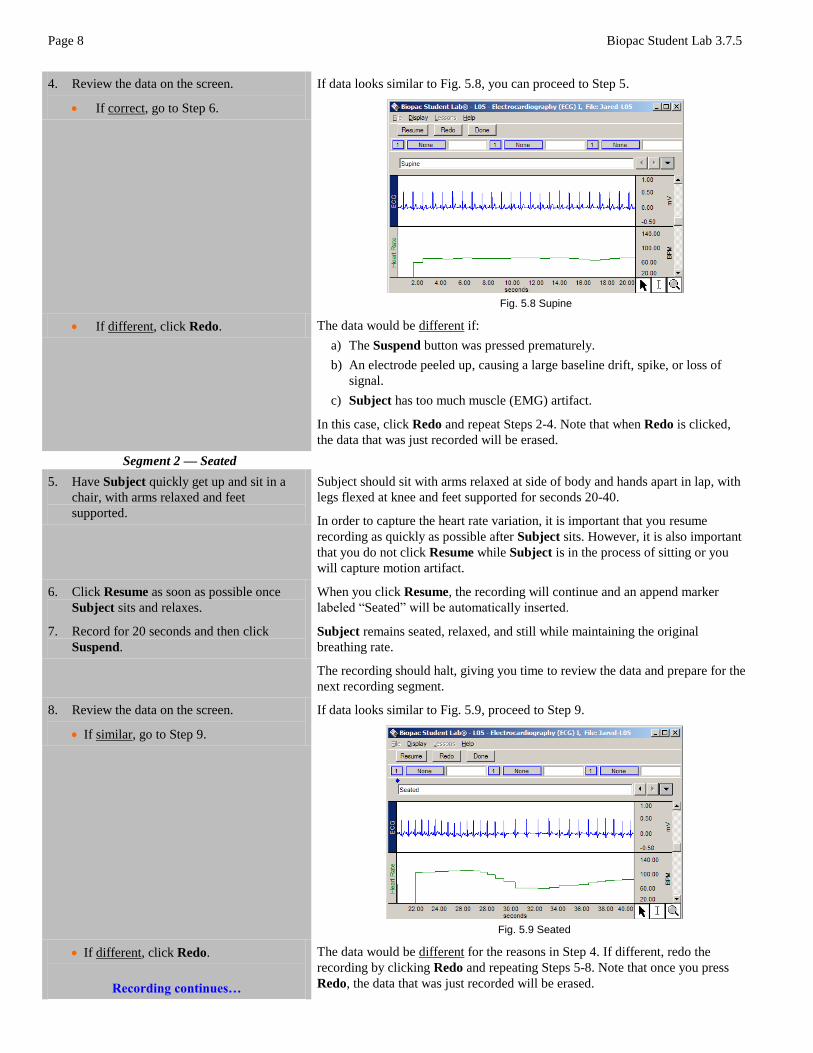
If data looks similar to Fig. 5.8, you can proceed to Step 5.
Fig. 5.8 Supine
If different, click Redo. The data would be different if:
a) The Suspend button was pressed prematurely.
b) An electrode peeled up, causing a large baseline drift, spike, or loss of
signal.
c) Subject has too much muscle (EMG) artifact.
In this case, click Redo and repeat Steps 2-4. Note that when Redo is clicked,
the data that was just recorded will be erased.
Segment 2 — Seated
5. Have Subject quickly get up and sit in a
chair, with arms relaxed and feet
supported.
Subject should sit with arms relaxed at side of body and hands apart in lap, with
legs flexed at knee and feet supported for seconds 20-40.
In order to capture the heart rate variation, it is important that you resume
recording as quickly as possible after Subject sits. However, it is also important
that you do not click Resume while Subject is in the process of sitting or you
will capture motion artifact.
6. Click Resume as soon as possible once
Subject sits and relaxes.
When you click Resume, the recording will continue and an append marker
labeled ―Seated‖ will be automatically inserted.
7. Record for 20 seconds and then click
Suspend.
Subject remains seated, relaxed, and still while maintaining the original
breathing rate.
The recording should halt, giving you time to review the data and prepare for the
next recording segment.
8. Review the data on the screen.
If similar, go to Step 9.
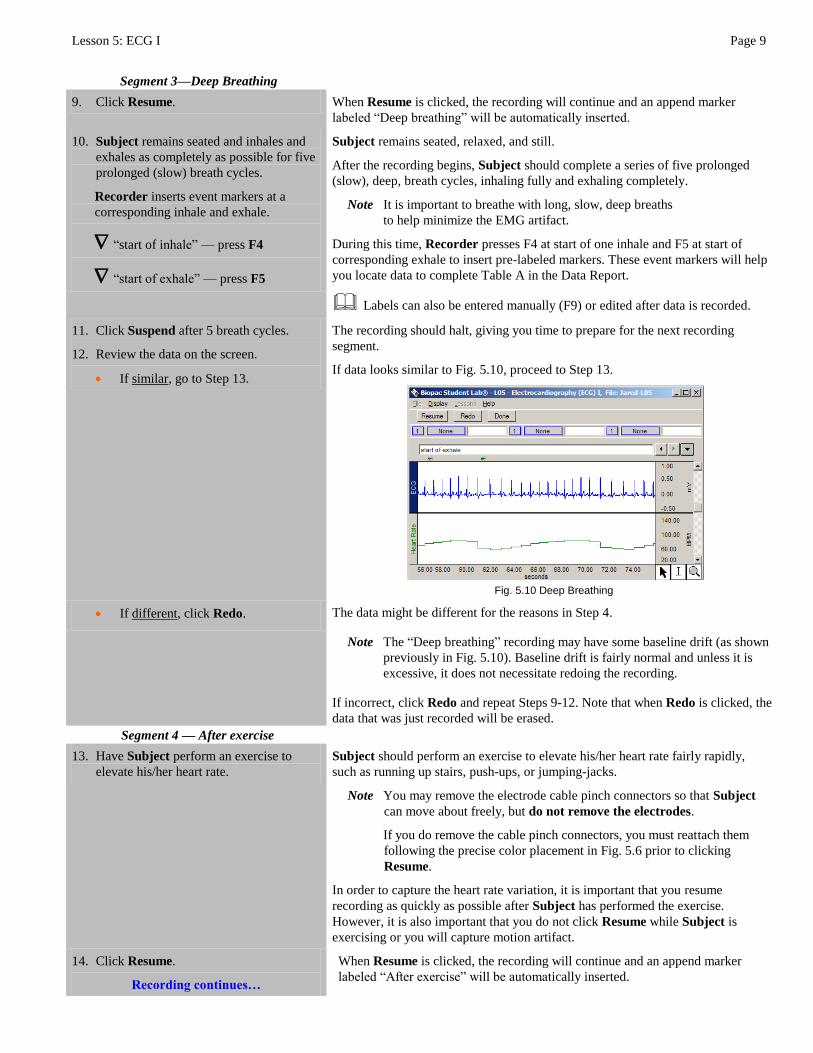
If data looks similar to Fig. 5.9, proceed to Step 9.
Fig. 5.9 Seated
If different, click Redo.
Recording continues…
The data would be different for the reasons in Step 4. If different, redo the
recording by clicking Redo and repeating Steps 5-8. Note that once you press
Redo, the data that was just recorded will be erased.
Lesson 5: ECG I Page 9
Segment 3—Deep Breathing
9. Click Resume. When Resume is clicked, the recording will continue and an append marker
labeled ―Deep breathing‖ will be automatically inserted.
10. Subject remains seated and inhales and
exhales as completely as possible for five
prolonged (slow) breath cycles.
Recorder inserts event markers at a
corresponding inhale and exhale.
―start of inhale‖ — press F4
―start of exhale‖ — press F5
Subject remains seated, relaxed, and still.
After the recording begins, Subject should complete a series of five prolonged
(slow), deep, breath cycles, inhaling fully and exhaling completely.
Note It is important to breathe with long, slow, deep breaths
to help minimize the EMG artifact.
During this time, Recorder presses F4 at start of one inhale and F5 at start of
corresponding exhale to insert pre-labeled markers. These event markers will help
you locate data to complete Table A in the Data Report.
Labels can also be entered manually (F9) or edited after data is recorded.
11. Click Suspend after 5 breath cycles.
12. Review the data on the screen.
If similar, go to Step 13.
The recording should halt, giving you time to prepare for the next recording
segment.
If data looks similar to Fig. 5.10, proceed to Step 13.
Fig. 5.10 Deep Breathing
If different, click Redo. The data might be different for the reasons in Step 4.
Note The ―Deep breathing‖ recording may have some baseline drift (as shown
previously in Fig. 5.10). Baseline drift is fairly normal and unless it is
excessive, it does not necessitate redoing the recording.
If incorrect, click Redo and repeat Steps 9-12. Note that when Redo is clicked, the
data that was just recorded will be erased.
Segment 4 — After exercise
13. Have Subject perform an exercise to
elevate his/her heart rate.
Subject should perform an exercise to elevate his/her heart rate fairly rapidly,
such as running up stairs, push-ups, or jumping-jacks.
Note You may remove the electrode cable pinch connectors so that Subject
can move about freely, but do not remove the electrodes.
If you do remove the cable pinch connectors, you must reattach them
following the precise color placement in Fig. 5.6 prior to clicking
Resume.
In order to capture the heart rate variation, it is important that you resume
recording as quickly as possible after Subject has performed the exercise.
However, it is also important that you do not click Resume while Subject is
exercising or you will capture motion artifact.
14. Click Resume.
Recording continues…
When Resume is clicked, the recording will continue and an append marker
labeled ―After exercise‖ will be automatically inserted.
Page 10 Biopac Student Lab 3.7.5
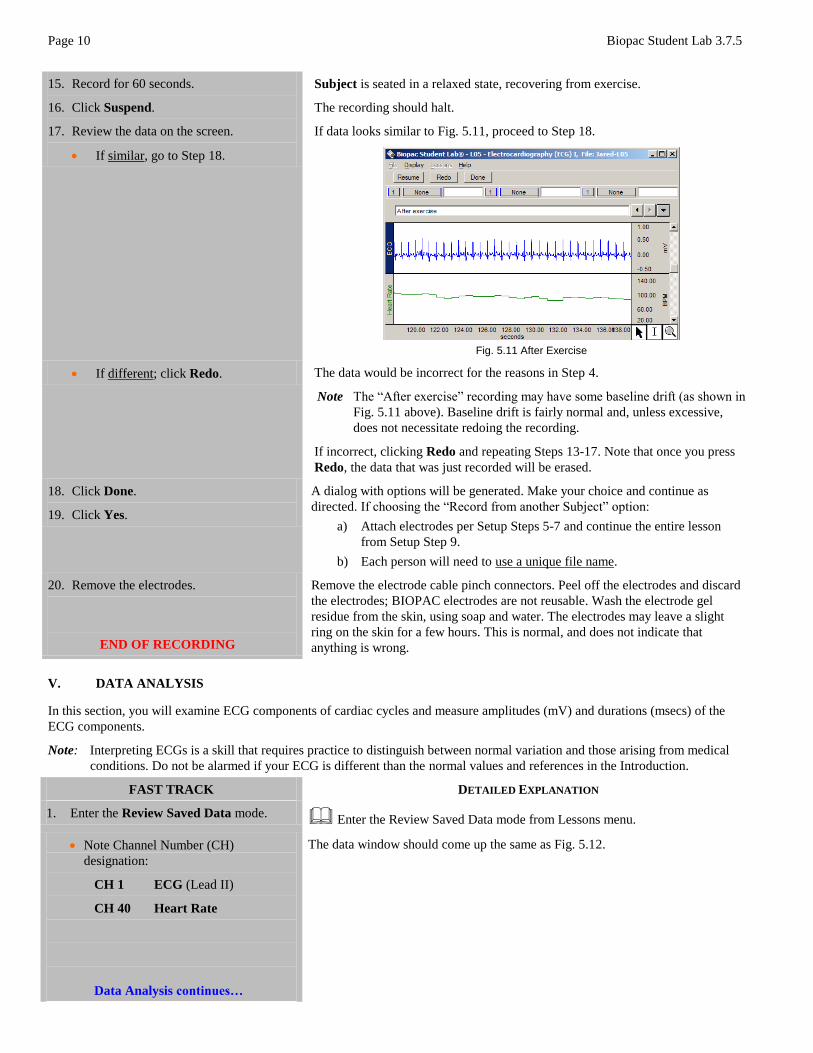
15. Record for 60 seconds.
16. Click Suspend.
17. Review the data on the screen.
If similar, go to Step 18.
Subject is seated in a relaxed state, recovering from exercise.
The recording should halt.
If data looks similar to Fig. 5.11, proceed to Step 18.
Fig. 5.11 After Exercise
If different; click Redo. The data would be incorrect for the reasons in Step 4.
Note The ―After exercise‖ recording may have some baseline drift (as shown in
Fig. 5.11 above). Baseline drift is fairly normal and, unless excessive,
does not necessitate redoing the recording.
If incorrect, clicking Redo and repeating Steps 13-17. Note that once you press
Redo, the data that was just recorded will be erased.
18. Click Done.
19. Click Yes.
A dialog with options will be generated. Make your choice and continue as
directed. If choosing the ―Record from another Subject‖ option:
a) Attach electrodes per Setup Steps 5-7 and continue the entire lesson
from Setup Step 9.
b) Each person will need to use a unique file name.
20. Remove the electrodes.
END OF RECORDING
Remove the electrode cable pinch connectors. Peel off the electrodes and discard
the electrodes; BIOPAC electrodes are not reusable. Wash the electrode gel
residue from the skin, using soap and water. The electrodes may leave a slight
ring on the skin for a few hours. This is normal, and does not indicate that
anything is wrong.
V. DATA ANALYSIS
In this section, you will examine ECG components of cardiac cycles and measure amplitudes (mV) and durations (msecs) of the
ECG components.
Note: Interpreting ECGs is a skill that requires practice to distinguish between normal variation and those arising from medical
conditions. Do not be alarmed if your ECG is different than the normal values and references in the Introduction.
FAST TRACK DETAILED EXPLANATION
1. Enter the Review Saved Data mode. Enter the Review Saved Data mode from Lessons menu.
Note Channel Number (CH)
designation:
CH 1 ECG (Lead II)
CH 40 Heart Rate
Data Analysis continues…
The data window should come up the same as Fig. 5.12.
Lesson 5: ECG I Page 11
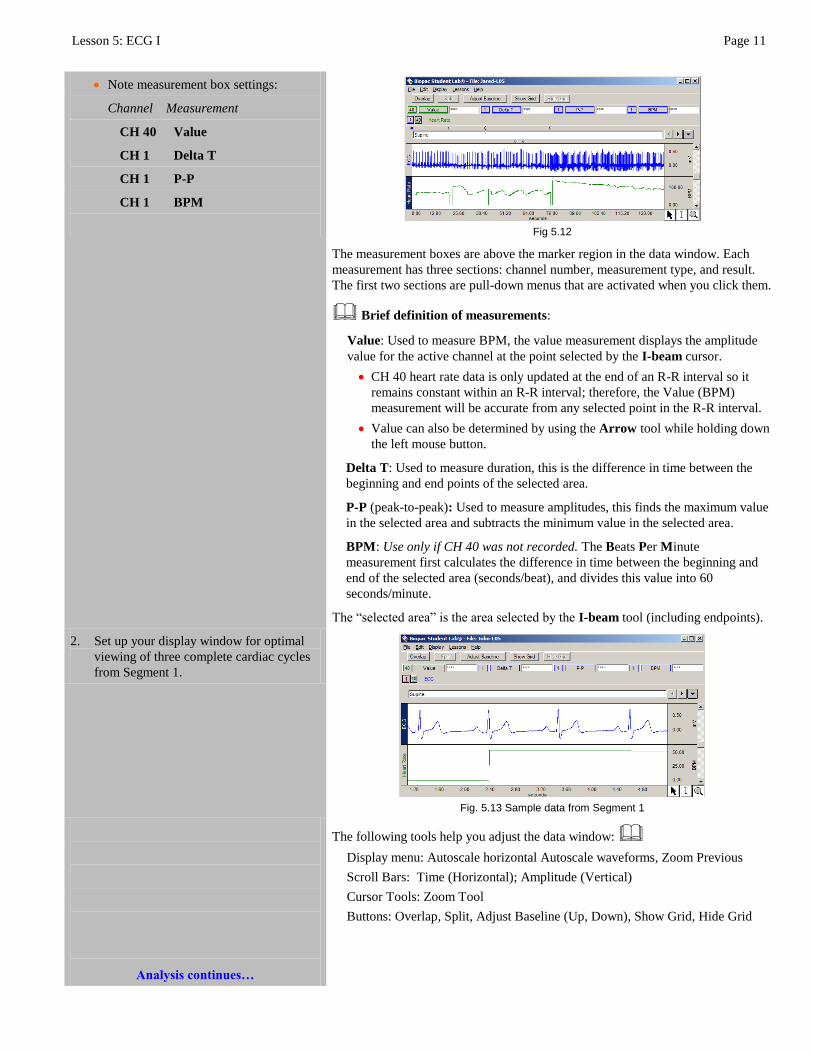
Note measurement box settings:
Channel Measurement
CH 40 Value
CH 1 Delta T
CH 1 P-P
CH 1 BPM
Fig 5.12
The measurement boxes are above the marker region in the data window. Each
measurement has three sections: channel number, measurement type, and result.
The first two sections are pull-down menus that are activated when you click them.
Brief definition of measurements:
Value: Used to measure BPM, the value measurement displays the amplitude
value for the active channel at the point selected by the I-beam cursor.
CH 40 heart rate data is only updated at the end of an R-R interval so it
remains constant within an R-R interval; therefore, the Value (BPM)
measurement will be accurate from any selected point in the R-R interval.
Value can also be determined by using the Arrow tool while holding down
the left mouse button.
Delta T: Used to measure duration, this is the difference in time between the
beginning and end points of the selected area.
P-P (peak-to-peak): Used to measure amplitudes, this finds the maximum value
in the selected area and subtracts the minimum value in the selected area.
BPM: Use only if CH 40 was not recorded. The Beats Per Minute
measurement first calculates the difference in time between the beginning and
end of the selected area (seconds/beat), and divides this value into 60
seconds/minute.
The ―selected area‖ is the area selected by the I-beam tool (including endpoints).
2. Set up your display window for optimal
viewing of three complete cardiac cycles
from Segment 1.
Fig. 5.13 Sample data from Segment 1
Analysis continues…
The following tools help you adjust the data window:
Display menu: Autoscale horizontal Autoscale waveforms, Zoom Previous
Scroll Bars: Time (Horizontal); Amplitude (Vertical)
Cursor Tools: Zoom Tool
Buttons: Overlap, Split, Adjust Baseline (Up, Down), Show Grid, Hide Grid
Page 12 Biopac Student Lab 3.7.5
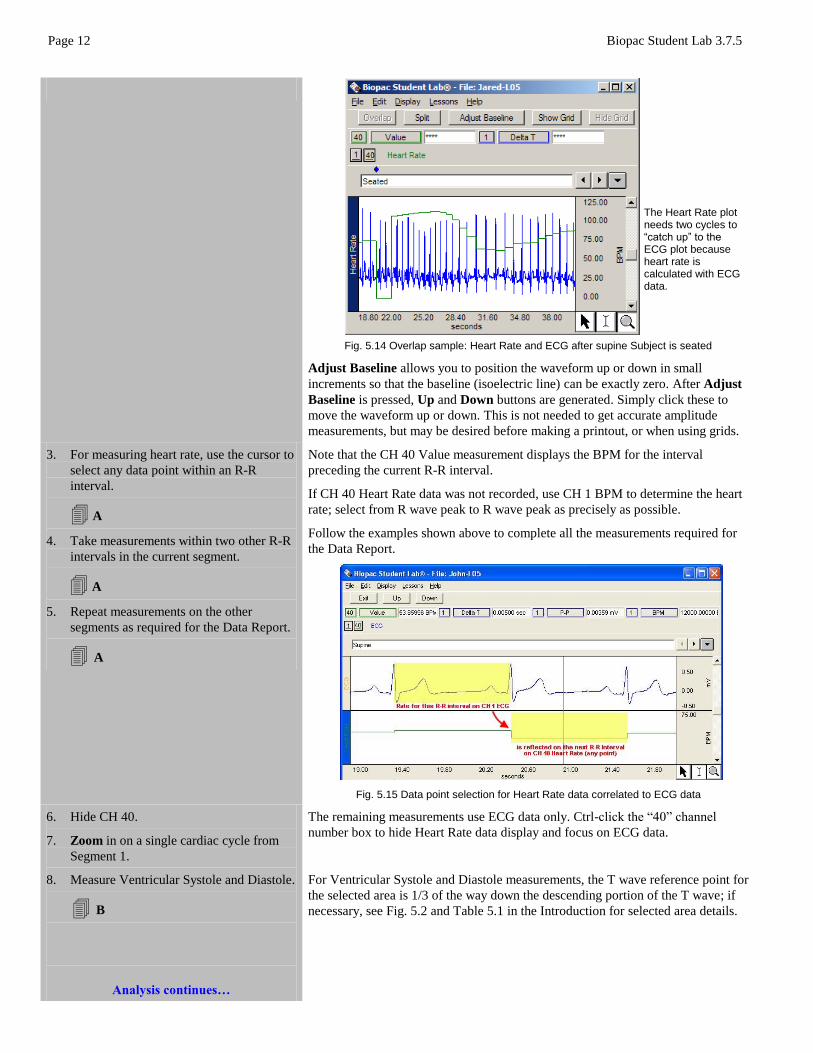
Fig. 5.14 Overlap sample: Heart Rate and ECG after supine Subject is seated
Adjust Baseline allows you to position the waveform up or down in small
increments so that the baseline (isoelectric line) can be exactly zero. After Adjust
Baseline is pressed, Up and Down buttons are generated. Simply click these to
move the waveform up or down. This is not needed to get accurate amplitude
measurements, but may be desired before making a printout, or when using grids.
3. For measuring heart rate, use the cursor to
select any data point within an R-R
interval.
A
4. Take measurements within two other R-R
intervals in the current segment.
A
5. Repeat measurements on the other
segments as required for the Data Report.
A
Note that the CH 40 Value measurement displays the BPM for the interval
preceding the current R-R interval.
If CH 40 Heart Rate data was not recorded, use CH 1 BPM to determine the heart
rate; select from R wave peak to R wave peak as precisely as possible.
Follow the examples shown above to complete all the measurements required for
the Data Report.
Fig. 5.15 Data point selection for Heart Rate data correlated to ECG data
6. Hide CH 40.
7. Zoom in on a single cardiac cycle from
Segment 1.
8. Measure Ventricular Systole and Diastole.
B
Analysis continues…
The remaining measurements use ECG data only. Ctrl-click the ―40‖ channel
number box to hide Heart Rate data display and focus on ECG data.
For Ventricular Systole and Diastole measurements, the T wave reference point for
the selected area is 1/3 of the way down the descending portion of the T wave; if
necessary, see Fig. 5.2 and Table 5.1 in the Introduction for selected area details.
The Heart Rate plot needs two cycles to ―catch up‖ to the ECG plot because heart rate is calculated with ECG data.
Lesson 5: ECG I Page 13
9. Repeat measurements for Segment 4.
B
Segment 4 starts at the marker labeled ―After exercise.‖
10. Zoom in on a single cardiac cycle
from Segment 1.
Be sure to stay in the first recorded segment when you select the cardiac cycle.
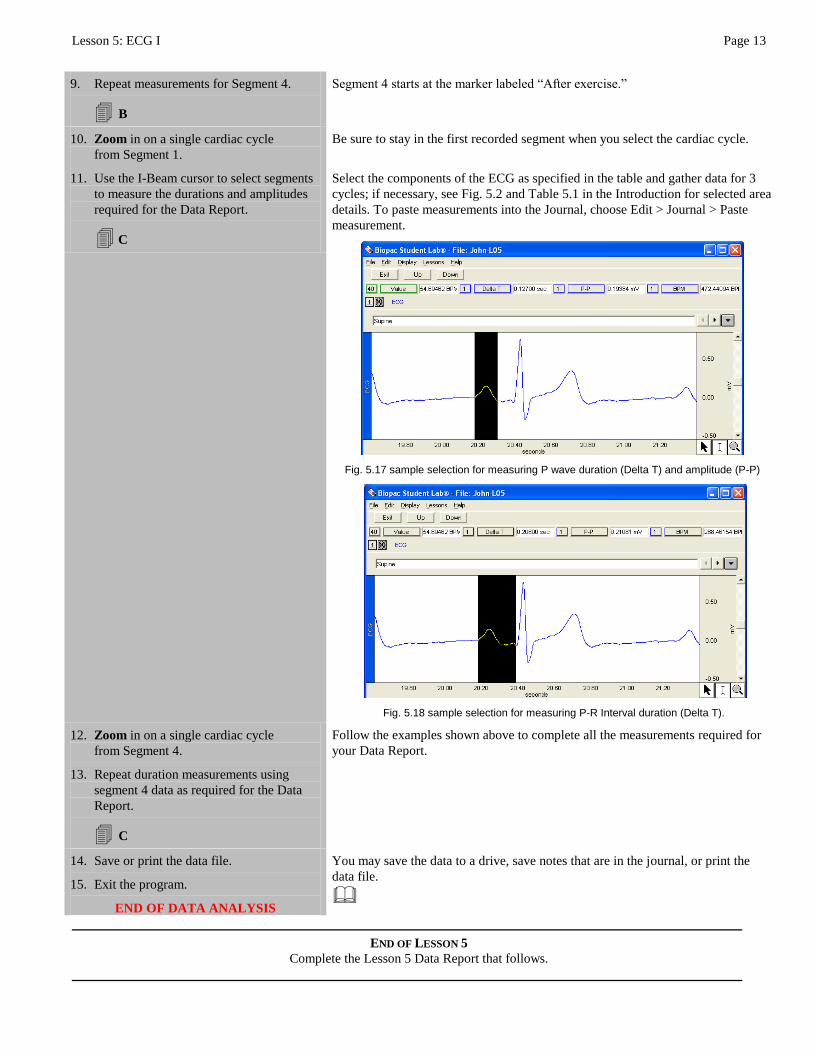
11. Use the I-Beam cursor to select segments
to measure the durations and amplitudes
required for the Data Report.
C
Select the components of the ECG as specified in the table and gather data for 3
cycles; if necessary, see Fig. 5.2 and Table 5.1 in the Introduction for selected area
details. To paste measurements into the Journal, choose Edit > Journal > Paste
measurement.
Fig. 5.17 sample selection for measuring P wave duration (Delta T) and amplitude (P-P)
Fig. 5.18 sample selection for measuring P-R Interval duration (Delta T).
12. Zoom in on a single cardiac cycle
from Segment 4.
13. Repeat duration measurements using
segment 4 data as required for the Data
Report.
C
Follow the examples shown above to complete all the measurements required for
your Data Report.
14. Save or print the data file.
15. Exit the program.
END OF DATA ANALYSIS
You may save the data to a drive, save notes that are in the journal, or print the
data file.
END OF LESSON 5
Complete the Lesson 5 Data Report that follows.

Page 14 Biopac Student Lab 3.7.5
Lesson 5: ECG I Page 15
ELECTROCARDIOGRAPHY I
ECG I
DATA REPORT
Student’s Name:
Lab Section:
Date:
I. Data and Calculations
Subject Profile
Name Height
Age Gender: Male / Female Weight
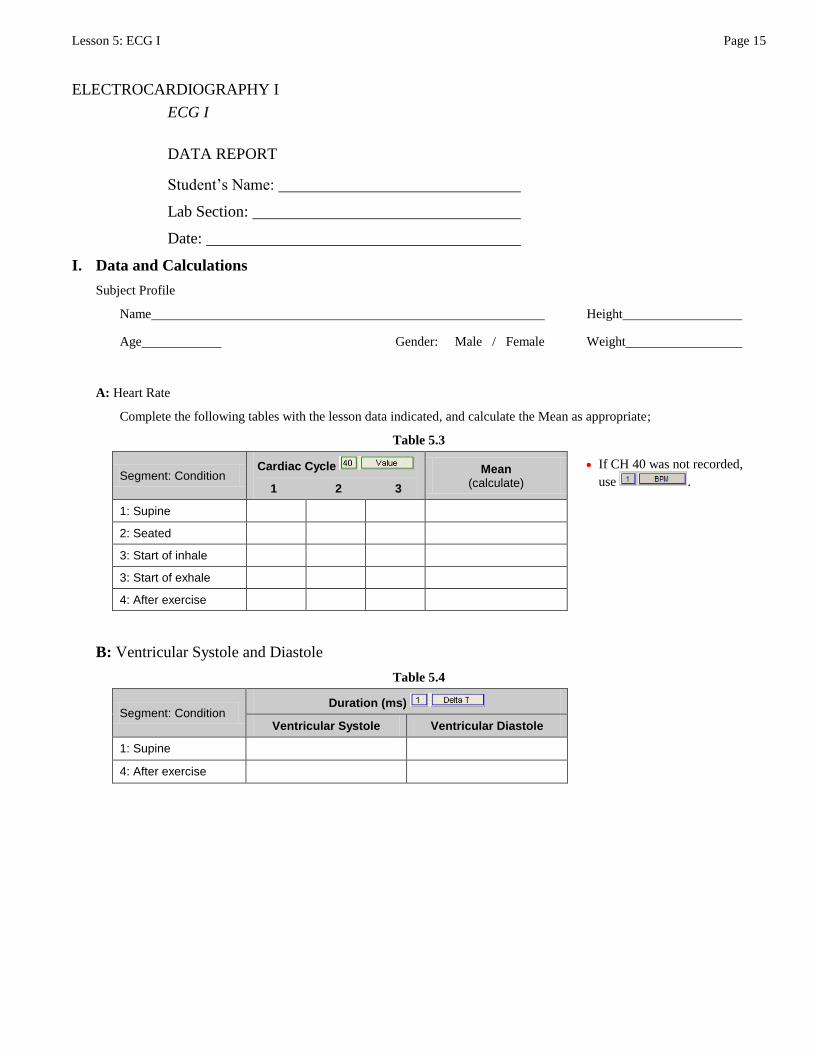
A: Heart Rate
Complete the following tables with the lesson data indicated, and calculate the Mean as appropriate;
Table 5.3
Segment: Condition Cardiac Cycle
1 2 3
Mean (calculate)
If CH 40 was not recorded,
use .
1: Supine
2: Seated
3: Start of inhale
3: Start of exhale
4: After exercise
B: Ventricular Systole and Diastole
Table 5.4
Segment: Condition Duration (ms)
Ventricular Systole Ventricular Diastole
1: Supine
4: After exercise
Page 16 Biopac Student Lab 3.7.5
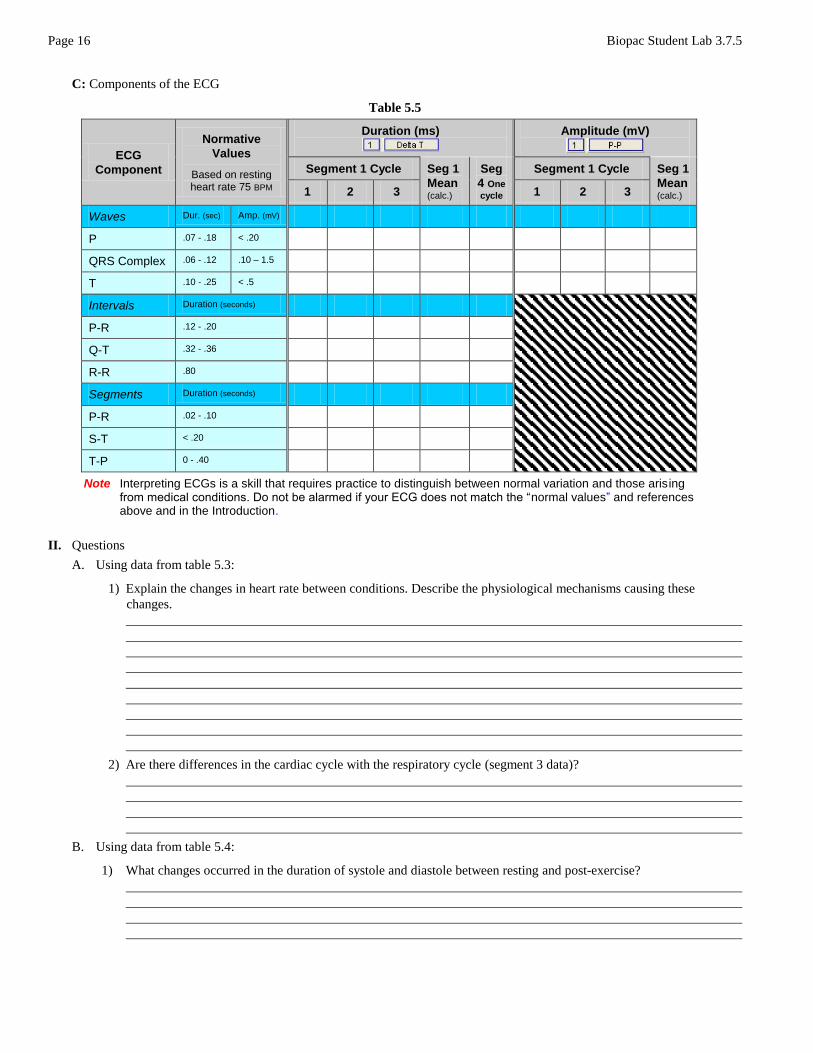
C: Components of the ECG
Table 5.5
ECG
Component
Normative
Values
Based on resting heart rate 75 BPM
Duration (ms)
Amplitude (mV)
Segment 1 Cycle Seg 1
Mean (calc.)
Seg
4 One
cycle
Segment 1 Cycle Seg 1
Mean (calc.) 1 2 3 1 2 3
Waves Dur. (sec) Amp. (mV)
P .07 - .18 < .20
QRS Complex .06 - .12 .10 – 1.5
T .10 - .25 < .5
Intervals Duration (seconds)
P-R .12 - .20
Q-T .32 - .36
R-R .80
Segments Duration (seconds)
P-R .02 - .10
S-T < .20
T-P 0 - .40
Note Interpreting ECGs is a skill that requires practice to distinguish between normal variation and those arising from medical conditions. Do not be alarmed if your ECG does not match the ―normal values‖ and references above and in the Introduction.
II. Questions
A. Using data from table 5.3:
1) Explain the changes in heart rate between conditions. Describe the physiological mechanisms causing these
changes.
2) Are there differences in the cardiac cycle with the respiratory cycle (segment 3 data)?
B. Using data from table 5.4:
1) What changes occurred in the duration of systole and diastole between resting and post-exercise?

Lesson 5: ECG I Page 17
C. Using data from table 5.5:
1) Compared to the resting state, do the durations of the ECG intervals and segments decrease during exercise?
Explain
2) Compare your ECG data to the normative values. Explain any differences.
3) Compare ECG data with other groups in your laboratory. Do their data differ? Explain why this may not be unusual.
D. In order to beat, the heart needs three types of cells. Describe the cells and their function.
1) ____________________________________________________________________
2) ____________________________________________________________________
3) ____________________________________________________________________
E. List in proper sequence, starting with the normal pacemaker, elements of the cardiac pacemaker system.
1) _________________________
2) _________________________
3) _________________________
4) _________________________
5) _________________________
6) _________________________
7) _________________________
8) _________________________
F. Describe three cardiac effects of increased sympathetic activity, and of increased parasympathetic activity.
Sympathetic
Parasympathetic
G. In the normal cardiac cycle, the atria contract before the ventricles. Where is this fact represented in the ECG?
H. What is meant by ―AV delay‖ and what purpose does the delay serve?
I. What is the isoelectric line of the ECG?
J. Which components of the ECG are normally measured along the isoelectric line?
End of Lesson 5 Data Report