Biomedical Physics & Engineering Express, 5(1): 015003 ...
10
http://www.diva-portal.org This is the published version of a paper published in . Citation for the original published paper (version of record): Dunås, T., Wåhlin, A., Zarrinkoob, L., Malm, J., Eklund, A. (2019) 4D flow MRI: automatic assessment of blood flow in cerebral arteries Biomedical Physics & Engineering Express, 5(1): 015003 https://doi.org/10.1088/2057-1976/aae8d1 Access to the published version may require subscription. N.B. When citing this work, cite the original published paper. Permanent link to this version: http://urn.kb.se/resolve?urn=urn:nbn:se:umu:diva-147254
Transcript of Biomedical Physics & Engineering Express, 5(1): 015003 ...

http://www.diva-portal.org
This is the published version of a paper published in .
Citation for the original published paper (version of record):
Dunås, T., Wåhlin, A., Zarrinkoob, L., Malm, J., Eklund, A. (2019)4D flow MRI: automatic assessment of blood flow in cerebral arteriesBiomedical Physics & Engineering Express, 5(1): 015003https://doi.org/10.1088/2057-1976/aae8d1
Access to the published version may require subscription.
N.B. When citing this work, cite the original published paper.
Permanent link to this version:http://urn.kb.se/resolve?urn=urn:nbn:se:umu:diva-147254

Biomedical Physics & EngineeringExpress
PAPER • OPEN ACCESS
4D flow MRI—Automatic assessment of blood flow in cerebral arteriesTo cite this article: Tora Dunås et al 2019 Biomed. Phys. Eng. Express 5 015003
View the article online for updates and enhancements.
This content was downloaded from IP address 130.239.30.35 on 04/03/2019 at 14:54
Biomed. Phys. Eng. Express 5 (2019) 015003 https://doi.org/10.1088/2057-1976/aae8d1
PAPER
4D flowMRI—Automatic assessment of blood flow in cerebralarteries
ToraDunås1 , AndersWåhlin1,2, Laleh Zarrinkoob3, JanMalm3 andAnders Eklund1,2
1 Department of Radiation Sciences, UmeåUniversity, Sweden2 UmeåCenter for Functional Brain Imaging, UmeåUniversity, Sweden3 Department of Pharmacology andClinical Neuroscience, UmeåUniversity, Sweden
E-mail: [email protected]
Keywords: cerebral arteries, hemodynamics, carotid stenosis,magnetic resonance imaging, circle of willis, cerebrovascular circulation
AbstractObjective:With a 10-minute 4DflowMRI scan, the distributionof bloodflow to individual arteriesthroughout the brain can be analyzed. This technique has potential to become a biomarker for treatmentdecisions, and topredict prognosis after stroke. To efficiently analyze andmodel the large dataset inclinical practice, automatization is needed.Wehypothesized that identificationof selected arterialregions using an atlaswith a priori probability informationon their spatial distribution canprovidestandardizedmeasurements of bloodflow in themain cerebral arteries.Approach: A newmethod forautomatic placement ofmeasurement locations in 4DflowMRIwas developed based on an existingatlas-basedmethod for arterial labeling, by defining specific regions of interestwithin the correspondingarterial atlas. The suggestedmethodwas evaluatedon38 subjectswith carotid artery stenosis, bycomparingmeasurements of bloodflowrate at automatically selected locations to referencemeasurements atmanually selected locations.Main results: Automatic and referencemeasurementranged from10 to 580mlmin−1 andwerehighly correlated (r=0.99)with ameanflowdifference of0.61±10.7mlmin−1 (p=0.21). Out of the 559 arterial segments in themanual reference, 489werecorrectly labeled, yielding a sensitivity of 88%, a specificity of 85%, and a labeling accuracy of 87%.Significance: This study confirms that atlas-based labelingof 4DflowMRIdata is suitable for efficientflowquantification in themajor cerebral arteries. The suggestedmethod improves the feasibility ofanalyzing cerebral 4Dflowdata, andfills a gap necessary for implementation in clinical use.
List of abbreviations
ICA Internal carotid artery,
VA Vertebral artery,
BA Basilar artery,
PCA Posterior cerebral artery,
MCA Middle cerebral artery,
ACA Anterior cerebral artery,
PCoA Posterior communicatingartery,
CAS Carotid artery stenosis,
AAIM Automatic atlas-basedartery identificationmethod,
FRQ Flow rate quantificationmethod
Introduction
4D flow MRI with whole brain coverage makes itpossible to assess blood flow in multiple arteriessimultaneously (Meckel et al 2008, Hope et al 2009,Schnell et al 2016). Atherosclerosis with stenosis orocclusion of cerebral arteries can affect cerebral bloodflow and hemodynamics (Shakur et al 2014, Caiet al 2016, Wu et al 2017). An assessed decreased totalblood flow and/or inadequate collateral function ofthe Circle of Willis has a potential to guide treatmentand predict outcome after stroke and risk for recurrentstroke (Henderson et al 2000, Amin-Hanjaniet al 2016).
4D flow MRI is increasingly used for flow assess-ment (Markl et al 2014, Pereira et al 2016, Roldán-Alzate et al 2016). Today, cerebral 4D flowMRI is pro-cessedmanually. This requires a skilled operator and is
OPEN ACCESS
RECEIVED
18 September 2018
REVISED
2October 2018
ACCEPTED FOR PUBLICATION
16October 2018
PUBLISHED
8November 2018
Original content from thisworkmay be used underthe terms of the CreativeCommonsAttribution 3.0licence.
Any further distribution ofthis workmustmaintainattribution to theauthor(s) and the title ofthework, journal citationandDOI.
© 2018 IOPPublishing Ltd
time-consuming if many arteries are to be investi-gated. By automatizing this process, flow values can beobtained in a systematic manner, and the operator isfree to perform other tasks in the meantime, but thistype of automated post-processing tools ismissing.
For amethod to be considered fully automatic, it isnot enough that the delineation of the vessel andseparation of vessel lumen from background is auto-mated (van der Geest et al 1998, Jiang et al 2015), or toautomatically find a measurement plane perpend-icular to the artery, starting from a manually selectedseed point (Wåhlin et al 2013, Schrauben et al 2015). Afully automatic method should also find the correctplacement of the measurements, presenting flowvalues for all arteries of interest. There has been workpresented on fully automatic identification of cerebralarteries (Bogunovic et al 2013, Bilgel et al 2013), butnot aimed specifically on flow quantification, and notadapted for 4D flowMRI.
We have previously developed a cerebral arterialatlas (UBA167), describing the spatial distribution ofthe main cerebral arteries connected to the Circle ofWillis (Dunås et al 2016). The atlas consists of a 3Dprobability maps for each artery, describing the prob-ability that the artery can be found at a particular loca-tion in the brain. We have also constructed an arterialidentification method (AAIM) utilizing the informa-tion from the atlas to enable accurate identification ofthe main cerebral arteries (Dunås et al 2017). Wehypothesized that this framework could be expandedto include standardized and automatic assessment ofblood flow in these arteries. The challenge for theautomatic method is to cope with the inter patientvariability in cerebral arterial anatomy and find amea-surement position in the identified artery that producea flow rate estimate that correspond to the one pro-duced when an investigator manually selects the wellspecified measurement position. Importantly, func-tionality of such an automatic method should also berobust for deviating flow patterns, e.g. compromisedflow caused by a stenosis or occlusion in strokepatients.
Methods
In this study, a new post-processing tool for automaticanalysis of 4D flow MRI is presented. This method isbased on a previously developed method for arteriallabeling where the whole artery is labeled (Dunåset al 2016), which in this study is extended to allow forstandardizedflowmeasurements.
This new post-processing tool was validated onsubjects with carotid artery stenosis (CAS), both interms of labeling accuracy and flow assessment. Forthe vessel segmentation and flow quantification weused a previously developed method (Wåhlin et al2013). Automatic measurements were compared tomeasurements atmanually selected locations.
SubjectsThirty-eight stroke patients with CAS (27 men, 11women, age 72.5±5.7 years), admitted to the tertiarystroke center at Umeå university hospital during2012–2015, were included in this study and investi-gated with magnetic resonance imaging, including 4DflowMRI.
Inclusion criteria were a transient ischemic attackor stroke, with a corresponding CAS�50% on thesymptomatic side, and eligible for carotid endarter-ectomy. Patients with Mini-Mental State Exam <24,modified Rankin scale >2 or ICA occlusion con-tralateral to the symptomatic side were excluded.Ongoing atrial fibrillation, severe aphasia or other pre-vious neurological disease in the central nervous sys-tem were also exclusion criteria. Patients withcontraindication for MRI examination were excludedas well. The CAS grading was performed using com-puted tomography angiography (GE Light Speed VCT64,Waukesha,WI, USA) data in 31 patients (82%) andcarotid artery ultrasound (GE Logiq E9, Linear probe9L, 9900 Innovation Drive, Wauwatosa, WI, USAor Philips iU22, Linear probe L9-3, 22100, BothellEverett Highway, Bothell,WA, USA) in 7 patients. Theregional ethics review board at Umeå Universityapproved the study and all subject gave informedconsent.
MRIA 3 Tesla scanner (Discovery MR 750; GE Healthcare,Milwaukee, WI, USA) with a 32-channel head coilwas used to collect 4D flow MRI (Johnson and Markl2010). Imaging parameters were: velocity encoding,110 cm s−1; TR/TE, 6.5/2.7 ms; flip angle, 8°; band-width, 166.67 kHz; radial projections, 16 000; acquisi-tion resolution, 300×300×300; imaging volume,220×220×220 mm3; reconstruction matrix size,320×320×320 (zero padded interpolation); andvoxel size 0.7×0.7×0.7 mm3. Velocity maps in x-,y- and z-directions, a T1-weigthed magnitude imageand a complex difference angiographic image werereconstructed and used to identify the arteries. Notime-resolved data was used in this study, since wewere only interested in the time averaged bloodflow rate.
Novel approachThe new method is based on a previously developedatlas-based method for artery identification (AAIM).The challenge tackled in this study was to extend thisframework to identify specific arterial regions, and tolocate seed points for flow quantification corresp-onding to these regions. Finding such well-definedregions is crucial to obtain reliable flowmeasurementsat standardized locations.
2
Biomed. Phys. Eng. Express 5 (2019) 015003 TDunås et al

Flow rate quantification algorithmThe flow rate quantification method (FRQ) used inthis study (Wåhlin et al 2013)was based on selection ofa seed point within the vessel. The velocity vector inthe selected seed point was used to determine thedirection of the vessel, and blood flow was calculatedin a volume defined by two cross-sectional planesperpendicular to this vessel direction, three voxelsapart, surrounding the seed point. The equation usedto determine which voxels to include in the selectedvolume is shown in figures 1(b) and (c). The vessellumen was separated from the background by thresh-olding the complex difference angiographic image atten percent of the maximum intensity value. Withinthe selected volume, flow rates (Q) in x-, y- andz-direction were calculated from the correspondingvelocity images, by integrating across the volume anddividing the value by the distance between the twoplanes.
The flow rate through the arterial volume wascalculated as the projection of the total flow on thedirectional vector of the seed voxel, Q =∣ ∣cos Q Q Q ,x
2y
2z
2q + + where θ is the anglebetween the flow direction in the seed voxel and theaverage flow direction within the plane. This approachcompensates for misalignment between the initialapproximation of the vessel direction and an approx-imation based on the average flow direction in thevessel.
Manual referencemeasurementsTwo independent raters viewed axial images of theangiographic volume tomanually place the seed pointsfor the measurements. The FRQ described above wasused to calculate blood flow. In general, the mean flowrate across raters was used as the reference value,although in cases where the difference between the
measurements from the two rates in an artery was over20%, a consensus measurement was made. Becausethe flow rate in the posterior communicating artery(PCoA) can be very low, it was not feasible to apply the20% limit to determine if measurements were correct.Therefore, for PCoA, the mean flow rate across raterswas used for all cases.
AutomaticmeasurementsBasic principleThe underlying principle of the AAIM was to labelvoxels within a vascular skeleton according to atlasprobabilities. The vascular skeleton of a subjectconsisted of centerline branches, connected by junc-tion points, where each branch corresponded to avascular segment and had a unique identificationnumber. To construct this skeleton, the complexdifference angiographic image was thresholded tocreate a binary image, which was then graduallythinned and pruned (Palàgyi and Kuba 1998, ChenandMolloi 2003).
The atlas used for labelingwas theUBA167 (Dunåset al 2017), which consists of probabilitymaps describ-ing the spatial probability of sixteen large cerebralarteries in Montreal Neurological Institute (MNI)space (Evans et al 2012). The labeling took place in thenative space of the subject, therefore, using the sub-jects T1 weighted magnitude image, SPM8’s DARTEL(Ashburner 2007)was used to transform the atlas fromMNI-space into native space (Dunås et al 2016).
Definingmeasurement sitesTo position the seed points in a standardized way, wedefined artery specific measurement sites withcorresponding regions in the UBA167. Thirteen of thesixteen probability maps in the UBA167 (all exceptdistal ACA and distal MCA) were used in this
Figure 1. Illustration of labeling and flow calculations in the basilar artery. (a) Labeling: Vessels in grey, centerline in black, probabilitymap for basilar artery in redwith the defined atlas region in cyan, candidate voxels in yellow, labeled segment in darker yellow andmeasurement plane in blue.(b)Zoom in ofmeasurement area shows cross-section calculations, v0=velocity direction in the seedvoxel, ri=distance from the seed voxel to voxel i, vtot=average direction of flow for all voxels in the plane. (c)Equation describinginclusion criteria for voxel i.
3
Biomed. Phys. Eng. Express 5 (2019) 015003 TDunås et al

implementation, and in ICA and PCA, two regionswere defined in the same probability map. These atlasregions where formed as planes with 9 mm thicknessand an orientation perpendicular to the arterialsegment in question.
The following positions were used for measure-ments:
• Internal carotid artery (ICA): Vertical petroussegment (C2)
• Internal carotid artery (ICA): Vertical cavernoussegment (C4)
• Basilar artery (BA): Middle of artery, between theanterior and superior inferior cerebellar artery
• Vertebral arteries (VA): Vertical intracranial seg-ment (V4)
• Middle cerebral artery (MCA): Proximal mainbranch (M1)
• Anterior cerebral artery (ACA): Before ACoA aper-ture (A1)
• Posterior communicating artery (PCoA): Middle ofartery
• Posterior cerebral artery (PCA): Just before PCoAaperture (P1)
• Posterior cerebral artery (PCA): Just after PCoAaperture (P2)
All arteries except BA aremeasured bilaterally, giv-ing a total of 17 defined atlas regions.
Selection of seed voxelAn illustration of the arterial labeling and selection ofthe seed voxel is presented in figure 1. As for themanual measurements, the FRQ was used for flowcalculations. Branch voxels were first labeled accord-ing to the probabilities in UBA167, assigning eachvoxel to the artery with the highest probability. Thelabeling was then refined by removing voxels that didnot fall within the defined atlas regions. Since thistransform smoothens the edges of the atlas regions,probability values under 0.3% (half of the lowest valuefound in the original atlas) were removed beforelabeling, for both the full UBA167 and for the definedregions. For each region, the longest continuoussegment of labeled voxels was identified. Segmentsshorter than eight voxels (∼5 mm) were consideredunreliable andwere therefore discarded. Themidpointof each identified segment was used as the seed pointfor the FRQ.
EvaluationThe output from the automaticmethod, in addition tothe flow values, was a 3D image of the vascular system
with color-coded regions corresponding to the labeledsegments, an example of this labeling is shown infigure 2. These imageswere visually inspected and eachlabeled segment was classified as correct or incorrect,based on if the labeled segment corresponded to thecorrect arterial branch, and accuracy of the labelingmethod was calculated for each of the nine specifiedpositions. Note that the aim of the labeling process wasnot to find the whole artery, but to identify a specificsegment, selected for accurate flow measurements.Flow values from the automatic method were com-pared to the manual reference measurements in termsofflowdifference.
Statistical analysisAll data processing and analyses were done in Matlab(Mathworks, Natick, MA, USA). Correlation betweenautomatic and reference measurements was calculated,as well as mean and standard deviation of the difference.Differences between flow rates were tested with pairedt-test, significance levelwas set top<0.05.
Agreement between the two raters, and betweenmanual and automatic measurements, was evaluatedusing intraclass correlations (ICC). In both cases, two-way absolute agreement analysis was selected. Since themean value from the two raterswas used as the reference,the multiple measurement option (ICC(2,k)) was usedfor that analysis, while single measurement (ICC(2,1))was used when comparing automatic to referencemeasurements.
Figure 2.Example of an output image for visual inspection.Gray regions show the regions segmentedwith arterial bloodflow and each colored region corresponds to a labeledsegment with black planes indicating the selected seed-points.
4
Biomed. Phys. Eng. Express 5 (2019) 015003 TDunås et al

Results
Manual referencemeasurements were obtained for 559arterial segments, whereof 489 were correctly identifiedby the automatic method. For the 87 arteries were noreference measurements where obtained, 74 werecorrectly identified asnon-existing, yielding a sensitivityof 88%, a specificity of 85%, and an accuracy of 87%when looking at all arterial segments together. Labelingresults for each arterial segment are presented in table 1,where the accuracy of 100% in BA and C4 should bespecifically noted. The average length of the identifiedsegmentswas 16.4±3.6 voxels (11.3mm).
Results from flow quantification are presented intable 2. On average, the flow rate obtained with theautomatic measurement was 0.61 ml min−1 higherthan the manual reference, but this difference was notsignificant (p=0.21). The standard deviation of thedifference compared to the manual reference
measurements, across all arteries, was 10.7 ml min−1.The measurements were highly correlated (r=0.99),agreement between the two methods are presented infigure 3.
Intraclass correlation for the different arterieswere between 0.95 and 0.99 for the two raters, andbetween 0.95 and 1.00 for the automatic versus refer-ence measurements. Calculated on all arteries toge-ther, both tests gave a intraclass correlation of 0.99.For the comparison of the two raters, all arteries had a95% confidence interval lower bound over 0.90, andfor the automatic versus reference measurements, thiswas true for all arteries but PCoA.
Discussion
In this study, we described and evaluated a new post-processing tool for 4D flow MRI, where blood flow
Table 1.Results from labeling specified for each artery.
Artery
Total
number of
arteries
Correctly
identified
existing (TP)
Correctly
identified
non-existing (TN)Mislabeled
non-existing (FP)Mislabeled
existing (FN)Not identi-
fied (FN) Accuracy [%]
ICAC2 73 72 2 1 1 — 97
ICAC4 71 71 5 — — — 100
BA 38 38 — — — — 100
VA 66 55 9 1 7 4 84
MCA 76 67 — — 6 3 88
ACA 69 62 7 — — 7 92
PCAP1 66 40 9 1 5 21 65
PCAP2 75 71 1 — 3 1 95
PCoA 25 13 41 10 2 10 71
Total 559 489 74 13 24 46 87
True positive (TP), false positive (FP), true negative (TN), and false negative (FN) rates and corresponding accuracy.ICA - Internal carotid artery, VA - Vertebral artery, BA - Basilar artery, PCA - Posterior cerebral artery, MCA - Middle cerebral artery, ACA -
Anterior cerebral artery, PCoA - Posterior communicating artery.
Table 2.Average bloodflow in each artery for automatic and referencemeasurements.
Flow rate (standard deviation) [ml min−1]
Artery Reference Automatic Difference Number of arteries
ICAC2 203.9 (95.8) 204.2 (96.4) −0.22 (14.3) 72
ICAC4 211.3 (100.7) 213.9 (107.4) −2.57 (14.7) 71
BA 156.3 (57.9) 157.6 (60.4) −1.32 (8.2) 38
VA 112.6 (73.5) 116.1 (74.8) −3.52 (13.3) 55
MCA 129.9 (35.7) 128.8 (37.4) 1.15 (9.4) 67
ACA 97.0 (63.1) 98.6 (64.8) −1.61 (4.6)* 62
PCAP1 70.1 (28.2) 69.3 (28.6) 0.81 (5.3) 40
PCAP2 58.7 (21.9) 56.7 (22.5) 1.98 (6.6)* 71
PCoA 51.0 (21.5) 51.4 (21.8) −0.40 (6.9) 13
tCBF 551.1 (101.1) 557.0 (111.3) −6.12 (22.9) 38
Values are calculated from the correctly identified arteries, total cerebral blood flow (tCBF) is
calculated from BA and C4, note that arteries with zero flow have not been included in the flow
rate calculations for individual arteries, but are includedwhen calculating tCBF, *p<0.05.ICA - Internal carotid artery, VA -Vertebral artery, BA - Basilar artery, PCA - Posterior cerebral
artery, MCA - Middle cerebral artery, ACA - Anterior cerebral artery, PCoA - Posterior
communicating artery.
5
Biomed. Phys. Eng. Express 5 (2019) 015003 TDunås et al

rates are automatically calculated in 17 specifiedarterial regions. Automatic blood flow measurementshad an excellent agreement with the manual referencemeasurements, confirming that atlas-based labeling issuitable for automatic blood flowquantification.
An advantage of 4D flow MRI compared to pre-vious methods such as ultrasound or 2D PCMRI isthat data for the entire brain is sampled simulta-neously, in a ten-minute MRI sequence. Thus, con-trary to 2D PCMRI investigations, it is not necessaryfor a radiologist to decide in advance which arteriesshould be examined, or to place and angulate themea-surement plane during theMRI acquisition. This workis instead done during the post-processing, and withthe method suggested in this study, the time spent onthismanual processing could be substantially reduced.The 4D flow MRI collection, together with the postprocessing described, are so straight forward that itwould be possible to implement this new method inclinical routine.
The suggested method had an overall accuracy of87%, and this accuracy does not seem to be affected bythe likely more challenging inter-subject variation inflow rate and morphology in patients with CAS. Theautomatic seed point selection is supposed to functionas an initial placement, with the option to make man-ual corrections by re-selecting or moving the seedpoint along the artery if the initial placement wasincorrect or unsatisfying.
If flow values are required for all seventeen regionsincluded in this study, manual editing would be nee-ded for 13% of the arteries, but if only the larger cere-bral arteries are of interest, this number could besubstantially reduced. The newmethod revealed 100%labeling accuracy in the basilar and distal carotid arter-ies, making it possible to calculate total cerebral bloodflow in all evaluated subjects. For the analysis of theblood supply to the cerebral vascular territories fromtheCircle ofWillis (MCA,ACA, PCA), we have an acc-uracy between 88 and 95% (table 1). These values are
slightly lower than what have been observed for fullartery labeling, where these arteries had an accuracy of96% or higher (Dunås et al 2016, Dunås et al 2017).This decrease in accuracy is mainly seen in ACA, dueto the restricted atlas region, and the MCA, due to thenew criteria that only pre-bifurcation segments areconsidered correctly labeled, which is necessary forcorrect flow measurements. Even though these valuesare slightly reduced, they are still considered sufficientfor the purpose of this tool. For ICA, BA, VA andPCoA, results are at the same level as previous studies,while P1 have not been previously evaluated.
For MCA, errors occur when the first bifurcationof theM1 segment arises very close to the origin of theartery, resulting in the labeling of a post-bifurcationbranch. This error would be easily fixed by manualediting. Lower identification accuracy was obtainedfor P1, PCoA and VA. If these arteries are required in aspecific analysis, for example collateral circulation inthe Circle of Willis or cerebellum blood supply, onecan expect the need of slightlymore editing time.
When looking at flow differences for specific arter-ies, a significant difference between automatic andmanual reference measurements were obtained forACA and P2, indicating a systematic difference in theplacement of the reference measurements comparedto the atlas regions. However, the difference was small,and none of the arteries had a systematic difference ofmore than 4%. The largest difference in flow betweenautomatic and reference measurements was found inthe VA. This was likely a manifestation of the highlyvariable anatomy and the branching of arteries likeposterior inferior cerebellar artery, visible in figure 2.Branching arteries that are not included in the atlasdoes increase the risk of mislabeling, and is the mainreason for the low labeling accuracy for VA.
The reported tCBF values are a bit lower than pre-viously reported in healthy elderly (Zarrinkoobet al 2015), this is expected in subjects with CAS (Fanget al 2016), since the ICA flow is restricted. This is
Figure 3. (a)Correlation plot and (b)Bland-Altman plot for the automatic versus referencemeasurements, with lines representingmean difference and 95% limits of agreements.
6
Biomed. Phys. Eng. Express 5 (2019) 015003 TDunås et al
partly, but not completely, compensated by increasedbloodflow in BA.
TheFRQused in this study is robust and simple,flowvalues are calculated in a volume with a length of threevoxels along the artery. By resampling the neighborhoodof the measurement voxel, calculations could be done ina true 2Dplane rather than an angled plane through a 3Dvolume (Schrauben et al 2015), which could result inmore accurate measurements. It should also be investi-gated if using amore advanced segmentation than afixed10% threshold could give more accurate flow assess-ment.However, to develop and evaluate the optimal seg-mentation method, a study designed with anindependently measured reference flow, for examplewithhigh-resolution2DPCMRI is needed.
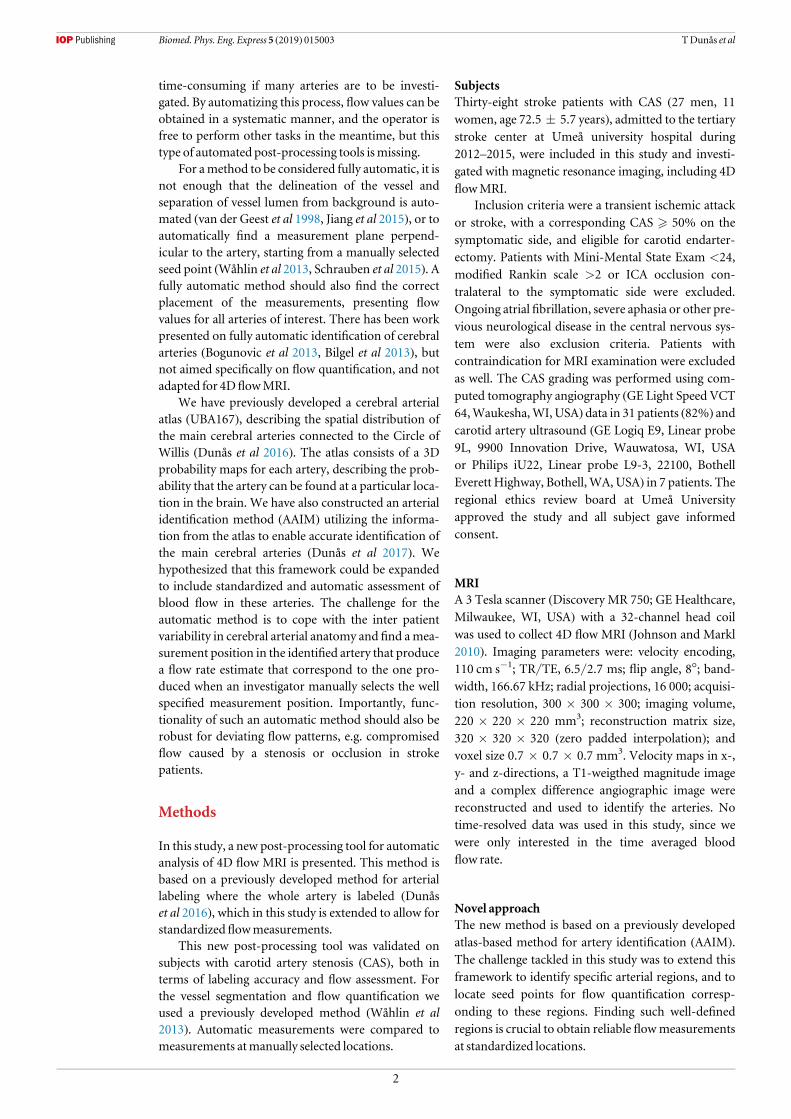
Figure 4 shows a printout report of a 4D flowMRIinvestigation, produced by the automatic methoddescribed in this paper. Blood flow is reported in ml/min for each of the labeled arteries. Although the post-processing of each 4D flow MRI investigation is chal-lenging and consists of a large set of data, calculationsare obtained in less than half an hour with the descri-bed automated method, not including reconstructionof data, which is necessary for manual measurementsas well. Since the process is automated, the only activeprocessing time needed is selecting the cases to ana-lyze, and reviewing the results, the rest of the proces-sing time can be devoted to other tasks.
The post-processing tool described in this paperallows the investigator to quickly get a profile of thedistribution of blood flow to the major arteries of thebrain. This could for instance be used to study effectsof stenosis or carotid artery dissections, or to obtain a
risk profile for how well collateral circulation is able tomaintain blood flow to the brain’s vascular territories(Henderson et al 2000, Amin-Hanjani et al 2005,Amin-Hanjani et al 2016). This may open for a newresearch area, aiming to use the intracranial blood flowprofile for guiding treatment options and to make riskassessments in vascular or neurodegenerative diseases(Rothwell et al 2006, Berman et al 2015). For example,it could be used to predict how an intracranial stentmay change the blood flow profile postoperatively(Alastruey et al 2007), or to make preoperative riskassessments of an asymptomatic carotid stenosis(Sheth and Liebeskind 2014, Pereira et al 2016).
In conclusion, atlas-based labeling was suitable forautomatic quantification of cerebral blood flow in 4Dflow MRI. In total, 87% of all arteries were correctlylabeled, with 100% accuracy for the large supplyingarteries needed to calculate total cerebral blood flow.Agreement between automatic and manual referencemeasurements was excellent, with no systematic differ-ence and a higher stability than repeated manual mea-surements. This study demonstrates the feasibility andutility of the atlas-based approach to assess cerebral arter-ial blood flow. It provides the tool for analyzing cerebral4DflowMRIdata that is needed for efficient in vivo studyof arterial blood flow in the brain and should haveimportant applications in variousneurological diseases.
Acknowledgments
This study was supported by the Swedish ResearchCouncil [grant number 2015-05616] and the Swedish
Figure 4.Example of clinical output image ICA - Internal carotid artery, VA -Vertebral artery, BA - Basilar artery, PCA - Posteriorcerebral artery,MCA -Middle cerebral artery, ACA -Anterior cerebral artery.
7
Biomed. Phys. Eng. Express 5 (2019) 015003 TDunås et al
Heart-Lung Foundation [grant numbers 20110383,20140592].
ORCID iDs
ToraDunås https://orcid.org/0000-0002-5911-9511JanMalm https://orcid.org/0000-0001-6451-1940
References
Alastruey J et al 2007Modelling the circle ofWillis to assess theeffects of anatomical variations and occlusions on cerebralflows J. Biomech. 40 1794–805
Amin-Hanjani S et al 2016 Effect of hemodynamics on stroke risk insymptomatic atherosclerotic vertebrobasilar occlusivedisease JAMANeurology 73 178–85
Amin-Hanjani S et al 2005Use of quantitativemagnetic resonanceangiography to stratify stroke risk in symptomaticvertebrobasilar disease Stroke 36 1140–5
Ashburner J 2007A fast diffeomorphic image registration algorithmNeuroImage 38 95–113
Berman S E et al 2015 Intracranial arterial four-dimensional flow isassociatedwithmetrics of brain health andAlzheimer’sdiseaseAlzheimer’s andDementia: Diagnosis, Assessment andDiseaseMonitoring 1 420–8
BilgelM et al 2013Automated anatomical labeling of the cerebralarteries using belief propagation Proc. of SPIE Int SocOpt Engvol 866918, pp 1– 6
BogunovicH et al 2013Anatomical labeling of the circle of willisusingmaximuma posteriori probability estimation IEEETrans.Med. Imaging 32 1587–99
Cai J et al 2016Comparison of extracranial artery stenosis andcerebral blood flow, assessed by quantitativemagneticresonance, using digital subtraction angiography as thereference standardMedicine 95 e5370
ChenZ andMolloi S 2003Automatic 3D vascular tree constructioninCT angiographyComput.Med. ImagingGraph. 27 469–79
Dunås T et al 2017A stereotactic probabilistic atlas for themajorcerebral arteriesNeuroinformatics 15 101–10
Dunås T et al 2016Automatic labeling of cerebral arteries inmagnetic resonance angiographyMagn. Reson.Mater. Phys.Biol.Med. 29 39–47
Evans AC et al 2012 Brain templates and atlasesNeuroImage 62911–22
FangH et al 2016Compensatory patterns of collateral flow in strokepatients with unilateral and bilateral carotid stenosisBMCNeurology 16 4–9
HendersonRD et al 2000Angiographically defined collateralcirculation and risk of stroke in patients with severe carotidartery stenosis Stroke 31 128–33
HopeMD et al 2009Complete intracranial arterial and venousbloodflow evaluationwith 4DflowMR imagingAmericanJournal of Neuroradiology 30 362–6
Jiang J et al2015Quantifying errors inflowmeasurementusingphasecontrastmagnetic resonance imaging: comparisonof severalboundarydetectionmethodsMagn.Reson. Imaging33185–93
JohnsonKMandMarklM2010 Improved SNR in phase contrastvelocimetrywith five-point balanced flow encodingMagn.Reson.Med. 63 349–55
MarklM, Schnell S and Barker A J 2014 4Dflow imaging: currentstatus to future clinical applicationsCurrent CardiologyReports 16 481
Meckel S et al 2008 In vivo visualization and analysis of 3Dhemodynamics in cerebral aneurysmswith flow-sensitized4DMR imaging at 3TNeuroradiology 50 473–84
Palàgyi K andKubaA 1998 A 3D6-subiteration thinning algorithmfor extractingmedial linesPattern Recognit. Lett. 19 613–27
PereiraVM et al20164DFlowMRI inneuroradiology : techniquesand applicationsTopics inMagneticResonance Imaging2581–7
Roldán-Alzate A et al 2016 Emerging applications of abdominal 4DflowMRIAmerican Journal of Roentgenology 20758–66
Rothwell PM, BuchanA and Johnston SC2006Recent advances inmanagement of transient ischaemic attacks andminorischaemic strokes Lancet Neurology 5 323–31
Schnell S,WuC andAnsari S A 2016 Four-dimensionalMRIflowexaminations in cerebral and extracerebral vessels–ready forclinical routine?Current Opinion inNeurology 29 1–10
Schrauben E et al 2015 Fast 4DflowMRI intracranial segmentationand quantification in tortuous arteries Journal ofMagneticResonance Imaging 42 1458–64
Shakur S F et al 2014Effects of extracranial carotid stenosis onintracranial bloodflow Stroke 45 3427–9
Sheth SA and LiebeskindD S 2014 Imaging evaluation of collateralsin the brain: physiology and clinical translationCurrentRadiology Reports 2 29
van derGeest R J et al 1998Automatedmeasurement of volumeflowin the ascending aorta usingMRvelocitymaps: evaluation ofinter- and intraobserver variability in healthy volunteersJ. Comput. Assist. Tomogr. 22 904–11
WuXC et al 2017 In vivo assessment of the impact of regionalintracranial atherosclerotic lesionsonbrain arterial 3DhemodynamicsAmerican Journal ofNeuroradiology38 515–22
Wåhlin A et al 2013Measuring pulsatileflow in cerebral arteriesusing 4Dphase-contrastMR imagingAmerican Journal ofNeuroradiology 34 1740–5
Zarrinkoob L et al 2015 Bloodflowdistribution in cerebral arteriesJournal of Cerebral Blood Flow&Metabolism 35 648–54
8
Biomed. Phys. Eng. Express 5 (2019) 015003 TDunås et al