Biomass combustion for greenhouse carbon dioxide enrichment
11
Biomass combustion for greenhouse carbon dioxide enrichment Yves Roy a, *, Mark Lefsrud a , Valerie Orsat a , Francis Filion a , Julien Bouchard a , Quoc Nguyen a , Louis-Martin Dion b , Antony Glover a , Edris Madadian a , Camilo Perez Lee a a Department of Bioresource Engineering, McGill University, Macdonald Campus, Macdonald-Stewart Building, 21,111 Lakeshore Road, Ste. Anne de Bellevue, QC H9X 3V9, Canada b Jean Gobeil & Associe ´s Inc., 1109, de Bromont, Longueuil, QC J4M 2P5, Canada article info Article history: Received 4 October 2013 Received in revised form 25 February 2014 Accepted 1 March 2014 Available online xxx Keywords: CO 2 enrichment Biomass Greenhouse Furnace Purification system Catalytic converter abstract Greenhouses in northern climates have a significant heat requirement that is mainly supplied by non-renewable fuels such as heating oil and natural gas. This project’s goal was the development of an improved biomass furnace able to recover the heat and the CO 2 available in the flue gas and use them in the greenhouse. A flue gas purification system was designed, constructed and installed on the chimney of a wood pellet furnace (SBI Caddy Alterna). The purification system consists of a rigid box air filter (MERV rating 14, 0.3 mm pores) followed by two sets of heating elements and a catalytic converter. The air filter removes the particulates present in the flue gas while the heating elements and catalysers transform the noxious gases into less harmful gases. Gas analysis was sampled at different locations in the system using a TESTO 335 flue gas analyzer. The purification system re- duces CO concentrations from 1100 cm 3 m 3 to less than 1 cm 3 m 3 NO x from 70 to 5.5 cm 3 m 3 SO 2 from 19 cm 3 m 3 to less than 1 cm 3 m 3 and trapped particulates down to 0.3 mm with an efficiency greater than 95%. These results are satisfactory since they ensure human and plant safety after dilution into the ambient air of the greenhouse. The recu- peration of the flue gas has several obvious benefits since it increases the heat usability per unit biomass and it greatly improves the CO 2 recovery of biomass heating systems for the benefit of greenhouse grown plants. ª 2014 Elsevier Ltd. All rights reserved. 1. Introduction The benefits of greenhouse crop production is widely docu- mented and recognised as a valuable technique to produce food throughout the year. In addition to the control of the ambient temperature, a greenhouse allows the producer to control a variety of other parameters influencing plant growth. The greenhouse can control humidity, temperature, air circu- lation, water and nutrient cycles, lighting intensity and dura- tion, and the concentration of carbon dioxide in the ambient air [1]. The effects of carbon dioxide concentration inside the greenhouse have been extensively studied in the last two de- cades in order to determine the optimum level for improved growth of different plant species [2]. Table 1 summarizes the benefit of CO 2 enrichment for different species of plant. * Corresponding author. Tel.: þ1 514 441 7494. E-mail address: [email protected] (Y. Roy). Available online at www.sciencedirect.com ScienceDirect http://www.elsevier.com/locate/biombioe biomass and bioenergy xxx (2014) 1 e11 Please cite this article in press as: Roy Y, et al., Biomass combustion for greenhouse carbon dioxide enrichment, Biomass and Bioenergy (2014), http://dx.doi.org/10.1016/j.biombioe.2014.03.001 http://dx.doi.org/10.1016/j.biombioe.2014.03.001 0961-9534/ª 2014 Elsevier Ltd. All rights reserved.
-
Upload
camilo-perez -
Category
Documents
-
view
213 -
download
0
Transcript of Biomass combustion for greenhouse carbon dioxide enrichment

ww.sciencedirect.com
b i om a s s a n d b i o e n e r g y x x x ( 2 0 1 4 ) 1e1 1
Available online at w
ScienceDirect
http: / /www.elsevier .com/locate/biombioe
Biomass combustion for greenhouse carbondioxide enrichment
Yves Roy a,*, Mark Lefsrud a, Valerie Orsat a, Francis Filion a,Julien Bouchard a, Quoc Nguyen a, Louis-Martin Dion b, Antony Glover a,Edris Madadian a, Camilo Perez Lee a
aDepartment of Bioresource Engineering, McGill University, Macdonald Campus, Macdonald-Stewart Building,
21,111 Lakeshore Road, Ste. Anne de Bellevue, QC H9X 3V9, Canadab Jean Gobeil & Associes Inc., 1109, de Bromont, Longueuil, QC J4M 2P5, Canada
a r t i c l e i n f o
Article history:
Received 4 October 2013
Received in revised form
25 February 2014
Accepted 1 March 2014
Available online xxx
Keywords:
CO2 enrichment
Biomass
Greenhouse
Furnace
Purification system
Catalytic converter
* Corresponding author. Tel.: þ1 514 441 749E-mail address: [email protected]
Please cite this article in press as: Roy Y,Bioenergy (2014), http://dx.doi.org/10.101
http://dx.doi.org/10.1016/j.biombioe.2014.03.0961-9534/ª 2014 Elsevier Ltd. All rights rese
a b s t r a c t
Greenhouses in northern climates have a significant heat requirement that is mainly
supplied by non-renewable fuels such as heating oil and natural gas. This project’s goal
was the development of an improved biomass furnace able to recover the heat and the CO2
available in the flue gas and use them in the greenhouse. A flue gas purification systemwas
designed, constructed and installed on the chimney of a wood pellet furnace (SBI Caddy
Alterna). The purification system consists of a rigid box air filter (MERV rating 14, 0.3 mm
pores) followed by two sets of heating elements and a catalytic converter. The air filter
removes the particulates present in the flue gas while the heating elements and catalysers
transform the noxious gases into less harmful gases. Gas analysis was sampled at different
locations in the system using a TESTO 335 flue gas analyzer. The purification system re-
duces CO concentrations from 1100 cm3 m�3 to less than 1 cm3 m�3 NOx from 70 to
5.5 cm3 m�3 SO2 from 19 cm3 m�3 to less than 1 cm3 m�3 and trapped particulates down to
0.3 mm with an efficiency greater than 95%. These results are satisfactory since they ensure
human and plant safety after dilution into the ambient air of the greenhouse. The recu-
peration of the flue gas has several obvious benefits since it increases the heat usability per
unit biomass and it greatly improves the CO2 recovery of biomass heating systems for the
benefit of greenhouse grown plants.
ª 2014 Elsevier Ltd. All rights reserved.
1. Introduction
The benefits of greenhouse crop production is widely docu-
mented and recognised as a valuable technique to produce
food throughout the year. In addition to the control of the
ambient temperature, a greenhouse allows the producer to
control a variety of other parameters influencing plant growth.
4.(Y. Roy).
et al., Biomass combust6/j.biombioe.2014.03.001
001rved.
The greenhouse can control humidity, temperature, air circu-
lation, water and nutrient cycles, lighting intensity and dura-
tion, and the concentration of carbon dioxide in the ambient
air [1]. The effects of carbon dioxide concentration inside the
greenhouse have been extensively studied in the last two de-
cades in order to determine the optimum level for improved
growth of different plant species [2]. Table 1 summarizes the
benefit of CO2 enrichment for different species of plant.
ion for greenhouse carbon dioxide enrichment, Biomass and

Table 1 e Review of the effect of CO2 enrichment on thegrowth enhancement of different plant species [2].
Observations Growth enhancement
All herbaceous plants þ45%
Woody plants þ48%
Herbaceous populations þ29%
Woody populations þ35%
Dry Matter productions þ20%
Grassland biomass þ12%
Forest Growth þ23%
b i om a s s a n d b i o e n e r g y x x x ( 2 0 1 4 ) 1e1 12
In general, greenhouse enrichment to CO2 concentrations
between 700 and 900 cm3 m�3 is valuable regardless of the
plant species [3]. Some species experience growth reduction
and leaf injuries for concentration higher than 1000 cm3 m�3
[3]. Humans have higher tolerance to carbon dioxide where no
adverse effects are observed for concentrations lower than
7000 cm3 m�3 [4]. As a safety precaution, the Canadian Min-
istry of Health recommends that individuals should not be
exposed to a concentration greater than 3500 cm3 m�3 [4].
The current popularity of biomass furnaces for greenhouse
heating allows for a new source of CO2 for greenhouse pro-
ducers [5]. The utilisation of the CO2 produced during com-
bustion of biomass for greenhouse enrichment has great
advantages for producers since it reduces producers’ environ-
mental footprint and their dependencyon fossil fuelswhichare
typicallyused for enrichment [5].However, theutilizationof the
CO2 from the flue gas of a wood pellet furnace presents
considerable challenges due to the presence of different
noxious gases (CO, NOx, SOx, C2H4, etc) and particulates. Thus,
the aim of this research project was to improve a biomass
furnace in order to recover the heat and theCO2 that is typically
vented with the flue gas and release them into the greenhouse.
2. Flue gas composition
Flue gas composition varies greatly in function of the type of
biomass, thedimensionsof thepellet, puckorbriquette,andthe
typeof stove/furnaceused for thecombustion [6]. Theoxygen to
fuel ratio determines the emission composition during com-
bustion. The expected emissions of different types of stoves/
furnacesaresummarized inTable2 [6]. Ingeneral, pellets stoves
produce less noxious emissions than other stove types because
the shape of the biomass allows a good distribution of oxygen
which produces a uniform and complete combustion. Conse-
quently, pellets stoves flue gas is easier to purify and therefore
more suitable for greenhouseCO2 enrichment. The combustion
Table 2 e Arithmetic average emission levels in mg mL3 at 13%
Appliances Load [kW] Excess airratio
CO [mg/m3]a
[m
Wood-Stoves 9.33 2.43 4986
Fireplace inserts 14.07 2.87 3326
Heat-storing stoves 13.31 2.53 2756
Pellet stove 8.97 3.00 313
a The term m�3 designates a volume at standard reference condition; pr
Please cite this article in press as: Roy Y, et al., Biomass combustBioenergy (2014), http://dx.doi.org/10.1016/j.biombioe.2014.03.001
of all types of biomass results in the production of air-borne
pollutants. The most important noxious gases found in the
flue gas are CO, NOx, particulates, SOx, and VOCs [5]. It is also
common to find trace amounts of nitrous oxides (N2O),
hydrogen chloride (HCl), heavy metals (Cu, Pb, Cd, Hg), poly-
cyclic aromatic hydrocarbons (PAH), polychlorinated dioxins
and furans (PCDD/F), ammonia (NH3) and ozone (O3) [6].
2.1. Carbon monoxide (CO)
Carbon monoxide (CO) is the product of incomplete combus-
tion of carbonaceous fuel into CO2. Thus, CO concentration in
the exhaust gases is a good indicator of the quality of the
combustion [6]. Control of the CO formation can be achieved
mainly through the adjustment of the air to fuel ratio at a
stoichiometric level in the combustion chamber. In fuel lean
conditions, more CO will be formed due to improper mixing
conditions and lack of oxygen to oxidize CO into CO2. In fuel
rich conditions,more COwill be formed in consequence of the
reduction of temperature in the combustion chamber caused
by the excess oxidizer reactant [7]. Increasing the residence
time will also contribute to reduce the concentration of CO in
the emission [8].
It has been reported that a CO concentration of
30e50 cm3 m�3 can be detrimental to plants and cause leaf
chlorosis and abscission as well as flower drop [3]. Also, CO
can negatively affect human health at concentrations lower
than those previously mentioned. Indeed, inhaled CO mole-
cules diminish blood ability to carry oxygen to cell and tissues
[5]. Thus, an exposure of no more than 10 cm3 m�3 of CO
during 24 h is recommended [4].
2.2. Nitrogen oxides (NOx)
Nitrogen oxides are produced by three main gas phase reac-
tion mechanisms during the combustion process. First of all,
there is the fuel NOx mechanism. The nitrogen present in the
wood is volatilized during the combustion process to create
NH3 and HCN molecules [9]. Depending on the fuel type, the
oxygen level, the temperature in the combustion chamber and
the residence time, different NH3 to HCN ratio will be pro-
duced. These molecules are subsequently converted into NO
and NO2 according to a series of elementary reactions [9].
Nitrogen oxides are produced by the thermal NOxmechanism.
At temperatures higher than 1300 �C, nitrogen in the air reacts
with oxygen molecules creating NO [6]. An increase in NO
concentration in the flue gas is generally the result of an
augmentation of temperature, oxygen concentration and
residence time in the combustion chamber. Lastly, NOx are
O2 from small-scale biomass combustion applications [6].
CxHy
g/m3]aParticles[mg/m3]a
NOx
[mg/m3]aTemp [�C] Efficiency [%]
581 130 118 307 70
373 50 118 283 74
264 54 147 224 78
8 32 104 132 83
essure 101.3 kPa and temperature 273 K.
ion for greenhouse carbon dioxide enrichment, Biomass and

b i om a s s a n d b i o e n e r g y x x x ( 2 0 1 4 ) 1e1 1 3
also formed by the prompt NOx mechanism. In fuel-rich
conditions, the nitrogen present in the air can react with CH
radicals produced during the combustion and produce mainly
HCH. These molecules follow the same path as the fuel NOx
mechanism and are converted into NO and N2O [6].
According to these three NOx formation mechanisms, the
reduction of NOx emission can be achieved through a tight
control of the temperature, residence time and oxygen level.
Indeed, keeping the temperature in the combusting chamber
below 1300 �C prevents the formation of thermal NOx. Since
fuel NOx formation is maximized at a temperature of 800 �C, itis beneficial to avoid as much as possible to create a region in
the combustion chamber with such a temperature [9]. Mini-
mizing the residence time in the critical temperature region is
also an important method to control NOx formation. The
stoichiometric ratio has a significant impact on the fuel NOx
reaction. Indeed, at fuel-lean and stoichiometric ratio, NH3
and HCH produce essentially NOwhile in fuel-rich conditions,
the same molecules are converted into N2 molecules [6].
NOx effect on plants varies greatly in function of species.
Mortensen [3] looked at the effect of NOx on 14 species and
discovered that some species are affected by a NOx concen-
tration as low as 0.8e1 cm3 m�3 while other species are not
affected at all. Species that were affected showed leaf chlo-
rosis and necrosis or simply growth-reduction [3]. Moreover,
nitrogen dioxide (NO2) can cause lung damage and negatively
affect the respiratory system of humans at concentration
greater than 0.05 cm3 m�3 (100 mg m�3) [4]. Since nitric oxide
(NO) is usually not found in significant amounts in residential
environment; Canada and the United States have not pub-
lished a maximum limit of exposure for this pollutant. How-
ever, for industrial environments, the US Department of Labor
has determined that the NO concentration in the air should
not exceed 25 cm3 m�3 while exposed during 8 h [10]. It has
been reported that a concentration of 3 cm3 m�3 of nitrogen
oxide has similar effect on the respiratory system than
10e15 cm3 m�3 of CO [5]. Assuming that the NOx concentra-
tion in a greenhouse is composed with 75% NO as estimated
by Mortensen [3], NOx concentration in a greenhouse should
not exceed 4 cm3 m�3 to ensure human safety.
2.3. Sulfur oxides (SOx)
Sulfur oxides are formed during the combustion process by
the complete oxidation of the sulfur contained in the fuel. It
has been reported that 57%e65% of the sulfur present in the
fuel is released into the flue gas while the rest is bound with
the ash [6]. SOx is composed mainly of sulfur dioxide (SO2) at
more than 95%, sulfur trioxide (SO3) at less than 5% and trace
amount is emitted as H2S and K2SO4 [6]. Biomass fuel may
contain as low as 0.01% of sulfur for wood pellets and up to 2%
for other organic feedstocks [5]. Since the amount of SOx
emission is directly correlated to the amount of sulfur in the
fuel, the reduction of fuel sulfur concentration is the primary
method allowing the reduction of SOx emission. Furthermore,
limestone blending with the feedstocks has proved efficient to
reduce SOx flue gas emission by increasing the proportion of
fuel sulfur in the ash [11].
Plants’ SO2 exposure can cause leaf necrosis at a con-
centration greater than 0.5 cm3 m�3 during 4 h [5]. Due to
Please cite this article in press as: Roy Y, et al., Biomass combustBioenergy (2014), http://dx.doi.org/10.1016/j.biombioe.2014.03.001
the considerable solubility of SO2 in water, it can easily
react with the water present in a human’s respiratory track
and irritate during breathing [12]. Thus, an exposure of no
more than 0.019 cm3 m�3 of SO2 during 8 h is recommended
[4,12].
2.4. Particulates
The particulates carried by the flue gas come from different
sources. They can originate from fly-ash, soot, char or
condensed hydrocarbons (tar) [6]. Fly-ash consists primarily of
small ash aggregation carried into the flue gas because of their
low specific density. Fly-ash is also composed of coarse fly-ash
(ash particles with a diameter larger than 1 mm) and aerosol
created during the combustion process by the reaction of K,
Na, Cl or S present in the burning fuel to form salts such as
KCl, NaCl, K2SO4 [6]. Coarse fly-ash traction in the exhaust
gases can be reduced using primary particle emission reduc-
tion measures by optimizing the combustion chamber design
to avoid high turbulence air flow. Aerosol concentration in the
flue gas varies greatly in function of the composition of the
burning fuel. Primary emission reduction measures are not
very effective because of the high volatility of aerosol. Thus
secondary emission reduction measures are more suitable
when aerosol emission is a problem [6].
Particle emissions resulting from incomplete combustion
are composed of soot, char, and tar. Soot particulates
contain mostly carbon and up to 10% hydrogen. Condensed
heavy hydrocarbons (tar) are produced by a local insuffi-
ciency in oxygen in the combustion chamber [13]. Char is
naturally formed in a combustion process during pyrolysis
of the burning fuel. Char’s low specific density makes it
prone to be carried in the flue gas especially at high flue gas
flow rates [6]. Incomplete combustion particles can be
reduced using primary emission reduction measures that
promote complete combustion such as higher combustion
temperature, longer residence time and higher air to fuel
ratio. Additionally, the mixing of steam and carbon dioxide
into the combustion gas can enhance soot oxidation and
therefore reduce soot particle emission [13]. However, sec-
ondary emission reduction devices such as baghouse filters,
cyclone, electrostatic precipitators (ESPs), wet scrubber and
polyethylene membrane separation can be used to reduce
particulate emissions [5,6].
No study on the adverse effect of plant exposure to par-
ticulates has been found in the literature. However, the effect
of particulates on human health has been studied for many
years. Regulatory agencies regulate particulates in function of
their diameter and their concentration in the air. Particulates
that have a diameter larger than 10 mm are typically filtered in
the upper respiratory track [14]. Particulates that have a
diameter between 2.5 and 10 mm can cause nose and throat
irritation, lung damage and bronchitis [12]. It is recommended
to limit the exposure to particle smaller than 10 mm (PM10) at
no more than 150 mg m�3 (24 h) [12]. Particulates that have a
diameter smaller than 2.5 mm (PM2.5) can enter deeply into the
lung. They are strongly associated with cardiovascular and
respiratory mortality and morbidity endpoints [4]. Therefore,
exposure concentration should not exceed 40 mg m�3 (8 h) in
order to ensure human safety [4].
ion for greenhouse carbon dioxide enrichment, Biomass and

Table 3 e Air quality guidelines for a greenhouse environment.
Standards or guideline Humans Plants Humans andplants
Canadian(Health Canada)a
United State(NAAQS/EPA)b
World HealthOrganisation
(WHO)c
Plants maximumexposured
Greenhouseenvironment
Carbon dioxide (CO2) 3500 cm3 m�3 (8 h) e e 1000 cm3 m�3 1000 cm3 m�3
Carbon monoxide (CO) 10 cm3 m�3
(8 h) 25 cm3 m�3 (1 h)
9 cm3 m�3 (8 h)e
35 cm3 m�3 (1 h)e6 cm3 m�3 (24 h)
9 cm3 m�3 (8 h)
31 cm3 m�3 (1 h)
87 cm3 m�3 (15 min)
30 to 50 cm3 m�3 depending
on species
10 cm3 m�3 (8 h)
25 cm3 m�3 (1 h)
NOx Nitrogen oxide (NO) e 3 cm3 m�3 (8 h)f e 0.8e1 cm3 m�3 for some
specific species
0.8 cm3 m�3g
Nitrogen dioxide (NO2) 0.05 cm3 m�3 (8 h)
0.25 cm3 m�3 (1 h)
0.05 cm3 m�3 (1yr) 0.02 cm3 m�3 (1yr)
0.11 cm3 m�3 (1 h)
0.05 cm3 m�3 (8 h)
0.25 cm3 m�3 (1 h)
Sulfur dioxide (SO2) 0.019 cm3 m�3 (8 h)
0.08 cm3 m�3 (5 min)
0.03 cm3 m�3 (1yr)
0.14 cm3 m�3 (24 h)
0.008 cm3 m�3 (24 h)
0.19 cm3 m�3 (10 min)
0.5 cm3 m�3 (4 h) 0.019 cm3 m�3 (8 h)
0.08 cm3 m�3 (5 min)
Particulates (PM2.5) MMADh 40 mg m�3 (8 h)i
100 mg m�3 (1 h)i15 mg m�3 (1yr)
35 mg m�3 (24 h)
10 mg m�3(1yr)
25 mg m�3 (24 h)
e 40 mg m�3 (8 h)
100 mg m�3 (1 h)
Particulates (PM10) MMADh e 150 mg m�3 (24 h) 20 mg m�3 (1yr)
50 mg m�3 (24 h)
e 150 mg m�3 (24 h)
C2H4 e e e 10 mm3 m�3 10 mm3 m�3
a Based on Canadian Residential Indoor Air Quality Guideline [4].b Based on ASHRAE Standard: Ventilation for Acceptable Indoor Air Quality [12].c Based on World Health Organisation [15,17].d Based on two review paper on plant responses to noxious gases [3,5].e Not to be exceeded more than once per year.f This value is not included in the ASHRAE standard. However, under the section covering NOx, it is explained that 3 cm3 m�3 of Nitrogen Oxide has similar effects on the respiratory system than
10e15 cm3 m�3 of CO [16].g This value is obtained assuming a very conservative approach and ismost probably lower than the real safety limit. Since it is not specified inMortensen’s [3] studywhat was the composition of NOx,
it was assumed that it was 100% nitrogen oxide.h MMAD ¼ mass median aerodynamic diameter in microns (micrometers). Less than 3.0 mm is considered breathable; less than 10 mm is considered inhalable.i These standards are based on exposure guidelines for residential indoor air quality (1987) and are only informative. New standard (2012) claims that indoor levels of PM2.5 should be kept as low as
possible. [4,18].
bio
mass
and
bio
energy
xxx
(2014)1e11
4Please
citeth
isarticle
inpress
as:
RoyY,etal.,
Biom
ass
com
bustio
nforgreenhouse
carb
ondioxideenrich
ment,Biom
ass
and
Bioenergy(2014),http
://dx.doi.o
rg/10.101
6/j.b
iom
bioe.2014.03.00
1

b i om a s s a n d b i o e n e r g y x x x ( 2 0 1 4 ) 1e1 1 5
2.5. Volatile organic compounds (VOC)
Volatile organic compounds are any volatile molecule con-
taining organic carbon bound with other carbon, hydrogen,
nitrogen or sulfur [5]. Each type is regulated independently
since their effect on human health varies greatly with their
composition. Every primary emission control measures pro-
moting complete combustion help in reducing VOC’s emis-
sion. Thus VOC should not be a concern if a proper
temperature in the combustion chamber, a long enough
residence time of burning fuel in the combustion chamber and
suitable air to fuel ratio are maintained. Nevertheless,
ethylene, a particular VOC, should be monitored since trace
amounts of this gas into the air can be detrimental to plants
[5]. Ethylene is a plant hormone that stimulates senescence of
the plants, causing leaf chlorosis and abscission as well as
flower drop [3]. Plant response to ethylene varies greatly with
species which makes it difficult to establish a general con-
centration limit. Moreover, studies have shown that the effect
of ethylene concentration on plant varies in function of car-
bon monoxide concentration in the ambient air [15]. Morten-
sen [3] has established that ethylene concentration in a
greenhouse should be kept lower than 10mm3 m�3 in order to
ensure no adverse effects on all species.
3. Air quality guidelines for a greenhouseenvironment
Table 3 summarizes different regulations, guidelines and
research on air quality ensuring safety for human and plants
[3e5,10,12,14,16e18]. Since the present research has been
conducted in Canada, the greenhouse air quality guidelines
are primarily based on Health Canada guidelines and the
maximum exposure concentration for plant safety. As shown
in this table, the World Health Organisation guidelines are
very stringent in terms of air quality while Canadian and US
guidelines are more permissive.
In order to ensure an effortless comparison between the
different standards, each standard in Table 3 has been re-
ported cm3 m�3 for noxious gases and mg m�3 for particulates.
However, some guidelines and research was not published in
those units.
Fig. 1 e Settling chamber [19].
Please cite this article in press as: Roy Y, et al., Biomass combustBioenergy (2014), http://dx.doi.org/10.1016/j.biombioe.2014.03.001
4. Exhaust purification apparatus
The technology to treat or remove noxious gas and particu-
late, can be divided into 5 process classes: mechanical
collection; electrostatic precipitation; filtration, scrubbing,
and catalytic conversion.
4.1. Mechanical collectors
Mechanical collectors are the less expensive type of filtering
devices. However, their efficiency is limited to large scale
particulates [19]. Mechanical collectors can be divided in two
main classes. There are settling chambers (Fig. 1) and cyclone
(Fig. 2). Settling chambers are based on the principle that
particulates will settle due to gravity. The length of the
chamber and the gas velocity are the main factors affecting
the effectiveness of the system. Their main advantages are
that they are simple, inexpensive, cause a small pressure drop
(<20 Pa), have a high capacity and require no water [6]. How-
ever, their efficiency is low and limited to large particles
(�50 mm) and their dimensions limit their utilisation to
constraint environments [19]. Cyclone separators are based on
the principle that the inertia of the particles makes them
collide with the outer wall when a gas stream is spinning in-
side a cylinder. Depending of their design configuration, their
efficiency varies between 50 and 90% and they can remove
particulates of larger diameters than 5e25 mm [19]. Their main
advantages are that they are simple to design and maintain,
they produce low to moderate pressure drop (60e150 Pa), they
can handle high loading and temperature and they are
economical [6]. However, they require head room, they have
low collection efficiency for small particles and they are sen-
sitive to variable dust loading and flow rate.
Fig. 2 e Reverse flow cyclone [6].
ion for greenhouse carbon dioxide enrichment, Biomass and

b i om a s s a n d b i o e n e r g y x x x ( 2 0 1 4 ) 1e1 16
4.2. Electrostatic precipitators
Electrostatic filters operate using the principle that an elec-
trode exerts an attractive force on oppositely charged particles
[19]. Two electrodes highly charged generate ions thatmigrate
fromone electrode to the other. At the same time, the polluted
gas stream flows in between the two electrodes. Thus, dirt
particles collidewith the flowof ions and become charged. The
newlychargedparticles are therefore attracted to theelectrode
due to electrostatic force. Periodically, this electrode is cleaned
using vibration or simply by scraping the electrode [19].
Electrostatic precipitators can achieve up to 99% efficiency
and collect particulates smaller than 1 mm [19]. They have the
ability to collect wet or dry particles, they generate very small
pressure drop (15e30 Pa) and they can operate at high flue gas
flow rates and temperature (up to 480 �C) [6]. Nevertheless,
their initial cost is relatively high, they are sensitive to variable
loading and flow rate and safety measures must be taken to
safeguard personnel from high voltage. Fig. 3 illustrates a cy-
lindrical single-stage electrostatic precipitator.
4.3. Filter
Bag filters operate using the principle that the size of partic-
ulates is greater than that of a gaseous molecule. Their con-
struction is simple and consists of a fibrous or packed media
into which the polluted gas stream is forced to pass through.
Once clogged of particulates, reverse flow can be used to clean
the filtering media and collect the particulates. Most filtering
media need to be replaced occasionally in order to limit
pressure drop and maintain high efficiency. Bag filters can
achieve above 99% efficiency and remove particles smaller
Fig. 3 e Cylindrical single-stage electrostatic precipitator
[19].
Please cite this article in press as: Roy Y, et al., Biomass combustBioenergy (2014), http://dx.doi.org/10.1016/j.biombioe.2014.03.001
than 1 mm in diameter [19]. Bag filters allow high removal ef-
ficiency at low cost. Nonetheless, filtering media can be
damaged or clogged by high temperature, chemical reaction
and humidity and most devices are voluminous [6].
4.4. Scrubber
Scrubbers takeadvantageof the fact thatawaterdropletmoving
in a dirty gas stream collides and intercepts particulates. Thus,
the more droplets sprayed in the gas stream, themore efficient
the scrubber. However, numerous and smaller droplets
generate a larger pressure drop and consume more energy.
Scrubber efficiency varies significantly in function of their
design. In general, spray towers have an efficiency of 80% for
particulates greater than 10 mm, cyclonic scrubbers have an ef-
ficiency of 80% for particulates greater than 2.5 mm, impinge-
mentscrubbershaveanefficiencyof80%forparticulatesgreater
than 2.5 mmand venture scrubbers have an efficiency of 99% for
particulates greater than 0.5 mm [19]. Scrubbers have numerous
advantages since they can simultaneously absorb SO2, NO2, HCl
and particles, they have the ability to cool and clean high-
temperature wet gases and they can treat corrosive gases [6].
However, thenecessity to have awastewater treatment system
to purify the water use in the scrubber is an additional expense
and concern that limit their use. They also have corrosion
problems and they cannot be used in cold weather.
4.5. Catalytic converter
Catalytic converters allow converting noxious gases produced
during the combustion process into less hazardous gases.
Unlike the other purification devices, catalytic converters are
efficient only to process noxious gases and can only work if
the gas stream contains very low particles concentration.
Catalytic converters are madewith a ceramic structure coated
by preciousmetals such as palladium, platinum and rhodium.
Platinum and palladium promote the oxidation of CO and HC,
whereas rhodium promotes the reduction of NOx [20]. In order
to maximize surface area and minimise the quantity of
precious metal used, the catalyst are usually shaped like
honeycombs, either squares or triangles, in order to get more
surface area. A drawback of catalytic converters is that they
are required to operate at a high temperature in order to be
efficient. In fact, the activation energy for Pt catalysed CO to
CO2 is about 83.68 kJ mol�1, compared to 167.36 kJ mol�1 for
non-catalysed or thermal reaction [21]. The catalysed reaction
of CO into CO2 has an activation temperature of approxi-
mately 200 �C. Thus, the temperature must be carefully
controlled within the catalytic converter.
5. Materials and methods
A wood pellet furnace was installed inside a tunnel green-
house and an emission purification system was installed on
the chimney of the biomass furnace. The composition of the
flue gas produced during wood pellet combustion was ana-
lysed and recorded. The specification of the furnace, wood
pellets used, and testing instruments are provided in the
following section.
ion for greenhouse carbon dioxide enrichment, Biomass and
b i om a s s a n d b i o e n e r g y x x x ( 2 0 1 4 ) 1e1 1 7
5.1. Furnace
A biomass furnace (SBI Caddy Alterna, Saint-Augustin-de-
Desmaures, Quebec, Canada) was installed inside a tunnel
greenhouse located on the Macdonald campus of McGill Uni-
versity (Ste-Anne-de-Bellevue, Quebec, Canada). The furnace
is equipped with a 101.6 mm chimney, a 500 Watts lighter, a
central computer allowing to control the input power which
can be set to 4.98, 17.58, 23.45, 29.31 and 35.17 kW [22]. Based
on dealer specifications, this furnace has an average thermal
efficiency of 81.2% [22].
5.2. Wood pellets
The biomass used during the experiment was premium grade
wood pellets made with 100% hardwood. As specified by the
manufacturer (Valfei Product Inc, Quebec, Canada), the wood
pellets contain no additive and chemical and produce less
than 1% of ash and less than 0.5% of fines. The bulk density of
hardwood pelletizedwoodwasmeasured at 580 kgm�3.Wood
pellets have a cylindrical shape with an average diameter of
8 mm and a length of 30 mm.
5.3. Gas analysis
The composition of the flue gas produced during wood pellet
combustionwasanalysedusingtheTESTO335portableanalyzer
(Testo Inc., Lenzkirch, Germany). This analyser has a resolution
of100mm3m�3 forCO,NOandNO2andaresolutionof1cm3m�3
for SO2 [23]. VOC analyses were performed using VOC detectors
(Reed GD-3300, Taipei, Taiwan) which have sensitivity of
50 cm3 m�3 for methane [24]. Volatile organic compound anal-
ysis was required in order to detect the presence of ethylene
which can be detrimental to plant as previously stated.
5.4. Experimental setup
The purpose of this research was to develop an exhaust
filtering system that can be installed on a residential size
wood pellet furnace for small scale greenhouse enrichment.
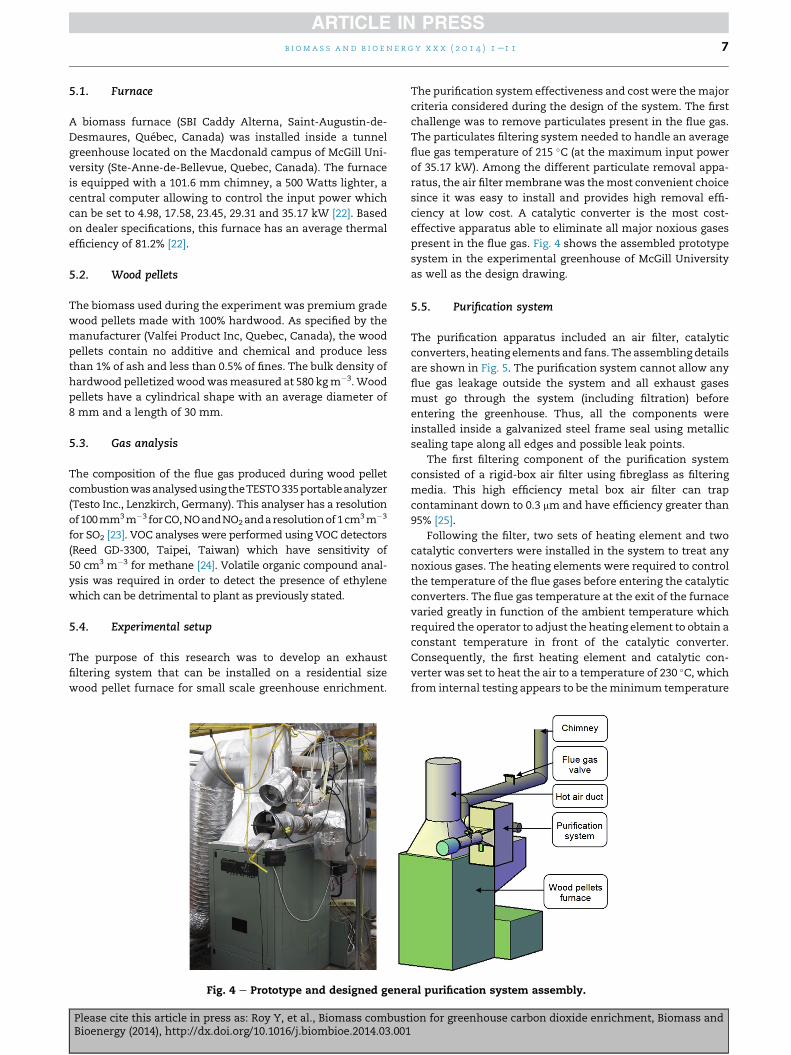
Fig. 4 e Prototype and designed gener
Please cite this article in press as: Roy Y, et al., Biomass combustBioenergy (2014), http://dx.doi.org/10.1016/j.biombioe.2014.03.001
The purification system effectiveness and cost were themajor
criteria considered during the design of the system. The first
challenge was to remove particulates present in the flue gas.
The particulates filtering system needed to handle an average
flue gas temperature of 215 �C (at the maximum input power
of 35.17 kW). Among the different particulate removal appa-
ratus, the air filtermembranewas themost convenient choice
since it was easy to install and provides high removal effi-
ciency at low cost. A catalytic converter is the most cost-
effective apparatus able to eliminate all major noxious gases
present in the flue gas. Fig. 4 shows the assembled prototype
system in the experimental greenhouse of McGill University
as well as the design drawing.
5.5. Purification system
The purification apparatus included an air filter, catalytic
converters, heating elements and fans. The assembling details
are shown in Fig. 5. The purification system cannot allow any
flue gas leakage outside the system and all exhaust gases
must go through the system (including filtration) before
entering the greenhouse. Thus, all the components were
installed inside a galvanized steel frame seal using metallic
sealing tape along all edges and possible leak points.
The first filtering component of the purification system
consisted of a rigid-box air filter using fibreglass as filtering
media. This high efficiency metal box air filter can trap
contaminant down to 0.3 mm and have efficiency greater than
95% [25].
Following the filter, two sets of heating element and two
catalytic converters were installed in the system to treat any
noxious gases. The heating elements were required to control
the temperature of the flue gases before entering the catalytic
converters. The flue gas temperature at the exit of the furnace
varied greatly in function of the ambient temperature which
required the operator to adjust the heating element to obtain a
constant temperature in front of the catalytic converter.
Consequently, the first heating element and catalytic con-
verter was set to heat the air to a temperature of 230 �C, which
from internal testing appears to be theminimum temperature
al purification system assembly.
ion for greenhouse carbon dioxide enrichment, Biomass and

Fig. 5 e Slice of the purification system.
b i om a s s a n d b i o e n e r g y x x x ( 2 0 1 4 ) 1e1 18
for CO and SO2 removal using a universal type catalyser con-
taining a loading of 20.34 g m�3 of Palladium and no Rhodium
and Platinum (Catalyseur National, St-Hubert, Quebec, Can-
ada). Increasing the air temperature above 250 �C increased
the production of thermal NOx by the first heating element.
The second heating element raised the flue gas temperature to
350 �C in order to improve the efficiency of the second cata-
lytic converter to process NOx into nitrogen and oxygen.
It is essential to properly install the high efficiency air filter
prior to the catalytic converter because particulates reduce
the contact area between noxious gases and the precious
metal coating inside the catalytic converter which signifi-
cantly reduce noxious gas conversion. Our testing has shown
that the usage of a fibreglass air filter pad, with a removal
efficiency of 80%, will cause the catalytic converter to lose half
of its efficiency to remove CO in only 36 h of operation. Thus,
particulates removal efficiency prior to the catalyser must be
monitored and controlled to ensure plants and humans
safety.
Fig. 6 e Gas concentration measured before the purific
Please cite this article in press as: Roy Y, et al., Biomass combustBioenergy (2014), http://dx.doi.org/10.1016/j.biombioe.2014.03.001
The high restriction caused by the catalytic converters and
the air filter made it necessary to install a fan at the entrance
of the flue gas filtering system to push the air through the
filtering system. Due to the high temperature of the flue gas, it
was not possible to use a regular centrifugal fan without
causing heat damage to the motor. In order to protect the
motor of the fan from the heat of the flue gas, a shaft was
machined and installed between the fan propeller and the
motor. This shaft protected the motor from overheating by
blowing air on themachined shaft using a regular ventilator. A
second fan was installed at the exit of the system to enhance
the pressure differential through the system allowing a better
flow of flue gas (Fig. 5).
6. Results and discussion
Figs. 6 and 7 show noxious gases and temperature variation at
the entrance and the exit of the purification system attached
ation system attached on the wood pellet furnace.
ion for greenhouse carbon dioxide enrichment, Biomass and
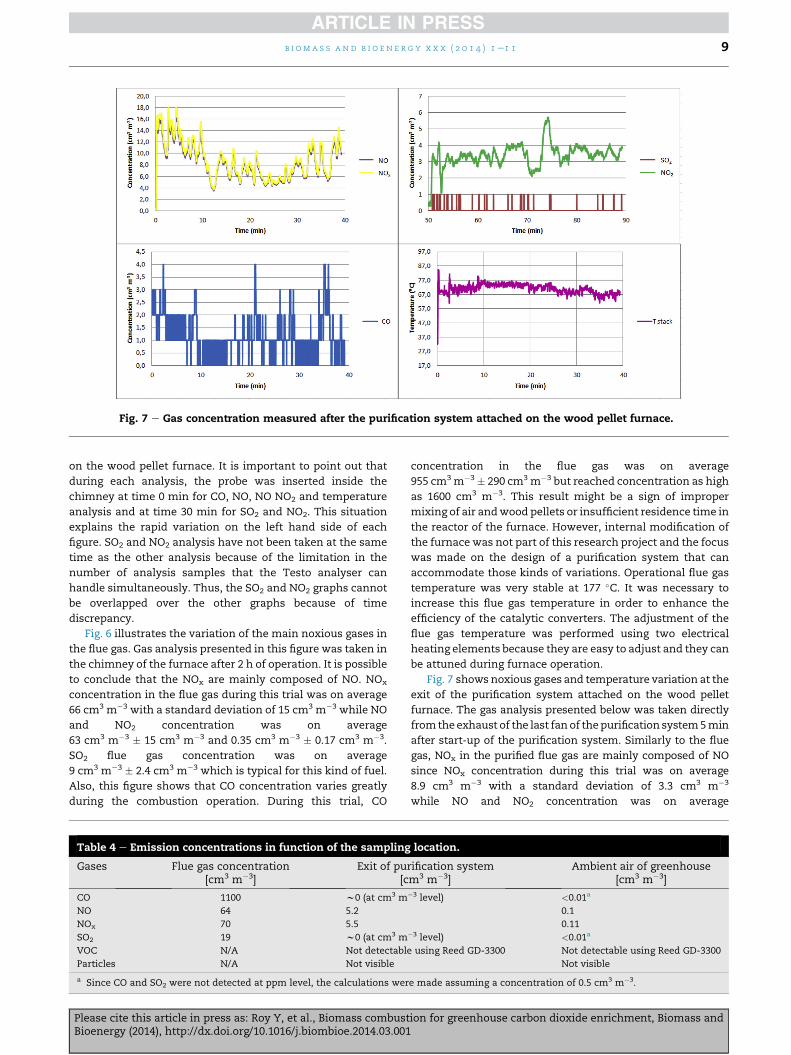
Fig. 7 e Gas concentration measured after the purification system attached on the wood pellet furnace.
b i om a s s a n d b i o e n e r g y x x x ( 2 0 1 4 ) 1e1 1 9
on the wood pellet furnace. It is important to point out that
during each analysis, the probe was inserted inside the
chimney at time 0 min for CO, NO, NO NO2 and temperature
analysis and at time 30 min for SO2 and NO2. This situation
explains the rapid variation on the left hand side of each
figure. SO2 and NO2 analysis have not been taken at the same
time as the other analysis because of the limitation in the
number of analysis samples that the Testo analyser can
handle simultaneously. Thus, the SO2 and NO2 graphs cannot
be overlapped over the other graphs because of time
discrepancy.
Fig. 6 illustrates the variation of the main noxious gases in
the flue gas. Gas analysis presented in this figure was taken in
the chimney of the furnace after 2 h of operation. It is possible
to conclude that the NOx are mainly composed of NO. NOx
concentration in the flue gas during this trial was on average
66 cm3 m�3 with a standard deviation of 15 cm3 m�3 while NO
and NO2 concentration was on average
63 cm3 m�3 � 15 cm3 m�3 and 0.35 cm3 m�3 � 0.17 cm3 m�3.
SO2 flue gas concentration was on average
9 cm3 m�3 � 2.4 cm3 m�3 which is typical for this kind of fuel.
Also, this figure shows that CO concentration varies greatly
during the combustion operation. During this trial, CO
Table 4 e Emission concentrations in function of the sampling
Gases Flue gas concentration[cm3 m�3]
Exit of pur[c
CO 1100 w0 (at cm3 m
NO 64 5.2
NOx 70 5.5
SO2 19 w0 (at cm3 m
VOC N/A Not detectable
Particles N/A Not visible
a Since CO and SO2 were not detected at ppm level, the calculations wer
Please cite this article in press as: Roy Y, et al., Biomass combustBioenergy (2014), http://dx.doi.org/10.1016/j.biombioe.2014.03.001
concentration in the flue gas was on average
955 cm3 m�3 � 290 cm3 m�3 but reached concentration as high
as 1600 cm3 m�3. This result might be a sign of improper
mixing of air andwood pellets or insufficient residence time in
the reactor of the furnace. However, internal modification of
the furnace was not part of this research project and the focus
was made on the design of a purification system that can
accommodate those kinds of variations. Operational flue gas
temperature was very stable at 177 �C. It was necessary to
increase this flue gas temperature in order to enhance the
efficiency of the catalytic converters. The adjustment of the
flue gas temperature was performed using two electrical
heating elements because they are easy to adjust and they can
be attuned during furnace operation.
Fig. 7 shows noxious gases and temperature variation at the
exit of the purification system attached on the wood pellet
furnace. The gas analysis presented below was taken directly
from theexhaust of the last fan of thepurification system5min
after start-up of the purification system. Similarly to the flue
gas, NOx in the purified flue gas are mainly composed of NO
since NOx concentration during this trial was on average
8.9 cm3 m�3 with a standard deviation of 3.3 cm3 m�3
while NO and NO2 concentration was on average
location.
ification systemm3 m�3]
Ambient air of greenhouse[cm3 m�3]
�3 level) <0.01a
0.1
0.11�3 level) <0.01a
using Reed GD-3300 Not detectable using Reed GD-3300
Not visible
e made assuming a concentration of 0.5 cm3 m�3.
ion for greenhouse carbon dioxide enrichment, Biomass and

b i om a s s a n d b i o e n e r g y x x x ( 2 0 1 4 ) 1e1 110
8.5 cm3m�3� 3.1 cm3m�3 and 3.4 cm3m�3� 0.7 cm3m�3. It has
beenobserved thatNOxconcentrationcanvarydepending if the
analysis is performedduring the first 30e45min of operation or
after. This isbecausecatalytic convertersneed tobehot inorder
to be efficient and 30e45 min is the time required to reach the
lower limit operational temperature. In order to reduce the
warmup time, itwould benecessary tomodify the set-up of the
furnace to increase exhaust flue gas temperature. Another so-
lutionwould be to install a bypass at the exit of the purification
rejecting thefirsthourofgasproduced into theatmosphere. SO2
concentration at the exit of the purification system was on
average 0.02 cm3 m�3 � 0.14 cm3 m�3 which is under the
1 cm3 m�3 resolution for this instrument. CO concentration in
the flue gaswas on average 1.1 cm3m�3� 0.8 cm3m�3 which is
very closeof the resolution limit of 1 cm3m�3 of this instrument
even though gas analysis has been conducted during thewarm
up of the purification unit. The catalytic converter for CO
removal produced a remarkable efficiency reducing CO con-
centration from 955 cm3 m�3 to only 1.1 cm3 m�3.
Seven experiments of approximately 4 h each have been
conducted on the purification system. Averaging all the re-
sults obtained during these multiple trial, it was found that
the emission control system installed on the chimney of the
furnace was able to reduce CO concentrations from 1100 to
less than 1 cm3 m�3, NOx from 70 to approximately
5.2 cm3m�3 and SO2 from 19 to less than 1 cm3m�3. Therewas
no significant variability among the different trial but it was
observed that the first hour of operation released generally
higher concentrations of NOx than after 1 h of operation. The
purification system was able to trap particles down to 0.3 mm
with an efficiency greater than 95%. In addition, volatile
organic compounds were not detected for any of the trials at
the exit of the system using the Reed GD-3300 analyser, which
confirms that no significant amount of ethylene is released
into the greenhouse.
The furnace was installed in a double layer polyethylene
greenhouse that has an approximate volume of 370 m3. This
size of greenhouse will experience approximately 0.5 air
changes per hour, excluding the effect of the ventilation [26].
At maximum input power of 35.17 kW, the volumetric flow
rate of purified flue gas was on average 0.001 m3 s�1. The
naturally occurring dilution factor was calculated using Eq.
(1) and was calculated to be approximately 50.
Dilution factor ¼ Greenhouse air exchange flow ratePurified flue gas flow rate
(1)
Table 4 shows the concentrations of noxious gases at the
entrance and the exit of the purification system as well as
their theoretical concentration in the ambient air of the
greenhouse. The ambient air concentrations of noxious
components are significantly below limit exposure values for
humans and plants reported in Table 3. These results are
satisfactory since they ensure human and plant safety.
7. Conclusion
The current study has shown that a purification system
composed of a rigid box air filter (MERV rating 14, 0.3 mm
Please cite this article in press as: Roy Y, et al., Biomass combustBioenergy (2014), http://dx.doi.org/10.1016/j.biombioe.2014.03.001
pores), two sets of heating element, two catalytic converters,
with two forced air fans is a suitable system to filter wood
pellet furnace exhaust gases for greenhouse CO2 enrich-
ment. Analysis shows that the purification system installed
on the chimney of the furnace was able to reduce CO con-
centration from 1100 to less than 1 cm3 m�3, NOx from 70 to
5.5 cm3 m�3, SO2 from 19 to less than 1 cm3 m�3 and
removed particulates larger than 0.3 mm with an efficiency
greater than 95%. Volatile organic compounds were not
detected for any of the trials at the exit of the system which
confirms that no significant amount of ethylene is released
into the greenhouse. These results meet and exceed the air
quality criterion for greenhouse environments after dilution
into the ambient air of the greenhouse. The designed system
provides an alternative to current carbon dioxide enrich-
ment technologies which uses fossil fuel to provide CO2 for
most greenhouse operations and considerably improved the
thermal efficiency of wood pellet heating system since no
heat is lost trough the flue gas.
Acknowledgements
We would like to thank SBI Company for providing a wood
pellet furnace for this project, Valfei Product for the wood
pellets, and Catalyseur National Company, for their technical
support on catalytic converter. Natural Sciences and Engi-
neering Research Council of Canada, Fonds quebecois de la
recherche sur la nature et les technologies, BioFuelNet (29)
and Ministere de l’Agriculture, des Pecheries et de l’Alimen-
tation duQuebec (MAPAQ) (809142) are acknowledged for their
financial support. Finally, I would like to give my sincere ac-
knowledgements to the Bioresource Engineering Department
staff andmore specifically to ScottManktelow andDr. Samson
Sotocinal for their technical help during the construction of
the system.
r e f e r e n c e s
[1] Mortensen LM. Growth responses of some greenhouse plantsto environment. I. Experimental techniques. Sci Hortic1982;16(1):39e46.
[2] Kirschbaum MU. Does enhanced photosynthesis enhancegrowth? Lessons learned from CO2 enrichment studies. PlantPhysiol 2011;155(1):117e24.
[3] Mortensen LM. Review: CO2 enrichment in greenhouses.Crop responses. Sci Hortic 1987;33(1e2):1e25.
[4] Health-Canada. Residential Indoor Air Quality Guidelines[Guideline on the internet]. Ottawa: Health Canada; 2012.Available from:, http://www.hc-sc.gc.ca/ewh-semt/air/in/res-in/index-eng.php [cited 27.01.14].
[5] Dion LM, Lefsrud M, Orsat V. Review of CO2 recoverymethods from the exhaust gas of biomass heating systemsfor safe enrichment in greenhouses. Biomass Bioenergy2011;35(8):3422e32.
[6] Van Loo S, Koppejan J. The handbook of biomass combustionand co-firing. London, UK: Earthscan; 2008. p. 465.
[7] Roy MM, Dutta A, Corscadden K. An experimental study ofcombustion and emissions of biomass pellets in a prototypepellet furnace. Appl Energy 2013;108(0):298e307.
ion for greenhouse carbon dioxide enrichment, Biomass and
b i om a s s a n d b i o e n e r g y x x x ( 2 0 1 4 ) 1e1 1 11
[8] Godbout SH, Palacios J, Larouche J-P, Brassard P, Pelletier F.Bilan energetique, emissions gazeuses et particulaires de lacombustion de la biomasse agricole a la ferme. Quebec,Canada: Institut de recherche et de developpement enagroalimantaire (IRDA); 2012. p. 239 [Project number IRDA#:100 035].
[9] Winter F, Wartha C, Hofbauer H. NO and N2O formationduring the combustion of wood, straw, malt waste and peat.Bioresour Technol 1999;70(1):39e49.
[10] OSHA (Occupational Safety and Health Standards). Table Z-1Limits for air contaminants [Guideline on the internet].Washington, DC: Occupational Safety and HealthAdministration (OSHA); 2006. Available from:, www.osha.gov/pls/oshaweb/owadisp.show_document?p_table¼STANDARDS&;p_id¼9992 [cited 27.01.14].
[11] Lupianez C, Guedea I, Bolea I, Dıez LI, Romeo LM.Experimental study of SO2 and NOx emissions in fluidizedbed oxy-fuel combustion. Fuel Process Technol2013;106(0):587e94.
[12] ASHRAE. ASHRAE Standard: ventilation for acceptableindoor air quality. ANSI/ASHRAE Addendum q to ANSI/ASHRAE Standard 621. Atlanta, GA, United States: AmericanSociety of Heating, Refrigerating and Air-ConditioningEngineers; 2010. p. 18.
[13] Law CK. Combustion physics. Cambridge, NY, United States:Cambridge University Press; 2006. p. 722.
[14] ASHRAE. 2009 ASHRAE handbook fundamentals. Atlanta,GA, United States: American Society of Heating, Refrigeratingand Air-Conditioning Engineers (ASHRAE); 2009. p. 926.
[15] Hanan JJ. Greenhouses: Advanced Technology for ProtectedHorticulture. Boca Raton: CRC Press; 1998.
[16] WHO. Air Quality guidelines, Global update 2005: particulatematter, ozone, nitrogen dioxide and sulfur dioxide.
Please cite this article in press as: Roy Y, et al., Biomass combustBioenergy (2014), http://dx.doi.org/10.1016/j.biombioe.2014.03.001
Copenhagen, Denmark: World Health Organization (WHO);2006. p. 496.
[17] WHO. WHO guidelines for indoor air quality: selectedpollutants. Copenhagen, Denmark: World HealthOrganization (WHO); 2010. p. 484.
[18] Health-Canada. Exposure guidelines for residential indoorAirQuality: a Report of the Federal-Provincial AdvisoryCommittee on Environmental and Occupational Health.Ottawa, Canada: Health Canada; 1987. p. 28. Report no.: H46-2/90-156E.
[19] Flagan R, Seinfeld JH. Fundamentals of air pollutionengineering. New Jersey, US: Prentice Hall; 1988. p. 554.
[20] Sideris M. Methods for monitoring and diagnosing theefficiency of catalytic converters a patent-oriented survey.New York, US: Elsevier; 1998.
[21] Heck RM, Farrauto RJ, Gulati ST. Catalytic air pollutioncontrol: commercial technology. New York: Wiley-Interscience; 2002.
[22] PSG. Instruction pour l’installation et le fonctionnement dela fournaise a granule CADDY ALTERNA: Manueld’instruction. Saint-Augustin de Desmaures, Canada: PSG;2011. p. 54.
[23] Testo. Testo 335 combustion analyser. Flanders, NJ, US:Testo.inc; 2011.
[24] Reedinstrument. GD-3300 Combustible Gas Detector. Ste-Anne-de-Bellevue, Canada: Reed instrument.inc; 2013.
[25] McMaster-Carr. High-efficiency metal box air filter, Merv 14,Aluminum-coated steel, 12 � 24, 12" thick [Specification onthe internet]. Aurora, OH, US: McMaster-Carr.inc; 2013.Available from:, http://www.mcmaster.com/#8231t42/¼qt0f2u [cited 27.01.14].
[26] Hicklenton PR. CO2 enrichment in the greenhouse: principlesand practice. Portland, Or, US: Timber Press; 1988.
ion for greenhouse carbon dioxide enrichment, Biomass and