BIOMARKERS: REVIEW AND APPLICATION TO FORMATION by ...
70
BIOMARKERS: REVIEW AND APPLICATION TO THE EAGLE FORD SHALE FORMATION by UGOCHUKWU ONONOGBU Presented to the Faculty of the Graduate School of The University of Texas at Arlington in Partial Fulfillment of the Requirements for the Degree of MASTER OF SCIENCE IN GEOLOGY THE UNIVERSITY OF TEXAS AT ARLINGTON December, 2012
Transcript of BIOMARKERS: REVIEW AND APPLICATION TO FORMATION by ...

BIOMARKERS: REVIEW AND APPLICATION TO
THE EAGLE FORD SHALE
FORMATION
by
UGOCHUKWU ONONOGBU
Presented to the Faculty of the Graduate School of
The University of Texas at Arlington in Partial Fulfillment
of the Requirements
for the Degree of
MASTER OF SCIENCE IN GEOLOGY
THE UNIVERSITY OF TEXAS AT ARLINGTON
December, 2012

Copyright © by Ugochukwu Ononogbu 2012
All Rights Reserved

iii
ACKNOWLEDGEMENTS
I am heartily thankful to Paul Walker of Weatherford Laboratories and Mark McCaffrey
of Oil Tracers for the Eagle Ford shale formation sample results which helped in the completion
of this thesis. I was given the results for the sole purpose as an aide for my thesis; and I am
very grateful for their generosity. The results of the oil sample from the Eagle Ford shale
formation were very detailed which helped me understand the material even better; Thank you.
My immense gratitude goes to Dr. Qinhong Hu, my advisor, for guiding me through the
entire process. His knowledge and straightforward approach to the process were essential in
the completion of this thesis. I also want to thank other members of my committee Dr. John
Wickham and Dr. Majie Fan; their input and criticism during the thesis proposal process
prepared me for the demands and dedication that was necessary in successfully concluding this
thesis.
Finally I would like to thank the various authors mentioned in my references.
Biomarkers are a fairly unknown field but the amount of publications available as references
makes it seem otherwise. Thank you all for your research and great work; your publications
made my thesis a success.
November 20, 2012

iv
ABSTRACT
BIOMARKERS: REVIEW AND APPLICATION TO
THE EAGLE FORD SHALE
FORMATION
Ugochukwu Ononogbu, M.S.
The University of Texas at Arlington, 2012
Supervising Professor: Qinhong Hu
Biomarkers have become an integral part of oil exploration. Gas Chromatography (-
Mass Spectrometry) is performed to an oil sample to acquire biomarkers from the sample. The
presence, lack of, or abundance of a given compound (or biomarker) in the geochemical results
of an oil sample depict(s) a property or properties of the source rock and the oil. For example,
the abundance of pristane and lack of phytane in an oil sample are characteristic of a shale
source rock, such as the Eagle Ford, will show a high pristane to phytane ratio.
The Eagle Ford shale formation is cretaceous in age; the presence and absence of
certain biomarkers like oleanane suggest age ranges. The oil sample tested from the Eagle
Ford shale formation support a source rock from the Cretaceous period. The biomaker results
from the Eagle Ford shale formation also suggest the thermal maturity of oil samples tested.
The Eagle Ford shale formation produces both gas and oil. Formations which produce both oil
and gas ensure that the biomarkers detected can be used to study thermal maturity. The results
from the Eagle Ford shale formation show a thermal maturity that is between peak and late
stages of oil generation which supports continued exploration from the reservoir of the oil
sample.

v
Results are affected by many variables; therefore, there will be considerable variations
in the ensuing interpretations. The use of multiple biomarkers in the results from the Eagle Ford
shale formation and comparing and contrasting those results with other available results will
produce more accurate conclusions.

vi
TABLE OF CONTENTS
ACKNOWLEDGEMENTS ................................................................................................................iii ABSTRACT ..................................................................................................................................... iv LIST OF ILLUSTRATIONS............................................................................................................. viii LIST OF TABLES ............................................................................................................................. x Chapter Page
1. INTRODUCTION……………………………………..………..….. ..................................... 1
1.1 Introduction to Biomarkers ............................................................................... 1
1.2 Physical Geology of Eagle Ford Formation ..................................................... 3
2. PREVIOUS RESEARCH OF BIOMARKERS ................................................................. 6
3. AIM AND OBJECTIVE OF THIS RESEARCH ................................................................ 7 4. METHOD ......................................................................................................................... 8
4.1 Sample Collection ............................................................................................ 8 4.2 Gas Chromatography (GC) .............................................................................. 8
4.3 Gas Chromatography – Mass Spectrometry (GC-MS) .................................... 9
5. RESULTS ...................................................................................................................... 11
5.1 Example Results of GC and GC-MS Analyses .............................................. 11 5.2 Acquired Results ............................................................................................ 13 5.3 Results through Different Geologic Time ....................................................... 27
6. DISCUSSION ................................................................................................................ 39
6.1 Application of Biomarkers in Age Dating ........................................................ 39 6.2 Application of Biomarkers in Determining the Depositional Environment ...... 42 6.3 Application of Biomarkers in Determining Thermal Maturity .......................... 47
7. CONCLUSION .............................................................................................................. 50
REFERENCES ............................................................................................................................... 52

vii
BIOGRAPHICAL INFORMATION .................................................................................................. 60

viii
LIST OF ILLUSTRATIONS
Figure Page 1.1 Eagle Ford shale formation lying between the Buda and Austin Chalk formation ............................................................................................................... 4 1.2 Eagle Ford shale formation through Texas showing changes in thickness ............................... 5 4.1 A schematic view of a Gas Chromatograph ............................................................................... 9 4.2 A schematic view of a Mass Spectrometer .............................................................................. 10 5.1 Eagle Ford shale formation showing whole oil GC and saturate compound GC-MS traces with important values/ratios ............................................................. 12 5.2 Whole Oil GC Trace ................................................................................................................. 14 5.3 GC-MS Traces for Saturate Compounds ................................................................................. 17 5.4 GC-MS Traces for Aromatic Compounds ................................................................................ 22 5.5 Precambrian Iremeken shale formation showing whole oil GC and saturate compound GC-MS traces with important values/ratios .............................................. 28 5.6 Cambrian Huqf Supergroup showing whole oil GC and saturate compound GC-MS traces with important values/ratios ............................................................ 29 5.7 Ordovician Red River formation showing whole oil GC and saturate compound GC-MS traces with important values/ratios ............................................................ 30 5.8 Lower Silurian Qusaiba shale showing whole oil GC and saturate compound GC-MS traces with important values/ratios ............................................................ 31 5.9 Devonian Lacustrine Old Red sandstone formation showing whole oil GC and saturate compound GC-MS traces with important values/ratios ....................................... 32 5.10 Mississippian Woodford shale showing whole oil GC and saturate compound GC-MS traces with important values/ratios .......................................................... 33 5.11 Permian Phosphoria carbonate formation showing whole oil GC and saturate compound GC-MS traces with important values/ratios ............................................ 34 5.12 Triassic Shublik formation showing whole oil GC and saturate compound GC-MS traces with important values/ratios .......................................................... 35 5.13 Jurassic Toarcian Schistes Carton shale showing whole oil GC and saturate compound GC-MS traces with important values/ratios ............................................ 36

ix
5.14 Cretaceous Iabe formation showing whole oil GC and saturate compound GC-MS traces with important values/ratios .......................................................... 37 5.15 Tertiary (Miocene) Heath shale formation showing whole oil GC and saturate compound GC-MS traces with important values/ratios ............................................ 38 6.1 Age-related parameters of the source rock .............................................................................. 41 6.2 Biomarker thermal maturation versus vitrinite reflectance ....................................................... 49

x
LIST OF TABLES
Table Page
1.1 Biomarkers indicative of source rock age, depositional environment and thermal maturity .......................................................................................................................... 2 5.1 Compounds detected in the whole oil ...................................................................................... 15 5.2 Compounds detected in saturate GC-MS ................................................................................ 18 5.3 Important ratios of detected saturate compounds .................................................................... 21 5.4 Compounds detected in aromatic GC-MS ............................................................................... 23 5.5 Important ratios of detected aromatic compounds ................................................................... 26 6.1 Suggested age-related biomarkers .......................................................................................... 40 6.2 Parameter of carbonate versus shale source rocks ................................................................. 43 6.3 Parameters based on the organic matter from marine, terrigenous, and lacustrine source-rock .............................................................................................................. 44

1
CHAPTER 1
INTRODUCTION
1.1 Introduction to Biomarkers
Biomarkers are compounds found in oil that hold information of the oil. They are mainly
lipids from living organisms that have been preserved through time. Unlike other organic
molecules such as proteins and carbohydrates, lipids can be preserved in sediments for millions
of years in a stable condition. A stable condition has very little to no free-oxygen (anoxic
condition) and minimal erosion.
Biomarkers are primarily made up of carbon and hydrogen, but can also contain other
elements such as oxygen, nitrogen, sulfur, and iron. Biomarkers are generally used in age
dating of a locale in the search for evidence of life and in petroleum exploration. In petroleum
exploration, biomarkers are indicative of one or more of the following: geologic time, thermal
maturity, and/or depositional environment. An example of a geologic time biomarker would be
oleanane (18alpha-oleanane) in an oil sample which indicates that the oil is from Cretaceous;
oleanane is formed from a flowering plant called angiosperm which is unique to Cretaceous and
younger (Moldowan et al., 1994). Furthermore, as an example of a depositional environment:
pristane/phytane ratio of less than one (< 1) in oil indicates that the environment was
hypersaline. Environments with increasing paleosalinity show a decreasing ratio of
pristane/phytane (ten Haven et al., 1987). The Eagle Ford shale formation is a marine
environment and not hypersaline; therefore, the ratio of pristane/phytane would be greater than
1. Table 1.1 shows more examples of biomarkers that provide information about the age of the
source rock, the depositional environment and the thermal maturity.

2
Table 1.1 Biomarkers indicative of source rock age, depositional environment and thermal maturity
Biomarker(s) Indication Comments
Oleanane
Indicative of a source rock from the
Cretaceous Period
Indicative of Cretaceous and
younger (Moldowan et al., 1994)
Pristane/Phytane
Indicative of marine (oxic) or
carbonate (suboxic) depositional
environment.
Ratio greater than 1 indicates
marine (Didyk et al., 1978)
Saturate compounds -
Steranes: S/(S+R)
Tells the thermal maturity of oil
samples, but could increase
dramatically past the oil peak
generation.
A high ratio indicates high thermal
maturation and/or heavy
biodegrading (Seifert and
Moldowan, 1986)
Aromatic Compounds-
Triaromatic/(Monoaromatic +
Triaromatic)
Tells the thermal maturity of
samples through the oil window.
The value increases with maturity.
The ratio works because
Triaromatic is a more mature
Monaromatic. Applications of the
ratio have been applied to basin
models (Mackenzie, 1984)

3
Biomarkers are evaluated from analysis on an oil sample using Gas Chromatography or Gas
Chromatography-Mass Spectrometry (GC-MS). Weatherford Laboratories and Oil Tracers used
a GC-MS instrument to test an oil sample from the Eagle Ford shale formation. Several of the
resulting compounds in the oil were known biomarkers; therefore, the oil sample was further
subjected to the GC-MS tests. A majority of the compounds (biomarkers) derived from the GC-
MS tests are indicators of the age of the source rock, the source rock depositional environment,
and thermal maturity.
1.2 Physical Geology of Eagle Ford Formation
The formation is located from the Mexican border northeastward into East Texas. The
formation lies between the Austin Chalk and the Buda lime (Fig. 1) around 4,000 to 12,000 feet
below the earth surface, with a thickness around 250 feet. The formation is about 50 miles wide
and 400 miles long (Fig. 2) and believed to be Cretaceous in age. The Eagle Ford formation is
divided into two layers: shale at the bottom which is organically enriched (Liro et al., 1994), and
carbonate flagstone interbedded with shale above. The Eagle Ford shale formation is the likely
source of the 140,000 acre East Texas oil field (Liro et al., 1994), which provides hydrocarbons
for formations like the Austin Chalk (Railroad Commission of Texas, 2012).

4
Figure 1.1 Eagle Ford shale formation lying between the Buda and Austin Chalk formation (World Oil, 2012)

5
Figure 1.2 Eagle Ford shale formation through Texas showing changes in thickness (World Oil, 2012)

6
CHAPTER 2
PREVIOUS RESEARCH OF BIOMARKERS
There is a significant amount of information on biomarkers in the petroleum exploration
field; detailed papers discussing biomarkers started to be published in the 1970s. Petroleum
exploration companies like Exxon Mobil have supported the study of biomarkers over the years
making biomarkers an important aspect of petroleum exploration. Scientists, including Kenneth
E. Peters, Clifford C. Walters, and J. Michael Moldowan have published many papers and
books on biomarkers including volumes 1 and 2 of The Biomaker Guide; their findings from
Volume 2 of the book is incorporated into this research. GeoMark Research, Inc owns a library
called Oil Information Library System (http://www.geomarkresearch.com/). The library contains
a lot of information on biomarkers, including various GC and GC-MS results of oils throughout
the geologic time. Weatherford Laboratories and Oil Tracers have also researched biomarkers
for many years, and they donated the analytical results for an oil sample from the Eagle Ford
shale formation for this research.

7
CHAPTER 3
AIM AND OBJECTIVE OF THIS RESEARCH
The objective of this study is to further understand the use of biomarkers in petroleum
exploration. To accomplish the objective, I used literature papers and biomarker books as a
guide while synthesizing the oil sample biomarker analyses from the Eagle Ford shale formation.
The overall aim of this study is to use the biomarkers found in the oil sample to determine: 1)
the age of the source rock, 2) the depositional environment, and 3) the thermal maturity of the
oil in the Eagle Ford shale formation. Other information like the kind of organic matter(s) that
went through diagenesis to form biomarker(s) found in the oil will also be explored during the
research.

8
CHAPTER 4
METHOD
4.1 Sample Collection
Weatherford Laboratories and Oil Tracers collect oil samples at the well head without
contamination. The oil sample used in this study was collected in the Eagle Ford shale in an
undisclosed location because of proprietary reasons. The well head is the structural support of a
well located at the surface of the well. A component called the header connects well head(s) to
flowlines, it has producing and testing valves that control the flow of each well. The sample was
not taken from the header because it could be contaminated by leaking valves, corrosion, etc.
Although it may be easier to collect the oil sample from components like the header, potential
contamination being in the tested sample is not an acceptable practice at Weatherford
Laboratories and Oil Tracers. In addition, the sample was collected in a glass bottle. Other
sample storage containers like plastic bottles may contaminate the sample.
4.2 Gas Chromatography (GC)
GC is the process of separating and identifying different organic compounds within a
test sample. Figure 4.1 below shows the brief process; the test sample is injected into the GC
instrument where the carrier gas (usually helium) takes it through the various components of the
GC instrument. The first GC instrument component is the column (a thin tube) with its interior
lined with a polymer coating (usually silicone oil polymers and other organic chemicals). The
polymer reacts with each compound in the sample differently as the carrier gas takes the
sample through the column, which is in the oven. The oven heats up the column turning the
compounds in the sample into a gaseous state; therefore, the more volatile material will get to
the next component faster with a smaller retention time. The next component the gaseous
material encounters is the detector which records the concentration (peak area or peak height)

9
of eluted compound over time Finally, the test sample can be fully recovered if the exit port is
connected to a cooling component, by changing the gaseous material back into liquid form
(expelling the helium).
Figure 4.1 A schematic view of a Gas Chromatograph (Maitland, 2000)
4.3 Gas Chromatography - Mass Spectrometry (GC-MS)
After the GC analysis was done on the oil sample, the results were analyzed and the
ratios and compounds acquired can be seen on Figure 5.2 and Table 5.1. The GC results
showed the presence of saturated and aromatic biomarkers, GC-MS analysis was conducted to
measure the saturated fraction and the aromatic fraction of the oil sample separately. The GC-
MS has a two part process, the GC and MS. The MS instrument is connected to the GC
instrument’s exit port, beginning the MS process immediately when the sample is injected in GC.
A cathode in MS reacts with the incoming material making it positively charged. Figure 4.2
illustrates the MS process, the positively charged material (ions) flows towards the negatively

10
charged plate. The slit on the plate allows some of the ions through to a curved path which is
between the poles of a magnet. The strength of the magnet is set to allow a certain molecular
weight to pass through the curve path successfully, hence filtering unwanted results. Figure 5.3
and 5.4 show multiple molecular weight (m/z) values, each value represents the molecular
weight allowed through the curved path. The ion detector then produces a graph/trace of ionic
abundance versus time. The aromatic GC-MS was run with ortho-terphenyl (seen in Table 5.4),
and the saturated GC-MS was run with 5 beta-cholane (seen in Table 5.2). Both compounds
(ortho-terphenyl and 5 beta-cholane) are internal standards used to calibrate the concentration
of each compound in the oil sample as a ratio of the internal standard to measured compound.
Figure 4.2 A schematic view of a Mass Spectrometer (Maitland, 2000)

11
CHAPTER 5
RESULTS
5.1 Example Results of GC and GC-MS Analyses
Figure 5.1 (from The Biomarker Guide) shows a whole oil GC and a saturate GC-MS
results of an oil sample from the Eagle Ford shale formation. The values of Pr/n-C17 and Ph/n-
C18 are used to evaluate the thermal maturity of oil (Winters and Williams, 1969). Another
example is the pristane/phytane value; it is greater than one in shales. I’ll compare the results in
Figure 5 to results of oil from my Eagle Ford oil sample as well as from other source rocks, to
further explain the usage of biomarkers.

12
Figure 5.1 Eagle Ford shale formation showing whole oil GC and saturate compound GC-MS traces with important values/ratios (Peters et al., 2005)

13
5.2 Acquired Results
The first set of results are the whole oil GC results; the trace/graph (Figure 5.2, key
biomarkers are highlighted) which is followed by a table showing all the compounds recorded by
the detector in the GC instrument (Table 5.1). The trace shows various peaks with peak labels.
The peak labels can be matched to the table which gives some information of each peak. The
ratios under the trace are ratios of biomarkers that suggest certain properties of oil.
The next set of results is the saturate GC-MS; the trace, followed by a table of the
detected compounds, and later a table showing the important ratios which can be seen to the
right of the trace (Figure 5.3, key biomarkers are highlighted). Three traces are of three different
ions as “m/z” numbers (Section 4.3). The ratios to the right of the traces are ratios of the
biomarkers from the Table 5.2. The applications of the ratios are specified to the right of ratio
values: A stands for age of rock; D stands for depositional environment; and M stands for
maturity. The ratios can also be seen in greater detail in Table 5.3.
The final set of results is the aromatic GC-MS (Figure 5.4, Table 5.4, and Table 5.5)
which has the same layout as the saturate GC-MS.

14
Figure 5.2 Whole Oil GC Trace

15
Table 5.1 Compounds detected in the whole oil

16
Table 5.1 Continued

17
Figure 5.3 GC-MS Traces for Saturate Compounds

18
Table 5.2 Compounds detected in saturate GC-MS

19
Table 5.2 Continued

20
Table 5.2 Continued
21
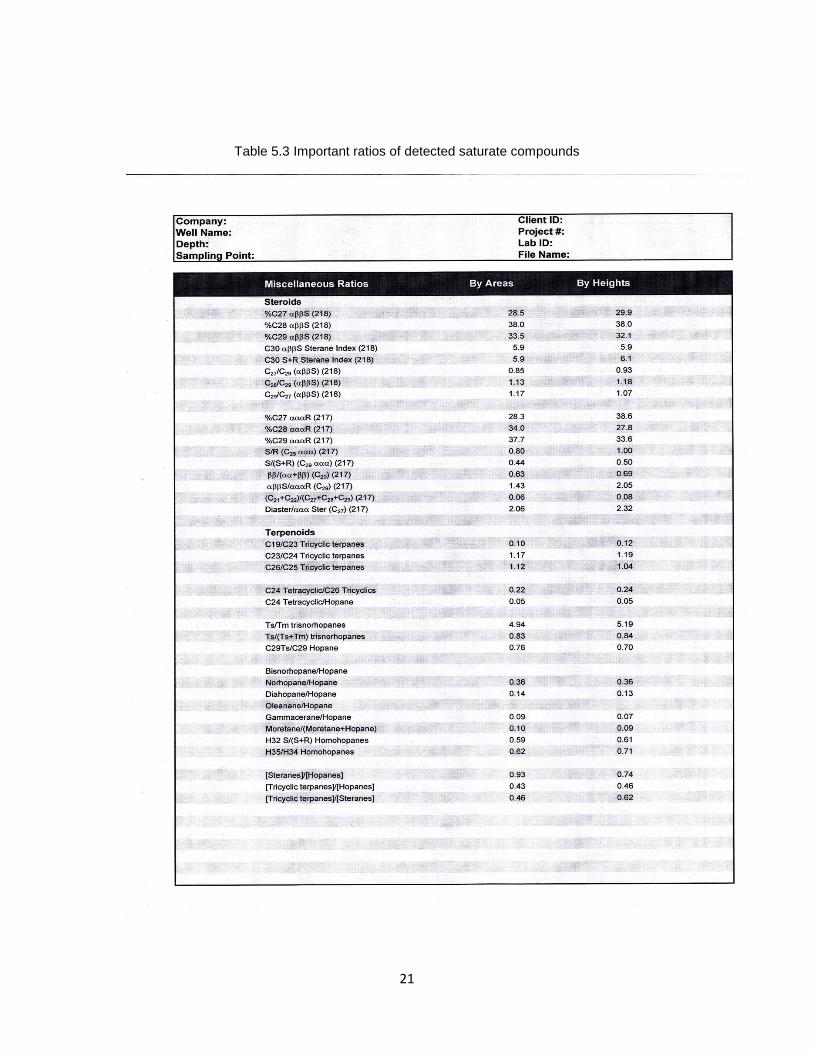
Table 5.3 Important ratios of detected saturate compounds

22
Figure 5.4 GC-MS Traces for Aromatic Compounds

23
Table 5.4 Compounds detected in aromatic GC-MS

24
Table 5.4 Continued

25
Tables 5.4 Continued

26
Table 5.5 Important ratios of detected aromatic compounds

27
5.3 Results through Different Geological Time
The following figures (Figures 5.5 to 5.15, listed in the order of geological time) are
results of tested oil samples by GeoMark Research, Inc. published in Peters et al. (2005).These
results will help explain some theories on biomarkers, and will also be used to discuss and
explain biomarkers further by comparing and contrasting the values with results of my Eagle
Ford sample.

28
Figure 5.5 Precambrian Iremeken shale formation showing whole oil GC and saturate compound GC-MS traces with important values/ratios (Peters et al., 2005)

29
Figure 5.6 Cambrian Huqf Supergroup showing whole oil GC and saturate compound GC-MS traces with important values/ratios (Peters et al., 2005)

30
Figure 5.7 Ordovician Red River formation showing whole oil GC and saturate compound GC-MS traces with important values/ratios (Peters et al., 2005)

31
Figure 5.8 Lower Silurian Qusaiba shale showing whole oil GC and saturate compound GC-MS traces with important values/ratios (Peters et al., 2005)

32
Figure 5.9 Devonian Lacustrine Old Red sandstone formation showing whole oil GC and saturate compound GC-MS traces with important values/ratios (Peters et al., 2005)

33
Figure 5.10 Mississippian Woodford shale showing whole oil GC and saturate compound GC-MS traces with important values/ratios (Peters et al., 2005)

34
Figure 5.11 Permian Phosphoria carbonate formation showing whole oil GC and saturate compound GC-MS traces with important values/ratios (Peters et al., 2005)

35
Figure 5.12 Triassic Shublik formation showing whole oil GC and saturate compound GC-MS traces with important values/ratios (Peters et al., 2005)

36
Figure 5.13 Jurassic Toarcian Schistes Carton shale showing whole oil GC and saturate compound GC-MS traces with important values/ratios (Peters et al., 2005)

37
Figure 5.14 Cretaceous Iabe formation showing whole oil GC and saturate compound GC-MS traces with important values/ratios (Peters et al., 2005)

38
Figure 5.15 Tertiary (Miocene) Heath shale formation showing whole oil GC and saturate compound GC-MS traces with important values/ratios (Peters et al., 2005)

39
CHAPTER 6
DISCUSSION
6.1 Application of Biomarkers in Age Dating
The process of using biomarkers for age dating is primarily based on the taxa that
formed the biomarker: therefore the source-organism of a biomarker needs to be known or else
the age of oil cannot be known by the biomarker alone. Other clues like the known source of a
reservoir can be used to support the biomarker in cases where the age dating from biomarker(s)
is not conclusive. Table 6.1 shows biomarkers, the related organism, and the age range when
the taxa were abundant. Figure 6.1 complements Table 6.1, both figure and table were
compiled from various papers (Grantham and Wakefield, 1988; Moldowan et al., 1994;
Moldowan et al., 1996; Holba et al., 1998; Moldowan, 2000; Moldowan and Jacobson, 2000;
Moldowan et al., 2001; Holba et al., 2001)

40
Table 6.1 Suggested age-related biomarkers (Peters et al., 2005)

41
Figure 6.1 Age-related parameters of the source rock (Peters et al., 2005). The arrow and star symbol indicate the results of my Eagle Ford sample.
Figure 6.1 and Table 6.1 are partially supported by the results in Section 5. The ratio of
C28/C29 steranes increases through time: the ratio of C28/C29 in Figures 9, 14 and 19 are 0.3,
0.5 and 1.47 respectively. My results of Eagle Ford oil sample support Figure 6.1 as well, using
results on steranes from Figure 5.3 and using the m/z 217. The C28/C29 ratio of 34 over 37.7 is
0.9 ( ) which falls into the category of Cretaceous or younger in Figure 6.1.

42
The presence of the biomarker oleanane is inconsistent; does not occur, or is less than
20% when it does occur prior to the Tertiary period according to Figure 6.1. Section 5 results
support this theory; Figure 5.14 having oleanane value of or 80% strongly suggests the
presence of angiosperms during deposition. The lack of oleanane values in my saturate GC-MS
result supports the inconsistencies of oleanane ( ) during the Cretaceous period. In my result
(Figure 5.3) the ratio of (C28+C29 Tricyclics)/Ts is 2.01 (low) Holba et al. (2001) stated that
values of >2 are high and <2 are low (Jurassic in age or younger). The presence of dinosteroid
in my results (Dinosteroid index on Figure 5.4) suggest Triassic or younger on Figure 6.1.
These interpretations narrow the age down to Cretaceous period. My results on the Eagle Ford
formation lack values for some biomarkers on Figure 6.1 due to variables like the m/z of GC-MS.
6.2 Application of Biomarker in Determining the Depositional Environment
The usage of biomarkers to determine the depositional environment is more common
than using it in age dating. The “D”s (depositional environment) on the ratios in Figure 5.3 and
5.4 show how many more biomarkers are used for D over “A” for age dating. This is mainly
because there is more information about biological origins’ habitant than its age of abundance
for biomarkers. Table 6.1 above shows the main organism of the biomarkers mentioned,
although Tables 6.2 and 6.3 do not give the main organisms for the biomarkers, both tables give
the inferred depositional environment.

43
Table 6.2 Parameters of carbonate versus shale source rocks (Peters et al., 2005)

44
Table 6.3 Parameters based on the organic matter from marine, terrigenous, and lacustrine source rock (Peters et al., 2005)
The following are derived from my oil sample results in section 5.2 and are highlighted
in tables 7 and 8: pristane/phytane is 1.53; diasteranes/steranes is 2.06 (high); C24
tetracyclic/C26 tricyclics is 0.22 (low); steranes/hopanes ~ 1(high); and Oleananes is absent.
Using both tables 7 and 8 as a guide to interpret my results, the oil sample of the Eagle Ford
formation is from a shale source rock and a marine depositional environment. Some biomarkers
in my results do not fully support this depositional environment, but they also do not fully
support other depositional environments. These biomarkers lay in the grey area of the
parameters mentioned in the tables above. For example, in Table 6.3 C27-C29 steranes has a
relatively high C28 in marine environments. In my results (Figure 5.4/Table 4.5) C28 is higher
than C29 in m/z 218 but is less in m/z 217. Further investigation led me to the paper of Philp et
al. (1989) where it stated that C28 and C29 are higher than C27 in the marine environment,

45
suggesting that the slight discrepancy does not discount my sample as being from a marine
environment.
The depositional environments of the oil samples in Section 5.3 can also be supported
by the biomarker values using the parameters in Tables 6.1 and 6.2 as a guide.
Fig. 5.5 Precambrian Iremeken formation is shale environment (Filiptsov et al.,
1999) and the biomarker results show: a high API gravity of 40.2 (shale); high
saturate/aromatic (shale); carbon preference index >1(shale); a value of 0.87
(a medium-high value, so cannot fully suggest “carbonates”) for the ratio of
pristane/phytane (marine); pristine/nC17 is 0.15 (marine).
Fig. 5.6 Early Cambrian Huqf formation is a carbonate source rock (Grantham
et al., 1988; Pollastro, 1999; Terken et al., 2001) and the results show: low API
gravity (carbonate); low saturate/aromatic value (carbonate); low
pristane/phytane (carbonate).
Fig. 5.7 Ordovician Red River formation is a marine shale (Hatch et al., 1987;
Pancost et al., 1999) and the results show: high API gravity (shale); CPI >1
(shale); C29/hopane is low~0.53 (shale); pristine/nC17 is 0.06 (marine);
pristane/phytane <2 (marine).
Fig. 5.8 Lower Silurian Qusaiba Shale is part of a source unit that occurs
across the northern African and Arabian cratons (Cole et al., 1994a; Cole et al.,
1994b; Jones and Stump, 1999; Tissot et al., 1984), and the depositional
environment was marine (Tyson, 1995). The results show: high API gravity
value, high saturate/aromatic value, and high pristane/phytane value (shale);
oleane/hopane is 0 (marine).
Fig. 5.9 There are uncertainties as to the source rock of this oil, but the favored
theory is that the majority of oil originated from the Devonian Lacustrine Old
Red sandstone formation (Peters et al., 1989; Peters et al., 1999). Another

46
theory is that the source is Devonian shale with marine incursions (Bailey et al.,
1990; Marshall, 1996). The results show: high API gravity, high
saturate/aromatic, pristane/phytane (shale); pristane/phytane 2.17 (lacustrine);
low oleananes (marine and lacustrine).
Fig. 5.10 The Mississippian Woodford shale is a marine/anoxic (Lambert, 1993;
Lambert et al., 1994; Wang and Philip, 1997) shale source rock (Lewan, 1983;
Michels et al., 1995; Montgomery, 1990). The results show: pristane/phytane is
1.37 (marine and shale); high API gravity and high saturate/aromatic (shale).
Fig. 5.11 Permian Phosphoria formation was deposited in an environment that
favored cyclic anoxia (marine) and salinity stratification (Dahl et al., 1993). The
formation is mainly shale (Parrish, 1982; Maughan, 1993; Jewell, 1995).
However, the oil sample in the results was taken from a carbonate layer in the
formation (Peters et al., 2005), so the results would have conflicting properties
for different biomarkers. The result show: medium API gravity (carbonate); low
saturate/aromatic (carbonate); pristane/phytane id 0.71 (marine and
carbonate); pristane/nC17 is 0.39 (marine).
Fig. 5.12 The Shublik formation consists of marine carbonate, marl and
phosphorite in a transgressive, upwelling depositoinal environment (Kupecz,
1995). The test sample was from the marl (carbonate). The results show: low
API gravity and saturate/aromatic (carbonate); high sulfur wt.% (marine
carbonate); low oleananes (marine).
Fig. 5.13 The Schistes Carton is a marine shale source rock (Espitalie et al.,
1987; Katz, 1995; Disnar et al., 1996). The results show: high API gravity and
saturate/aromatic (shale); pristane/phytane is 1.43 (marine and shale);
oleananes is absent (marine).

47
Fig. 5.14 The Iabe is a marine shale source rock in the offshore Congo Delta
(Burwood, 1999; Cole et al., 2000; Schoellkopf and Patterson, 2000). The
results show: pristane/phytane is 1.23 (marine and shale).
Fig. 5.15 The source rock of this oil sample is the Miocene Heath formation
and it is marine shale (Higley, 2002). The results show: pristane/phytane is
1.59 (marine and shale); high saturate/aromatic (shale); low C29/(C30)hopane
value (shale).
6.3 Application of Biomarkers in Determining Thermal Maturity
Thermal maturity is caused by time and temperature and not the amount of petroleum
generated (Peters and Moldowan, 1993), therefore, it is wrong to conclude that a
reservoir/source rock will “dry up” based on how much production has occurred. This is why
figuring out the thermal maturity is important for exploration purposes. The basic explanation of
how biomarkers can be used to determine thermal maturity is by obtaining a ratio of two
biomarkers that deteriorate inversely (or at different rates) due to thermal maturity. Both
biomarkers need to have similar properties for the effect of time and temperature to have similar
effects on the biomarkers. An example of biomarkers used in determining thermal maturity is
the ratio of moretanes/hopanes, both biomarkers decrease relative to each other with thermal
maturity due to their chemical properties (Seifert and Moldowan, 1980). The ratio value of
moretanes/hopanes for mature oils ranges from 0.05 to 0.15 (Mackenzie et al., 1980; Seifert
and Moldowan, 1980). The value for the ratio of moretane/hopane in my results for Eagle Ford
formation is 0.11 (Figure 5.3). Other values of different biomarker ratios for determining thermal
maturity are presented in Figure 5.3 and Figure 5.4 with “M” denoted as its application. The
inferred vitrinite reflectance value of some biomarker ratios on Figure 5.3 and 5.4 are in
parenthesis next to the value.

48
Figure 6.2 Biomarker thermal maturation versus vitrinite reflectance (Peters et al., 2005). The arrows in the figure represent biomarkers in my acquired results and the correlating vitrinite
reflectance.

49
Figure 6.2 shows ranges of biomarker thermal maturity ratios versus vitinite refelctance
with a generalized oil-generation curve (after Mackenzie, 1984). The numbers on the bar show
the maximum end values, except that 10, 5, and 0 values in the Terpanes section are minimum
end values. The solid bars in Figure 6.2 are not linear to the values within; therefore, bars with
values within give a more accurate estimation as to where other value lie within the bar. For
example, in my acquired results on Figure 5.4 the value for TA28/(TA28+MA29) is 0.59 and a
vitrinite reflectance of 0.8 was estimated. Linearly 0.59 will have a vitrinite value that indicates
an earlier stage than the peak stage of oil generation on Figure 6.2 ( , this symbol is a linear
estimate of 0.59 on the bar). The maturity (M) values from my Eagle Ford sample (on Figure 5.3
and 5.4) range from 0.6-1.4% (including a vitrinite value (Ro%) on Figure 5.4 of 0.79). The
yellow arrows represent the biomarkers that have a vitrinite reflectance value approximate to
0.79. The red and green arrows represent the biomarkers that are in the early and
condensate/wet gas stages of oil generation respectively. The majority of the biomarker values
suggest that production may still occur in the reservoir when this oil sample was acquired.

50
CHAPTER 7
CONCLUSION
Biomarkers are the signature of oils. Prior to biomarker research, the source of an oil
sample was speculative. Although there are some limitations in the process of using biomarkers,
biomarkers are very important in understanding the source rock properties of oil samples. Some
more research can make biomarker parameters more accurate, and can help understand how
various variables (like temperature) alter each biomarker.
Section 5.2 contains the Eagle Ford oil sample results I acquired. The following
biomarkers from the results show a source rock characteristic of marine shale: pristane/phytane
is 1.53; diasteranes/steranes is 2.06 (high); C24 tetracyclic/C26 tricyclics is 0.22 (low);
steranes/hopanes ~ 1(high); and oleananes is absent. The absence of oleananes is a
characteristic of Cretaceous age. A value of 0.9 derived from the ratio of C28/C29 steranes in
Section 5.2 is also a characteristic of Cretaceous age.
As stated in Discussion Section (Chapter 6), a number of the suggested parameters did
not match my results in regards to the properties of the Eagle Ford shale formation. Therefore
some more research can be done to improve those parameters so that biomarkers suggest
similar properties. A few discrepancies are expected in the values because each petroleum
system has a unique set of organic matter. Such discrepancies can be seen in biomarker
results for my Eagle Ford sample in comparison to other Eagle Ford samples (in Section 5.1
and 5.2).
Also the effect on various biomarkers by variables like temperature need to be studied
some more. The thermal maturity biomarkers in my results from the Eagle Ford shale show my
sample is in the peak and late stage of generation. This may be due to the different properties
of the biomarkers; therefore, the vitrinite reflectance should be altered so that the values infer

51
similar stages of oil generation. Another variable may be thermal stress, and this variable and
others should all be studied further to have more accurate parameters.
Finally, my results of the Eagle Ford sample provided tables showing a detailed list of
detected compounds. Detailed tables and traces should be made available to the public to
further the study of biomarkers.

52
REFERENCES
Bailey, N.J.L., R. Burwood, and G.E. Harriman. 1990. Application of pyrolyzate carbon isotope
and biomarker technology to organofacies definiition and oil correlation problems in North Sea
basins. Organic Geochemistry, 16:1157-1172.
Burwood, R. 1999. Angola: source rock control for Lower Congo coastal and Kwanza Basin
petroleum system. In: The Oil and Gas Habitat of the South Atlantic (N. Cameron, R.H. Bate
and V. Clure, eds.), Geological Society of London, London, 181-194.
Cole, G.A., M.A. Abu-Ali, S.M. Aoudeh, et al. 1994. Organic geochemistry of the Paleozoic
petroleum system of Saudi Arabia. Fuel, 8:1425-1442.
Cole, G.A., H.I. Halpern, and S.M. Aoudeh. 1994. The relationships between iron-sulfur-carbon
and gamma-ray response, Silurian basal Qusaiba Shale, northern Saudi Arabia. Saudi Aramco
Journal of Technology, 95:9-19.
Cole, G.A., A.G. Requejo, D. Ormerod, Z. Yu, and A. Clifford. 2000. Petroleum geochemical
assessment of the Lower Congo Basin. In: Petroleum System of South Atlantic Margins (M.R.
Mello and B.J. Katz, eds.), American Association of Petroleum Geologists, Tulsa, Ok, 325-339.
Connan, J. 1981. Biological markers in crude oils. In: Petroleum Geology in China (J.F. Mason,
ed.), Penn Well, Tulsa, OK, pp. 48-70.
Connan, J., and D. Dessort. 1987. Novel family of hexcyclic hopanoid alkanes (C32-C35)
occurring in sediments and oils from anoxic paleoenvironments. Organic Geochemistry, 11:103-
113.
Connan, J., J. Bouroullec, D. Dessort and P. Albrecht. 1986. The microbial input in carbonate-
anhydrite facies of a sabkha paleoenvironment from Guatemala: A molecular approach. Organic
Geochemistry, 10:29-50.

53
Dahl, J., J.M. Moldowan, and P. Sundararaman. 1993. Relationship of biomarker distribution to
depositional en; Phosphoria Formation, Montana, USA. Organic Geochemistry, 20:1001-1017.
Didyk, B.M., B.R.T. Simoneit, S.C. Brassell, and G. Eglinton. 1978. Organic geochemical
indicators of paleoenvironmental conditions of sedimentation. Nature, 272:216-222.
Disnar, J., and L.D. Stasiuk. 1996. Organic matter sedimentation in the northeast of the Paris
Basin: Consequences in the deposition of the lower Toarcian black shales. Chemical Geology,
131:15-35.
Espitalie, J., F. Marquis, and L. Sage. 1987. Organic geochemistry of the Paris Basin. In:
Petroleum Geology of Northwest Europe (J. Brooks and K. Glennie, eds.), Graham and
Trotman, London, pp. 71-86.
Fan, P., J.D. King, and G.E. Claypool. 1987. Characteristics of biomarker compounds in
Chinese crude oils. In: Petroleum Geochemistry and Exploration in the Afro-Asian Region (R.K.
Kumar, P. Dwivedi, V. Banerjie and V. Gupta, eds.), Balkema, Rotterdam, 197-202.
Filiptsov, Y.A., Y.V. Petrishina, L.I. Bogorodskaya, A.A. Kontorovich, and V.A. Krinin. 1999.
Evaluation of maturity and oil-and gas-generation properties of organic matter in Riphean and
Vendian rocks of the Baykit and Katanga petroleum regions. Geologiya i Geofizika, 40:1362-
1374.
Grantham, P.J. and L.L. Wakefield. 1988. Variations in the sterane carbon number distributions
of marine source rock derived crude oils through geological time. Organic Geochemistry, 12:61-
73.
Halpern, H.I. 1995. Development and application of Light-Hydrocarbon-Based star diagrams.
American Association of Petroleum Geologists Bulletin, 79:801-815.
Hatch, J.R., J.R. Jacobson, B.J. Witzke, et al. 1987. Possible Middle Ordovician organic carbon
isotope excursion: evidence from Ordovician oils and hydrocarbon source rocks, Mid-Continent,
and East-Central United States. American Association of Petroleum Geologists Bulletin,
71:1342-1354.

54
Higley, D.K. 2002. The Talara Basin province of northwestern Peru: Cretaceous-Tertiary total
petroleum system. Presented at the Annual Meeting of the American Association of Petroleum
Geologists, March 10-13, 2002, Houston, TX.
Holba, A.G., L.I.P. Dzou, and W.D. Masterson. 1998. Application of 24-norcholestanes for
constraining source age of petroleum. Organic Geochemistry, 29:1269-1283.
Holba, A.G., L. Ellis, L.I.P. Dzou, et al. 2001. Extended tricyclic terpanes as age discriminators
between Triassic, Early Jurassic and Middle-Late Jurassic oils. Presented at the 20th
International Meeting on Organic Geochemistry, 10-14 September, 2001, Nancy France.
Hughes, W.B. 1984. Use of thiophenic organosulfur compounds in characterizing crude oils
derieved from carbonate versus siliciclastic sources. In: Petroleum Geochemistry and Source
Rock Potential of Carbonate Rocks (J.G. Palacas, ed.), American Association of Petroleum
Geologists, Tulsa, OK, 181-196.
Jarvie, D.M., R.J., Hill, T.E.Ruble, and R.M. Pollastro, R.M. 2007. Unconventional shale-gas
system: The Mississippian Barnet Shale of north-central Texas as one model of thermogenic
shale-gas assessment. American Association of Petroleum Geology Bulletin, 91(4):475-499.
Jewell, P.W., 1995. Geological consequences of globe-encircling equatorial currents. Geology,
23:117-120.
Jones, P.J. and T.E. Stump. 1999. Depositional and tectonic setting of the Lower Silurian
hydrocarbon source rock facies, central Saudi Arabia. American Association of Petroleum
Geologists Bulletin, 83:314-332.
Katz, B.J. 1995. The Schistes Carton – the Lower Toarcian of the Paris Basin. In: Petroleum
Source Rocks, Casebooks in Earth Science (B.J. Katz, ed.), Springer-Verlag, Berlin, pp. 61-79.
Kupecz, J.A. 1995. Depositional setting, sequence stratigraphy, diagensis, and reservoir
potential of a mixed-lithology, upwelling deposit: Upper Triassic Shublik Formation, Prudhoe
Bay, Alaska. American Association of Petroleum Geologists Bulletin, 79:1301-1319.

55
Lambert, M.W. 1993. Internal stratigraphy and organic facies of the Devonian-Mississipian
Chattanooga (Woodford) Shale in Oklahoma and Kansas. In: Source Rocks in a Sequence
Stratigraphy Framework, (B.J. Katz and L.M. Pratt, eds.), American Association of Petroleum
Geologists, Tulsa, OK, 163-176.
Lambert, M.W., P.J. Burkett, W.A. Chiou, R.H. Bennett, and D.M. Lavoie. 1994. Kerogen
networks and hydrocarbon generation in the Chattanooga (Woodford) Shake of Oklahoma and
Kansas. Presented at the Annual Meeting of American Association of Petroleum Geologists,
June 12-15, 1994, Denver, CO.
Lewan, M.D. 1983. Effects of thermal maturation of stable organic carbon isotopes as
determined by hydrous pyrolysis of Woodford Shale. Geochimica et Cosmochimica Acta,
47:1471-1479.
Mackenzie, A.S. 1984. Application of biological markers in petroleum geochemistry. In:
Advances in Petroleum Geochemistry Vol.1 (J. Brooks and D.H. Welte, eds.), Academic Press,
London, pp. 115-214.
Mackenzie, A.S., C. Beaumont, and D.P. McKenzie. 1984. Estimation of the kinetics of
geochemical reactions with geophysical models of sedimentary basins and applications.
Organic Geochemistry, 6:875-84.
Maitland, J.J. 2000. Organic Chemistry. 2nd edition, W. W. Norton & Company, Inc., 500 fifth
Avenue, New York, NY 10110.
Mango, F.D. 1994. The origin of Light-Hydrocarbons in petroleum - Ring preference in the
closure of carbocyclic rings. Geochimica et Cosmochimica Acta, 58:895-901.
Marshall, J.E.A., D.A. Rogers, and M.J. Whiley. 1996. Devonian marine incursions into the
Orcadian Basin, Scotland. Journal of the Geological Society of London, 153:451-466.
Marzi, R., B.E. Torkelson, and R.K. Olson. 1993. A revised carbon preference index. Organic
Geochemistry, 20:1301-1306.

56
Maughan, E.K. 1993. Phosphoria Formation (Permian) and its resource significance in the
Western Interior, USA. Presented at the CSPG Pangeo: Global Environment and Resources
Conference, Calgary, August 15-19, 1993.
McKirdy, D.M., A.K. Aldridge and P.J.M. Ypma. 1983. A geochemical comparison of some
crude oils from Pre-Ordovician carbonate rocks. In: Advances in Organic Geochemistry 1981 (M.
Bjoroy, C. Albrecht, C. Cornford et al., eds.), John Wiley & Sons, New York, pp. 99-107.
Michels, R., P. Landais, B.E. Torkelson, and R.P. Philp. 1995. Effects of effluents and water
pressure on oil generation during confined pyrolysis and high pressure hydrous pyrolysis.
Geochimica et Cosmochimica Acta, 59:1589-1604.
Moldowan, J.M. 2000. Trails of life. Chemistry in Britain, 36:34-37.
Moldowan, J.M., J. Dahl, S.R. Jacobson, B.J. Huizinga, F.J. Fago, R. Shetty, D.S. Watt, and
K.E. Peters. 1996. Chemostratigraphic reconstruction of biofacies: Molecular evidence linking
cyst-forming dinoflagellates with pre-Triassic ancestors. Geology, 24:159-162.
Moldowan, J.M., B.J. Huizinga, J.E. Dahl, F.J. Fago, D.W. Taylor, and L.J. Hickey. 1994. The
molecular fossil record of oleanane and its relationship to angiosperms. Science, 265:768-771.
Moldowan, J.M., and S.R. Jacobson. 2000. Chemical signals for early evolution of major taxa:
biosignatures of taxon-specific biomarkers. International Geology Review, 42:805-812.
Moldowan, J.M., S.R. Jacobson, J. Dahl, A. Al-Hajji, B.J. Huizinga, and F.J. Fago. 2001.
Molecular fossils demonstrate Precambrian origin of dinoflagellates. In: Ecology of the
Cambrian Radiation (A. Zhuravlev and R. Ridings, eds), Columbia University Press, New York,
pp. 474-493.
Moldowan, J.M., W.K. Seifert, and E.J. Gallegos. 1985. Relationship between petroleum
composition and depositional environment of petroleum source rocks: American Association of
Petroleum Geologists Bulletin, 69:1255-1268.
Montgomery, S. 1990. Tight gas formation: an ongoing effort by the U.S. Department of Energy.
Petroleum Frontiers, 7:26-35.

57
Palacas, J.G. 1984. Carbonate rocks as sources of petroleum geological and chemical
characteristics and oil-source correlations. In: Proceedings of the Eleventh World Petroleum
Congress 1983, Volume 2, John Wiley & Sons, Chictester, UK, pp. 31-43.
Pancost R.D., K.H. Freeman, and M.E. Patzkowsky. 1999. Organic-matter source variation and
the expression of a late Middle Ordovician carbon isotope excursion. Geology, 27:1015-1018.
Parrish, T.J. 1982. Upwelling and petroleum source beds, with reference to Paleozoic.
American Association of Petroleum Geologists Bulletin, 66:750-774.
Peters, K.E., M.J. Clutson, and G. Robertson. 1999. Mixed marine and lacustrine input to an oil-
cemented sandstone breccia from Brora, Scotland. Organic Geochemistry, 30:237-248.
Peters, K.E., J.M. Moldowan, A.R. Driscole, and G.J. Demaison. 1989. Origin of Beatrice oil by
cosourcing from Devonian and Middle Jurassic source rock, Inner Morary Firth, UK. American
Association of Petroleum Geologists Bulletin, 73:454-471.
Peters, K.E. and J.M. Moldowan. 1993. The Biomarker Guide: Interpreting Molecular Fossils in
Petroleum and Ancient Sediments. Prentice-Hall, Englewood Cliffs, NJ.
Peters, K.E., C.C.Walters, and J.M. Moldowan. 2005. The Biomarker Guide. 2nd volume,
Cambridge Press, New York, NY, pp. 475-963.
Philp, R.P., J. Li, and C.A. Lewis. 1989. An organic geochemical investigation of crude oils from
Shanganning, Jianghan, Chaidamu and Zhungeer basins, People’s Republic of China. Organic
Geochemistry, 14:447-460.
Pollastro, R.M. 1999. Ghaba Salt Basin Province and Fahud Salt Basin Province, Oman-
geological overview and total petroleum systems. In: U.S. Geological Survey Bulletin, 2167:41.
Railroad Commission of Texas. 2012. Eagle Ford Information. Retrieved on April 3, 2012 from
http://www.rrc.state.tx.us/eagleford/index.php.
Richnow, H.H., A. Jenisch and W. Michaelis. 1992. Structural investigations of sulphur-rich
macromolecular oil fractions and a kerogen by sequential chemical degradation. Organic
Geochemistry, 19:351-370.

58
Riolo, J., G. Hussler, P. Albrecht, and J. Connan. 1986. Distribution of aromatic steroids in
geological samples: their evaluation as geochemical parameters. Organic Geochemistry,
10:981-90.
Robison, C.R. 1997. Hydrocarbon source rock variability within the Austin Chalk and Eagle Ford
Shale (Upper Cretaceous), East Texas, U.S.A. International Journal of Coal Geology, 34:287-
305.
Schoellkopf, N.B. and B. Patterson. 2000. Petroleum system of offshore Cabinda, Angola. In:
Petroleum Systems of South Atlantic Margins (M.R. Mello amd B.J. Katz, eds.), American
Association of Petroleum Geologists, Tulsa, OK, 361-176.
Seifert, W.K. and J.M. Moldowan. 1980. The effect of thermal stress on source-rock quality as
measured by hopane stereochemistry. Physics and Chemistry of the Earth, 12:229-237
Seifert, W.K. and J.M. Moldowan. 1986. Use of biological markers in petroleum exploration. In
Methods in Geochemistry and Geophysics Vol. 24 (R. B. Johns, ed.), Elsevier, Amsterdam, pp.
261-290.
Ten Haven, H.L., J.W. de Leeuw, J. Rullkotter, and J.S. Sinninghe Damste. 1987. Restricted
utility of the pristane/phytane ratio as a paleoenvironmental indicator. Nature, 330:641-643.
Ten Haven, H.L., J.W. de Leeuw, J.S. Sinninghe Damste, et al. 1988. Application of biological
markers in the recognition of palaeohypersaline environments. In: Lacustrine Petroleum Source
Rocks (A.J. Fleet, K. Kelts and M.R. Talbot, eds.), Blackwell, London, pp. 123-130.
Terken, J.M.J., N.L. Frewin, and S.L. Indrelid. 2001. Petroleum system of Oman: charge timing
and risks. American Association of Petroleum Geologists Bulletin, 85:1817-1845.
Thompson, K.F.M. 1983. Classification and thermal history of petroleumbased on light
hydrocarbons. Geochimica et Cosmochimica Acta, 47:303-316.
Tissot, B.P. and D.H. Welte. 1984. Petroleum Formation and Occurrence. Springer-Verlag, New
York.

59
Tissot, B., J. Espitalie, G. Deroo, C. Tempere, and D. Jonathan. 1984. Origin and migration of
hydrocarbons in the eastern Sahara (Algeria), In: Petroleum Geochemistry and Basin
Evaluation, (G. Demaison and R.J. Murris, eds.), American Association of Petroleum Geologists,
pp. 315-324
Tyson, R.V. 1995. Sedimentary Organic Matter: Organic Facies and Palynofacies. Chapman
and Hall, New York.
Wang, H.D. and R.P. Philip. 1997. Geochemical study of potential source rocks and crude oils
in the Anadarko Basin, Oklahoma. America Association of Petroleum Geologists Bulletin,
81:249-275.
Winters, J.C., and J.A. Williams. 1969. Microbiological alteration of crude oil in the reservoir.
American Chemical Society, Division of Petroleum Chemistry, New York Meeting Preprints, v.
14(4), p. E22-E31.
World Oil. 2012. Retrieved on June 6, 2012 from http://www.worldoil.com/Oil-NGL-and-
condensate-opportunities-lift-Eagle-Ford-Shale-activity.html.

60
BIOGRAPHICAL INFORMATION
Ugochukwu Ononogbu began a Bachelors Degree at the University of Texas at
Arlington in the spring of 2007, which he completed in the spring of 2010 with a Bachelors
Degree in Geology and a minor in Chemistry. He began pursuing a Masters Degree at the
University of Texas at Arlington and is projected to graduate in the fall of 2012 with a Masters
Degree in Geology. He has research interests in oil exploration fields ranging from structural
and sedimentary properties of reservoirs to the geochemistry of oil and gas. He has worked on
projects that encompass structural geology, sedimentary geology, paleontology, metamorphism,
petrology etc. Furthermore, he has worked on projects that directly prepare students for
professional work: seismic, mapping, and geo-steering software based projects. Ugochukwu
Ononogbu hopes to someday follow in his father’s footsteps by working for an energy producing
company.