Biomarkers of Industrial and Environmental Exposure to...
40
Natalia Tretyakova University of Minnesota Cancer Center and The Department of Medicinal Chemistry Slides Prepared for the 2014 Symposium on Understanding the Health Risks of Lower Olefins November 5, 2014 Biomarkers of Industrial and Environmental Exposure to 1,3‐Butadiene
Transcript of Biomarkers of Industrial and Environmental Exposure to...

Natalia TretyakovaUniversity of Minnesota Cancer Center and The Department of Medicinal Chemistry
Slides Prepared for the 2014 Symposium on Understanding the Health Risks of Lower Olefins
November 5, 2014
Biomarkers of Industrial and Environmental Exposure to
1,3‐Butadiene

Central dogma of chemical carcinogenesis
Adapted from Tsunehiro Oyama et al. Frontiers in Bioscience , 9, 1967‐1976, 2004, Hecht, S. S. J. Natl. Cancer Inst. 91, 1194‐1210
Carcinogens
DNA Adducts
Nucleus
Detoxifiedmetabolites
Excretion
Mutations:Persistence &
miscoding
Alteredk-ras,p53 Cancer
Sources of human exposure to BD
Automobile exhaust~0.1‐10 ppb in urban air
Occupational exposure(0.5‐1.0 ppm)
20‐75 µgper cigarette
~ 0.15 ppb Wood burningforest fires

Metabolism of 1,3-Butadiene
S Kotapati et al. Chem. Res. Toxicol. 2011, 24, 1516–1526; Van Sittert et al. Toxicol. Sci. 2000, 56, 189–202; S Kotapati et al. Carcinogenesis. 2014;35(6):1371‐8.
1,3-Butadiene
P450 2E1,2A6
O
P450 2E1,2A6
O
O
EpoxideHydrolase
OHO
OH
3,4-epoxy-1-butene (EB)
1,2,3,4-diepoxybutane (DEB)
3,4-epoxy-1,2-butanediol (EBD)
1-butene-3,4-diol(EB-diol)
HOOH
SNH
O OH
O
OH
SNH
O OH
OOH
MHBMA
SNH
O OH
O
OH
OHSHN
HO O
O
bis-BDMA
SNH
O OH
O
OHOH
OH
THBMA
GST
MA pathway
GST
MA pathway
GST
MA pathway
HOO
HMVK
ADH
HOOH S
NH
O OH
O
DHBMA
GST MA pathway
> =Mutagenicity

Interspecies differences in sensitivity to BD‐mediated cancer
• Laboratory mice develop tumors following exposure to 6.25 ppm BD, while rats require 200‐fold higher concentrations.
This may be explained by a more efficient formation of DEB in mice:
Higher amounts of DEB are detected in blood of BD‐exposed mice.
Filser et al. Chem. Biol. Interact. 166, 93‐103 (2007)
Greater amounts of DEB‐globin adducts are found in mice.
Boysen et al. Chem. Biol. Interact. 166, 84‐92 (2007)

Individuals and ethnic groups may differ in respect tometabolic activation and deactivation of BD, leading to andifferences in formation of DNA‐reactive BD intermediates/modified risk.
RISK
detoxification
Bioactivation
What determines individual susceptibility to BD?
O
Odiepoxybutane
O
3,4-epoxy-1-buteneOH
HO
1-butene-3,4-diol
BD

Genetic polymorphisms in BD Metabolizing Genes
Protein Variant Changes to Genotype/Phenotype
GSTT1 12-14
rs11550605 A>C Thr104Pro; decreased protein expression
rs199521920 C>T in exon 2 Asp43Asn; decreased protein expression
C>T in exon 2 Thr65Met; decreased protein expression
CYP2E1 15-16
rs6413432 A>T in intron 6; introduces Dra1 siters3813867 G>C in 5’ upstream region; introduces Pst1 siters2031920 C>T in 5’ upstream region; removes RsaI site
EPHX1 8rs1051740 T>C in exon 3 Tyr113His; decreased protein
activity
rs2234922 A>G in exon 4 His139Arg; increased protein activity

Ethnic differences in incidence of genetic polymorphisms in xenobiotic‐metabolizing gene
(percentages)GSTM1-1
NullGSTT1-1
Null Slow EH Fast EHLow
CYP2E1 Activity
LowCYP2A6 Activity
European American 52 7 14.7 7 27.9 8 19.1 8 1 7 21.5 9
AfricanAmerican 27 7 21.8 7 20.8 8 28.9 8 4 7 2.5 9
Japanese 48.6 7 44.3 11 44 10 14 10 19.3 7 48 9
Wormhoudt, L. W. et al. Crit. Rev. Toxicol. 1999, 29, 59‐124.London, S. J. et al. Lung Cancer. 2000, 28, 147‐155.Fernandez‐Salguero, P. et al. Am. J. Hum. Gent. 1995, 57, 651‐660.Yoshikawa, M. et al. Int. J. Mol. Med. 2000, 5, 49‐53.

Goals of this work
• Develop biomarkers of human exposure to BD (urinary metabolites, DNA adducts)
• Evaluate BD exposure in general population, smokers, and occupationally exposed workers
• Investigate ethnic and individual variability in BD metabolism/DNA adduct formation.

Urinary Metabolites of 1,3-Butadiene
S Kotapati et al. Chem. Res. Toxicol. 2011, 24, 1516–1526; Van Sittert et al. Toxicol. Sci. 2000, 56, 189–202; S Kotapati et al. Carcinogenesis. 2014;35(6):1371‐8.
1,3-Butadiene
P450 2E1,2A6
O
P450 2E1,2A6
O
O
EpoxideHydrolase
OHO
OH
3,4-epoxy-1-butene (EB)
1,2,3,4-diepoxybutane (DEB)
3,4-epoxy-1,2-butanediol (EBD)
1-butene-3,4-diol(EB-diol)
HOOH
SNH
O OH
O
OH
SNH
O OH
OOH
MHBMA
SNH
O OH
O
OH
OHSHN
HO O
O
bis-BDMA
SNH
O OH
O
OHOH
OH
THBMA
GST
MA pathway
GST
MA pathway
GST
MA pathway
HOO
HMVK
ADH
HOOH S
NH
O OH
O
DHBMA
GST MA pathway
GST: Glutathione‐S‐transferase, ADH: Alcohol dehydrogenase Metabolic Ratio = MHBMA/(MHBMA + DHBMA)
• Inversely proportional to epoxide hydrolase activity• Higher ratio suggests higher risk

Mass Spectrometry Based Quantitation of Urinary BD-Mercapturic Acids
Urine Aliquot (100 μL)
Solid Phase Extraction (Isolute ENV+ 1ml/50 mg)
Add internal standard(60 ng each of deuterium labeled MA)
HPLC- ESI-- MS/MS analysis
ISTD
Analyte
MHBMA and DHBMA: Varian Pursuit 3 Diphenyl column 2.1 x 150THBMA and bis-BDMA: SIELC Primesep D 2.1 x 100

HPLC‐MS/MS method for MHBMA and DHBMA
Range(ng/ml)
LOD (ng/ml)
LOQ(ng/ml)
Intra‐dayprecision (%)
Inter‐dayPrecision (%)
Accuracy (%) Extraction recovery (%)
5‐16,000 1 5 0.88 1.17 98.04 46

Representative HPLC‐ESI‐MS/MS Traces for MHBMA and DHBMA in Human Urine
0 2 4 6 8 10 12 14 16 18 20 22 24 26 28 30Time (min)
0
20
40
60
80
100
Rel
ativ
e Ab
unda
nce
0
20
40
60
80
100
Rel
ativ
e Ab
unda
nce
0
20
40
60
80
100
Rel
ativ
e Ab
unda
nce
0
20
40
60
80
100
Rel
ativ
e Ab
unda
nce
RT: 13.29
RT: 12.85
RT: 8.37
RT: 8.09
MHBMA232.1 103.1
2H6-MHBMA238.1 109.1
DHBMA257.1 78.1
2H7-DHBMA250.1 75.1
MHBMA
OH
SHN
O OHO
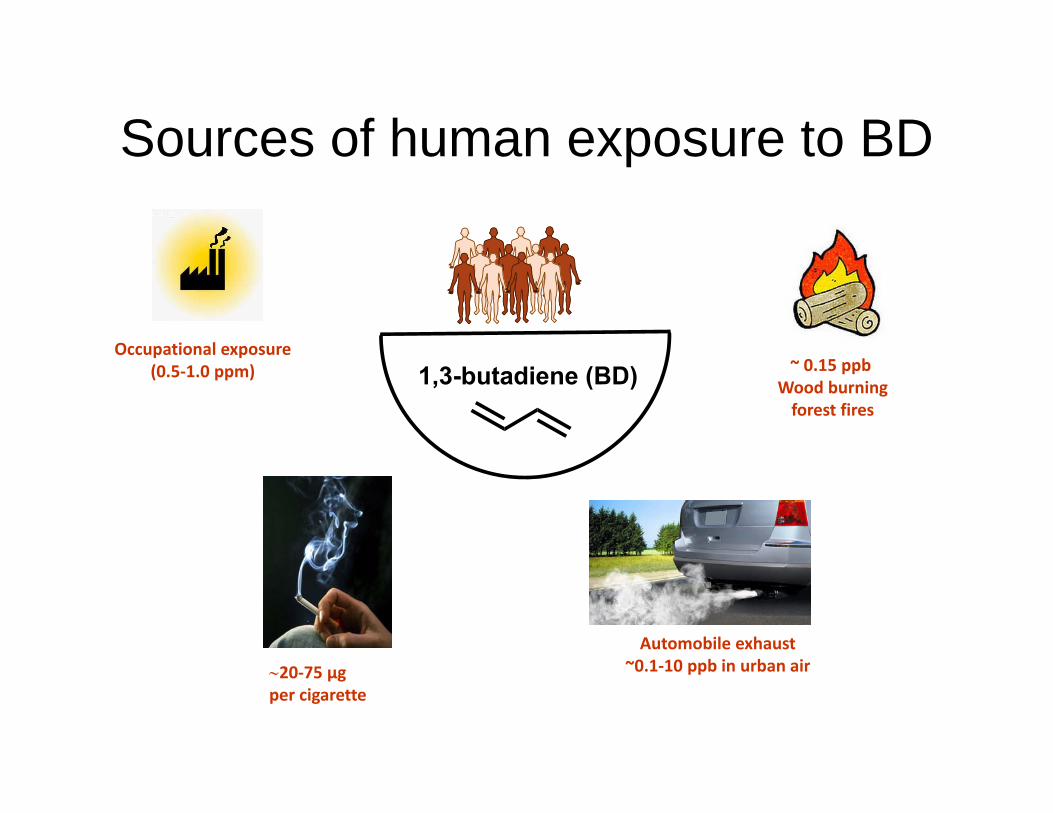
The levels of all BD-mercapturic acids in rat urine increase linearly with BD exposure
Rat urine samples provided by Dr. Vernon Walker(University of Vermont)
Kotapati, S. et al. Carcinogenesis 35(6):1371-8 (2014)
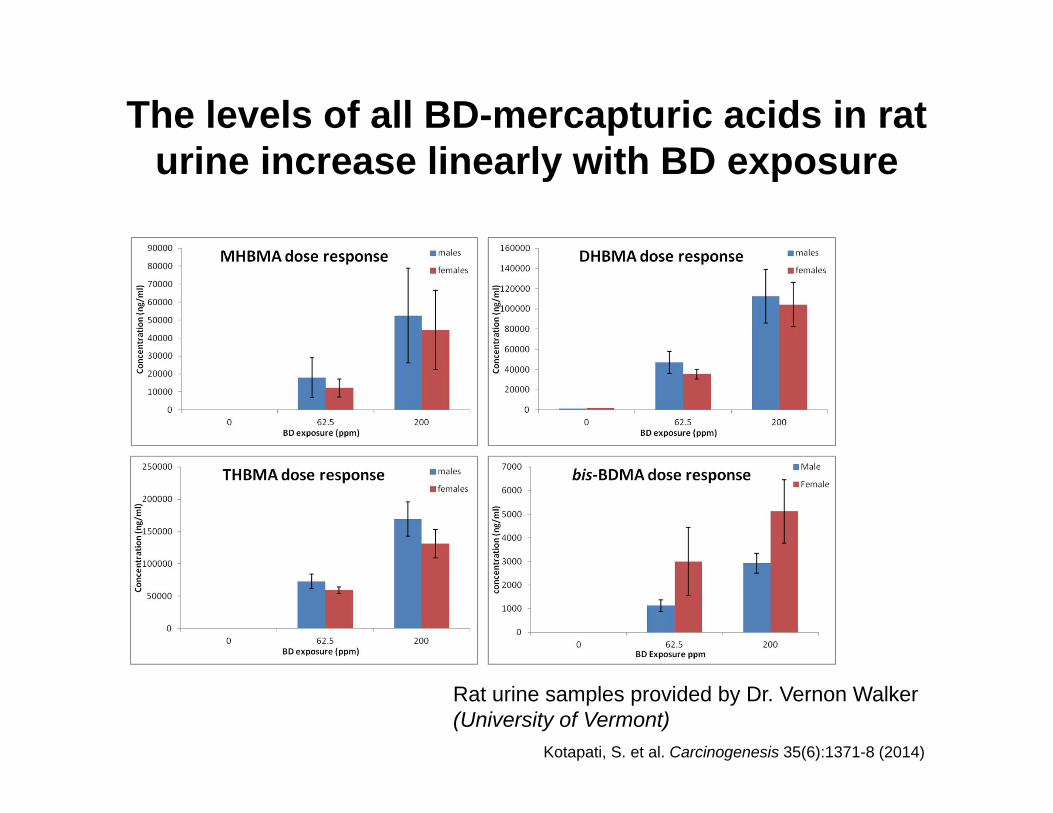
DEB-derived bis-BDMA was detected in the urine of F344 rats exposed to BD, but not in humans
Control rat Rat exposed to 62.5 ppm BD
Occupationally exposed worker (2 ppm)
Kotapati, S. et al. Carcinogenesis 35(6):1371-8 (2014)

First detection of THBMA in humans
Kotapati, S. et. al. Chem Res Toxicol. 2011, 24, 1516–1526.16
HO
OH
OH
S
HN
O OHO

Association of urinary BD-mercapturicacids with exposure
Kotapati, S. et al. Carcinogenesis 35(6):1371-8 (2014)
MHBMA is associated with BD exposure, but the correlation is weak for DHBMA and THBMA

BD-urinary acids in urine of occupationally exposed workers
Concentrations (ng/ml)
N BD exposure (mg/m3)
MHBMA DHBMA THBMA Metabolic Ratio
Males
Controls 21 0.007 ± 0.005 9.9 ± 11 1480 ± 968 58 ± 33 0.007 ± 0.008Exposed 16 0.68 ± 0.41 96 ± 111 3136 ± 2560 139 ± 104 0.027 ± 0.026
Females
Controls 19 0.007 ± 0.005 3.1 ± 4.8 561.2 ± 531.5 24.2 ± 16.6 0.006 ± 0.007Exposed 16 0.32 ± 0.34 8.3 ± 8.1 716.1 ± 830.7 47.4 ± 70.9 0.017 ± 0.012
• Significantly higher concentrations of BD‐mercapturic acids in urine of exposed workers• Greater increase in males vs females• Large amounts of BD‐mercapturic acids detected in unexposed controls• No bis‐BDMA detected in human urine
Kotapati, S. et al. Carcinogenesis 35(6):1371-8 (2014)
Czech cohort (Albertini et al. Chemico‐Biological Int. 166 (2007) 63‐77)

Relative concentrations of BD‐mercapturic acids in urine of BD‐exposed rats and in human smoker urine
Kotapati, S. et al. Carcinogenesis 35(6):1371-8 (2014)
Rats (62.5 ppm BD) Humans (1- 2 ppm BD)
MHBMA
OH
SHN
O OHO
THBMA
HO
OH
OH
S
HN
O OHO
• Humans excrete a lot of DHBMA • bis‐BDMA is undetectable in human urine

Ethnic differences in excretion of urinary BD‐mercapturic acids
MHBMA
Group N Mean ± SD (nmol/mg) P‐value
Afr. Am. 346 10.87 ± 8.3 0.0002
Jap. Am. 380 9.64 ± 19.8 < 0.0001
Eur. Am. 426 14.3 ± 12.6 ‐
DHBMA
Group N Mean ± SD (nmol/mg) P‐value
Afr. Am. 346 611.85 ± 436.6 0.0142
Jap. Am. 380 806 ± 974.6 0.7425
Eur. Am. 426 725.22 ± 703.5 ‐
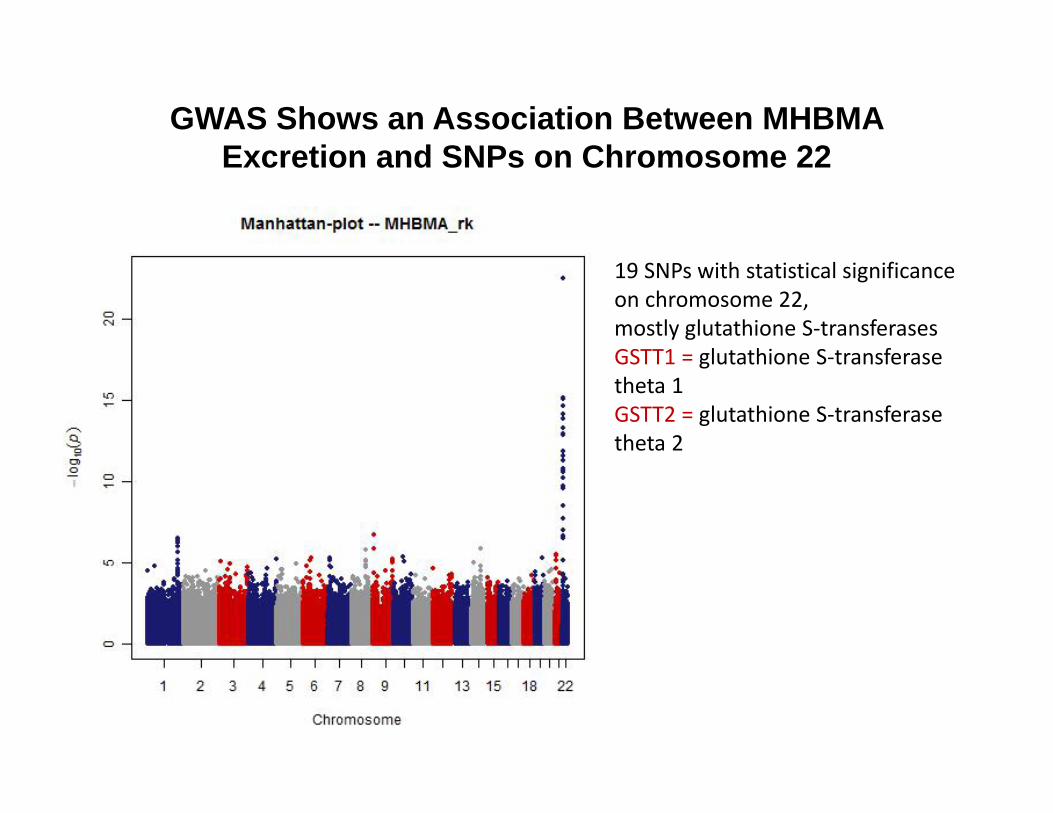
GWAS Shows an Association Between MHBMA Excretion and SNPs on Chromosome 22
19 SNPs with statistical significanceon chromosome 22, mostly glutathione S‐transferasesGSTT1 = glutathione S‐transferasetheta 1 GSTT2 = glutathione S‐transferasetheta 2

DHB‐Lys: a Novel DEB‐Specific Urinary Biomarker

0 5 10 15 20 25 30 35 40 45 50Time (min)
0
10
20
30
40
50
60
70
80
90
100
Relativ
e Ab
undance
0
10
20
30
40
50
60
70
80
90
100
Relativ
e Ab
undance
26.58
27.23
1.83
30.0332.23
26.58
1.41
27.2432.1126.1121.75
233.12 130.11
233.12 188.14
Detection of DHB-Lys in Smoker’s Urine

1,3-Butadiene- Induced DNA adducts: Biomarkers of risk
Exp Pathol. 1989;37(1‐4):108‐13; Atmospheric Environment 2006 40, 170–181;Chem Biol Interact 2007 166(1‐3):44‐51; Chem. Res. Toxicol. 2007, 20, 839‐847; Chem. Res. Toxicol. 2008, 21, 1163–1170; Chem. Res. Toxicol. 2010, 23, 808–812; Chem. Res. Toxicol. 2013, 26, 1486−1497.
NH
NN
N
O
NH2
OH
HO
OH
N7-THBG
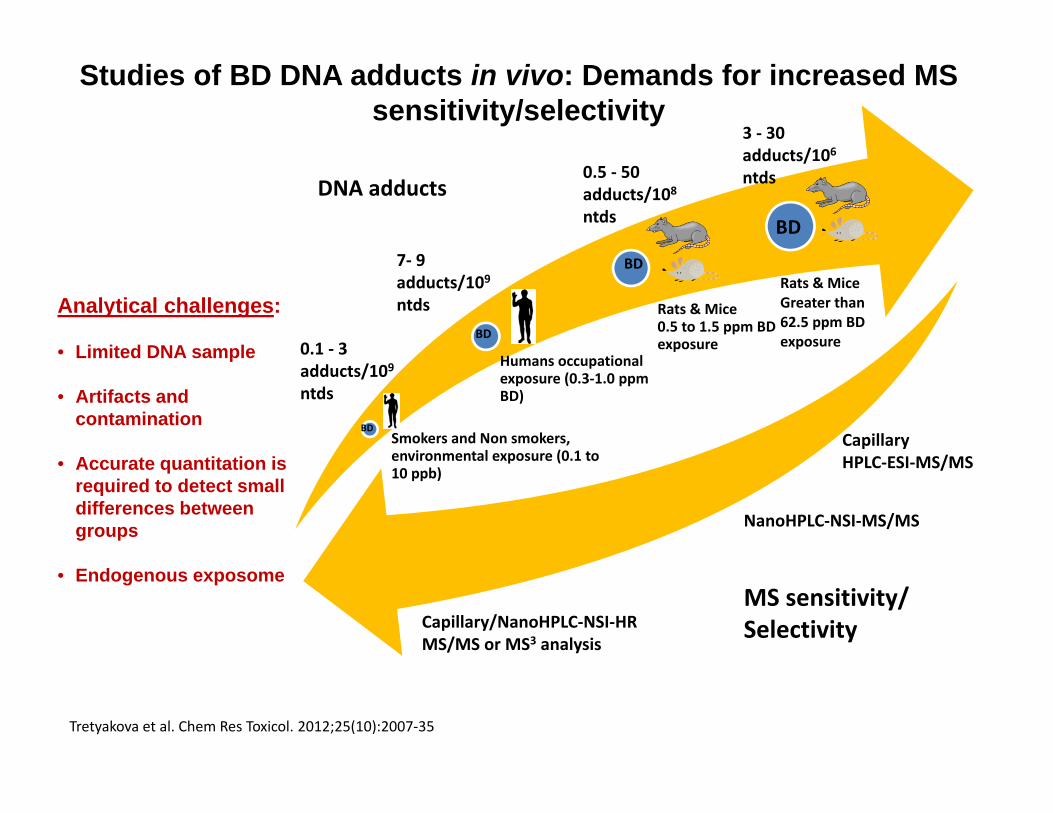
Studies of BD DNA adducts in vivo: Demands for increased MS sensitivity/selectivity
Analytical challenges:
• Limited DNA sample
• Artifacts and contamination
• Accurate quantitation is required to detect small differences between groups
• Endogenous exposome
Smokers and Non smokers, environmental exposure (0.1 to 10 ppb)
Humans occupational exposure (0.3‐1.0 ppm BD)
Rats & Mice0.5 to 1.5 ppm BD exposure
Rats & MiceGreater than 62.5 ppm BD exposure
DNA adducts
MS sensitivity/Selectivity
BD
BD
BD
BDCapillary HPLC‐ESI‐MS/MS
NanoHPLC‐NSI‐MS/MS
Capillary/NanoHPLC‐NSI‐HR MS/MS or MS3 analysis
0.1 ‐ 3 adducts/109ntds
0.5 ‐ 50 adducts/108ntds
3 ‐ 30 adducts/106ntds
7‐ 9 adducts/109ntds
Tretyakova et al. Chem Res Toxicol. 2012;25(10):2007‐35

Sample preparation procedure for the quantitation of N7-guanine DNA adducts
Tretyakova et al. Chem Res Toxicol. 2012;25(10):2007‐35
Stable isotopelabeled internal
standard
Neutral Thermal Hydrolysis and Ultra‐filtration
Isotope dilution MS analysis
analyte
Internal standard
NH
NN
N
O
NH2
R
OO
O
NH
NN
N
O
NH2
R
OO
OH2O
NH
NN
N
O
NH2
OO
O
OH R

HPLC-ESI+-HRMS/MS analysis of N7-THBG in leukocyte DNA of a smoker and an occupationally BD exposed worker
Sangaraju, D et al. Chem Res Toxicol. 2013 Oct 21;26(10):1486-97
Sample matrix
LOQ Range Accuracy Intra/interdayprecision
DEB treated HT1080 cells (1-100 µM)
Control DNA from HT1080 cells
1.0 fmol/150 µg of DNA (2 adducts/109
nucleotides)
1.0 - 50 fmol(Y =1.059 X, R2= 0.9989)
92.3 ± 6.7 (N = 5)
%CV < 13% y = 9.4252x + 2.4797R² = 1(Endogenous levels: 2.03 fmol/150 µg DNA)
Occupationally exposed worker Smoker
NH
NN
NO
NH2
(N7-THBG)
M = 152. 05669
[M+H]+ = 256.1M= 135.03014
HO
HO
OH
H+

N7-THBG concentrations in leukocyte DNA of BD exposed humans
Sangaraju, D et al. Chem Res Toxicol. 2013 Oct 21;26(10):1486-97

Isotope dilution NanoLC/ESI+-HRMS3 analysis of EB-GII adducts
Nanoflow LC300 nL/min
MS1 MS2 MS3
Sangaraju, D et al. J Am Soc Mass Spectrom. 2014 Jul;25(7):1124-35.

EB-GII quantitation in liver of BD-exposed rats
EB-GII formation in liver tissue DNA of F344 rats exposed to BD (0.5, 1, 1.5 ppm) for 2
weeks (5 days per week) EB-GII adducts in liver DNA of a F344 rat exposed
to 1.0 ppm BD by inhalation for 2 weeks
Sangaraju, D et al. J Am Soc Mass Spectrom. 2014 Jul;25(7):1124-35.
Sample matrix
LOD LOQ Range Accuracy Intra/interdayprecision
NonsmokerBlood DNA
0.02 fmol/150 µg DNA
0.2 fmol/150 µg of DNA (0.4 adducts/109
nucleotides)
0.2 - 10 fmol(Y = 0.905 X,R2 = 0.995)
92.9 ± 7.1 (N=9)
%CV < 8%

Attempted quantitation of EB-GII in blood leukocyte DNA of smokers and nonsmokers
EB-GII levels are either equal or below the Limit of quantitation of the method (0.2 fmol in 150µg of DNA)!
SmokerEB-GII222.1 152.1 135.0301, 153.0407
0.15 fmol
15N5-EB-GII227.1 157.1 139.0183, 157.0288
NonsmokerEB-GII222.1 152.1 135.0301, 153.0407
15N5-EB-GII227.1 157.1 139.0183, 157.0288
0.13 fmol
Sangaraju, D et al. J Am Soc Mass Spectrom. 2014 Jul;25(7):1124-35.

EB-GII in vivo half life in liver tissue DNA of F344 rats exposed to 1250 ppm BD
t½= 2.20 ± 0.12 days
Hydrolysis/DNA adduct repair
Urinary excretion!
Sangaraju, D et al. J Am Soc Mass Spectrom. 2014 Jul;25(7):1124-35.
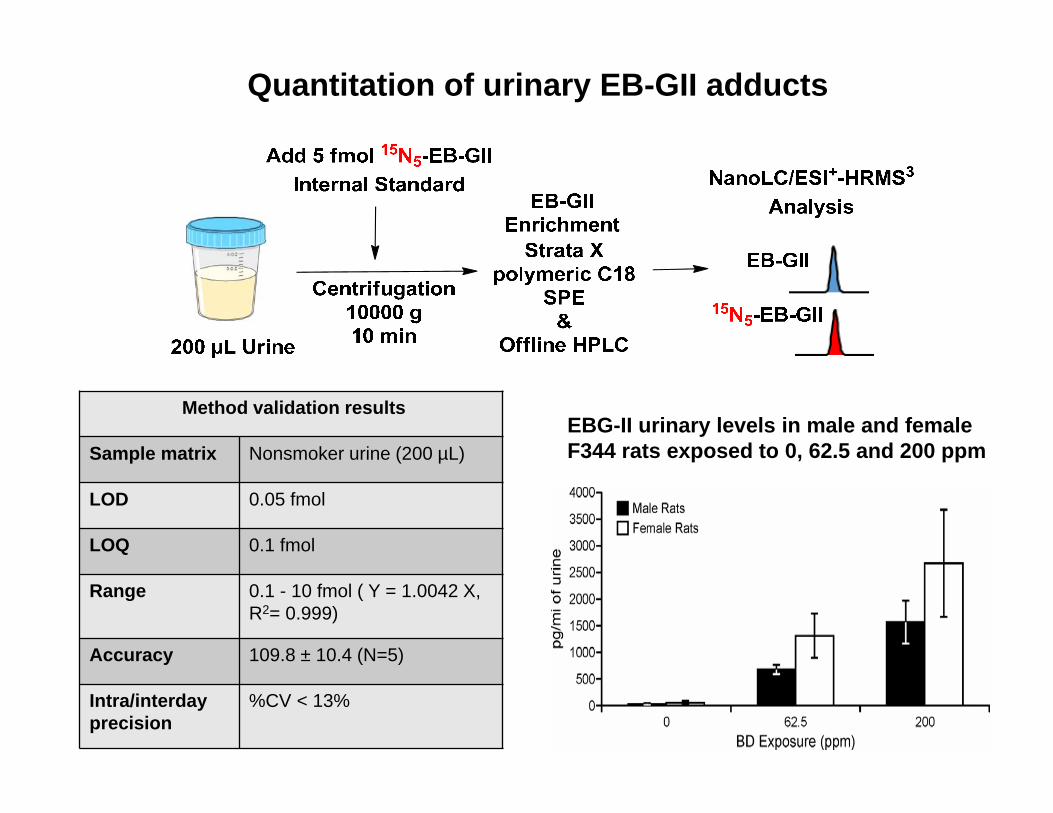
Quantitation of urinary EB-GII adducts
Method validation results
Sample matrix Nonsmoker urine (200 µL)
LOD 0.05 fmol
LOQ 0.1 fmol
Range 0.1 - 10 fmol ( Y = 1.0042 X,R2= 0.999)
Accuracy 109.8 ± 10.4 (N=5)
Intra/interdayprecision
%CV < 13%
EBG-II urinary levels in male and female F344 rats exposed to 0, 62.5 and 200 ppm

NanoLC/ESI+-HRMS3 analysis of EB-GII in urine of smokers and occupationally exposed workers
Smoker
EB-GII222.1 152.1 135.0301, 153.0407
15N5-EB-GII227.1 157.1 139.0183, 157.0288
0.34 fmol0.50 fmol
Occupational BDExposed worker
EB-GII222.1 152.1 135.0301, 153.0407
15N5-EB-GII227.1 157.1 139.0183, 157.0288

Urinary EB-GII concentrations in occupational BD exposed workers vs administrative controls, nonsmokers vs smokers
1.24 ± 2.31
Group T-test , p = 0.08
1.78 ± 2.81
(N = 28) (N = 29)
0
2
4
6
8
10
12
14
nonsmokers smokers
EB-G
II (p
g/m
g cr
eatin
ine)
0.006 ± 0.002 ppm BD 0.46 ± 0.51 ppm BD(N = 28) (N = 23)
Occupational BD exposure (ppm)
2.94± 3.54
Group T-test, p = 0.0051
0.93 ± 1.85
0
2
4
6
8
10
12
Controls Exposed
EB-G
II (p
g/m
g cr
eatin
ine)

Ethnic/racial differences in the formation of butadiene-DNA adducts upon exposure to BD

Racial/ethnic differences in urinary EB-GII excretion
Metabolicbioactivation
Detoxification
CancerRisk
Haiman, C. A. et. al. N. Engl. J. Med. (2006), 354, 333-342.
0
0.2
0.4
0.6
0.8
1
1.2
1.4
1 2
European Americans
African Americans
Genotyping in progress to identify the origins of ethnic differences
P <0.0001

Conclusions
1. Several new biomarkers of exposure to BD have been developed and applied to smokers, occupationally exposed workers, and controls.
2. Urinary BD-mercapturic acids and BD-DNA adducts are associated with exposure.
3. Interspecies and ethnic/interindividualdifferences in BD metabolism have been revealed.
4. “Unexposed” individuals contain significant numbers of BD-DNA adducts and excrete BD-mercapturic acids.

Future Directions
1. Evaluate DHB-Lys as a novel DEB-specific urinary biomarker.
2. Identify the origins of endogenous THBMA, DHBMA, THB-Gua, and EB-Gua.
3. Quantify DEB-derived metabolites and DNA adducts in rats, mice, and humans exposed to sub-ppm concentrations of BD.

Students: Melissa Goggin, Srikanth Kotapati, Dewakar Sangaraju, Emily Boldry
Funding:American Chemistry Council, NIH P01 CA-138338, R01-CA-100670
Acknowledgements
Special thanks to: Kimberly Wise (American Chemistry Council Olefins Panel)Richard J. Albertini (University of Vermont)
Animal Tissues: James A. Swenberg (UNC), Vernon Walker (Univ. of Vermont)
Human urine and blood samples: Univ. of Minnesota Biorepository, American Chemistry Council Olefins Panel and Richard J. Albertini (University of Vermont)