![Association of Diagnostic Stroke Biomarkers with Post ... · and also prevents the cognitive impairment [28-30]. PARK7 protein and nucleoside diphosphate kinase A in the spinal fluid](https://static.fdocuments.in/doc/165x107/5f1da24c69249043e71d8f45/association-of-diagnostic-stroke-biomarkers-with-post-and-also-prevents-the.jpg)
Biomarkers of Fish Consumption and Risk of Stroke or - DiVA
49
Biomarkers of Fish Consumption and Risk of Stroke or Myocardial Infarction Maria Wennberg Department of Public Health and Clinical Medicine, Occupational and Environmental Medicine, Umeå University Umeå 2010
Transcript of Biomarkers of Fish Consumption and Risk of Stroke or - DiVA
Biomarkers of Fish Consumption and
Risk of Stroke or Myocardial Infarction
Maria Wennberg
Department of Public Health and Clinical Medicine, Occupational and Environmental Medicine, Umeå University Umeå 2010

Copyright © 2010 by Maria Wennberg New series No. 1356, ISSN: 0346-6612 ISBN: 978-91-7459-0008-1 Front page picture from http://bookshop.europa.eu/ with permission from www.scandfish.com Printed by: Print & Media, Umeå, Sweden 2010

“The dose makes the poison”
Paracelsus 1493-1541
1
CONTENTS
ABSTRACT ........................................................... 4
SUMMARY IN SWEDISH – SAMMANFATTNING PÅ
SVENSKA ............................................................. 6
ABBREVIATIONS ................................................. 7
ORIGINAL PAPERS .............................................. 8
INTRODUCTION .................................................. 9
Cardiovascular disease ......................................................................................................................... 9
Atherosclerosis .......................................................................................................................................... 9
Stroke ........................................................................................................................................................... 9
Myocardial Infarction............................................................................................................................... 9
Fish consumption and cardiovascular disease ...................................................................... 10
Mechanisms for EPA and DHA affecting cardiovascular risk .................................................. 10
Triglyceride-lowering ............................................................................................................................. 11
Blood pressure-lowering ...................................................................................................................... 11
Heart Rate-lowering .............................................................................................................................. 11
Antiarrhythmic effects .......................................................................................................................... 11
Antiinflammatory effects ..................................................................................................................... 11
Decreased platelet aggregation ........................................................................................................ 12
Atherosclerotic plaque stabilization ................................................................................................. 12
Previous studies on consumption of fish or marine omega-3 fatty acids and
risk of cardiovascular disease ........................................................................................................ 12
Randomized controlled trials .............................................................................................................. 12
Reviews ...................................................................................................................................................... 12
Selenium and cardiovascular disease ........................................................................................ 13
Methylmercury ......................................................................................................................................... 13
Sources of pollution ............................................................................................................................... 13
Transmission of mercury ..................................................................................................................... 13
Dietary sources of methylmercury................................................................................................... 14
Health effects of methylmercury .................................................................................................. 14
Cardiovascular effects of methylmercury ...................................................................................... 14
Biomarkers of fish consumption – EPA+DHA and methylmercury ........................... 15

2
Gender differences ................................................................................................................................ 15
OBJECTIVES .......................................................17
MATERIAL AND METHODS ..................................18
Study population .................................................................................................................................... 18
The Northern Sweden MONICA Study ........................................................................................ 18
The Västerbotten Intervention Program .................................................................................. 18
Selection bias ........................................................................................................................................... 18
The health examination in the Northern Sweden MONICA Study and the Västerbotten
Intervention Program ............................................................................................................................ 19
Blood samples in the Northern Sweden MONICA Study and the Västerbotten
Intervention Program ............................................................................................................................ 19
The Mammography Screening Project ....................................................................................... 19
Study design and study subjects .................................................................................................. 19
Paper 1 ....................................................................................................................................................... 19
Paper 2 ....................................................................................................................................................... 20
Papers 3 and 4......................................................................................................................................... 20
Paper 3 ....................................................................................................................................................... 20
Paper 4 ....................................................................................................................................................... 21
Study variables ........................................................................................................................................ 23
Chemical analyses ................................................................................................................................. 23
Analyses of mercury in erythrocytes .............................................................................................. 23
Analyses of fatty acids in plasma phospholipids or erythrocytes ......................................... 23
Analyses of lead, cadmium and selenium in erythrocytes ...................................................... 24
Analyses of ferritin in serum .............................................................................................................. 24
Dietary assessment - The FFQ ........................................................................................................ 24
Fish consumption .................................................................................................................................... 24
Estimation of intake of EPA+DHA from dietary data ................................................................ 25
Alcohol consumption ............................................................................................................................. 26
Consumption of fruits and vegetables ............................................................................................ 26
Background variables .......................................................................................................................... 26
Smoking ..................................................................................................................................................... 26
Diabetes mellitus .................................................................................................................................... 26
Blood pressure ......................................................................................................................................... 26
Serum cholesterol .................................................................................................................................. 26
Apolipoprotein B/ Apolipoprotein A1 ............................................................................................... 27

3
Body mass index ..................................................................................................................................... 27
Education ................................................................................................................................................... 27
Physical inactivity ................................................................................................................................... 27
Statistical analyses ............................................................................................................................... 27
Multivariate model building (papers 3 and 4) ............................................................................. 27
Ethical considerations ......................................................................................................................... 28
RESULTS WITH COMMENTS ................................29
Paper 1 ......................................................................................................................................................... 29
Lead ............................................................................................................................................................. 30
Mercury ...................................................................................................................................................... 30
Cadmium.................................................................................................................................................... 30
Ongoing and future studies ................................................................................................................ 30
Implications .............................................................................................................................................. 30
Paper 2 ......................................................................................................................................................... 31
Ongoing and future studies ................................................................................................................ 31
Implications .............................................................................................................................................. 32
Paper 3 ......................................................................................................................................................... 32
Ongoing and future studies ................................................................................................................ 32
Implications .............................................................................................................................................. 33
Paper 4 ......................................................................................................................................................... 33
Ongoing and future studies ................................................................................................................ 35
Implications .............................................................................................................................................. 36
GENERAL DISCUSSION .......................................37
Validity of exposures............................................................................................................................ 37
Methods to estimate fish consumption .......................................................................................... 37
Biomarkers of fish consumption in relation to risk ............................................................ 37
The prospective case-control design .......................................................................................... 39
Balance between good and bad in fish ...................................................................................... 39
Fish or fish oil supplements? ........................................................................................................... 40
CONCLUSIONS ...................................................41
ACKNOWLEDGEMENTS .......................................42
REFERENCES ......................................................43
4
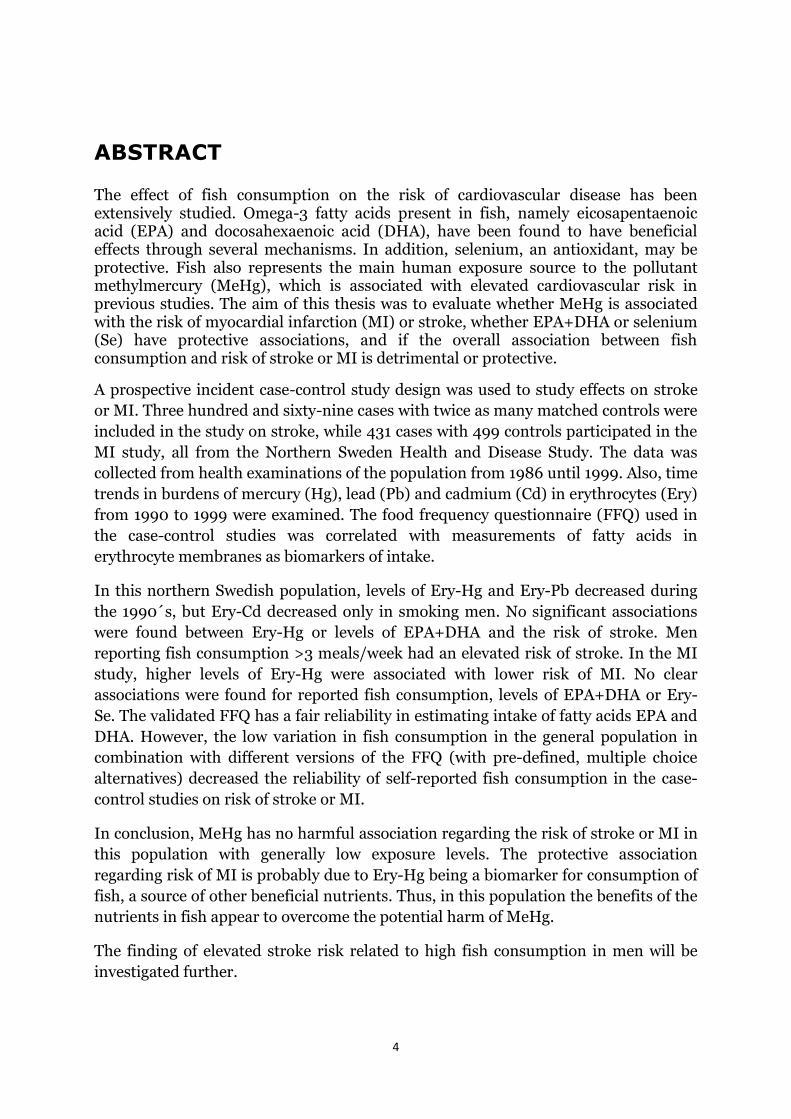
ABSTRACT
The effect of fish consumption on the risk of cardiovascular disease has been extensively studied. Omega-3 fatty acids present in fish, namely eicosapentaenoic acid (EPA) and docosahexaenoic acid (DHA), have been found to have beneficial effects through several mechanisms. In addition, selenium, an antioxidant, may be protective. Fish also represents the main human exposure source to the pollutant methylmercury (MeHg), which is associated with elevated cardiovascular risk in previous studies. The aim of this thesis was to evaluate whether MeHg is associated with the risk of myocardial infarction (MI) or stroke, whether EPA+DHA or selenium (Se) have protective associations, and if the overall association between fish consumption and risk of stroke or MI is detrimental or protective.
A prospective incident case-control study design was used to study effects on stroke
or MI. Three hundred and sixty-nine cases with twice as many matched controls were
included in the study on stroke, while 431 cases with 499 controls participated in the
MI study, all from the Northern Sweden Health and Disease Study. The data was
collected from health examinations of the population from 1986 until 1999. Also, time
trends in burdens of mercury (Hg), lead (Pb) and cadmium (Cd) in erythrocytes (Ery)
from 1990 to 1999 were examined. The food frequency questionnaire (FFQ) used in
the case-control studies was correlated with measurements of fatty acids in
erythrocyte membranes as biomarkers of intake.
In this northern Swedish population, levels of Ery-Hg and Ery-Pb decreased during
the 1990´s, but Ery-Cd decreased only in smoking men. No significant associations
were found between Ery-Hg or levels of EPA+DHA and the risk of stroke. Men
reporting fish consumption >3 meals/week had an elevated risk of stroke. In the MI
study, higher levels of Ery-Hg were associated with lower risk of MI. No clear
associations were found for reported fish consumption, levels of EPA+DHA or Ery-
Se. The validated FFQ has a fair reliability in estimating intake of fatty acids EPA and
DHA. However, the low variation in fish consumption in the general population in
combination with different versions of the FFQ (with pre-defined, multiple choice
alternatives) decreased the reliability of self-reported fish consumption in the case-
control studies on risk of stroke or MI.
In conclusion, MeHg has no harmful association regarding the risk of stroke or MI in
this population with generally low exposure levels. The protective association
regarding risk of MI is probably due to Ery-Hg being a biomarker for consumption of
fish, a source of other beneficial nutrients. Thus, in this population the benefits of the
nutrients in fish appear to overcome the potential harm of MeHg.
The finding of elevated stroke risk related to high fish consumption in men will be
investigated further.

5
Keywords: fish consumption, omega-3 fatty acids, eicosapentaenoic acid,
docosahexaenoic acid, methylmercury, selenium, lead, cadmium, stroke, myocardial
infarction, erythrocytes, food frequency questionnaire
6
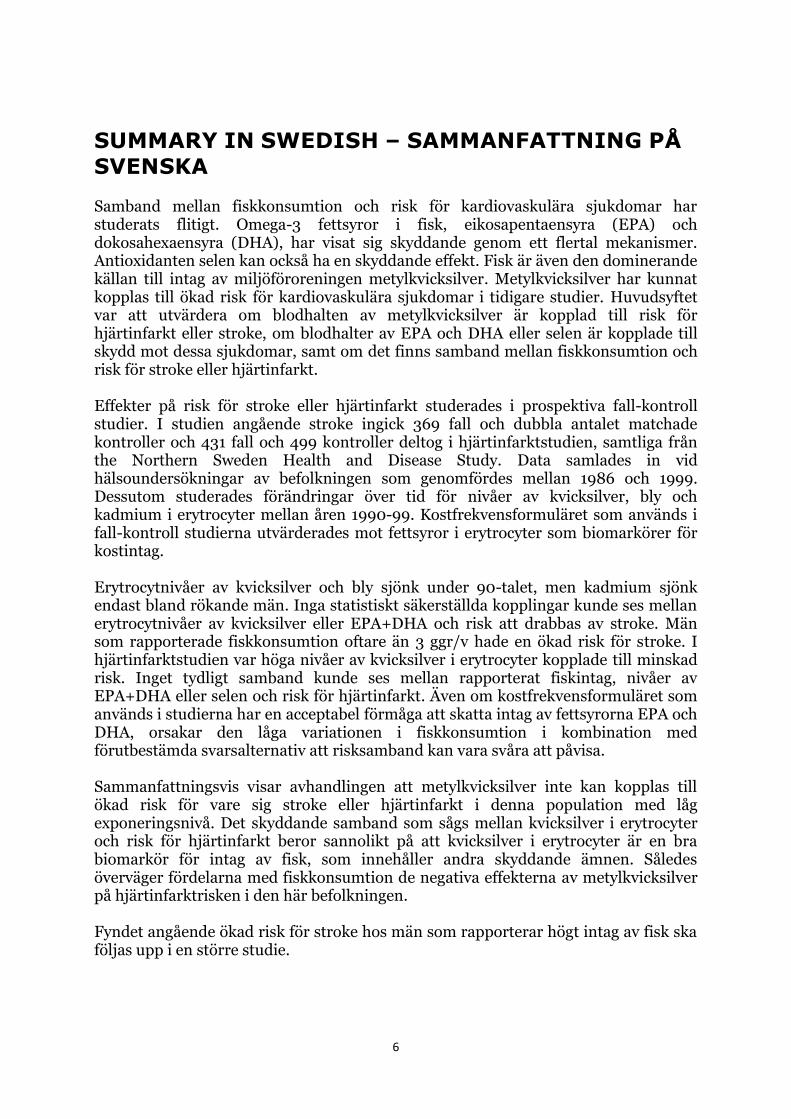
SUMMARY IN SWEDISH – SAMMANFATTNING PÅ
SVENSKA
Samband mellan fiskkonsumtion och risk för kardiovaskulära sjukdomar har studerats flitigt. Omega-3 fettsyror i fisk, eikosapentaensyra (EPA) och dokosahexaensyra (DHA), har visat sig skyddande genom ett flertal mekanismer. Antioxidanten selen kan också ha en skyddande effekt. Fisk är även den dominerande källan till intag av miljöföroreningen metylkvicksilver. Metylkvicksilver har kunnat kopplas till ökad risk för kardiovaskulära sjukdomar i tidigare studier. Huvudsyftet var att utvärdera om blodhalten av metylkvicksilver är kopplad till risk för hjärtinfarkt eller stroke, om blodhalter av EPA och DHA eller selen är kopplade till skydd mot dessa sjukdomar, samt om det finns samband mellan fiskkonsumtion och risk för stroke eller hjärtinfarkt. Effekter på risk för stroke eller hjärtinfarkt studerades i prospektiva fall-kontroll studier. I studien angående stroke ingick 369 fall och dubbla antalet matchade kontroller och 431 fall och 499 kontroller deltog i hjärtinfarktstudien, samtliga från the Northern Sweden Health and Disease Study. Data samlades in vid hälsoundersökningar av befolkningen som genomfördes mellan 1986 och 1999. Dessutom studerades förändringar över tid för nivåer av kvicksilver, bly och kadmium i erytrocyter mellan åren 1990-99. Kostfrekvensformuläret som används i fall-kontroll studierna utvärderades mot fettsyror i erytrocyter som biomarkörer för kostintag. Erytrocytnivåer av kvicksilver och bly sjönk under 90-talet, men kadmium sjönk endast bland rökande män. Inga statistiskt säkerställda kopplingar kunde ses mellan erytrocytnivåer av kvicksilver eller EPA+DHA och risk att drabbas av stroke. Män som rapporterade fiskkonsumtion oftare än 3 ggr/v hade en ökad risk för stroke. I hjärtinfarktstudien var höga nivåer av kvicksilver i erytrocyter kopplade till minskad risk. Inget tydligt samband kunde ses mellan rapporterat fiskintag, nivåer av EPA+DHA eller selen och risk för hjärtinfarkt. Även om kostfrekvensformuläret som används i studierna har en acceptabel förmåga att skatta intag av fettsyrorna EPA och DHA, orsakar den låga variationen i fiskkonsumtion i kombination med förutbestämda svarsalternativ att risksamband kan vara svåra att påvisa. Sammanfattningsvis visar avhandlingen att metylkvicksilver inte kan kopplas till ökad risk för vare sig stroke eller hjärtinfarkt i denna population med låg exponeringsnivå. Det skyddande samband som sågs mellan kvicksilver i erytrocyter och risk för hjärtinfarkt beror sannolikt på att kvicksilver i erytrocyter är en bra biomarkör för intag av fisk, som innehåller andra skyddande ämnen. Således överväger fördelarna med fiskkonsumtion de negativa effekterna av metylkvicksilver på hjärtinfarktrisken i den här befolkningen. Fyndet angående ökad risk för stroke hos män som rapporterar högt intag av fisk ska följas upp i en större studie.

7
ABBREVIATIONS
AA arachidonic acid AHA American Heart Association Apo A1 apolipoprotein A1 Apo B apolipoprotein B BMI body mass index Cd cadmium CHD coronary heart disease CI confidence interval CV coefficient of variation CVD cardiovascular disease DHA docosahexaenoic acid EFSA The European Food Safety Authority EPA eicosapentaenoic acid Ery erythrocytes FFQ food frequency questionnaire Hg mercury LDL low-density lipoprotein MeHg methylmercury MI myocardial infarction MONICA Multinational Monitoring of Trends and Determinants in
Cardiovascular Disease MSP Mammography Screening Project NSHDS Northern Sweden Health and Disease Study OR odds ratio Pb lead P-EPA+DHA sum of proportions of EPA and DHA in plasma phospholipids SCD sudden cardiac death S-cholesterol cholesterol in serum SD standard deviation Se selenium S-EPA+DHA sum of proportions of EPA and DHA in serum S-ferritin ferritin in serum TG triglyceride RCT randomized controlled trial VIP Västerbotten Intervention Program WHO World Health Organization 24-HDR twenty-four hour dietary recall

8
ORIGINAL PAPERS This thesis is based on the following papers: I. Wennberg M, Lundh T, Bergdahl I.A, Hallmans G, Jansson J-H, Stegmayr B,
Custodio H.M, Skerfving S. Time trends in burdens of cadmium, lead, and mercury in the population of northern Sweden. Environ Res. 2006;100:330-338.
II. Wennberg M, Vessby B, Johansson I. Evaluation of relative intake of fatty acids
according to the Northern Sweden FFQ with fatty acid levels in erythrocyte membranes as biomarkers. Public Health Nutr. 2009;12:1477-1484.
III. Wennberg M, Bergdahl I.A, Stegmayr B, Hallmans G, Lundh T, Skerfving S,
Strömberg U, Vessby B, Jansson J-H. Fish intake, mercury, long-chain n-3 polyunsaturated fatty acids and risk of stroke in northern Sweden. Br J Nutr. 2007;98:1038-1045.
VI. Wennberg M, Bergdahl I.A, Hallmans G, Norberg M, Lundh T, Skerfving S,
Strömberg U, Vessby B, Jansson J-H. Fish consumption and myocardial infarction: a second prospective biomarker study from northern Sweden. Submitted.

Introduction
9
INTRODUCTION
CARDIOVASCULAR DISEASE
Cardiovascular disease (CVD) is the number one cause of death globally (about 30% of deaths) (1). CVD refers to diseases that involve the heart and blood vessels. During the last decades mortality rates from CVD have decreased in both men and women in Sweden, but is still the leading cause of death. Approximately 42% of women and 41% of men in Sweden die of CVD, the two most common being ischemic heart disease (including myocardial infarction) and stroke (2).
ATHEROSCLEROSIS Atherosclerosis followed by the formation of thrombus is the major biological process causing both ischemic stroke and myocardial infarction. Oxidized low-density lipoprotein (LDL) causes damage to the arterial wall. This leads to the accumulation of macrophages and lymphocytes, followed by inflammation and the formation of an atherosclerotic plaque. Rupture of an atherosclerotic plaque can eventually lead to thrombosis (3).
STROKE Ischemic stroke accounts for about 80% of all stroke events, whereas hemorrhage (bleeding) account for about 20% (4). Ischemic stroke is caused by a blockage of arteries leading to the brain. This leads to cerebral ischemia and cell necrosis. Intracerebral hemorrhage is caused by a rupture of a cerebral artery. Non-modifiable risk factors for ischemic stroke are age, male sex and heredity. Hypertension, smoking, other CVD, dyslipidemia, diabetes mellitus, atrial fibrillation, carotid stenosis, unhealthy diet, obesity, physical inactivity and postmenopausal hormone therapy are well-documented modifiable risk factors (5). Hypertension is the main cause of hemorrhagic stroke. Weakening of the blood vessel by high blood pressure may lead to aneurysm formation, which can rupture and bleed into the brain tissue.
MYOCARDIAL INFARCTION A myocardial infarction (MI) usually occurs due to thrombus formation in a coronary artery. This leads to a severe reduction in the blood supply to part of the heart and, as a consequence, the myocardium becomes ischemic and eventually necrotic. Risk factors for MI are similar to those for ischemic stroke since atherosclerosis is the underlying biological process responsible for the diseases. Age and male sex are established non-modifiable risk factors for MI. In the INTERHEART study, a global case-control study of risk factors for acute MI, nine modifiable risk factors for MI that together account for 90% of the risk were identified. These were smoking, dyslipidemia, hypertension, diabetes mellitus, obesity, low consumption of fruit and vegetables, low physical activity, alcohol consumption (moderate consumption protective) and psychosocial factors (for example depression and perceived stress) (6).
Introduction
10
FISH CONSUMPTION AND CARDIOVASCULAR DISEASE
The health benefits of a diet high in fish with regard to CVD has been discussed since the 1970´s when epidemiologists observed that Inuits consuming large amounts of fish had a low rate of coronary heart disease (CHD) and mortality (7, 8). Much attention has focused on the long-chain omega-3 fatty acids present in fish, eicosahexaenoic acid (EPA) and docosahexaenoic acid (DHA), for which fish and other seafood are the predominate sources of intake in humans. Other nutrients in fish that are suggested to be protective include the antioxidant selenium (9) and more recently, vitamin D (10).
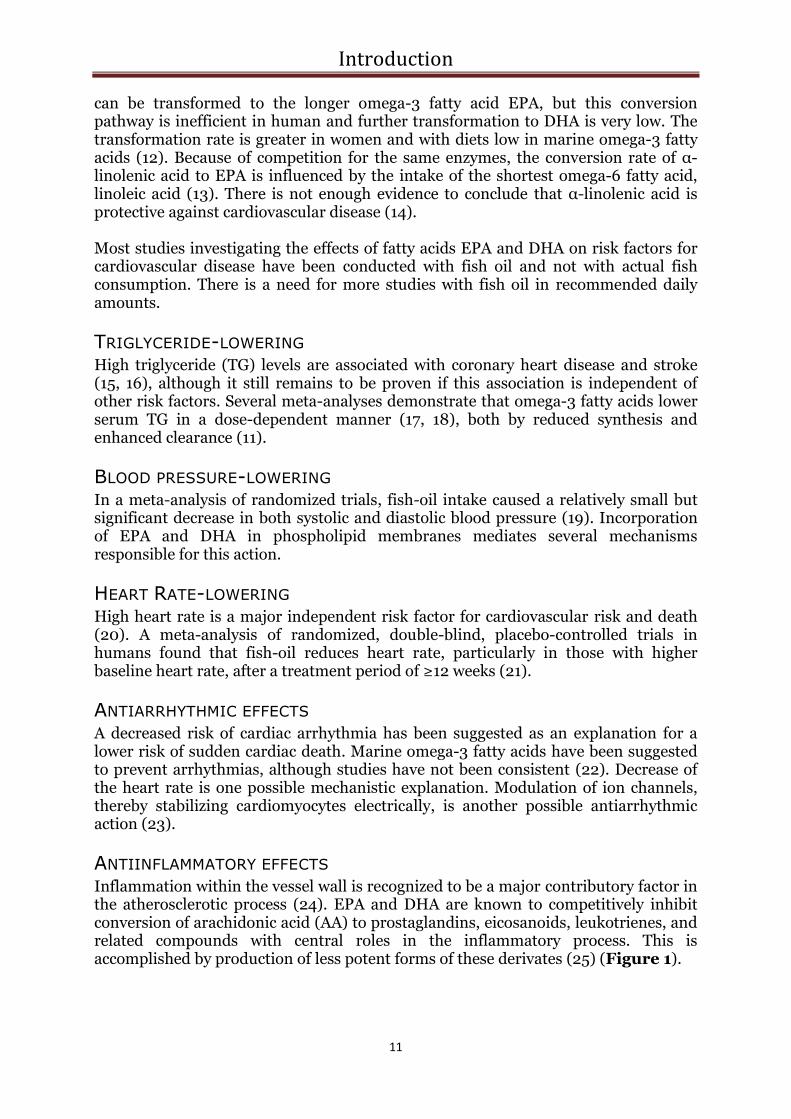
MECHANISMS FOR EPA AND DHA AFFECTING CARDIOVASCULAR RISK Marine omega-3 fatty acids, EPA and DHA, favorably affect a number of factors involved in the development of atherosclerosis and subsequent cardiovascular or cerebrovascular events (11). Several of the protective mechanisms of omega-3 fatty acids are attributed to competition with omega-6 fatty acids for enzymatic pathways related to the production of eicosanoids (Figure 1). End products derived from omega-3 precursors result in less potent eicosanoids. This has implications both for mechanisms of inflammation and blood aggregation pathways. Omega-3 and omega-6 fatty acids are both essential components of a normal diet.
Omega-6 Omega-3
18:2 n-6Linoleic acid
18:3 n-3α-linolenic acid
18:3 n-6
20:3 n-6
20:4 n-6Arachidonic acid
22:4 n-6
24:4 n-6
24:5 n-6
22:5 n-6
18:4 n-3
20:4 n-3
20:5 n-3EPA
22:5 n-3
24:5 n-3
24:6 n-3
22:6 n-3DHA
Δ6-desaturase
eicosanoids
eicosanoids
eicosanoids
elongase
Δ5-desaturase
elongase
elongase
Δ6-desaturase
β-oxidation
Figure 1. Pathway for the conversion of linoleic acid and α-linolenic acid into longer-chain fatty acids (based on reference (11)). Good sources of the shortest omega-3 fatty acid, α-linolenic acid, are leafy vegetables, rapeseed and soybean oil, walnuts and linseed. To a certain extent, α-linolenic acid
Introduction
11
can be transformed to the longer omega-3 fatty acid EPA, but this conversion pathway is inefficient in human and further transformation to DHA is very low. The transformation rate is greater in women and with diets low in marine omega-3 fatty acids (12). Because of competition for the same enzymes, the conversion rate of α-linolenic acid to EPA is influenced by the intake of the shortest omega-6 fatty acid, linoleic acid (13). There is not enough evidence to conclude that α-linolenic acid is protective against cardiovascular disease (14). Most studies investigating the effects of fatty acids EPA and DHA on risk factors for cardiovascular disease have been conducted with fish oil and not with actual fish consumption. There is a need for more studies with fish oil in recommended daily amounts.
TRIGLYCERIDE-LOWERING High triglyceride (TG) levels are associated with coronary heart disease and stroke (15, 16), although it still remains to be proven if this association is independent of other risk factors. Several meta-analyses demonstrate that omega-3 fatty acids lower serum TG in a dose-dependent manner (17, 18), both by reduced synthesis and enhanced clearance (11).
BLOOD PRESSURE-LOWERING In a meta-analysis of randomized trials, fish-oil intake caused a relatively small but significant decrease in both systolic and diastolic blood pressure (19). Incorporation of EPA and DHA in phospholipid membranes mediates several mechanisms responsible for this action.
HEART RATE-LOWERING High heart rate is a major independent risk factor for cardiovascular risk and death (20). A meta-analysis of randomized, double-blind, placebo-controlled trials in humans found that fish-oil reduces heart rate, particularly in those with higher baseline heart rate, after a treatment period of ≥12 weeks (21).
ANTIARRHYTHMIC EFFECTS A decreased risk of cardiac arrhythmia has been suggested as an explanation for a lower risk of sudden cardiac death. Marine omega-3 fatty acids have been suggested to prevent arrhythmias, although studies have not been consistent (22). Decrease of the heart rate is one possible mechanistic explanation. Modulation of ion channels, thereby stabilizing cardiomyocytes electrically, is another possible antiarrhythmic action (23).
ANTIINFLAMMATORY EFFECTS Inflammation within the vessel wall is recognized to be a major contributory factor in the atherosclerotic process (24). EPA and DHA are known to competitively inhibit conversion of arachidonic acid (AA) to prostaglandins, eicosanoids, leukotrienes, and related compounds with central roles in the inflammatory process. This is accomplished by production of less potent forms of these derivates (25) (Figure 1).

Introduction
12
DECREASED PLATELET AGGREGATION Omega-3 fatty acids can diminish thrombosis. This is mediated by the competition between omega-3 fatty acids and the omega-6 fatty acid AA in eicosanoid generation (Figure 1). EPA-based end products have weaker trombocyte-aggregatory effects than AA (26).
ATHEROSCLEROTIC PLAQUE STABILIZATION Marine omega-3 fatty acids have been demonstrated to stabilize atherosclerotic plaques by decreasing infiltration of inflammatory cells like macrophages and lymphocytes (27). This is mediated by a reduction in chemoattractants, growth factors and adhesion molecule production by these fatty acids (26).
PREVIOUS STUDIES ON CONSUMPTION OF FISH OR MARINE OMEGA-
3 FATTY ACIDS AND RISK OF CARDIOVASCULAR DISEASE
RANDOMIZED CONTROLLED TRIALS Four large randomized controlled trials (RCT) that have investigated the effects of consumption of fish or fish oil supplements on the risk of cardiovascular disease are often cited in review articles (28-31). Of these, three found protective associations (28, 30, 31). In the DART study, carried out in Wales, 2033 male patients with previous MI were assigned to 8 dietary advice groups. A 29% reduction in total mortality were found after 2 years in the group advised to eat fatty fish twice a week when compared to the control group with no dietary advice. The greatest benefit was seen in the reduction of fatal MI (28). In the DART II study, over 3000 patients with angina were randomized to either a diet of fatty fish twice a week or daily supplemental fish oil capsules versus no dietary changes. In this study, the risk of cardiac death was higher in the group advised to eat fish or take fish oil as compared to those who received no dietary recommendations (29). However, the validity of this study has been questioned due to methodological limitations. A third study, the Italian GISSI-Prevenzion Trial, enrolled 11,324 CHD patients to either dietary supplementation with fish oil (low-dose; 850 mg/d), vitamin E (300 mg/d), both or no treatment. After 3.5 years of follow-up, fish oil supplementation reduced cardiovascular death by 30% and sudden death by 45%, while no risk reduction was seen for non-fatal cardiovascular events (32). In the Japanese JELIS study of 18,645 hyperlipidemic patients treated with statins, the addition of fish oil supplementation reduced major coronary events by 19% (31).
REVIEWS Several systematic reviews and meta-analyses of randomized and observational studies on the association between fish or fish oil consumption and risk of cardiovascular outcomes have been conducted (14, 33-41). The majority of these investigations support a protective effect. However, the review by Hooper et al. from 2006 (cited on the Cochrane Collaboration webpage) maintains that dietary or supplemental omega-3 fatty acids have not been conclusively shown to impact combined cardiovascular events or total mortality (37). This review has been questioned by other scientists for several reasons. First, the use of combined cardiovascular outcomes has been criticized. Also, Hooper excluded cohorts that
Introduction
13
reported only estimates of fish consumption and made no estimation of intake of marine omega-3 fatty acids. Regarding cerebrovascular benefits, there is less published evidence than for ischemic heart disease, but reviews have suggested a protective effect with respect to ischemic stroke (36, 42). In summary, results from observational and randomized trials are not entirely consistent, but a majority of available evidence supports a protective association between consumption of fish or fatty acids (EPA and DHA) and cardiovascular risk.
SELENIUM AND CARDIOVASCULAR DISEASE
The role of selenium in prevention of CVD has been debated. Selenium is an essential trace element, yet demonstrates toxicity at high doses. Selenoproteins are components in antioxidant systems (e.g., glutathione peroxidase) that protect against damage from free radicals and reactive oxygen species (43). Fish is a good source of selenium. However, in Sweden the intake of selenium from meat and milk products is more substantial than that from fish on a population level due to higher overall consumption of these food groups (44). Findings support that plasma selenium concentrations up to 70-90 µg/L increase glutathione peroxidase activity, but higher levels are unlikely to cause any further enhancement (45). Few randomized trials have been conducted on the influence of selenium on cardiovascular risk. Current evidence from meta-analyses of randomized trials and observational studies is insufficient to support a protective role of selenium against cardiovascular disease (9). High selenium levels have been associated with an increased risk of hypertension, diabetes and hypercholesterolemia (46-48).
METHYLMERCURY
Mercury (Hg) in aquatic wildlife is primarily composed of its methylated form, methylmercury (MeHg). MeHg is more reactive and more easily absorbed in the gastrointestinal tract than elemental or inorganic mercury. Thus, MeHg is the mercury species of interest when considering health effects of long-term, low-level exposure (49).
SOURCES OF POLLUTION Inorganic Hg enters the atmosphere by human activity such as combustion of coal, discharge from industrial processes such as production of chlorine, sodium and cement, as well as from mining and waste incineration. Mercury vapor (Hg0) also evaporates naturally from the crust of the earth (50).
TRANSMISSION OF MERCURY Mercury vapor from human activity or naturally occuring sources can move long distances in the atmosphere over a period of time as long as one year before being converted to a more water soluble form. Mercury ions (Hg2+) eventually become deposited in soil or bodies of water as a result of rainfall. Some of the Hg2+ is converted back to vapor and reenters the atmosphere. Microorganisms can convert

Introduction
14
Hg2+ to MeHg in aquatic sediments. In that form it enters the food chain, first through plankton and then to smaller fish. MeHg then accumulates through the entire food chain with the highest concentrations found in long-lived predatory fish. Amounts increase in proportion to the size of the fish (50). The concentration of MeHg is usually higher in fish in smaller lakes. Acidification of lakes increases the level of MeHg. MeHg concentrations are higher in proximity to sources of polluted discharge (51).
DIETARY SOURCES OF METHYLMERCURY Consumption of fish is the main source of exposure to MeHg in humans. Approximately 75-100% of the mercury in fish is in the form of MeHg (52). The Swedish National Food Administration has issued recommendations for limited consumption of some species caught locally in Sweden, namely pike, perch, pike-perch and burbot due to the risk of higher MeHg. Additionally, other fish species are restricted from lakes known to be contaminated, such as char, salmon and salmon trout from Lake Vänern and Lake Vättern (53). Recently, consumption of rice has been identified as a source of MeHg exposure in locations in China, probably due to high Hg contamination through combustion of coal, as well as mining activity. High methylation rates occur in paddy field soils (54). As rice is a staple food it may represent a significant source of MeHg ingestion in these areas of China. This is unlikely to represent a problem in Sweden. However, MeHg content in imported rice should be monitored.
HEALTH EFFECTS OF METHYLMERCURY
The most notable adverse health effect of MeHg is prenatal neurotoxicity. This effect has been investigated previously and is not a topic of discussion here (55, 56).
CARDIOVASCULAR EFFECTS OF METHYLMERCURY In adults, the most concerning potential health effect of chronic, low-level exposure of MeHg is CVD. Five previous epidemiological studies have investigated the effect of total-Hg or MeHg on the risk of cardiovascular outcomes (49). In a cohort from eastern Finland, the Kuopio Ischemic Heart Disease Study, Virtanen et al. found that those in the highest tertile of hair-Hg content had 66% higher risk of acute coronary syndromes compared to men in the lowest tertile (57). Guallar et al. found a 2-fold higher risk of MI for men in the two highest quintiles of toenail Hg, as compared to those in the lowest quintile, in a retrospective case-control study from eight European countries and Israel (58). In a study involving male health professionals in the US, toenail mercury was not associated with CHD. After exclusion of dentists, which represented nearly 60% of the cohort, a non-significant association was seen between levels of Hg in toenails and higher CHD risk (59). In two previous studies from Sweden, no detrimental effect of Hg as measured in erythrocytes (Ery-Hg) (60) or in serum (61) was found. Hallgren et al. found a protective association between Ery-Hg and MI which was potentially explained by Ery-Hg representing a marker of fish consumption (60). Experimentally observed effects of Hg regarding the risk of CVD are summarized by Mozaffarian (49). Such systemic effects are: a) promotion of free radicals and reactive oxygen species, b) inhibition of antioxidant systems, c) increased lipid peroxidation,
Introduction
15
d) promotion of blood coagulation, and e) inhibition of endothelial cell migration. Direct cardiovascular effects include: a) reduction in myocardial contractile force, b) increased calcium release from myocardial sarcoplasmic reticulum, c) reduction in left ventricular myosin ATPase activity, d) decreased heart rate variability, and e) increased blood pressure.
BIOMARKERS OF FISH CONSUMPTION – EPA+DHA AND
METHYLMERCURY
Dietary surveys are often biased. Biomarkers of dietary consumption offer the opportunity to objectively verify survey data. The omega-3 polyunsaturated fatty acids, EPA and DHA, are traditionally used as biomarkers for fish consumption (62). Fish is the predominant dietary source of these fatty acids. Both are essential fatty acids and, therefore, cannot be synthesized by humans. The only exception to this is the small conversion of the essential fatty acid α-linolenic acid mentioned above (12). EPA and DHA are useful as surrogate biomarkers of fish consumption for this reason. MeHg can also function as a biomarker of fish consumption because fish is the main source of human exposure to MeHg. The method of assessment is vital. Biological samples reflecting longer accumulation periods give a more accurate estimation of the average fish consumption of an individual. Thus, levels of EPA and DHA in adipose tissue would be the biological sample of choice, reflecting approximately one year´s exposure. Hair-Hg is of interest because specific time periods of exposure can be investigated. Hair grows on average 1 cm per month. Because over 80% of the Hg in hair is in the form of MeHg (63), total-Hg can be measured in hair to estimate MeHg exposure. However, for large epidemiologic studies based on banked biological material, blood specimens are most commonly available. Proportions of EPA and DHA can be measured in serum (reflecting days of exposure), triglycerides (reflecting hours of exposure), phospholipids or cholesterol esters (reflecting days of exposure) and erythrocyte membranes (reflecting about a month of exposure) (62). Total-Hg in erythrocytes also gives a reasonable estimate of MeHg exposure. Most of the mercury sequestered in erythrocytes is in the form of MeHg (64). Unpublished data by Custodio et al. show that only about 8% of the Hg in erythrocytes from individuals living in northern Sweden is inorganic Hg. Moreover, some of the inorganic Hg found in hair or in erythrocytes may actually be demethylated MeHg (64). Total-Hg in nails has also been used as a biomarker for MeHg exposure. The assumption that Hg in toenails is likely to be almost exclusively MeHg was verified in an autopsy study by Björkman et al. (65).
GENDER DIFFERENCES
Because other risk factors for CVD are known to affect men and women differently (66), studies of gender differences in how fish-related factors relate to MI and stroke are warranted. There are known gender differences in burdens of the heavy metals lead (Pb) and cadmium (Cd). Males have generally slightly higher burdens of Pb (67),

Introduction
16
and females have substantially higher burdens of Cd resulting from increased intestinal uptake primarily due to lower iron status (68). For MeHg there are no known gender differences in burdens.
Objectives
17
OBJECTIVES The overall objective of this thesis was to investigate associations between fish consumption or biomarkers of fish consumption and the risk of stroke or myocardial infarction. The specific aims of each paper were:
I. To investigate changes over time in burdens of mercury, lead and cadmium in the population in northern Sweden.
II. To evaluate the ability of the food frequency questionnaire used in the Northern Sweden Health and Disease Study to estimate fish consumption.
III. To investigate associations between reported fish consumption, body
burdens of methylmercury or the fatty acids EPA+DHA, and risk of stroke.
IV. To investigate associations between reported fish consumption, body burdens of methylmercury, fatty acids EPA+DHA or selenium, and risk of myocardial infarction.

Material and Methods
18
MATERIAL AND METHODS
STUDY POPULATION
All studies in this thesis were based on data from the Northern Sweden Health and Disease Study (NSHDS) which consists of three study cohorts based on the population in the counties of Västerbotten and Norrbotten in northern Sweden. These two counties have a population of approximately 510 000 inhabitants within an area of 154 300 km2. The three study cohorts in NSHDS are: i) the Northern Sweden MONICA Study, ii) the Västerbotten Intervention Program (VIP), and iii) the Mammography Screening Project (MSP).
THE NORTHERN SWEDEN MONICA STUDY
The Northern Sweden MONICA Study started in 1982 as part of a multicenter World Health Organization (WHO) survey entitled Multinational Monitoring of Trends and Determinants in Cardiovascular Disease (MONICA). In the Northern Sweden MONICA Study, 2000 or 2500 randomly selected participants aged 25-74 years (stratified for sex and age range; the age group 65-74 years has been included since 1994) were invited to participate in a continuous health survey. Surveys thus far have been performed during the years 1986, 1990, 1994, 1999, 2004 and 2009. This thesis includes data from the 1990 through and including the 1999 survey (papers 1, 3 and 4). The participation rate for these years was 71-82% (69).
THE VÄSTERBOTTEN INTERVENTION PROGRAM
The VIP started in 1985 in the municipality of Norsjö in Västerbotten where prevalence of CVD was known to be exceedingly high (70). The study was gradually enlarged to encompass all municipalities in Västerbotten. It was coordinated with the MONICA study. Since 1991 the VIP includes the entire county and health screening is ongoing. Men and women are invited to participate in the health screening upon turning 40, 50 and 60 years of age (from 1985 to 1996 even 30 years of age). This thesis includes VIP data from 1986 through and including 1999 [papers 2 (subjects screened 1992), 3 and 4]. The mean participation rate in VIP is 59%.
SELECTION BIAS VIP participants have been compared to non-participants (71). Only marginal differences in social characteristics have been observed. However, somewhat lower participation rates are seen among the unemployed, those with lower income and in the youngest age strata.
Material and Methods
19
THE HEALTH EXAMINATION IN THE NORTHERN SWEDEN MONICA STUDY
AND THE VÄSTERBOTTEN INTERVENTION PROGRAM In the Northern Sweden MONICA Study and the VIP, participants fill out an extensive questionnaire on lifestyle factors which includes a food frequency questionnaire (FFQ). They undergo a thorough health examination focusing on risk factors for cardiovascular disease and diabetes: blood pressure, an oral glucose tolerance test, weight, height, and blood lipids are registered, among other parameters.
BLOOD SAMPLES IN THE NORTHERN SWEDEN MONICA STUDY AND THE
VÄSTERBOTTEN INTERVENTION PROGRAM The participants were asked to donate a fasting blood sample (minimum 4 hours) for use in future research. Venous blood samples were drawn without stasis into evacuated glass tubes. Erythrocytes, buffy coat and plasma were separated by centrifugation at 1500g for 15 minutes and aliquots are stored at -80°C at the Northern Sweden Medical Research Bank at Umeå University Hospital until analysis was performed. Because only serum samples were obtained during the first MONICA visits in 1986, these participants are not included in any of the papers in this thesis.
THE MAMMOGRAPHY SCREENING PROJECT
Since 1995, all women in Västerbotten aged approximately 40-70 years (age limits have varied over time) have been encouraged to undergo mammography every two or three years as part of the MSP. A questionnaire is included in the project protocol and participants are asked to donate a blood sample for use in future research. Samples are stored at -80°C at the Northern Sweden Medical Research Bank. The blood sampling procedure is the same as for the MONICA study and the VIP, but blood samples in the MSP are collected throughout the day so participants are not necessarily fasting. Participants with unknown fasting status are considered to have fasted 0-4 hours. The questionnaire in the MSP concerns mostly reproductive history, but tobacco consumption is also recorded. The participation rate has been 85% in screening and 33% in blood sample donation. Due to limited information on adjustment variables, participant data is only included in sex-specific analyses with limited adjustment in paper 4, using data from the years 1995 through 1999.
STUDY DESIGN AND STUDY SUBJECTS
PAPER 1 Paper 1 is based on repeated cross-sectional studies. Two hundred participants from the MONICA surveys from each of the years 1990 (199 participants in statistical analyses because one sample was contaminated), 1994 and 1999 participated. Different individuals participated different years, so it was not the same 200 individuals that were sampled three times. Concentrations of Cd, Pb and Hg were determined in erythrocytes in order to examine time trends. Lifestyle factors of importance were taken into consideration.

Material and Methods
20
PAPER 2 Paper 2 was a validation study of the 84-item FFQ used in the MONICA study, where measurement of fatty acids in erythrocyte membranes served as biomarkers. This was an extension of a previous validation study conducted on 96 men and 99 women who participated in the VIP in 1992. Respondents completed an eighty-four item FFQ used in the MONICA study, first in the first quarter of 1993 and again a year later. In the intervening months between surveys the participants carried out ten 24-hour dietary recalls (24-HDR) using telephone interviews (72). In paper 2, measured levels of fatty acids in erythrocytes were compared to estimated consumption utilizing dietary methods.
PAPERS 3 AND 4 Papers 3 and 4 were conducted with a prospective incident nested case-control study design regarding stroke (paper 3) or MI (paper 4). The study design implies that data was collected before development of an event (prospective), and that only first-ever events (incident) were counted in a larger study base (nested). Cases were identified by screening for stroke and MI events in hospital medical records, primary care journals and death certificates according to the WHO MONICA criteria (69).
PAPER 3 A cohort of first-ever stroke cases with matched controls nested within the NSHDS served as the study group. During the period from January 1, 1985 to September 20, 2000, a total of 585 definite, first-ever stroke cases that previously participated in the MONICA survey or the VIP were registered in the Northern Sweden MONICA Incidence Registry (73). An acute stroke case was defined as “rapidly developing clinical signs of focal (or global) disturbance of cerebral function lasting more than 24 hours (unless interrupted by surgery or death) with no apparent cause other than a vascular origin”. All transient ischemic attacks, silent brain infarction (events without clinical signs), stroke caused by trauma, subarachnoid hemorrhage and acute stroke with concomitant brain tumour or severe blood disease were excluded based on WHO criteria (69). Individuals with previous stroke, myocardial infarction, cancer (according to the Swedish National Cancer Registry), or with inadequate blood samples were excluded, resulting in 388 first-ever stroke cases. Two randomly selected controls, matched for age (± 2 years), sex, date of health survey (± 1 year), type of health survey (MONICA or VIP) and geographic region (municipality) were selected for each case. Controls were excluded if they had died or moved out of the region before the qualifying event for the respective case. Another nineteen triplets in paper 3 were excluded due to the lack of data for all the variables of fish consumption, mercury and fatty acids in the case or both controls. Paper 3 included 302 ischemic stroke cases (ICD-9: 434, ICD-10: I63), sixty hemorrhagic stroke cases (ICD-9: 431, ICD-10: I61-I62) and seven unspecified stroke cases (ICD-9: 436, ICD-10: I64) plus 738 controls (Figure 2).

Material and Methods
21
Excluded
-previous stroke, MI or cancer (N=197
triplets)
-subjects without any of the variables fish
consumption, Ery-Hg or fatty acids (N=19
triplets)
Västerbotten population 255 640 (2000-12-31)95% of the study base
Norrbotten population 256 238 (2000-12-31)5% of the study base
Baseline health examinations
Medical biobank (n=74619)
VIP (90%) + MONICA (10%)
Case finding (2000-09-20)
MONICA-Stroke
11917 individuals
Record linkage
Cases with participation in health examination in the VIP or the
MONICA study prior to the stroke (n=585)
369 cases 738 referents
Ischemic stroke: 302 cases
Hemorrhagic stroke: 60 cases
Unspecified stroke: 7 cases
Figure 2. Selection and exclusion algorithm for study subjects in paper 3.
PAPER 4 A cohort of first-ever myocardial infarction (MI) cases with matched controls nested within the NSHDS served as the study group. From January 1, 1985 until December 31, 1999, a total of 696 MI cases participating in the MONICA study or the VIP were identified by cross-referencing the health examination registry with the Northern Sweden MONICA Incidence Registry. The Northern Sweden MONICA Incidence Registry included data on individuals aged 25-64 years and additional participants were recruited from the NSHDS which included individuals over 64 years of age. A non-fatal case had to be classified as a definite infarction to be included. A definite infarction was required to meet at least one of the following criteria:
Typical serial ECG progression (defined by the Minnesota codes)
At least one measurement of elevated cardiac enzymes to more than twice the upper limit of normal combined with abnormal ECG and typical symptoms
At least one measurement of elevated cardiac enzymes to more than twice the upper limit of normal combined with atypical symptoms and an ECG progression labeled probable.
The final diagnoses for fatal cases were based on autopsies or confirmed by medical records.

Material and Methods
22
Those with survival time < 24 hours were defined as SCD. These data were collected from patient records. After exclusion of cases with previous stroke or cancer (and MIs diagnosed before the initiation of the Northern Sweden MONICA Incidence Registry), 651 cases remained. Cases in the age range 25-64 years with a documented first MI between January 1, 1985 and September 30, 1994 participated in a pilot study (60) and are not included. The number of controls in paper 4 was limited due to financial constraints. One control was matched to each male case, while two controls were matched to female cases (to increase statistical power for females, who were less numerous). Matching was conducted randomly for age (± 2 years), sex, date of health survey (± four months), type of health survey and geographical region (municipality). Finally, subjects without available erythrocyte samples were excluded from this study. This resulted in 431 cases of MI (ICD-9: 410-414, ICD-10: I20-I25) from the MONICA study and the VIP with 499 controls (Figure 3). Of these, 81 were defined as sudden cardiac deaths (death within 24 hours). Another 69 MI cases and 126 controls with the same matching criteria from the MSP were included in sex-specific analyses.
Excluded
-previous MI, stroke or cancer
-subjects without erythrocytes
-limitation of referents*
Västerbotten population 256 710 (1999-12-31)95% of the study base
Norrbotten population 258 094 (1999-12-31)5% of the study base
Baseline health examinations
Medical biobank (n=73750)
VIP (90%) + MONICA (10%)
*One referent for men, two referents for women
Case finding
MONICA-MI
7337 individuals
Record linkage
Cases with participation in health examination in the VIP or the
MONICA study prior to the MI (n=696)
Main study
431 cases (c) 499 referents (r)
Subjects with Ery-Hg (c/r): 431/499
Subjects with Ery-Se (c/r): 431/497
Subjects with P-EPA+DHA (c/r): 374/434
Pilot study
78 cases 156 referents
Figure 3. Selection and exclusion algorithm for study subjects in paper 4. Additional 69 MI cases and 126 controls from the MSP were included in sex-specific analyses.
Material and Methods
23
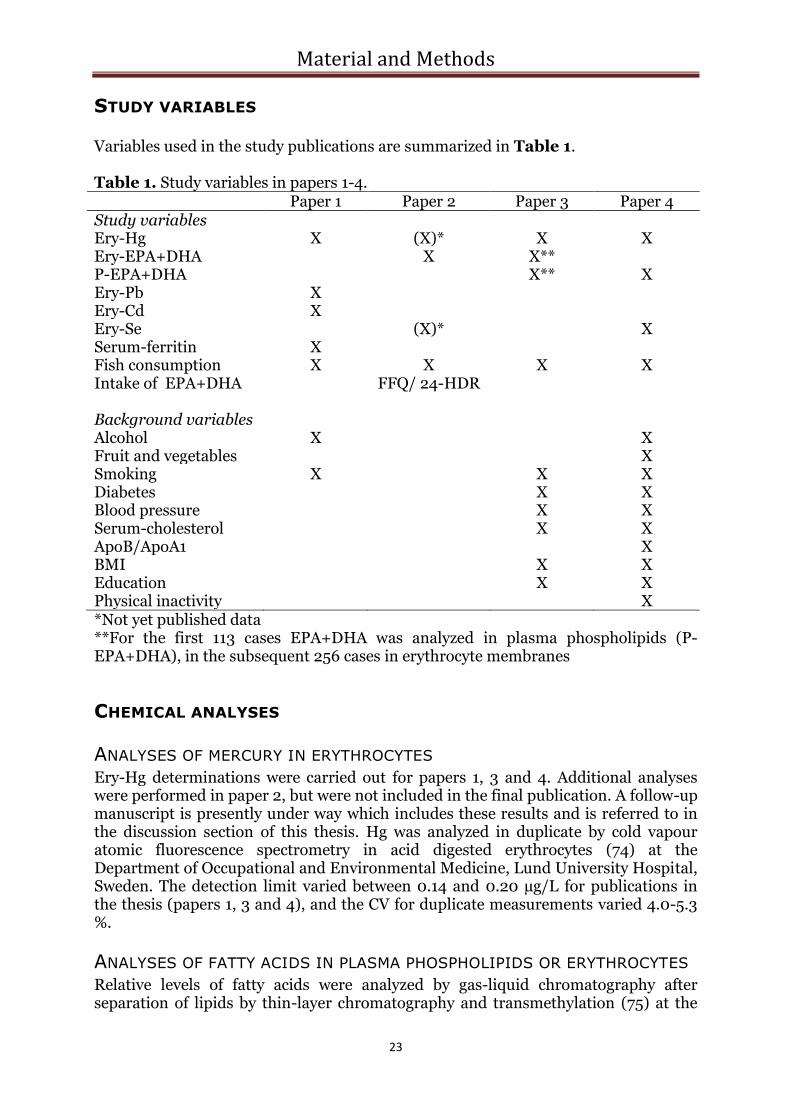
STUDY VARIABLES
Variables used in the study publications are summarized in Table 1. Table 1. Study variables in papers 1-4. Paper 1 Paper 2 Paper 3 Paper 4 Study variables Ery-Hg X (X)* X X Ery-EPA+DHA X X** P-EPA+DHA X** X Ery-Pb X Ery-Cd X Ery-Se (X)* X Serum-ferritin X Fish consumption X X X X Intake of EPA+DHA FFQ/ 24-HDR Background variables Alcohol X X Fruit and vegetables X Smoking X X X Diabetes X X Blood pressure X X Serum-cholesterol X X ApoB/ApoA1 X BMI X X Education X X Physical inactivity X *Not yet published data **For the first 113 cases EPA+DHA was analyzed in plasma phospholipids (P-EPA+DHA), in the subsequent 256 cases in erythrocyte membranes
CHEMICAL ANALYSES
ANALYSES OF MERCURY IN ERYTHROCYTES Ery-Hg determinations were carried out for papers 1, 3 and 4. Additional analyses were performed in paper 2, but were not included in the final publication. A follow-up manuscript is presently under way which includes these results and is referred to in the discussion section of this thesis. Hg was analyzed in duplicate by cold vapour atomic fluorescence spectrometry in acid digested erythrocytes (74) at the Department of Occupational and Environmental Medicine, Lund University Hospital, Sweden. The detection limit varied between 0.14 and 0.20 µg/L for publications in the thesis (papers 1, 3 and 4), and the CV for duplicate measurements varied 4.0-5.3 %.
ANALYSES OF FATTY ACIDS IN PLASMA PHOSPHOLIPIDS OR ERYTHROCYTES Relative levels of fatty acids were analyzed by gas-liquid chromatography after separation of lipids by thin-layer chromatography and transmethylation (75) at the

Material and Methods
24
Unit for Clinical Nutrition Research, Department of Public Health and Caring Science, Uppsala University, Sweden. The method has been described elsewhere (76). In paper 2, fatty acids were determined in erythrocytes. In paper 3, fatty acids were determined with two methodologies; in the first 113 cases with controls in plasma phospholipids, and in the subsequent 256 cases with controls in erythrocyte membranes. Fatty acids were determined in plasma phospholipids in paper 4. Levels of fatty acids in plasma phospholipids or erythrocyte membranes were expressed as the percentage of each fatty acid relative to the total sum of fatty acids analyzed. The coefficient of variance measured with this method determined in plasma phospholipids have been measured to <1-5.5% (77).
ANALYSES OF LEAD, CADMIUM AND SELENIUM IN ERYTHROCYTES Ery-Pb and Ery-Cd were determined for paper 1 and Ery-Se for paper 4 using inductively coupled plasma-mass spectrometry (78). Analyses were carried out at the Department of Occupational and Environmental Medicine, Lund University Hospital, Sweden. The detection limits were 0.26, 0.09 and 0.55 µg/L for Ery-Pb, Ery-Cd and Ery-Se, respectively, and CV for duplicate measurements were 6.0, 2.3 and 3.2 %, respectively. Ery-Se has also been analyzed for the material used in paper 2, though not included in that paper. A follow-up manuscript is under way and referenced in the discussion section of this thesis.
ANALYSES OF FERRITIN IN SERUM Ferritin in serum was analyzed for paper 1 in the 1990 and 1999 samples by an immunochemical method using monoclonal antibodies performed at the Department of Clinical Chemistry, Lund University Hospital, Sweden.
DIETARY ASSESSMENT - THE FFQ
Dietary intake was estimated by a FFQ in the Northern Sweden MONICA Study and the VIP. In this thesis consumption of fish, alcohol, fruits and vegetables were estimated from the FFQ. The Northern Sweden MONICA Study uses an 84-item FFQ which is thoroughly described in paper 2. In the 1990 survey, a 49-item version of the FFQ was used due to financial constraints, while the 84-item FFQ was used in the 1994 and 1999 surveys. In the early years of VIP (1985-1992), there was some variation in the FFQ used in different municipalities. In 1992, an optically readable version of the 84-item FFQ used in the MONICA study was also put in use in the VIP for all municipalities. The number of items has varied over the years for financial reasons. In 1996 a shortened version with 64 to 66 items (addition of water in 1998 and eggs in 2000) was gradually implemented in the VIP.
FISH CONSUMPTION Inquiries regarding fish consumption have been consistent in all of the different FFQ versions. Some older versions of the FFQ used in VIP contained only six pre-defined responses instead of nine.

Material and Methods
25
The question asked in the FFQ was: “How often do you eat the following foods? Mark average consumption during the last year. Mark only one alternative per row.” This is followed by a list of different foods with nine or six pre-defined responses. Fish was subcategorized as follows: Lean fish (perch, cod, etc.) Fatty fish (herring, Baltic herring, whitefish/lavaret, salmon, etc.) Salty fish (salted herring, salted Baltic herring, etc.) Quantifications to intakes per week were as follows: FFQ with nine pre-defined answer alternatives: never A few
times a year
1-3 times a month
Once a week
2-3 times a week
4-6 times a week
Once a day
2-3 times a day
4 times a day or more
Intakes per week
0 0.05 0.50 1.00 2.50 5.00 7.00 17.5 28.0
FFQ with six pre-defined answer alternatives:
never Less than once a week
1-2 times a week
3-5 times a week
6-7 times a week
More than daily
Intakes per week
0 0.50 1.50 4.00 6.50 10.5
Questions on lean and fatty fish were handled separately and as a combined variable (total fish). Responses regarding salty fish were considered as fatty fish. Initially it was assumed that respondents included salty fish (which are fatty fish) as a portion of their total fatty fish consumption. However, some subjects in papers 3 and 4 had reported a higher frequency of salty than of fatty fish, making this assumption incorrect. In these cases the estimation of salty fish consumption was used as the estimation of fatty fish consumption.
ESTIMATION OF INTAKE OF EPA+DHA FROM DIETARY DATA In paper 2, intake of fatty acids EPA and DHA and other fatty acids was estimated from the FFQ and from ten 24-hour dietary recalls (24-HDR). From the FFQ data, frequencies of consumption of the different food items were multiplied by portion size for each sex and age-group. Portion sizes were estimated from a validation study conducted previously on the same data set (72). The ten 24-hour interviews were conducted by trained interviewers by telephone. A booklet with portion size pictures was mailed in advance to the participants and used to estimate portion sizes. The food composition database, PC-kost 1995 (National Food Administration, Uppsala, Sweden), was used for estimation of intake of different fatty acids by the dietary methods. This database was based on analyses of food from the years preceding 1995.
Material and Methods
26
ALCOHOL CONSUMPTION Frequencies of consumption of wine, strong beer and spirits were recorded in all FFQ versions and converted to intake occasions per week in the same way as for fish consumption. A combined variable of total alcohol consumption was used in paper 1, while in paper 4 the three types of alcohol were totaled separately.
CONSUMPTION OF FRUITS AND VEGETABLES Fruit and vegetable consumption was measured in paper 4. After conversion to servings per day, frequencies were computed to a single variable. Only a rough dichotomized estimate (more than or less than once a day) was possible due to modifications in the FFQ over time.
BACKGROUND VARIABLES
SMOKING Smoking was used as an adjustment variable in papers 1, 3 and 4. Exposure was estimated from the questionnaire used in the MONICA study, the VIP and the MSP. Current smokers, never smokers and previous smokers could be identified. The number of cigarettes per day for current smokers and number of smoke-free years for previous smokers was used in the statistical analyses in paper 1. A dichotomized variable, current daily-smoker or non-smoker (which included ex-smokers and occasional smokers), was used in papers 3 and 4.
DIABETES MELLITUS Diabetes mellitus, dichotomized to diabetic or not, was considered as an adjustment variable in papers 3 and 4. In paper 3, those who reported having diabetes in the questionnaire were categorized as diabetics. In paper 4, fasting plasma glucose ≥ 7 mmol/L and/or a 2-hour post-load plasma glucose ≥ 11.0 mmol/L (≥ 12.2 mmol/L in the VIP, as capillary plasma was drawn) was used in addition to the self-reported information.
BLOOD PRESSURE Blood pressure was taken into consideration in papers 3 and 4. The definition for hypertension in paper 3 was a systolic blood pressure ≥ 160 mmHg and/or a diastolic blood pressure ≥95 mmHg, and/or reported use of anti-hypertensive medication during the previous 14 days. In paper 4, new limits for defining hypertension, a systolic blood pressure ≥140 mmHg and/ or a diastolic blood pressure ≥90 mmHg, was used in addition to the reported use of anti-hypertensive medication during the previous 14 days. In adjustments, hypertension was used in paper 3, and in paper 4 systolic blood pressure as a continuous variable was used.
SERUM CHOLESTEROL Cholesterol in serum was considered for multivariate adjustment in papers 3 and 4. However, because the apolipoproteinB/apolipoproteinA1 ratio (ApoB/ApoA1) is generally acknowledged as a stronger risk predictor than serum cholesterol, and because this analysis became available only later, it supplanted serum cholesterol in paper 4. In the VIP, total cholesterol was measured at each health centre with

Material and Methods
27
Reflotron benchtop analyzers by enzymatic methods (Boehringer Mannheim GmbH Diagnostica, Germany). In the MONICA study samples were analyzed with an enzymatic method at a core laboratory at the University of Umeå (Boehringer Mannheim GmbH Diagnostica, Germany). The two methods have been evaluated on 180 subjects. The correlation coefficient between the methods were 0.90 and the mean value for each method differed by 0.04 mmol/L.
APOLIPOPROTEIN B/ APOLIPOPROTEIN A1 ApoA1 and ApoB were analyzed at the Umeå University Hospital Laboratory by immunoturbidimetry with reagents from Dako (Glostrup, Denmark) and calibrated (X 0947) on a Hitachi 911 multianalyser (Roche Diagnostics GmbH, Mannheim, Germany). The ApoB/ApoA1 ratio was calculated and used for adjustment in paper 4.
BODY MASS INDEX Body mass index (BMI) was used as an adjustment variable in papers 3 and 4. It was calculated as weight (kg)/ square height (m2).
EDUCATION Academic education or not, self-reported in the questionnaire, was used for multivariate adjustment in papers 3 and 4.
PHYSICAL INACTIVITY There were several questions on physical activity in the questionnaire. Despite changes in the questionnaire over time, those reporting inactivity could be identified and this variable was dichotomized accordingly. Physical inactivity was considered as an adjustment variable in paper 4.
STATISTICAL ANALYSES
Non-parametric statistical tests were used because several of the variables were not normally distributed. To compare distribution of values the independent sample test of Mann-Whitney was used for continuous variables and the Chi-square test was used for categorical variables. P for trends was analyzed using the Kruskal-Wallis independent samples test. Spearman correlations were analyzed. In paper 1, bivariate correlations were done with Kendall´s tau instead of Spearman´s rho. In the other papers Spearman´s rho was used for all correlations. In paper 1, multivariate analyses with lifestyle variables of importance in the model were conducted by multiple linear regression to examine time trends. In papers 3 and 4, conditional logistic regression, based on the matched case-control sets, was used to calculate crude and multivariate odds ratios (ORs) and 95% confidence intervals (CIs).
MULTIVARIATE MODEL BUILDING (PAPERS 3 AND 4) In paper 3, potential risk factors with a crude P value less than 0.25 were considered for the multivariate analyses on fish consumption, which was found to be associated with stroke risk in the univariate analyses. In paper 4, separate multivariate models were built for the study variables: fish consumption, Ery-Hg, P-EPA+DHA and Ery-Se. Adjustment variables that changed
Material and Methods
28
the crude point estimate 10 percent or more were included. This resulted in different models for the study variables. Another model was built where adjustment variables according to the Framingham Study (ApoB/ApoA1, systolic blood pressure, smoking and diabetes) were used in addition to the previously included variables. A third multivariate model was built for the fish-related study variables, Ery-Hg and P-EPA+DHA, where the other fish-related study variable was added to the multivariate model. A P value < 0.05 was considered statistically significant in paper 1 and p ≤ 0.05 in papers 2-4. The SPSS statistical software package (SPSS Inc., Chicago, IL, USA) was used for statistical analyses in all papers, although in different versions. In paper 3, EGRET for Windows (version 2.0; CYTEL Software Corporation, Cambridge, MA, USA) was used in addition to SPSS.
ETHICAL CONSIDERATIONS
All studies in this thesis were approved by the Research Ethics Committee of Umeå University and all participants gave informed consent. All data analyses were done on anonymous datasets, thus it was not possible for the researchers that analyzed data to identify individuals. For the prospective case-control studies (papers 3 and 4), limits were established for when a result should be considered so hazardous that the individual could be contacted for further investigation. These limits were set to 40µg/L for Ery-Hg and 500µg/L for Ery-Se. It would be possible to identify individuals through a secure encryption key at the Northern Sweden Medical Research Bank at Umeå University Hospital. We considered it unethical to contact any individual with concentrations above these limits if over 70 years of age at discovery. In the prospective case-control studies (papers 3 and 4), four individuals had Ery-Hg above 40 µg/L (46-87 µg/L), and one person had an Ery-Se of 713 µg/L. All of these individuals were older than 70 years at discovery, thus no action was taken. Regrettably, no limits for action were set for paper 1, but actions are now being made to take new samples from two individuals with high levels.
Results with Comments
29
RESULTS WITH COMMENTS
PAPER 1
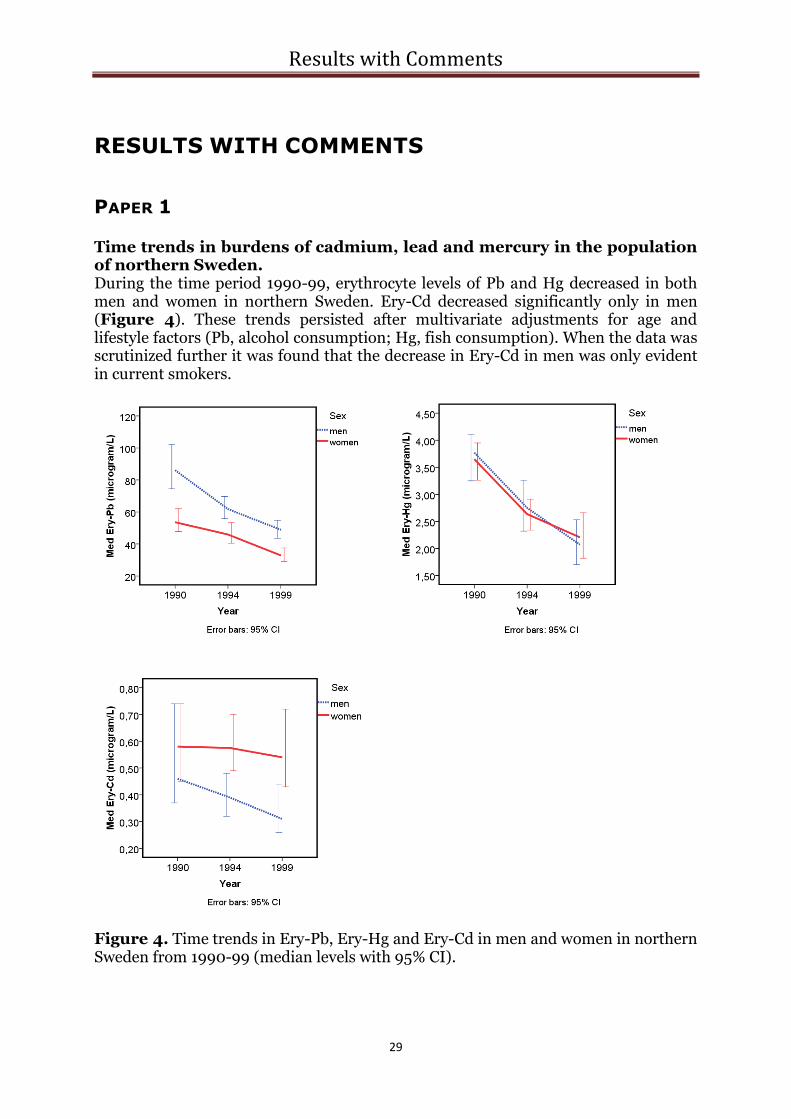
Time trends in burdens of cadmium, lead and mercury in the population of northern Sweden. During the time period 1990-99, erythrocyte levels of Pb and Hg decreased in both men and women in northern Sweden. Ery-Cd decreased significantly only in men (Figure 4). These trends persisted after multivariate adjustments for age and lifestyle factors (Pb, alcohol consumption; Hg, fish consumption). When the data was scrutinized further it was found that the decrease in Ery-Cd in men was only evident in current smokers.
Figure 4. Time trends in Ery-Pb, Ery-Hg and Ery-Cd in men and women in northern Sweden from 1990-99 (median levels with 95% CI).

Results with Comments
30
LEAD The obvious decrease in Ery-Pb over time is not surprising. It can be explained by the gradual elimination of Pb as an additive in petrol. To some extent the change from soldered to welded food cans may have had an influence.
MERCURY As for the decline in Ery-Hg, decreased fish consumption may play a role, but it cannot fully explain these findings as fish consumption did not decrease over time in women. It is likely that lower Hg levels in the fish consumed explains a significant portion of the decrease. This may be explained not only by lower Hg levels in locally caught fish (79), but also by a change in the choice of fish species. Data from the Swedish Board of Agriculture reveal that the annual consumption of salmon, a low-Hg fish, increased from 1.38 kg/person in 1990 to 2.00 kg/person in 1999. A small decrease was observed in consumption of freshwater fish (1.13 vs. 1.03 kg/ person in 1990 and 1999, respectively) (80). Although not specified for fish species, fresh water predatory fish are more commonly high in Hg. However, because a significant proportion of freshwater fish consumed in northern Sweden (mainly perch and pike) are caught recreationally, the statistics likely misjudge true consumption levels. The use of dental amalgam has diminished over time and this may also have contributed to the decrease in Hg burdens.
CADMIUM Available data indicate no decline in Ery-Cd in women. This is unfortunate because Cd can cause adverse health effects on kidney function and bone architecture at these levels (81) and may increase cardiovascular risk (82). Women have higher levels of Ery-Cd than men due to generally lower iron stores and a coherent uptake of iron and Cd (81). The decrease in Ery-Cd in smoking men can be explained in part by a decrease in number of cigarettes smoked per day in male smokers, but this does not explain the entire decrease. We believe that a plausible explanation might be that Cd-content in Swedish tobacco products has diminished over time. We have no data to confirm this for cigarettes, but this is true for smokeless tobacco (snuff) used in Sweden (Swedish Match, unpublished data).
ONGOING AND FUTURE STUDIES Cd, Pb and Hg were determined in whole blood in 296 women who participated in the Northern Sweden MONICA Study in 2004. Cd and Pb, but not Hg, could be calculated to erythrocyte levels, and thus compared to the 1999 levels. Both Ery-Pb and Ery-Cd have remained essentially unchanged since 1999 (unpublished data). Another follow-up study will be conducted on both men and women that participated in the 2009 survey.
IMPLICATIONS The data from this study suggests that additional efforts are required to reduce Cd pollution in the environment. The easiest way for an individual to minimize risk for Cd exposure is to refrain from smoking and avoid iron deficiency. Population levels of Ery-Pb and Ery-Hg are not alarming presently. However, by following the advice from the National Food Administration in Sweden concerning restriction in consumption of fish species higher in Hg (83), the risk of an elevated Hg level for a given individual can be minimized.

Results with Comments
31
PAPER 2
Evaluation of relative intake of fatty acids according to the Northern Sweden FFQ with fatty acids in erythrocyte membranes as biomarkers Spearman correlations between erythrocyte levels of different fatty acids and intake of the corresponding fatty acids were calculated. Intake was estimated from the FFQ used in the Northern Sweden MONICA Study or ten 24-HDR. For this thesis, the results concerning fish fatty acids (EPA and DHA) are of special interest (Table 3). Table 3. Spearman correlations between proportions of fatty acids EPA and DHA in erythrocytes (Ery) and intake of the corresponding fatty acid (g/100g fat) measured by the FFQ and ten 24-HDR in 88 men and 92 women. All correlations are highly significant (P <0.001). FFQ-EPA
(g/100g fat) FFQ-DHA (g/100g fat)
24-HDR-EPA (g/100g fat)
24-HDR-DHA (g/100g fat)
men women men women men women men women Ery-EPA (%)
0.42
0.46
0.39
0.40
Ery-DHA (%)
0.48
0.51
0.38
0.42
This study also indicated that the FFQ has a reasonable ability to capture intake of milk fatty acids 15:0 and 17:0. However, the FFQ has a poor ability to estimate fatty acids 18:2 n-6 and 18:3 n-3, mainly derived from vegetable oils. Both dietary methods seem to have a fair ability to capture intake of the fatty acids EPA and DHA and, accordingly, the consumption of fatty fish. Intakes of EPA and DHA as estimated by the FFQ correlate somewhat better with the erythrocyte levels of EPA and DHA than do intakes estimated by the 24-HDR. This is not surprising; ten days of dietary recording is not comprehensive enough to capture the intake of a seldom consumed food.
ONGOING AND FUTURE STUDIES After publication of paper 2 we analyzed erythrocyte levels of Hg and Se for the participants. These values have been related to the intake of fatty acids EPA and DHA according to the two dietary assessment methods and to fish consumption (intakes/week) according to the FFQ. Interestingly, Ery-Hg correlates to estimated intake of fatty acids EPA and DHA almost as well as relative levels of these fatty acids in erythrocytes (Ery-EPA+DHA; Rs=0.39-0.53, Ery-Hg; Rs=0.33-0.49). Thus, Ery-Hg seems to be a biomarker for fish consumption that is as good as fish fatty acids EPA and DHA in erythrocytes. The best correlation is found between the biomarkers Ery-Hg and Ery-EPA+DHA (Rs=0.65, p<0.001 in men and Rs=0.48, p<0.001 in women). Ery-Se, on the other hand, is poorly correlated to both reported fish consumption and intake of EPA and DHA calculated from dietary methods. This was not unexpected as
Results with Comments
32
foods other than fish provide selenium in the diet. These results are not yet published.
IMPLICATIONS The FFQ used in the Northern Sweden MONICA Study can provide information of the intake of fish fatty acids or milk fatty acids, but not of the intake of fatty acids from vegetable oils.
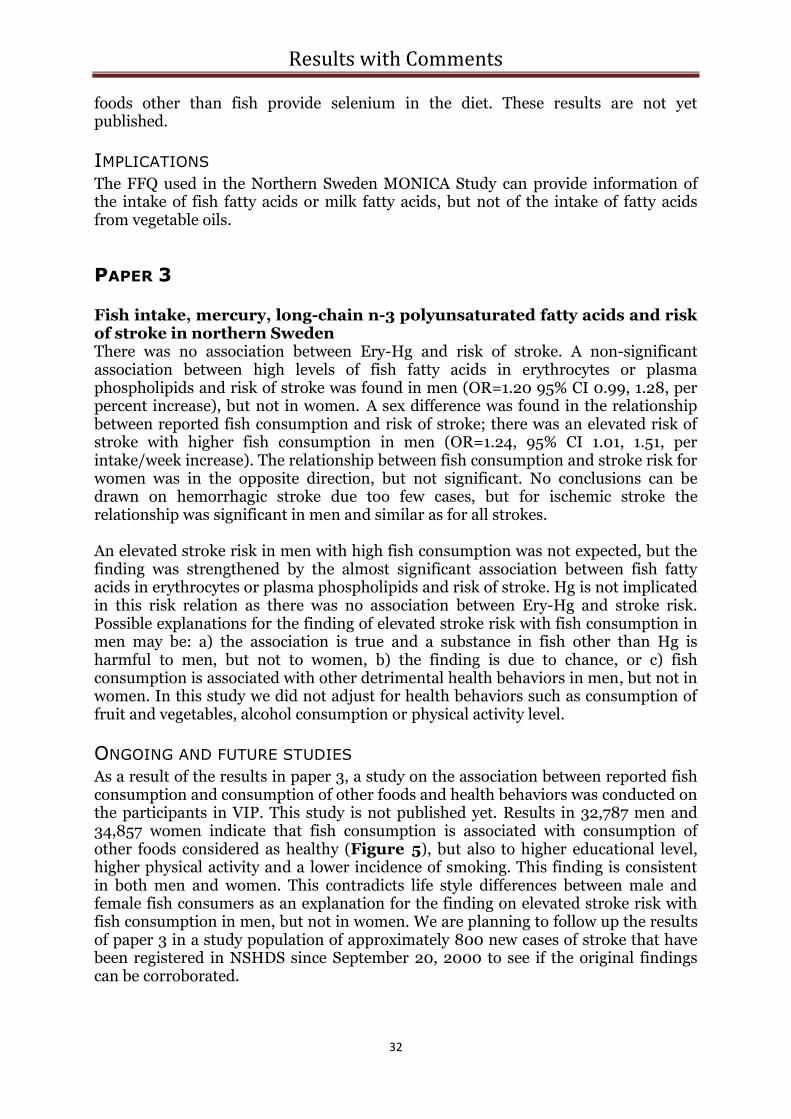
PAPER 3
Fish intake, mercury, long-chain n-3 polyunsaturated fatty acids and risk of stroke in northern Sweden There was no association between Ery-Hg and risk of stroke. A non-significant association between high levels of fish fatty acids in erythrocytes or plasma phospholipids and risk of stroke was found in men (OR=1.20 95% CI 0.99, 1.28, per percent increase), but not in women. A sex difference was found in the relationship between reported fish consumption and risk of stroke; there was an elevated risk of stroke with higher fish consumption in men (OR=1.24, 95% CI 1.01, 1.51, per intake/week increase). The relationship between fish consumption and stroke risk for women was in the opposite direction, but not significant. No conclusions can be drawn on hemorrhagic stroke due too few cases, but for ischemic stroke the relationship was significant in men and similar as for all strokes. An elevated stroke risk in men with high fish consumption was not expected, but the finding was strengthened by the almost significant association between fish fatty acids in erythrocytes or plasma phospholipids and risk of stroke. Hg is not implicated in this risk relation as there was no association between Ery-Hg and stroke risk. Possible explanations for the finding of elevated stroke risk with fish consumption in men may be: a) the association is true and a substance in fish other than Hg is harmful to men, but not to women, b) the finding is due to chance, or c) fish consumption is associated with other detrimental health behaviors in men, but not in women. In this study we did not adjust for health behaviors such as consumption of fruit and vegetables, alcohol consumption or physical activity level.
ONGOING AND FUTURE STUDIES As a result of the results in paper 3, a study on the association between reported fish consumption and consumption of other foods and health behaviors was conducted on the participants in VIP. This study is not published yet. Results in 32,787 men and 34,857 women indicate that fish consumption is associated with consumption of other foods considered as healthy (Figure 5), but also to higher educational level, higher physical activity and a lower incidence of smoking. This finding is consistent in both men and women. This contradicts life style differences between male and female fish consumers as an explanation for the finding on elevated stroke risk with fish consumption in men, but not in women. We are planning to follow up the results of paper 3 in a study population of approximately 800 new cases of stroke that have been registered in NSHDS since September 20, 2000 to see if the original findings can be corroborated.
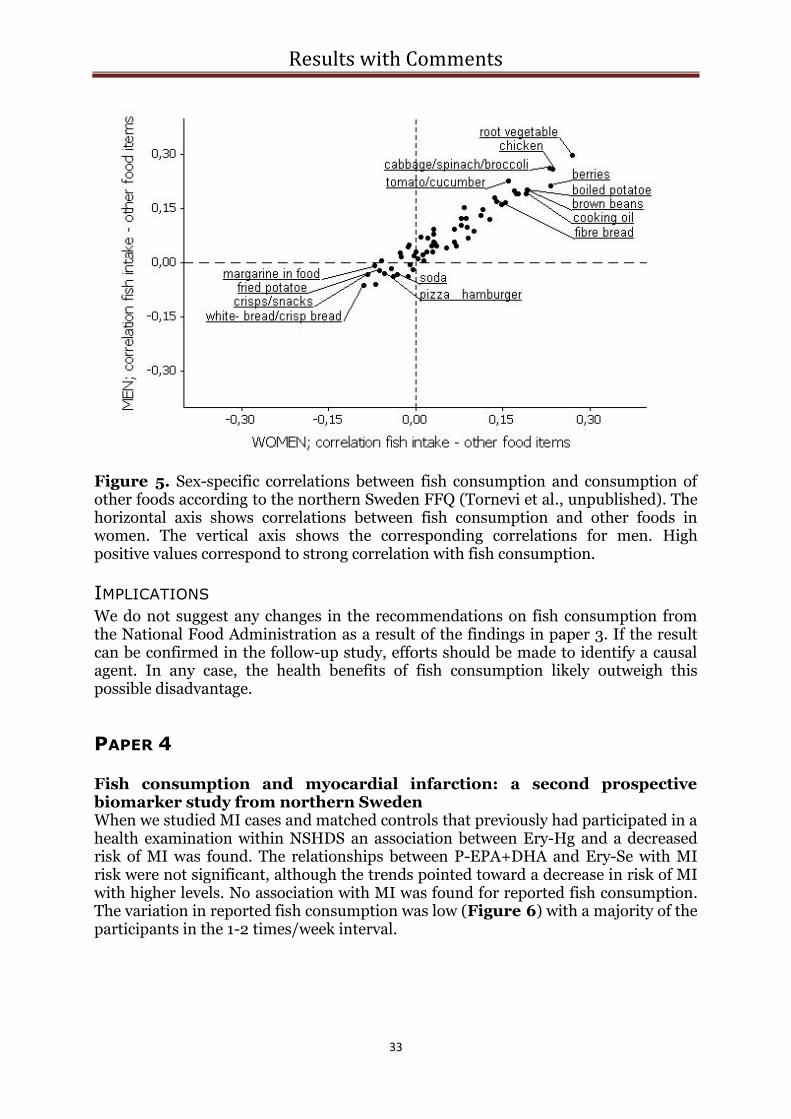
Results with Comments
33
Figure 5. Sex-specific correlations between fish consumption and consumption of other foods according to the northern Sweden FFQ (Tornevi et al., unpublished). The horizontal axis shows correlations between fish consumption and other foods in women. The vertical axis shows the corresponding correlations for men. High positive values correspond to strong correlation with fish consumption.
IMPLICATIONS We do not suggest any changes in the recommendations on fish consumption from the National Food Administration as a result of the findings in paper 3. If the result can be confirmed in the follow-up study, efforts should be made to identify a causal agent. In any case, the health benefits of fish consumption likely outweigh this possible disadvantage.
PAPER 4
Fish consumption and myocardial infarction: a second prospective biomarker study from northern Sweden When we studied MI cases and matched controls that previously had participated in a health examination within NSHDS an association between Ery-Hg and a decreased risk of MI was found. The relationships between P-EPA+DHA and Ery-Se with MI risk were not significant, although the trends pointed toward a decrease in risk of MI with higher levels. No association with MI was found for reported fish consumption. The variation in reported fish consumption was low (Figure 6) with a majority of the participants in the 1-2 times/week interval.

Results with Comments
34
1 = < 1/month 2 = 1/month-<1/week 3 = 1-2/week 4 = >2/week-3/week 5 = >3/week Figure 6. Number of participants in paper 4 reporting different intake of fish in the five defined groups. When the data was limited to cases of SCD and matched controls, the risk estimate was even lower for the highest tertile of Ery-Hg than for all MI, though not significant after adjustments. This may be because only 58 case-control sets had all adjustment variables. Surprisingly, an elevated risk of SCD was found for the tertile highest in Ery-Se as compared to the lowest tertile, but only after adjustments. No sex differences were detected in this study. The blood samples used in this study had been stored at -80°C for varying periods of time (8-20 years) before analysis. Long-chain polyunsaturated fatty acids are especially sensitive to oxidation. Even though -80°C should be sufficient to prevent this (62), we compared the levels of EPA+DHA in plasma phospholipids after varying storage durations. No time-related differences could be detected (P-EPA+DHA; 8-11 years of storing; 5.9%, 17-20 years of storing; 5.7%). It is not likely that MeHg has a protective effect against MI, but Ery-Hg appears to be a stable biomarker for consumption of fish which contains other beneficial agents. This is strengthened by the unpublished data from paper 2, where we found that Ery-Hg reflects reported intake of EPA+DHA as reliably as Ery-EPA+DHA. In paper 4, EPA+DHA were analyzed in plasma phospholipids. This may reflect fish consumption over a shorter period of time than measurements from erythrocytes (62). This may have contributed to the lack of a significant association for P-EPA+DHA with risk of MI, despite the protective association for Ery-Hg. Also, EPA+DHA are expressed as relative levels of fatty acids and thus affected by the total intake of fatty acids, whereas Ery-Hg reflects the absolute intake of MeHg. Thus, Ery-

Results with Comments
35
Hg seem to be a more stable biomarker than P-EPA+DHA. The lack of a detrimental effect of Hg on MI risk in this population, which is contradicted by studies in other populations (57, 58), might well be explained by a lower exposure level in northern Sweden (Figure 7). The estimation of fish consumption may be too coarse and the variation too small to detect a risk association.
0.25
Hair-Hg
(µg/g)
Ery-Hg
(µg/l)
2
4 0.5
8 1.0
12 1.5
16 2.0
20 2.5
24 3.0
28 3.5
32 4.0
36 4.5
Northern Sweden
Eastern Finland
Exposure levels
Nail-Hg
(µg/g)
0.15
0.30
8 European countries and Israel
0.45
0.60
Figure 7. Median levels of Hg in different biological samples in studies from northern Sweden (paper 4), eight European countries and Israel (58) and eastern Finland (57). Scales are approximate. The finding on Ery-Se and SCD should be pursued in future research.
ONGOING AND FUTURE STUDIES Our findings on MI risk contradict published results from eastern Finland (Kuopio Ischemic Heart Disease Study) (57). However, when the data is scrutinized a logical explanation is found. Burdens of MeHg in the population from eastern Finland are considerably higher than corresponding levels in northern Sweden. Within the structure of an European Union Sixth Framework Programme (PHIME = Public health impact of long-term, low-level mixed element exposure in susceptible population strata), individual data on male MI cases in paper 4, male MI cases from the study by Hallgren et al. (60), and male MI cases from the eastern Finland cohort (57) (a case-control study was created within the cohort) have been pooled. To aid in statistical comparisons erythrocyte Hg fatty acid levels were converted to hair-Hg and EPA+DHA in serum (S-EPA+DHA). Also, traditional risk factors were considered in the pooled analyses. Interestingly, hair-Hg was higher, but S-EPA+DHA was lower in the Finnish population when compared to Sweden. Preliminary statistical treatment gives an informative figure of model-based relative risks for varying values of S-EPA+DHA and hair-Hg (Figure 8). The reference group is set to S-EPA+DHA =

Results with Comments
36
4.0% and hair-Hg = 1.0 µg/g, which are close to the median levels of the whole study population. Compared to the reference group, a S-EPA+DHA of 6% is associated with significantly decreased risk of MI if simultaneously low hair-Hg (<1.0 µg/g) is found. With elevated levels of S-EPA+DHA even higher hair-Hg can be tolerated and still result in risk reduction.
Figure 8. Crude model-based relative risks of MI with different levels of hair-Hg and S-EPA+DHA. The figure is based on 411 case-control sets from northern Sweden and 219 case-control sets from eastern Finland (males only). Green crosses correspond to statistically significant reduced risk of MI, red crosses correspond to statistically significant increased risk of MI and yellow crosses to “no statistical evidence for an effect”. The yellow circle represents the reference group.
IMPLICATIONS The result of paper 4 and the ongoing study with data from northern Sweden and eastern Finland support recommendations on fish consumption from the Swedish National Food Administration (83). Fish consumption should be encouraged, but restrictions on intake of species high in MeHg are necessary. This is true not only for pregnant women, but also for the general population due to effects on cardiovascular risk. Also, efforts to reduce pollution with Hg, and thereby decrease levels of MeHg in fish, are important to further enhance the benefits of fish consumption.
2 3 4 5 6 7 8
EPA + DHA % (in serum)
0
1
2
3
4
5
6
7
8
Hair
Hg
(µ
g/g
)
General Discussion
37
GENERAL DISCUSSION
VALIDITY OF EXPOSURES
METHODS TO ESTIMATE FISH CONSUMPTION The validity study (paper 2) concludes that the FFQ used in The Northern Sweden MONICA Study gives a fair estimation of intake of fatty acids EPA and DHA. Since questions on fish consumption are identical in multiple versions of the FFQ, it seems reasonable to state that they are equally valid. However, older versions of the questionnaire with only six pre-defined answers (instead of nine) may lead to misclassification. Another concern is that participants in the validity study (who were informed of the purpose of the study) may have been more meticulous when filling out the FFQ when compared to participants in the general health examination, where the FFQ was a part of a more extensive questionnaire. Also, the variation in reported fish consumption was low with few participants on the extreme ends of the spectrum. This low variation in fish consumption may make it hard to detect a risk association, if any. It may be argued that the observed low variation would be reflected in the biomarkers of fish consumption. However, it is possible that the pre-defined answer alternatives in the FFQ amplify this problem for self-reported fish consumption. This may explain the conclusion in paper 4; a protective association for Ery-Hg, ascribed to Ery-Hg being a biomarker of fish consumption, even though no association was found for self-reported fish consumption. In paper 2, intake of fatty acids according to two dietary assessment methods are compared to the proportion of the same fatty acids measured in erythrocytes. Unfortunately, no method gives a completely valid estimate of intake and only relative comparisons are possible. Underestimations, especially of foods considered as unhealthy, are common with all dietary assessment methods and the tendency to underreport varies with sex, age and body mass index, etc. (84). Also, standard values in the food database used may differ from the true composition of the consumed food, introducing error. Although never absolutely reflective of the true intake, biomarkers are not affected by memory or attitudes of the study subjects. Agreement between two independent measures in epidemiological studies, like a biomarker and a dietary assessment method, strengthens study conclusions. The elevated stroke risk found in men reporting high fish consumption (paper 3) could be regarded as unimportant due to uncertainty in self-reported fish consumption. However, the association between the biomarker EPA+DHA and higher stroke risk make a true relationship more probable even though this did not reach statistical significance.
BIOMARKERS OF FISH CONSUMPTION IN RELATION TO RISK
We detected a stronger relationship for risk reduction of MI for Ery-Hg than for EPA and DHA in plasma phospholipids (paper 4). Unpublished data on our study
General Discussion
38
population show a nearly equally good correlation with estimated intake of EPA and DHA by our FFQ or ten 24-HDR for Ery-Hg as for Ery-EPA+DHA. In a Finnish study evaluating biomarkers of fish consumption, correlations between FFQ estimated fish consumption and MeHg in blood were higher (Rs=0.43 and Rs=0.45, for men and women, respectively) as compared to S-EPA+DHA (Rs=0.38 and Rs=0.31, for men and women, respectively) (85). Even though levels of MeHg vary between fish species, age of fish and location of harvest, it appears to reflect total fish consumption as well as EPA+DHA. The choice of biological sample is important. In paper 4, EPA+DHA was estimated in plasma phospholipids, reflecting days or weeks of fish consumption (62). This may result in a less precise estimation of the general fish consumption than if erythrocyte composition is used. Total Hg or EPA+DHA in erythrocytes, reflecting fish consumption over about a month, seem to be reasonable choices when blood samples are utilized. Because levels of fatty acids measured are in proportion of total intake of fatty acids, total Hg may even be a better choice as a fish consumption biomarker. However, for individuals consuming fish species high in MeHg, fish consumption would be overestimated if Hg or MeHg is the biomarker of choice. When considering the results of paper 4 it is necessary to determine whether Ery-Hg represents a stable marker of consumption of fish (containing other protective nutrients) or a marker for a healthy lifestyle, or a combination of these factors. This question has been brought up by some researchers in the field and associations between fish consumption and healthy lifestyle have been detected in different populations (86, 87). In our MI study, no correlations were found between Ery-Hg and lifestyle variables (except for a weak correlation with self-reported fish consumption). Self-reported fish consumption, on the other hand, showed significant correlations, although weak, with self-reported physical activity and consumption of fruit and vegetables. Because of this, in combination with the lack of correlation between biomarkers of fish consumption and other healthy behaviours, a “tendency to report healthy-bias” is suspected. Our yet unpublished study on the association between fish consumption and consumption of other foods and health behaviours has demonstrated strong associations between fish consumption and healthy behaviours in both men and women. However, in paper 4, the protective association for Ery-Hg persisted even after adjustment for the life style variables such as consumption of fruit and vegetables, physical inactivity, educational level, consumption of strong beer and of wine, in addition to traditional risk factors. Even though this consistency strengthens the assumption that fish consumption is protective, it cannot be completely ruled out that the protective association for Ery-Hg is partly due to associations with healthy behaviours or socioeconomic status that have not been adjusted for. A protective association, presumably due to fish consumption, is found between Ery-Hg and risk of MI (paper 4), but not for risk of stroke (paper 3). There is more available data supporting a protective effect of fish consumption on MI risk compared to stroke risk. To some extent, similar mechanisms underlie the development of MI and ischemic stroke, but there are also differences which can be of relevance for this discrepancy. Decreased risk of arrhythmia by fatty acids from fish is one mechanism protecting against MI, but not stroke. In paper 4, we find even lower ORs for SCD with Ery-Hg levels than for total MI, which strengthens the antiarrhythmic hypothesis. Several of the RCTs that have been conducted on fish consumption or fish oil supplementation and cardiovascular disease favour the antiarrythmic theory, at
General Discussion
39
least for secondary-prevention (28, 32). We have no explanation for the finding of elevated stroke risk in men reporting high fish consumption. The planned follow-up study will be of importance. If the finding is confirmed this ought to be investigated mechanistically further; what in fish is harmful to men, but not to women?
THE PROSPECTIVE CASE-CONTROL DESIGN
The prospective design in the case-control studies concerning risk of stroke or myocardial infarction (papers 3 and 4) has advantages; the disease process does not affect the questionnaire replies (decreased risk of recall bias) or the blood samples (no risk of reversed causality). However, the controls in these studies are likely to be healthier than the general population because subjects with previous MI, stroke or cancer were excluded from the study (risk of selection bias). No indications of such differences were found when the baseline data of the controls were compared to surveys of the general population (88). Another problem with the case-control design arises in the multivariate analyses; if one adjustment variable is missing in the case or all controls in a set, the whole set is excluded from the analysis. With a cohort design only the single individual with a missing value would have been lost. However, chemical analyses of fatty acids are expensive, and so are analysis of mercury and selenium in erythrocytes, making this a financial issue. In the prospective case-control studies, the time that had past between baseline and illness varied widely between cases (from 4 days to eleven years in the MI study). The risk of behavioral changes increases as time elapses. Also, a lifestyle intervention was included in the VIP health screening with the intention of improving lifestyle for individuals. The effects of these interventions can be expected to be similar in cases and controls due to the prospective design. The expected effect of this, if any, would be a dilution of associations.
BALANCE BETWEEN GOOD AND BAD IN FISH
Pooled data from the Swedish population with low MeHg exposure and the Finnish population with higher exposure to MeHg suggests that the balance between exposure to Hg and fatty acids EPA+DHA in fish is of importance to the risk of MI. The best choice would obviously be fish high in fatty acids and low in MeHg. The decrease in Ery-Hg from 1990 to 1999, found in paper 1, is gratifying. It can only be partially be explained by a decrease in fish consumption. Thus, a decrease in MeHg in locally caught fish and/or a change to fish species lower in MeHg are plausible explanations. In the studies in this thesis mean fish consumption varies between 0.89 times/week (men in 1994 in paper 1) and 1.56 times/week (women in paper 3). This level of consumption is too low when compared to existing recommendations. The European Food Safety Authority (EFSA) has recently set the recommendation to intake of 250 mg/day of EPA+DHA (corresponding to about 1-2 servings of fatty fish per week) (89). The recommendation from American Heart Association (AHA) is an intake of 500 mg/day of EPA+DHA for individuals without CHD and 1000 mg/day for those with CHD (90). The Swedish Food Administration recommends consumption of fish and shellfish 2-3 times per week with variation in species (83).
General Discussion
40
As compared to the reference group (represented by individuals with median S-EPA+DHA at 4% and hair-Hg at 1 µg/g), individuals in the pooled MI study with relative S-EPA+DHA at 6% or higher had a significantly lower relative risk of MI if simultaneously low levels of hair-Hg (below 1 µg/g) were found. With higher S-EPA+DHA, protective associations can be found despite somewhat higher mercury levels. It is not possible to exactly define what 6% S-EPA+DHA corresponds to in intake of fish or fatty acids EPA+DHA. Different fish contain different amounts of EPA+DHA. Also, S-EPA+DHA is expressed as a proportion of total intake of fatty acids. To make a rough estimation from our MI study (paper 4), where the mean intake of fish in male controls from northern Sweden were 1.25 intakes per week (fat fish 0.57 intakes per week and lean fish 0.70 intakes per week) and the median level of S-EPA+DHA were 4.2 %, a S-EPA+DHA level of 6% would correspond to about 1.8 intakes of fish per week. A S-EPA+DHA at 8% (i.e., the highest level on the horizontal axis in Figure 8) would than correspond to 2.4 intakes of fish per week. Thus, based on our pooled data, fish consumption according to the recommendations from the Swedish Food Administration (2-3 times/week) would place the individuals at about 6-8 %, a level sufficient to achieve a significant protection against MI as long as fish species high in Hg are avoided and at least one meal consists of fatty fish.
FISH OR FISH OIL SUPPLEMENTS?
It can be claimed that a simple way to get the beneficial fatty acids EPA+DHA without any contaminants is to take fish oil capsules instead of eating fish. However, these fatty acids may not be the only cardioprotective nutrients in fish. Selenium and vitamin D have been pointed out as possible cardioprotective agents (9, 10) and fish is a good source of both. A fish meal generally replaces a meal that is likely to contain more saturated fat, known to increase risk of CVD (91). Also, fish contains high quality protein. Beneficial effects on CVD risk of the amino acid derivate taurine, concentrated in fish, have been reported (92). Therefore, fish consumption is preferred. However, if fish consumption is not possible (due to for example fish allergy or a vegetarian diet), fish oil supplements should be considered (33).

Conclusions
41
CONCLUSIONS
Burdens of mercury and lead decreased in the population of northern Sweden during the 1990´s to median levels considered harmless. Cadmium levels are still of concern in this population, especially in women, and future steps to reduce cadmium pollution are needed.
The food frequency questionnaire (FFQ) used in the Northern Sweden MONICA Study has a fair ability to reflect intake of the essential “fish fatty acids” EPA and DHA and thus even consumption of fatty fish. However, the small variation in fish consumption in this population, in combination with shortcomings resulting from alterations to the FFQ, make associations (or especially the absence of associations) between self-reported fish consumption and disease outcome less reliable. Therefore, complementary analyses with biomarkers are valuable.
An elevated risk of ischemic stroke was found in men reporting fish consumption more than three times a week, but this was not found in women. The gender discrepancy could not be explained by lifestyle differences related to fish consumption. Mercury is not the causal agent as mercury was not associated with risk of stroke.
Mercury levels in erythrocytes were associated with a lower risk of myocardial infarction in this population with low exposure, both in men and women. This is likely explained by mercury in erythrocytes being a stable biomarker for consumption of fish which contain other protective agents. However, a high mercury level, especially in combination with low levels of protective fatty acids EPA and DHA, probably increases the risk of myocardial infarction.

Acknowledgments
42
ACKNOWLEDGEMENTS I would like to thank the following people for contributing to this thesis in different ways: The participants in the Northern Sweden Health and Disease Study, for your contribution to medical research. Jan-Håkan Jansson and Ingvar Bergdahl, my supervisors, for being such a supportive and complementary team and for guidance in scientific research. My collaborators at the Department of Occupational and Environmental Medicine at Lund University, especially Ulf Strömberg, for sharing your knowledge in statistics, Staffan Skerfving, for sharing your knowledge in environmental science and Thomas Lundh, for sharing your knowledge in analytical chemistry. My other coauthors who have contributed valuable insights to the publications: Bengt Vessby, Birgitta Stegmayr, Göran Hallmans, Ingegerd Johansson and Margareta Norberg. All my colleagues working with the PHIME-project who have contributed comments and discussions at our meetings. Anna-Sara Molin and Åsa Ågren at the Northern Sweden Medical Research Bank, for your assistance in gaining access to the data and answering all my many questions. My colleagues at the Department of Occupational and Environmental Medicine at Umeå University that have been supportive along the way, especially Anneli Sundkvist, Nils-Göran Lundström, Bodil Björ, Johan Nilsson and Andreas Tornevi. My colleagues at Forskningsenheten at Skellefteå lasarett, for helpful comments and discussions during the process of preparing this thesis. Thomas Suh, for professional and careful proofreading. Wulf Becker at the National Food Administration, for assistance with the food composition database. My parents, Inga-Lill and Bengt, and my brother, Olof, for invaluable practical and emotional support. Patrik, for your impressive patience with me (and with my computer) and for leading the way. Thea and Linn, for making life great. The studies in this thesis were part of the European Union Sixth Framework Programme project PHIME (Public health impact of long-term, low-level mixed element exposure in susceptible population strata).

References
43
REFERENCES 1. World Health Organization. Internet:
http://www.who.int/mediacenter/factsheets/fs317/en/index.html. 2010. 2. National Board of Health and Welfare. Cause of death 2007; official statistics of Sweden 2009. 3. Hansson GK. Inflammation, atherosclerosis, and coronary artery disease. N Engl J Med 2005 Apr
21;352(16):1685-95. 4. Sudlow CL, Warlow CP. Comparable studies of the incidence of stroke and its pathological types: results
from an international collaboration. International Stroke Incidence Collaboration. Stroke 1997 Mar;28(3):491-9.
5. Goldstein LB, Adams R, Alberts MJ, Appel LJ, Brass LM, Bushnell CD, et al. Primary prevention of ischemic stroke: a guideline from the American Heart Association/American Stroke Association Stroke Council: cosponsored by the Atherosclerotic Peripheral Vascular Disease Interdisciplinary Working Group; Cardiovascular Nursing Council; Clinical Cardiology Council; Nutrition, Physical Activity, and Metabolism Council; and the Quality of Care and Outcomes Research Interdisciplinary Working Group: the American Academy of Neurology affirms the value of this guideline. Stroke 2006 Jun;37(6):1583-633.
6. Yusuf S, Hawken S, Ounpuu S, Dans T, Avezum A, Lanas F, et al. Effect of potentially modifiable risk factors associated with myocardial infarction in 52 countries (the INTERHEART study): case-control study. Lancet 2004 Sep 11-17;364(9438):937-52.
7. Bang HO, Dyerberg J, Sinclair HM. The composition of the Eskimo food in north western Greenland. Am J Clin Nutr 1980 Dec;33(12):2657-61.
8. Dyerberg J, Bang HO, Stoffersen E, Moncada S, Vane JR. Eicosapentaenoic acid and prevention of thrombosis and atherosclerosis? Lancet 1978 Jul 15;2(8081):117-9.
9. Navas-Acien A, Bleys J, Guallar E. Selenium intake and cardiovascular risk: what is new? Curr Opin Lipidol 2008 Feb;19(1):43-9.
10. Mertens PR, Muller R. Vitamin D and cardiovascular risk. Int Urol Nephrol 2010 Mar;42(1):165-71. 11. Harris WS, Miller M, Tighe AP, Davidson MH, Schaefer EJ. Omega-3 fatty acids and coronary heart
disease risk: clinical and mechanistic perspectives. Atherosclerosis 2008 Mar;197(1):12-24. 12. Burdge GC, Calder PC. Conversion of alpha-linolenic acid to longer-chain polyunsaturated fatty acids in
human adults. Reprod Nutr Dev 2005 Sep-Oct;45(5):581-97. 13. Chan JK, McDonald BE, Gerrard JM, Bruce VM, Weaver BJ, Holub BJ. Effect of dietary alpha-linolenic acid
and its ratio to linoleic acid on platelet and plasma fatty acids and thrombogenesis. Lipids 1993 Sep;28(9):811-7.
14. Wang C, Harris WS, Chung M, Lichtenstein AH, Balk EM, Kupelnick B, et al. n-3 Fatty acids from fish or fish-oil supplements, but not alpha-linolenic acid, benefit cardiovascular disease outcomes in primary- and secondary-prevention studies: a systematic review. Am J Clin Nutr 2006 Jul;84(1):5-17.
15. Sarwar N, Danesh J, Eiriksdottir G, Sigurdsson G, Wareham N, Bingham S, et al. Triglycerides and the risk of coronary heart disease: 10,158 incident cases among 262,525 participants in 29 Western prospective studies. Circulation 2007 Jan 30;115(4):450-8.
16. Freiberg JJ, Tybjaerg-Hansen A, Jensen JS, Nordestgaard BG. Nonfasting triglycerides and risk of ischemic stroke in the general population. JAMA 2008 Nov 12;300(18):2142-52.
17. Harris WS. n-3 fatty acids and serum lipoproteins: human studies. Am J Clin Nutr 1997 May;65(5 Suppl):1645S-54S.
18. Eslick GD, Howe PR, Smith C, Priest R, Bensoussan A. Benefits of fish oil supplementation in hyperlipidemia: a systematic review and meta-analysis. Int J Cardiol 2009 Jul 24;136(1):4-16.
19. Geleijnse JM, Giltay EJ, Grobbee DE, Donders AR, Kok FJ. Blood pressure response to fish oil supplementation: metaregression analysis of randomized trials. J Hypertens 2002 Aug;20(8):1493-9.
20. Kannel WB, Kannel C, Paffenbarger RS, Jr., Cupples LA. Heart rate and cardiovascular mortality: the Framingham Study. Am Heart J 1987 Jun;113(6):1489-94.
21. Mozaffarian D, Geelen A, Brouwer IA, Geleijnse JM, Zock PL, Katan MB. Effect of fish oil on heart rate in humans: a meta-analysis of randomized controlled trials. Circulation 2005 Sep 27;112(13):1945-52.
22. Leon H, Shibata MC, Sivakumaran S, Dorgan M, Chatterley T, Tsuyuki RT. Effect of fish oil on arrhythmias and mortality: systematic review. BMJ 2008;337:a2931.

References
44
23. Leaf A, Kang JX, Xiao YF, Billman GE. Clinical prevention of sudden cardiac death by n-3 polyunsaturated fatty acids and mechanism of prevention of arrhythmias by n-3 fish oils. Circulation 2003 Jun 3;107(21):2646-52.
24. Ross R. Atherosclerosis--an inflammatory disease. N Engl J Med 1999 Jan 14;340(2):115-26. 25. Calder PC. N-3 polyunsaturated fatty acids and inflammation: from molecular biology to the clinic. Lipids
2003 Apr;38(4):343-52. 26. Calder PC. n-3 Fatty acids and cardiovascular disease: evidence explained and mechanisms explored. Clin
Sci (Lond) 2004 Jul;107(1):1-11. 27. Thies F, Garry JM, Yaqoob P, Rerkasem K, Williams J, Shearman CP, et al. Association of n-3
polyunsaturated fatty acids with stability of atherosclerotic plaques: a randomised controlled trial. Lancet 2003 Feb 8;361(9356):477-85.
28. Burr ML, Fehily AM, Gilbert JF, Rogers S, Holliday RM, Sweetnam PM, et al. Effects of changes in fat, fish, and fibre intakes on death and myocardial reinfarction: diet and reinfarction trial (DART). Lancet 1989 Sep 30;2(8666):757-61.
29. Burr ML, Ashfield-Watt PA, Dunstan FD, Fehily AM, Breay P, Ashton T, et al. Lack of benefit of dietary advice to men with angina: results of a controlled trial. Eur J Clin Nutr 2003 Feb;57(2):193-200.
30. Marchioli R, Barzi F, Bomba E, Chieffo C, Di Gregorio D, Di Mascio R, et al. Early protection against sudden death by n-3 polyunsaturated fatty acids after myocardial infarction: time-course analysis of the results of the Gruppo Italiano per lo Studio della Sopravvivenza nell'Infarto Miocardico (GISSI)-Prevenzione. Circulation 2002 Apr 23;105(16):1897-903.
31. Yokoyama M, Origasa H, Matsuzaki M, Matsuzawa Y, Saito Y, Ishikawa Y, et al. Effects of eicosapentaenoic acid on major coronary events in hypercholesterolaemic patients (JELIS): a randomised open-label, blinded endpoint analysis. Lancet 2007 Mar 31;369(9567):1090-8.
32. Dietary supplementation with n-3 polyunsaturated fatty acids and vitamin E after myocardial infarction: results of the GISSI-Prevenzione trial. Gruppo Italiano per lo Studio della Sopravvivenza nell'Infarto miocardico. Lancet 1999 Aug 7;354(9177):447-55.
33. He K. Fish, long-chain omega-3 polyunsaturated fatty acids and prevention of cardiovascular disease--eat fish or take fish oil supplement? Prog Cardiovasc Dis 2009 Sep-Oct;52(2):95-114.
34. He K, Song Y, Daviglus ML, Liu K, Van Horn L, Dyer AR, et al. Accumulated evidence on fish consumption and coronary heart disease mortality: a meta-analysis of cohort studies. Circulation 2004 Jun 8;109(22):2705-11.
35. Konig A, Bouzan C, Cohen JT, Connor WE, Kris-Etherton PM, Gray GM, et al. A quantitative analysis of fish consumption and coronary heart disease mortality. Am J Prev Med 2005 Nov;29(4):335-46.
36. Bouzan C, Cohen JT, Connor WE, Kris-Etherton PM, Gray GM, Konig A, et al. A quantitative analysis of fish consumption and stroke risk. Am J Prev Med 2005 Nov;29(4):347-52.
37. Hooper L, Thompson RL, Harrison RA, Summerbell CD, Ness AR, Moore HJ, et al. Risks and benefits of omega 3 fats for mortality, cardiovascular disease, and cancer: systematic review. BMJ 2006 Apr 1;332(7544):752-60.
38. Mozaffarian D. Fish and n-3 fatty acids for the prevention of fatal coronary heart disease and sudden cardiac death. Am J Clin Nutr 2008 Jun;87(6):1991S-6S.
39. Kris-Etherton PM, Harris WS, Appel LJ. Fish consumption, fish oil, omega-3 fatty acids, and cardiovascular disease. Circulation 2002 Nov 19;106(21):2747-57.
40. von Schacky C. Omega-3 fatty acids and cardiovascular disease. Curr Opin Clin Nutr Metab Care 2004 Mar;7(2):131-6.
41. Bucher HC, Hengstler P, Schindler C, Meier G. N-3 polyunsaturated fatty acids in coronary heart disease: a meta-analysis of randomized controlled trials. Am J Med 2002 Mar;112(4):298-304.
42. He K, Song Y, Daviglus ML, Liu K, Van Horn L, Dyer AR, et al. Fish consumption and incidence of stroke: a meta-analysis of cohort studies. Stroke 2004 Jul;35(7):1538-42.
43. Holben DH, Smith AM. The diverse role of selenium within selenoproteins: a review. J Am Diet Assoc 1999 Jul;99(7):836-43.
44. The National Food Administration in Sweden. Internet: http://www.slv.se/sv/grupp1/Mat-och-naring/Vad-innehaller-maten/Salt--mineraler/Selen-/. 2009.
45. Burk RF. Selenium, an antioxidant nutrient. Nutr Clin Care 2002 Mar-Apr;5(2):75-9. 46. Laclaustra M, Navas-Acien A, Stranges S, Ordovas JM, Guallar E. Serum selenium concentrations and
hypertension in the US Population. Circ Cardiovasc Qual Outcomes 2009 Jul;2(4):369-76.

References
45
47. Stranges S, Marshall JR, Natarajan R, Donahue RP, Trevisan M, Combs GF, et al. Effects of long-term selenium supplementation on the incidence of type 2 diabetes: a randomized trial. Ann Intern Med 2007 Aug 21;147(4):217-23.
48. Stranges S, Laclaustra M, Ji C, Cappuccio FP, Navas-Acien A, Ordovas JM, et al. Higher selenium status is associated with adverse blood lipid profile in British adults. J Nutr 2010 Jan;140(1):81-7.
49. Mozaffarian D. Fish, mercury, selenium and cardiovascular risk: current evidence and unanswered questions. Int J Environ Res Public Health 2009 Jun;6(6):1894-916.
50. Clarkson TW, Magos L, Myers GJ. The toxicology of mercury--current exposures and clinical manifestations. N Engl J Med 2003 Oct 30;349(18):1731-7.
51. Lindestrom L. Mercury in sediment and fish communities of Lake Vanern, Sweden: recovery from contamination. Ambio 2001 Dec;30(8):538-44.
52. Storelli MM, Giacominelli Stuffler R, Storelli A, Marcotrigiano GO. Total mercury and methylmercury content in edible fish from the Mediterranean Sea. J Food Prot 2003 Feb;66(2):300-3.
53. Petersson-Grawé K, Concha G, Ankarberg E. Risk Assessment of Methylmercury in fish, National Food Administration S; 2007. Report No.: 10.
54. Li P, Feng X, Qiu G, Shang L, Wang S. Mercury exposure in the population from Wuchuan mercury mining area, Guizhou, China. Sci Total Environ 2008 Jun 1;395(2-3):72-9.
55. Debes F, Budtz-Jorgensen E, Weihe P, White RF, Grandjean P. Impact of prenatal methylmercury exposure on neurobehavioral function at age 14 years. Neurotoxicol Teratol 2006 May-Jun;28(3):363-75.
56. Davidson PW, Strain JJ, Myers GJ, Thurston SW, Bonham MP, Shamlaye CF, et al. Neurodevelopmental effects of maternal nutritional status and exposure to methylmercury from eating fish during pregnancy. Neurotoxicology 2008 Sep;29(5):767-75.
57. Virtanen JK, Voutilainen S, Rissanen TH, Mursu J, Tuomainen TP, Korhonen MJ, et al. Mercury, fish oils, and risk of acute coronary events and cardiovascular disease, coronary heart disease, and all-cause mortality in men in eastern Finland. Arterioscler Thromb Vasc Biol 2005 Jan;25(1):228-33.
58. Guallar E, Sanz-Gallardo MI, van't Veer P, Bode P, Aro A, Gomez-Aracena J, et al. Mercury, fish oils, and the risk of myocardial infarction. N Engl J Med 2002 Nov 28;347(22):1747-54.
59. Yoshizawa K, Rimm EB, Morris JS, Spate VL, Hsieh CC, Spiegelman D, et al. Mercury and the risk of coronary heart disease in men. N Engl J Med 2002 Nov 28;347(22):1755-60.
60. Hallgren CG, Hallmans G, Jansson JH, Marklund SL, Huhtasaari F, Schutz A, et al. Markers of high fish intake are associated with decreased risk of a first myocardial infarction. Br J Nutr 2001 Sep;86(3):397-404.
61. Ahlqwist M, Bengtsson C, Lapidus L, Gergdahl IA, Schutz A. Serum mercury concentration in relation to survival, symptoms, and diseases: results from the prospective population study of women in Gothenburg, Sweden. Acta Odontol Scand 1999 Jun;57(3):168-74.
62. Arab L. Biomarkers of fat and fatty acid intake. J Nutr 2003 Mar;133 Suppl 3:925S-32S. 63. Cernichiari E, Toribara TY, Liang L, Marsh DO, Berlin MW, Myers GJ, et al. The biological monitoring of
mercury in the Seychelles study. Neurotoxicology 1995 Winter;16(4):613-28. 64. Berglund M, Lind B, Bjornberg KA, Palm B, Einarsson O, Vahter M. Inter-individual variations of human
mercury exposure biomarkers: a cross-sectional assessment. Environ Health 2005;4:20. 65. Bjorkman L, Lundekvam BF, Laegreid T, Bertelsen BI, Morild I, Lilleng P, et al. Mercury in human brain,
blood, muscle and toenails in relation to exposure: an autopsy study. Environ Health 2007;6:30. 66. Regitz-Zagrosek V, Lehmkuhl E, Weickert MO. Gender differences in the metabolic syndrome and their
role for cardiovascular disease. Clin Res Cardiol 2006 Mar;95(3):136-47. 67. Nordberg M, Winblad B, Fratiglioni L, Basun H. Lead concentrations in elderly urban people related to
blood pressure and mental performance: results from a population-based study. Am J Ind Med 2000 Sep;38(3):290-4.
68. Olsson IM, Bensryd I, Lundh T, Ottosson H, Skerfving S, Oskarsson A. Cadmium in blood and urine--impact of sex, age, dietary intake, iron status, and former smoking--association of renal effects. Environ Health Perspect 2002 Dec;110(12):1185-90.
69. Stegmayr B, Lundberg V, Asplund K. The events registration and survey procedures in the Northern Sweden MONICA Project. Scand J Public Health Suppl 2003;61:9-17.
70. Weinehall L, Hellsten G, Boman K, Hallmans G. Prevention of cardiovascular disease in Sweden: the Norsjo community intervention programme--motives, methods and intervention components. Scand J Public Health Suppl 2001;56:13-20.
References
46
71. Weinehall L, Hallgren CG, Westman G, Janlert U, Wall S. Reduction of selection bias in primary prevention of cardiovascular disease through involvement of primary health care. Scand J Prim Health Care 1998 Sep;16(3):171-6.
72. Johansson I, Hallmans G, Wikman A, Biessy C, Riboli E, Kaaks R. Validation and calibration of food-frequency questionnaire measurements in the Northern Sweden Health and Disease cohort. Public Health Nutr 2002 Jun;5(3):487-96.
73. Asplund K, Tuomilehto J, Stegmayr B, Wester PO, Tunstall-Pedoe H. Diagnostic criteria and quality control of the registration of stroke events in the MONICA project. Acta Med Scand Suppl 1988;728:26-39.
74. Sandborgh-Englund G, Elinder CG, Langworth S, Schutz A, Ekstrand J. Mercury in biological fluids after amalgam removal. J Dent Res 1998 Apr;77(4):615-24.
75. Boberg M, Croon LB, Gustafsson IB, Vessby B. Platelet fatty acid composition in relation to fatty acid composition in plasma and to serum lipoprotein lipids in healthy subjects with special reference to the linoleic acid pathway. Clin Sci (Lond) 1985 May;68(5):581-7.
76. Wirfalt E, Vessby B, Mattisson I, Gullberg B, Olsson H, Berglund G. No relations between breast cancer risk and fatty acids of erythrocyte membranes in postmenopausal women of the Malmo Diet Cancer cohort (Sweden). Eur J Clin Nutr 2004 May;58(5):761-70.
77. Smedman AE, Gustafsson IB, Berglund LG, Vessby BO. Pentadecanoic acid in serum as a marker for intake of milk fat: relations between intake of milk fat and metabolic risk factors. Am J Clin Nutr 1999 Jan;69(1):22-9.
78. Barany E, Bergdahl IA, Schutz A, Skerfving S, Oskarsson A. Inductively coupled plasma mass spectrometry for direct multi-element analysis of diluted human blood and serum. J Anal Atomic Spectrometry 1997;12:1005-9.
79. Fellbrink L. Mercury Levels in Pike in Lakes of Västerbotten County in Sweden.: Department of Natural Geographics, Umeå University 2002.
80. The Swedish board of agriculture. Internet: http//statistik.sjv.se/Dialog/varval.asp?ma=DK06&ti=Direktkonsumtion&path=../Database/Jordbruksverket/Konsumtion%20av%20livsmedel%20%28ej%20officiell%20statistik%29/&lang=2. 2010.
81. Jarup L, Akesson A. Current status of cadmium as an environmental health problem. Toxicol Appl Pharmacol 2009 Aug 1;238(3):201-8.
82. Peters JL, Perlstein TS, Perry MJ, McNeely E, Weuve J. Cadmium exposure in association with history of stroke and heart failure. Environ Res 2010 Feb;110(2):199-206.
83. The National Food Administration in Sweden. Internet: http://www.slv.se/sv/grupp1/Mat-och-naring/kostrad/Rad-om-fisk/. 2010.
84. Johansson G, Wikman A, Ahren AM, Hallmans G, Johansson I. Underreporting of energy intake in repeated 24-hour recalls related to gender, age, weight status, day of interview, educational level, reported food intake, smoking habits and area of living. Public Health Nutr 2001 Aug;4(4):919-27.
85. Turunen AW, Mannisto S, Kiviranta H, Marniemi J, Jula A, Tiittanen P, et al. Dioxins, polychlorinated biphenyls, methyl mercury and omega-3 polyunsaturated fatty acids as biomarkers of fish consumption. Eur J Clin Nutr 2010 Mar;64(3):313-23.
86. Cundiff DK, Lanou AJ, Nigg CR. Relation of omega-3 Fatty Acid intake to other dietary factors known to reduce coronary heart disease risk. Am J Cardiol 2007 May 1;99(9):1230-3.
87. Panagiotakos DB, Pitsavos C, Zampelas A, Chrysohoou C, Griffin BA, Stefanadis C, et al. Fish consumption and the risk of developing acute coronary syndromes: the CARDIO2000 study. Int J Cardiol 2005 Jul 20;102(3):403-9.
88. Jansson JH, Boman K, Messner T. Trends in blood pressure, lipids, lipoproteins and glucose metabolism in the Northern Sweden MONICA project 1986-99. Scand J Public Health Suppl 2003;61:43-50.
89. European Food Safety Authority. Internet: www.efsa.europa.eu/en/scdocs/scdoc/1176.htm. 2010. 90. American Heart Association. Internet:
www.americanheart.org/presenter.jhtml?identifier=3071540#aha_recs_for_omega_3_fatty_acids. 2010.
91. Erkkila A, de Mello VD, Riserus U, Laaksonen DE. Dietary fatty acids and cardiovascular disease: an epidemiological approach. Prog Lipid Res 2008 May;47(3):172-87.
92. Yamori Y, Liu L, Ikeda K, Miura A, Mizushima S, Miki T, et al. Distribution of twenty-four hour urinary taurine excretion and association with ischemic heart disease mortality in 24 populations of 16 countries: results from the WHO-CARDIAC study. Hypertens Res 2001 Jul;24(4):453-7.