Biology and assessment of the painted sweetlips Diagramma ...
14
75 Abst r ac t —The population biology and status of the painted sweeplips ( Diagramma pictum) and spangled emperor (Lethrinus nebulosus) in the southern Arabian Gulf were estab- lished by using a combination of size-frequency, biological, and size- at-age data. Transverse sections of sagittal otoliths were characterized by alternating translucent and opaque bands that were validated as annuli. Comparisons of growth characteris- tics showed that there were no sig- nificant differences (P>0.05) between sexes. There were well defined peaks in the reproductive cycle, spawning occurred from April to May for both species, and the mean size at which females attained sexual maturity was 31.8 cm fork length (L F ) for D. pictum and 27.6 cm (L F ) for L. nebulosus. The mean sizes at first capture (21.1 cm L F for D. pictum and 26.4 cm L F for L. nebulosus) were smaller than the sizes for both at first sexual maturity and those at which yield per recruit would be maximized. The range of fishing-induced mortality rates for D. pictum (0.37−0.62/yr) was sub- stantially greater than the target (F opt =0.07/yr) and limit (F limit =0.09/ yr) estimates. The range of fishing- induced mortality rates for L. nebu- losus (0.15/yr to 0.57/yr) was also in excess of biological reference points (F opt =0.10/yr and F limit =0.13/yr). In addition to growth overfishing, the stocks were considered to be recruit- ment overfished because the biomass per recruit was less than 20% of the unexploited levels for both species. The results of the study are important to fisheries management authorities in the region because they indicate that both a reduction in fishing effort and mesh-size regulations are required for the demersal trap fishery. Manuscript submitted 29 December 2003 to the Scientific Editor’s Office. Manuscript approved for publication 11 July 2005 by the Scientific Editor. Fish. Bull. 104:75–88 (2006). Biology and assessment of the painted sweetlips ( Diagramma pictum (Thunberg, 1792)) and the spangled emperor ( Lethrinus nebulosus (Forsskål, 1775)) in the southern Arabian Gulf Edwin M. Grandcourt Thabit Z. Al Abdessalaam Ahmed T. Al Shamsi Franklin Francis Marine Environment Research Centre Environmental Research and Wildlife Development Agency Corniche Road P. O. Box 45553 Khalidiya Abu Dhabi, United Arab Emirates E-mail address (for E. M. Grandcourt): [email protected] The painted sweetlips ( Diagramma pictum (Thunberg, 1792)), is a member of the family Haemulidae and is widely distributed throughout the Indo-West Pacific, from the Red Sea and East Africa to Japan and New Caledonia (Randall et al., 1997). Adults are found in shallow coastal waters and coral reefs down to a depth of 80 m, and juveniles are often found in weedy areas (Smith and McKay, 1986). The diet of this species consists of benthic invertebrates and fishes (Sommer et al., 1996). It is a rela- tively large tropical species attaining 100 cm fork length and 6 kg in total weight (Torres, 1991); consequently it is exploited throughout its range with a variety of gears, including hand- lines, traps, and nets (Fischer and Bianchi, 1984). Diagramma. pictum has a gonochoristic reproductive mode and spawning occurs annually with one clear seasonal peak (Breder and Rosen, 1966). Fishes of the family Lethrinidae are abundant in the coastal tropical and subtropical Indo-Pacific (Young and Martin, 1982). The spangled em- peror (Lethrinus nebulosus (Forsskål, 1775)), is distributed throughout the Indo-West Pacific from the Red Sea and East Africa to southern Japan and Samoa. It is found in a variety of habitats including coral reefs, sea grass beds and mangroves from near shore to a depth of 75 m (Randall, 1995). Adults are either solitary or are found in small schools, and ju- veniles form large schools in shal- low, sheltered sandy areas. The diet of this species is mainly composed of mollusks, crustaceans, polychaete worms, and echinoderms (Fischer and Bianchi, 1984). As with other representatives of the family Lethrinidae, L. nebulosus is a protogynous hermaphrodite, and sexual transformation from female to male occurs over a wide range of sizes (Young and Martin, 1982; Ebisawa, 1990). Lethrinids are considered to have long spawning seasons, running from spring to at least early fall, with spring and fall peaks. Spawning oc- curs after dark for most species in aggregations along the inner or outer edge of the fringing reef (Johannes, 1981). Lethrinus nebulosus is a large tropical species reaching 80.0 cm total length and 8.4 kg total weight (Ran- dall, 1995) and is exploited through- out its range with a variety of gears (Fischer and Bianchi, 1984). Both species form an important part of fisheries landings in the southern Arabian Gulf, where they are mainly caught with dome-shaped wire traps that have a hexagonal mesh of ap- proximately 3.5 cm in diameter. Traps are either set individually or in strings from traditional wooden dhows, sets are made to a maximum depth of 40 m, and vessels fish an
Transcript of Biology and assessment of the painted sweetlips Diagramma ...

75
Abst r ac t —The population biology and status of the painted sweeplips (Diagramma pictum) and spangled emperor (Lethrinus nebulosus) in the southern Arabian Gulf were estab-lished by using a combination of size-frequency, biological, and size-at-age data. Transverse sections of sagittal otoliths were characterized by alternating translucent and opaque bands that were validated as annuli. Comparisons of growth characteris-tics showed that there were no sig-nificant differences (P>0.05) between sexes. There were well defined peaks in the reproductive cycle, spawning occurred from April to May for both species, and the mean size at which females attained sexual maturity was 31.8 cm fork length (LF) for D. pictum and 27.6 cm (LF) for L. nebulosus. The mean sizes at first capture (21.1 cm LF for D. pictum and 26.4 cm LF for L. nebulosus) were smaller than the sizes for both at first sexual maturity and those at which yield per recruit would be maximized. The range of fishing-induced mortality rates for D. pictum (0.37−0.62/yr) was sub-stantially greater than the target (Fopt=0.07/yr) and limit (F limit=0.09/ yr) estimates. The range of fishing-induced mortality rates for L. nebu-losus (0.15/yr to 0.57/yr) was also in excess of biological reference points (Fopt=0.10/yr and F limit=0.13/yr). In addition to growth overfishing, the stocks were considered to be recruit-ment overfished because the biomass per recruit was less than 20% of the unexploited levels for both species. The results of the study are important to fisheries management authorities in the region because they indicate that both a reduction in fishing effort and mesh-size regulations are required for the demersal trap fishery.
Manuscript submitted 29 December 2003 to the Scientific Editor’s Office.
Manuscript approved for publication 11 July 2005 by the Scientific Editor.
Fish. Bull. 104:75–88 (2006).
Biology and assessment of the painted sweetlips (Diagramma pictum (Thunberg, 1792)) and the spangled emperor (Lethrinus nebulosus (Forsskål, 1775)) in the southern Arabian Gulf
Edwin M. Grandcourt
Thabit Z. Al Abdessalaam
Ahmed T. Al Shamsi
Franklin Francis
Marine Environment Research Centre Environmental Research and Wildlife Development Agency Corniche Road P. O. Box 45553 Khalidiya Abu Dhabi, United Arab Emirates E-mail address (for E. M. Grandcourt): [email protected]
The painted sweetlips (Diagramma pictum (Thunberg, 1792)), is a member of the family Haemulidae and is widely distributed throughout the Indo-West Pacific, from the Red Sea and East Africa to Japan and New Caledonia (Randall et al., 1997). Adults are found in shallow coastal waters and coral reefs down to a depth of 80 m, and juveniles are often found in weedy areas (Smith and McKay, 1986). The diet of this species consists of benthic invertebrates and fishes (Sommer et al., 1996). It is a rela-tively large tropical species attaining 100 cm fork length and 6 kg in total weight (Torres, 1991); consequently it is exploited throughout its range with a variety of gears, including hand-lines, traps, and nets (Fischer and Bianchi, 1984). Diagramma. pictum has a gonochoristic reproductive mode and spawning occurs annually with one clear seasonal peak (Breder and Rosen, 1966).
Fishes of the family Lethrinidae are abundant in the coastal tropical and subtropical Indo-Pacific (Young and Martin, 1982). The spangled em-peror (Lethrinus nebulosus (Forsskål, 1775)), is distributed throughout the Indo-West Pacific from the Red Sea and East Africa to southern Japan and Samoa. It is found in a variety of habitats including coral reefs, sea grass beds and mangroves from near shore to a depth of 75 m (Randall,
1995). Adults are either solitary or are found in small schools, and ju-veniles form large schools in shal-low, sheltered sandy areas. The diet of this species is mainly composed of mollusks, crustaceans, polychaete worms, and echinoderms (Fischer and Bianchi, 1984).
As with other representatives of the family Lethrinidae, L. nebulosus is a protogynous hermaphrodite, and sexual transformation from female to male occurs over a wide range of sizes (Young and Martin, 1982; Ebisawa, 1990). Lethrinids are considered to have long spawning seasons, running from spring to at least early fall, with spring and fall peaks. Spawning oc-curs after dark for most species in aggregations along the inner or outer edge of the fringing reef (Johannes, 1981). Lethrinus nebulosus is a large tropical species reaching 80.0 cm total length and 8.4 kg total weight (Ran-dall, 1995) and is exploited through-out its range with a variety of gears (Fischer and Bianchi, 1984).
Both species form an important part of fisheries landings in the southern Arabian Gulf, where they are mainly caught with dome-shaped wire traps that have a hexagonal mesh of ap-proximately 3.5 cm in diameter. Traps are either set individually or in strings from traditional wooden dhows, sets are made to a maximum depth of 40 m, and vessels fish an

76 Fishery Bulletin 104(1)
Arabian Gulf
Figure 1 Study site (stippled area) showing the location of the Emirate of Abu Dhabi, off the coast of which data were collected for the painted sweetlips (Diagramma pictum) and spangled emperor (Lethrinus nebulosus) from commercial catches.
average of 210 traps each. Collection of catch-and-effort data for the fisheries of the Emirate of Abu Dhabi in the United Arab Emirates was initiated in 2001. However, many species, including D. pictum and L. nebulosus, are recorded to the family level, and therefore the use of statistical catch-at-age methods can not be used for conducting assessments at the species level. Landings of haemulids (predominantly D. pictum) and lethrinids (predominantly L. nebulosus), totaled 719 and 2911 metric tons, respectively, in the Emirate of Abu Dhabi during 2003 (Grandcourt et al.1). Despite the limited time scale for which catch and effort data are available, there has been an overall increase in fishing effort and catches since 2001.
Many of the fish populations in the Arabian Gulf have been heavily exploited (Samuel et al., 1987), and fishing effort may have already been above optimum levels for most demersal species (Siddeek et al., 1999). The expan-sion of the fishing fleet of the United Arab Emirates and the lack of appropriate data on most stocks underscore the need to assess the fisheries resources of the region. The goal of this study was to evaluate the status of D. pictum and L. nebulosus and to provide biological refer-
1 Grandcourt, E. M., F. Francis, A. Al Shamsi, K. Al Ali, and S. Al Ali. 2004. Annual fisheries statistics for Abu Dhabi Emirate 2003, 87 p. Environmental Research and Wildlife Development Agency, P.O. Box 45553, Government of Abu Dhabi, United Arab Emirates.
ence points and other pertinent information required for management. Specific objectives included establishing key demographic parameters by using validated age estimates, identifying reproductive characteristics and conducting yield-per-recruit analyses for the selected study species.
Materials and methods
Study site and sampling protocol
Size-frequency data were collected from commercial catches made off the coast of the Emirate of Abu Dhabi in the United Arab Emirates (Fig. 1) between September 2000 and March 2003. Fish were selected at random from landings and fork length (LF) was recorded to the nearest cm by using a measuring board. Monthly target sample sizes were 500 individuals per species.
Biological data was collected from specimens pur-chased from commercial catches between June 2002 and May 2003. Samples were obtained from 30 individuals of each species from a representative size range during the last week of each month. Standard length (LS), fork length (LF), and total length (LT) were recorded to the nearest mm by using a measuring board. Whole wet weight was measured with an electronic balance and recorded to the nearest g. The sex of a fish was deter-mined by macroscopic examination of the gonad, which

77 Grandcourt et al.: Biology and assessment of Diagramma pictum and Lethrinus nebulosus in the southern Arabian Gulf
was removed and subsequently weighed to 0.1 g with an electronic balance.
Sagittal otoliths were extracted, cleaned in water, dried, and stored in seed envelopes. One of each pair of sagittae was weighed to 0.1 mg, burnt on a hotplate until it changed to a dark brown color, and embedded in epoxy resin. Transverse sections through the nucleus (of approximately 200−300 μm thickness) were obtained by using a twin blade saw. Sections were mounted on glass slides and examined with a low-power microscope and transmitted light.
Age and growth
The number of opaque bands in transverse sections was recorded in addition to the optical characteristics of the outer margin (opaque or translucent). The proportion of samples with opaque or translucent margins was calculated for each month and used to infer the timing and periodicity of increment formation. The age at which the first opaque band formed was calculated as the time between the mean birth date and the time of formation of opaque bands. Subsequently, the absolute age was calculated as the age at formation of the first band plus the number of opaque bands outside the first band and the time between the formation of the last band and cap-ture. In order to establish the relationship of the timing of opaque zone formation with trends in sea water tem-perature, time series data were converted by using the scaling process given in Newman and Dunk (2003).
Growth was investigated by fitting the von Berta-lanffy growth function (von Bertalanffy, 1938) to size-at-age data using standard nonlinear optimization methods. The model was fitted to pooled data and each sex separately. The von Bertalanffy growth function is defined as follows:
Lt = L∞ (1 – e –k (t–t0)),
where Lt = length at time t; L∞ = the asymptotic length; k = the instantaneous growth coefficient; and t0 = the hypothetical time at which length is
equal to 0.
Growth curves were compared between sexes for each species by using the analysis of residual sums of squares method of Chen et al. (1992).
The growth performance index Φʹ (Gayanilo and Pau-ly, 1997) was calculated in order to provide a basis for the comparison of growth characteristics in terms of length:
Φʹ = Φ – 2/3 log10 (a),
3where Φ = log10 (k) + 0.67 log10 (W∞) and W∞ = aL∞ .
The constant, a, was derived from length-weight rela-tionships and k and L∞ were obtained from the von Bertalanffy growth function.
Parameters of the length-weight relationship were ob-tained by fitting the power function W = aLF
b to length and weight data where W is the total wet weight, a is a constant determined empirically, LF is the fork length, and b is close to 3.0 for species with isometric growth. Ratios of total length (LT) to fork length (LF) were also calculated for each species.
Reproduction
The mean size at first sexual maturity was estimated for females by fitting the logistic function to the proportion of mature fish in 2-cm (LF) size categories. The mean size at first maturity was taken as that at which 50% of individuals were mature. Gonadosomatic indices, calculated by expressing gonad weight as a proportion of total body weight, were plotted against the sample period by month to establish the timing and seasonality of spawning. The mean birth date was estimated from patterns in reproductive indices.
Population sex ratios were examined by using χ2 good-ness-of-fit tests. Independent tests were conducted to determine whether sex ratios differed significantly from unity for whole samples and for size and age categories within samples. The probability level was set at 0.05 (α=0.05) and Yates’s correction factor was used on ac-count of there being only one degree of freedom for each comparison. Juvenile retention was calculated as the proportion of fish in aggregated size-frequency samples below the mean size at first sexual maturity.
Mortality and selectivity
Size-at-age data were used to construct age-length keys following the method of Ricker (1975) and these were used to convert aggregated length-frequency data into age-frequency distributions. The number of fish above the age at which fish were fully recruited to the fishery was calculated as a proportion of the total number of fish. The annual instantaneous rate of total mortality (Z) was subsequently determined with the age-based catch curve method (Beverton and Holt, 1957). The natural logarithm of the number of fish in each age class was plotted against the corresponding age, and Z (±95% CI) was estimated from the descending slope of the best fitting line by using least-squares linear regression. Initial ascending points representing fish that were not fully recruited to the fishery were excluded from the analyses.
The annual instantaneous rate of total mortality was also estimated with the length-converted catch method of Pauly (1983). Pooled length-frequency samples were converted into relative age-frequency distributions by using parameters of the von Bertalanffy growth func-tion. The natural logarithm of the number of fish in each relative age group divided by the change in rela-tive age was plotted against the relative age, and Z (±95% CI) was estimated from the descending slope of the best fitting line with least-squares linear regres-sion. The estimates of Z from age-based and length-

78 Fishery Bulletin 104(1)
converted catch curves were compared by using a modified t-test (Sokal and Rohlf, 1995).
Backwards extrapolation of the length-con-verted catch curves was used to estimate the probability of capture data. Selectivity curves were generated by fitting a logistic function to the plot of the probability of cap-ture against size, from which values of the parameters L50, L75, and the size at which fish were fully recruited to the fishery (L100) were obtained.
Estimates of the annual instantaneous rate of natural mortality (M) were obtained for each species with the empirical equation derived by Hoenig (1983). Maximum age estimates of 31 years for D. pictum and 21 years for L. nebulosus from the literature (Loubens, 1980; Edwards and Shaher, 1991) were used because the maximum ages and sizes obtained in our study were considerably lower than other reported values.
The annual instantaneous rate of fish-ing-induced mortality (F) was calculated by subtracting the natural mortality rate (M) from the total mortality rate (Z) derived from age-based catch curves (F=Z–M). The calcu-lation was also made for the upper and lower 95% confidence intervals for estimates of Z in order to derive a range of fishing mortal-
A
B
Figure 2 Photomicrographs of transverse sections through the sagittal oto-liths of (A) Diagramma pictum, 56.0 cm LF and (B) Lethrinus nebu-losus, 45.7 cm LF. Dots show opaque zones (scale bar=1 mm). ity rate estimates. The exploitation rate (E)
was calculated as the proportion of the fish-ing mortality in relation to total mortality (E=F/Z).
Assessment of the fishery
Relative yield and biomass-per-recruit analyses were used to assess the fishery. Growth (k and L∞), mortal-ity (M), and selectivity (L50) parameters were used as model inputs, and knife-edge selection was assumed. The Beverton and Holt (1966) yield-per-recruit (YPR) model modified by Pauly and Soriano (1986) was used to estimate the sizes at maximum yield per recruit (Lmax) and to predict the effects of increasing the mean size at first capture (L50) to the mean size at first sexual maturity (Lmat) and that at which yield per recruit would be maximized (Lmax). Estimates of exploitation rates representing 1) a marginal increase of relative yield per recruit which is 0.1 of its value at the origin (E0.1) and 2) maximum yield (Emax) were also derived from the model. The exploitation rates corresponding to
and Elimit) were calculated and used Fopt and Flimit (Eopt to estimate the relative biomass per recruit for each species for L50, Lmat, and L from relative biomass-max per-recruit curves. Precautionary target (Fopt) and limit (F limit) biological reference points were calculated as 0.5 and 2/3 M, respectively, and used to infer resource status by direct comparison with the fishing mortality rates established for the study species.
Results
Age and growth
Alternating translucent and opaque growth increments were observed in transverse sections of the sagittal otoliths of D. pictum and L. nebulosus when viewed with transmitted light under low-power magnification (Fig. 2). For both species, one growth increment consist-ing of an opaque and translucent zone was formed on an annual basis. Opaque bands formed in the summer months between May and September in association with increasing sea water temperatures (Fig. 3); conversely translucent zones were deposited in the autumn and winter (October to February) in association with decreas-ing sea water temperatures.
The maximum age estimates determined from counts of opaque bands were 13 and 14 years for D. pictum and L. nebulosus, respectively. Size-at-age relationships were asymptotic in form and there was considerable individual variability in growth (Fig. 4) (parameters of the von Bertalanffy growth function are given in Table 1). A comparison of the growth characteristics between sexes revealed that there were no significant differ-ences in parameter estimates for both species (P=0.125, df=319 for D. pictum and P=0.878, df =324 for L. nebu-

79 Grandcourt et al.: Biology and assessment of Diagramma pictum and Lethrinus nebulosus in the southern Arabian Gulf
losus). Values of the growth performance index Φʹ for growth in length were 2.81 for D. pictum and 2.80 for L. nebulosus.
The length-weight relationship provided a good fit to length and weight data for D. pictum (W=1 × 10⁻⁵ × L2.99) (r2=0.994) and L. nebulosus (W= 3 × 10⁻⁵ × L2.88) (r2= 0.992). Ratios of total length (LT) to fork length (LF) were 1.11:1.0 for D. pictum and 1.07:1 for L. nebulosus.
Reproduction
The mean size at first sexual maturity (Lmat) for D. pictum was 30.7 cm LF for males (24.3−37.2 cm 95% CI) and 31.8 cm LF for females (24.3−38.9 cm 95% CI). Those for L. nebulosus were 28.6 cm LF (23.7–33.8 cm 95% CI) and 27.6 cm LF (19.6–35.6 cm 95% CI) for males and females, respectively.
There was a peak in the gonadosomatic index for both D. pictum and L. nebulosus females in April, the main spawning period lasted until the end of May (Fig. 5), and the mean birth date was estimated as 1 May. There was a significant (P<0.05) female bias in the overall sex ratios (male to female) of 1:2.8 for D. pictum and 1:2.6 for L. nebulosus. The results of chi-square good-ness-of-fit tests conducted for the sex ratios in both age and size categories revealed that the female bias was consistent across all categories for L. nebulosus although the bias was removed in the oldest age and largest size classes of D. pictum (Tables 2 and 3).
The proportion of fish in aggregated size-fre-quency samples that were below the mean size at first sexual maturity for females (juvenile re-tention rate) was 35.1% for D. pictum and 10.9% for L. nebulosus.
Mortality and selectivity
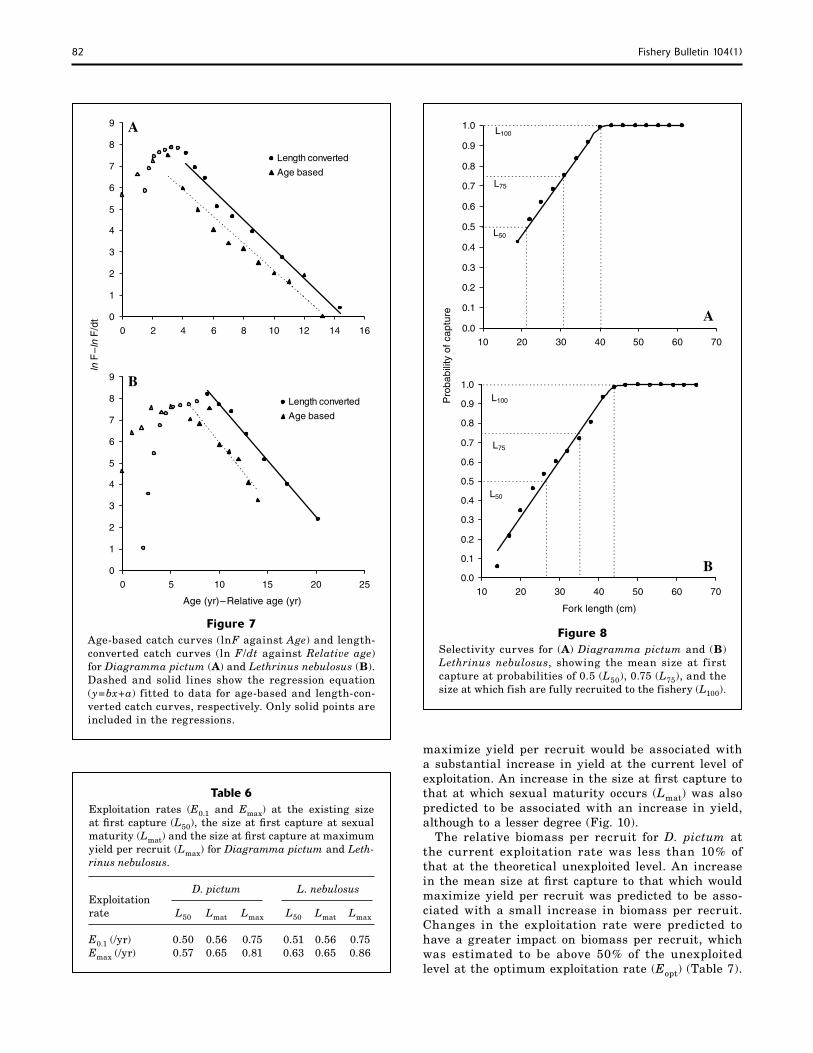
Modal age groups in age-frequency distributions derived from age-length keys and size-frequency data were 3 years for D. pictum and 5 years for L. nebulosus (Fig. 6). The proportion of fish above the age at which fish were fully recruited was 13.8% and 45.7% for D. pictum and L. nebulosus, respectively. There were no significant differences between the total mortality rate estimates derived from age-based and length-converted catch curves for D. pictum (t=0.81, P=0.43, 15 df) and L. nebulosus (t=0.03, P=0.98, 11 df) (Fig. 7). Fishing mortality rates were in excess of the natural mortality rates, accounting for 79% and 64% of the total mortality for D. pictum and L. nebulosus, respectively (Table 4).
The selectivity range derived from plots of the prob-ability of capture at size was 25.0 cm for D. pictum (18.0–43.0 cm) and 34.0 cm for L. nebulosus (13.0–47.0 cm) (Fig. 8). Values of the sizes where the probability of capture was 50% (L50), 75% (L75), and 100% (L100) are given in Table 5. For both species, fish were recruited
A) (n B) (n
0 1 2 3 4 5 6 7 8 9
0 1 2 3 4 5 6 7 8 9
lii
A
B
Figure 3 The proportion of otoliths with opaque outer margins for (Diagramma pictum =348) and ( Lethrinus. nebulosus =343) and monthly sea temperatures off the Emirate of Abu Dhabi. Note that the values have been converted to a standardized scale to enable comparison of the trends.
-0.1
0.0
0.1
0.2
0.3
0.4
0.5
0.6
0.7
0.8
0.9
1.0
1.1
10 11 12
Temp
% opaque
-0.1
0.0
0.1
0.2
0.3
0.4
0.5
0.6
0.7
0.8
0.9
1.0
1.1
10 11 12
Temp
% opaque S
cang
un
ts
Month
Table 1 Parameters of the von Bertalanffy growth function, coef-ficients of determination (r2), and sample sizes (n) for Dia-gramma pictum and Lethrinus nebulosus in the southern Arabian Gulf.
D. pictum L. nebulosus
Fe- Fe-Males males All Males males All
k 0.29 0.23 0.24 0.10 0.11 0.11
L∞ cm (LF) 60.6 63.8 63.0 69.9 65.2 66.2
t0 (yr) −1.2 −1.5 −1.4 −3.3 −2.9 −3.0
r2 0.86 0.83 0.84 0.91 0.88 0.79
n 81 244 325 86 244 330

80 Fishery Bulletin 104(1)
Fi(A)
(n= B) (n=
1 2 3 4 5 6 7 8 9
l
l
1 2 3 4 5 6 7 8 9
l
l
ic i
A
B
Fi
A) B) .
l
0
0 2 4 6 8
0 0 2 4 6 8
α
P
gure 5 Mean monthly gonadosomatic indices (± SE) for Diagramm pictum 359) and ( Lethrinus nebulosus
360).
0.0
1.0
2.0
3.0
4.0
10 11 12
Fema es
Ma es
0.0
1.0
2.0
3.0
4.0
5.0
6.0
7.0
10 11 12
Fema es
Ma es
Gon
ados
omat
ndex
(%
)
Month
gure 4 The von Bertalanffy growth function fitted to size-at-age relationships for ( Diagramma pictum and (Lethrinus nebulosus
For
k en
gth
(cm
)
Age (yr)
10
20
30
40
50
60
10 12 14
10
20
30
40
50
60
10 12 14
Table 2 Results of chi-square goodness-of-fit tests on sex ratios within age categories for Diagramma pictum and Lethrinus nebulosus (* significant at =0.05).
Age category (yr) No. of males No. of females Chi-square (total)
D. pictum
0−2 29 130 64.2 <0.01*
3−5 38 91 21.8 <0.01*
6−13 16 29 3.8 >0.05
L. nebulosus
0–2 34 93 27.4 <0.01*
3–6 29 88 29.8 <0.01*
7–14 27 69 18.4 <0.01*
A
Males
Females
B

81 Grandcourt et al.: Biology and assessment of Diagramma pictum and Lethrinus nebulosus in the southern Arabian Gulf
Table 3 Results of chi-square goodness-of-fit tests on sex ratios within size categories for Diagramma pictum and Lethri-nus nebulosus (*=significant at α=0.05).
Size Chi-category No. of No. of square (cm LF) males females (total) P
D. pictum
20−34 26 128 67.6 <0.01*
35−49 41 93 20.2 <0.01*
50−64 27 43 3.7 >0.05
L. nebulosus
15−29 40 121 40.8 <0.01*
30–44 41 89 17.7 <0.01*
45–54 26 73 22.3 <0.01*
Table 4 Mortality and exploitation rates (±95 CI) for Diagramma pictum and Lethrinus nebulosus.
D. pictum L. nebulosus
Total mortality rate/yr (Z)
(Age-based 0.63 (0.50–0.75) 0.56 (0.35–0.77) catch curve)
(Length-converted 0.69 (0.58–0.79) 0.56 (0.53–0.60) catch curve)
Natural mortality 0.13 0.20 rate/yr (M)
Fishing mortality 0.50 (0.37−0.62) 0.36 (0.15−0.57) rate/yr (F)
Exploitation 0.79 0.64 rate/yr (E)
Table 5 Probability of capture (selectivity) for Diagramma pictum and Lethrinus nebulosus.
D. pictum L. nebulosus Probability of capture cm (LF) cm (LF)
50% (L50) 21.1 26.4
75% (L75) 30.7 35.1
100% (L100) 40.3 43.8
0 0 1 2 3 4 5 6 7 8 9
nA
500
1000
1500
2000
10 11 12 13
= 5006
Freq
uenc
y
FiA)
B)
0 0 1 2 3 4 5 6 7 8 9
n =B
gure 6 Age-frequency distributions for ( Diagramma pictum and ( Lethrinus nebulosus derived from age-length keys and size-frequency data.
500
1000
1500
2000
10 11 12 13 14
13,129
Age group (yr)
to the fishery at a mean size (L50) which was smaller than the mean size at which first sexual maturity was attained (Lmat).
Assessment of the fishery
The size at which yield per recruit would be maximized (Lmax) was 44.4 cm (LF) for D. pictum and 36.9 cm (LF) for L. nebulosus. For both species, these values were considerably greater than the mean size at first capture and the mean size at first sexual maturity (Fig. 9).
The exploitation rate for D. pictum (0.79/yr) was greater than that which would maximize yield per re-cruit (0.57/yr) at the existing mean size at first capture (Table 6). Furthermore, the same yield per recruit could be achieved at a much lower exploitation rate and at an increased relative biomass per recruit (Fig. 10). The yield-per-recruit function also indicated that an increase in the size at first capture to that which would
82 Fishery Bulletin 104(1)
n F
–ln
F/d
t
9 1.0
8 0.9
7 0.8
0.7 6
0.6 5
0.5 4
0.4 3
0.3 2
0.2 1
0.1 0
0 2 4 6 8 10 12 14 16 0.0
10 20 30 40 50 60 70
ty o
f cap
ture
A
Length converted
Age based L75
L100
L50
A
l
9 1.0
8 0.9
7 0.8
6 0.7 P
roba
bili
0.6 5
0.5 4
0.4 3 0.3
2 0.2
1 0.1
0 0.0
0 5 10 15 20 25 10 20 30 40 50 60 70
Age (yr)–Relative age (yr) Fork length (cm)
Figure 7 Figure 8
Age-based catch curves (lnF against Age) and length-converted catch curves (ln F/dt against Relative age) for Diagramma pictum (A) and Lethrinus nebulosus (B). Dashed and solid lines show the regression equation (y=bx+a) fitted to data for age-based and length-con-
Selectivity curves for (A) Diagramma pictum and (B) Lethrinus nebulosus, showing the mean size at first capture at probabilities of 0.5 (L50), 0.75 (L75), and the size at which fish are fully recruited to the fishery (L100).
verted catch curves, respectively. Only solid points are included in the regressions.
maximize yield per recruit would be associated with a substantial increase in yield at the current level of exploitation. An increase in the size at first capture to
Table 6 that at which sexual maturity occurs (Lmat) was also Exploitation rates (E0.1 and Emax) at the existing size predicted to be associated with an increase in yield, at first capture (L50), the size at first capture at sexual although to a lesser degree (Fig. 10). maturity (Lmat) and the size at first capture at maximum The relative biomass per recruit for D. pictum at yield per recruit (Lmax) for Diagramma pictum and Leth- the current exploitation rate was less than 10% of rinus nebulosus. that at the theoretical unexploited level. An increase
in the mean size at first capture to that which would
Exploitation D. pictum L. nebulosus maximize yield per recruit was predicted to be asso-
rate L50 Lmat Lmax L50 Lmat Lmax ciated with a small increase in biomass per recruit. Changes in the exploitation rate were predicted to
E0.1 (/yr) 0.50 0.56 0.75 0.51 0.56 0.75 have a greater impact on biomass per recruit, which Emax (/yr) 0.57 0.65 0.81 0.63 0.65 0.86 was estimated to be above 50% of the unexploited
level at the optimum exploitation rate (Eopt) (Table 7).
B Length converted
Age based
L75
L100
L50
B

83 Grandcourt et al.: Biology and assessment of Diagramma pictum and Lethrinus nebulosus in the southern Arabian Gulf
A) B)
LL
L
0
0
L
L
L
B
Si LF )
n
Figure 9 Aggregated length-frequency distributions for (Diagramma pictum and ( Lethrinus nebulosus showing the mean sizes at first capture ( 50), sexual maturity ( mat), and the size at first capture which would maximize yield per recruit ( max).
100
200
300
400
500
600
700
800
900
10 20 30 40 50 60 70
500
1000
1500
2000
2500
3000
10 20 30 40 50 60 70
50
max
mat
Freq
uenc
y
ze (cm
=13,180
A
L50
L mat L max
n=5047
E EL L
(L .
L L L L L L
E (/
E (/
0
0 1
0
1
E E
0 0 1
0
1
EE
A
B
li
iel
it li
iit
loi i /
A) B)
E
(EL
L
Table 7 Relative biomass per recruit at precautionary exploita-tion rates ( opt and limit) at the existing size at first cap-ture ( 50), the size at first capture at sexual maturity ( mat), and the size at first capture at maximum yield per recruit
max) for Diagramma pictum and Lethrinus nebulosus
Relative biomass per recruit
D. pictum L. nebulosus Exploitation rate 50 mat max 50 mat max
opt yr) 0.52 0.55 0.60 0.50 0.51 0.53
limit yr) 0.44 0.48 0.53 0.39 0.40 0.45
0.01
0.02
0.03
0.04
0.05
0.2 0.4 0.6 0.8
0.2
0.4
0.6
0.8
L50
Lmat
Lmax 0.1
0.05
0.1
0.15
0.2
0.2 0.4 0.6 0.8
0.2
0.4
0.6
0.8
L50
Lmax
Lmat
0.1
Re
atve
yd
per
recr
u
Re
atve bom
ass per recru
Exp tat on rate ( yr)
Figure 10 Relative yield and respective biomass-per-recruit curves (descending lines) for ( Diagramma pictum and (Lethrinus nebulosus showing the existing exploitation rate ( ) and the exploitation rate at which the slope of the yield-per-recruit curve is 0.1 of its value at the origin
0.1). Curves show the effect of increasing the existing mean size at first capture ( 50) to the mean size at first sexual maturity ( mat) and the size which would maximize yield per recruit (Lmax).
Estimates of precautionary target and limit exploita-tion rates (Eopt and Elimit) for D. pictum were 0.34 and 0.40, respectively.
The exploitation rate for L. nebulosus (0.64/yr) was marginally greater than that which would maximize yield per recruit (0.63/yr) at the existing mean size at first capture (Table 6). The yield-per-recruit function indicated that an increase in the size at first capture to that which would maximize yield per recruit would be associated with an increase in yield at the current level of exploitation. An increase in the size at first capture to that at which sexual maturity occurs (Lmat) was also predicted to be associated with an increase in yield, although to a lesser degree (Fig. 10).
The relative biomass per recruit for L. nebulosus at the current exploitation rate was less than 20% of that

84 Fishery Bulletin 104(1)
at the theoretical unexploited level. An increase in the mean size at first capture to that which would maxi-mize yield per recruit was predicted to be associated with a small increase in biomass per recruit. Changes in the exploitation rate were predicted to have a greater impact on biomass per recruit, which was estimated to be above 50% of the unexploited levels at the optimum exploitation rate (Eopt) (Table 7). Estimates of precau-tionary target and limit exploitation rates (Eopt and Elimit) for L. nebulosus were 0.33 and 0.43, respectively. For both D. Pictum and L. nebulosus, the exploitation rates predicted from the yield per recruit function (E0.1 and Emax) were equal to or in excess of values where F=M (0.5) for all sizes at first capture.
The range of fishing mortality rates estimated for D. pictum (0.37−0.62/yr) was substantially greater than both the target (Fopt=0.07/yr) and limit (Flimit=0.09/yr) biological reference points. The range of fishing mortal-ity rates for L. nebulosus (0.15/yr to 0.57/yr) were also in excess of the biological reference points for this spe-cies (Fopt=0.10/yr and Flimit=0.13/yr).
Discussion
Age and growth
The formation of alternating translucent and opaque growth zones in fish otoliths has been associated with a variety of factors, including seasonal variations in water temperature, photoperiod, feeding, and reproduction (Moe, 1969; Reay, 1972; Panella, 1980; Manickchand-Heileman and Phillip, 2000). Although the mechanisms of growth-increment formation are poorly understood, the deposition of the opaque zone in tropical species generally occurs in the spring and summer months during periods of accelerated growth, whereas the trans-lucent zone is formed when there is reduced metabolic activity (Beckman and Wilson, 1995). The formation of opaque and translucent zones in the sagittal otoliths of D. pictum and L. nebulosus determined in our study follows this generalized pattern.
The southern Arabian Gulf exhibits marked sea-sonal variability in oceanographic characteristics; sea water temperatures can exceed 34°C in summer and fall to 21°C in the winter (Sheppard et al., 1992). The close association of the formation of opaque zones with increasing seawater temperature indicates that tem-perature could be the principal environmental signal stimulating the deposition of these growth zones. Other allied variables, such as productivity and subsequent food availability, may also be associated with seasonal growth-rate oscillations and the formation of growth increments. The validation of the annual periodicity of increment formation adds to a growing body of evi-dence (Fowler, 1995) and dismisses the misconception that annuli do not form in the otoliths of reef fish due to a lack of seasonality in the tropics (e.g., Sparre and Venema, 1992). Nevertheless, the edge analysis method used should ideally be conducted over a 2-year cycle and
could have been more rigorous with the use of larger sample sizes and by conducting the analyses for indi-vidual ages. Furthermore, it is important to distinguish between the validation of increment periodicity and absolute age (Campana, 2001). Although our study has provided empirical evidence for an annual pattern of increment formation, the absolute age of the study spe-cies remains to be validated. Validation of the absolute age could be achieved through independent means such as a mark-recapture study and the chemical marking of juvenile fish of known age.
The maximum number of opaque bands counted for D. pictum in the present study (13) was considerably less than the maximum age of 31 years estimated by Loubens (1980) for this species in New Caledonia. Like-wise, our longevity estimate of 14 years for L. nebulosus was less than that of Mathews and Samuel (1991) (20 years) and of Edwards and Shaher (1991) (21 years) for this species in the northern Arabian Gulf and Gulf of Aden, respectively. Our longevity estimates therefore were most likely to have been underestimated owing to the absence of fish close to the maximum reported sizes for these species.
A method of validating growth parameters involves the comparison of growth performance indices (Φʹ ) in terms of growth in length with other estimates obtained for the same or a similar species (Gayanilo and Pauly, 1997). Values of Φʹ for D. pictum available from other studies have ranged from 2.88 (Loubens, 1980) to 3.24 (Baillon and Kulbicki, 1988), and an estimate of 3.07 has been obtained for this species in the Gulf of Aden (Edwards et al., 1985). The estimate obtained in our study (2.81) compares with the lower end of this range. Values of Φʹ for L. nebulosus have ranged from 2.55 (Kuo and Lee, 1986) to 3.41 (Baillon, 1991), and an es-timate of 2.87 obtained for this species in the northern Arabian Gulf in the waters off Kuwait (Baddar, 1987) compares well with our estimate of 2.80. Although the growth parameters in our study would appear to be of the right order (by comparison), improvements in our es-timates could have been made by the addition of larger specimens close to the maximum size for both species.
Despite its widespread use, the von Bertalanffy growth function may not be suitable for hermaphro-ditic populations (Appeldoorn, 1996). Growth analyses have shown distinct differences in the sizes of equal-age males and females of protogynous species (Moe, 1969; Nagelkerken, 1979; Garratt et al., 1993), and experi-ments have shown what are considered to be growth accelerations leading to sex change (Ross et al., 1983). Failure to account for growth spurts in yield models can result in significant over estimation of both maxi-mum yield and optimal effort (Bannerot et al., 1987). Although L. nebulosus is a protogynous hermaphro-dite (Young and Martin, 1982; Ebisawa, 1990), the results of the analysis of residual sums of squares in our study indicated that there are no differences in the growth characteristics between sexes and that the use of growth parameters from pooled data would therefore be justified in yield-per-recruit analyses.

85 Grandcourt et al.: Biology and assessment of Diagramma pictum and Lethrinus nebulosus in the southern Arabian Gulf
Reproduction
Simulation models and evidence of the effects of fish-ing have shown that protogynous species are far more vulnerable to fishing pressure than comparable gono-choristic stocks (Huntsman and Schaaf, 1994). For protogynous species, in which males tend to be larger than females on average, there are indications that size-selective fishing mortality may result in the dif-ferential loss of larger males (Sadovy, 1996) and the possibility that insufficient males remain in the repro-ductive population to fertilize eggs from all females (Koenig et al., 1996). In this context, L. nebulosus may be particularly vulnerable to such effects because the female-biased sex ratios were consistent throughout all the age categories and size classes. The overall female bias and removal of the bias in the oldest and largest age category for D. pictum is generally representative of the sexual structure of a protogynous population. Given these characteristics, histological confirmation of the reproductive mode of this species should be considered.
The well-defined spawning period of D. pictum and L. nebulosus between April and May supports the view that seasonal reproductive cycles are common among tropical fishes (Robertson, 1990; Montgomery and Gal-zin, 1993; Sadovy, 1996). There were high levels of ju-venile retention for D. pictum (35.1%) because fish were recruited to the fishery before the mean size at which sexual maturity occurred, indicating a need to increase the mesh size of traps.
Mortality and selectivity
Estimates of natural mortality derived from other stud-ies of D. pictum range from 0.43/yr (Edwards et al., 1985) to 0.67/yr (Baillon and Kulbicki, 1988). The com-paratively low value of M obtained in our study (0.13/yr) can be attributed to the difference in methods used, but errors in other estimates from the empirically derived formula of Pauly (1980) may have occurred because the relationship has tended to overestimate M, especially for slow growing species (e.g., Ralston, 1987; Russ et al., 1998). Similarly, our value of the instantaneous natural mortality rate for L. nebulosus (0.20/yr) was lower than other estimates that range from 0.279/ yr (Edwards et al., 1985) to 1.18/yr (Baillon, 1991). Although estimates of M derived from the Hoenig (1983) relationship have been shown to provide a reasonable approximation of M in tropical demersal fishes (Hart and Russ, 1996; Newman et al., 1996), errors in this parameter were potentially the greatest source of error in our assessment.
Upward bias in estimates of the total mortality rate (Z) may have occurred if larger fish were less vulnera-ble to the fishing gear or if adult fish underwent migra-tions, for example. A survey of the biomass of demersal species in the Arabian Gulf waters of the United Arab Emirates showed that there were no seasonal changes in the abundance of L. nebulosus and the haemulid
Plectorhinchus sordidus (Shallard2). This finding indi-cates that ontogenetic or spawning-associated migra-tions would unlikely be altering the size and age com-position and subsequent estimates of Z for the species investigated. Although size-specific selectivity cannot be discarded as a possible explanation for the small proportion of larger and older fish in size-frequency and biological samples, the impact of fishing on the size and age structure of the respective populations is considered a more likely reason for these observations and is likely to be the probable cause given the historic absence of regulation in the trap fishery.
Because the size at first capture (21.1 cm LF) was considerably smaller than the size at which yield per recruit would be maximized (44.4 cm LF) for D. pictum, an increase in the mesh size for the trap fishery should be considered by management authorities especially given the high rate of juvenile retention for this species. The same is applicable for L. nebulosus with a mean size at first capture of 26.4 cm LF and size at maximum yield per recruit of 36.9 cm LF.
Assessment of the fishery
The use of yield-per-recruit models may be particularly restrictive for fast growing tropical species with high rates of natural mortality because the curves may not reach a maximum within a reasonable range of fishing mortality values (Gayanilo and Pauly, 1997). Although the species examined in our study were relatively slow growing and had low rates of natural mortality, failure of the yield-per-recruit model may still have occurred at the upper end of the fishing mortality range.
Gulland (1970) suggested that in an optimally ex-ploited stock, fishing mortality should be about equal to natural mortality, resulting in an exploitation rate of 0.5/yr. However, exploitation rates should be very conservative for relatively long-lived reef fish (Newman and Dunk, 2003), especially given that potential yields may be over estimated by a factor of 3−4 where F=M (Beddington and Cooke, 1983). With a range from 0.5 to 0.86/yr, the exploitation rates derived from yield-per-recruit analyses (E0.1 and Emax) are considered to have overestimated the associated fishing mortality rates.
The relative yield-per-recruit analyses indicated that an increase in the size at first capture of D. pictum and L. nebulosus to that which would maximize yield per re-cruit would be associated with increases in yields at the existing exploitation rates. However, the existing exploi-tation rate for D. pictum (0.79/yr) was greater than that which would maximize yield per recruit (Emax=0.57/yr). Although the exploitation rate for L. nebulosus (0.64/yr) was comparable to that which would maximize yield per
2 Shallard, B. 2003. Distribution and abundance of demersal fish stocks in the UAE, 211 p. Technical Report 1. Fish Resources Assessment Survey Project of Abu Dhabi and UAE Waters. Bruce Shallard and Associates and Environmental Research and Wildlife Development Agency, P.O. Box 45553, Government of Abu Dhabi, United Arab Emirates.

86 Fishery Bulletin 104(1)
recruit (0.63/yr), given that Emax was probably overes-timated, the results indicate that growth overfishing is also occurring for this species.
The specified precautionary target (Fopt=0.5.M) and limit (Flimit=2/3.M) values are considered to be more appropriate biological reference points in light of the constraints of the yield-per-recruit model. The range of f ishing mortality rates estimated for D. pictum (0.37−0.62/yr) was substantially greater than both the target (Fopt=0.07/yr) and limit (Flimit=0.09/yr) biologi-cal reference points, and the existing exploitation rate (0.79/yr) was more than double the optimum level (0.34/ yr). The range of fishing mortality rates for L. nebulo-sus (0.15/yr to 0.57/yr) were also in excess of the biologi-cal reference points for this species (Fopt=0.10/yr and Flimit=0.13/yr) and the exploitation rate (0.64/yr) was approximately double the optimum target level (0.33/ yr). This result clearly indicates growth overfishing for both species and, in combination with the results of the yield-per-recruit analyses, demonstrates that effort re-ductions are also required in the fishery because target reference points cannot be achieved by modification of the gear-selectivity characteristics alone.
A critical limitation of the yield-per-recruit model is the assumption that there is no relationship between the size of the spawning stock biomass and recruit-ment (Buxton, 1992). Even if the size at first capture is less than the size at first sexual maturity, the stock size may approach zero at high levels of fishing mor-tality in spite of predictions of high levels of yield per recruit. It is therefore important to consider the size of the spawning stock biomass across the range of fishing mortality rates when interpreting results. The relative biomass per recruit of D. pictum and L. nebulosus at the estimated fishing mortality rates was particularly low at less than 10% and 20%, respectively, of unex-ploited levels. If the critical spawning stock biomass is between 20% and 50% of the unexploited levels, as suggested by King (1995), recruitment overfishing is likely to be occurring for both species. This is most clearly seen in the age structure for D. pictum, for which only 13.8% of the total number of fish were above the age at which fish were fully exploited by the gear (ages 4−13 years). For this species, the majority of the yield was derived from the newly recruited age class representing fish that had just become fully vulnerable to the gear.
The relative biomass per recruit at the exploitation rates that were equivalent to Fopt corresponded to 52% and 51% of the theoretical unexploited biomass levels for D. pictum and L. nebulosus, respectively. The associ-ated levels of fishing mortality are therefore considered appropriate target reference points, given the present fisheries policy which is aimed at resource conserva-tion and stock rebuilding. Accordingly, the results of our study are important to fisheries management au-thorities in the region because they indicate that both a substantial reduction in fishing effort and an increase in mesh-size of traps are currently necessary for the previously unregulated demersal trap fishery.
Acknowledgments
We are very grateful to Sultan Al Ali, Khaled Al Ali, John Hoolihan, and Kunath Gopalan for their assis-tance with data collection and Abdulla Aboubaker for helping with data entry. Howard Choat and Will Rob-bins assisted in the training of technicians in otolith processing. The comments of the anonymous reviewer helped considerably in improving the manuscript. This study was funded by the Government of the United Arab Emirates through the Environmental Research and Wildlife Development Agency’s Marine Environment Research Centre.
Literature cited
Appeldoorn, R. S. 1996. Model and method in reef fishery assessment. In
Reef fisheries (N. V. C. Polunin and C. M. Roberts, eds.), p. 219−248. Chapman and Hall, London.
Baddar, M. K. 1987. A preliminary study of the population dynamics
of sheiry, the starry pigface bream, Lethrinus nebu-losus. Kuwait Bull. Mar. Sci. 9:215−220.
Baillon, N. 1991. Otolithometrie en milieu tropical: application à trois
espèces du lagon de Nouvelle-Caledonie. ORSTOM, Inst. Fr. Rech. Sci. Dév. Coop., Trav. Doc. 113, 296 p.
Baillon, N., and M. Kulbicki. 1988. Aging of adult tropical reef fish by otoliths: a
comparison of three methods on Diagramma pictum. In Proceedings of the sixth international coral reef sym-posium, Townsville, Australia, 8th−12th August 1988 (J. H. Choat, ed.), p. 341−346. 6th International Coral Reef Symposium Executive Committee, Townsville, Queensland, Australia.
Bannerot, S. P., W. W. Fox, and J. E. Powers. 1987. Reproductive strategies and the management of
snappers and groupers in the Gulf of Mexico and the Caribbean. In Tropical snappers and groupers: biology and fisheries management (J. J. Polovina and S. Ralston, eds.), p. 561−603. Westview Press, Boulder, CO.
Beckman, D. W., and C. A. Wilson. 1995. Seasonal timing of opaque zone formation in fish
otoliths. In Recent developments in fish otolith research (D. H. Secor, J. M. Dean, and S. E. Campana eds.), p. 27−43. Univ. South Carolina Press, Colombia, SC.
Beddington, J. R., and J. G. Cooke. 1983. The potential yield of fish stocks. FAO Fish. Tech.
Pap. 242, 47 p. FAO, Rome. Beverton, R. J. H., and S. J. Holt
1957. On the dynamics of exploited fish populations, 533 p. Chapman and Hall, London.
1966. Manual of methods for fish stock assessment, part II. Tables of yield function. Fisheries Biology Technical Paper 38, 67 p. FAO, Rome.
Breder, C. M., and D. E. Rosen. 1966. Modes of reproduction in fishes, 941 p. T.F.H.
Publications, Neptune City, NJ. Buxton, C. D.
1992. The application of yield-per-recruit models to two South African sparid reef species, with special consid-eration to sex change. Fish. Res. 15:1−16.

87 Grandcourt et al.: Biology and assessment of Diagramma pictum and Lethrinus nebulosus in the southern Arabian Gulf
Chen, Y. D., D. A. Jackson, and H. H. Harvey. 1992. A comparison of von Bertalanffy and polynomial
functions in modelling fish growth data. Can. J. Fish. Aquat. Sci. 49:1228−1235.
Campana, S. E. 2001. Accuracy, precision and quality control in age deter-
mination, including a review of the use and abuse of age validation methods. J. Fish. Biol. 59:197−242.
Ebisawa, A. 1990. Reproductive biology of Lethrinus nebulosus (Pices:
Lethrinidae) around the Okinawan waters. Nippon Suisan Gakkaishi 56 (12):1941−1954.
Edwards, R. R. C., A. Bakhader, and S. Shaher. 1985. Growth, mortality, age composition and fishery
yields of fish from the Gulf of Aden. J. Fish. Biol. 27:13−21.
Edwards, R. R. C., and S. Shaher. 1991. The biometrics of marine fishes from the Gulf of
Aden. Fishbyte 9(2):27−29. Fischer, W., and G. Bianchi.
1984. FAO species identification sheets for fishery pur-poses. Vol. II: Western Indian Ocean (Fishing Area 51), 257 p. Prepared and printed with the support of the Danish International Development Agency (DANIDA). FAO. Rome.
Fowler, A. J. 1995. Annulus formation in the otoliths of coral reef fish—
a review. In Recent developments in fish otolith research (D. H. Secor, J. M. Dean, and S. E. Campana, eds.), p. 45−63. Univ. South Carolina Press, Colombia, SC.
Garratt, P. A., A. Govender, and A. E. Punt. 1993. Growth acceleration at sex change in the protogy-
nous hermaphrodite Chrysoblephus puniceus (Pisces: Sparidae). S. Afr. J. Mar. Sci. 13:187−193.
Gayanilo, F. C. Jr., and D. Pauly. 1997. FAO–ICLARM stock assessment tools. Reference
manual, 262 p. FAO. Rome. Gulland, J. A.
1970. The fish resources of the ocean. FAO Fisheries Technical Paper 97, 425 p. FAO, Rome.
Hart, A. M., and G. R. Russ. 1996. Response of herbivorous fish to crown of thorns
starf ish Acanthaster planci outbreaks. III: Age, growth, mortality and maturity indices of Acanthurus nigrofuscus. Mar. Ecol. Prog. Ser. 136:25−35.
Hoenig, J. M. 1983. Empirical use of longevity data to estimate
mortality rates. Fish. Bull. 82:898−902. Huntsman, G. R., and W. E. Schaaf.
1994. Simulation on the impact of fishing on reproduc-tion of a protogynous grouper, the graysby. N. Am. J. Fish. Manag. 14:41−52.
Johannes, R. E. 1981. Words of the lagoon, 320 p. Univ. Calif. Press,
Los Angeles, CA. King, M.
1995. Fisheries biology, assessment and management, 341 p. Blackwell Science Ltd., London.
Koenig, C. C., F. C. Coleman, L. A. Collins, Y. Sadovy, and P. L. Collin.
1996. Reproduction in gag (Mycteroperca microlepis) (Pices: Serranidae) in the eastern Gulf of Mexico and the consequences of fishing spawning aggregations. In Biology, fisheries and culture of tropical groupers and snappers (F. Arreguin-Sanchez, J. L. Munro, M. C.
Balgos, and D. Pauly, eds.), p. 307−323. ICLARM Conf. Proc. 48.
Kuo, C. L., and S. S. Lee. 1986. Age and growth of common porgy, Lethrinus nebulo-
sus (Forsskål) in shelf waters off northwest Australia. J. Fish. Soc. Taiwan. 3:39−57.
Loubens, G. 1980. Biologie de quelques espèces de poissons du lagon
Néo-Calédonien. III. Croissance. Cah. Indo-Pac. 2:101−153.
Manickchand-Heileman, S. C., and D. A. Phillip. 2000. Age and growth of the yellow edge grouper, Epineph-
elus flavolimbatus, and the yellowmouth grouper, Myc-teroperca interstitialis, off Trinidad and Tobago. Fish. Bull. 98:290−298.
Mathews, C. P., and M. Samuel. 1991. Growth, mortality and length-weight parameters for
some Kuwaiti fish and shrimp. Fishbyte 9(2):30−33. Moe, M. A.
1969. Biology of the red grouper, Epinephelus Morio, (Valenciennes) from the eastern Gulf of Mexico. Flor-ida Dept. Nat. Resour. Mar. Res. Lab., Prof. Pap. Ser. 10:1−95.
Montgomery, W. L., and R. Galzin. 1993. Seasonality in gonads, fat deposits and condition of
tropical surgeonfishes (Teleostei: Acanthuridae). Mar. Biol. 115:529−536.
Nagelkerken, W. P. 1979. Biology of the graysby, Epinephelus cruentatus,
of the coral reef of Curaçao. Stud. Fauna Curaçao other Carib. Islands 186, 118 p.
Newman, S. J., and I. J. Dunk. 2003. Age validation, growth, mortality, and additional
population parameters of the goldband snapper (Pristi-pomoides multidens) off the Kimberley coast of north-western Australia. Fish. Bull. 101:116−128.
Newman, S. J., D. McB. Williams, and G. R. Russ. 1996. Age validation, growth and mortality rates of the
tropical snappers (Pices: Lutjanidae), Lutjanus adetii (Castelnau, 1873) and L. quinquelineatus (Bloch, 1790) from the Central Great Barrier Reef, Australia. Mar. Freshw. Res. 47(4):575−584.
Panella, G. 1980. Growth patterns in fish sagittae. In Skeletal
growth of aquatic organisms (D. C. Rhoads and R. A. Lutz, eds.), p. 519−560. Plenam Press, New York, NY.
Pauly, D. 1980. On the interrelationships between natural mor-
tality, growth parameters and mean environmental temperature in 175 fish stocks. J. Cons. Int. Explor. Mer 39:175−199.
1983. Length-converted catch curves: a powerful tool for fisheries research in the tropics (part 1). Fishbyte 1(2):9−13.
Pauly, D., and M. L. Soriano. 1986. Some practical extensions to Beverton and Holt’s
relative yield-per-recruit model. In The first Asian fisheries forum (J. L. Maclean, L. B. Dizon, and L. V. Hosillo, eds.), p. 491−496. Asian Fisheries Society, Manila, Philippines.
Randall, J. E. 1995. Coastal fishes of Oman, 439 p. Univ. Hawaii
Press, Honolulu, HI. Randall, J. E., G. R. Allen, and R. C. Steene.
1997. Fishes of the Great Barrier Reef and Coral Sea, 507 p. Univ. Hawaii Press, Honolulu, HI.

88 Fishery Bulletin 104(1)
Ralston, S. 1987. Mortality rates of snappers and groupers. In
Tropical snappers and groupers: biology and fisheries management (J. J. Polovina and S. Ralston eds.), p. 375–404. Westview Press, Boulder, CO.
Reay, P. J. 1972. The seasonal pattern of otolith growth and its
application to back-calculation studies in Ammodytes tobianus. J. Cons. Int. Explor. Mer 34:485–504.
Ricker, W. E. 1975. Computation and interpretation of biological statis-
tics of fish populations, 382 p. Bull. Fish. Res. Board Can. 191.
Robertson, D. R. 1990. Differences in the seasonalities of spawning and
recruitment of some small neotropical reef fishes. J. Exp. Mar. Biol. Ecol. 144:49−62.
Ross, R. M., G. S. Losey, and M. Diamond. 1983. Sex change in coral reef f ish:dependence of
stimulation and inhibition on relative size. Science 221:574−575.
Russ, G. R., D. C. Lou, J. B. Higgs, and B. P. Ferreira. 1998. Mortality rate of a cohort of the coral trout, Plec-
tropomus leopardus, in zones of the Great Barrier Reef Marine Park closed to fishing. J. Mar. Freshw. Res. 49:505−11.
Sadovy, Y. J. 1996. Reproduction of reef f ishery species. In Reef
fisheries (N. V. C. Polunin and C. Roberts, eds.), p. 15−59. Chapman and Hall, London.
Samuel, M., C. P. Mathews, and A. S. Bawazeer. 1987. Age and validation of age from otoliths for warm
water fishes from the Arabian Gulf. In Age and growth of f ish (R. C. Summerfelt and G. E. Hall, eds.), p. 253−265. IOWA State Univ. Press, Ames, IA.
Sheppard, C., A. Price, and C. Roberts. 1992. Marine ecology of the Arabian region. Patterns
and processes in extreme tropical environments, 347 p. Academic Press. London.
Siddeek, M. S. M., M. M. Fouda, and G. V. Hermosa Jr. 1999. Demersal fisheries of the Arabian Sea, the Gulf
of Oman and the Arabian Gulf. Estuar. Coastal Shelf Science 49 (suppl. A):87−97.
Smith, M. M., and R. J. McKay. 1986. Haemulidae. In Smiths’ sea fishes (M. M. Smith
and P. C. Heemstra, eds.), p. 564−571. Springer-Verlag, Berlin.
Sokal, R. R., and F. J. Rohlf 1995. Biometry. The principles and practice of statistics
in biological research. 3rd ed., 887 p. W. H. Freeman and Co., New York, NY.
Sommer, C., W. Schneider, and J. M. Poutiers. 1996. FAO species identification field guide for fishery
purposes. The living marine resources of Somalia, 376 p. FAO, Rome.
Sparre, P., and S. C. Venema. 1992. Introduction to tropical fish stock assessment.
Part 1. FAO Fisheries Technical Paper No. 306.1, rev. 1, 376 p. FAO, Rome.
Torres, F. S. B., Jr. 1991. Tabular data on marine fishes from Southern
Africa. Part I. Length-weight relationships. Fishbyte 9(1):50−53.
von Bertalanffy, L. 1938. A quantitative theory of organic growth. Hum.
Biol. 10:181−213. Young, P. C., and R. B. Martin.
1982. Evidence for protogynous hermaphroditism in some lethrinid fishes. J. Fish. Biol. 21:475−84.