BiologicalControlin CoolingWaterSystems UsingNonDChemical ... · ASHRAE 1719 Tullie Circle Atlanta,...
134
April 2010 Final Technical Report April 1, 2008 Ȃ December 31, 2009 Principal Author: Radisav D. Vidic Contributing Authors: Scott M. Duda Janet E. Stout ASHRAE Project Number 1361RP Biological Control in Cooling Water Systems Using NonChemical Treatment Devices Submitted to: ASHRAE 1719 Tullie Circle Atlanta, GA 30329 Submitted by: University of Pittsburgh Department of Civil and Environmental Engineering Pittsburgh, PA 152612294 Fullscale and pilot scale cooling towers
Transcript of BiologicalControlin CoolingWaterSystems UsingNonDChemical ... · ASHRAE 1719 Tullie Circle Atlanta,...

April 2010
Final Technical Report
April 1, 2008 December 31, 2009
Principal Author: Radisav D. Vidic
Contributing Authors:
Scott M. Duda Janet E. Stout
ASHRAE Project Number 1361-‐RP
Biological Control in Cooling Water Systems Using Non-Chemical Treatment Devices
Submitted to:
ASHRAE 1719 Tullie Circle Atlanta, GA 30329
Submitted by:
University of Pittsburgh Department of
Civil and Environmental Engineering Pittsburgh, PA 15261-2294
Full-scale and pilot-scale cooling towers

Executive Summary
Microbial growth in cooling water systems causes corrosion, decreases energy efficiency, and
has the potential to cause human infection. Control of microbial growth in these systems is
typically achieved with the use of chemical biocides. Recently, non-chemical water treatment
methods have seen increased use as an alternative. However, few objective studies with an
untreated system as a reference are available to verify the efficacy of these devices to control
microbial growth in cooling towers. Therefore, the specific objective of this investigation was to
provide a controlled, independent, and scientific evaluation of several classes of non-chemical
treatment devices (NCDs) for controlling biological activity in a model cooling tower system.
Five NCDs were evaluated for efficacy in reducing planktonic (bulk water) and sessile
(biofilm) microbial populations within a pilot-scale cooling system. The devices included
magnetic, pulsed electric field, electrostatic, ultrasonic, and hydrodynamic cavitation. Two
model towers were designed and operated to simulate field conditions (e.g., heat load, residence
time, liquid loading rate, evaporative cooling, blowdown and make-up system). One tower
served as the untreated control (T1) while the NCD was installed on the second tower (T2).
Each device trial was conducted over a 4-week period. Heterotrophic plate counts (HPC) were
used to monitor biological growth in both planktonic and attached phase. Physicochemical
monitoring included temperature, conductivity, pH, alkalinity, hardness, total dissolved solids
(TDS), ORP, and chloride. Make-up water for each system was dechlorinated city tap water.
According to information documented in the literature, the makeup water chemistry used in this
study is representative of that found in many building cooling tower systems.
Under the experimental conditions used in this study, no statistically significant
difference (p values in a t-test above 0.05) in planktonic and sessile microbial concentrations

ii
(HPC) was observed between the control tower and a tower treated by any of the five NCDs
evaluated in this study (i.e., biological and chemical parameters were comparable in T1 and T2
for all device trials).
Standard chemical treatment of pilot-scale cooling towers by the addition of free chlorine
(positive control) was able to achieve appreciable reduction in both planktonic (2-3 orders of
magnitude) and sessile microbial growth (3-4 orders of magnitude) in these towers. These
positive controls were repeated three times throughout the study and the results clearly showed
that free chlorine was able to control biological growth in every instance, even after heavy
microbial colonization of model cooling towers.
The results of this study conducted under well-controlled conditions show that NCDs did
not control biological growth under the conditions of the testing in the pilot scale cooling tower
systems. As with any research project, the conclusions that can be drawn to full-scale
applications are limited by the extent to which the variables possible in full-scale are understood
and appropriately modeled against controls. The study can only properly conclude that the
devices did not successfully control biological growth under the conditions tested. As with any
protocol for biological control, it is prudent for building owners and engineers to consider taking
water sample tests for all HVAC systems that require biological control. If the testing shows an
issue, appropriate adjustment of technology or protocols followed by additional testing is
important to prevent potential health or operating issues.
iii
TABLE OF CONTENTS
1.0 INTRODUCTION ............................................................................................... 1
1.1 COOLING SYSTEM WATER TREATMENT ................................................ 1
1.2 NON-CHEMICAL WATER TREATMENT .................................................... 3
1.2.1 Magnetic Treatment ........................................................................................ 3
1.2.2 Pulsed-power and Electrostatic Treatment ................................................... 5
1.2.3 Ultrasonic Cavitation Treatment ................................................................... 9
1.2.4 Hydrodynamic Cavitation Treatment ......................................................... 12
2.0 EXPERIMENTAL PROTOCOL .................................................................................. 16
2.1 SPECIFIC OBJECTIVES ................................................................................ 16
2.2 MATERIALS AND METHODS ...................................................................... 17
2.2.1 Cooling Tower System Description .............................................................. 17
2.2.2 Device Trial Protocol ..................................................................................... 21
2.2.3 Chemical Disinfection Test Protocols .......................................................... 28
2.2.3.1 Pre-Device Trial Chlorination Test Protocol.................................... 29
2.2.3.2 ED/UD Chlorination Test ................................................................... 30
2.2.3.3 UD/HCD Chlorination Test................................................................ 31
2.3 NON-CHEMICAL DEVICES .......................................................................... 33
iv
2.3.1 Magnetic Device (MD) ................................................................................... 33
2.3.2 Pulsed Electric Field Device (PEFD) ........................................................... 34
2.3.3 Electrostatic Device (ED) .............................................................................. 38
2.3.4 Ultrasonic Device (UD) .................................................................................. 39
2.3.5 Hydrodynamic Cavitation Device (HCD).................................................... 40
3.0 EXPERIMENTAL REPRODUCIBILITY ................................................................... 43
3.1 MAKE-UP WATER QUALITY ...................................................................... 44
3.1.1 Biological Parameters .................................................................................... 45
3.1.2 Summary ........................................................................................................ 46
3.2 T1 (CONTROL) CONDITIONS ...................................................................... 48
3.2.1 T1 (Control) System Operation .................................................................... 48
3.2.2 Biological Parameters .................................................................................... 50
3.2.3 Summary ........................................................................................................ 53
4.0 DEVICE TRIAL RESULTS AND DISCUSSION ....................................................... 55
4.1 MAGNETIC DEVICE (MD) TRIAL .............................................................. 55
4.1.1 Tower System Operation .............................................................................. 56
4.1.2 Biological Parameters .................................................................................... 58
4.1.3 Summary ........................................................................................................ 64
4.2 PULSED ELECTRIC FIELD DEVICE (PEFD) TRIAL 1/2 ........................ 66
4.2.1 Tower System Operation .............................................................................. 66
4.2.2 Biological Parameters .................................................................................... 68
4.2.3 Summary ........................................................................................................ 72
4.3 PULSED ELECTRIC FIELD DEVICE (PEFD) TRIAL 2/2 ........................ 73

v
4.3.1 Tower System Operation .............................................................................. 74
4.3.2 Biological Parameters .................................................................................... 76
4.3.3 Summary ........................................................................................................ 81
4.4 ELECTROSTATIC DEVICE (ED) TRIAL ................................................... 83
4.4.1 Tower System Operation .............................................................................. 83
4.4.2 Biological Parameters .................................................................................... 85
4.4.3 Summary ........................................................................................................ 91
4.5 ULTRASONIC DEVICE (UD) TRIAL ........................................................... 92
4.5.1 Tower System Operation .............................................................................. 92
4.5.2 Biological Parameters .................................................................................... 95
4.5.3 Summary ........................................................................................................ 99
4.6 HYDRODYNAMIC CAVITATION DEVICE (HCD) TRIAL ................... 100
4.6.1 Tower System Operation ............................................................................ 100
4.6.2 Biological Parameters .................................................................................. 102
4.6.3 Summary ...................................................................................................... 106
4.7 CHLORINATION TEST RESULTS ............................................................. 107
4.7.1 Pre-Device Trial Chlorination Test............................................................ 107
4.7.2 ED/UD Chlorination Test ........................................................................... 110
4.7.3 UD/HCD Chlorination Test ........................................................................ 111
4.8 HPC ANALYSES USING ATP MICROBIAL EQUIVALENTS AND POUR
PLATE METHOD .......................................................................................... 115
5.0 SUMMARY AND CONCLUSIONS ........................................................................... 117
6.0 REFERENCES .............................................................................................................. 121

vi
APPENDIX A: SCALING INDICES CALCULATION & INTERPRETATION ............ 128
APPENDIX B : EXPERIMENTAL REPRODUCIBILITY ................................................ 130
APPENDIX B.1 MAKE-UP WATER QUALITY ...................................................... 130
APPENDIX B.2 T1 (CONTROL) WATER QUALITY ............................................ 134
APPENDIX C: MD TRIAL .................................................................................................... 141
APPENDIX C.1 EXPERIMENTAL RESULTS ......................................................... 141
APPENDIX C.2 STATISTICAL ANALYSES ........................................................... 152
APPENDIX C.3 - PHOTOGRAPHS OF TOWER SYSTEMS.................................... 157
APPENDIX D : PEFD TRIAL 1/2 ......................................................................................... 161
APPENDIX D.1 EXPERIMENTAL RESULTS ........................................................ 161
APPENDIX D.2 STATISTICAL ANALYSES OF CHEMICAL PARAMETERS 172
APPENDIX D.3 PHOTOGRAPHS OF TOWER SYSTEMS ................................... 177
APPENDIX E : PEFD TRIAL 2/2 .......................................................................................... 184
APPENDIX E.1 EXPERIMENTAL RESULTS ......................................................... 184
APPENDIX E.2 STATISTICAL ANALYSES............................................................ 195
APPENDIX E.3 PHOTOGRAPHS OF TOWER SYSTEMS ................................... 200
APPENDIX E.4 BIOFILM SAMPLING COUPON COMPARISON ..................... 206
APPENDIX F : ED TRIAL ..................................................................................................... 207
APPENDIX F.1 EXPERIMENTAL RESULTS ......................................................... 207
APPENDIX F.2 STATISTICAL ANALYSES ............................................................ 218
APPENDIX F.3 PHOTOGRAPHS OF TOWER SYSTEMS ................................... 223
APPENDIX F.4 BIOFILM SAMPLING COUPON COMPARISON ...................... 230
APPENDIX G : UD TRIAL .................................................................................................... 231
vii
APPENDIX G.1 EXPERIMENTAL RESULTS ........................................................ 231
APPENDIX G.2 STATISTICAL ANALYSES ........................................................... 242
APPENDIX G.3 PHOTOGRAPHS OF TOWER SYSTEMS ................................... 247
APPENDIX G.4 BIOFILM SAMPLING COUPON COMPARISON ..................... 255
APPENDIX H : HCD TRIAL ................................................................................................. 256
APPENDIX H.1 EXPERIMENTAL RESULTS ........................................................ 256
APPENDIX H.2 STATISTICAL ANALYSES ........................................................... 267
APPENDIX H.3 PHOTOGRAPHS OF TOWER SYSTEMS ................................... 272
APPENDIX H.4 BIOFILM SAMPLING COUPON COMPARISON ..................... 280

ASHRAE 1361-‐RP 1 Final Technical Report
1.0 INTRODUCTION
This section will provide a brief background for the investigation discussed in this report. First,
the basic principles of cooling system water treatment will be discussed. Next, an introduction to
several non-chemical treatment technologies will be provided. Each of the technologies
discussed in this section was tested during this investigation. These included magnetic, pulsed-
power, electrostatic, ultrasonic, and hydrodynamic cavitation treatment mechanisms.
1.1 COOLING SYSTEM WATER TREATMENT
Disinfection is essential for the maintenance of an efficient cooling water system. Pathogens
must be removed from industrial process waters to prevent spreading of pathogenic organisms
and associated health problems. In addition, the presence of microorganisms in cooling water
systems can lead to bacterially-induced corrosion of the infrastructure and inefficient heat
transfer due to coating of surfaces with heavy microbial growth (biofilm). It is currently a
standard practice to use chemical biocides as means of limiting microbial growth. The most
popular of these chemical agents is free chlorine, which is utilized as a primary disinfectant in
the United States as well as throughout the world.
The exclusive use of chemical disinfectants for water treatment has fallen out of favor in
recent years for several reasons. Chemical disinfectants must be replenished regularly. Many
biocidal agents are highly toxic and may cause serious health problems to those handling them.
ASHRAE 1361-‐RP 2 Final Technical Report
As a result, safety training must be provided for workers who are responsible for the application
of treatment chemicals. Extended use of chemical disinfectants can lead to the establishment of
microbial resistance, which forces industries to regularly alternate the primary biocide [Gaines et
al., 2007]. Chemical disinfectants may also combine with other compounds present in treated or
receiving waters to form disinfection byproducts (DBPs), which may have adverse ecological
effects. In particular, the formation of toxic trihalomethanes in waters containing chlorine
residual has been well-documented [Lee et al., 2007].
Chemical water treatment has been the industry standard for control of biological growth.
However, due to the limitations described above there has been significant interest in the use of
non-chemical (physical) water treatment technologies. Physical non-chemical water treatment
devices have been marketed since the late 19th century [Faunce & Cabell, 1890], but only
recently have they seen widespread application. Magnetic treatment exhibited potential
applicability for corrosion and scale control [Baker and Judd, 1996]. However, it has not been
shown to effectively control microbial growth. Other physical water treatment technologies,
including pulsed-power systems, electrostatic systems, ultrasonic systems, and hydrodynamic
cavitation systems, have been developed and marketed by a variety of manufacturers over the
past several decades. While the manufacturers of some devices claim that their products are
capable of controlling scaling, corrosion, and microbial growth, only a limited amount of
independently performed research has substantiated those claims [Baker & Judd, 1996; Kitzman
et al., 2003; Phull et al., 1997; Vega-Mercado et al., 1997].
The validity of claims regarding device efficiency must be evaluated using objective
criteria. Studies that report anecdotal uncontrolled observations, experiments performed under
laboratory conditions that do not simulate field conditions, or studies conducted or supported by
ASHRAE 1361-‐RP 3 Final Technical Report
the device manufacturer have less scientific merit than controlled prospective studies conducted
under conditions that do simulate typical cooling tower operation.
The investigation described in this report has been funded by the American Society of
Heating, Refrigeration and Air-Conditioning Engineers (ASHRAE) with the intention of
providing an independent and unbiased study to determine if these non-chemical treatment
devices can control biological growth in cooling tower systems.
1.2 NON-CHEMICAL WATER TREATMENT
1.2.1 Magnetic Treatment
Magnetic water conditioners have been applied to reduce scaling and corrosion in industrial
systems for several decades. There are no claims, however, that magnetic devices control
microbial growth in cooling tower systems. These devices function by allowing the water to
pass through a fixed magnetic field. This field is purported to alter the water chemistry to
p
transfer and are difficult to remove. Factors which affect the ability of a magnetic water
he water, strength and
configuration of the magnetic field, thermodynamic properties of the water and fluid flow
et al., 1997].
All molecules can be classified as either polar or non- -polar molecule is
one in which the center of gravity of the positive nuclei and the electrons coincide, while a polar

ASHRAE 1361-‐RP 4 Final Technical Report
et al., 1997]. As a result, molecules which
maintain symmetry, such as the diatomic gases, are non-polar, while molecules which do not,
such as water, are polar. When non-polar molecules are exposed to a magnetic field,
displacement of molecular charges leads to the formation of an induced dipole. This induced
dipole allows non-polar molecules to align themselves in the direction of the applied magnetic
field. In addition, polar molecules also align themselves according to the magnetic field
direction. According to Quinn et al. (1997), the capacity of a magnetic conditioner can be
determined by the gauss strength, flux density, surface area of the exposure , the number of fields
and the distance between alternating poles. In order for a fixed magnetic field to be effectively
used for water conditioning, certain conditions must be met. These conditions are as follows
[Quinn et al., 1997]:
The water path must be perpendicular to the magnetic lines of force.
Water should first cut the south magnetic lines and then proceed to break wider and more
dense alternating reversing polarity lines, until exiting the magnetic chamber through the
single north pole flux path.
Water must be under pressure and moving with the least amount of turbulence possible,
just before entering and during its travel through the magnetic fields.
Under these conditions, several studies have indicated that magnetic conditioners are able to
prevent the formation of scaling compounds. Calcium carbonate that is exposed to a magnetic
field may be converted from the calcite form, which is responsible for scale formation, into the
aragonite form, which exists

ASHRAE 1361-‐RP 5 Final Technical Report
surfaces. [Quinn et al., 1997]. A study conducted by the National Aeronautics and Space
Administration (NASA) in 1975 reported negligible corrosion rates for magnetically conditioned
water, while chemically treated water was reported to have a corrosion rate between 1-50 mils/yr
[Kuivinen, 1975]. Researchers have repeatedly verified that magnetic fields increase the
potential of coagulation in waters containing at least moderate levels of hardness [Bogatin,
1999]. Later studies revealed that the efficiency of a magnetic treatment system was
independent of the hardness of the water being treated [Gabrielli et al., 2001].
1.2.2 Pulsed-power and Electrostatic Treatment
Pulsed-power treatment, also referred to as pulsed electric field (PEF) treatment [Rieder et al.,
2008] or electropulse treatment [Danilenko et al., 2005], involves the bombardment of the
substance to be treated with pulses of electromagnetic energy. These pulses may inactivate
microorganisms, including pathogens, present in the treated liquid. However, the optimal
mechanism by which this process occurs has not been definitively established. The biocidal
application of pulsed-power technology has been evaluated for use in the food processing
industry [Feng et al., 2004], as well as for cooling tower process water treatment [Opheim, 2001;
Kitzman et al., 2003].
Laboratory studies have demonstrated the efficacy of pulsed-power disinfection
technology, particularly in food and beverage production. The work of Feng et al. (2004)
demonstrated a high reduction in aerobic plate counts prepared from germinated brown rice in
circulating water treated with pulsed-power. The reactions which produced this antimicrobial

ASHRAE 1361-‐RP 6 Final Technical Report
effect, however, were found to be electrochemical, rather than physical. Additionally, this effect
was observed in a closed system, as opposed to a cooling water system which allows for the
intrusion of airborne bacteria and bacteria from incoming make-up water. Oil field reinjection
water treatment using pulsed-power technology has also been investigated in laboratory settings,
resulting in several log reduction of saprophytic, sulfate-reducing, and iron bacteria [Xin et al.,
2008]. However, these experiments were performed under batch conditions, as opposed to a
field setting. Treatment times required for effective microbial reductions were long, with
significant effects not appearing until nearly 15 minutes of continuous treatment.
Evidence of pulsed- inactivate pathogens has also been claimed in
several field studies. Application of pulsed-power systems on ice skating rink cooling towers in
Connecticut demonstrated several log reduction of microorganisms (quantified using
heterotrophic plate counts) both in bulk water and in biofilm coupon samples prepared from
glass slides [Opheim, 2001]. These antimicrobial effects were observed after two months of
treatment, and heterotrophic plate counts during the first two months of operation following
installation ranged from 103 to 106 CFU/mL.
A similar investigation involved the application of a pulsed-power treatment system to
SC [Kitzman, 2003]. This
study compared the efficacy of pulsed-power treatment at varying cooling tower cycles of
concentration to chemical and hydrodynamic cavitation treatment. Pulsed-power treatment
demonstrated average plate counts of aerobic and anaerobic planktonic bacteria of 65,000
CFU/mL and 85 CFU/mL, respectively and it appears that microbial control using this treatment
system was more consistent than that observed using chemical treatment. It is important to note
that the installation of the pulsed-power and hydrodynamic cavitation systems at Mt. Holly

ASHRAE 1361-‐RP 7 Final Technical Report
Works included a cyclonic separator for solids removal. During the investigation, each of the
three cooling towers received large quantities of airborne carbon dust from a nearby carbon silo.
While the pulsed-power and hydrodynamic cavitation experimental towers were able to remove
this additional carbon via sidestream filtration, the chemically treated tower had no means of
filtration, and as a result turbidity levels in chemically treated tower (>120 NTU) were
significantly higher than in the towers receiving physical water treatment (10-15 NTU). It is
uncertain whether the observed antimicrobial effects of the physical water treatment systems
were the result of the physical treatment mechanisms or the removal of large amounts of carbon
via sidestream filtration. Additionally, although plate counts were lower in the tower with the
pulsed-power device than in the chemically treated tower, none of the treatment methods
produced plate counts below the industry standard of 104 CFU/mL.
Multiple mechanisms have been proposed for the inactivation of microorganisms by
pulses of electromagnetic energy. It has been suggested that pulsed-power treatment can disrupt
protective cellular structures in a mechanism known as electroporation. Laboratory studies
documented that pulsed-power systems are capable of generating a transmembrane potential that
is sufficient to cause electroporation [Zimmermann, 1986; Tsong, 1991]. The electromagnetic
-electrical breakthrough of the phosphorus lipid double layer in biological
et al., 2008]. This mechanism is also
supported by research which demonstrated the relative resistance of Gram-negative bacteria to
pulsed-power treatment in comparison to Gram-positive bacteria [Min et al., 2007]. This study
attributed the resistance of Gram-negative bacteria to the presence of cell walls, and it also
documented pulsed-power treatment resistance in bacterial spores and mold ascospores.

ASHRAE 1361-‐RP 8 Final Technical Report
Laboratory investigations have verified that exposure to electromagnetic energy disrupts
and weakens cellular membranes. The electromagnetic fields in these studies [Zimmermann,
1986; Tsong, 1991] were very strong (volts to kilovolts), and they were applied over very short
distances and for relatively long exposure times (milliseconds microseconds) in comparison to
the conditions generated by commercially available pulsed-power treatment systems. The
strengths of the applied fields in these studies were far higher than those produced by
commercial treatment systems, and the distance of exposure was comparatively short (cm).
While these investigations have demonstrated that the induction of electroporation is possible
through the application of pulses of electromagnetic energy, it has not been demonstrated that the
electromagnetic exposures generated by commercially available treatment systems are powerful
enough to produce these effects.
Another hypothesis regarding the mechanism for inactivation of microorganisms by
pulsed-power treatment proposes that free radicals (OH-, ClO-) are formed in water treated with
electromagnetic bombardment [Vega-Mercado et al., 1997; Oshima et al., 1997]. Further
investigation of this theory confirmed the formation of hydroxyl radicals upon exposure to
electromagnetic pulses [Feng et al., 2000]. As a result, hybridization of pulsed-power systems
with low-dose chemical disinfectant feeds have been proposed, as the electromagnetic pulses
have demonstrated the ability to increase free chlorine concentrations [Abderahmane et al.,
2008]. This indicates that the antimicrobial effects of pulsed-power treatment systems may be
the result of electrochemical reactions, and that their mechanism of operation may not be strictly
physical. While both the electroporation mechanism and the free radical formation mechanism
have been substantiated with supporting laboratory research, it has not yet been determined
which may be effective for microbial inactivation in field conditions.

ASHRAE 1361-‐RP 9 Final Technical Report
The mechanisms of operation for electrostatic treatment systems are essentially identical
to that involved in the operation of pulsed-power treatment systems. The primary difference is
that electrostatic systems apply a static electric field, rather than pulses of energy. The claims of
the manufacturers of these devices also include scaling, corrosion, and microbial control
[Huchler, 2002]. However, there is no published literature indicating that the application of
relatively weak static electric fields for a very short exposure time over a relatively large distance
is capable of producing any antimicrobial effects.
1.2.3 Ultrasonic Cavitation Treatment
The use of ultrasonic energy to inactivate microorganisms has been under investigation for
several years. The first studies, attempting to utilize ultrasound as means of microbial
inactivation, date back to 1929, when the technology was originally considered to be too energy
intensive for commercial applications [Harvey & Loomis, 1929]. However, significant
advances have been made in the field of ultrasonic technology over the past several decades, and
it is now being re-evaluated as a potential disinfection agent. The use of ultrasound alone for
disinfection remains energy-intensive, especially for high volume applications, and a number of
studies have been conducted to evaluate the disinfection capacity of ultrasound in combination
with other disinfection technologies [Joyce, 2003].
The interaction of ultrasonic energy with water results in cavitation process through a
process known as sonication. Several processes resulting from the collapse of these cavitation
bubbles are responsible for bacterial inactivation [Mason & Joyce et al., 2003]:

ASHRAE 1361-‐RP 10 Final Technical Report
Forces due to surface resonance of the bacterial cell are induced by cavitation.
Pressures and pressure gradients resulting from the collapse of gas bubbles which
enter the bacterial solution on or near the bacterial cell wall can cause cellular
damage. Bacterial cell damage results from mechanical fatigue, over a period of
time, which depends on frequency.
Shear forces induced by microstreaming occur within bacterial cells.
Chemical attack due to the formation of radicals (H and OH ) during cavitation
in the aqueous medium can also cause cellular damage. These radicals attack the
chemical structure of the bacterial cell wall and weaken the cell wall to the point
of disintegration.
Among the final products of the sonochemical degradation of water is hydrogen
peroxide (H2O2), which is a strong bactericide.
Bench-scale investigations of the application of both low- (20-40 kHz) and high- (0.5-
0.85 MHz) frequency ultrasonic energy to bacterial mediums have indicated that ultrasound may
be responsible for both the death of bacteria and the disruption of cellular agglomerations
[Mason & Joyce et al., 2003]. These two processes can also counteract, resulting in no net
biocidal effect. However, tests involving the use of an ultrasonic treatment unit to decontaminate
20 L of bacterial suspension contained within a flow loop have demonstrated a kill efficiency of
near 85% [Mason & Duckhouse et al., 2003].
Several studies have investigated the application of ultrasound for the disinfection of both
drinking water and wastewater. Some of these investigations have evaluated ultrasound as a
stand-alone treatment process [Furuta et al., 2004; Hua & Thompson, 2000; Scherba et al., 1991]
ASHRAE 1361-‐RP 11 Final Technical Report
or in combination with other treatment technologies. Hybrid disinfection systems combining
ultraviolet treatment with ultrasonic pretreatment generated coliform reductions of 3.3 to 3.7 log
units, whereas ultraviolet treatment alone generated reductions of 2.5 log units [Blume & Neis,
2004]. Treatment with an ultrasonic horn combined with 5 mg/L H2O2 dosing was able to
generate a 15-minute disinfection percentage of 90% for fecal coliform removal, while 5 mg/L
H2O2 dosing alone was only able to produce a disinfection percentage of 9% and treatment with
the ultrasonic horn alone was only able to produce a disinfection percentage of 47% [Jyoti &
Pandit, 2003]. A system combining an ultrasonic horn with 0.5 mg/L ozone dosing was able to
produce a 99.9% disinfection efficiency for heterotrophic plate count bacteria after 15 minutes of
treatment, while 15 minute stand-alone treatment regimens of 0.5 mg/L ozone dosing and
ultrasonic horn treatment produced heterotrophic plate count bacteria removal percentages of
46% and 50%, respectively [Jyoti & Pandit, 2004].
While research has demonstrated that microbial inactivation is possible through the
application of ultrasonic energy, it has not successfully demonstrated that this technology may be
applied to cooling system process water. The treatment times utilized in the studies performed
by Jyoti & Pandit were long (15 minutes) compared to the very short treatment times required for
cooling system process water. Since ultrasonic bombardment produces no residual, it may not be
effective in controlling the microbial population of a cooling water system which receives large
quantities of airborne material at various points throughout the system during operation. Some
form of residual treatment is likely necessary in order to prevent microbial fouling from
occurring, and as a result ultrasonic treatment systems alone may not be capable of significant
microbial control in cooling water systems.

ASHRAE 1361-‐RP 12 Final Technical Report
1.2.4 Hydrodynamic Cavitation Treatment
When fluids are subjected to sudden high pressure changes, very small vapor bubbles may form
within the fluid in a process known as cavitation. These bubbles quickly collapse, leading to
extremely high local temperatures, pressures, and fluid velocities. The implosion of these small
bubbles of fluid vapor within a liquid may lead to inactivation of surrounding organisms. This
own as
hydrodynamic cavitation [Gaines, 2007], and it has been proposed as a possible method of
disinfection for potable water, wastewater, and industrial process water.
The efficacy of hydrodynamic cavitation disinfection has been demonstrated by a number
of laboratory researchers. A group of investigators from India recently demonstrated the biocidal
effect of hydrodynamic cavitation on zooplankton, achieving disinfection efficiency of
approximately 80% [Sawant, 2008]. Additionally, elimination of Legionella pneumophila
bacteria using a laboratory-scale hydrodynamic cavitation treatment system has been observed
[Stout, 2002]. Hydrodynamic cavitation systems were able to generate a fecal coliform
disinfection efficiency of 89% after 60 minutes of treatment [Jyoti & Pandit, 2003]. This
treatment time is far longer than may be utilized by a cooling water treatment system, however.
Field studies involving the application of hydrodynamic cavitation treatment systems for
cooling tower make up water have also demonstrated positive results with regards to the control
of microbial populations. A group of researchers funded by the American Society of Heating,
Refrigerating, and Air-Conditioning Engineers (ASHRAE) investigated the biocidal capabilities
of a hydrodynamic cavitation system installed on a cooling tower located in an automotive test
lab [Gaines, 2007]. This system was capable of sustaining heterotrophic plate count values
ASHRAE 1361-‐RP 13 Final Technical Report
below approximately 104 CFU/mL for over 2 months. However, several HPCs in excess of 104
CFU/mL were observed during the investigation. Field application of a hydrodynamic cavitation
treatment system was also performed alongside pulsed-power treatment testing at Mt. Holly
Works in Goose Creek, SC [Kitzman, 2003]. In this study, the hydrodynamic cavitation device
was able to successfully maintain an average aerobic plate count of 95,500 CFU/mL and an
average anaerobic plate count of 87 CFU/mL in its cooling water system. However, the
installation of this system was accompanied by the installation of cyclonic separator for solids
removal. Since the systems during this investigation received large amounts of airborne carbon
fines from a nearby carbon silo, and the chemically-treated tower in this comparative study had
no form of filtration, a conclusion may not be made whether or not the observed reduction in
microbial activity in the system treated by hydrodynamic cavitation was the result of the physical
treatment process or the removal of high levels of excess carbon through filtration.
Several mechanisms for the inactivation of microorganisms via hydrodynamic cavitation
have been proposed. Studies have demonstrated that cavitation may result in the formation of
free radicals when applied to aqueous solutions [Kalumuck et al., 2003]. These hydrogen,
hydroxyl, and hydrogen peroxide radicals have the potential to eliminate pathogens, but only in
the area directly surrounding the bubble which collapses [Gaines, 2007]. The collapse of these
small fluid vapor bubbles also releases high pressure pulses (up to 1450 psia), shear forces, and
shock waves which are capable of causing nearby cells to rupture [Brennen, 1995].
work has demonstrated that extremely high temperatures (as high as 8540 °F) occur for a few
microseconds at the interface between the liquid and the vapor bubble during collapse. These
temperatures may also lead to the death of nearby microorganisms [Gaines, 2007]. Additionally,
when vapor bubble collapse occurs asymmetrically (i.e. near a surface), jets of fluid with

ASHRAE 1361-‐RP 14 Final Technical Report
extremely high velocities are formed, as well as eddies with large amounts of energy [Naude &
Elllis, 1961; Benjamin & Ellis, 1966]. These high fluid velocities may also be responsible for
cellular inactivation.
The development of hydrodynamic cavitation disinfection systems, much like that of
pulsed-power systems, must direct future efforts towards determining which inactivation
mechanisms to exploit. While microorganism inactivation has been documented via several
pathways, researchers must determine which pathway allows for the most efficient disinfection.
Several hydrodynamic cavitation systems are commercially available for use as a primary form
of disinfection, relying on asymmetric bubble collapse, pressure shock waves, and extreme local
temperatures for microbial inactivation. However, systems which employ the use of
hydrodynamic cavitation in combination with a low dose of chemical disinfectant and ultrasonic
cavitation technologies are also under development.
Researchers from the University of Mumbai in India have investigated a number of
hybrid hydrodynamic cavitation disinfection systems, coupling this treatment technology with
ultrasonic cavitation, ozone dosing, and hydrogen peroxide dosing [Jyoti & Pandit, 2003; Jyoti &
Pandit, 2004]. The combination of hydrodynamic cavitation with these disinfection technologies
demonstrated a synergistic effect. Hydrodynamic cavitation coupled with 5 mg/L H2O2 dosing
generated 90% removal of fecal coliforms after 60 minutes, compared to just 21% removal
produced after 60 minutes of 5 mg/L H2O2 dosing alone [Jyoti & Pandit, 2003]. When
hydrodynamic cavitation treatment alone was employed during this study, a fecal coliform
disinfection efficiency of 89% was observed after 60 minutes, indicating that the addition of
hyrodgen peroxide did little to increase the disinfection capacity of the cavitation device.
Hydrodynamic cavitation coupled with 0.5 mg/L dosing of ozone generated a fecal coliform
ASHRAE 1361-‐RP 15 Final Technical Report
disinfection efficiency of 80% after 15 minutes of treatment, compared to disinfection
efficiencies of 68% and 57% observed after 15 minutes of 0.5 mg/L ozone dosing and
hydrodynamic cavitation treatment, respectively [Jyoti & Pandit, 2004]. However, the treatment
times utilized during these studies are longer than is practical for cooling water treatment.
The application of hydrodynamic cavitation disinfection systems requires continued
research for optimization of efficiency. The use of hybrid systems which couple hydrodynamic
cavitation with other processes (both chemical and physical) should be further investigated, as
the results of some preliminary hybrid process studies [Jyoti & Pandit, 2003; Jyoti & Pandit,
2004] have demonstrated potentially high disinfection efficiencies. Additionally, different
hydrodynamic cavitation system designs must be compared to determine which means of
inducing cavitation produces the strongest biocidal effect. The ability of hydrodynamic
cavitation systems to eliminate Legionella has been demonstrated in the laboratory, but further
field research is necessary to verify these findings. Additionally, hydrodynamic cavitation
systems may affect the heat transfer efficiency of the water being treated, a subject which
warrants further investigation in order to be substantiated [Gaines, 2007]. Like ultrasonic
cavitation treatment, hydrodynamic cavitation does not produce any form of residual treatment.
ASHRAE 1361-‐RP 16 Final Technical Report
2.0 EXPERIMENTAL PROTOCOL
The following section will provide a detailed outline of the project performance. The objectives
of the investigation will be described, and the materials and methods used for the completion of
the study will be presented. This section will include a description of all parameters monitored
during each experiment, frequency and method of measurement, and specific instrumentation
used for sample analysis. In addition, a description of each non-chemical treatment device
evaluated during this investigation will be provided.
2.1 SPECIFIC OBJECTIVES
The primary objective of this investigation was to evaluate the ability of five (5) non-
chemical water treatment devices to significantly reduce the microbial population within a pilot-
scale cooling water system. This objective was accomplished in a well-controlled study in which
two identical cooling water systems were operated simultaneously. One tower received
treatment from the non-chemical device being tested, while the other tower received no treatment
for the duration of the experimental trial. Each device was activated at the beginning of the trial
and allowed to operate for the duration of the experiment (4 weeks). In addition, the
performance of non-chemical devices for the control of biological growth in pilot-scale cooling

ASHRAE 1361-‐RP 17 Final Technical Report
towers was compared to standard chemical treatment protocol (i.e., chlorination) that was
performed several times during this study as positive control (Section 4.7.) for experimental
validation.
2.2 MATERIALS AND METHODS
2.2.1 Cooling Tower System Description
Two pilot-scale model cooling tower systems were used to evaluate the performance of each
device. The two model cooling towers used in this study were designed to be identical. A
schematic outlining the cooling system setup for each tower is shown in Figure 1.
In each pilot-scale system, water is stored in a 60 gal. holding tank prior to being pumped
at a rate of 7 gpm by a 2 hp centrifugal pump into a stainless steel heating bath. The system flow
rate is controlled by the use of a side stream placed immediately after the pump discharge. This
sidestream returns a portion of the flow back to the 60 gal. holding tank. The rate of return flow
is controlled by a needle valve, allowing the tower operator to manually adjust the system flow
rate to approximately 7 gpm.
Immediately prior to entering the heating bath, the flow of water is split into two paths,
105 ft. and 44 ft.) wrap around a 15 kW immersion heater, and the entire heating apparatus is
surrounded by a stainless steel box containing dechlorinated water. The box is sealed by a lid
made of ½ in. thick plexiglass in order to minimize evaporative losses. The immersion heater is
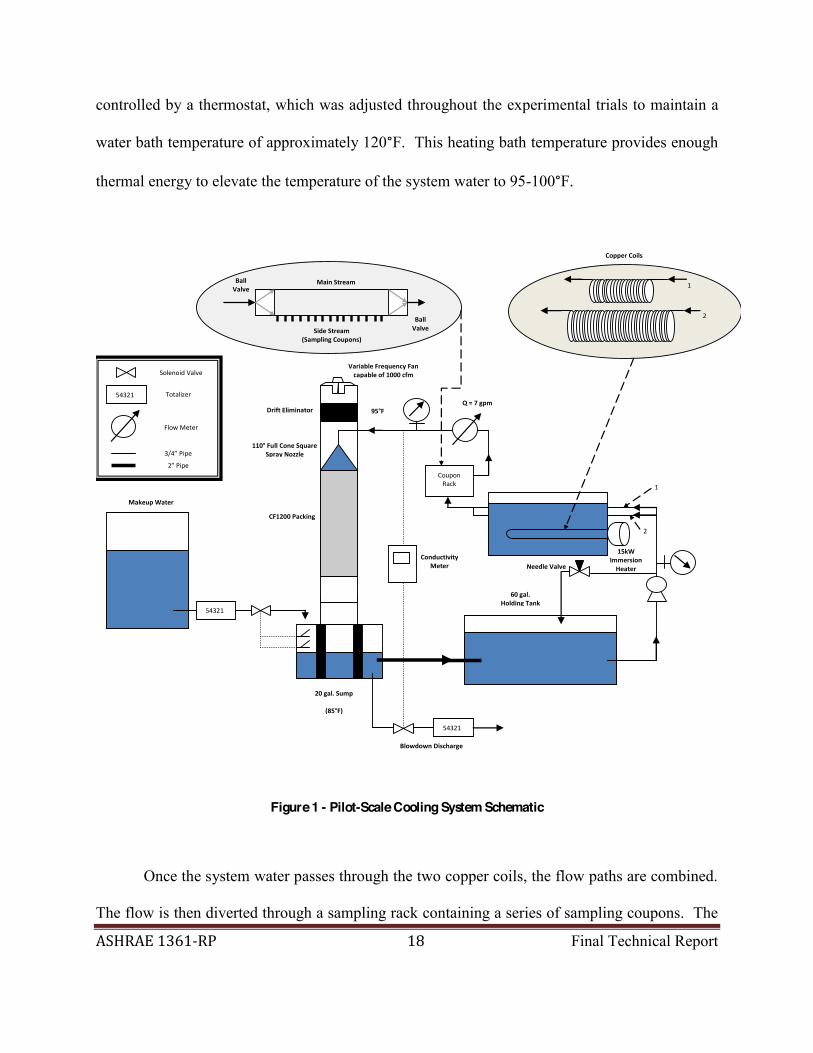
ASHRAE 1361-‐RP 18 Final Technical Report
controlled by a thermostat, which was adjusted throughout the experimental trials to maintain a
water bath temperature of approximately 120°F. This heating bath temperature provides enough
thermal energy to elevate the temperature of the system water to 95-100°F.
54321
54321
1
2
1
2
Coupon Rack
54321
Solenoid Valve
Totalizer
Flow Meter
95°F
20 gal. Sump
(85°F)
Makeup Water
Variable Frequency Fan capable of 1000 cfm
Drift Eliminator
110° Full Cone Square Spray Nozzle
CF1200 Packing
Blowdown Discharge
Conductivity Meter
15kW Immersion Heater
Copper Coils
Q = 7 gpm
Main Stream
Side Stream (Sampling Coupons)
Ball Valve
Ball Valve
Needle Valve
60 gal. Holding Tank
Figure 1 - Pilot-Scale Cooling System Schematic
Once the system water passes through the two copper coils, the flow paths are combined.
The flow is then diverted through a sampling rack containing a series of sampling coupons. The

ASHRAE 1361-‐RP 19 Final Technical Report
sampling coupons were 5.61 cm2 stainless steel washers which were scrubbed and autoclaved at
121°F prior to installation in the experimental towers. These coupons were installed at the
beginning of each device trial, and they were used to quantify biofilm growth within each of the
cooling tower systems. Coupons were installed parallel to the direction of flow.
Upon exiting the sampling rack, the system flow passes through a number of sensors for
data collection. Flow passes past a pH probe, an ORP probe, a conductivity probe, and a
thermometer designed to record the water temperature prior to tower entrance. Each of these
probes is connected to an AquaTrac Multiflex data collection system, which records data values
at 1-hour intervals. The flow then passes through a flow meter to ensure that system flow rate of
7 gpm is maintained. Immediately prior to tower entrance, the flow passes over an additional
conductivity meter. This conductivity meter is connected to a blowdown control system which
uses conductivity readings to control when the tower goes through blowdown based on a user-
defined blowdown conductivity setpoint. The setpoint is chosen based on the make-up water
conductivity, and it was selected to produce 4-5 cycles of concentration in the cooling tower
system.
Flow enters each of the cooling towers by way of a 110° full cone square spray nozzle.
This allows the flow to be distributed evenly over the surface of the CF1200 packing (Brentwood
Industries) which is installed in each tower. The height of the packing in each tower is adjusted
so that the spray from the nozzle contacts the packing at its uppermost edge, diverting flow
through the interior of the packing rather than down the side wall of the tower. A total of three
units of packing (1 ft3 each) were installed vertically in each tower system, for a total packing
height of 3 ft.

ASHRAE 1361-‐RP 20 Final Technical Report
Once the water has travelled through the packing, it is deposited into a 20 gal. sump. To
ensure an even flow distribution across the packing, water flow was measured at several points
Table 1). In order to minimize water losses from
Table 1 - Water flow (gpm) distribution across packing
A B
C
D E F
G H
I
Packing Measurement Locations (Cross-Sectional View)
A B c D E F G H I
T1 0.465 0.343 0.375 0.655 0.396 0.417 0.517 0.480 0.306 T2 0.422 0.322 0.338 0.449 0.475 0.549 0.581 0.607 0.602
Upon entering the sump, the water temperature decreased to 85-90°F, thereby
maintaining a temperature differential across the packing of approximately 10°F. This cooling is
accomplished by a variable frequency axial fan placed at the top of the tower, above the water
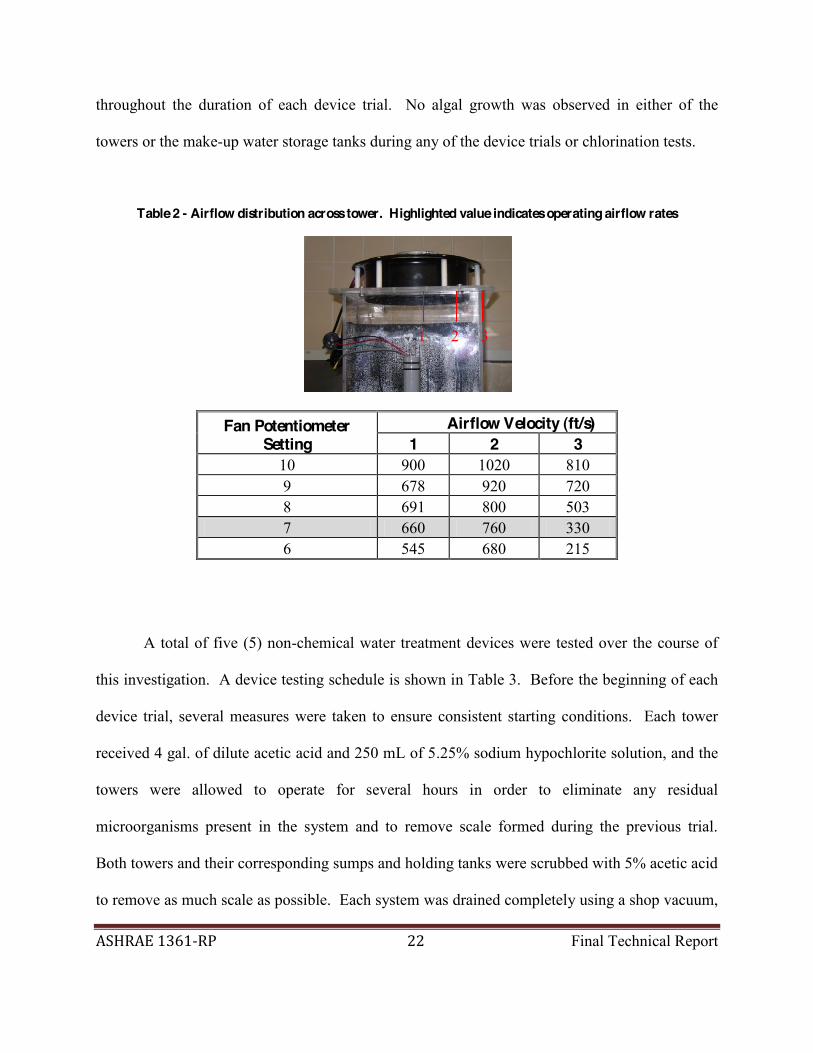
entrance. The rate of airflow generated by this fan is controlled by a potentiometer to produce
the desired 10°F temperature differential. A distribution of the airflow across the width of the
tower is shown in Table 2. The 20 gal. sump is connected to the 60 gal. holding tank via a 2 in.
diameter PVC pipe, and as water travels through the system it is pulled from the 20 gal. sump
back into the 60 gal. holding tank, completing the cooling water cycle.

ASHRAE 1361-‐RP 21 Final Technical Report
Make-up water used for all experiments in this study was dechlorinated City of
Pittsburgh tap water. Dechlorination was accomplished by passing the water through a fixed-bed
activated carbon adsorber [Loret et al., 2005]. The cylindrical activated carbon adsorber had a
height of 6 ft. and a diameter of 12 in. The column contained 33 L of activated carbon (TIGG
5DC 0830, coconut shell based, 8 x 30 mesh size, activity = 1000; manufactured by TIGG
Corporation), and the flow rate through the column during make-up water generation was
maintained at or below 3 gpm in order to ensure a minimum contact time of 3 min. Make-up
water for each cooling tower was stored in four 125-gal polyethylene tanks to provide enough
water for two days of tower operation (approximate tank residence time = 48 hrs). In between
device trials, the carbon column was flushed by running water through it at twice the flow rate
necessary for chlorine removal (> 6 gpm) for a minimum of 1 hr.
2.2.2 Device Trial Protocol
For each device trial, a control tower and a test tower were utilized. The control tower
(T1) received no treatment during the testing process, while the device tower (T2) received
treatment from the device being evaluated. The device was activated at the beginning of the
study, and it was not turned off until the investigation had been completed. For the remainder of
this report, the control tower in each device trial will be referred to as T1 (Control), and the
device tower will be referred to as T2 (Device). Lights in both the shower room containing the
two test towers and the locker room containing the make-up water storage tanks were kept on
ASHRAE 1361-‐RP 22 Final Technical Report
throughout the duration of each device trial. No algal growth was observed in either of the
towers or the make-up water storage tanks during any of the device trials or chlorination tests.
Table 2 - Airflow distribution across tower. Highlighted value indicates operating airflow rates
Fan Potentiometer Setting
Airflow Velocity (ft/s) 1 2 3
10 900 1020 810 9 678 920 720 8 691 800 503 7 660 760 330 6 545 680 215
A total of five (5) non-chemical water treatment devices were tested over the course of
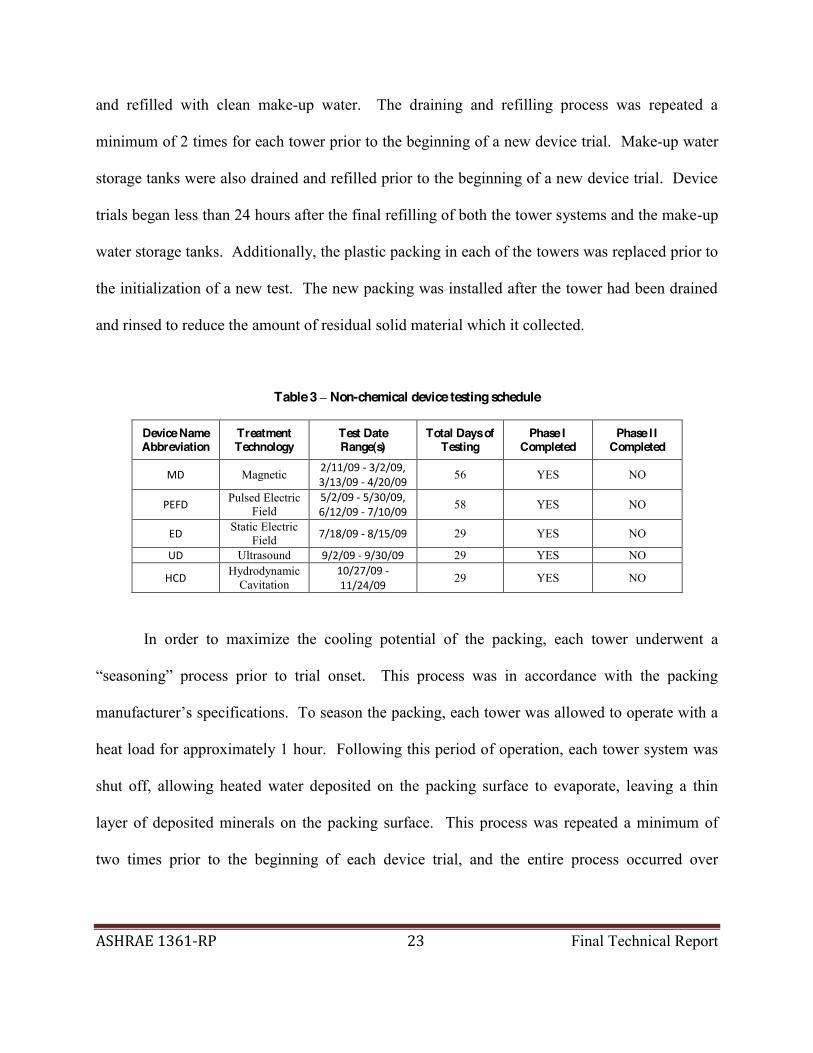
this investigation. A device testing schedule is shown in Table 3. Before the beginning of each
device trial, several measures were taken to ensure consistent starting conditions. Each tower
received 4 gal. of dilute acetic acid and 250 mL of 5.25% sodium hypochlorite solution, and the
towers were allowed to operate for several hours in order to eliminate any residual
microorganisms present in the system and to remove scale formed during the previous trial.
Both towers and their corresponding sumps and holding tanks were scrubbed with 5% acetic acid
to remove as much scale as possible. Each system was drained completely using a shop vacuum,
3 C 2 1 A
ASHRAE 1361-‐RP 23 Final Technical Report
and refilled with clean make-up water. The draining and refilling process was repeated a
minimum of 2 times for each tower prior to the beginning of a new device trial. Make-up water
storage tanks were also drained and refilled prior to the beginning of a new device trial. Device
trials began less than 24 hours after the final refilling of both the tower systems and the make-up
water storage tanks. Additionally, the plastic packing in each of the towers was replaced prior to
the initialization of a new test. The new packing was installed after the tower had been drained
and rinsed to reduce the amount of residual solid material which it collected.
Table 3 Non-chemical device testing schedule
Device Name Abbreviation
Treatment Technology
Test Date Range(s)
Total Days of Testing
Phase I Completed
Phase I I Completed
MD Magnetic 2/11/09 -‐ 3/2/09, 3/13/09 -‐ 4/20/09
56 YES NO
PEFD Pulsed Electric
Field 5/2/09 -‐ 5/30/09, 6/12/09 -‐ 7/10/09
58 YES NO
ED Static Electric
Field 7/18/09 -‐ 8/15/09 29 YES NO
UD Ultrasound 9/2/09 -‐ 9/30/09 29 YES NO
HCD Hydrodynamic
Cavitation 10/27/09 -‐ 11/24/09
29 YES NO
In order to maximize the cooling potential of the packing, each tower underwent a
heat load for approximately 1 hour. Following this period of operation, each tower system was
shut off, allowing heated water deposited on the packing surface to evaporate, leaving a thin
layer of deposited minerals on the packing surface. This process was repeated a minimum of
two times prior to the beginning of each device trial, and the entire process occurred over

ASHRAE 1361-‐RP 24 Final Technical Report
approximately 3 days. Each tower system was drained and replenished following the final
seasoning of the packing.
Throughout the course of the study, water temperature measurements were taken at regular
intervals to determine both the temperature of the water entering the tower system and the water in the
sump. Measurements of the water temperature entering each of the tower systems were taken every
hour using an AquaTrack MultiFlex data logging device. A manual reading of this temperature for
each tower system was recorded on a daily basis. Sump temperature measurements were taken every
15 minutes using a portable thermologger (Omega Scientific). Additionally, manual sump
temperature measurements were taken daily using a handheld thermometer.
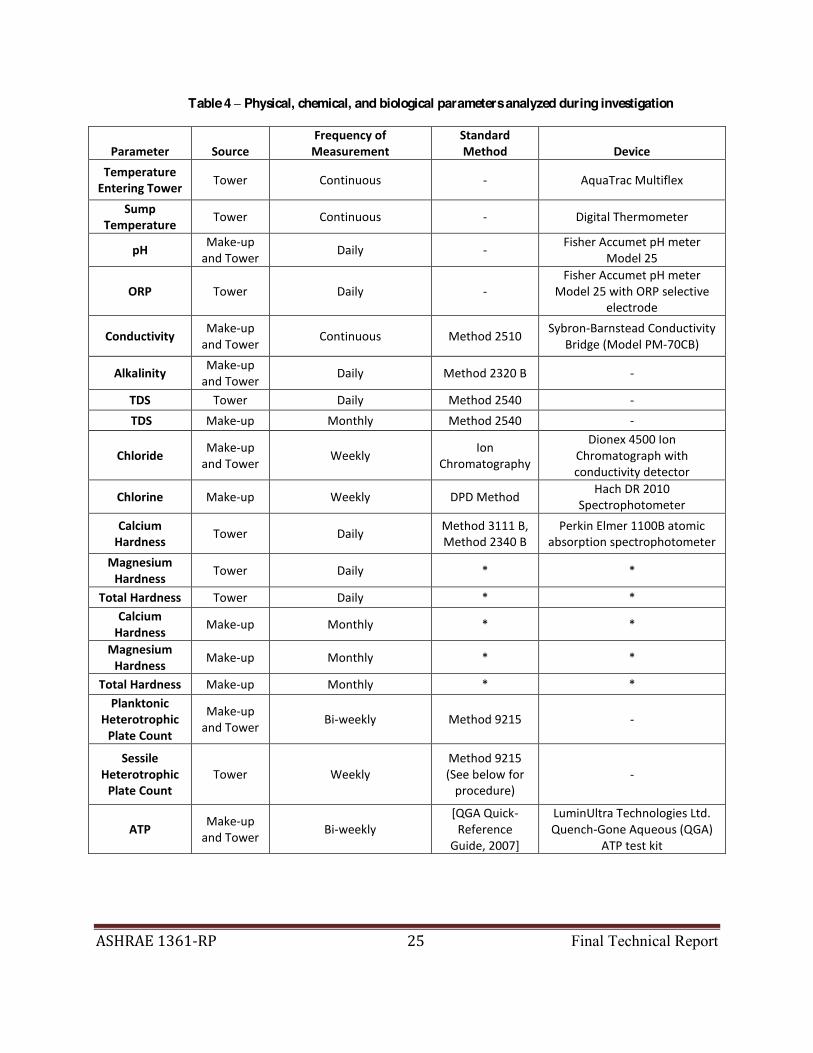
A number of physical, chemical, and biological parameters were monitored during the
performance of each device trial. The parameters measured, as well as their corresponding
frequencies of measurement, are shown in Table 4. Immediately following this table is a
description of the protocol used for biofilm sampling. A picture of the biofilm sampling coupon
setup is shown in Figure 2.
ASHRAE 1361-‐RP 25 Final Technical Report
Table 4 Physical, chemical, and biological parameters analyzed during investigation
Parameter Source Frequency of Measurement
Standard Method Device
Temperature Entering Tower
Tower Continuous -‐ AquaTrac Multiflex
Sump Temperature
Tower Continuous -‐ Digital Thermometer
pH Make-‐up and Tower
Daily -‐ Fisher Accumet pH meter
Model 25
ORP Tower Daily -‐ Fisher Accumet pH meter
Model 25 with ORP selective electrode
Conductivity Make-‐up and Tower
Continuous Method 2510 Sybron-‐Barnstead Conductivity
Bridge (Model PM-‐70CB)
Alkalinity Make-‐up and Tower
Daily Method 2320 B -‐
TDS Tower Daily Method 2540 -‐
TDS Make-‐up Monthly Method 2540 -‐
Chloride Make-‐up and Tower
Weekly Ion
Chromatography
Dionex 4500 Ion Chromatograph with conductivity detector
Chlorine Make-‐up Weekly DPD Method Hach DR 2010
Spectrophotometer
Calcium Hardness
Tower Daily Method 3111 B, Method 2340 B
Perkin Elmer 1100B atomic absorption spectrophotometer
Magnesium Hardness
Tower Daily * *
Total Hardness Tower Daily * * Calcium Hardness
Make-‐up Monthly * *
Magnesium Hardness
Make-‐up Monthly * *
Total Hardness Make-‐up Monthly * * Planktonic
Heterotrophic Plate Count
Make-‐up and Tower
Bi-‐weekly Method 9215 -‐
Sessile Heterotrophic Plate Count
Tower Weekly Method 9215 (See below for procedure)
-‐
ATP Make-‐up and Tower
Bi-‐weekly [QGA Quick-‐Reference
Guide, 2007]
LuminUltra Technologies Ltd. Quench-‐Gone Aqueous (QGA)
ATP test kit

ASHRAE 1361-‐RP 26 Final Technical Report
Biofilm Sampling Protocol
**Close valves to bypass coupon rack**
1. Put on gloves 2. Unscrew coupon holder from rack and remove 3. Swab bottom of coupon before unscrewing 4. Hold coupon over sterile conical tube and unscrew nut 5. Release coupon into 5 mL conical tube bottom side down 6. Swab top of coupon and add 10 mL of sterile water to tube 7. Place swab into tube and agitate vigorously to remove attached material from swab.
Cut or break swab and leave in the tube 8. Transport sample to lab as soon as possible 9. Vortex for 30 sec before testing the sample liquid. Process for HPC using appropriate
dilution scheme 10. Total CFU recovered is calculated by multiplying CFU x 10 mL sample volume 11. Divide total CFU by surface area of the coupon (5.61 cm2). Report coupon results as
CFU/cm2 12. Save coupon and sterilize for reuse
Figure 2 Diagram of biofilm sampling coupon setup
Stainless Steel Washer (SA = 5.61 cm2)

ASHRAE 1361-‐RP 27 Final Technical Report
Bulk water samples were collected using sterilized sampling bottles. Biofilm samples
were collected using the protocol described below. All biological samples were kept chilled
during transport to the laboratory. Upon arrival, samples were shaken thoroughly and subject to
a series of dilutions. The dilutions used were determined using pre-device trial testing, which
indicated the levels of microbial growth to be expected in each of the towers, as well as in the
make-up water.
A series of three dilutions was plated for each bulk water and biofilm sample. Ten-fold
dilutions were accomplished by transferring 1.0 mL of sample water to a test tube containing 9.0
mL of sterilized deionized water. Hundred-fold dilutions were accomplished by transferring 0.1
mL of sample water into a test tube containing 9.9 mL of sterilized deionized water. The range
of dilutions used for make-up water analysis was 10-2 10-4 for this investigation, while the bulk
water tower dilution range was 10-3 10-5 and the biofilm sample dilution range was 10-4 10-6.
Fresh sterilized pipette tips were used for each volumetric transfer during the dilution process.
Dilutions were plated according to Standard Method 9215 pour plate protocol.
The measurement of cellular ATP was performed using a test kit manufactured by
passing through a sample. By comparing the measured number of RLUs to a standard of a
known concentration of ATP, it was possible to determine the concentration of ATP present in
each tower system biological sample. The following equation was used to calculate cellular ATP
(cATP) [QGA Quick-Reference Guide, 2007]:

ASHRAE 1361-‐RP 28 Final Technical Report
In this equation, RLUUltraCheck refers to the measured RLUs passing through a standard of
known ATP concentration. For all measurements, a sample volume of 50 mL was used.
Cellular ATP was used to determine the number of microbial equivalents present in each sample
for comparison with heterotrophic plate counts. This was done using the following equation
[QGA Quick-Reference Guide, 2007]:
2.2.3 Chemical Disinfection Test Protocols
During the course of investigating the effectiveness of NCDs for the control of biological growth
in cooling towers, three chlorination tests were performed. These tests, which involved the
addition of chlorine to the device tower (T2), are essential to provide scientifically defensible
evidence that industry-tested disinfection methods are capable of controlling microbial growth in
the experimental system operated in this study. Demonstrating the effectiveness of these
disinfection tests indicates that the comparison between accepted and experimental treatment
mechanisms is valid.
The selection of free chlorine as a positive control was based on common practice in
cooling water treatment and a previous study where several chemical biocides, including free
chlorine, were evaluated in model cooling towers that simulated real-world cooling tower
operational conditions [Thomas et al., 1999]. The Thomas et al. investigation was performed
ASHRAE 1361-‐RP 29 Final Technical Report
using a series of cross-flow cooling tower cells. Prior to the performance of disinfection trials,
the researchers demonstrated that the tower cells were capable of generating and maintaining a
heterotrophic bacterial population >106 CFU/mL after 48 hrs of operation. In the first phase of
the Thomas et. al. study, the chlorine treatment protocol (0.5-1.5 ppm as free residual oxidant)
reduced planktonic heterotrophic bacteria by at least 3 orders of magnitude (99.9%) and
reduced heterotrophic bacteria in biofilms by 3-4 orders of magnitude (99.9+%) compared to
controls. This study demonstrated that chlorination may be used as an effective means of
biological control when applied to a model cooling tower system, and its application to a pilot-
scale system can produce results which directly reflect those observed in full-scale cooling
systems.
2.2.3.1 Pre-Device Trial Chlorination Test Protocol
The first chlorination test was performed prior to the beginning of the device trials. During this
test, both T1 (Control) and T2 (Device) operated untreated from 1/15/09 1/22/09. After
samples were taken on 1/22, a spike dose of chlorine (80 mL of 5.25% sodium hypochlorite
supplied by Fisher Scientific) was added to each of the towers, resulting in an initial chlorine
dose of approximately 14 mg/L. Following this spike dose, chlorine stock solution was pumped
into each tower system to maintain a chlorine concentration of approximately 1 mg/L for 3 days.
For this chlorination test, the stock solution was prepared by adding 60 mL of 5.25% sodium
hypochlorite solution per gallon of dechlorinated water, resulting in a free chlorine concentration
of 832 mg/L.

ASHRAE 1361-‐RP 30 Final Technical Report
For the first day of chlorination, chlorine stock solution was pumped into each tower at a
rate of 5 mL/min. Flow rates for the 2nd and 3rd days of chlorination were approximately 3
mL/min and 2 mL/min, respectively, as a result of decreased chlorine demand due to microbial
inactivation. Overall, the total volume of chlorine stock solution added to each tower during this
3-day test was 14.4 L, corresponding to a total chlorine mass added to each tower of
approximately 12 g. The average makeup water consumption rate for each tower was
approximately 130 gal/day and the average initial chlorine feed for each tower can be estimated
at approximately 8 mg/L. Considering that the chlorine residual in each tower was maintained at
approximately 1 mg/L, the disinfectant demand for this experimental system heavily colonized
with microbial growth can be estimated at approximately 7 mg/L.
2.2.3.2 ED/UD Chlorination Test
The second chlorination test was performed immediately after the ED trial and immediately
before the towers were prepared for the UD trial. During this chlorination test, T2 (Device)
received chemical treatment, while T1 (Control) remained untreated. Chlorination began on 8/21
after biological samples were taken, and it was performed for three days. The sodium
hypochlorite purchased from Fischer Scientific was consumed during the cleaning processes
following the MD and PEFD device trials, and new sodium hypochlorite solution had to be
purchased. The sodium hypochlorite solution used for this chlorination test was 6.0% household
bleach.

ASHRAE 1361-‐RP 31 Final Technical Report
The chlorination process began with a spike dose of chlorine (80 mL of 6.0% sodium
hypochlorite), resulting in an initial chlorine dose of approximately 16 mg/L. This shock dose
was followed by a steady flow of chlorine stock solution in order to maintain a free chlorine
concentration of approximately 1 mg/L. The stock solution was prepared by adding 52 mL of
6.0% sodium hypochlorite per gallon of dechlorinated water for an approximate concentrion of
832 mg/L. The flow rate of chlorine stock solution on days 1, 2, and 3 of chlorination were 5
mL/min, 3 mL/min, and 2 mL/min, respectively. Overall, the total volume of chlorine stock
solution added to each tower during this 3-day test was 14.4 L, corresponding to a total chlorine
mass added to each tower of approximately 12 g. The average makeup water consumption rate
for each tower was approximately 130 gal/day and the average initial chlorine feed for each
tower can be estimated at approximately 8 mg/L. Considering that the chlorine residual in each
tower was maintained at approximately 1 mg/L, the disinfectant demand for this experimental
system heavily colonized with microbial growth can be estimated at approximately 7 mg/L.
2.2.3.3 UD/HCD Chlorination Test
The third chlorination test was performed immediately following the UD trial and immediately
before the towers were prepared for the HCD trial. Chlorination of T2 (Device) began on 10/1
following biological sampling, and it was performed using a steady dose of chlorine stock
solution. The sodium hypochlorite solution used for this chlorination test was 6.0% household
bleach manufactured by Target Corporation. The stock solution was prepared by adding 52 mL

ASHRAE 1361-‐RP 32 Final Technical Report
of 6.0% sodium hypochlorite per gallon of dechlorinated water for an approximate concentrion
of 832 mg/L.
No shock dose of chlorine was used for this test, but instead a gradual increase in
chlorine concentration was performed over a period of 5 days until the residual concentration
reached 1 mg/L. The flow rate of chlorine stock solution on day 1 was approximately 8 mL/min.
The flow rate was decreased to 6 mL/min on day 2, 5 mL/min on day 3, 3 mL/min on day 4, and
2 mL/min on day 5. Overall, the total volume of chlorine stock solution added to each tower
during this 5-day test was 34.6 L, corresponding to a total chlorine mass added to each tower of
approximately 29 g (in the absence of an initial shock dose of chlorine). The average makeup
water for each tower was approximately 130 gal/day and the average initial chlorine feed for
each tower can be estimated at approximately 11.4 mg/L. Considering that the chlorine residual
in each tower was maintained at approximately 1 mg/L, the disinfectant demand for this
experimental system heavily colonized with microbial growth can be estimated at approximately
10.4 mg/L. While this demand was higher than the previous 2 chlorination tests, this may be
attributed to the fact that no initial shock dose of chlorine was applied during this test.

ASHRAE 1361-‐RP 33 Final Technical Report
2.3 NON-CHEMICAL DEVICES
2.3.1 Magnetic Device (MD)
-through cylinder
which exposes water to 4 alternating magnetic poles. A diagram of the device is shown in
Figure 3. Since the device utilizes fixed magnetic fields to condition the water, it requires
protection from electromagnetic fields generated by high-voltage electronic devices. In order to
prevent any interference with the MD by the 3-phase centrifugal pump used to pump water
through the cooling system, a lead shield was installed around the device during the testing
period.
Figure 3 Magnetic device (MD) diagram [Lin & Nadiv, 1988]
ASHRAE 1361-‐RP 34 Final Technical Report
The MD is marketed as a scale-inhibiting water conditioner. The manufacturer does not
claim that the device is capable of microbiological control. According to the manufacturer, the
device operates by keeping mineral ions, such as calcium and magnesium in suspension, thereby
preventing them from forming scale on cooling surfaces [Cho, 2002]. Instead, mineral
compounds form in suspension, leading to the formation of a precipitate, which is easily
removed from cooling system surfaces. This reduction in scale formation leads to increased
system operational efficiency, while at the same time reducing water and energy consumption.
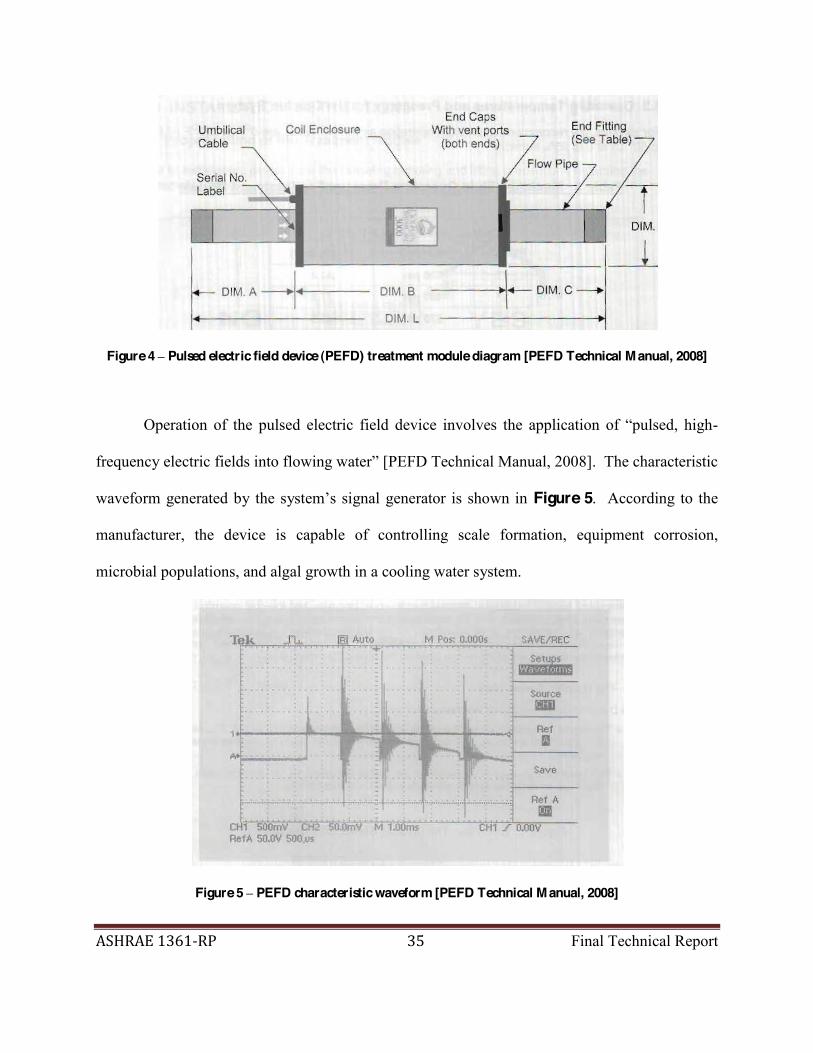
2.3.2 Pulsed Electric Field Device (PEFD)
The pulsed-power (electrostatic) non-chemical treatment device evaluated in this investigation is
composed of two primary components: the signal generator and the treatment module. The
parts. LEDs installed in the front of the box are used to ensure proper operation, while
ventilation slits on both sides of the unit allow for fan-powered cooling of the interior
electronics. A power connection is also included in the signal generator, and it operates at a
flow-through reactor, is connected to the signal generator via an umbilical cable. A diagram of
the treatment module is shown in Figure 4.
ASHRAE 1361-‐RP 35 Final Technical Report
Figure 4 Pulsed electric field device (PEFD) treatment module diagram [PEFD Technical Manual, 2008]
-
freque
Figure 5. According to the
manufacturer, the device is capable of controlling scale formation, equipment corrosion,
microbial populations, and algal growth in a cooling water system.
Figure 5 PEFD characteristic waveform [PEFD Technical Manual, 2008]

ASHRAE 1361-‐RP 36 Final Technical Report
The PEFD manufacturer claims that scaling is controlled via the interaction between the
pulsating electromagnetic field produced by the signal generator and suspended particles in the
suspended particles by removing the static electric charge on their surface
Manual, 2008]. By removing this electric charge, interactions between molecules found in water
lead to the formation of a powdery calcium carbonate precipitate, as opposed to the formation of
a thick calcium carbonate scale on system surfaces. The precipitated calcium carbonate may
then be removed either through filtration or normal tower blowdown.
Biological control by PEFD is proposed to occur by two separate pathways. The first is
encapsulation, where the precipitate formed as a result of the interaction between suspended
particles clusters around microorganisms which are present in the cooling water system.
Bacteria normally would repel these particles due to their static charge. However, by removing
this static charge the PEFD allows for these suspended particles to collect around microbes,
encasing them and effectively inactivating them by preventing any further microbial
reproduction from occurring. The second pathway by which microbial control is proposed to
occur is electroporation, which involves a physical rupturing of the membrane of planktonic
of holes within the outer membrane of microorganisms which pass through the treatment module
[PEFD Technical Manual, 2008]. As a result of this membrane damage, microorganisms spend
the remainder of their 1-2 day lifespan repairing external cellular damage, eliminating their
reproductive capacity and effectively rendering them inactive. The combined effect of
encapsulation and electroporation is suggested to lead to a reduction in total bacterial counts in
systems which utilize the PEFD.

ASHRAE 1361-‐RP 37 Final Technical Report
In addition to the control of planktonic microbial population, it is proposed that the PEFD
is also capable of biofilm formation prevention. This control may result from the interaction
between planktonic and sessile microorganisms in cooling water systems. Planktonic bacteria
generate specific nutrients which are then absorbed and utilized by sessile bacteria. The
elimination of planktonic bacteria via encapsulation and electroporation greatly reduces the
sessile
microbial population present in the system is claimed to be greatly reduced.
Corrosion control by the PEFD is a result of the prevention of scale formation and the
reduction of the sessile and planktonic microbial populations within the system water. The
formation of calcium carbonate precipitates is thought to act as a preventive measure against
by blocking the reception of electrons that are throw
Technical Manual, 2008]. Several microorganisms which commonly populate cooling water
systems generate corrosive byproducts, such as hydrogen sulfide. By controlling the
reproduction of these organisms, the PEFD may be able to reduce the concentrations of these
corrosive byproducts, reducing the overall corrosion rate of the system water. As a result, the
device manufacturer claims that both localized and uniform corrosion rates are significantly
decreased by the application of their device.
The PEFD was installed in the cooling tower system used in this study according to the
pump and immediately before the heat bath. According to the manufacturer, the treatment
module may also be placed directly after the heat exchanger but before the entrance of water into
the cooling tower.
ASHRAE 1361-‐RP 38 Final Technical Report
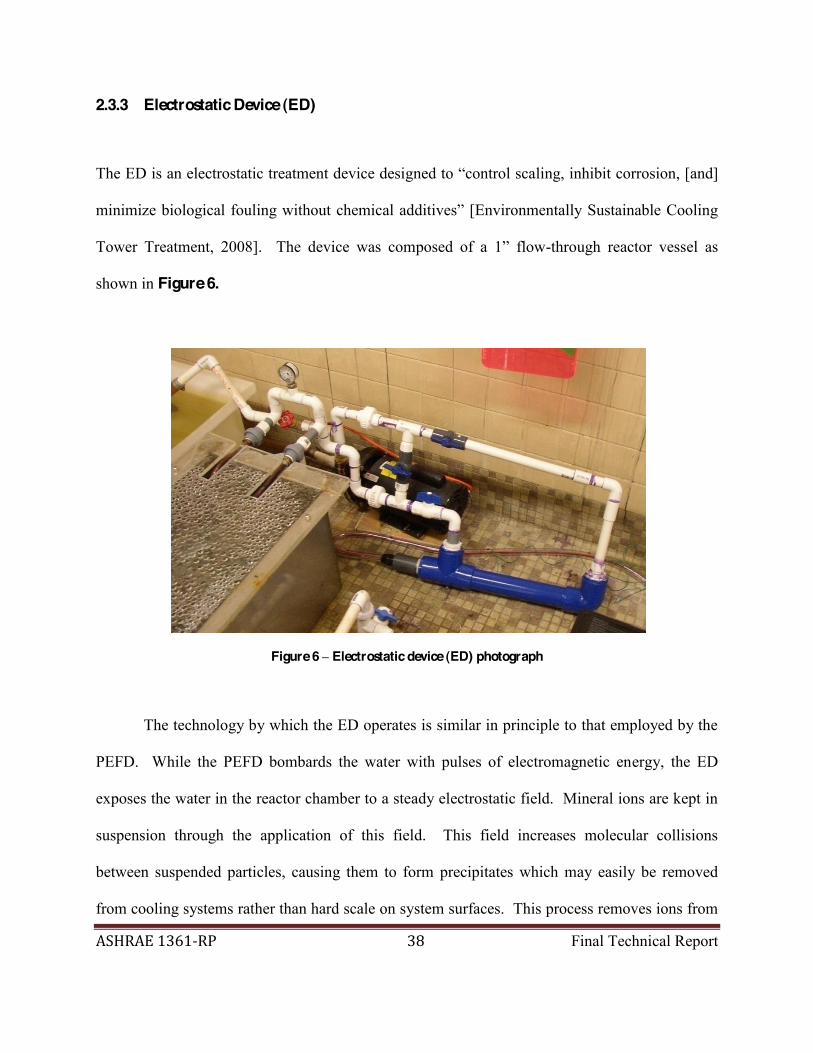
2.3.3 Electrostatic Device (ED)
ling, inhibit corrosion, [and]
-through reactor vessel as
shown in Figure 6.
Figure 6 Electrostatic device (ED) photograph
The technology by which the ED operates is similar in principle to that employed by the
PEFD. While the PEFD bombards the water with pulses of electromagnetic energy, the ED
exposes the water in the reactor chamber to a steady electrostatic field. Mineral ions are kept in
suspension through the application of this field. This field increases molecular collisions
between suspended particles, causing them to form precipitates which may easily be removed
from cooling systems rather than hard scale on system surfaces. This process removes ions from

ASHRAE 1361-‐RP 39 Final Technical Report
solution, which allows for the dissolution of scale which has already formed [Environmentally
Sustainable Cooling Tower Treatment, 2008]. Possible mechanisms for the control of biological
growth in the system would be very similar to those described for the PEFD.
2.3.4 Ultrasonic Device (UD)
The UD operates by diverting water from the cooling system sump or holding tank through a
venturi and into an ultrasonic treatment cell. Once the flow velocity has been increased by
passing through the venturi, air is introduced into the water stream. According to the
manufacturer, the vacuum pressure generated by the venturi during normal operation should be
between 0.4 and 0.75 bar below atmospheric pressure [UD Operation Manual, 2008]. The
water/air mixture then enters an ultrasonic treatment chamber containing 6 ceramic transducers.
Upon exiting the treatment cell, the water passes through a basket filter prior to discharge back
into the cooling system sump.
representative from the manufacturer approved the final installation. A sidestream was
constructed for the application of this device, with the sidestream intake positioned near the
A diagram of the ultrasonic device is shown in Figure 7.

ASHRAE 1361-‐RP 40 Final Technical Report
Figure 7 Ultrasonic device (UD) diagram [UD Operation Manual, 2008]
2.3.5 Hydrodynamic Cavitation Device (HCD)
Operation of the HCD involves the diversion of water from the cooling system sump or holding
tank into the device, where treatment is administered and the water is returned to the sump from
which it was initially withdrawn. Water drawn from the system sump enters a pressure-
equalization chamber. The flow of water is then split into two separate streams and each of these
streams, and these streams are forced to collide in a low-pressure stabilizing chamber.

ASHRAE 1361-‐RP 41 Final Technical Report
The collision of these two conical streams creates a vacuum region which results in the
formation of cavitation bubbles. In turn, the collapse of these bubbles generates local regions of
high shearing forces, temperatures, and pressures, leading to microbial inactivation.
-bonding molecular arrays of water are broken down, thereby
allowing entrapped gasses, such as CO2, to be released and off-gassed to [the] atmosp
[HCD Technology: A Primer, 2008].
The manufacturer of the HCD claims that the device is capable of controlling biological
growth and scaling, in addition to corrosion protection. Case studies of similar system operation
provided by the manufacturer indicate that bacterial plate counts of < 10,000 CFU/mL and levels
of Legionella below detectable limits may be achieved by proper system operation [Scappatura,
2002]. Additionally, the systems described in these case studies provided a visible reduction in
system scaling, while at the same time reducing mild steel corrosion rates to < 2.5 MPY and
copper corrosion rates to < 0.3 MPY [Scappatura, 2002]. As a result, the system was able to
reduce blowdown volumes by over 70% [Scappatura, 2002].
The H
representative from the manufacturer approved the final installation. The sidestream used for the
ultrasonic device trial was reused. In order to allow for adequate CO2 degassing, the outlet end
of the sidestream was cut so that water was expelled above the sump water surface level. Plastic
sheeting was installed around the sidestream outlet in order to minimize water losses from
splashing. A diagram of the HCD reaction chamber provided by the manufacturer is shown in
Figure 8.

ASHRAE 1361-‐RP 42 Final Technical Report
Figure 8 Hydrodynamic cavitation device (HCD) reaction chamber diagram
Cavitation Chamber Inlet Water
Treated Water
Inlet Water
Pressure Equalization Chamber
Pressure Equalization Chamber

ASHRAE 1361-‐RP 43 Final Technical Report
3.0 EXPERIMENTAL REPRODUCIBILITY
Each of the five non-chemical water treatment devices was tested for a minimum of 4 weeks.
Some tests were repeated due to operational problems. Additionally, chlorination tests were
performed between some device trials in order to demonstrate that the microbial population in
the towers could be controlled using a traditional approach (i.e. chemical treatment). The
chemical parameter values collected during each investigation were used to calculate 3 different
scaling indices. The calculation and interpretation of these indices are outlined in Appendix A.
The make-up water quality and performance of T1 (Control) throughout the course of the
entire investigation were monitored in order to ensure similar conditions of operation for each
individual device trial. These data were compared using statistical analyses to verify that
operating conditions were not biased for any of the experimental device trials. This comparison
provides evidence of experimental reproducibility by demonstrating consistent and realistic
operating conditions over the course of the investigation.
The reproducibility of this investigation is governed by two main factors: make-up water
quality and conditions in T1 (Control). In order to verify that each experimental device operated
under similar conditions during its respective device trial, it is necessary to analyze the make-up
water entering each of the two tower systems for similarity during each device trial.
Additionally, it is necessary to demonstrate that control conditions were essentially constant over

ASHRAE 1361-‐RP 44 Final Technical Report
the duration of the entire experiment. Data figures and tables demonstrating experimental
reproducibility in terms of physical/chemical parameters of make-up water and T1 (Control)
operating conditions are included in Appendix B.
3.1 MAKE-UP WATER QUALITY
Both chemical and biological characteristics of the make-up water were monitored regularly over
the course of the experiment. Chemical parameters of make-up water quality are shown in
Appendix B.1, while the average values for the measured physical and chemical make-up water
parameters are shown in Table 5. Detailed monthly measurements are shown in Figure B1
Figure B4 of Appendix B and summarized in Table B1.
Table 5 Average values for make-up water
Make-up Water Summary Table
Average Standard Deviation
Conductivity (mS/cm) 0.307 0.039 pH 7.33 0.22
Alkalinity (mg/L as CaCO3) 26 5
Calcium Hardness (mg/L as CaCO3) 28 7.3
Magnesium Hardness (mg/L as CaCO3) 24 5.9
Total Hardness (mg/L as CaCO3) 52 11 TDS (mg/L) 208 25 Chloride (mg/L) 37 4 Free Chlorine (mg/L) 0.017 0.009 Copper (mg/L) ND - I ron (mg/L) ND - Sulfate (mg/L) 40.7 6.3 Phosphate (mg/L) 1.15 0.32 Planktonic HPC (CFU/mL) 2.66E+04 6.13E+04

ASHRAE 1361-‐RP 45 Final Technical Report
3.1.1 Biological Parameters
Average planktonic HPC in make-up water for each device trial are summarized in Figure 9.
Figure 10 shows the variation in planktonic HPC in the make-up water for each trial. A
comparison of these parameters demonstrates that, while fluctuations in both the biological and
chemical composition of the make-up water were observed over the course of the experiment,
these fluctuations did not alter conditions to an extent which would have adversely affected
experimental reproducibility.
Figure 9 Average make-up water planktonic microbial population (HPC) during each device trial. Error
bars represent range of observed values (maximum and minimum)
1.00E+02
1.00E+03
1.00E+04
1.00E+05
1.00E+06
MD
HPC
(CFU
/mL)
Make-‐Up Water Average Planktonic Microbial Populations
Make-‐Up
PEFD (1/2) PEFD (2/2) ED UD HCD

ASHRAE 1361-‐RP 46 Final Technical Report
Figure 10 Make-up water planktonic microbial populations (HPC) for each device trial
3.1.2 Summary
The average heterotrophic plate count for the make-up water over the course of the entire
investigation was 104.4 CFU/mL. While this value is higher than the EPA mandatory potable
water quality standard (< 500 CFU/mL or < 102.7 log CFU/mL), it does not demonstrate an
excessive or unrealistic level of microbial activity in the make-up water. Planktonic
heterotrophic plate count values for a variety of potential make-up water sources are shown in
Table 6. The water sources highlighted in this table include household taps, which may be used
as make-up water sources in small-scale cooling systems, as well as potential natural make-up
1.E+01
1.E+02
1.E+03
1.E+04
1.E+05
1.E+06
1.E+07
0 5 10 15 20 25 30 35 40
HPC
(CFU
/mL)
Days Elapsed
Make-‐up Water Planktonic Microbial Population
MD
PEFD Test 1/2
PEFD Test 2/2
ED
UD
HCD
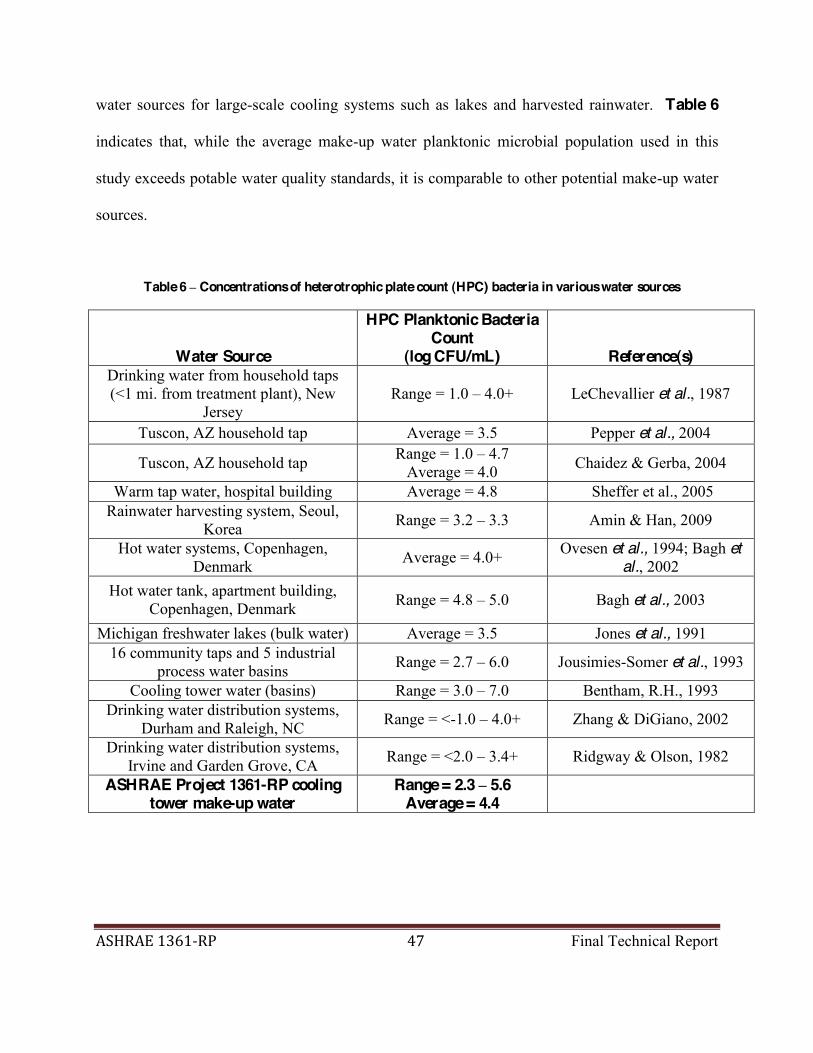
ASHRAE 1361-‐RP 47 Final Technical Report
water sources for large-scale cooling systems such as lakes and harvested rainwater. Table 6
indicates that, while the average make-up water planktonic microbial population used in this
study exceeds potable water quality standards, it is comparable to other potential make-up water
sources.
Table 6 Concentrations of heterotrophic plate count (HPC) bacteria in various water sources
Water Source
HPC Planktonic Bacteria Count
(log CFU/mL) Reference(s) Drinking water from household taps (<1 mi. from treatment plant), New
Jersey Range = 1.0 4.0+ LeChevallier et al., 1987
Tuscon, AZ household tap Average = 3.5 Pepper et al., 2004
Tuscon, AZ household tap Range = 1.0 4.7 Average = 4.0 Chaidez & Gerba, 2004
Warm tap water, hospital building Average = 4.8 Sheffer et al., 2005 Rainwater harvesting system, Seoul,
Korea Range = 3.2 3.3 Amin & Han, 2009
Hot water systems, Copenhagen, Denmark Average = 4.0+ Ovesen et al., 1994; Bagh et
al., 2002 Hot water tank, apartment building,
Copenhagen, Denmark Range = 4.8 5.0 Bagh et al., 2003
Michigan freshwater lakes (bulk water) Average = 3.5 Jones et al., 1991 16 community taps and 5 industrial
process water basins Range = 2.7 6.0 Jousimies-Somer et al., 1993
Cooling tower water (basins) Range = 3.0 7.0 Bentham, R.H., 1993 Drinking water distribution systems,
Durham and Raleigh, NC Range = <-1.0 4.0+ Zhang & DiGiano, 2002
Drinking water distribution systems, Irvine and Garden Grove, CA Range = <2.0 3.4+ Ridgway & Olson, 1982
ASHRAE Project 1361-RP cooling tower make-up water
Range = 2.3 5.6 Average = 4.4

ASHRAE 1361-‐RP 48 Final Technical Report
3.2 T1 (CONTROL) CONDITIONS
Because the T1 (Control) tower was operated under similar conditions during all device trials
except for PEFD Trial 2/2, the data collected from T1 (Control) during each individual device
trial may be consolidated and analyzed in order to determine whether or not operating conditions
were comparable between the trial. Complete data collected throughout the T1 (Control) tests
are shown in Appendix B.2.
3.2.1 T1 (Control) System Operation
Average values for all of the experiments with T1 (Control) are shown in Table 7. The target
temperature differential throughout the investigation was 10 °F, while a temperature differential
of approximately 9-13 °F was maintained for all NCD tests. The only exception was the test
conducted with the MD, where operational problems with the heating unit in T1 (Control)
resulted in a slightly larger temperature differential.
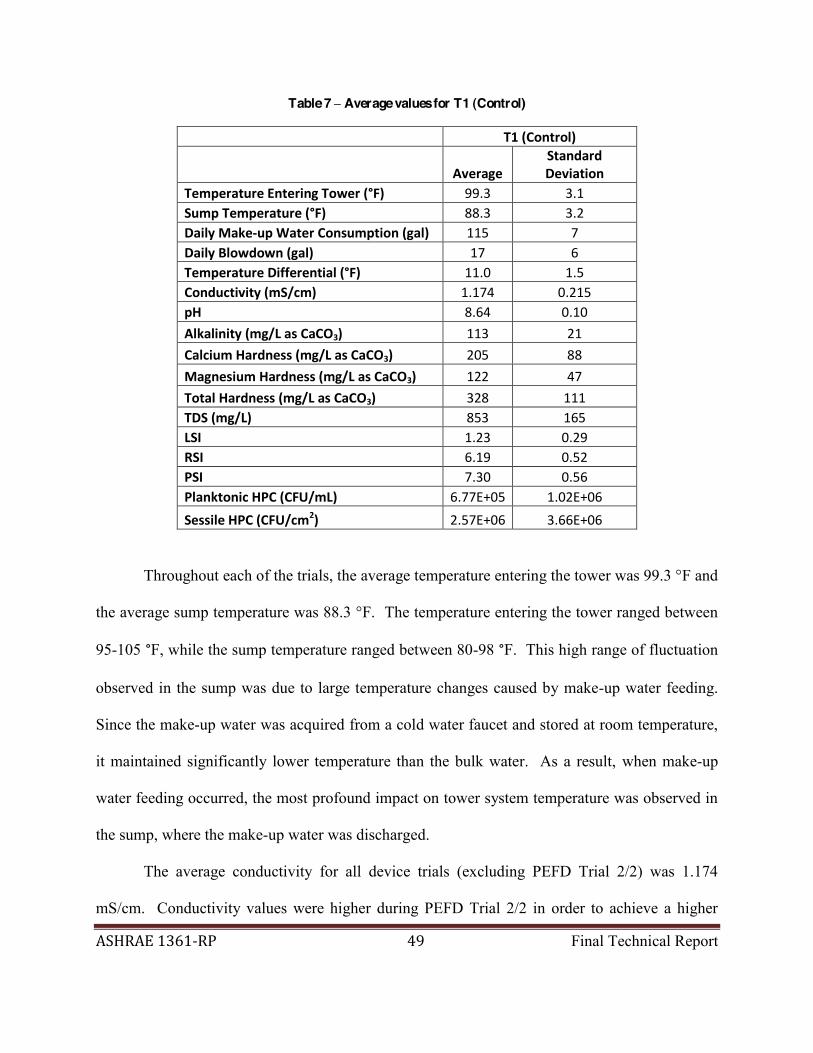
ASHRAE 1361-‐RP 49 Final Technical Report
Table 7 Average values for T1 (Control)
T1 (Control)
Average Standard Deviation
Temperature Entering Tower (°F) 99.3 3.1 Sump Temperature (°F) 88.3 3.2 Daily Make-‐up Water Consumption (gal) 115 7 Daily Blowdown (gal) 17 6 Temperature Differential (°F) 11.0 1.5 Conductivity (mS/cm) 1.174 0.215 pH 8.64 0.10
Alkalinity (mg/L as CaCO3) 113 21
Calcium Hardness (mg/L as CaCO3) 205 88
Magnesium Hardness (mg/L as CaCO3) 122 47
Total Hardness (mg/L as CaCO3) 328 111 TDS (mg/L) 853 165 LSI 1.23 0.29 RSI 6.19 0.52 PSI 7.30 0.56 Planktonic HPC (CFU/mL) 6.77E+05 1.02E+06
Sessile HPC (CFU/cm2) 2.57E+06 3.66E+06
Throughout each of the trials, the average temperature entering the tower was 99.3 °F and
the average sump temperature was 88.3 °F. The temperature entering the tower ranged between
95-105 °F, while the sump temperature ranged between 80-98 °F. This high range of fluctuation
observed in the sump was due to large temperature changes caused by make-up water feeding.
Since the make-up water was acquired from a cold water faucet and stored at room temperature,
it maintained significantly lower temperature than the bulk water. As a result, when make-up
water feeding occurred, the most profound impact on tower system temperature was observed in
the sump, where the make-up water was discharged.
The average conductivity for all device trials (excluding PEFD Trial 2/2) was 1.174
mS/cm. Conductivity values were higher during PEFD Trial 2/2 in order to achieve a higher

ASHRAE 1361-‐RP 50 Final Technical Report
cycles of concentration. The average pH throughout the entire investigation was 8.64, with T1
(Control) maintaining an equilibrium pH in the range of 8.40 8.80.
The average alkalinity and hardness in T1 (Control) were 113 and 328 mg/L as CaCO3,
respectively. The average LSI for T1 (Control) was 1.23, indicating that conditions were
strongly scale forming. The average RSI was 6.19, indicating stable conditions in T1 (Control),
while the average PSI was 7.30, indicating moderate scale-forming conditions. A combined
analysis of these three indices indicates that conditions in T1 (Control) were mildly to
moderately scale-forming for the duration of the investigation.
3.2.2 Biological Parameters
The average planktonic microbial population (enumerated by heterotrophic plate count using a
pour plate method) for each device trial is shown in Figure 11. Throughout each device trial, a
planktonic population of between 105 106 CFU/mL was maintained in the control tower, with
the HCD trial generating average microbial counts slightly lower than 105 CFU/mL. The
average planktonic heterotrophic plate count over the course of the six device trials was 677,000
CFU/mL, fulfilling the goal outlined in the original scope of work of maintaining a control
microbial population on the order of magnitude of 105 CFU/mL. Figure 12 depicts variations in
planktonic HPC throughout each NCD trial. Since the project scope of work target of 105
CFU/mL in the control tower was achieved, no additional microbial seeding of the make-up
water was employed for any of the device trials or chlorination tests.

ASHRAE 1361-‐RP 51 Final Technical Report
Figure 11 T1 (Control) average planktonic microbial populations for each device trial
Figure 12 T1 (Control) planktonic microbial population (HPC) for each device trial
1.00E+02
1.00E+03
1.00E+04
1.00E+05
1.00E+06
1.00E+07
MD
HPC
(CFU
/mL)
T1 (Control) Average Planktonic Microbial Populations
Make-‐Up
T1 (Control)
PEFD (1/2) PEFD (2/2) ED UD HCD
1.E+02
1.E+03
1.E+04
1.E+05
1.E+06
1.E+07
1.E+08
1.E+09
0 5 10 15 20 25 30 35 40
HPC
(CFU
/mL)
Days Elapsed
T1 (Control) Planktonic Microbial Population
MD
PEFD Test 1/2
PEFD Test 2/2
ED
UD
HCD
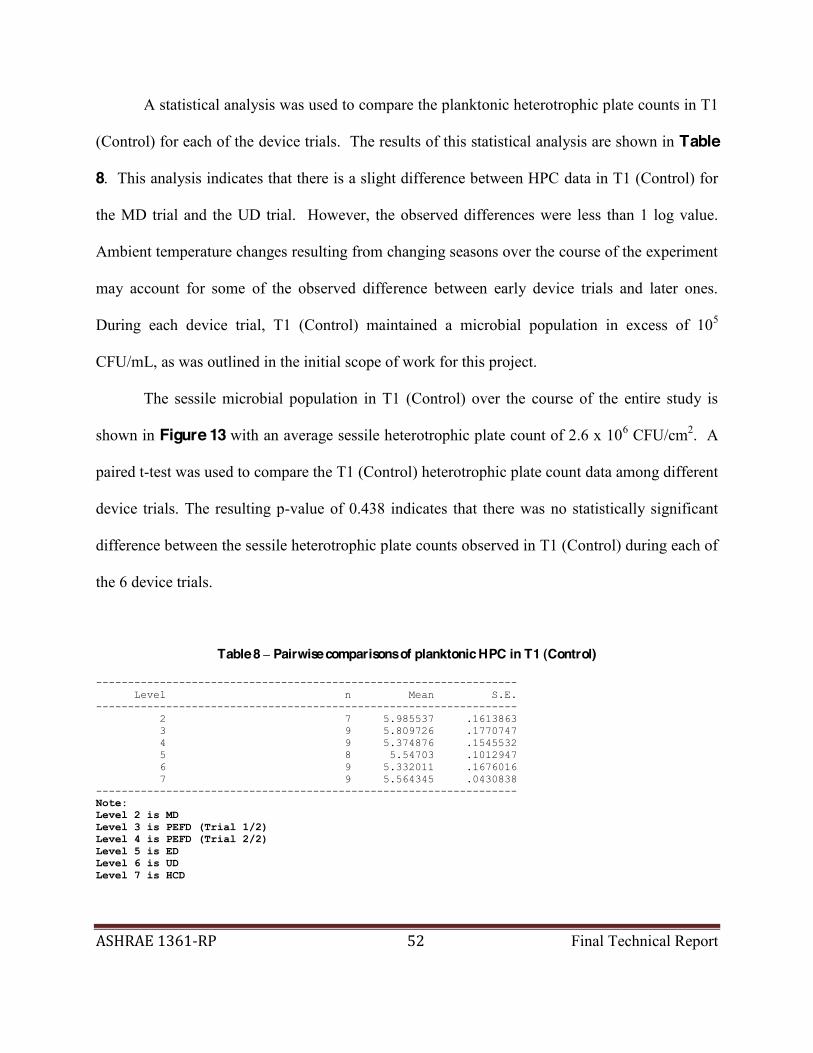
ASHRAE 1361-‐RP 52 Final Technical Report
A statistical analysis was used to compare the planktonic heterotrophic plate counts in T1
(Control) for each of the device trials. The results of this statistical analysis are shown in Table
8. This analysis indicates that there is a slight difference between HPC data in T1 (Control) for
the MD trial and the UD trial. However, the observed differences were less than 1 log value.
Ambient temperature changes resulting from changing seasons over the course of the experiment
may account for some of the observed difference between early device trials and later ones.
During each device trial, T1 (Control) maintained a microbial population in excess of 105
CFU/mL, as was outlined in the initial scope of work for this project.
The sessile microbial population in T1 (Control) over the course of the entire study is
shown in Figure 13 with an average sessile heterotrophic plate count of 2.6 x 10⁶ CFU/cm2. A
paired t-test was used to compare the T1 (Control) heterotrophic plate count data among different
device trials. The resulting p-value of 0.438 indicates that there was no statistically significant
difference between the sessile heterotrophic plate counts observed in T1 (Control) during each of
the 6 device trials.
Table 8 Pairwise comparisons of planktonic HPC in T1 (Control)
------------------------------------------------------------------ Level n Mean S.E. ------------------------------------------------------------------ 2 7 5.985537 .1613863 3 9 5.809726 .1770747 4 9 5.374876 .1545532 5 8 5.54703 .1012947 6 9 5.332011 .1676016 7 9 5.564345 .0430838 ------------------------------------------------------------------ Note: Level 2 is MD Level 3 is PEFD (Trial 1/2) Level 4 is PEFD (Trial 2/2) Level 5 is ED Level 6 is UD Level 7 is HCD

ASHRAE 1361-‐RP 53 Final Technical Report
Figure 13 T1 (Control) combined sessile microbial population
3.2.3 Summary
Conditions in T1 (Control) were approximately the same for each of the six device trials.
Temperature fluctuations were the result of changes in the ambient outdoor temperature over the
course of the investigation. Fluctuations in chemical parameters, such as conductivity, pH, and
alkalinity, were the result of changes in make-up water quality. Total hardness data showed the
largest fluctuation over the course of the investigation, which was significantly reduced by the
preparation of new standards for hardness measurements. Scaling index calculations indicate
1.E+02
1.E+03
1.E+04
1.E+05
1.E+06
1.E+07
1.E+08
3/20 4/17 5/15 6/12 7/10 8/7 9/4 10/2 10/30
Heterotroph
ic Plate Cou
nt (C
FU/cm
2)
Date
T1 (Control) Sessile Microbial Population

ASHRAE 1361-‐RP 54 Final Technical Report
that mild to moderate scaling potential was maintained in T1 (Control) throughout the
investigation. Planktonic microbial populations above 105 CFU/mL and sessile microbial
populations above 106 CFU/cm2 were maintained in T1 (Control) over the course of each device
trial.
Another very important measure of reproducibility that was achieved in this study is
discussed in Section 4.7, where the results of three separate chlorination tests are presented. It is
important to note that the chlorination tests demonstrated not only the reproducibility of the
experimental investigations conducted in this study but also the effectiveness of a conventional
chemical biofouling control approach for pilot-scale cooling systems.

ASHRAE 1361-‐RP 55 Final Technical Report
4.0 DEVICE TRIAL RESULTS AND DISCUSSION
The following section provides the results from each individual device trial. These include
operational, chemical, and biological parameters. Biological data are provided in the following
sections, while chemical and operational data are provided in the corresponding appendices.
4.1 MAGNETIC DEVICE (MD) TRIAL
The investigation of the magnetic device began on 3/13/09 and lasted until 4/20/09. The heating
systems in T1 (Control) and T2 (Device) had to be rewired on 3/29/09 due to electrical problems.
Additionally, a solenoid valve malfunction led to a pause in the operation of T1 (Control) from 4/11
4/15. Data collected during the test with magnetic device are shown in Appendix C. Operational and
chemical data for the make-up water and each of the two system towers are included in Appendix
C.1. Statistical analyses of the chemical and water consumption data collected during this
investigation are shown in Appendix C.2. This analysis contains data from an earlier trial run which
was terminated due to operational problems. Photographs of each of the tower systems before and
after the test of the magnetic device are shown in Appendix C.3.
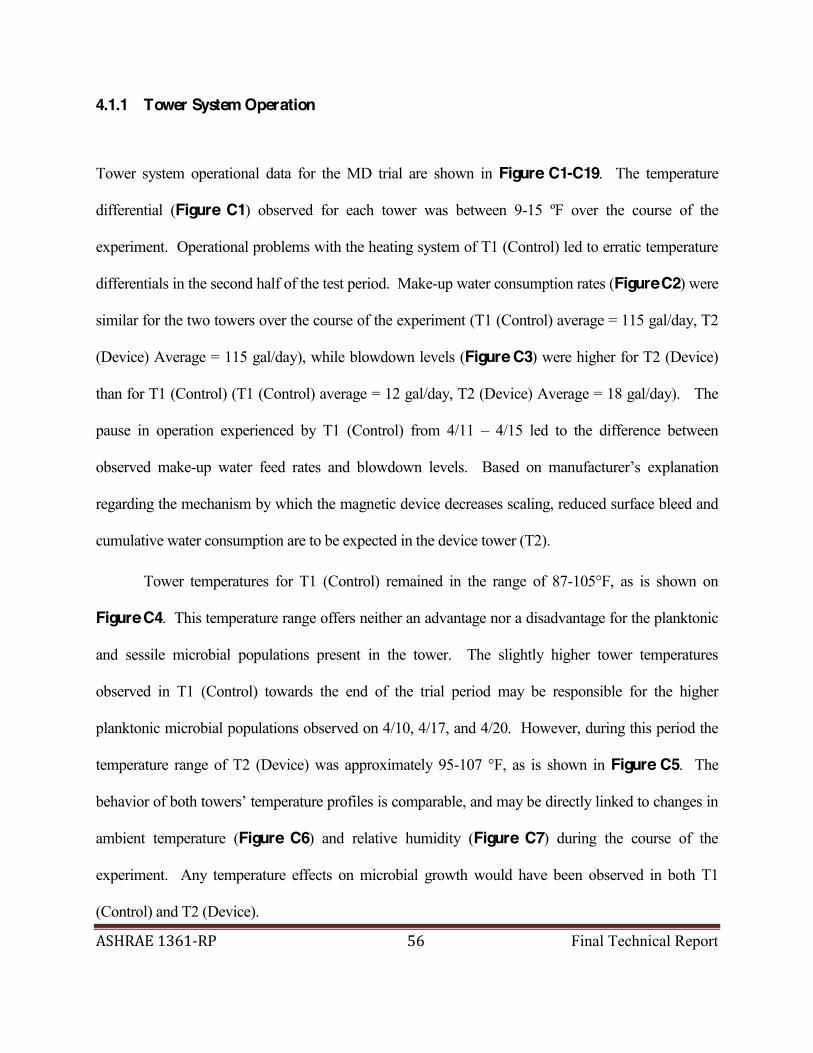
ASHRAE 1361-‐RP 56 Final Technical Report
4.1.1 Tower System Operation
Tower system operational data for the MD trial are shown in Figure C1-C19. The temperature
differential (Figure C1) observed for each tower was between 9-15 ºF over the course of the
experiment. Operational problems with the heating system of T1 (Control) led to erratic temperature
differentials in the second half of the test period. Make-up water consumption rates (Figure C2) were
similar for the two towers over the course of the experiment (T1 (Control) average = 115 gal/day, T2
(Device) Average = 115 gal/day), while blowdown levels (Figure C3) were higher for T2 (Device)
than for T1 (Control) (T1 (Control) average = 12 gal/day, T2 (Device) Average = 18 gal/day). The
pause in operation experienced by T1 (Control) from 4/11 4/15 led to the difference between
observed make-up water feed rates and blowdown levels. Based on manufacturer
regarding the mechanism by which the magnetic device decreases scaling, reduced surface bleed and
cumulative water consumption are to be expected in the device tower (T2).
Tower temperatures for T1 (Control) remained in the range of 87-105°F, as is shown on
Figure C4. This temperature range offers neither an advantage nor a disadvantage for the planktonic
and sessile microbial populations present in the tower. The slightly higher tower temperatures
observed in T1 (Control) towards the end of the trial period may be responsible for the higher
planktonic microbial populations observed on 4/10, 4/17, and 4/20. However, during this period the
temperature range of T2 (Device) was approximately 95-107 °F, as is shown in Figure C5. The
temperature profiles is comparable, and may be directly linked to changes in
ambient temperature (Figure C6) and relative humidity (Figure C7) during the course of the
experiment. Any temperature effects on microbial growth would have been observed in both T1
(Control) and T2 (Device).

ASHRAE 1361-‐RP 57 Final Technical Report
Average values and standard deviations for all parameters measured during this investigation
are presented in Table 9. Additional chemical data collected during this investigation are shown in
Figure C8 Figure C16. The fluctuations in these measurements during the beginning portion of the
experiment, as well as following periods of non-operation, indicate that several days of tower
operation are required in order to achieve steady state operation. Conductivity measurements were
somewhat erratic during the experiment, as can be seen in Figure C8. The blowdown controllers
were reset at various times throughout the course of the experiment to achieve approximately 4-5
cycles of concentration. However, improper calibration of the conductivity data collection probes
may have resulted in the collection of seemingly disparate data.
Table 9 Average values for MD trial
T1 (Control) T2 (Device)
Average Standard Deviation Average Standard Deviation
Temperature Entering Tower (°F) 93.4 5.5 97.9 3.4 Sump Temperature (ºF) 85.0 3.7 84.9 3.1 Daily Make-up Water Consumption (gal) 113 36 115 27 Daily Blowdown (gal) 12 8 18 9 Conductivity (mS/cm) 0.867 0.155 0.819 0.146 pH 8.56 0.08 8.61 0.10 ORP (mV) 257 22 258 36 Alkalinity (mg/L as CaCO3) 134 13 133 16 Calcium Hardness (mg/L as CaCO3) 230 183 257 158
Magnesium Hardness (mg/L as CaCO3) 67 25 78 14 Total Hardness (mg/L as CaCO3) 300 189 349 159 TDS (mg/L) 632 179 672 144 LSI 1.12 0.44 1.19 0.46 RSI 6.31 0.81 6.19 0.84 PSI 7.17 0.76 6.86 0.76 Planktonic HPC (CFU/mL) 1.60E+06 1.42E+06 6.79E+05 6.79E+05 ATP Microbial Equivalents (MEQs/mL) 1.02E+06 1.06E+06 1.02E+06 5.94E+05
Sessile HPC (CFU/cm2) 1.21E+06 1.17E+06 2.68E+06 1.53E+06
ASHRAE 1361-‐RP 58 Final Technical Report
Chloride measurements for each tower are shown in Table C1, and these measurements
indicate that the cycles of concentration for this run were slightly higher than 5 for each of the towers.
Somewhat erratic results for some of the chemical parameters measured towards the end of the
experimental run may be the result of the fact that sampling was performed at different times before
and after make-up water addition and blowdown, which provided different dilution factors.
Using the chemical data collected during this investigation, three scaling indices were
calculated for each of the towers. Both towers produced comparable values for each of the
scaling indices analyzed. The Langelier Saturation Index value observed was approximately
1.12 for T1 (Control) and 1.19 for T2 (Device) (Figure C17), indicating that the water in each
tower had strong scaling potential. The Ryznar Stability Index value observed was
approximately 6.31 for T1 (Control) and 6.19 for T2 (Device) (Figure C18), indicating that T1
(Control) had a slight tendency to dissolve scale, while T2 (Device) was neutral with regards to
scale formation. The average Puckorius Scaling Index value observed for T1 (Control) was 7.17,
and for T2 (Device) it was 6.86 (Figure C19), indicating that the water in each tower had high
scale-dissolving potential. Based on a comparison of the observed values of these three indices,
it may be concluded that the water in each tower maintained comparable moderate scaling
potential over the course of the experiment.
4.1.2 Biological Parameters
Analysis of the biological data collected during the second evaluation of the magnetic device indicates
that the magnetic device offers little to no control of planktonic and sessile microbial populations.

ASHRAE 1361-‐RP 59 Final Technical Report
Observations of the biological population present in each tower (Figure 14 - Figure 16) indicate that
each tower contained comparable levels of microbial activity both in the bulk water and in the system
biofilms throughout the course of the experiment. No planktonic biological sample was taken from
T1 on 4/6 since the tower was not operational.
The planktonic heterotrophic plate counts observed in each of the tower systems throughout
the MD trial are shown in Figure 14. This figure reveals that the heterotrophic plate count in T1
(Control) was higher than that of T2 (Device) on 7 out of the 10 days for which data are available for
both tower systems. However, there was less than 1 log value difference on each of these 7 days. A
statistical analysis of the heterotrophic plate count data is shown in Table 10, and this analysis
indicates that the observed difference between the plate counts for T1 (Control) and T2 (Device) was
not statistically significant. At no point during the device trial did T2 (Device) maintain a microbial
population below the industry standard of 104 CFU/mL.
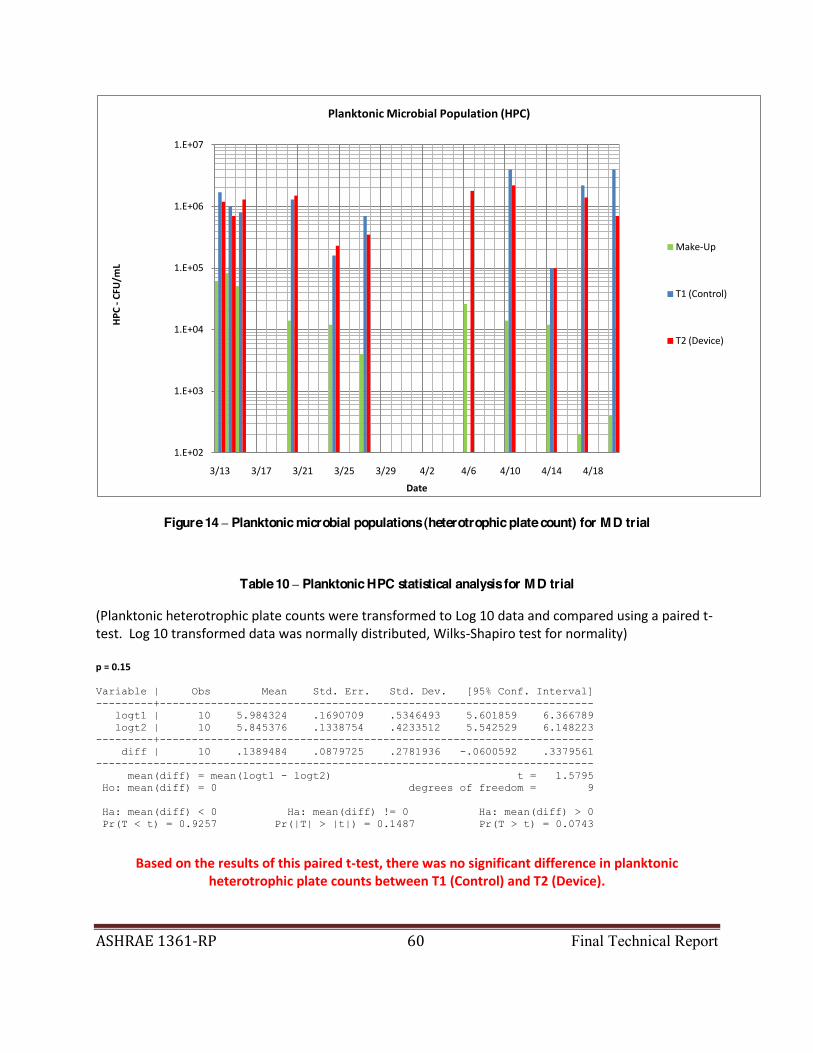
ASHRAE 1361-‐RP 60 Final Technical Report
Figure 14 Planktonic microbial populations (heterotrophic plate count) for MD trial
Table 10 Planktonic HPC statistical analysis for MD trial
(Planktonic heterotrophic plate counts were transformed to Log 10 data and compared using a paired t-‐test. Log 10 transformed data was normally distributed, Wilks-‐Shapiro test for normality) p = 0.15 Variable | Obs Mean Std. Err. Std. Dev. [95% Conf. Interval] ---------+-------------------------------------------------------------------- logt1 | 10 5.984324 .1690709 .5346493 5.601859 6.366789 logt2 | 10 5.845376 .1338754 .4233512 5.542529 6.148223 ---------+-------------------------------------------------------------------- diff | 10 .1389484 .0879725 .2781936 -.0600592 .3379561 ------------------------------------------------------------------------------ mean(diff) = mean(logt1 - logt2) t = 1.5795 Ho: mean(diff) = 0 degrees of freedom = 9 Ha: mean(diff) < 0 Ha: mean(diff) != 0 Ha: mean(diff) > 0 Pr(T < t) = 0.9257 Pr(|T| > |t|) = 0.1487 Pr(T > t) = 0.0743
Based on the results of this paired t-‐test, there was no significant difference in planktonic heterotrophic plate counts between T1 (Control) and T2 (Device).
1.E+02
1.E+03
1.E+04
1.E+05
1.E+06
1.E+07
3/13 3/17 3/21 3/25 3/29 4/2 4/6 4/10 4/14 4/18
HPC
-‐CFU/m
L
Date
Planktonic Microbial Population (HPC)
Make-‐Up
T1 (Control)
T2 (Device)
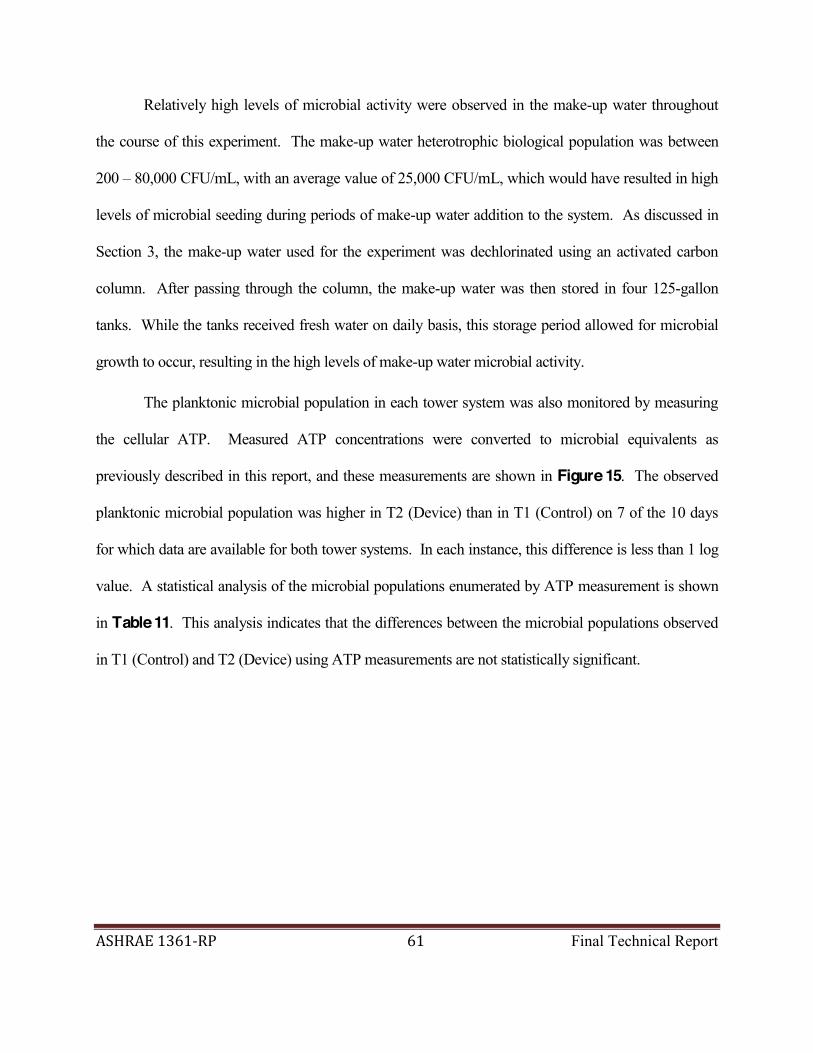
ASHRAE 1361-‐RP 61 Final Technical Report
Relatively high levels of microbial activity were observed in the make-up water throughout
the course of this experiment. The make-up water heterotrophic biological population was between
200 80,000 CFU/mL, with an average value of 25,000 CFU/mL, which would have resulted in high
levels of microbial seeding during periods of make-up water addition to the system. As discussed in
Section 3, the make-up water used for the experiment was dechlorinated using an activated carbon
column. After passing through the column, the make-up water was then stored in four 125-gallon
tanks. While the tanks received fresh water on daily basis, this storage period allowed for microbial
growth to occur, resulting in the high levels of make-up water microbial activity.
The planktonic microbial population in each tower system was also monitored by measuring
the cellular ATP. Measured ATP concentrations were converted to microbial equivalents as
previously described in this report, and these measurements are shown in Figure 15. The observed
planktonic microbial population was higher in T2 (Device) than in T1 (Control) on 7 of the 10 days
for which data are available for both tower systems. In each instance, this difference is less than 1 log
value. A statistical analysis of the microbial populations enumerated by ATP measurement is shown
in Table 11. This analysis indicates that the differences between the microbial populations observed
in T1 (Control) and T2 (Device) using ATP measurements are not statistically significant.
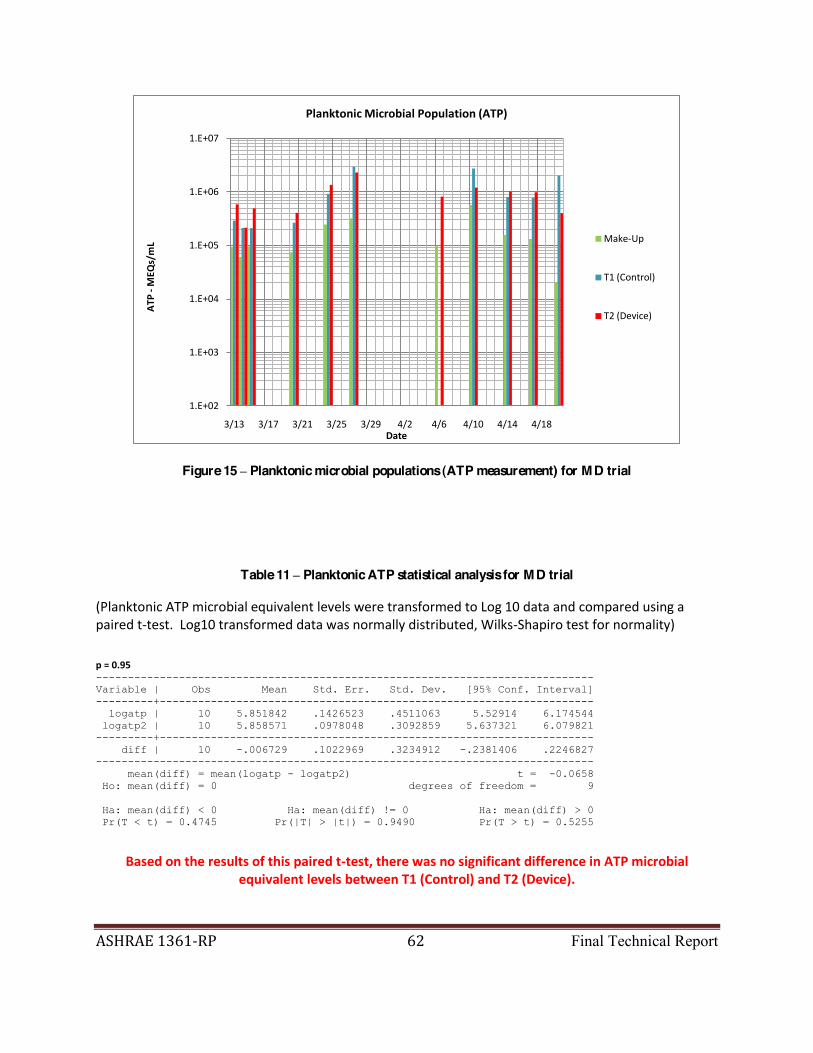
ASHRAE 1361-‐RP 62 Final Technical Report
Figure 15 Planktonic microbial populations (ATP measurement) for MD trial
Table 11 Planktonic ATP statistical analysis for MD trial
(Planktonic ATP microbial equivalent levels were transformed to Log 10 data and compared using a paired t-‐test. Log10 transformed data was normally distributed, Wilks-‐Shapiro test for normality) p = 0.95 ------------------------------------------------------------------------------ Variable | Obs Mean Std. Err. Std. Dev. [95% Conf. Interval] ---------+-------------------------------------------------------------------- logatp | 10 5.851842 .1426523 .4511063 5.52914 6.174544 logatp2 | 10 5.858571 .0978048 .3092859 5.637321 6.079821 ---------+-------------------------------------------------------------------- diff | 10 -.006729 .1022969 .3234912 -.2381406 .2246827 ------------------------------------------------------------------------------ mean(diff) = mean(logatp - logatp2) t = -0.0658 Ho: mean(diff) = 0 degrees of freedom = 9 Ha: mean(diff) < 0 Ha: mean(diff) != 0 Ha: mean(diff) > 0 Pr(T < t) = 0.4745 Pr(|T| > |t|) = 0.9490 Pr(T > t) = 0.5255
Based on the results of this paired t-‐test, there was no significant difference in ATP microbial equivalent levels between T1 (Control) and T2 (Device).
1.E+02
1.E+03
1.E+04
1.E+05
1.E+06
1.E+07
3/13 3/17 3/21 3/25 3/29 4/2 4/6 4/10 4/14 4/18
ATP
-‐MEQ
s/mL
Date
Planktonic Microbial Population (ATP)
Make-‐Up
T1 (Control)
T2 (Device)
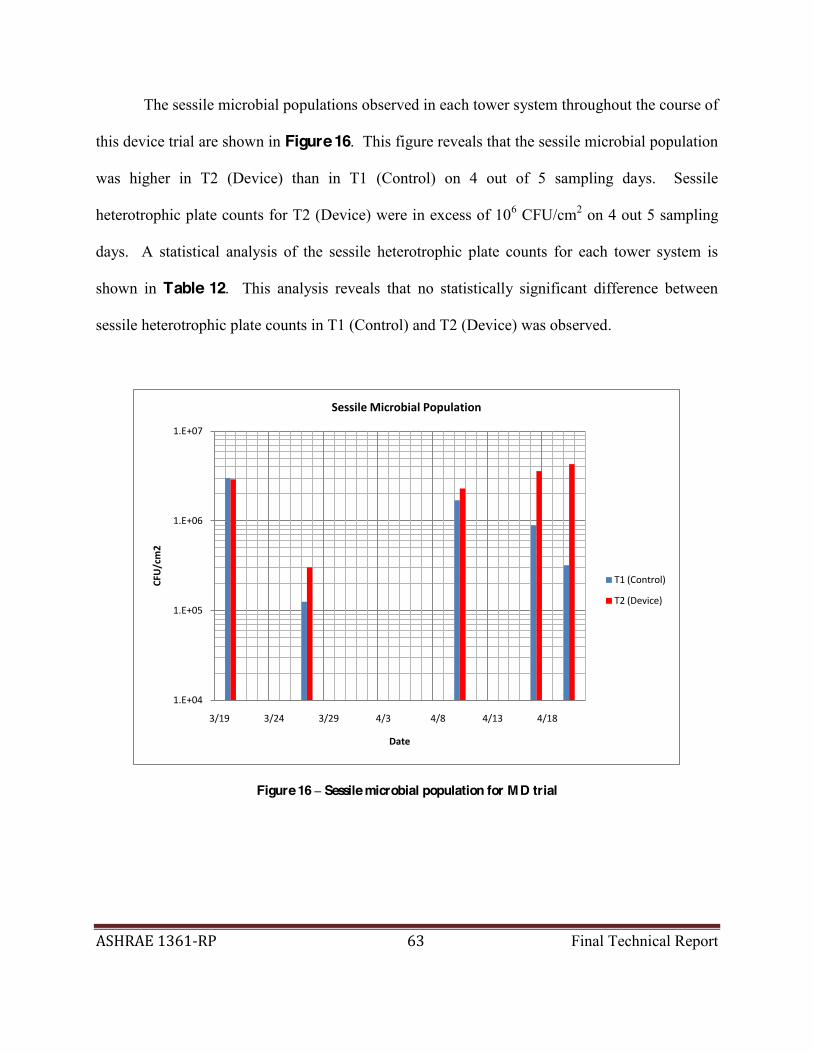
ASHRAE 1361-‐RP 63 Final Technical Report
The sessile microbial populations observed in each tower system throughout the course of
this device trial are shown in Figure 16. This figure reveals that the sessile microbial population
was higher in T2 (Device) than in T1 (Control) on 4 out of 5 sampling days. Sessile
heterotrophic plate counts for T2 (Device) were in excess of 106 CFU/cm2 on 4 out 5 sampling
days. A statistical analysis of the sessile heterotrophic plate counts for each tower system is
shown in Table 12. This analysis reveals that no statistically significant difference between
sessile heterotrophic plate counts in T1 (Control) and T2 (Device) was observed.
Figure 16 Sessile microbial population for MD trial
1.E+04
1.E+05
1.E+06
1.E+07
3/19 3/24 3/29 4/3 4/8 4/13 4/18
CFU/cm2
Date
Sessile Microbial Population
T1 (Control)
T2 (Device)
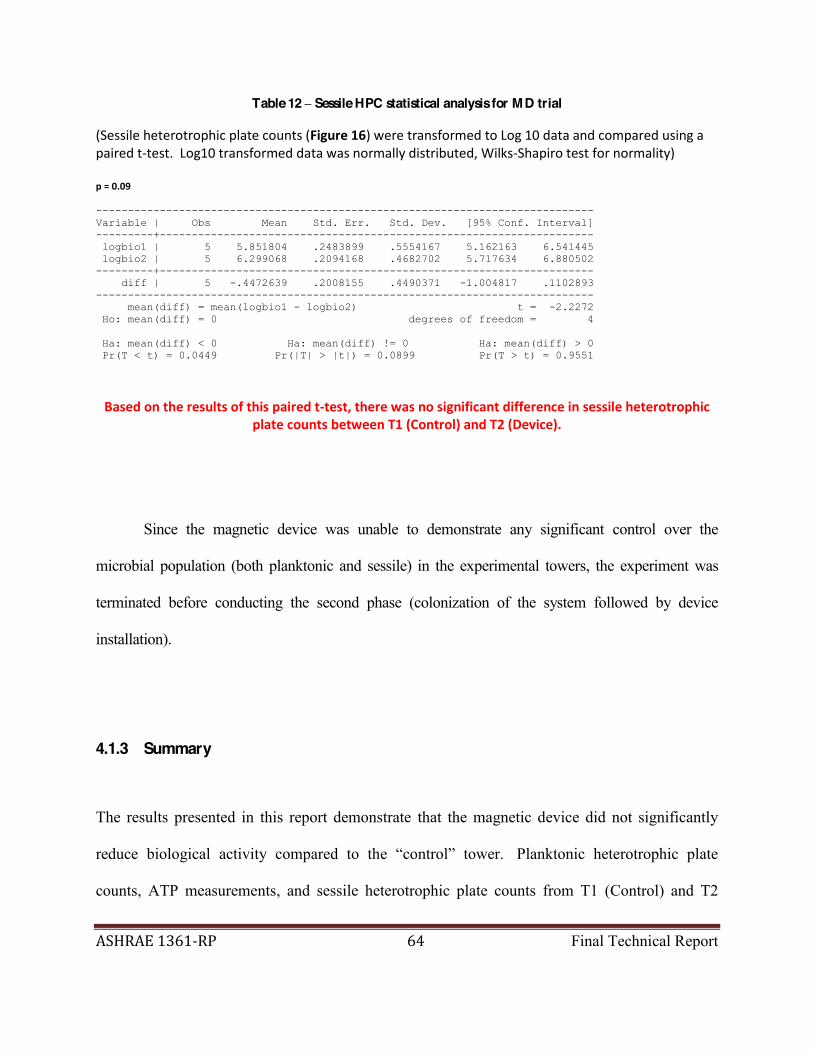
ASHRAE 1361-‐RP 64 Final Technical Report
Table 12 Sessile HPC statistical analysis for MD trial
(Sessile heterotrophic plate counts (Figure 16) were transformed to Log 10 data and compared using a paired t-‐test. Log10 transformed data was normally distributed, Wilks-‐Shapiro test for normality) p = 0.09 ------------------------------------------------------------------------------ Variable | Obs Mean Std. Err. Std. Dev. [95% Conf. Interval] ---------+-------------------------------------------------------------------- logbio1 | 5 5.851804 .2483899 .5554167 5.162163 6.541445 logbio2 | 5 6.299068 .2094168 .4682702 5.717634 6.880502 ---------+-------------------------------------------------------------------- diff | 5 -.4472639 .2008155 .4490371 -1.004817 .1102893 ------------------------------------------------------------------------------ mean(diff) = mean(logbio1 - logbio2) t = -2.2272 Ho: mean(diff) = 0 degrees of freedom = 4 Ha: mean(diff) < 0 Ha: mean(diff) != 0 Ha: mean(diff) > 0 Pr(T < t) = 0.0449 Pr(|T| > |t|) = 0.0899 Pr(T > t) = 0.9551
Based on the results of this paired t-‐test, there was no significant difference in sessile heterotrophic plate counts between T1 (Control) and T2 (Device).
Since the magnetic device was unable to demonstrate any significant control over the
microbial population (both planktonic and sessile) in the experimental towers, the experiment was
terminated before conducting the second phase (colonization of the system followed by device
installation).
4.1.3 Summary
The results presented in this report demonstrate that the magnetic device did not significantly
Planktonic heterotrophic plate
counts, ATP measurements, and sessile heterotrophic plate counts from T1 (Control) and T2

ASHRAE 1361-‐RP 65 Final Technical Report
(Device) showed no significant differences at any point during the investigation. Tower
operational conditions were comparable throughout the course of the device trial

ASHRAE 1361-‐RP 66 Final Technical Report
4.2 PULSED ELECTRIC FIELD DEVICE (PEFD) TRIAL 1/2
The first investigation of the PEFD began on 5/2/09 and it continued uninterrupted until 5/30/09. Data
collected during this investigation are included in Appendix D. Operational data collected during this
investigation are shown in Appendix D.1. Statistical analyses of the chemical data analyzed during
the investigation are shown in Appendix D.2. Photographs of the system before and after the test are
shown in Appendix D.3.
4.2.1 Tower System Operation
Tower system operational data for this device trial are shown in Figure D1 Figure D19 . A
temperature differential of approximately 9-13 °F was maintained for each tower throughout the
majority of the investigation (Figure D1). Since temperature differential calculations were
determined using manual temperature readings, it is likely that the low observed temperature
differentials (< 10 °F) were the result of measurements being taken soon after the towers received
make-up water. Receiving make-up water cools down the sump temperature significantly, and this
may have led to the low measured temperature differentials. The quantity of make-up water
consumed by each tower throughout the course of the investigation was approximately the same
(Figure D2). T1 (Control) exhibited higher blowdown volumes initially (Figure D3), and T2
(Device) gradually approached the blowdown rate exhibited by Tower 1 as the experiment progressed.
Tower temperature profiles are shown in Figure D4 (T1) and Figure D5 (T2), with fluctuations
occurring as a result of changing ambient conditions such as temperature (Figure D6) and relative
humidity (Figure D7).

ASHRAE 1361-‐RP 67 Final Technical Report
Average values and standard deviations for all parameters measured during this investigation
are shown in Table 13. Chemical data collected during the course of this experiment are shown in
Figure D8 Figure D16. Continuous conductivity data collected during the investigation are shown
in Figure D8. The conductivity observed in T1 (Control) was slightly higher than that observed in T2
(Device) for the duration of the experiment. Although both blowdown controllers were set at identical
values (1.20 mS/cm), the blowdown controller for T2 (Device) was not functioning properly. As a
result, the conductivity levels which triggered blowdown in T2 (Device) were lower than the setpoint,
resulting in a lower overall conductivity. This trend may also be observed with the continuous pH
monitoring of the systems (Figure D9). Make-up water conductivity ranged from 0.284 0.312
mS/cm, while the make-up water pH ranged from 6.82 7.53 (Figure D11).
Table 13 Average values for PEFD (Trial 1/2)
T1 (Control) T2 (Device) Average Standard Deviation Average Standard Deviation Temperature Entering Tower (°F) 102.0 2.1 100.7 3.8 Sump Temperature (°F) 90.7 2.4 88.9 3.5 Daily Make-up Water Consumption (gal) 111 24 109 28 Daily Blowdown (gal) 20 10 15 8 Conductivity (mS/cm) 1.057 0.045 0.948 0.038 pH 8.61 0.09 8.45 0.04 ORP (mV) 228 12 197 64 Alkalinity (mg/L as CaCO3) 132 10 117 10 Calcium Hardness (mg/L as CaCO3) 266 43 250 36
Magnesium Hardness (mg/L as CaCO3) 206 27 185 21 Total Hardness (mg/L as CaCO3) 472 65 436 52 TDS (mg/L) 980 74 934 64 LSI 1.42 0.15 1.18 0.10 RSI 5.71 0.05 6.09 0.19 PSI 6.70 0.16 6.94 0.17 Planktonic HPC (CFU/mL) 1.23E+06 1.54E+06 5.50E+05 4.63E+05 ATP Microbial Equivalents (MEQs/mL) 9.98E+05 6.92E+05 9.65E+05 4.49E+05
Sessile HPC (CFU/cm2) 3.19E+06 3.91E+06 1.95E+06 1.78E+06

ASHRAE 1361-‐RP 68 Final Technical Report
Chloride measurements for each tower are shown in Table D1, and these measurements
indicate that T1 (Control) was operating at near 6.5 cycles of concentration, while T2 (Device) was
operating at near 6 cycles of concentration. These values are higher than the target cycles of
concentration (4-5), which is most likely due to the erratic nature of the make-up conductivity and the
collection of solids on the conductivity probes which are used to control blowdown.
The chemical parameters measured during this investigation were used to calculate 3 scaling
indices commonly used in the water treatment industry: The Langelier Saturation Index (LSI), the
Ryznar Stability Index (RSI), and the Puckorius Scaling Index (PSI). At equilibrium, T1 (Control)
had an average LSI value of approximately 1.42, while T2 (Device) had an LSI value of 1.18 (Figure
D17). These values suggest that the water in each tower system had strong scaling potential. The RSI
values for T1 (Control) and T2 (Device) at equilibrium were 5.71 and 6.09, respectively, indicating
that T1 (Control) had slight scale formation potential and T2 (Device) was neutral with regards to
scaling potential (Figure D18). The equilibrium PSI values for T1 (Control) and T2 (Device) were
6.70 and 6.94, respectively, also indicating moderate scale-dissolving potential (Figure D19). A
combined analysis of each of these scaling indices indicates that the towers were operating under very
similar conditions.
4.2.2 Biological Parameters
Biological data collected during this investigation are shown in Figure 17 Figure 19. Analysis of
this data indicates that the device did not exhibit any significant biocidal effects. No significant
reduction in planktonic or sessile microbial activity was observed in T2 (Device). Biological data

ASHRAE 1361-‐RP 69 Final Technical Report
collected during this device trial were combined with data from PEFD Trial 2/2, and the statistical
analyses performed using this combined data are discussed in Section 4.3.2.
Heterotrophic plate counts for each of the towers systems were measured throughout the
course of the device trial, and these measurements are shown in Figure 17. Although T2 (Device)
demonstrated lower planktonic heterotrophic plate count values on 7 out of 9 of the biological
sampling days, the observed differences between the plate counts from T1 (Control) and T2 (Device)
were less than 1 log value. On each sampling day, the microbial population in T2 (Device) was higher
than the industry standard of 104 CFU/mL.
Figure 17 Planktonic microbial populations (HPC) for PEFD (Trial 1/2)
1.E+02
1.E+03
1.E+04
1.E+05
1.E+06
1.E+07
5/2 5/6 5/10 5/14 5/18 5/22 5/26 5/30
HPC
-‐CFU/m
L
Date
Planktonic Micobial Population (HPC)
Make-‐Up
T1 (Control)
T2 (Device)

ASHRAE 1361-‐RP 70 Final Technical Report
Microbial populations were also enumerated using measurement of cellular ATP, and the
results of these measurements are shown in Figure 18. ATP concentrations were converted to
microbial equivalents according to the equation previously discussed in this report. Microbial
equivalent levels were comparable in each tower system throughout the device trial.
Figure 18 Planktonic microbial population (ATP measurement) for PEFD (Trial 1/2)
The sessile microbial populations for each tower system over the course of the device
trial are shown in Figure 19. Each tower system maintained a comparable level of sessile
microbial activity, and all measured heterotrophic plate counts were in excess of 105 CFU/cm2.
This indicates that the device did not have a significant effect on sessile microbial growth.
1.E+02
1.E+03
1.E+04
1.E+05
1.E+06
1.E+07
5/2 5/6 5/10 5/14 5/18 5/22 5/26 5/30
ATP
-‐MEQ
s/mL
Date
Planktonic Micobial Population (ATP)
Make-‐Up
T1 (Control)
T2 (Device)

ASHRAE 1361-‐RP 71 Final Technical Report
Figure 19 Sessile microbial population for PEFD (Trial 1/2)
The make-up water contained a heterotrophic biological population between 1,000 440,000
CFU/mL during this device trial, with an average value of approximately 67,000 CFU/mL. One
sampling date (5/27/09) demonstrated a make-up water microbial population higher than that
observed in either of the two tower systems (440,000 CFU/mL). It is likely that this high microbial
count was the result of sample contamination since microbial equivalent levels measured using
cellular ATP were comparable on this sampling day to other values observed during this device trial.
Excluding this outlier, the make-up water contained an observed biological range of 1,000 59,000
CFU/mL and an average heterotrophic population of approximately 20,000 CFU/mL. Make-up water
biological growth was allowed to occur without any means of biocidal control. No artificial microbial
seeding was performed on the make-up water during this or any of the device trials.
1.E+03
1.E+04
1.E+05
1.E+06
1.E+07
5/9 5/14 5/19 5/24 5/29
HPC
(CFU
/cm2)
Date
Sessile Microbial Population
T1 (Control)
T2 (Device)

ASHRAE 1361-‐RP 72 Final Technical Report
Since no significant planktonic or sessile microbial control was observed in this test, Phase II
of the device trial (colonization of towers followed by device activation) was not performed.
However, an additional Phase I test was performed at a higher cycle of concentration to determine if
this would have an effect on biological control using the PEFD. The manufacturer
indicates that precipitation of scale helps to remove microorganisms from the system, which may not
have occurred to a significant extent during this trial due to the low value of cycles of concentration.
4.2.3 Summary
No biological control resulting from the installation of the PEFD was observed during this trial.
this could have been the result of insufficient cycles
of concentration employed in this test since the conductivity of the device tower was not as high
as is normally encountered in industrial cooling systems. Additional concerns regarding relative
humidity and temperature levels in the shower room containing the tower systems and the
consistency of the heating units were also addressed prior to the performance of this second
device trial. Flexible ducting was installed on the top of each tower system in order to funnel
tower exhaust air directly into the ventilation system. Additionally, the fan belt for the roof fan
controlling the shower room ventilation system was replaced. These modifications improved
ventilation in the shower room, minimizing air recirculation.

ASHRAE 1361-‐RP 73 Final Technical Report
4.3 PULSED ELECTRIC FIELD DEVICE (PEFD) TRIAL 2/2
The second investigation of the pulsed electric field device began on 6/12, and it was completed on
7/10. This investigation was performed to determine if higher scaling index would improve biological
control in the cooling tower. The primary parameter altered during the second investigation was the
blowdown conductivity setpoint. In the previous investigation of the pulsed electric field device, the
blowdown conductivity setpoint was chosen to establish a steady state of 4-5 cycles of concentration
which results in stable scale forming index. For the second pulsed electric field device investigation,
the set point was raised to establish a steady state of 6-7 cycles of concentration. The increased cycles
of concentration were verified by total dissolved solids, conductivity, and chloride measurements,
although calcium hardness and alkalinity of the make-up water decreased during this device trial in
comparison to PEFD Trial 1/2 (See Appendix B.1, Table B1).
An electrical failure caused T2 (Device) to go offline on 6/21. T2 (Device) went back online
on 6/23 following the installation of a new pump, and it remained online for the duration of the
investigation. All data collected during this investigation is included in Appendix E. Operational and
chemical data collected during this investigation are shown in Appendix E.1, and statistical analyses
of the data collected during both device trials (PEFD Trials 1/2 and 2/2) are shown in Appendix E.2.
Photographs of each tower system before and after the device trial are shown in Appendix E.3.
Photographs of the last two biofilm sampling coupons taken from each tower during this investigation
are shown in Appendix E.4.

ASHRAE 1361-‐RP 74 Final Technical Report
4.3.1 Tower System Operation
Tower operational data are shown in Figure E1 Figure E19. The temperature differentials for each
tower over the course of the device trial are shown in Figure E1, illustrating that a temperature
differential of 9-13°F was maintained in each tower throughout the investigation. The differential in
T1 (Control) was approximately 1°F lower than that observed in T2 (Device). Figure E2
demonstrates that make-up water consumption levels were comparable in T1 (Control) and T2
(Device) during this test, as indicated by the similar slopes of make-up consumption volume over
time. Figure E3 demonstrates that T1 (Control) and T2 (Device) maintained comparable cumulative
blowdown levels throughout the course of the experiment.
Observation of the temperature profiles for T1 (Control) (Figure E4) and T2 (Device) (Figure
E5) indicate that the two towers were operating under steady and consistent conditions for the
majority of the experimental run. Tower operation was halted on 6/22 6/23 for T2 (Device) due to
operational failure. Fluctuations in the temperature profiles of each tower are the result of changes in
ambient conditions such as temperature (Figure E6) and relative humidity (Figure E7). Ambient
relative humidity in the shower room was decreased for this experimental run by the installation of
two dehumidifiers and -
mounted exhaust duct.
Average values and standard deviations for the parameters measured during this investigation
are shown in Table 14. Chemical parameters measured throughout the course of this experiment are
shown in Figure E8 Figure E16. Values for these parameters were consistently higher during the
second trial than were observed during the first trial. Continuous conductivity data are shown in

ASHRAE 1361-‐RP 75 Final Technical Report
Figure E8, and continuous pH data are shown in Figure E9. T1 (Control) maintained a pH of
approximately 8.71, while T2 (Device) maintained a pH of approximately 8.73. Measurements of
conductivity and pH indicate that the operating conditions of each tower were nearly identical for the
duration of the experimental trial. The blowdown setpoint on each tower was set to a value of 2.10
mS/cm based on the chemical characteristics of the incoming make-up water (Figure E11).
Table 14 Average values for PEFD (Trial 2/2)
T1 (Control) T2 (Device)
Average
Standard Deviation Average Standard Deviation
Temperature Entering Tower (ºF) 96.4 1.0 98.6 1.8 Sump Temperature (ºF) 85.6 1.7 86.8 1.6 Daily Make-up Water Consumption (gal) 105 23 96 7 Daily Blowdown (gal) 8 6 8 8 Conductivity (mS/cm) 1.980 0.102 1.908 0.203 pH 8.71 0.03 8.73 0.06
ORP (mV) 196 7 246 22 Alkalinity (mg/L as CaCO3) 123 10 114 16 Calcium Hardness (mg/L as CaCO3) 173 3 167 7 Magnesium Hardness (mg/L as CaCO3) 198 11 192 21 Total Hardness (mg/L as CaCO3) 371 11 361 81 TDS (mg/L) 1411 67 1329 155 LSI 1.24 0.05 1.24 0.13 RSI 6.24 0.08 6.25 0.21 PSI 7.35 0.12 7.40 0.25 Planktonic HPC (CFU/mL) 4.12E+05 5.00E+05 1.17E+06 2.24E+06 ATP Microbial Equivalents (MEQs/mL) 4.59E+05 4.12E+05 6.08E+05 1.96E+05
Sessile HPC (CFU/cm2) 2.07E+06 5.44E+05 1.89E+06 6.14E+05
Three scaling indices were calculated using the chemical parameters observed during this
investigation, and these indices may be used to q
supply. The Langelier Saturation Index for each tower was approximately 1.24 at equilibrium,

ASHRAE 1361-‐RP 76 Final Technical Report
indicating that the water in each tower system had strong scaling potential (Figure E17). Equilibrium
values of the Ryznar Stability Index for each tower were approximately 6.24 for T1 (Control) and 6.25
for T2 (Device) (Figure E18), indicating that the water in each system was stable. However, the
Puckorius Scaling Index values were approximately 7.35 for T1 (Control) and 7.40 for T2 (Device) at
equilibrium, indicating moderate scale-dissolving potential (Figure E19). These indices provide
conflicting information regarding whether or not the water in each tower system is scale-forming or
scale-dissolving.
4.3.2 Biological Parameters
Observation of the biological population present in each tower (Figure 20 Figure 22) indicates that
each tower maintained comparable levels of microbial activity both in the bulk water and in system
biofilms throughout the course of the experiment. No significant reduction in microbial activity was
observed in the tower with the device. Both towers maintained planktonic microbial populations in
excess of acceptable industry standards (104 CFU/mL).
Planktonic heterotrophic plate counts for each tower system over the course of the device trial
are shown in Figure 20. The microbial population was higher in T2 (device) than in T1 (Control) on
7 of the 9 sampling days. On 6/20, the heterotrophic plate count in T2 (Device) was approximately 1
log value higher than in T1 (Control). This was the largest observed difference between the
planktonic microbial populations of the two tower systems. A statistical analysis of the combined
planktonic heterotrophic plate count data from PEFD Trial 1/2 and Trial 2/2 is shown in Table 15.
This analysis indicates that the observed difference between the planktonic heterotrophic plate counts
for T1 (Control) and T2 (Device) was not statistically significant.

ASHRAE 1361-‐RP 77 Final Technical Report
Figure 20 Planktonic microbial population enumerated by heterotrophic plate count for PEFD (Trial 2/2)
Table 15 Planktonic HPC statistical analysis for PEFD Trial 1/2 and PEFD Trial 2/2
(Planktonic heterotrophic plate counts were transformed to Log 10 data and compared using a paired t-‐test. Log 10 transformed data was normally distributed, Wilks-‐Shapiro test for normality) Combined Runs (p = 0.92) ------------------------------------------------------------------------------ Variable | Obs Mean Std. Err. Std. Dev. [95% Conf. Interval] ---------+-------------------------------------------------------------------- t1sump10 | 18 5.592301 .1256143 .5329365 5.327278 5.857324 t2sump10 | 18 5.602987 .1161657 .4928494 5.357899 5.848075 ---------+-------------------------------------------------------------------- diff | 18 -.0106858 .1051676 .4461884 -.2325701 .2111985 ------------------------------------------------------------------------------ mean(diff) = mean(t1sump10 - t2sump10) t = -0.1016 Ho: mean(diff) = 0 degrees of freedom = 17 Ha: mean(diff) < 0 Ha: mean(diff) != 0 Ha: mean(diff) > 0 Pr(T < t) = 0.4601 Pr(|T| > |t|) = 0.9203 Pr(T > t) = 0.5399
The results of this t-‐test indicate that there was no significant difference between planktonic heterotrophic plate counts recorded for each of the tower systems during both device trials.
1.E+03
1.E+04
1.E+05
1.E+06
1.E+07
6/12 6/17 6/22 6/27 7/2 7/7 7/12
HPC
-‐CFU/m
L
Date
Planktonic Microbial Population (HPC)
Make-‐Up
T1 (Control)
T2 (Device)

ASHRAE 1361-‐RP 78 Final Technical Report
The concentration of microorganisms present in the make-up water during this investigation
was comparable to that observed during the first pulsed electric field device trial. This is a result of
the combination of make-up water dechlorination and storage. Although high microbial
concentrations in the make-up water most likely led to constant seeding of microorganisms, no
difference in planktonic heterotrophic plate counts between T1 (Control) and T2 (Device) was
observed, indicating that the non-chemical device did not have an effect on the growth of planktonic
microorganisms in the cooling tower.
The microbial population in each of the two tower systems was also enumerated using the
measurement of cellular ATP. The concentration of ATP was used to calculate microbial
equivalents according to the equation described previously in this report. ATP microbial
equivalent measurements are shown in
Figure 21. The observed microbial population was higher in T2 (Device) than in T1
(Control) on 6 of the 8 sampling days. A statistical analysis using ATP data from both PEFD
Trial 1/2 and Trial 2/2 is shown in Table 16. This analysis shows that the observed difference
between the microbial populations of T1 (Control) and T2 (Device) during PEFD Trial 1/2 and
Trial 2/2 was not statistically significant.
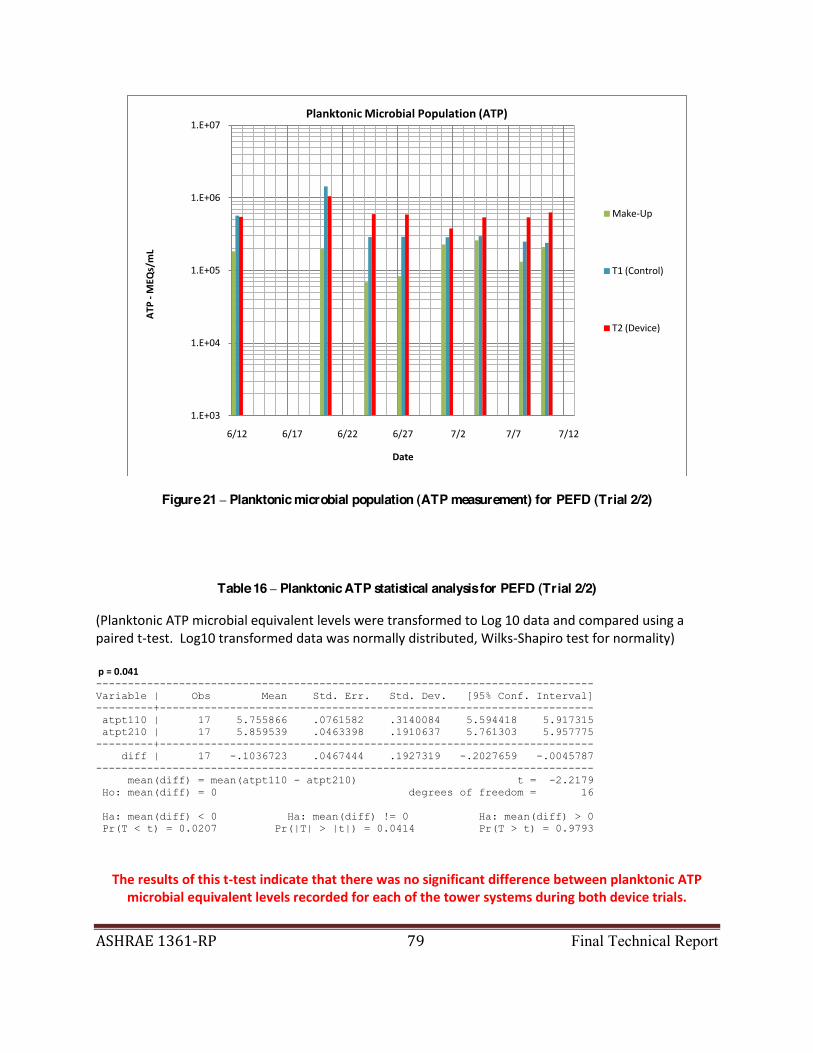
ASHRAE 1361-‐RP 79 Final Technical Report
Figure 21 Planktonic microbial population (ATP measurement) for PEFD (Trial 2/2)
Table 16 Planktonic ATP statistical analysis for PEFD (Trial 2/2)
(Planktonic ATP microbial equivalent levels were transformed to Log 10 data and compared using a paired t-‐test. Log10 transformed data was normally distributed, Wilks-‐Shapiro test for normality) p = 0.041 ------------------------------------------------------------------------------ Variable | Obs Mean Std. Err. Std. Dev. [95% Conf. Interval] ---------+-------------------------------------------------------------------- atpt110 | 17 5.755866 .0761582 .3140084 5.594418 5.917315 atpt210 | 17 5.859539 .0463398 .1910637 5.761303 5.957775 ---------+-------------------------------------------------------------------- diff | 17 -.1036723 .0467444 .1927319 -.2027659 -.0045787 ------------------------------------------------------------------------------ mean(diff) = mean(atpt110 - atpt210) t = -2.2179 Ho: mean(diff) = 0 degrees of freedom = 16 Ha: mean(diff) < 0 Ha: mean(diff) != 0 Ha: mean(diff) > 0 Pr(T < t) = 0.0207 Pr(|T| > |t|) = 0.0414 Pr(T > t) = 0.9793
The results of this t-‐test indicate that there was no significant difference between planktonic ATP microbial equivalent levels recorded for each of the tower systems during both device trials.
1.E+03
1.E+04
1.E+05
1.E+06
1.E+07
6/12 6/17 6/22 6/27 7/2 7/7 7/12
ATP
-‐MEQ
s/mL
Date
Planktonic Microbial Population (ATP)
Make-‐Up
T1 (Control)
T2 (Device)
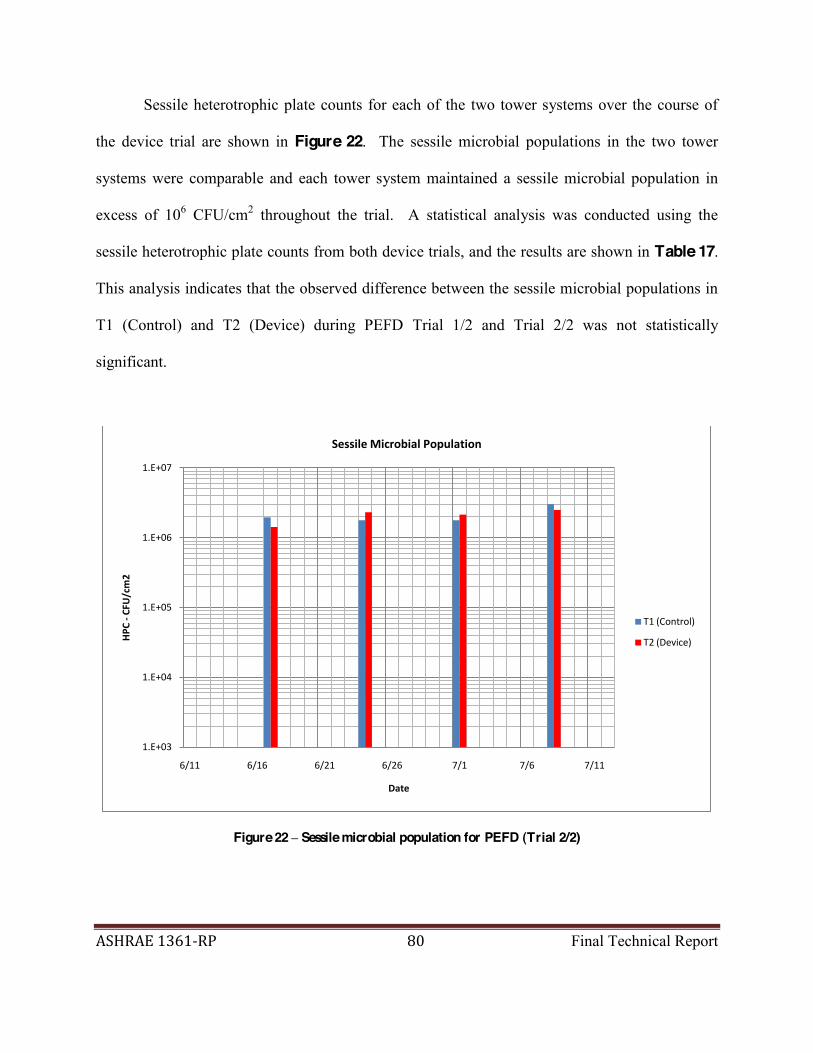
ASHRAE 1361-‐RP 80 Final Technical Report
Sessile heterotrophic plate counts for each of the two tower systems over the course of
the device trial are shown in Figure 22. The sessile microbial populations in the two tower
systems were comparable and each tower system maintained a sessile microbial population in
excess of 106 CFU/cm2 throughout the trial. A statistical analysis was conducted using the
sessile heterotrophic plate counts from both device trials, and the results are shown in Table 17.
This analysis indicates that the observed difference between the sessile microbial populations in
T1 (Control) and T2 (Device) during PEFD Trial 1/2 and Trial 2/2 was not statistically
significant.
Figure 22 Sessile microbial population for PEFD (Trial 2/2)
1.E+03
1.E+04
1.E+05
1.E+06
1.E+07
6/11 6/16 6/21 6/26 7/1 7/6 7/11
HPC
-‐CFU/cm2
Date
Sessile Microbial Population
T1 (Control)
T2 (Device)

ASHRAE 1361-‐RP 81 Final Technical Report
Table 17 Sessile HPC statistical analysis for PEFD Trial 1/2 and Trial 2/2
(Sessile heterotrophic plate counts were transformed to Log 10 data and compared using a paired t-‐test. Log 10 transformed data was normally distributed, Wilks-‐Shapiro test for normality) p = 0.126 ------------------------------------------------------------------------------ Variable | Obs Mean Std. Err. Std. Dev. [95% Conf. Interval] ---------+-------------------------------------------------------------------- t1bio10 | 9 6.264815 .1293026 .3879078 5.966643 6.562988 t2bio10 | 9 6.170275 .1344017 .4032052 5.860344 6.480206 ---------+-------------------------------------------------------------------- diff | 9 .0945397 .0552943 .165883 -.0329692 .2220487 ------------------------------------------------------------------------------ mean(diff) = mean(t1bio10 - t2bio10) t = 1.7098 Ho: mean(diff) = 0 degrees of freedom = 8 Ha: mean(diff) < 0 Ha: mean(diff) != 0 Ha: mean(diff) > 0 Pr(T < t) = 0.9372 Pr(|T| > |t|) = 0.1257 Pr(T > t) = 0.0628
The results of this t-‐test indicate that there was no significant difference between sessile heterotrophic plate counts recorded for each of the tower systems during both device trials.
The make-up water contained a heterotrophic biological population between 1,400 90,000
CFU/mL during this device trial, with an average value of approximately 18,000 CFU/mL. Make-up
water biological growth was allowed to occur without any means of biocidal control since water was
dechlorinated prior to usage. No artificial microbial seeding was performed on the make-up water
during this or any of the device trials.
4.3.3 Summary
The results presented in this report demonstrate that the pulsed electric field non-chemical device
Two device
trials were performed at different cycles of concentration. Planktonic heterotrophic plate counts

ASHRAE 1361-‐RP 82 Final Technical Report
and ATP measurements from T1 (Control) and T2 (Device) showed no significant difference at
any point during either of the device trials. The same behavior was observed for sessile
heterotrophic plate counts in two tower systems during both device trials.

ASHRAE 1361-‐RP 83 Final Technical Report
4.4 ELECTROSTATIC DEVICE (ED) TRIAL
The evaluation of the static electric field device began on 7/18 and it continued until 8/15. A
malfunction in the make-up feed solenoid valve on T2 (Device) occurred on 8/2. As a result, T2
(Device) was turned off for several hours while the valve was replaced. This malfunction also led to a
dilution of the water in T2 (Device). All data collected during this trial is included in Appendix F.
Operational and chemical data collected during this investigation are shown in Appendix F.1, and
statistical analyses of the chemical data are shown in Appendix F.2. Photographs of the tower systems
taken before and after the device trial are shown in Appendix F.3, and photographs of biofilm coupon
taken during the investigation are shown in Appendix F.4. After the trial period for the static electric
field device had ended, a chlorination test was performed on T2 (Device) and these results are
discussed in Section 4.7 of this report.
4.4.1 Tower System Operation
Operational and chemical data collected during this device trial are shown in Figure F1 Figure E19.
Throughout the course of the investigation, a temperature differential 9.8 11.6 ºF was maintained for
T1 (Control), while the temperature differential of 11 14 ºF was maintained for T2 (Device) (Figure
F1). Figure F2 demonstrates that make-up water consumption levels were comparable in Tower 1
(Control) and Tower 2 (Device) during this test. This is indicated by the similar slopes of the two data
sets. Figure F3 demonstrates that T1 (Control) and T2 (Device) maintained comparable cumulative
blowdown levels throughout the course of the experiment. Temperature profiles for each tower are

ASHRAE 1361-‐RP 84 Final Technical Report
shown in Figure F4 (T1) and Figure F5 (T2). Fluctuations in the temperatures of each tower were
the result of changes in ambient temperature (Figure F6) and relative humidity (Figure F7).
Average values for the parameters measured during this device trial are shown in Table 18.
Examination of the continuous conductivity data (Figure F8) shows evidence of a blowdown valve
malfunction in the T2 (Device) system on 7/29, resulting in a sudden spike followed by a dramatic
drop in conductivity. Make-up water was unable to enter the tower, and a large amount of water
evaporated from the system, thereby increasing the conductivity of system water. Once the valve was
replaced, make-up water diluted the system volume, decreasing the overall system conductivity.
Continuous pH data collected during the test (Figure F9) reveal that the average pH of T1 (Control)
was approximately 8.58, while the average pH of T2 (Device) was approximately 8.64. A
malfunction in the make-up feed valve of T1 (Control) on 7/30 diluted the system water, decreasing
the pH significantly. Make-up water conductivity and pH are shown in Figure F11.
Three scaling indices were calculated using the chemical parameters observed during this
investigation, and these indices may be used to quantify the scaling potential in each tower. Both
towers produced comparable values for each of the scaling indices analyzed. The Langelier
Saturation Index for T1 (Control) was approximately 0.96, and for T2 (Device) it was approximately
1.04, indicating that the water in each tower system had moderate scaling potential (Figure F17).
Equilibrium values of the Ryznar Stability Index (Figure F18) were approximately 6.66 and 6.56 for
T1 (Control) and T2 (Device), respectively, indicating that the water has slight scale-dissolving
potential. Puckorius Scaling Index values were approximately 7.35 for T1 (Control) and 7.40 for T2
(Device) at equilibrium, which indicates moderate scale-dissolving tendency (Figure F19). A

ASHRAE 1361-‐RP 85 Final Technical Report
combined analysis of these three indices indicates that each tower system contained water with mild
scaling potential.
Table 18 Average parameter values for ED trial
T1 (Control) T2 (Device)
Average Standard Deviation Average Standard Deviation
Temperature Entering Tower (°F) 100.3 1.6 100.950 2.1 Sump Temperature (ºF) 89.3 1.5 88.3 1.9 Daily Make-up Water Consumption (gal) 116 27 102 36 Daily Blowdown (gal) 19 9 18 11 Conductivity (mS/cm) 1.217 0.072 1.184 0.109 pH 8.58 0.08 8.64 0.08 ORP (mV) 190 31 195 34 Alkalinity (mg/L as CaCO3) 86 10 88 11
Calcium Hardness (mg/L as CaCO3) 153 10 152 10 Magnesium Hardness (mg/L as CaCO3) 105 8 99 9 Total Hardness (mg/L as CaCO3) 257 15 251 18 TDS (mg/L) 793 93 773 87 LSI 0.96 0.15 1.04 0.43 RSI 6.66 0.22 6.56 0.72 PSI 7.49 0.24 7.51 0.20 Planktonic HPC (CFU/mL) 3.89E+05 2.79E+05 4.99E+05 3.66E+05 ATP Microbial Equivalents (MEQs/mL) 5.72E+05 1.33E+05 7.44E+05 2.43E+05
Sessile HPC (CFU/cm2) 1.43E+06 6.05E+05 1.60E+06 5.49E+05
4.4.2 Biological Parameters
Observation of the biological population present in each tower (Figure 23 Figure 25) indicates that
each tower contained comparable levels of microbial activity both in the bulk water and in system
biofilms throughout the course of the experiment. No significant reduction in microbial activity was
observed in the tower treated with the static electric field device.

ASHRAE 1361-‐RP 86 Final Technical Report
A chlorination test was performed on 8/22 in tower T2 (Device), resulting in a significant
reduction in planktonic and sessile microbial activity observed in this tower on 8/23. The results of
this chlorination test will be discussed together with other chlorination tests conducted throughout this
study in Section 4.7 of this report.
Heterotrophic plate counts for each tower system over the course of the device trial are shown
in Figure 23. The microbial population in T2 (Device) was higher than T1 (Control) on 6 of the 9
sampling days. Both towers maintained planktonic microbial populations in excess of acceptable
industry standards (approximately 104 CFU/mL). A statistical analysis of the heterotrophic plate
counts measured during the device trial is shown in Table 19. This analysis indicates that the
observed difference between the heterotrophic plate counts in T1 (Control) and T2 (Device) was not
statistically significant.
Figure 23 Planktonic microbial population (HPC) for ED trial
1.E+02
1.E+03
1.E+04
1.E+05
1.E+06
1.E+07
7/18 7/23 7/28 8/2 8/7 8/12 8/17
HPC
-‐CFU/m
L
Date
Planktonic Microbial Population (HPC)
Make-‐Up
T1 (Control)
T2 (Device)

ASHRAE 1361-‐RP 87 Final Technical Report
Table 19 Planktonic HPC statistical analysis for ED trial
(Planktonic heterotrophic plate counts were transformed to Log 10 data and compared using a paired t-‐test. Log 10 transformed data was normally distributed, Wilks-‐Shapiro test for normality) p = 0.31 ------------------------------------------------------------------------------ Variable | Obs Mean Std. Err. Std. Dev. [95% Conf. Interval] ---------+-------------------------------------------------------------------- t1sump10 | 8 5.54703 .1012947 .2865046 5.307507 5.786554 t2sump10 | 8 5.630686 .1184785 .3351079 5.350528 5.910843 ---------+-------------------------------------------------------------------- diff | 8 -.0836552 .0769271 .2175826 -.2655589 .0982484 ------------------------------------------------------------------------------ mean(diff) = mean(t1sump10 - t2sump10) t = -1.0875 Ho: mean(diff) = 0 degrees of freedom = 7 Ha: mean(diff) < 0 Ha: mean(diff) != 0 Ha: mean(diff) > 0 Pr(T < t) = 0.1564 Pr(|T| > |t|) = 0.3129 Pr(T > t) = 0.8436
The results of this t-‐test indicate that there was no significant difference between planktonic heterotrophic plate counts recorded for each of the tower systems during both device trials
The microbial population in each tower was also enumerated by measuring the concentration
of cellular ATP present in each tower system and converting this measurement to microbial
equivalents using the equation described previously in this report. The microbial equivalents for each
tower system during this device trial are shown in Figure 24. T2 (Device) maintained higher
microbial population than T1 (Control) on 6 of the 8 sampling dates. A statistical analysis of this data
is shown in Table 20. This analysis shows that the observed difference between the microbial
equivalents in T1 (Control) and T2 (Device) was not statistically significant.
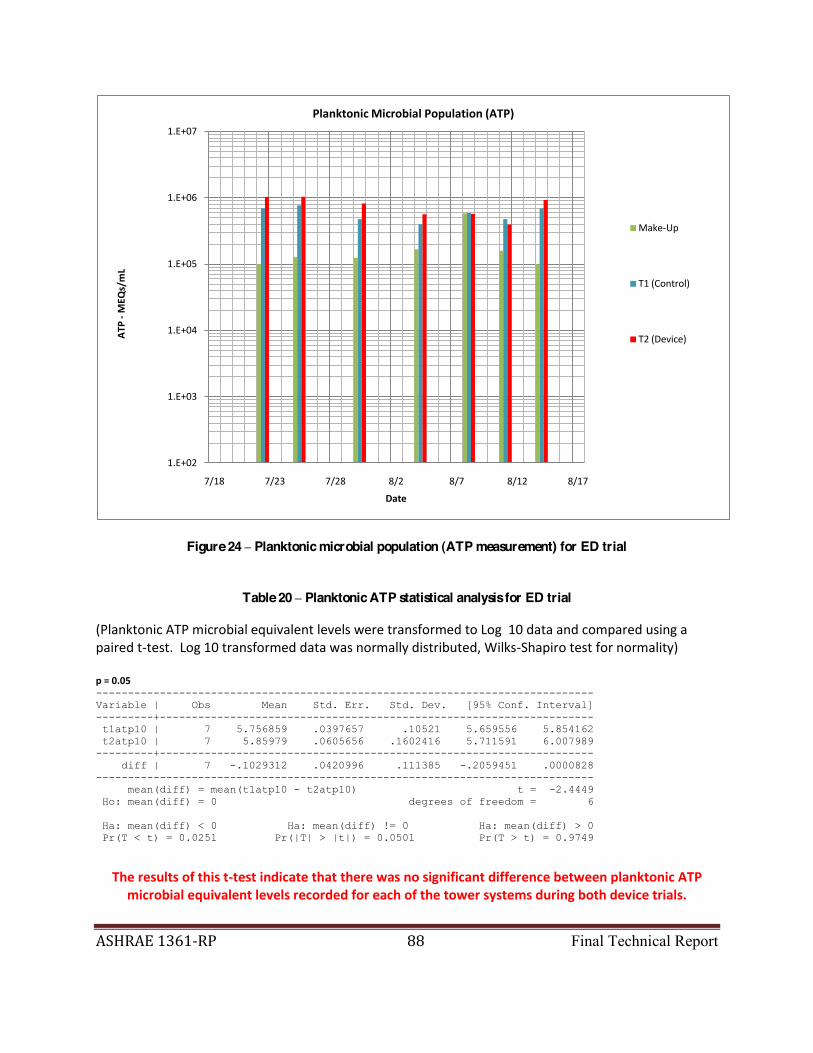
ASHRAE 1361-‐RP 88 Final Technical Report
Figure 24 Planktonic microbial population (ATP measurement) for ED trial
Table 20 Planktonic ATP statistical analysis for ED trial
(Planktonic ATP microbial equivalent levels were transformed to Log 10 data and compared using a paired t-‐test. Log 10 transformed data was normally distributed, Wilks-‐Shapiro test for normality) p = 0.05 ------------------------------------------------------------------------------ Variable | Obs Mean Std. Err. Std. Dev. [95% Conf. Interval] ---------+-------------------------------------------------------------------- t1atp10 | 7 5.756859 .0397657 .10521 5.659556 5.854162 t2atp10 | 7 5.85979 .0605656 .1602416 5.711591 6.007989 ---------+-------------------------------------------------------------------- diff | 7 -.1029312 .0420996 .111385 -.2059451 .0000828 ------------------------------------------------------------------------------ mean(diff) = mean(t1atp10 - t2atp10) t = -2.4449 Ho: mean(diff) = 0 degrees of freedom = 6 Ha: mean(diff) < 0 Ha: mean(diff) != 0 Ha: mean(diff) > 0 Pr(T < t) = 0.0251 Pr(|T| > |t|) = 0.0501 Pr(T > t) = 0.9749
The results of this t-‐test indicate that there was no significant difference between planktonic ATP microbial equivalent levels recorded for each of the tower systems during both device trials.
1.E+02
1.E+03
1.E+04
1.E+05
1.E+06
1.E+07
7/18 7/23 7/28 8/2 8/7 8/12 8/17
ATP
-‐MEQ
s/mL
Date
Planktonic Microbial Population (ATP)
Make-‐Up
T1 (Control)
T2 (Device)

ASHRAE 1361-‐RP 89 Final Technical Report
The sessile heterotrophic plate counts for each tower system throughout the course of the
device trial are shown in Figure 25. The sessile microbial populations in each tower system were
comparable for the duration of the trial. Each tower system maintained a sessile microbial population
in excess of 105 CFU/cm2. A statistical analysis of sessile heterotrophic plate counts shown in Table
21 reveals that the observed difference between the sessile heterotrophic plate counts for T1 (Control)
and T2 (Device) was not statistically significant.
Figure 25 Sessile microbial population for ED trial
1.E+02
1.E+03
1.E+04
1.E+05
1.E+06
1.E+07
7/18 7/23 7/28 8/2 8/7 8/12 8/17
HPC
-‐CFU/cm2
Date
Sessile Microbial Population
T1 (Control)
T2 (Device)

ASHRAE 1361-‐RP 90 Final Technical Report
Table 21 Sessile HPC statistical analysis for ED trial
(Sessile heterotrophic plate counts were transformed to Log 10 data and compared using a paired t-‐test. Log 10 transformed data was normally distributed, Wilks-‐Shapiro test for normality) p = 0.46 ------------------------------------------------------------------------------ Variable | Obs Mean Std. Err. Std. Dev. [95% Conf. Interval] ---------+-------------------------------------------------------------------- t1bio10 | 4 6.064831 .0968112 .1936224 5.756734 6.372927 t2bio10 | 4 6.148427 .1027606 .2055213 5.821397 6.475457 ---------+-------------------------------------------------------------------- diff | 4 -.0835965 .0995033 .1990065 -.4002603 .2330673 ------------------------------------------------------------------------------ mean(diff) = mean(t1bio10 - t2bio10) t = -0.8401 Ho: mean(diff) = 0 degrees of freedom = 3 Ha: mean(diff) < 0 Ha: mean(diff) != 0 Ha: mean(diff) > 0 Pr(T < t) = 0.2313 Pr(|T| > |t|) = 0.4625 Pr(T > t) = 0.7687
The results of this t-‐test indicate that there was no significant difference between sessile heterotrophic plate counts recorded for each of the tower systems during both device trials.
The make-up water contained a heterotrophic biological population between 1,300 20,000
CFU/mL during this device trial, with an average value of approximately 4,400 CFU/mL. Make-up
water biological growth was allowed to occur without any means of biocidal control since water was
dechlorinated prior to usage. No artificial microbial seeding was performed on the make-up water
during this or any of the device trials.
Phase I consisted of operating both the control and device towers for 4 weeks, with the non-
chemical treatment device activated at the beginning of the investigation. This phase was completed
for the static electric field treatment device. Since no microbial control was demonstrated during
Phase I, Phase II was not initiated for this device. Phase II was to be conducted after a 2-week period
during which each tower was allowed to operate with no treatment to achieve significant biological
activity. The device would then be activated to determine whether or not any existing biological
ASHRAE 1361-‐RP 91 Final Technical Report
growth in the device tower may be removed through the application of this non-chemical treatment
device.
4.4.3 Summary
The results presented in this report demonstrate that the static electric field non-chemical device
Planktonic
heterotrophic plate counts and ATP measurements from T1 (Control) and T2 (Device) showed
no significant difference at any point during the investigation. The same trend was observed for
sessile heterotrophic plate counts in the two tower systems.

ASHRAE 1361-‐RP 92 Final Technical Report
4.5 ULTRASONIC DEVICE (UD) TRIAL
The investigation of the ultrasonic non-chemical treatment device began on 9/2 and continued
uninterrupted until 9/30. Data collected during this investigation is shown in Appendix G.
Operational and chemical data from this investigation are included in Appendix G.1, and statistical
analyses of the chemical parameters are included in Appendix G.2. Appendix G.3 contains
photographs of each tower system before and after the device trial. Appendix G.4 contains
photographs of biofilm sampling coupons taken from each tower system throughout the course of the
investigation.
4.5.1 Tower System Operation
Tower operational and chemical data is shown in Figure G1 Figure G19. Average values for the
parameters measured during this device trial are contained in Table 22. The temperature differential
for each tower system over the course of the experiment is shown in Figure G1. Calculation of the
temperature differential was performed by subtracting the manual sump temperature reading from the
manual reading of the temperature entering each tower system. The tower systems were designed
with a target temperature differential of approximately 10 °F. Figure G1 indicates that T1 (Control)
operated with a temperature differential of 9.0 11.3 ºF, while T2 (Device) operated with a
temperature differential of 10.2 13.2 ºF. The difference in temperature differentials between the two
tower systems was due to differing performance efficiencies of the heating elements and axial cooling
fans installed in each system.

ASHRAE 1361-‐RP 93 Final Technical Report
Table 22 Average parameter values for UD trial
T1 (Control) T2 (Device)
Average
Standard Deviation Average
Standard Deviation
Temperature Entering Tower (°F) 100.6 2.4 102.5 3.0 Sump Temperature (ºF) 90.1 2.8 90.3 3.3 Daily Make-‐up Water Consumption (gal) 123 27 121 27 Daily Blowdown (gal) 19 9 25 12 Conductivity (mS/cm) 1.334 0.149 1.335 0.167 pH 8.71 0.06 8.78 0.05 ORP (mV) 197 33 185 27
Alkalinity (mg/L as CaCO3) 102 14 98 11 Calcium Hardness (mg/L as CaCO3) 175 15 176 17 Magnesium Hardness (mg/L as CaCO3) 124 21 126 22
Total Hardness (mg/L as CaCO3) 299 36 302 39 TDS (mg/L) 915 115 914 128 LSI 1.22 0.13 1.30 0.11 RSI 6.27 0.21 6.19 0.17 PSI 7.49 0.24 7.51 0.20 Planktonic HPC (CFU/mL) 3.81E+05 4.06E+05 2.04E+05 1.98E+05 ATP Microbial Equivalents (MEQs/mL) 9.00E+05 7.71E+05 5.52E+05 7.33E+05 Sessile HPC (CFU/cm2) 7.74E+06 7.69E+06 1.43E+07 2.27E+07
Both towers were supplied with make-up water from the same source. Make-up water
consumption rates for each tower system (Figure G2) were nearly identical throughout the test, as
indicated by the similar slopes produced by the cumulative consumption curves. Cumulative
blowdown volumes for each tower system (Figure G3) indicate that T2 (Device) had more frequent
blowdowns than T1 (Control). This is most likely because temperatures in T1 (Control) (Figure G4)
were lower than those in T2 (Device) (Figure G5), resulting in more evaporation and more frequent
blowdowns in T2 (Device) due to increased conductivity. Fluctuations in tower temperatures were the
result of changes in ambient temperature (Figure G6) and relative humidity (Figure G7).

ASHRAE 1361-‐RP 94 Final Technical Report
Chemical data collected during this investigation are shown in Appendix G (Figure G8
Figure G16). The continuous conductivity data (Figure G8) shows two significant increases in the
tower system conductivities. On 9/14, the blowdown conductivity setpoint was changed from 1200
µS/cm to 1400 µS/cm, increasing peak conductivity levels in both tower systems. On 9/22, the
blowdown conductivity setpoint was raised from 1400 µS/cm to 1500 µS/cm, again increasing peak
conductivity levels for each system. Changes in the blowdown conductivity setpoint were made
based on the increasing conductivity of the make-up water used in this trial (Figure G11). The
blowdown conductivity setpoint was adjusted to be approximately 4 times the conductivity of the
incoming make-up water in order to establish 4-5 cycles of concentration. Continuous pH data for the
tower system are shown in Figure G10, indicating that the average pH in T1 (Control) at equilibrium
was approximately 8.71, while the average equilibrium pH for T2 (Device) was approximately 8.78.
Inflows of make-up water were associated with steep drops in tower pH. Following the periods of
make-up water feeding, the pH steadily increased as system water evaporated.
Chloride concentration measurements collected in this investigation (Table G1) indicate that
each system was operating at 5-6 cycles of concentration throughout the course of the testing. This is
slightly higher than the target of 4-5 cycles of concentration. Conductivity was used to establish the
cycles of concentration in each tower. The chloride ion is a more sensitive indicator of cycles of
concentration due to its relative inertness, and as a result the cycles of concentration determined using
chloride measurements tend to be higher than those determined using conductivity.
Values for three scaling indices were calculated using the chemical data collected during this
investigation. The Langelier Saturation Index (Figure G17) was approximately 1.22 for T1 (Control)
and 1.30 for T2 (Device), indicating strong scaling potential. The equilibrium Ryznar Stability Index

ASHRAE 1361-‐RP 95 Final Technical Report
(Figure G18) for T1 (Control) was 6.27, while for T2 (Device) it was approximately 6.19, indicating
little to no scaling potential in either of the tower systems. The Puckorius Scaling Index (Figure G19)
was approximately 7.49 for T1 (Control) and 7.51 for T2 (Device), indicating moderate scale-
dissolving potential.
4.5.2 Biological Parameters
Biological data collected during this trial with ultrasonic device are shown in Figure 26 Figure 28.
The planktonic and sessile microbial populations were comparable in each of the two towers for the
duration of this trial. There was no observed reduction in microbial activity in T2 (Device). A
chlorination test was performed beginning on 10/2. The last data point (10/4) is excluded from the
discussion of the data collected in this trial and the results of this chlorination test will be discussed
together with other chlorination tests conducted throughout this study in Section 4.7 of this report.
The planktonic heterotrophic plate counts for each tower system during this device trial are
shown in Figure 26. Each tower system had heterotrophic plate counts higher than the industrial
standard of 104 CFU/mL. T2 (Device) maintained a lower microbial population on 6 of the 9
sampling dates. If the non-chemical device reduced the average tower microbial concentrations, it
should have been reflected in a significant difference between microbial counts for T1 (Control) and
T2 (Device). However, no statistically significant difference between the microbial counts was
observed in the two towers. A paired t-test was used to compare log 10 planktonic heterotrophic plate

ASHRAE 1361-‐RP 96 Final Technical Report
Figure 26 Planktonic microbial population (HPC) for UD trial
Figure 27 Planktonic microbial population (ATP measurement) for UD trial
1.E+03
1.E+04
1.E+05
1.E+06
1.E+07
9/2 9/7 9/12 9/17 9/22 9/27 10/2
HPC
-‐CFU/m
L
Date
Planktonic Microbial Population (HPC)
Make-‐Up HPC
T1 (Control) HPC
T2 (Device) HPC
1.E+03
1.E+04
1.E+05
1.E+06
1.E+07
9/2 9/7 9/12 9/17 9/22 9/27 10/2
ATP
-‐MEQ
s/mL
Date
Planktonic Microbial Population (ATP)
Make-‐Up ATP
T1 (Control) ATP
T2 (Device) ATP

ASHRAE 1361-‐RP 97 Final Technical Report
Figure 28 Sessile microbial population for UD trial
counts for each tower system, resulting in a p value of 0.449. This indicates that the observed
difference between the planktonic heterotrophic plate counts in T1 (Control) and T2 (Device) was not
statistically significant.
Planktonic microbial populations in each tower were also enumerated by converting measured
cellular ATP concentrations to microbial equivalents using the equation previously discussed in this
report. The planktonic microbial equivalent values determined in this fashion are shown in Figure 27.
While T2 (Device) maintained a lower microbial population throughout the device trial, the difference
between T1 (Control) and T2 (Device) was less than 1 log value. A paired t-test was performed using
the log 10 microbial equivalent data from this device trial, resulting in a p-value of p = 0.063. This
1.E+03
1.E+04
1.E+05
1.E+06
1.E+07
1.E+08
9/6 9/11 9/16 9/21 9/26 10/1
HPC
-‐CFU/cm2
Date
Sessile Microbial Population
T1 (Control)
T2 (Device)
ASHRAE 1361-‐RP 98 Final Technical Report
indicates that the observed difference between the microbial populations in T1 (Control) and T2
(Device) was not statistically significant.
Sessile heterotrophic plate counts from T1 (Control) and T2 (Device) were also comparable
throughout the course of this investigation (Figure 28). A paired t-test was performed using the log
10 sessile heterotrophic plate counts, resulting in a p-value of p = 0.469. This indicates that the
observed difference between the sessile heterotrophic plate counts in T1 (Control) and T2 (Device)
was not statistically significant.
The make-up water contained a heterotrophic biological population between 1,800 120,000
CFU/mL during this device trial, with an average value of approximately 23,000 CFU/mL. Make-up
water biological growth was allowed to occur without any means of biocidal control since water was
dechlorinated prior to usage. No artificial microbial seeding was performed on the make-up water
during this or any of the device trials.
Since no sessile or planktonic microbial control was demonstrated during Phase I, the device
investigation was terminated without performing the Phase II testing. Phase I consisted of operating
both the control and device towers for 4 weeks, with the non-chemical treatment device activated at
the beginning of the investigation. This phase was completed for the ultrasonic treatment device.
Phase II was to be conducted after a 2 week period during which each tower was allowed to operate
with no treatment. The device would then be activated to determine whether or not any existing
biological growth in the device tower may be removed through the application of non-chemical
treatment.

ASHRAE 1361-‐RP 99 Final Technical Report
4.5.3 Summary
The results presented in this report demonstrate that the ultrasonic non-chemical device did not
Planktonic
heterotrophic plate counts and ATP measurements from T1 (Control) and T2 (Device) showed
no statistically significant difference at any point during the investigation. The same trend was
observed for sessile heterotrophic plate counts from each tower system.
ASHRAE 1361-‐RP 100 Final Technical Report
4.6 HYDRODYNAMIC CAVITATION DEVICE (HCD) TRIAL
The evaluation of the hydrodynamic cavitation treatment device began on 10/27, and it continued
uninterrupted until 11/24. All data collected during this investigation is included in Appendix G.
Operational and chemical data figures and tables for this investigation are shown in Appendix
G.1, and statistical analyses of the chemical data are included in Appendix G.2. Photographs of
each of the two tower systems before and after the device trial are included in Appendix G.3, and
photographs of biofilm sampling coupons are provided in Appendix G.4.
4.6.1 Tower System Operation
Tower operational and chemical data are shown in Figure G1 - Figure G19. After three days of
operation, the temperature differential for each tower system was 10 11.6 ºF (Figure G1),
which was near the target differential of 10 ºF. T2 (Device) consumed 443 gal. more make-up
water than T1 (Control) over the course of the experiment (Figure G2), but cumulative
blowdown volumes for the two towers were comparable (Figure G3). T2 (Device) most likely
consumed more make-up water than T1 (Control) due to increased splashing within the system
holding tank caused by the discharge from the non-chemical device recirculation loop.
Tower temperature profiles are shown in Figure G4 (T1) and Figure G5 (T2). The
heater installed in the T2 (Device) tower system was not operating at full capacity from 10/31 to
11/19. As a result, average tower temperatures were lower in T2 (Device) than in T1 (Control)
during this period. Over the course of the experiment, the average temperature entering T1
(Control) was 99.8 °F, while the average temperature entering T2 (Device) was 95.5 °F. The

ASHRAE 1361-‐RP 101 Final Technical Report
difference in temperature between the two towers was not severe enough to have a significant
impact on microbial growth rates.
Average values and standard deviations for all parameters measured during this
investigation are shown in Table 23. These values were calculated using the data collected after
the first blowdown occurred in each of the towers. Chemical data collected during this
investigation are shown in Figure G8 - Figure G16.
Table 23 Average values and standard deviations for HCD trial
T1 (Control) T2 (Device)
Average
Standard Deviation Average
Standard Deviation
Temperature Entering Tower (°F) 99.8 1.1 95.5 3.2 Sump Temperature (ºF) 89.1 1.3 84.9 3.3 Daily Make-‐up Water Consumption (gal) 124 27 139 32 Daily Blowdown 23 10 23 10 Conductivity (mS/cm) 1.364 0.091 1.385 0.080 pH 8.75 0.04 8.67 0.05 ORP (mV) 180 22 181 23
Alkalinity (mg/L as CaCO3) 115 8 115 6 Calcium Hardness (mg/L as CaCO3) 201 10 191 14
Magnesium Hardness (mg/L as CaCO3) 102 11 99 10
Total Hardness (mg/L as CaCO3) 303 16 290 21 TDS (mg/L) 929 66 920 51 LSI 1.36 0.07 1.21 0.10 RSI 6.02 0.10 6.24 0.15 PSI 7.21 0.11 7.35 0.14 Planktonic HPC (CFU/mL) 9.56E+04 4.50E+04 1.24E+05 9.03E+04 ATP Microbial Equivalents (MEQs/mL) 3.81E+05 1.12E+05 5.65E+05 3.03E+05 Sessile HPC (CFU/cm2) 6.37E+05 3.37E+05 2.10E+06 9.48E+05

ASHRAE 1361-‐RP 102 Final Technical Report
Three scaling indices were calculated using the chemical parameters measured during
this device trial. The Langelier Saturation Index (Figure G17) was approximately 1.36 for T1
(Control) at equilibrium, and the equilibrium value for T2 (Device) was approximately 1.21.
These values indicate that each system had mild scaling potential. The Ryznar Stability Index
(Figure G18) was 6.02 for T1 (Control) and 6.24 for T2 (Device) at equilibrium, while the
equilibrium values of the Puckorius Scaling Index (Figure G19) for T1 (Control) and T2
(Device) were 7.21 and 7.35, respectively. All of these scaling index values indicate mild
scaling potential in both T1 (Control) and T2 (Device).
4.6.2 Biological Parameters
Biological data collected during this investigation are included in Figure 29 Figure 31. Based
on these data, there was no observed biocidal effect as a result of the device installation. T1
(Control) and T2 (Device) demonstrated comparable sessile and planktonic microbial growth
throughout the device trial.
Planktonic heterotrophic plate counts for each tower system over the course of the device
trial are shown in Figure 29. Neither T1 (Control) nor T2 (Device) maintained planktonic
microbial levels below the industry standard (104 CFU/mL). The average planktonic
heterotrophic plate count for T1 (Control) was 9.56 x 10⁴ CFU/mL with a standard deviation of
4.50 x 10⁴ CFU/mL, while the average value for T2 (Device) was 1.24 x 10⁵ CFU/mL with a
standard deviation of 9.03 x 10⁴ CFU/mL. A paired t-test was performed using the log 10
heterotrophic plate count data from this device trial, resulting in a p-value of 0.513. This

ASHRAE 1361-‐RP 103 Final Technical Report
indicates that the observed difference between the planktonic microbial populations of T1
(Control) and T2 (Device) was not statistically significant.
Figure 29 Planktonic microbial population enumerated by heterotrophic plate count for HCD trial
The planktonic microbial population in each tower system was also enumerated by
converting cellular ATP measurements to microbial equivalents using the equation described
previously in this report. The planktonic microbial equivalents for each tower system during the
course of this device trial are shown in Figure 30. The microbial population was higher in T2
(Device) than T1 (Control) on 7 of the 9 sampling dates. A paired t-test was performed using the
log 10 microbial equivalent data, resulting in a p-value of p = 0.058. This indicates that the
observed difference between the microbial populations observed in T1 (Control) and T2 (Device)
was not statistically significant.
1.E+03
1.E+04
1.E+05
1.E+06
10/27 11/1 11/6 11/11 11/16 11/21
HPC
-‐CFU/m
L
Date
Planktonic Microbial Population (HPC)
Make-‐Up HPC
T1 (Control) HPC
T2 (Device) HPC

ASHRAE 1361-‐RP 104 Final Technical Report
Figure 30 Planktonic microbial population enumerated by ATP measurement for HCD trial
The average sessile heterotrophic plate count (Figure 31) for T1 (Control) was 6.37 x 10⁵
CFU/cm2 with a standard deviation of 3.37 x 10⁵ CFU/cm2, while for T2 (Device) the average
was 2.10 x 10⁶ CFU/cm2 with a standard deviation of 9.48 x 10⁵ CFU/cm2. T2 (Device)
maintained a higher sessile microbial population than T1 (Control) on 3 of the 4 sampling dates.
A paired t-test was performed using the log 10 sessile heterotrophic plate count data from this
device trial, resulting in a p-value of 0.058. This indicates that the observed difference between
the sessile microbial populations in T1 (Control) and T2 (Device) was not statistically
significant. Since no significant difference in the sessile and planktonic microbial populations
was observed between T1 (Control) and T2 (Device), the investigation was terminated following
the completion of Phase I. Phase II was not completed for this treatment device.
1.E+03
1.E+04
1.E+05
1.E+06
1.E+07
10/27 11/1 11/6 11/11 11/16 11/21
ATP
-‐MEQ
s/mL
Date
Planktonic Microbial Population (ATP)
Make-‐Up ATP
T1 (Control) ATP
T2 (Device) ATP

ASHRAE 1361-‐RP 105 Final Technical Report
Figure 31 Sessile microbial population for HCD trial
The make-up water contained a heterotrophic biological population between 8,000 60,000
CFU/mL during this device trial, with an average value of approximately 23,000 CFU/mL. Make-up
water biological growth was allowed to occur without any means of biocidal control since water was
dechlorinated prior to usage. No artificial microbial seeding was performed on the make-up water
during this or any of the device trials.
1.E+03
1.E+04
1.E+05
1.E+06
1.E+07
11/4 11/9 11/14 11/19 11/24
HPC
-‐CFU/cm2
Date
Sessile Microbial Population
T1 (Control) HPC
T2 (Device) HPC

ASHRAE 1361-‐RP 106 Final Technical Report
4.6.3 Summary
The results presented in this report demonstrate that the hydrodynamic cavitation non-chemical
tower. Heterotrophic plate counts for both planktonic and sessile microbial populations were
comparable for T1 (Control) and T2 (Device). In addition, ATP measurements showed no
significant microbial reduction in the device tower system when compared to the control tower
system.

ASHRAE 1361-‐RP 107 Final Technical Report
4.7 CHLORINATION TEST RESULTS
Over the course of the investigation, 3 separate chlorination tests were performed to demonstrate
effective chemical microbial control. The first chlorination test was performed from 1/15/09
1/26/09. The second chlorination was performed immediately following the ED trial (8/14/09
8/23/09), and the third was performed immediately following the UD trial (9/27/09 10/4/09).
The selection of free chlorine as a positive control was based on common practice in
cooling water treatment and a previous study where several chemical biocides, including free
chlorine, were evaluated in model cooling towers that simulated real-world cooling tower
operational conditions (Thomas et al., 1999). A detailed description of both the results of the
Thomas et al. study and the protocol used for each chlorination test during this investigation is
included in Section 2.2.3 of this report.
4.7.1 Pre-Device Trial Chlorination Test
The first chlorination test was performed prior to the beginning of the device trials. During this
test, both T1 (Control) and T2 (Device) operated untreated from 1/15 1/22. After samples were
taken on 1/22, a spike dose of chlorine was added to each of the towers. Following this spike
dose, chlorine stock solution was pumped into each tower system to maintain a chlorine
concentration of approximately 1 mg/L. The planktonic microbial population enumerated by
heterotrophic plate count is shown in Figure 32, while ATP enumeration is shown in Figure 33.
Each tower demonstrated a 2-3 log reduction in planktonic microbial activity within 3 days from
the beginning of chlorination. The sessile microbial population is shown in Figure 34.

ASHRAE 1361-‐RP 108 Final Technical Report
Chlorination produced a 4-5 log reduction in sessile microbial activity in each of the tower
systems. Make-up water heterotrophic plate counts observed during this chlorination test were
comparable to those observed during the device trials which followed.
Figure 32 Pre-device trial chlorination test planktonic microbial population enumerated by HPC
1.E+02
1.E+03
1.E+04
1.E+05
1.E+06
1/15 1/16 1/17 1/18 1/19 1/20 1/21 1/22 1/23 1/24 1/25
Heterotroph
ic Plate Cou
nt (C
FU/m
L)
Date
Planktonic Microbial Population (HPC)
Make-‐Up Water
T1 (Control)
T2 (Device)
Chlorination

ASHRAE 1361-‐RP 109 Final Technical Report
Figure 33 Pre-device trial chlorination test planktonic microbial population enumerated by ATP
Figure 34 Pre-device trial chlorination test sessile microbial population
1.E+01
1.E+02
1.E+03
1.E+04
1.E+05
1.E+06
1/15 1/16 1/17 1/18 1/19 1/20 1/21 1/22 1/23 1/24 1/25
Microbial Equ
ivalen
ts (#/m
L)
Date
Planktonic Microbial Population (ATP)
Make-‐Up Water
T1 (Control)
T2 (Device)
Chlorination
1.E+01
1.E+02
1.E+03
1.E+04
1.E+05
1.E+06
1.E+07
1.E+08
1/22 1/23 1/24 1/25
Heterotroph
ic Plate Cou
nt (C
FU/cm2)
Date
Sessile Microbial Population (HPC)
T1 (Control)
T2 (Device)
Chlorination

ASHRAE 1361-‐RP 110 Final Technical Report
4.7.2 ED/UD Chlorination Test
The second chlorination test was performed immediately after the ED trial and before the towers
were prepared for the UD trial. During this chlorination test, T2 (Device) received chemical
treatment, while T1 (Control) remained untreated. Chlorination began on 8/21 after biological
samples were taken. The chlorination process began with a spike dose of chlorine, followed by a
steady flow of chlorine stock solution in order to maintain a free chlorine concentration of
approximately 1 mg/L. The planktonic microbial population is shown enumerated by HPC in
Figure 35 and enumerated by ATP in Figure 36. Make-up water heterotrophic plate counts
observed during this chlorination test were comparable to those observed during each device
trial.
Figure 35 ED/UD chlorination test planktonic microbial population enumerated by HPC
1.E+00
1.E+01
1.E+02
1.E+03
1.E+04
1.E+05
1.E+06
8/21 8/22 8/23
Heterotroph
ic Plate Cou
nt (C
FU/m
L)
Date
Planktonic Microbial Population (HPC)
Make-‐Up Water
T1 (Control)
T2 (Device)
Chlorination

ASHRAE 1361-‐RP 111 Final Technical Report
Figure 36 ED/UD chlorination test planktonic microbial population enumerated by ATP
The planktonic microbial population experienced a 2 log reduction within 2 days of the
beginning of chlorination. The sessile microbial population is shown in Figure 37. Chlorination
resulted in a 4 log reduction in the sessile microbial population.
4.7.3 UD/HCD Chlorination Test
The third chlorination test was performed immediately following the UD trial and immediately
before the towers were prepared for the HCD trial. Chlorination of T2 (Device) began on 10/1
following biological sampling, and it was performed using a steady dose of chlorine stock
solution. No shock dose of chlorine was used for this test, but instead a gradual increase in
chlorine concentration was performed over a period of 5 days until the concentration reached 1
mg/L. The planktonic microbial population enumerated by HPC is shown in Figure 38 and
1.E+00
1.E+01
1.E+02
1.E+03
1.E+04
1.E+05
1.E+06
8/21 8/22 8/23
Microbial Equ
ivalen
ts (#/m
L)
Date
Planktonic Microbial Population (ATP)
Make-‐Up Water
T1 (Control)
T2 (Device)
Chlorination

ASHRAE 1361-‐RP 112 Final Technical Report
enumerated by ATP in Figure 39. Make-up water heterotrophic plate counts observed during
this chlorination tests were comparable to those observed during all other device trials.
Figure 37 ED/UD chlorination test sessile microbial population
Figure 38 UD/HCD chlorination test planktonic microbial population enumerated by HPC
1.E+00
1.E+01
1.E+02
1.E+03
1.E+04
1.E+05
1.E+06
1.E+07
8/21 8/22 8/23
Heterotroph
ic Plate Cou
nt (C
FU/m
L)
Date
Sessile Microbial Population (HPC)
T1 (Control)
T2 (Device)
Chlorination
1.E+02
1.E+03
1.E+04
1.E+05
1.E+06
10/1 10/2 10/3 10/4
Heterotroph
ic Plate Cou
nt (C
FU/m
L)
Date
Planktonic Microbial Population (HPC)
Make-‐Up Water
T1 (Control)
T2 (Device)
Chlorination

ASHRAE 1361-‐RP 113 Final Technical Report
Figure 39 UD/HCD chlorination test planktonic microbial population enumerated by ATP
The HPC enumeration of the planktonic microbial population showed an increase in
microbial activity following chlorination, rather than a decrease. This result is contradictory to
the results of the previous chlorination tests. Tower planktonic heterotrophic plate count
increased from 4.0 x 10⁴ CFU/mL to 1.2 x 10⁵ CFU/mL. Sessile heterotrophic plate counts
decreased from 3.2 x 10⁶ CFU/cm2 to 6.2 x 10³ CFU/cm2 (Figure 40). The observed 3 log
reduction in the sessile microbial population of T2 (Device) following chlorination indicates that
biomass was effectively removed from surfaces within the system. The results in Fig 38 could
be due to entrainment of biomass from the surfaces as a result of removal during chlorination.
This effect is often observed in field situation: an effective biocide treatment causes release of
biomass from surfaces into the recirculating water which results in very high but transient
planktonic counts. In the previous chlorination tests, the initial shock dose of chlorine would
1.E+02
1.E+03
1.E+04
1.E+05
1.E+06
10/1 10/2 10/3 10/4
Microbial Equ
ivalen
ts (#/m
L)
Date
Planktonic Microbial Population (ATP)
Make-‐Up Water
T1 (Control)
T2 (Device)
Chlorination

ASHRAE 1361-‐RP 114 Final Technical Report
have effectively oxidized this material, but the lower chlorine dose used during this particular
test were unable to effectively oxidize the majority of this material during three days of
operation.
Figure 40 UD/HCD chlorination test sessile microbial population
1.E+02
1.E+03
1.E+04
1.E+05
1.E+06
1.E+07
10/1 10/2 10/3 10/4
Heterotroph
ic Plate Cou
nt (C
FU/cm2)
Date
Sessile Microbial Population (HPC)
T1 (Control)
T2 (Device)
Chlorination
ASHRAE 1361-‐RP 115 Final Technical Report
4.8 HPC ANALYSES USING ATP MICROBIAL EQUIVALENTS AND POUR
PLATE METHOD
While standard plating practices allow for accurate enumeration of planktonic microbial
populations in water samples, these methods generally require a minimum of three days in order
to process the sample. Microbial population enumeration via ATP measurement, however, is a
simple process which may be completed in approximately one hour. As a result, it is highly
desirable to establish the practical utility of the ATP method in terms of its ability to accurately
quantify the planktonic microbial population in cooling water samples.
In order to determine whether the ATP measurement offers a valid alternative to
traditional plating techniques, heterotrophic plate count data and ATP microbial equivalent data
from the entire investigation were compared. This comparison indicated that all heterotrophic
plate counts and ATP microbial equivalent measurements collected in this study had a
coefficient of correlation of R2 = 0.37.
The observed correlation between ATP microbial equivalents and HPC CFU/mL values
is quite low. This weak correlation is most likely due to the inclusion of all experimental data,
even those that were later discarded. For example, a device trial that was performed with MD at
the beginning of this study had to be interrupted due to numerous operational problems. The
ATP measurements taken from this period were included in this comparative analysis although
they demonstrate a far weaker correlation with HPC measurements than was observed during the
six device trials discussed in this report. As a result, these data were removed and the
comparative analysis was performed a second time. Excluding the data from this failed device
trial, a correlation of R2 = 0.77 was observed between ATP microbial equivalents and HPC

ASHRAE 1361-‐RP 116 Final Technical Report
measurements taken from the tower systems. These results indicates that ATP measurement
offers a fast means of estimating planktonic activity in a given water sample for microbial
populations in excess of 105 CFU/mL. However, traditional plating techniques should be used
when accurate measurements are required.
The correlation between ATP microbial equivalents and HPC measurements in the
system make-up water was also analyzed. A graph comparing these data is shown in Figure 41.
The correlation observed between the two data sets was relatively low, and make-up water
microbial equivalent levels were generally on the order of 1 log value higher than those
determined using heterotrophic plate counts. Based on this comparison, it may be concluded that
ATP measurement does not offer a reliable estimation of microbial populations when the HPC
values are below 104 CFU/mL. However, it is possible that water samples with lower microbial
populations require larger sample volume during analysis in order to produce accurate results
(the sample volume for both the systems water and the make-up water was 50 mL).
Figure 41 HPC vs. ATP measurement of planktonic microbial population in make-up water
0
1
2
3
4
5
6
7
1 11 21 31 41 51 61
Log(Microbial Pop
ulation)
Elapsed Days
HPC vs. ATP in Make-‐up Water
log cfu makeup
log ATP eq makeup

ASHRAE 1361-‐RP 117 Final Technical Report
5.0 SUMMARY AND CONCLUSIONS
Many faciliti
the operation of cooling systems. The goal is to increase efficiency and reduce water
consumption. One choice they often face is whether to continue to use conventional chemical
water treatment or to use non-chemical water treatment devices as an alternative. There are
many different non-chemical devices commercially available today. In order to make an
informed decision, objective evidence of the efficacy of these non-chemical devices for cooling
water management is needed.
Very limited objective and relevant information is available to verify the efficacy of these
non-chemical devices to control microbial growth in cooling towers in the field, which is an
essential element in the efficient operation of a cooling tower. Review of the literature reveals
few controlled studies on the efficacy of non-chemical devices, and none that were performed
under conditions that simulate normal cooling tower operation. Therefore, this study was
designed to provide a controlled, independent, scientific evaluation of a variety of classes of non-
chemical devices in a model cooling tower operated to simulate typical cooling tower operation.
This study examined the efficacy of five (5) NCDs to control the planktonic and sessile
microbial populations in a pilot-scale cooling tower system. The model towers were operated
according to specifications from ASHRAE and were representative of typical operation of a

ASHRAE 1361-‐RP 118 Final Technical Report
cooling tower, including cycles of concentration, temperature differential, and water chemistry.
The make-up water was dechlorinated using an activated carbon filter, a method that has been
used previously to produce dechlorinated water for disinfection studies. The use of
dechlorinated city tap water was specified to eliminate any antimicrobial effects of chlorine in
the make-up water. It would be expected that without chlorine the microbial concentrations in
this water would be higher than chlorinated water. However, the concentrations of HPC bacteria
that we observered in the make-up water were not unlike the average microbial counts in tap
water observed by other investigators.
Under the controlled experimental conditions used in this study, none of the devices were
shown to control microbial growth. There was no statistically significant difference in the
concentration of HPC observed between the control tower and a tower treated by any of the five
NCDs evaluated in this study (i.e., biological and chemical parameters were comparable in T1
and T2 for all device trials). The p-values calculated from t-tests comparing planktonic HPC
results for the experimental and control towers were 0.81, 0.92, 0.60, 0.45, and 0.51 for the
magnetic, pulsed electric field, electrostatic, ultrasonic, and hydrodynamic cavitation device
trials, respectively. The p-values from t-tests comparing sessile HPC results for the experimental
and control towers were 0.04, 0.13, 0.43, 0.47, and 0.06 for the magnetic, pulsed electric field,
electrostatic, ultrasonic, and hydrodynamic cavitation device trials, respectively.
Repeated chemical treatment of the pilot-scale cooling towers using an industry accepted
chemical biocide of known efficacy (chlorine) achieved significant reduction (i.e., three orders of
magnitude) in microbial growth in these towers.
demonstrated that the model system, when treated with an active biocide, was capable of
reflecting this antimicrobial effect.
ASHRAE 1361-‐RP 119 Final Technical Report
In addition to not being able to achieve significant reduction in planktonic or sessile
microbial activity in the experimental device tower system (T2 (Device)) when compared to the
control tower system (T1 (Control)), planktonic microbial levels in the experimental device
tower (T2 (Device)) were consistently` higher than recommended industry standard of 104
CFU/mL. Furthermore, microbial levels in the Device tower (T-2) were never lower than those
observed in the incoming make-up water, further demonstrating that no biological control was
demonstrated by these five NCDs under the experimental conditions used in this study.
The findings of this study are not in agreement with previous research published by non-
chemical device manufacturers and some reports from independent researchers on these same
devices. These studies reported reductions in microbial populations, which were not observed in
this study. Therefore, it is important to review the reasons for differing outcomes.
The scientific peer-reviewed literature offers little in the way of reports that verify the
antimicrobial effects of many non-chemical devices. For example, electroporation is one of the
mechanisms that has been suggested as the basis for an antimicrobial effect from devices such as
those using static or pulsed power. While electroporation is effectively used in molecular
biology to disrupt cell membranes, it should be noted that the electromagnetic fields used in
these applications include high energy (volts to kilovolts), are applied across very short distances
(centimeters), and for long exposure times. The conditions applied in the field application of
static or pulsed power devices and in the present study produce exposures of considerably less
energy and are applied over greater distances and shorter exposure time.
Comparison between HPC analysis by pour plate method and ATP measurements
revealed that the ATP measurement offers a fast means of estimating planktonic activity in a
water sample containing microbial populations in excess of 105 CFU/mL. On the other hand,

ASHRAE 1361-‐RP 120 Final Technical Report
ATP measurement does not offer a reliable estimation of microbial populations when the HPC
values are below 104 CFU/mL. It is possible that water samples with lower microbial
populations require larger sample volume during analysis in order to produce accurate results.
In conclusion, none of the NCDs evaluated in this study demonstrated significant
biological control in model cooling tower system operated under realistic process conditions that
may be encountered in the field. However, this study still offers several opportunities for
continued investigation of non-chemical treatment devices. The effects of residual chlorine in
the incoming make-up water were not analyzed during this investigation, and the effect of some
non-chemical water treatment devices may be augmented by the presence of chlorine. In
addition, the combined effects of chemical (e.g., oxidizing and non-oxidizing biocides) and
physical treatment technologies on the control of biological growth in cooling towers may offer
significant advantages. Combining hydrodynamic cavitation as well as ultrasonic cavitation with
chemical disinfection has been shown to achieve significant kill of different microorganisms and
the use of such hybrid systems (both chemical and physical) certainly warrants further
investigation.
The results from this study show that effective microbial control in cooling water systems
may not be achieved using a non-chemical device as the sole method of water treatment.
Consequently, equipment operators, building owners and engineers should consider taking more
frequent water sample tests for their systems that rely on NCD devices for biological control. If
the testing shows an issue, one possible measure is to add chemical treatment capability to their
system.

ASHRAE 1361-‐RP 121 Final Technical Report
6.0 REFERENCES
A E. Coli and Pseudomonas aeruginosa Materials Science & Engineering: C. Vol 28, Issue 5/6, pp. 901-905.
Amin, Muhammad Tahi -harvested rainwater for potable
Technology. 60.2, 419 431. Bagh, Lene Karen, Hans-Jørgen Albrechtsen, Erik Arvin, and Kaj Ovesen.
Water Research. 38(1), 225-235.
Bagh, Lene Karen, H-
Water Science & Technology. 46(9), 95-101.
Wat. Res. 30, pp 247-260.
Thereby Produced Against Solid B Phil. Trans. Roy. Soc. London. Ser. A 260, 221-240.
Bentham, R. H. (1993). "Environmental factors affecting the colonization of cooling towers by
Legionella spp in South Australia." International Biodeterioration and Biodegration 31: 55-63.
Blume, T., and U. Neis. 2004. Improved wastewater disinfection by ultrasonic pre-treatment.
Ultrasonic Sonochemistry. Vol. 11, Pp. 333 336. Bogatin Magnetic Treatment of Irrigation Water: Experimental Results and
Application Conditions Environmental Science & Technology, 33, 8. Pp. 1280-1285. Brennen, C.E. 1995. Cavitation and Bubble Dynamics. New York: Oxford University Press.

ASHRAE 1361-‐RP 122 Final Technical Report
point-of-use (POU)- International Journal of Environmental Health Research. 14(4), 253-260.
Cheremisinoff, Nicholas P. and Paul N. Cheremisinoff. Cooling Towers: Selection, Design, and
Practice. Ann Arbor, MI: Ann Arbor Science Publishers, Inc., 1981.
1155-TRP.
Russian Journal of Applied Chemistry. Vol. 78, No. 10, pp. 1631-1635.
KS.
Treatment of Wastewater, Fundamental Experiments For Developing the Treatment The XIV Memorial CIGR World Congress 2000, pp. 1306-1311.
Feng, Chuanping, Keitaro Suzuki, Shuyun Zhao, Norio Sugiura, Satoru Shimada, and Takaaki
Bioresource Technology. 94, 21-25.
Faunce, A., and S. Cabell. 1890. U.S. Patent 48,579. Furuta, M., Yamaguchi, M., Tsukamoto, T., Yim, B., Stavarche, C.E., Hasiba, K., and Maeda, Y.
2004. Inactivation of Escherichia coli by ultrasonic irradiation. Ultrasonic Sonochemistry. Vol. 11, Pp. 57 60.
Gabrielli, C., R. Jaouhari, G. Maurin and M. Keddam. Magnetic water treatment for
scale Wat. Res. Vol. 35, No. 13, pp. 3249-3259.
Co -07-028. ASHRAE Transactions, Vol. 113, Pt. 2., Pp 250-260.
Journal of Bacteriology. Vol 17, Pp. 373-379. Hua, I., and J. Thompson. 2000. Inactivation of Escherichia coli by sonication at discrete
ultrasonic frequencies. Water Resources. Vol. 34, Pp. 3888 3893.

ASHRAE 1361-‐RP 123 Final Technical Report
ic bacteria of the
freshwater neuston and their ability to act as plasmid recipients under nutrient deprived Microbial Ecology. Vol. 22, No. 1, 15-25.
Jousimies-Somer, Hannele R., Sirkku Waarala, and Marja-
Legionella Legionella: Current Status and Emerging Perspectives. Eds. James M Barbaree, Robert F. Breiman, and Alfred P. Dufour. Washington, D.C.: American Society for Microbiology, 1993. 200-201. Print.
Biochem. Eng. Journal. 14, 9-17.
Biochem. Eng. Journal. 18, 9-19.
Disinfection of
November 1-4, Osaka, Japan. Kitzman, Kevin A., Edward F. Maziarz, Bobby Padgett, Charles D. Blumenschein, and Alan
-Chemical Cooling Water Treatments A Side-by-side -03-22. Presented at the International Water Conference, October
2003.
Magnetically Treated Water and in a WateNational Aeronautics and Space Administration, Lewis Research Center, Cleveland.
Characterization of Distribution System Bio App. And Env. Microbio. 53(12), Pp. 2714-2724.
Water Sci. Tech. 55, 307-313. Lin, I. J., and S. Nadiv. 198
Magnetic Separation News. Vol. 2, 137-143.

ASHRAE 1361-‐RP 124 Final Technical Report
of Disinfectants for Biofilm, Protozoa, and L J. Water and Health, 03.4, 423-433.
th World Congress on Ultrasonics (WCU). Paris, France, September 7-10.
Ultrasonics Sonochemistry. Vol. 10, Pp. 319-324.
ic Fields: Processing System, IEEE Trans
Plasma Sci. 35, 59-73.
Nonhemispherical Cavities in Contact wit ASME J. Basic Eng. 83, 648-656.
-Power
-01-54. Presented at the International Water Conference, October 2001. Oshima, T., K. Sato, H.
High- J. Electrostat. 42, 159-166. Ovesen, K., F. Schmidt-
earch Institute. Report No. 235. Hørsholm, Denmark; 1994 [In Danish, summary in English].
PEFD Technical Manual. 2008. CWSTL0204. Essex, Ct. Pepper, I. L., P. Rusin, D. R. Quintanar, C. Haney, K.L. Josephson, and C.P. Gerba. 2004.
ncentrations of heterotrophic plate count bacteria from the source to the International Journal of Food Microbiology. 92, 265-271.
Phull, S.S., Newman, A.P., Lorimer, J.P., Pollet, B., and Mason, T.J. 1997. The development
and evaluation of ultrasound in the biocidal treatment of water. Ultrasonic Sonochemistry. Vol. 4, Pp. 157 164.
water prevents mineral build- Iron and Steel Engineer. Pp. 47-53.
Appl. & Eng. Microbio. October 1982, p. 972 987.
ASHRAE 1361-‐RP 125 Final Technical Report
Rieder, A., T. Schwartz, K. Schön-Hölz, S.-M. Marten, J. Süß, C. Gusbeth, W. Kohnen, W.
Journal of Appl. Microbio. 105, 2035-2045. Sawant, Subhash Shivram, Arga Chandrashekar Anil, Venkat Krishnamurthy, Chetan Gaonkar,
Janhavi Kolwalkar, Lidita Khandeparker, Dattesh Desai, Amit Vinod Mahulkar, Vivek
Cavitation on Zoopl Biochem. Eng. Journal. 42, 320-328.
Sheffer, P. J., J. E. Stout, et al. (2005). "Efficacy of new point-of-use water filters for preventing
exposure to Legionella and waterborne bacteria." Amer J Infect Cont 33(5): S20-S25.
Quantitative assessment of the germicidal efficacy of ultrasonic energy. Applied Environmental Microbiology. Vol. 57, Pp. 20792084.
Legionella Control: A Multi-Step
-02-02. Presented at the 63rd International Water Conference, October 20-24, Pittsburgh, PA.
Thomas, W. M.; Eccles, J.; Fricker, C., Laboratory observations of biocide efficiency against
Legionella in model cooling tower systems. ASHRAE Transactions 1999, 105(2), SE-99-3-4 (RP-954).
Biophys. J. 60, 297.
UD Operation Manual. 2008. Barendrecht, Netherlands. Vega-Mercado, H., O. Martin-Belloso, Q. Bai-Lin, F.J. Chang, M.M. Gongora-Nieto, G.V.
Barbosa- -Thermal Food Preservation: Pulsed Trends in Food Science and Technology. 8, 151-157.
-Field
Ind. Eng. Chem. Res. 47 (23), 9644-9650.
Zhang, W
distribution systems using free chlorine and chloramines: a statistical study of causative Water Research. 36: 1469-1482.

ASHRAE 1361-‐RP 126 Final Technical Report
Rev. Physiol. Biochem. Pharmacol. 105, 176.