BIOLOGICAL VARIATION AND UNCERTAINTY OF...
49
BIOLOGICAL VARIATION AND UNCERTAINTY OF MEASUREMENT
Transcript of BIOLOGICAL VARIATION AND UNCERTAINTY OF...
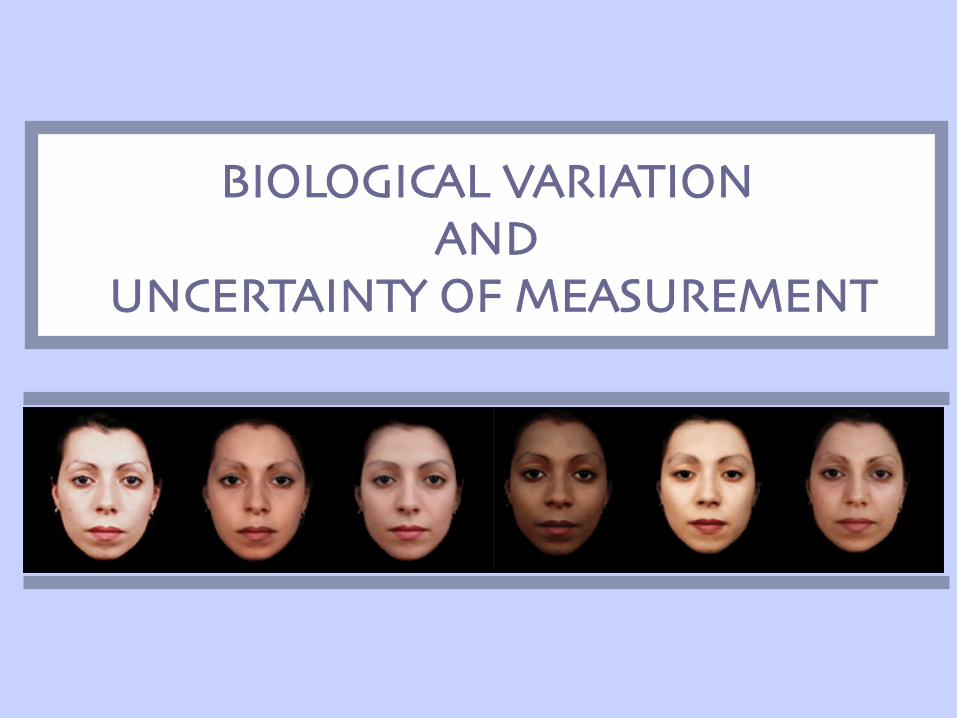
BIOLOGICAL VARIATION���AND���
UNCERTAINTY OF MEASUREMENT

Outline
Biological variation (BV)Then
Use BV to determine UOM (CVT)Then
Use UOM (CVT) to determine reference change values (RCV)


NON-RANDOM
Lifespan
Daily Rhythms
Monthly Rhythms
Seasonal Rhythms
NATURE OF BIOLOGICAL VARIATION

• Lifespan
Fraser CG. Biological Variation: From principles to practice. 2001
NON-RANDOM BIOLOGICAL VARIATION
20 30 40 50 60 70 Age (years)
Rela
tive
Conc
entr
atio
n
Cholesterol
Urea
Phosphate

• Daily Rhythms
Prof JS Koeslag. “Are the fat soluble hormones really hormones?” Http://academic.sun.ac.za/medphys/hormone.htm
NON-RANDOM BIOLOGICAL VARIATION

• Monthly Rhythm
NON-RANDOM BIOLOGICAL VARIATION

RANDOM NON-RANDOM
Within-Subject
Between-Subject
Lifespan
Daily Rhythms
Monthly Rhythms
Seasonal Rhythms
NATURE OF BIOLOGICAL VARIATION
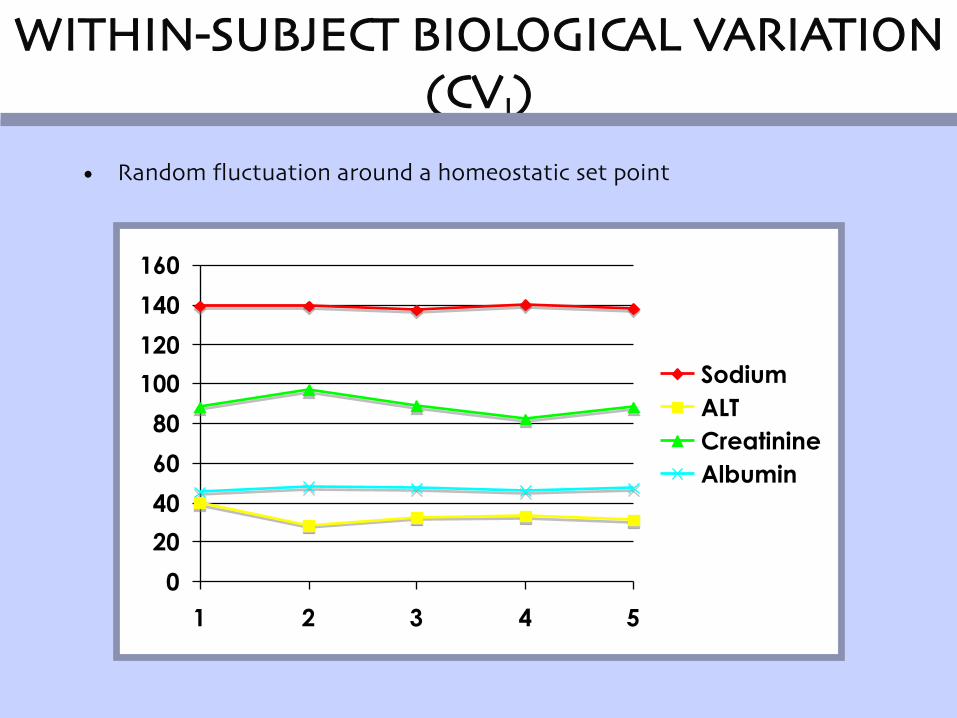
• Random fluctuation around a homeostatic set point
0
20
40
60
80
100
120
140
160
1 2 3 4 5
Sodium
ALT
Creatinine
Albumin
WITHIN-SUBJECT BIOLOGICAL VARIATION (CVI)

ANALYTEBIOLOGICAL
VARIATION (CVI) (%)
ABSOLUTE
Arbitrary Set Point Variation
Sodium (s) 0.7 140 138 142
Potassium 4.8 4.3 3.9 4.9
Calcium 1.9 2.25 2.21 2.29
Creatinine 4.3 88 81 95
Albumin 3.1 45 42 48
Cholesterol 6.0 4.0 3.5 4.5
http://www.westgard.com/biodatabase1.htm

1 2 3 4
60 63 66 62
SERUM CREATININE CONCENTRATION IN A HEALTHYMAN OVER A 14 DAY INTERVAL

MAN 1 2 3 4
1 60 63 66 62
2 103 99 110 107
3 88 85 93 86
4 125 120 115 118
5 75 83 78 86
6 92 98 90 96
7 75 70 68 71
8 105 110 99 103
9 72 81 74 78
10 68 75 72 77
SERUM CREATININE CONCENTRATIONS (uM) IN 10 HEALTHY MEN OVER A 14 DAY INTERVAL
Different homeostatic set points in different individuals
BETWEEN SUBJECT BIOLOGICAL VARIATION (CVG)

0
1
2
3
4
5
6
7
8
9
10
55 65 75 85 95 105 115 125
CREATININE (uM)
SU
BJE
CT
NU
MB
ER
SERUM CREATININE CONCENTRATION - MEAN & ABSOLUTE RANGES (uM)
Fraser CG. Biological Variation: From principles to practice. 2001

ANALYTE CVI
BIOLOGICAL VARIATION (CVG) (%)
ABSOLUTE
Arbitrary Set Point
Variation of Set Points
Sodium (s) 0.7 1.0 140 137 143
Potassium 4.8 5.6 4.3 3.8 4.8
Calcium 1.9 2.8 2.25 2.13 2.37
Creatinine 4.3 12.9 88 66 110
Albumin 3.1 4.2 45 41 49
Cholesterol 6.0 14.9 4.0 2.8 5.2
http://www.westgard.com/biodatabase1.htm

http://www.westgard.com/biodatabase1.htm These
Use BV data
- To calculate the UOM (CVT)
- to set quality specifications
- To assess the significance of changes in serial results in an individual (RCV)
- To consider the utility of conventional population-based reference values


How does this affect interpretation of your lab result?
one of the sources (biggest) of variation in laboratory results

USING BV DATA IN THE UNCERTAINTY OF MEASUREMENT (UOM)

UOM
• Metrology = science of measurement and includes all theoretical and practical aspects of measurement
• G: metron meaning measure• G: logos meaning study/calculation
• UOM not a concept unique to medical laboratories
• Primarily developed for calibration and testing laboratories, i.e. length, temp, weight, conductivity etc
• Guide to the Expression of Uncertainty in Measurement (GUM) developed by standards bodies to provide a framework for expressing UOM

UOM
• UOM is a new concept in medical laboratories that was introduced to provide a quantitative estimation of the level of confidence a laboratory has in the analytical precision of a test
• UOM provides a quantitative estimate of the variability of the results that a laboratory would normally expect if the measurement were to be repeated
• Measurement of an analyte is and estimate of its concentration at the moment of collection
• How good or bad that estimate is, depends on the sum of the effects of pre-analytical, analytical and post-analytical uncertainties

UOM

WHAT IS UOM?
Pre-measurement uncertaintysample instability
transportstorage
sample preparation
Measurement uncertaintyimprecision of value assigned to calibrator
Imprecision of dispensed volumes of samples and reagentsBatch to batch variation of reagent and calibrator composition
Technical performance variations due to equipment maintenance and different operators
InterferencesUncertainty due to nature of measurand
Post-measurement uncertaintyNumerical precision (rounding of data)

WHAT IS UOM?
The Uncertainty of Measurement of a test procedure is the sum of the uncertainties associated with the technical steps required to conduct a test
according the the standard operating procedure of the method
What is the laboratories responsibility?
The sources of interpretative uncertainty should where possible be identified, their typical magnitude estimated, and the information made readily accessible to requesting clinicians.
Australasian Association of Clinical Biochemists established Working Group to provide a practical framework for reporting UOM for routine quantitative medical testing procedures.

WHAT IS UOM?
But why go to all this trouble?
Because we must for accreditation (ISO15189):
“ A measurement result is complete only when accompanied by a quantitative statement of its uncertainty. The uncertainty is required in order to decide if the result is adequate for its intended purpose”
Because we want to add value:
Make sure our test results are fit for their clinical purpose
Ultimately to improve the quality of laboratory results and their clinical interpretation
Educate users regarding limitations of tests

WHAT IS UOM?
• In the measurement process, there are two major sources of uncertainty:
• Associated with numerical value assigned to measurand present in calibrator material
• Uncertainty associated with value of test result due to random errors (despersion/imprecision)
• These two uncertainties should be summed to give total uncertainty

UOM AND THE LAB
Step 1: Accurately identify and document what is being measured by and analytical method and interferences with method e.g.
• Serum/plasma intact β-HCG
• Measured via 2 site sandwich microparticle immunoassay
• Units IU/L
• Interferences: heterophilic antibodies
• Limitations: for use in normal pregnancy only, not to be used as sole diagnostic criteria for trophoblastic tumours

UOM AND THE LAB
Step 2: Determine imprecision of your assay (CVA):
• Established methods: • minimum of 6 months IQC data• Multiple calibrators• Multiple reagent batches• Multiple operators• Equipment maintenance• Summer/winter• For UOM estimate, use 95% confidence interval of CV% (1.96%CV
or 2%CV)• EQA data not recommended (to few data points)
• For new methods• Use at least 30 data points for each level of QC• Across at least 2 batches of calibrator and reagents
UOM AND THE LAB
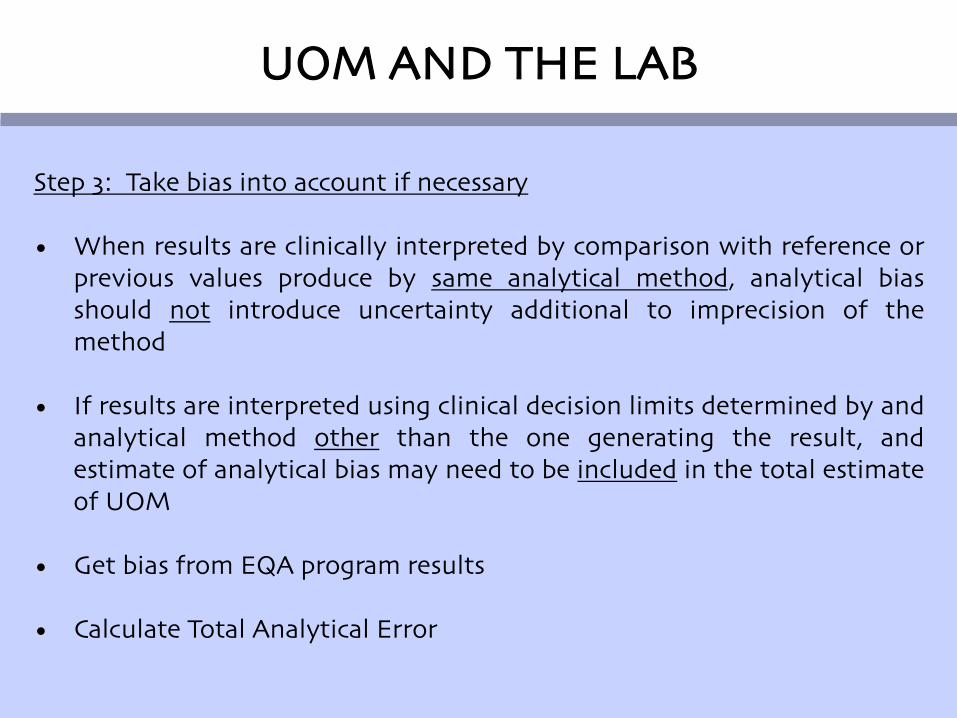
Step 3: Take bias into account if necessary
• When results are clinically interpreted by comparison with reference or previous values produce by same analytical method, analytical bias should not introduce uncertainty additional to imprecision of the method
• If results are interpreted using clinical decision limits determined by and analytical method other than the one generating the result, and estimate of analytical bias may need to be included in the total estimate of UOM
• Get bias from EQA program results
• Calculate Total Analytical Error

UOM AND THE LAB
Step 4: make sure of the nr of significant figures reported
• The nr of significant figures used to report a quantitative results implies a certainty with which the result has been determined (rounding off)
• Clinicians often unaware of real imprecision
• E.g.• Raw data = 50,39 U/L• Round off to 50,4 U/L or 50 U/L
• Each value carries an implied statement of measurement precision
• The laboratory must decide how many decimal places are significant

UOM AND THE LAB
Step 4: Calculate UOM from CVA an CVI (Total variance)
€
CVT = CVA2 + CVI
2TOTAL
VARIATION
POST- ANALYTICALVARIATION
ANALYTICALVARIATION
PRE- ANALYTICALVARIATION
BIOLOGICAL VARIATION
= UOM

For p <0.05True Result = Measured Result ± 2 x Total Variation

€
CVT = CVA2 + CVI
2
= 1.62 + 62
€
CVT = CVA2 + CVI
2
= 1.62 + 62
KEY:T = TotalA = AnalyticalI = Within subject
Example:What is the 95% CI of a patient’s cholesterol result = 6.6mmol/L?
CVI = 6.0%; CVA = 1.6%
= 6.2%
For 95% CI: ±2 x CVT = ±12.4%
The dispersion = 5.8 - 7.4mmol/L
= 0.8mmol/L
DISPERSION OF TEST RESULT
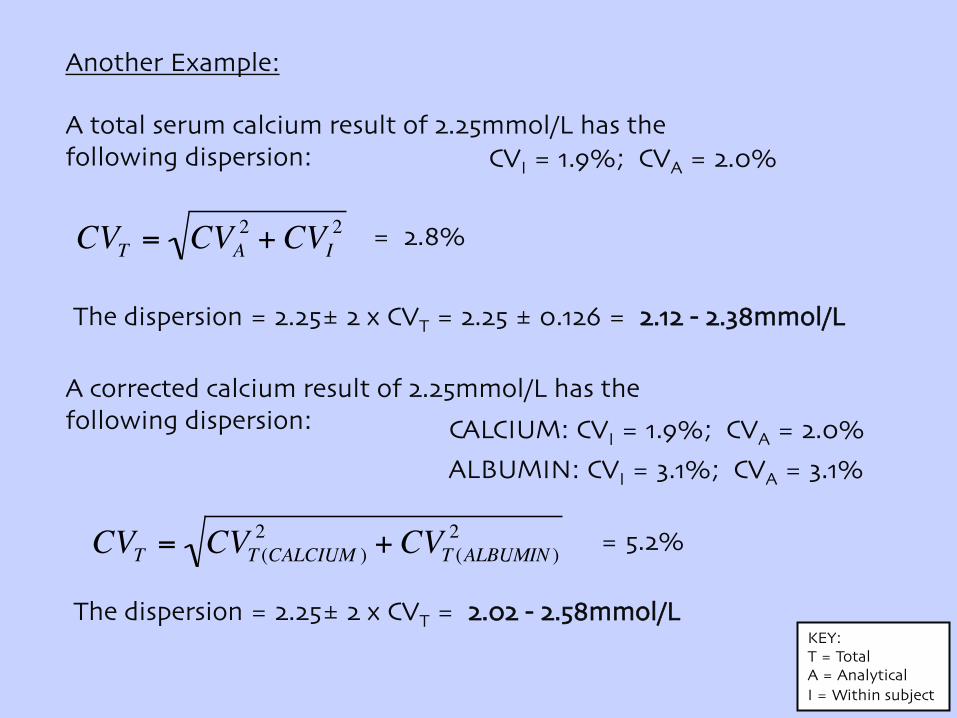
Another Example:
A total serum calcium result of 2.25mmol/L has the following dispersion: CVI = 1.9%; CVA = 2.0%
€
CVT = CVA2 + CVI
2
= 1.62 + 62
KEY:T = TotalA = AnalyticalI = Within subject
= 2.8%
The dispersion = 2.25± 2 x CVT = 2.25 ± 0.126 = 2.12 - 2.38mmol/L
A corrected calcium result of 2.25mmol/L has thefollowing dispersion: CALCIUM: CVI = 1.9%; CVA = 2.0%
ALBUMIN: CVI = 3.1%; CVA = 3.1%
€
CVT = CVT (CALCIUM )2 + CVT (ALBUMIN )
2
= 1.62 + 62= 5.2%
The dispersion = 2.25± 2 x CVT = 2.02 - 2.58mmol/L

An asymptomatic patient has the following free thyroxine result:FT4 = 23pmol/L (RR 12-22)
A repeat test is mistakenly done on the next day: FT4 = 20pmol/L
Thinking that there may have been a mistake, the clinician repeats the test again the next day:
FT4 = 24pmol/L
The clinician then phones the lab to discuss these “irregularities”.

These results are acceptable i.e. within the expected dispersion of the free thyroxine result in
this patient(19 - 27pmol/L)
Dispersion (UOM) = 23 ± 2 x CVT (8%)
= 23 ± 2x 1,84
= 23 ± 3,68
= 19,32 - 26,68
= 19 - 27 pmol/L
CVI = 2,7%; CVA = 7,6%
€
CVT = CVA2 + CVI
2
= 1.62 + 62= 8%

UOM AND THE LAB
UOM and fitness for purpose
ISO 15185: “the laboratory shall use examination procedures, ...which meet the needs of the users of laboratory services and are appropriate for the
examinations”
• Judge “fit for purpose” by comparing estimated UOM (imprecision from IQC and bias from EQC data) to a analytical goal”
• Internationally agreed analytical goals e.g. HbA1C/cholesterol• Define upper acceptable limit for imprecision as a proportion of the
intra-individual biological variation of the analyte
Optimum: CVA = < 0,25 x CVIDesirable: CVA = < 0,50 x CVIMinimum: CVA = < 0,75 x CVI

UOM AND THE LAB
UOM and fitness for purpose
• Where analytical goal for total imprecision is met, the contributing uncertainty components need not be identified
• Where goal is not met, contributors should be identified and reduced (change of step in method or change of method)
• For some methods, analytical goals set by BV are unachievable by current technology or are not relevant to clinical application
• Possibility then to compare with EQC

UOM AND THE LAB
UOM and fitness for purpose
• If test results are interpreted using reference or clinical decision values determined by a different method, bias should be considered as part of the estimation of uncertainty
• There are 3 levels of analytical goal for bias based on BV:Optimum: BA = < o,125 (CVI
2 + CVG2)1/2
Desirable: BA = < 0,250 (CVI2 + CVG
2)1/2Minimum: BA = < 0,375 (CVI
2 + CVG2)1/2
• For methods where bias and imprecision must both meet performance criteria, the two parameters are combined as Total Error Allowable(Tea)
Optimum: CVA = < 1,65 ( 0,25 x CVI) + o,125 (CVI2 + CVG
2)1/2Desirable: CVA = < 1,65 (0,50 x CVI) + o,250 (CVI
2 + CVG2)1/2
Minimum: CVA = < 1,65 (0,75 x CVI) + o,375 (CVI2 + CVG
2)1/2

www.medlabstats.com/uncertainty/uncertainty-budget-excel-template.xls
Analyte + RRBV from www
IQC dataCalculated by embedded formulae
SQRT CVI2 + CVA
2 x low QC/100SQRT CVI
2 + CVA2

www.medlabstats.com/uncertainty/uncertainty-budget-exel-template.xls
Green if PI value < 0,5 (desirable performance)Yellow if PI value ≤ 0,75 (minimum performance)Red if PI is greater than 0,75 (unsuitable performance)

Analyte HGC ALP
Measurand S/P intact βhCG S/P/U concentration
Test principle 2 site sandwich IA Bromocresol purple dye-binding spectrophotometry
Units IU/L g/L
Reference values < 5: non-pregnant>25: pregnant
In-patients: 31 - 44 g/LOut-patients: 33 - 46 g/L
Limitations Use for N pregnancy only Grossly haemolysed specimens
Interferences Heterophilic Ab’s None reported
Calibrator traceability WHO 3rd IS 75/537UOM not provided
470 Certified Reference Material UOM: 38,2 ± 0,72 g/L (95% CI)
Analytical bias Mean 4,5% (cycle 21 CAP) N/A
UOM Period + QC results details Period + QC results details
Analytical goal CVA <5% at 25 IU/L CVI = 3,1% (Westgard website)Desirable: < 0,5 CVI = < 1,6%
CVA 5,4% at QC mean 22 IU/L 1,75% at QC mean 38,4 g/L
Fit for purpose Borderline acceptable Borderline unacceptable: assess QAP
Reportable intervals < 20 IU/L: 1 U/L20 - 100 IU/L: 2 U/L> 1000 U/L: 100 U/L
20 - 50 g/L: 1 g/L
Estimation of UOM ± 2 IU/L @ 25 IU/L± 10% @ > 1000 IU/L
± 1,5 g/L
���USING BV DATA TO ASSESS THE SIGNIFICNACE OF CHANGES IN
SERIAL RESULTS IN AN INDIVIDUAL ���(REFERENCE CHANGE VALUES)���

• Clinical lab results are used for many purposes i.e. training, research, diagnosis , screening and monitoring
• Many of these results are used to monitor the health of a person over a period of time (short, medium or long term)
• It is therefore important that the lab, as part of it’s quality service assist clinicians in interpreting results objectively, with emphasis placed on the significance of changes in serial results
Reference change values

• 63 year old male patient , newly diagnosed hypertensive.
• A panel of tests were requested, which included LFT’s, cholesterol, TFT etc
• The GP was concerned about his cholesterol of 6,6 mmol/L
• He was given dietary and lifestyle advice and asked to return a month later where the above tests were repeated
• The repeated cholesterol a month later revealed a value of 5.82 mmol/L
• Is this change significant?? To answer this question, we need to calculate reference change values (RCV)
INTRODUCTION: CASE

• Z X ( CVA2 + CVI
2)1/2
• The found value will lie within the range value ± 2CV with 95,5% probability (∴ Z = 1,96 or rounded off to 2, from Z table)
• When considering the difference between 2 serial results, the total variation is given as:
• {[Z X ( CVA2 + CVI
2)1/2 + [Z X ( CVA2 + CVI
2)1/2]}
• This can be simplified to : RCV=21/2 X Z X ( CVA
2 + CVI2)1/2
CALCULATING THE RCV
€
CVT = CVA2 + CVI
2
= 1.62 + 62

• Cholesterol changed from 6.60mmol/L to 5.82 mmol/L – change = 0,78 mmol/L = 11,8%
• RCV = 21/2 X Z X ( CVA2 + CVI
2)1/2– Z-score used (bidirectional) = 1.96– 2 ½= 1.414– CVA from internal QC programme = 1,6%– CVI from database (within subject variation) = 6%– For a change to be significant:
• RCV = 21/2 X Z X (CVA2 + CVI
2)1/2
• RCV = 1,414 x 1,96 x (1,62 + 6,02)1/2 = 17,2%
• RCV > Change, therefore there is no significant change
• Lab’s advice to clinician: lifestyle modification did not lower pt’s cholesterol results. GP decided to then put patient on a statin
APPLYING RCV

• Is a more objective way of reporting
• It’s easy to compute and prepare
• Can be adapted to an LIS system as a delta check
• It is more useful in detecting significant changes than the clinical fixed limits
• Changes in numerical values, might not be significant, whilst values still within the reference range can be significant
ADVANTAGES OF THE RCV

• This is a new concept to get use to, but not as complicated as it looks at first
• Knowing about BV and UOM can add value to our results:– Better clinical use (UOM and RCV)– Improve the quality of our results (fit for purpose)
CONCLUSION

?