BIOLOGICAL ACTIVITY IN AN AREA WITH A TIDALLY … Doccuments/1983/L/1983_L4.pdf · In the southern...
13
, . l t I • This paper not to be cited without prior reference to the author International Council for C.M. 1983/L:4 the Exploration of the Sea Biological Oceanography Committee BIOLOGICAL ACTIVITY IN AN AREA WITH A TIDALLY-INDUCED FRONT by F. Creutzberg Netherlands Institute for Sea Research P.O. Box 59, 1790 AB Den Burg, Texei, The Netherlands ABSTRACT In the southern North Sea,in Dutch offshore waters, there is an extensive gradient of tidal current velocities, decreasing from south to north. At a certain latitude the current velocities drop below critical values allowing, not only deposition of mud and detritus at the bottom, but allowing also the generation of a summer stratification in the overlying water masses north of that latitude. At this boundary (or front) the benthic fauna is very rich, showing significantly higher biomass figures than in the south • These figures are comparable to those occurring in the Wadden Sea. The question, discussed in the present paper, is whether this increased biomass can be attributed solely to increased primary production at the frontal zone or whether it is also increased by the deposition of organic matter from adjacent, more turbulent areas. Temperature and chlorophyll a sections are measured across the enriched zone through the year July 1982-July 1983. The most conspicuous phenomenon in this context is the persistence of a chlorophyll a maximum above the enriched zone irrespective of the presence or absence of a tidally-induced front. This chloro- phyll a maximum is attributed to accumulation of organic matter, mineralization and mixing processes in the enriched zone.
Transcript of BIOLOGICAL ACTIVITY IN AN AREA WITH A TIDALLY … Doccuments/1983/L/1983_L4.pdf · In the southern...

,.ltI
~
•
This paper not to be cited without prior reference to the author
International Council for C.M. 1983/L:4
the Exploration of the Sea Biological Oceanography Committee
BIOLOGICAL ACTIVITY IN AN AREA WITH A TIDALLY-INDUCED FRONT
by
F. Creutzberg
Netherlands Institute for Sea Research
P.O. Box 59, 1790 AB Den Burg, Texei,
The Netherlands
ABSTRACT
In the southern North Sea,in Dutch offshore waters, there is
an extensive gradient of tidal current velocities, decreasing from
south to north. At a certain latitude the current velocities drop
below critical values allowing, not only deposition of mud and
detritus at the bottom, but allowing also the generation of a
summer stratification in the overlying water masses north of that
latitude.
At this boundary (or front) the benthic fauna is very rich,
showing significantly higher biomass figures than in the south •
These figures are comparable to those occurring in the Wadden Sea.
The question, discussed in the present paper, is whether this
increased biomass can be attributed solely to increased primary
production at the frontal zone or whether it is also increased
by the deposition of organic matter from adjacent, more turbulent
areas.
Temperature and chlorophyll a sections are measured across
the enriched zone through the year July 1982-July 1983. The most
conspicuous phenomenon in this context is the persistence of a
chlorophyll a maximum ju~t above the enriched zone irrespective of
the presence or absence of a tidally-induced front. This chloro
phyll a maximum is attributed to accumulation of organic matter,
mineralization and mixing processes in the enriched zone.
Ciftci
Stempel-ICES-Paper

- 2 -
INTRODUCTION
In the southern North Sea, about 50 km north of Texel (Holland),
there is a marked discontinuity in the benthic system with a sharp
boundary between sandy sediments in the south and muddy sediments
in the north (Figure'l). Just north of this boundary there is an
enriched zone, about 15 km broad between the 30 m and 40 m isobaths,
with high organic carbon contents in the sediment (40/00 POC)
-2and high biomass values of the benthic fauna (about 25 9 AFDW.m ).
The POC contents of the sandy sediments in the south, on the
other hand, are in the order of 0.5-1.00/00, whereas the biomass
-2of the benthic fauna ranges between 3 and 5 9 AFDW.m •
The gradual decrease of tidal current velocities from south
to north (Figure 2), dropping below a critical valueat a certain
latitude, have been found to be responsible for the depositio~
of silt and particulate organic matter (CREUTZBERG & POSTMA, 1979).
Muddy sediments receive energy not only from primary production
in the overlying water mass, but also from nearby sandy areas,
where water turbulence prevents deposition of detritus.
This simple hypothesis of ,a horizontal transport of detritus
and accumulation of potential food for the benthic fauna in an
area with little turbulence should, however, be compared with
the possibility of an increased and (in summer) prolonged primary
production in the water immediately overlying the enriched zone.
Such a zone with an increased primary production may be present
through the occurrence of a tidally-induced front between a weIl
mixed area and an area with a summer stratification (PINGREE,
1978). The positionof such a summer frontal boundary is deter~
mined by the critical value of the "stratification parameter" S
(S = 1.5). With the aid of a numerical model, developed by
SIMPSON & HUNTER (1974), PINGREE & GRIFFITHS (1978) and PINGREE
(1978), the stratification parameter can be determined on the basis
of tidal current velocities and depth according to:
S = l09IO[col:r3]
where h is the depth in cm, lul is the tidal stream velocity in-1cm.s and the over bar denotes the average value over one tidal
•
•
-,
..

- 3 -
cycle. CD is the drag coefficient, IV 2.5 x 10⁻³ (PINGREE, 1978).
•MUD CONTENT
• >20% ECd5-10%
.15-20% 02.5%
.10-15% 0 <2%
o5
Figure 1. Distribution of sedimentsaccording to mudcontent (particles< 50 pm). The dotsare stations alonga transect fromsouth to north •
•If applied in the region under consideration with data
available (Atlas of tidal streams, Deutsches Hydrographisches
Institut, Hamburg, 1963) the S = 1.5'contour appears to coincide
with the enriched zone which, as argued before, is likewise
the result of the hydraulic regime (Figure 3).
The question of whether local primary production at the
tidally-induced front represents a significant contribution to the
food supply of the benthic fauna has led to temperature and
chlorophyll a measurements along a transect (205 km long) from
south to north as shown in Figure 1.
Acknowledgements. Many people have co~operated in this work. The
author is much indepted to Govert J. van Noort for its wide-ranging
assistance, to the crew of the R.V. "Aurelia" for its co-operative
attitude during our cruises, to miss Birgit van Megen and miss
Coby de Vries for chlorophyll a measurements,. to miss Ank Groenewold,

- 4 -
miss Marga Kannegieter and miss Ellen Okkels for assistance during
the cruises, to Dr. M. Ian Jenness for the improvement of the
English text, to Dr. Ben Tijssen for critical reading of the
manuscript and to mrs Lidy Everhardus for type-writing the
manuscript.
MATERIAL AND METHODS
Water samples were taken from a drifting vessel with a Nansen
bottle. Temperature was measured by lowering an electric sensor or
by reading the reversing thermometer attached to the Nansen bottle.
For the determination of chlorophyll a, one litre of seawater
was filtered over a glass microfibre filter to which a small amount
of MgC03
was added. Extraction took place in 90% acetone in an
ultrasonic disintegrator. Measurements were carried out with a
Turner 111 fluorometer.
During the cruises of July and November 1982 the chlorophyll
a content at the surface was registered automatically with a
Variosens fluorometer.
RESULTS
The results are summarized in Figures 4 and 5. Temperature
sections over the course of the year July 1982-July 1983 (as
found along the south-north transect.indicated in Figure 1) are
shown on the left side. The corresponding chlorophyll a sections
(if present) are shown on the right side.
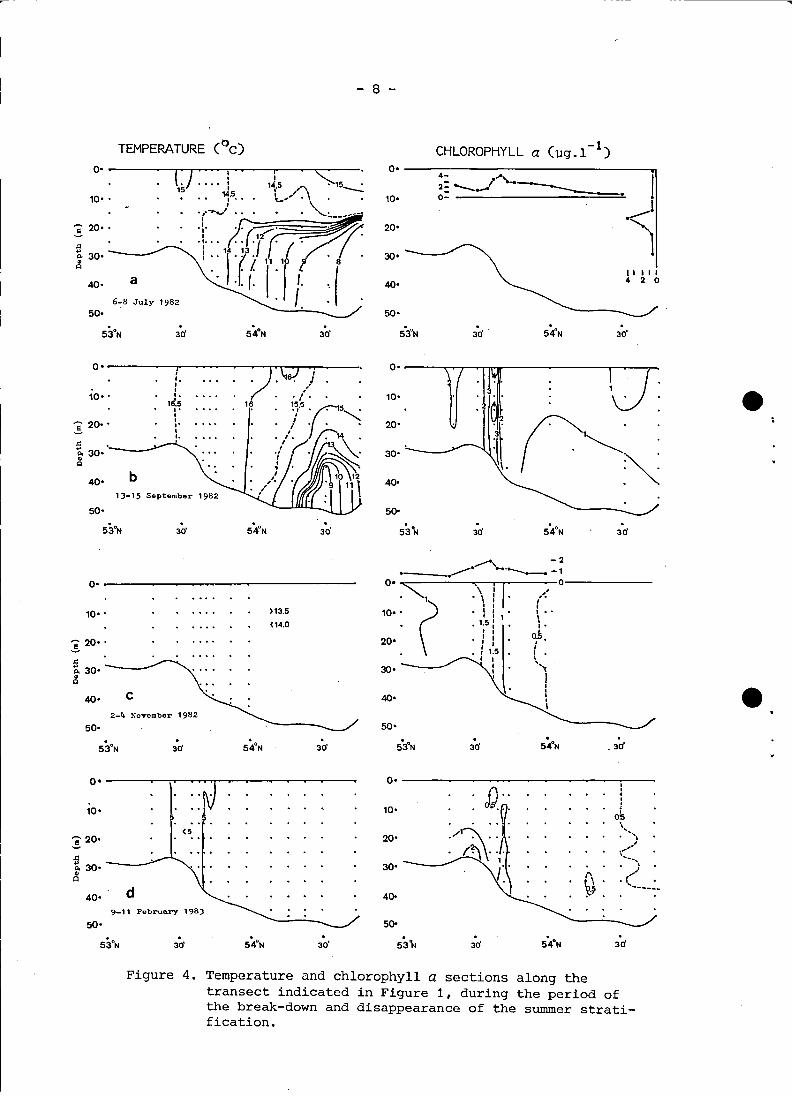
In July 1982 (Figure 4a) a well developed summer thermocline
was observed in the northern part of the section. In this month
the chlorophyll a concentration was only measured at the surface
(automatie registration) and along a vertical cast at the northern
most station (540
45'N). A chlorophyll a peak was found at the
surface at 530
40'N, just above the enriched benthic zone (between
530 37'N and 530 45'N). Further a peak was observed at a depth of
17~ m, immediately below the thermocline, in the cast at the
northernmost station.
•
•

1
- 5 -
Figure 2. Maximum tidalvelocities (mean springtide) in knots, andlines of equal velocityas deduced from the atlasof tidal streams, published
~4·. by the Deutsches Hydrographisches Institut,Hamburg ( 1963) •
~.
~2·
2° 3° . 4° 30' ° . Figure 3. Distribution30' 30 5 30
of the "stratificationparameter" S according
30' 30.
to a numerical modelpresented by PINGREE(1978) , and the applica-tion of tidal velocities
° 54° (mean spring-tide)54derived from the Germanatlas of tidal streams
• (Hamburg, 1963) •.30' 30
•

- 6 -
In September 1982 (Figure 4h) the stratification had withdraWn
about 55 km to the north, but the maximum chlorophyll a levels
were still found above the enrich~d zone (53037'N).
In November 1982 (Figure 4c) the stratification was no longer
present. Although there were no direct observations north of 54oN,
it has been established that at the beginning of October 1982 the
thermocline had practically disappeared (C. Veth, pers. comm.).
On the basis of automatie variosens chlorophyll a measurements at
the surface and some Nansen bottle sampies at different depths, a
chlorophyll a maximum above the enriched benthoc zone (530
37'N)
wasagain apparent.
In February.1983 (Figure 4d), stratification was againabsent
but chlorophyll a levels were observed to remain higher above the
enriched zone (53042~'N).
Whereas the break-down and absence of the summer stratifi
cation in the course of the autumn and winter is shown in Figure 4,
the gradual upbuilding of a new thermocline in the subsequent
spring and summer can be followed in Figure 5.
In April 1983 (Figure 5a) the first weak signs of a new
stratification became visible. The chlorophyll a distribution still
maintained its usual pattern. Apart from high concentrations in
the southernmost station the water overlying the enriched zone
(at 53037'N) show the highest concentrations.
No chlorophyll readings were made on May 17-18 1983. The
temperature section measured (Figure Sb) shows the continued
progress of the stratification.
At the time of the survey from May 30th to June 1st 1983
(Figure Sc) the thermal stratification had intensified. The chloro
phyll a contents were the highest hitherto measured. A number of
irregularly distributed subsurface blooms are apparent. It is not
known whether or not they are slnking to the Dottom. North of
54010'N there is a tendency for the development of a rich chloro
phyll a layer at, or just below the depth of the thermocline. A
possible peak of chlorophyll a in the water overlying the en
riched zone (530
37'N-53045'N), particularly near the bottom, might
be recognized, but it is heavily dominated by the irregular
phytoplankton patches.
•
•

l
•
•
- 7 -
In July 1983 (Figure Sd) maximum stratification was observed,
with a definitive structure and the highest differences between
surface and near-bottom water temperatures. This situation is
comparable to that in July 1982 (Figure 4a). There is, however, one
crucial difference. In 1983 the front separating the stratified
and weIl mixed water is located far more southerly (about 30 km)
with the result that now the enriched benthic zone is underlying
the stratified water. The chlorophyll a distribution in July 1983
has a pattern which, most probably, also occurred in July 1982
(Figure 4a, right side). In the stratified area in the north,
there is a rich layer coinciding with,or just below the thermo
cline. At the surface there is a maximum south of the front which,
according to the observations in 1983, is mixed downward through
the complete water column. In 1983 the high concentrations are
located some 27 km more southerly than in 1982.
DISCUSSION
One of the conspicuous features of the area investigated is
the occurrence of a sharp boundary dividing sandy sediments in the
south from muddy sediments in the north. The position of this
boundary has remained remarkably constant as shown - not only
from the results of our surveys during the past 10 years - but
also from the results of earlier workers. The distribution of silt
(particle size 0-0.09 mm) as presented by BORLEY (1923) on the
basis of data collected in 1904-1908 shows that the southern
boundary of the silty area (see Figure 3a in CREUTZBERG & POSTMA,
1979) coincides precisely with the one of the present study (Figure
1). The same holds true more or less for the sediment charts given
by LÜDERS (1939), PRATJE (1949), JARKE (1956), and SCHÜTTENHELM
(1980).
Just north of this boundary there is a zone, about 15 km
broad, with a rich benthic fauna (biomass in the order of 25 g
AFDw.m-2). The fauna of this zone, apparently, receives more food
than the benthic fauna in other places of the southern North Sea.
This phenomenon has been explained by the gradual decrease, from
south to north, of the tidal current velocities which, at a
II
- 8 -
TEMPERATURE (oe)
~ 20"
.=~ 30'---~~
'" 11 I I I4 2 0
-30'3d
O· ---:-------------~4- ...'0 I2= 0.....-.-'. -._____0= - • ....-i
'1
-1CHLOROPHYLL a (Ug.l )
40-
10-
20-
so-
30- ~---
30'30'
a6-8 July 1982
O--~-L).",! .15 1J,5
• •• I",10' ,
40-
•-3d-30'
20-
O.~,.. 'J10' " .. 1 ,
:l ,~"\. :~
50'
30' ---~
40·
30'30'
b
0- ---~-"7'/-~~---_._.......,.......,r--o-.I,II
.J.50'III'II.
10- '
40-
:5Po 30- ----~
'"
e 20"
0- ~--~~-~~-~-------
~ -2• ,.,.-. --....- -1
o· "'" - '< I I 0-----......... \ I ,,:
10- :. (1 : , 11: !. .1.5: \ •
I I 01;20- ; : I
, I I, I 1.5 I
I I I, '-"",,;:30- I I
I II.
40- ~,
10- '
~ 20,'
:5Po 30'~
40'
50·
c2-4 November 1982
.3d
>13.5
<14.0
-30'
50- .3d -.30'
•<5
O· -----...............1: "N10-
\"
. ,),........,)
0",( .------
-3d.3d
0- ---~-~~~~---~--~i,~--I.:,
OS
20'
40-
10'
30'
-30'-30'
d9-11 February 198)
40'
50'
:IiPo 30·~
'"
~ 20·
Figure 4. Temperature and chlorophyll a sections along thetransect indicated in Figure 1, during the period ofthe break-down and disappearance of the summer stratification.

------------ ----
- 9 -
-1CHLOROPHYLL a (Vg.l )TEMPERATURE (oe)
Q- •
710' ., ...-;...
,/~ 20"
6.. J"
......-, ...'.<: .~,5"·t 30· 30-m ,'"
,i
a I40'40- t
I
18-19 April 198) ~
50· 50-
53°N - 54°N.
53"N30' 30'.
3d.
• 30'
·l;"·--·:~··~-·_·-·-'
.,I
,":,I,I,IIIII
b17-18 May 198)
40'
0- .. " - -.••,;,;) C9' , __• , __• .'----. .---9,~-·' 9--- ~C-...·;~10" I" I"' .. / ...
I
20·· .. r .~ .. ~ .
II•
50· .30' 30'
•
10- .
40·
50·
c)0 May - 1 June
30' 30'
40'
50'
3d -.30'
".\,\
• I,..'
I," .
"(05 :
....",!,I;.\
.3d·3d
,(0- "T'"'""~-"""'"'\~--r""T'"''''Ir-~,,?'''--':-''''''''~--'~-''''''''''
... .. \0,5--"" ' ...~_ .........,\\· ... " '.. . .. ..
~.~: 1: s::::.2~ \..--:-0,\.",;
'::1": ~~~• •• .. ,.'-'. • \,.,/.\ .:>-2~..: ,- .. \ ;...---, :.. 0:5' . . '0:5' r .
•• ,. • .. .. .. t .. I" ..:. , I
; .. ; .. : .., I
.. I .. I, ,I I
50-
30'
40·
30'30'
, d18-20 July 198) '"
50'
10'
40'
Figure 5. Temperature and chlorophyll a sections along thetransect indicated in Figure 1, during the period ofthe up-building of a new thermocline.
L

- 10 -
certain latitude drop below a critical value, allowing the
deposition of organic and inorganic suspended matter (CREUTZBERG
et al. 1983). In other words, the enriched zone receives organic
matter not only from phytoplankton production in the overlying
water mass, but also, through horizontal transport, from adjacent,
more turbulent, areas.
In the present study the importance of enrichement through
such a process is weighed against the possibility of an extra
food supply through a local strong phytoplankton growth (especially
in summer) which, according to PINGREE et ale (1978) occurs in
tidally-induced fronts separating summer-stratified and well-
mixed water masses. If the "stratification parameter" (S) is computed
with the formula presented by PINGREE (1978) using tidal velocities
(mean spring tide) derived from the atlas of tidal streams
(Hamburg, 1963), indeed, the derived front (S-= 1.5) coincides
with the enriched benthic zone in the region under consideration
(Figure 3). This is not surprising since both, the. critical zone
for deposition of mud and organic matter as weIl as the "stratifi
cation parameter" are determined by tidal velocities and depth.
In the concept of PINGREE,on the long-term basis,the rate of
surface heat input is regarded as constant. If, however,
separate years are compared, such a constancy is not justified.
Although the summers of 1982 and 1983 were both abnormally hot,
July 1983 was even hotter than in the previous year. This slight
difference may have led to the 30 km difference in observed
positions of the fronts in these two years (Figures 4a and 5d).
Also wind can have exerted a certain influence. If a front is
responsible for an extra food supply for the benthic fauna,
such a variation is not consistent with the constancy of the
position of the enriched benthic zone.
DIETRICH (1950) has designed a stratification chart on the
basis of the average of several years (1902 to 1939), showing
that the "front" (at the longitude of 40 30'E) is located at
540
10'N, in other words, some 65 kill northerly of the position of
the front in 1983.
The chlorophyll a sections in the course of the year show
two marked phenomena. The first is a strong summer phytoplankton
•
•

•
- 11 -
growth occurring near the base of the thermocline inthe stratified
region following nutrient depletion (Figures 4a and 5d). This
feature is well documented and will not be discussed further here.
The other conspicuous phenomenon is the occurrence of high
chlorophyll a contents just above the enriched benthic zone (530
37'N-530 45'N). In July 1982 it could have been associated with the
presence of a front (Figure 4a). In September 1982, however, even
though the front had withdrawn to the north some 55 km, the
chlorophyll a maximum maintained the same position, well mixed
over the water column (Figure 4b). Also in November 1982 and
February 1983 (Figure 4c, d) the chlorophyll a maximum above the
enriched zone continued to persist, notwithstanding the fact that
stratification had disappeared completely. In April 1983
(Figure 5a), when the first weak signs of a new stratification
became apparent, the chlorophyll a maximum had still maintained
its position, although it is nearly masked by even higher levels
in the south. On May 30th-June 1st 1983 (Figure Sc) an inconspi
cuous peak above the enriched zone is masked by irregular
phytoplankton outbursts. In July 1983 (Figure 5d) there is no
maximum in the water column above the enriched zone. But, this
is probably because the thermocline has expanded over the en
riched benthic zone, preventing a mixing over the entire water
column. The only chlorophyll a peak is at the depth of 12~ m,
near the base of the thermocline •
The persistent occurrence of a chlorophyll a maximum at a
certain latitude (except in July 1983), irrespective of the
presence or absence of a front, does not support the view that
there is a causal relation between fronts and chlorophyll a
concentrations. There is greater reasonto believe that a relation
exists between the accumulation of deposited organic matter and
the occurrence of chlorophyll a concentrations in the overlying
water mass. Through the processes of deposition, mineralization
and mixing, the water covering an enriched area must also have
an increased level of primary production. POSTMA· (1981) has found
in'the'Wadden Sea that the processes of accumulation, mineralization •
and mixing of the water overlying an enriched area increase the
- ----------,

- 12 -
fertility of the area. Nevertheless the difference in depth between
the Wadden Sea and the North Sea should be taken into account
when speaking in terms of mixing and exchange of material between
the bottom and the overlying water mass. The remarkable uniformity,
however, of temperature and chlorophyll a contents along most of
the vertical easts at the latitude of the enriched zone, support
the view that such processes may weIl be possible. The exceptional
results of the July 1983 observations should be attributed to
the absence of mixing through the water column, because of the
extension of the stratification over the enriched zone.
In general, it may be concluded that the constancy of the
position of the enriched benthic zone is associated with the
constancy of the lunar cycle and water depth. The boundaries of
stratified water masses, on the other hand, show great variation
caused by seasonal wind and temperature fluctuations and year to
year differences.
REFERENCES
BORLEY, J.O., 1923. The marine deposits of the southern North Sea.
Fishery Invest. (2)i (6): 1-73.
CREUTZBERG, F. & POSTMA, H., 1979. An experimental approach to the
distribution of mud in the southern North Sea. Neth. J. Sea
Res. ~(1): 99-116.
CREUTZBERG, F., WAPENAAR, P., DUINEVELD, G. & LOPEZ LOPEZ, N.,
1983. Distribution and density of the benthic fauna in the
southern North Sea in relation to bottom characteristics
and hydrographie conditions. Rapp. P.-v. Reun. Cons. int.
Explor. Mer, 183, in press.
DEUTSCHES HYDROGRAPHISCHES INSTITUT, Hamburg, 1963. Atlas der
Ge~eitenströme für die Nordsee, den Kanal und die Britischen
Gewässer.
DIETRICH, G., 1960. Die natürlichen Regionen von Nord- und Ostsee
auf hydrographischer Grundlage. Kieler Meeresforsch. 2(12):
35-69.
•
•

- 13 -
JARKE, J., 1956. Eine neue Bodenkarte der südlichen Nordsee.
Dt. hydrogr. Z. 9: 1-9.
LÜDERS, K., 1939. Sediments of the North Sea. In: P.D. Trask (ed.),
Recent marine sediments. Am. Ass. Petrol. Geol., Tulsa: 322-
342.
PINGREE, R.D., 1978. Mixing and stabilization of phytoplankton
distribution on the northwest European continental shelf. In:
J.H. Steele (ed.), Spatial patterns in plankton communities.
Plenum Press, London: 181-220.
PINGREE, R.D. & GRIFFITHS, D.K., 1978. Tidal fronts on the shelf
seas'around the British Isles. J. Geophys. Res. 83(C9):
4615-4622.
PINGREE, R.D., HOLLIGAN, P.M. & MARDELL, G.T., 1978. The effects
of vertical stability on phytoplankton distributions in
the summer on the northwest European shelf. Deep-Sea Research
25: 1011-1028.
POSTMA, H., 1981. Exchange of materials between the North Sea and
the Wadden Sea. Marine Geology 40: 199-213.
PRATJE, 0., 1949. Die Bodenbedeckung der nordeuropäischen Meere.
Handb. Seefisch. Nordeur. !(J): 1-23.
SCHÜTTENHELM, R.T.E., 1980. The superficial geology of the Dutch
sector of the North Sea. Marine Geology 34(1/2): M27-M37.
SIMPSON, J.H. & HUNTER, J.R., 1974. Fronts in the Irish Sea.
Nature 250: 404-406.